Democratize
Exploratory’s Simple UI experience makes it possible for anyone to use Data Science to Explore data quickly, Discover deeper insights, and Communicate effectively.
Trusted By


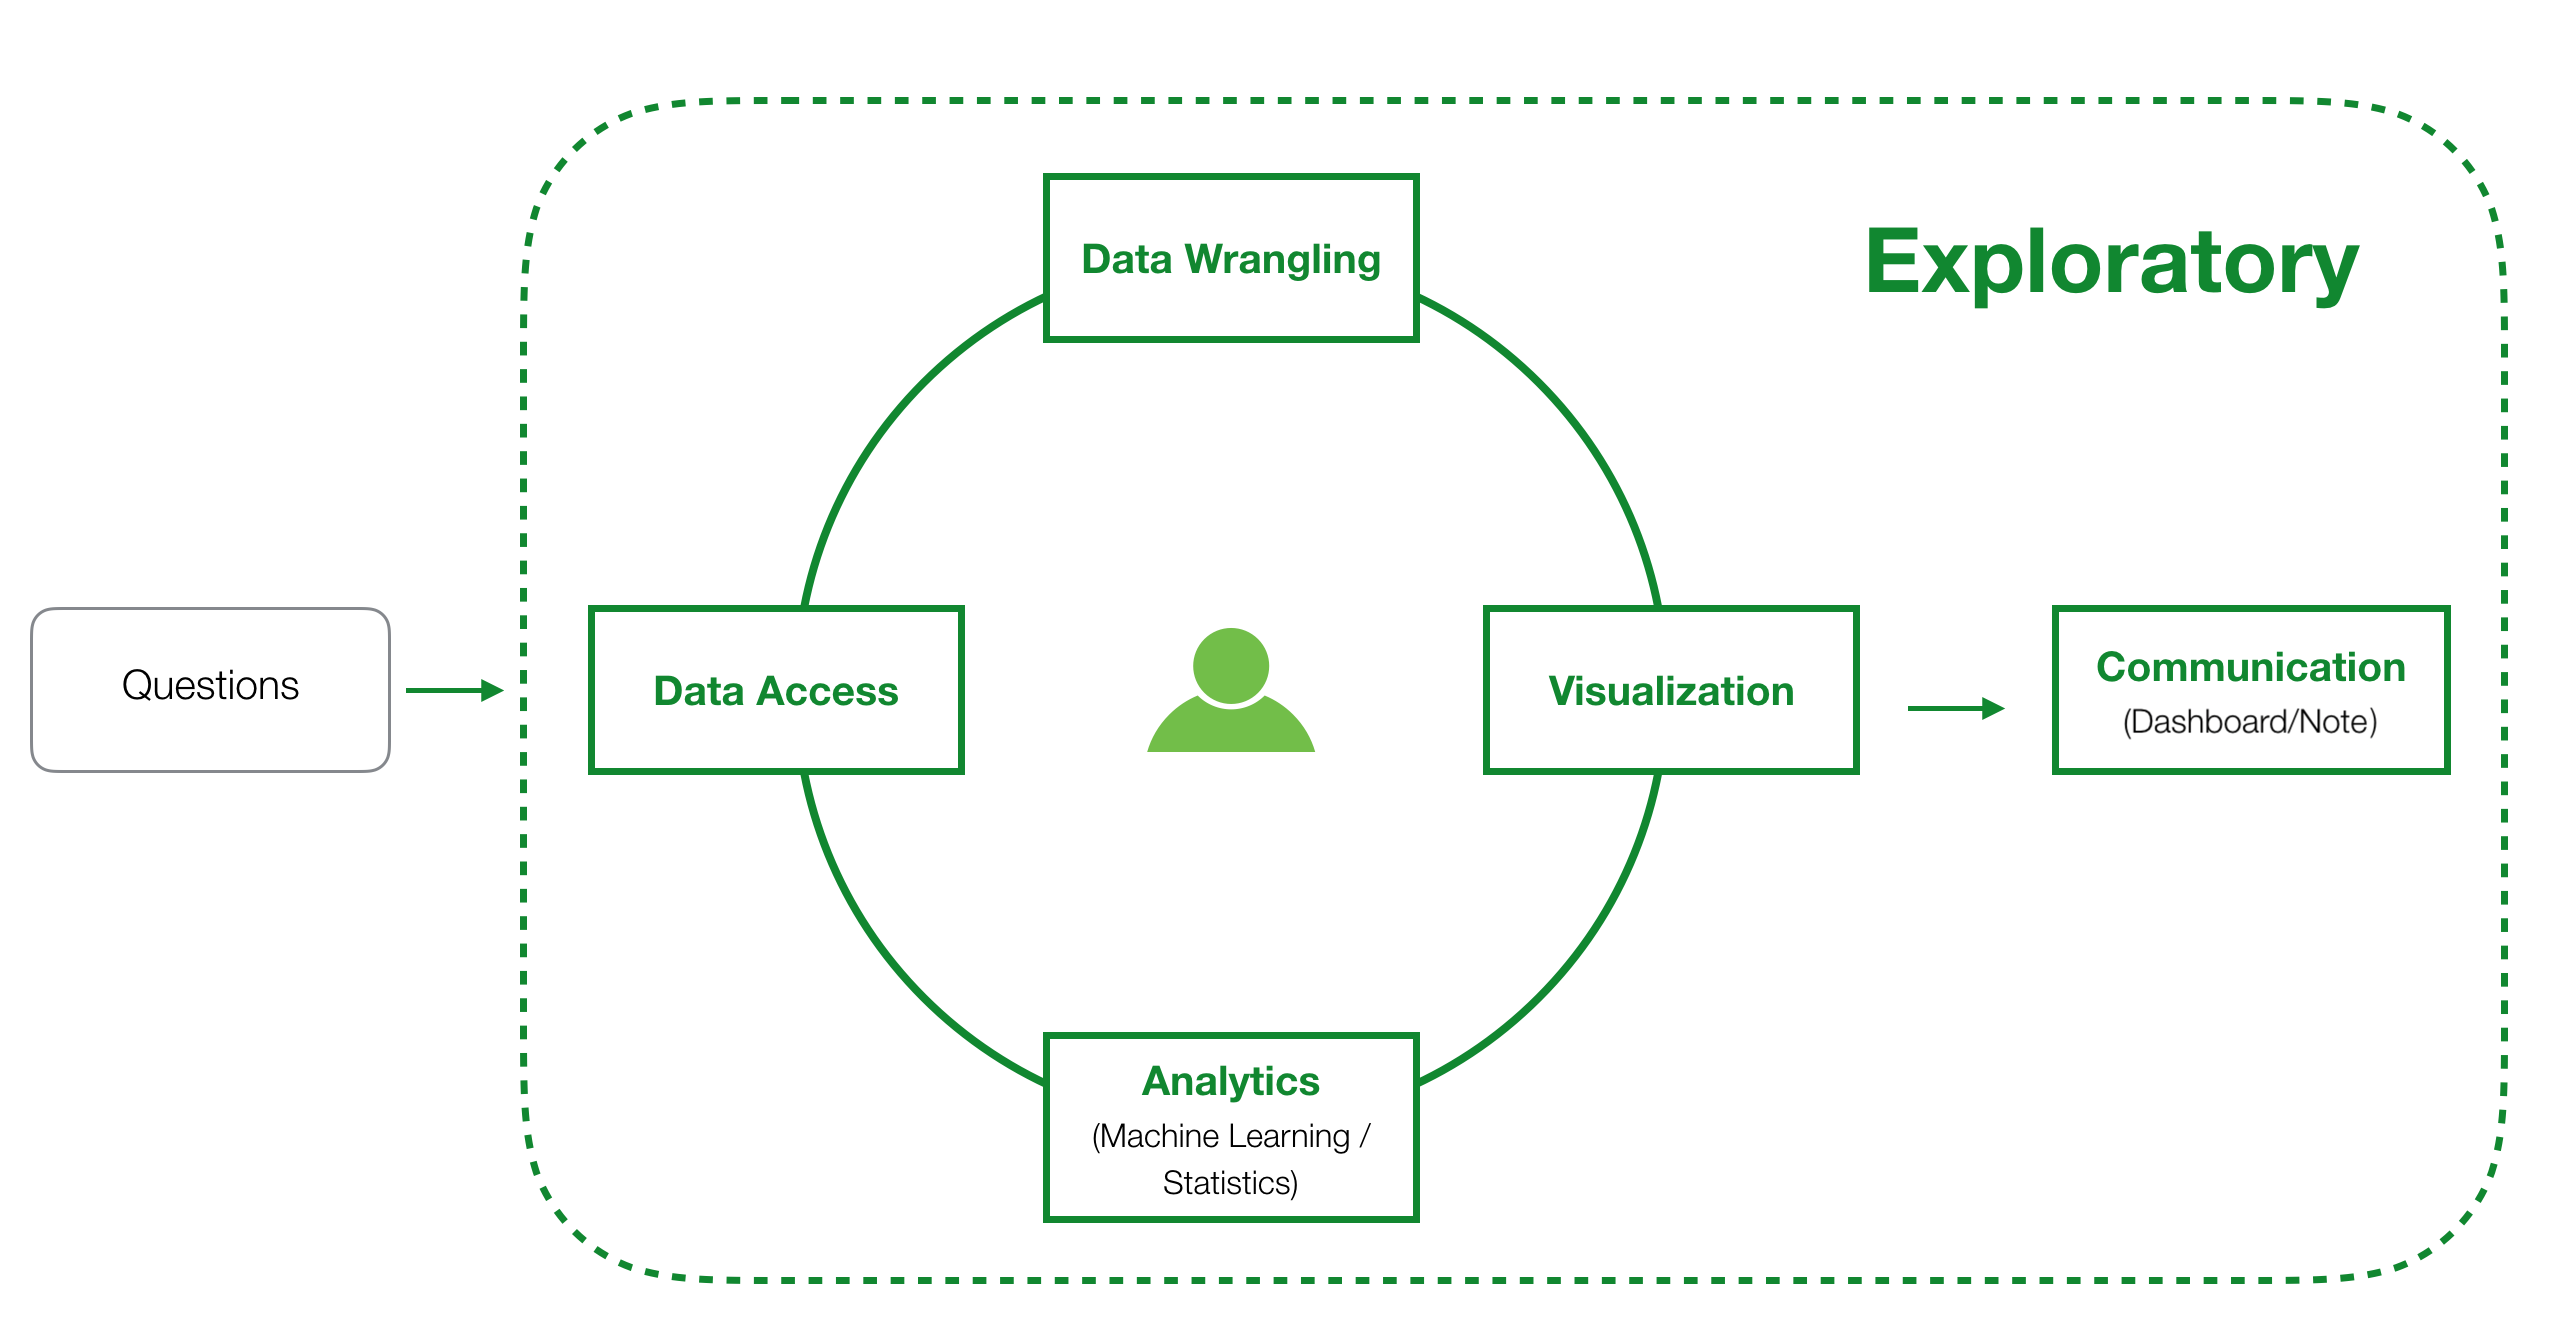
Exploratory Desktop
Exploratory Desktop provides a Simple and Easy-to-Use UI experience to access various data sources, clean and transform data, visualize and analyze data to gain deeper insights, communicate your discoveries with Notes, and monitor your business metrics with Dashboards.
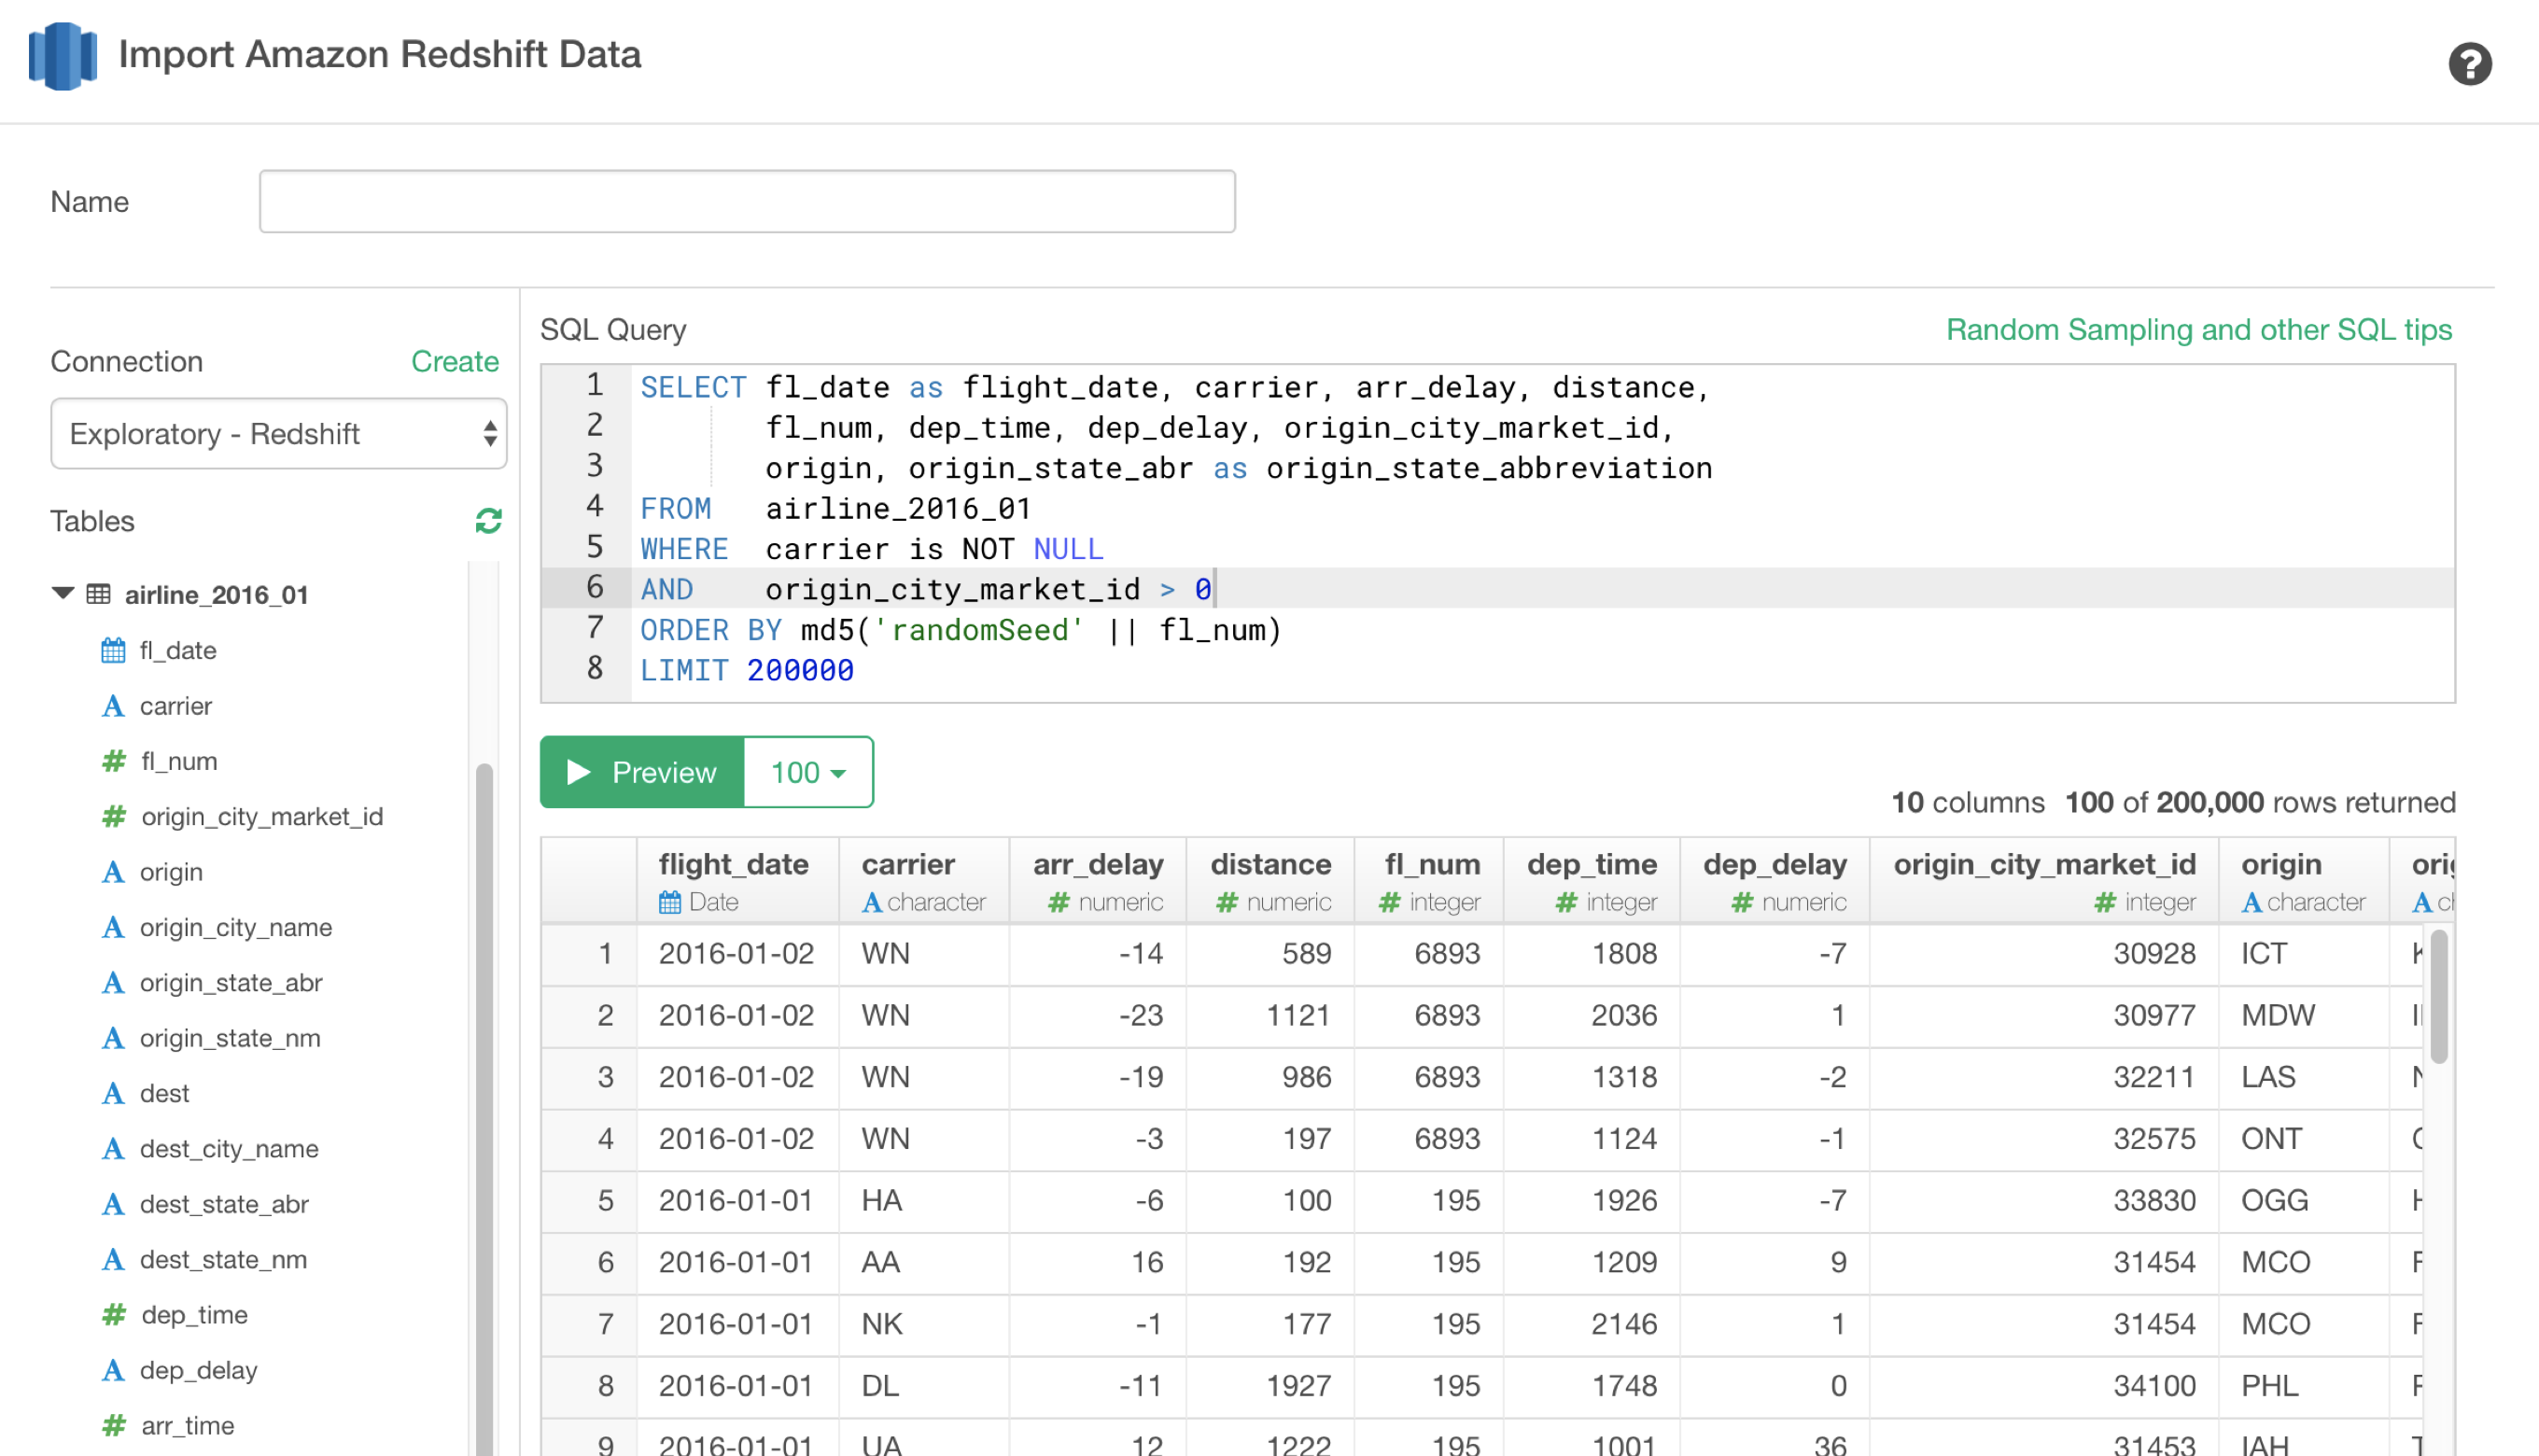
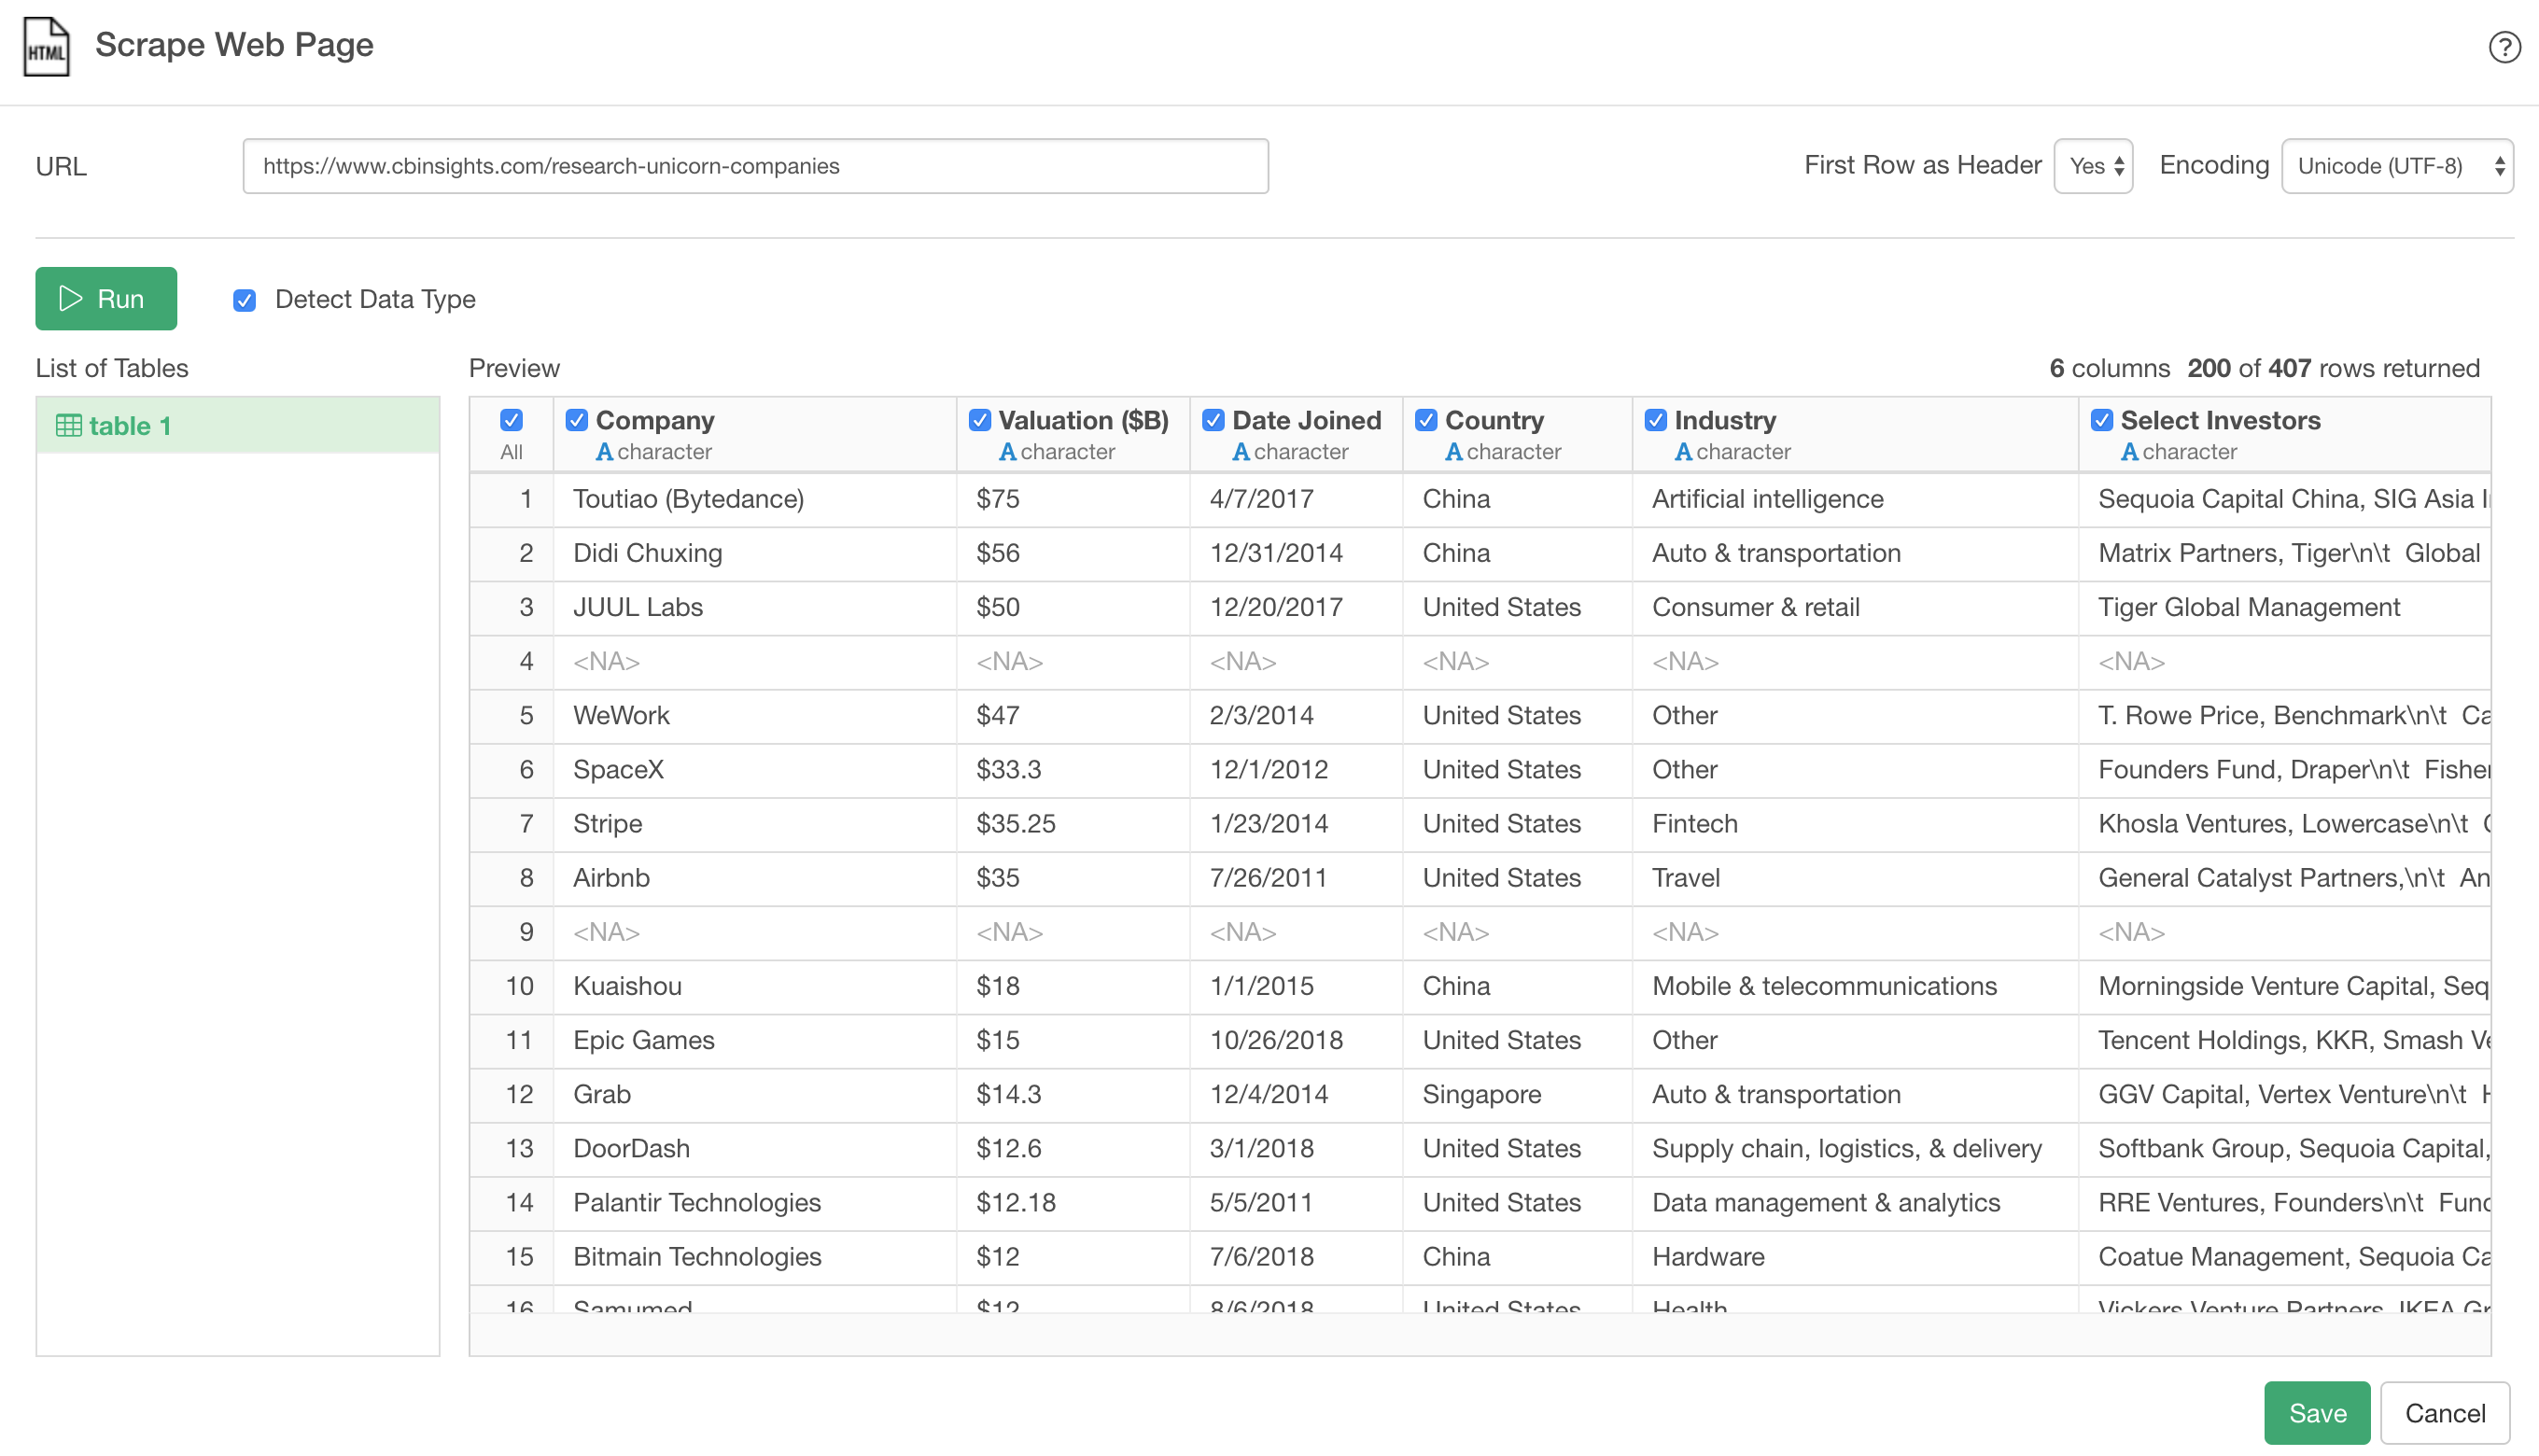
Data Access
You can quickly extract data from various built-in data sources such as Redshift, BigQuery, PostgreSQL, MySQL, Oracle, SQL Server, Vertica, MongoDB, Presto, Google Analytics, Google Drive, Azure Storage, Amazon S3, Web Scraping, CSV, Excel, JSON, etc.
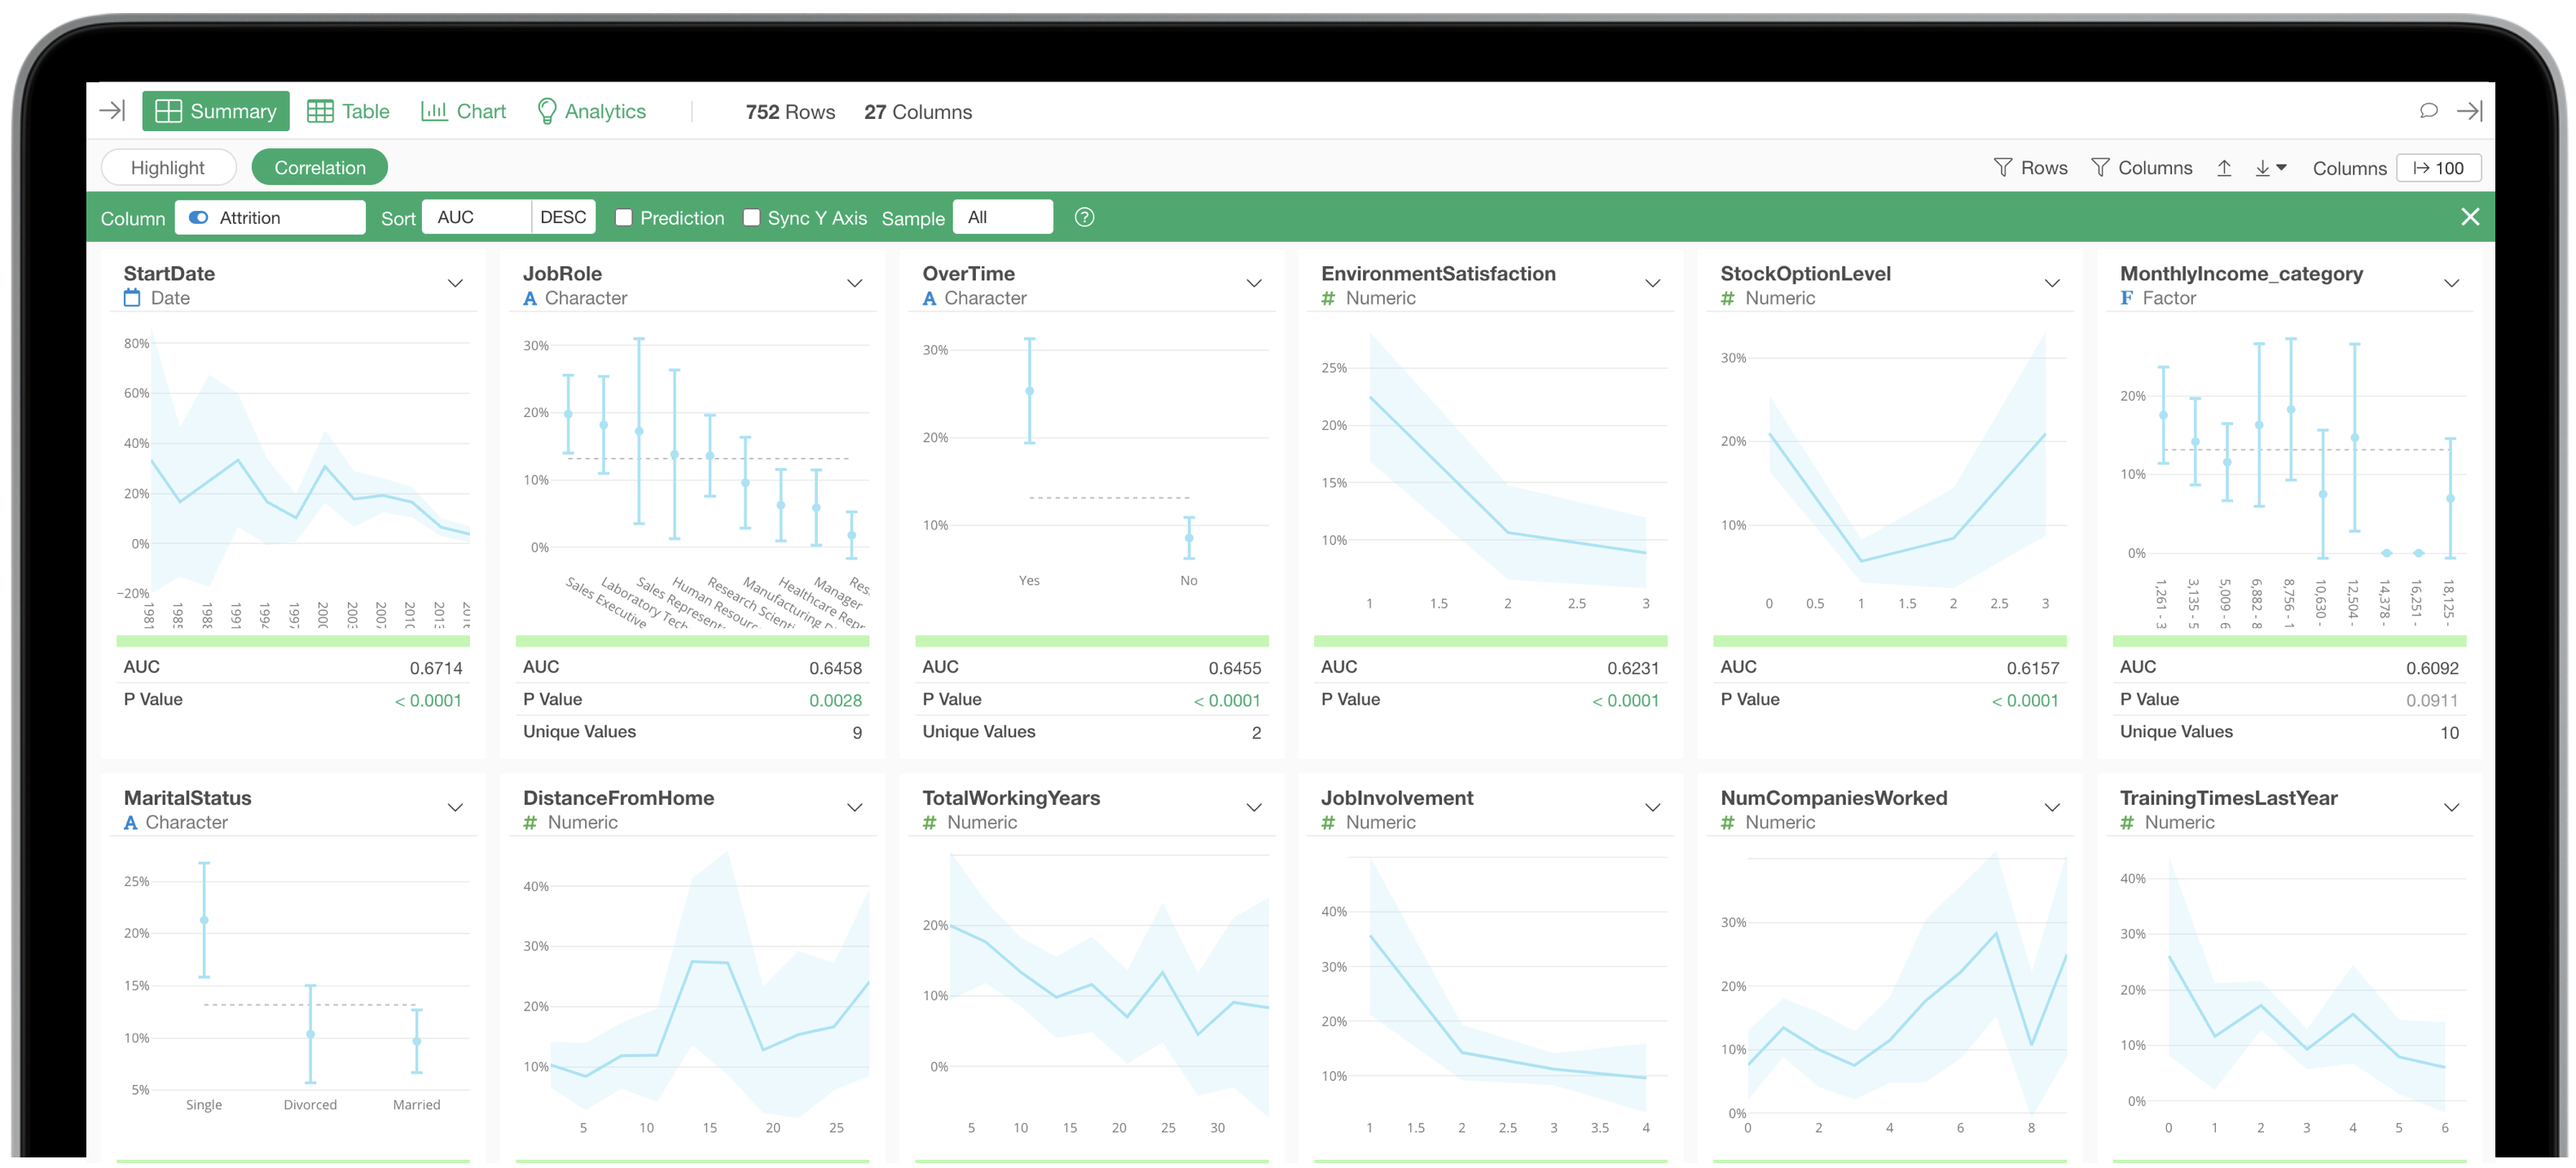
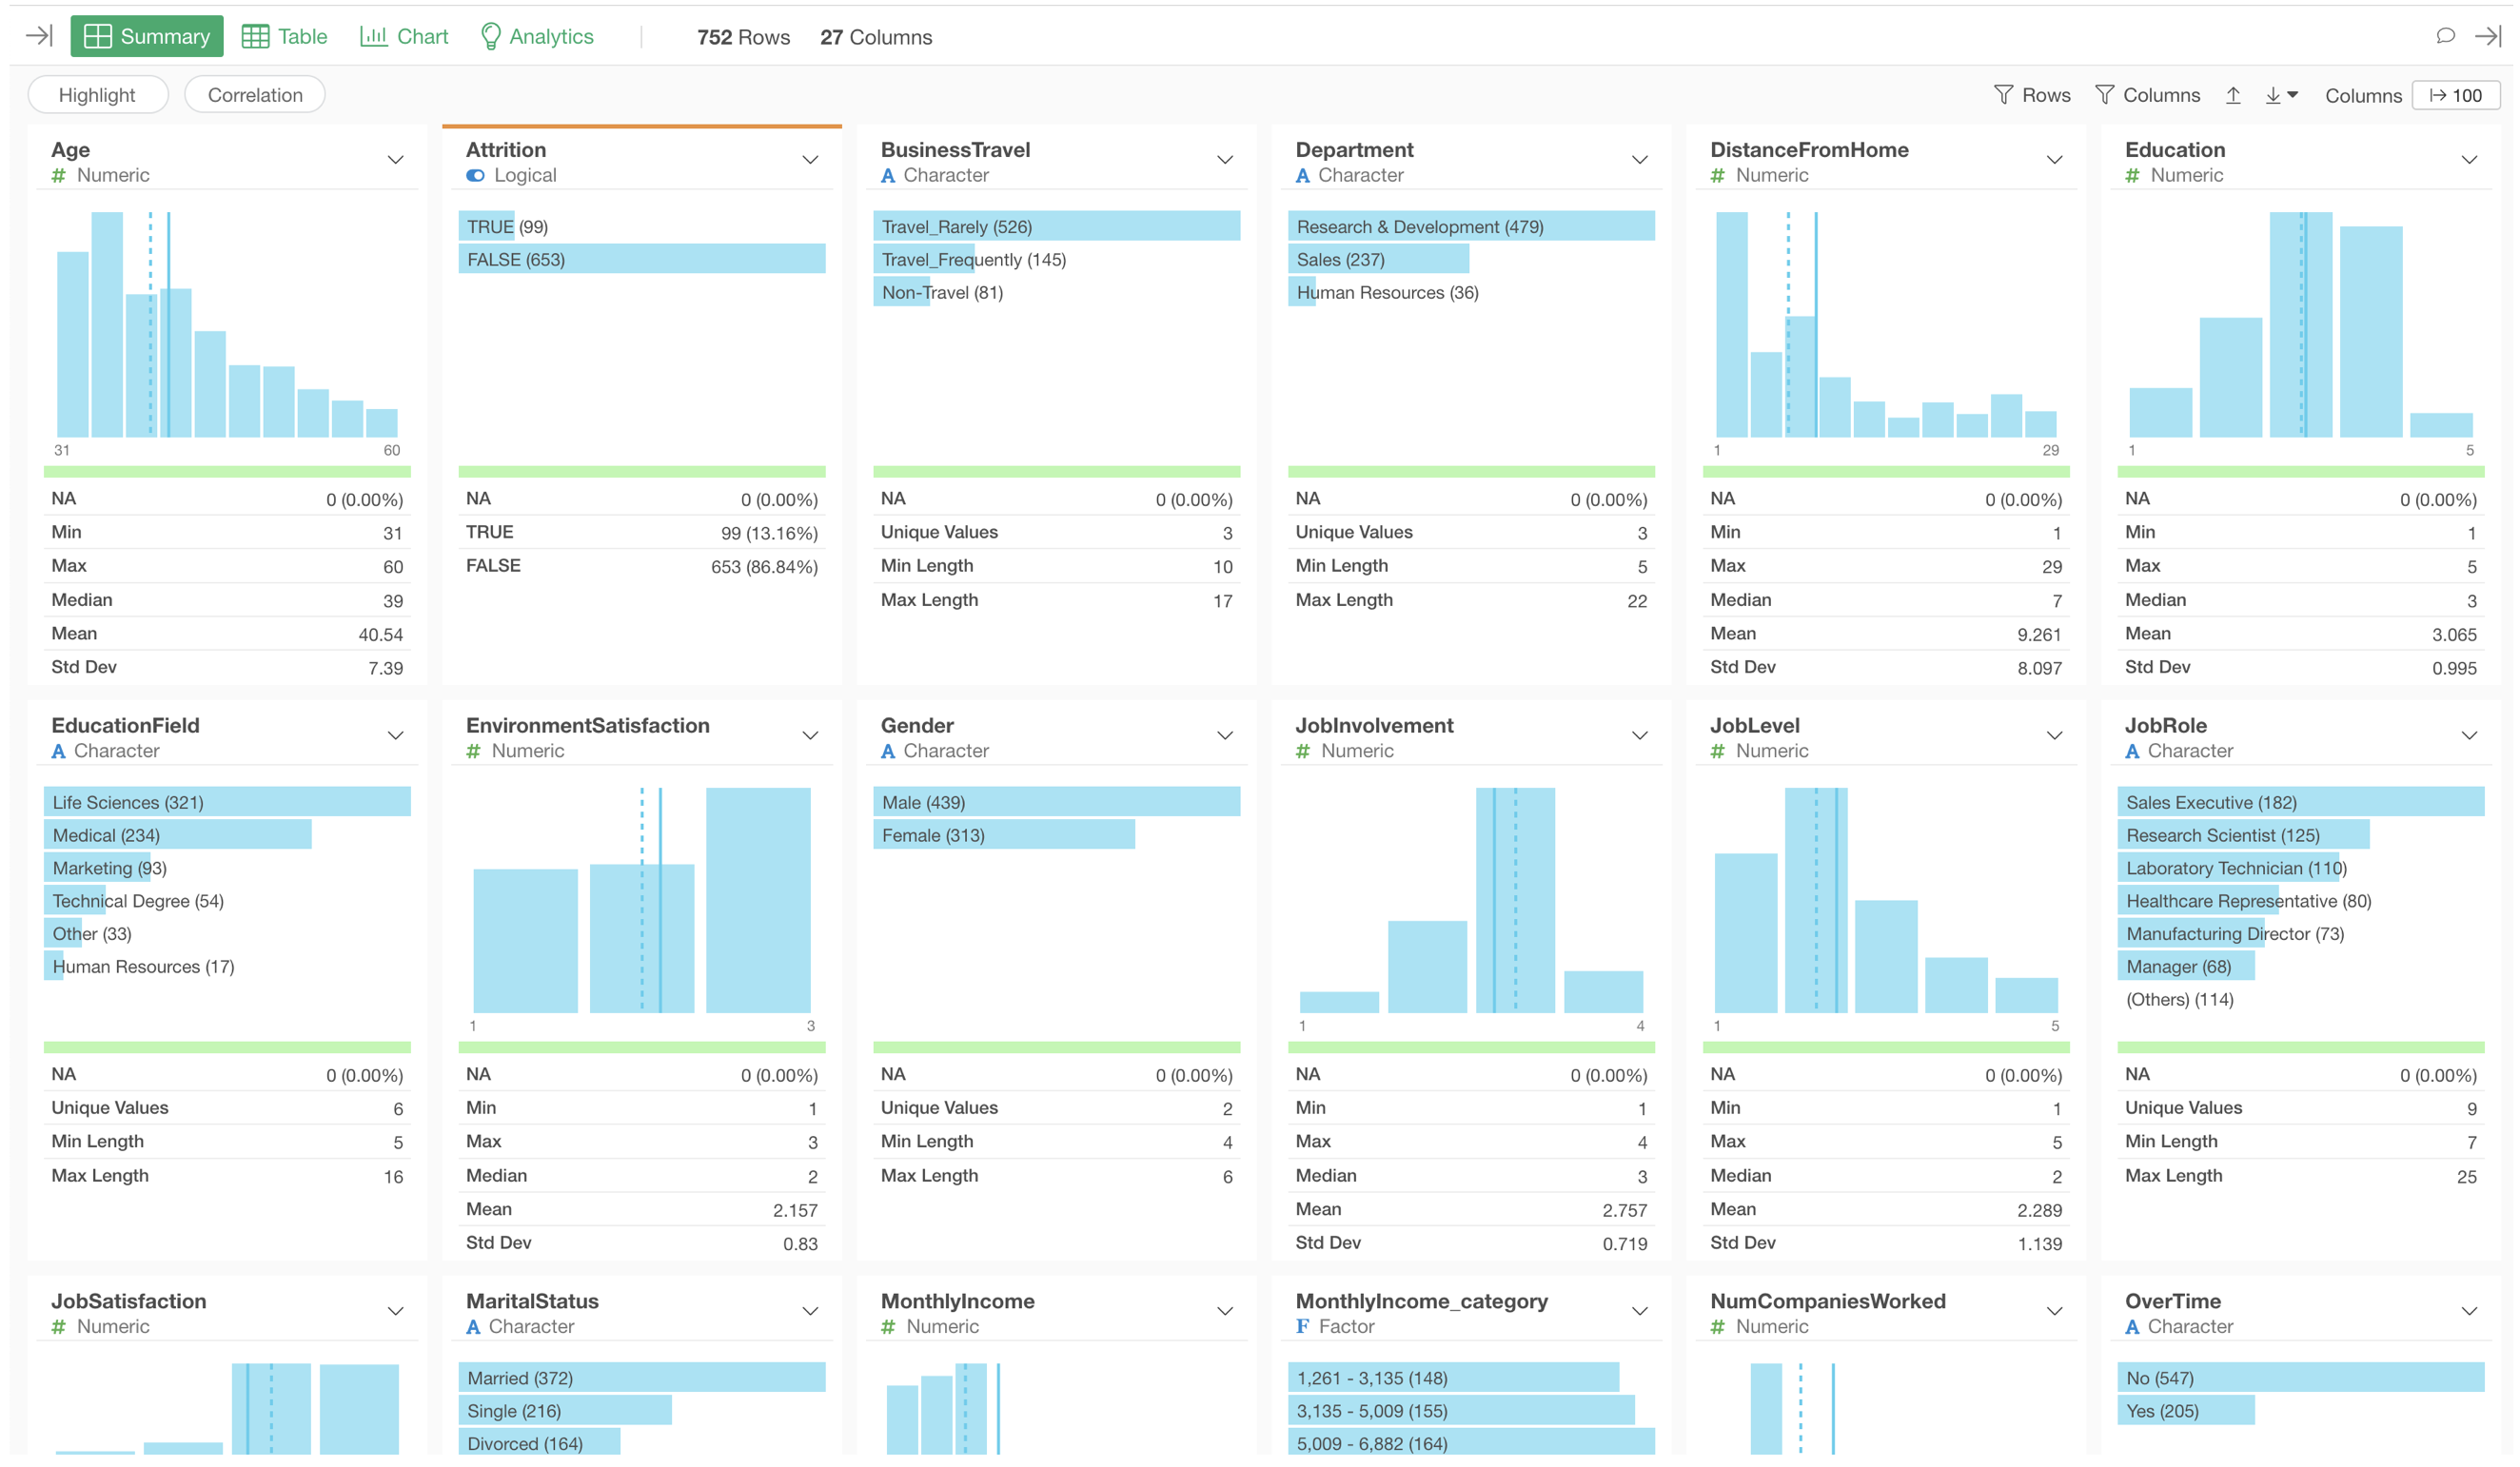
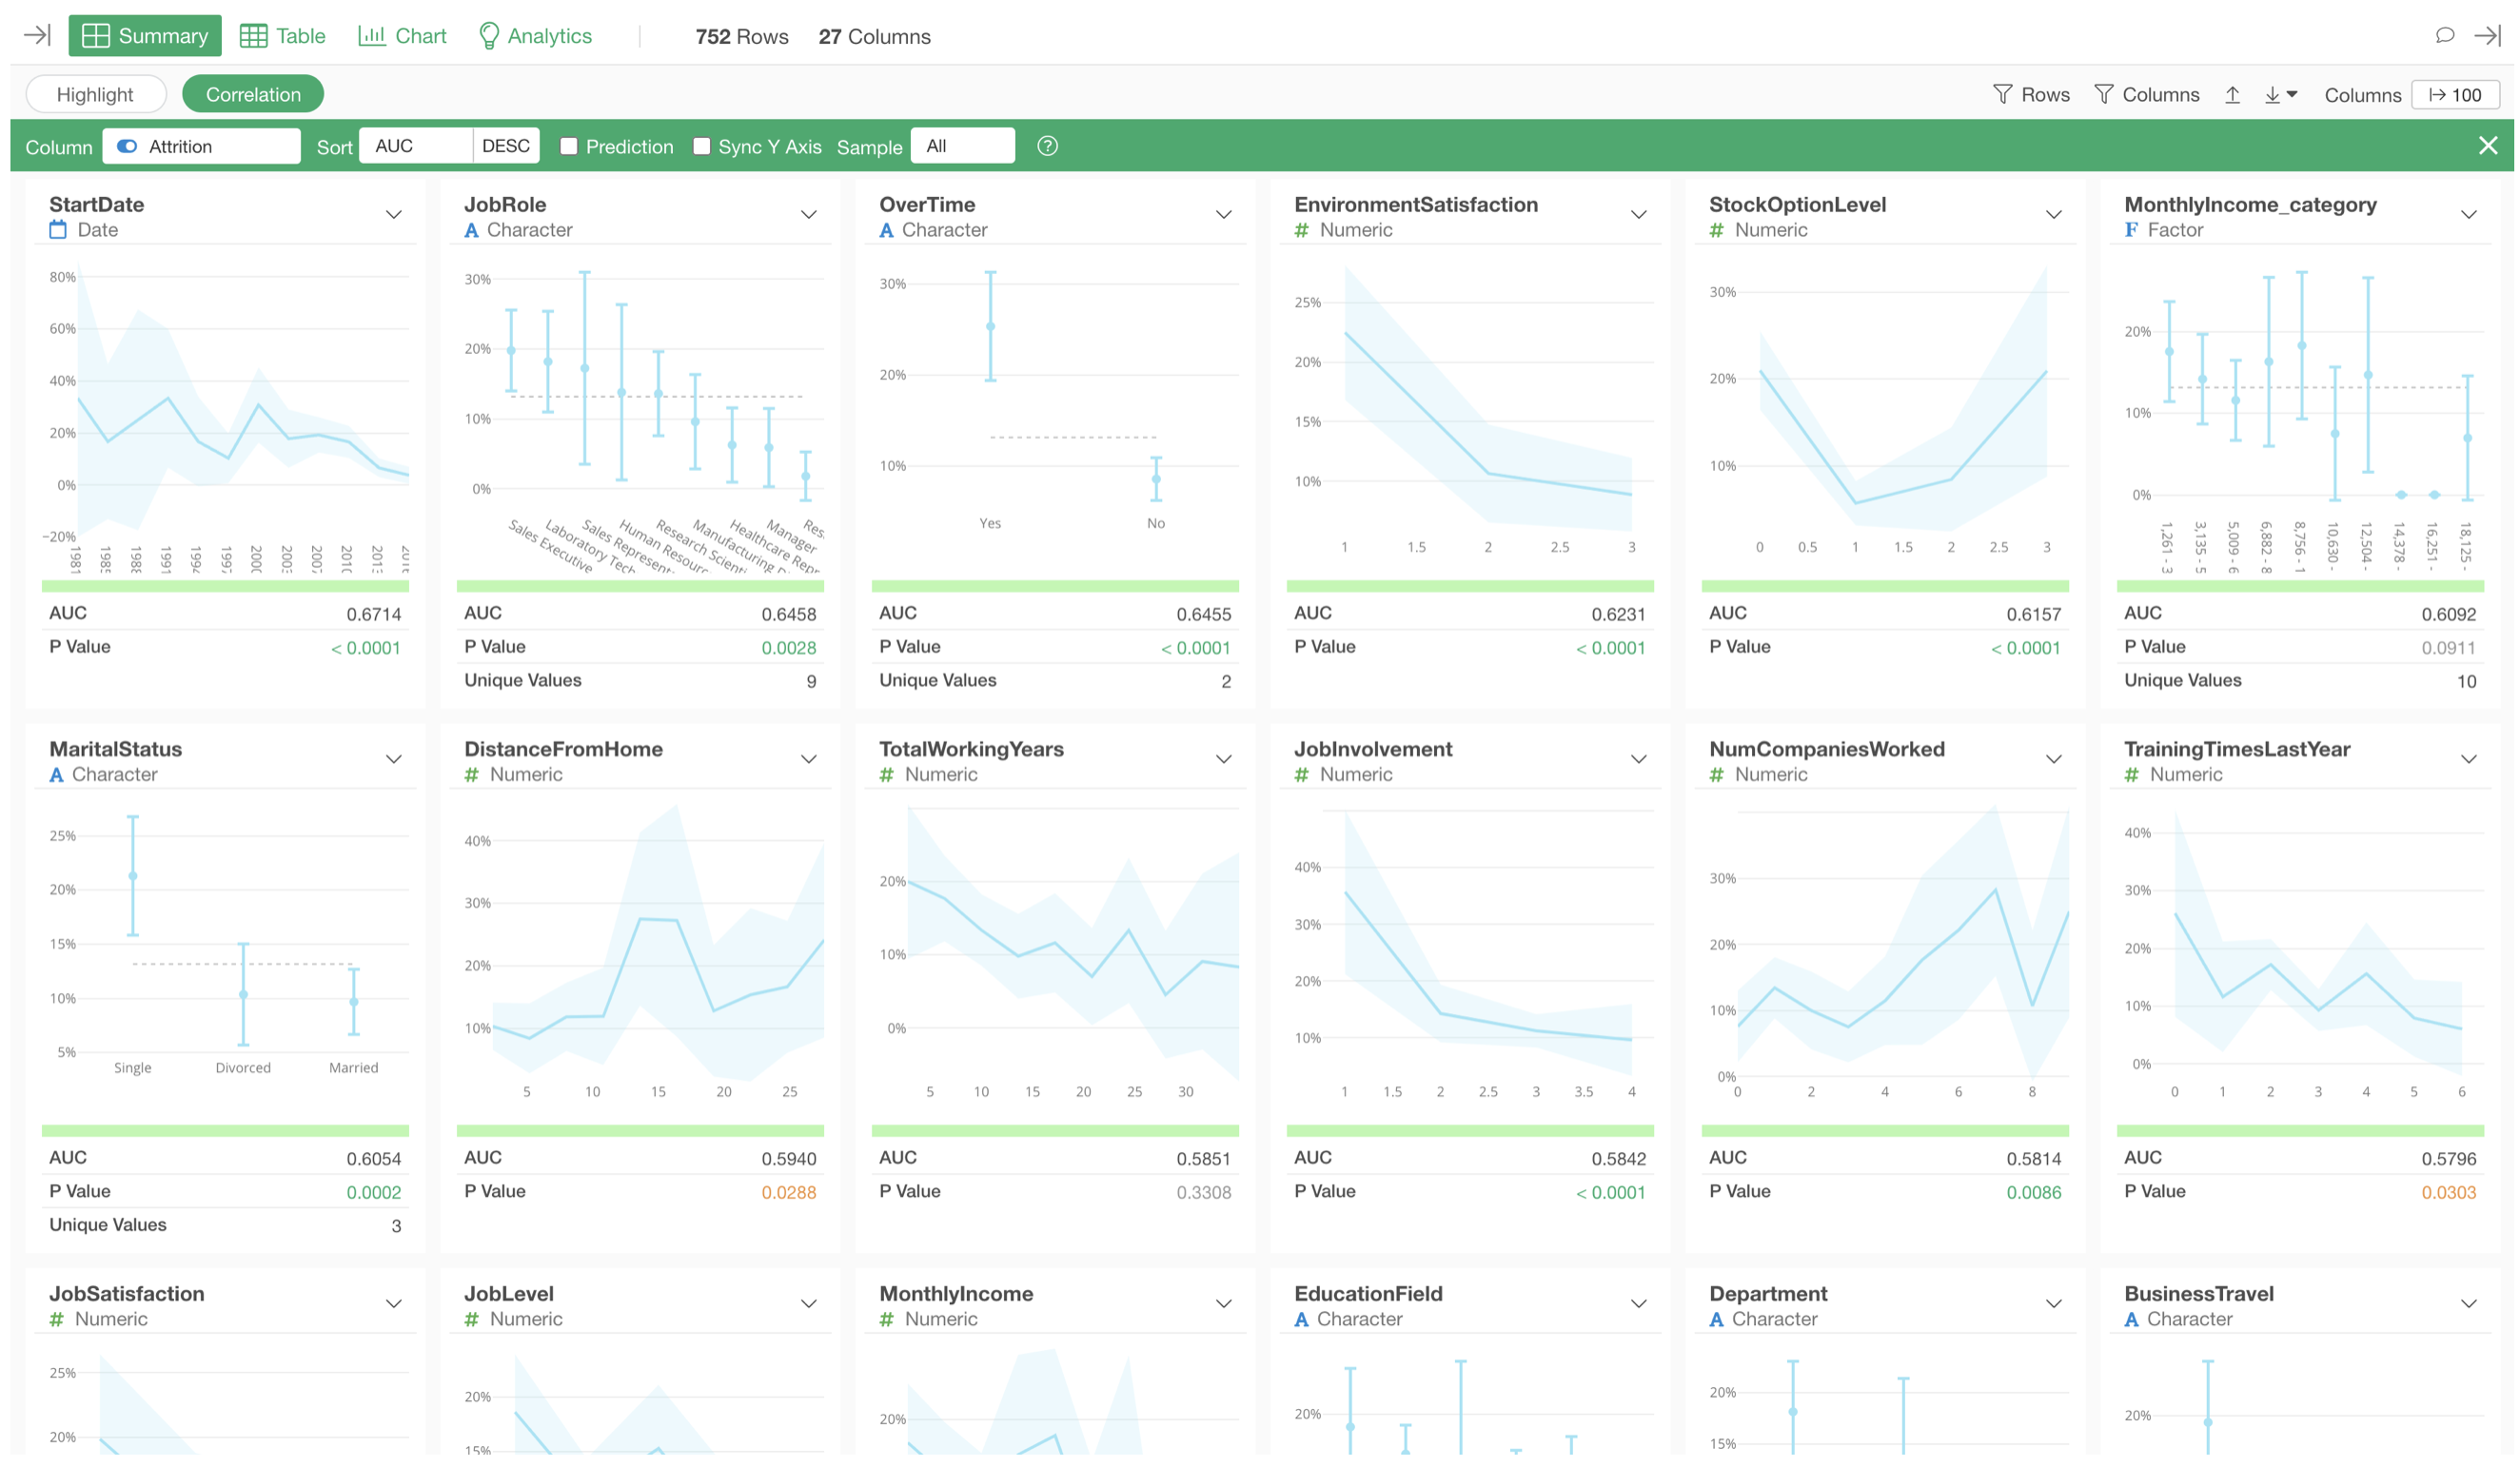
Summary View
Once you import your data, Exploratory automatically generates a summary view where you can see a set of statistics and charts understand your data at glance. You can also use Correlation mode to analyze relationships among variables quickly.
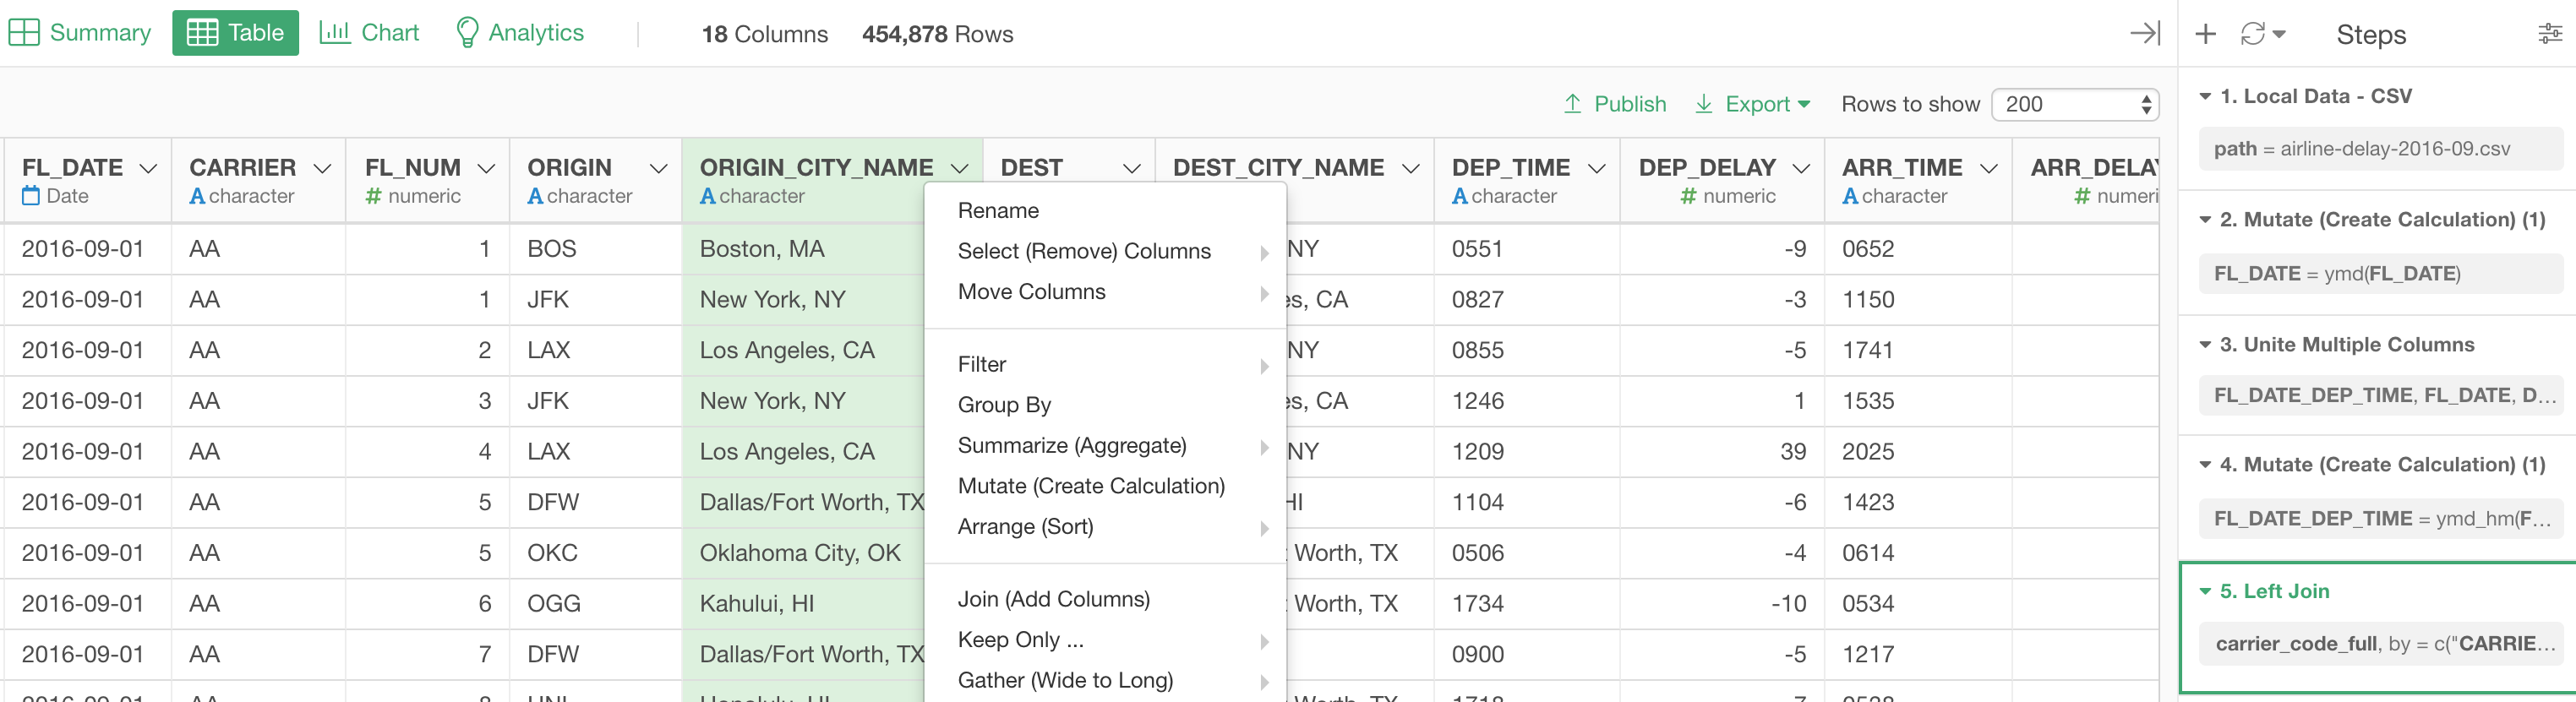
Data Wrangling
Exploratory’s Step based UI experience makes it easy to clean and transform data flexibly and manage the data wrangling process in a reproducible way.
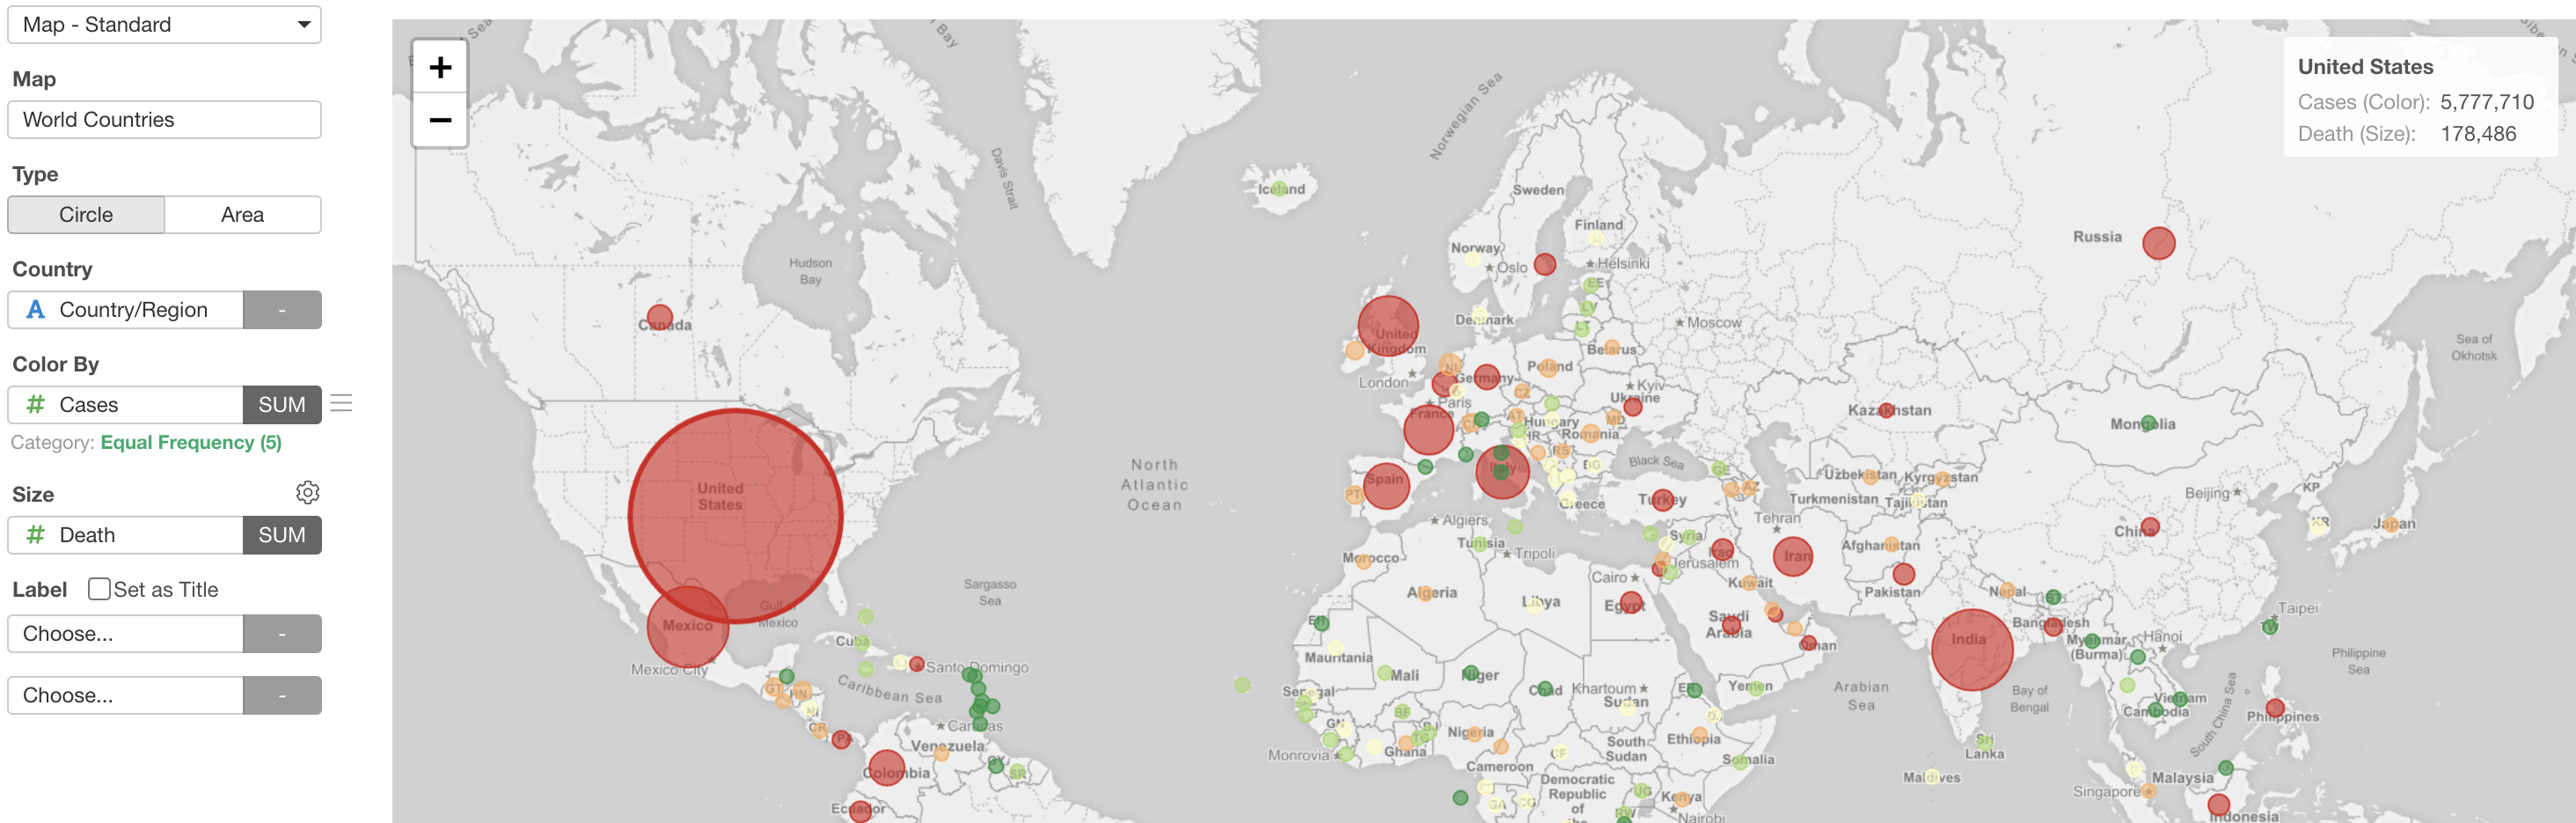
Data Visualization
Easy to create charts with a wide range of chart types and with various functionalities to explore your data and discover insights quickly.
Analytics
Statistics / Machine Learning
Exploratory’s simple UI experience makes it easy to use a wide range of Statistics and Machine Learning algorithms to explore data and gain deeper insights quickly.
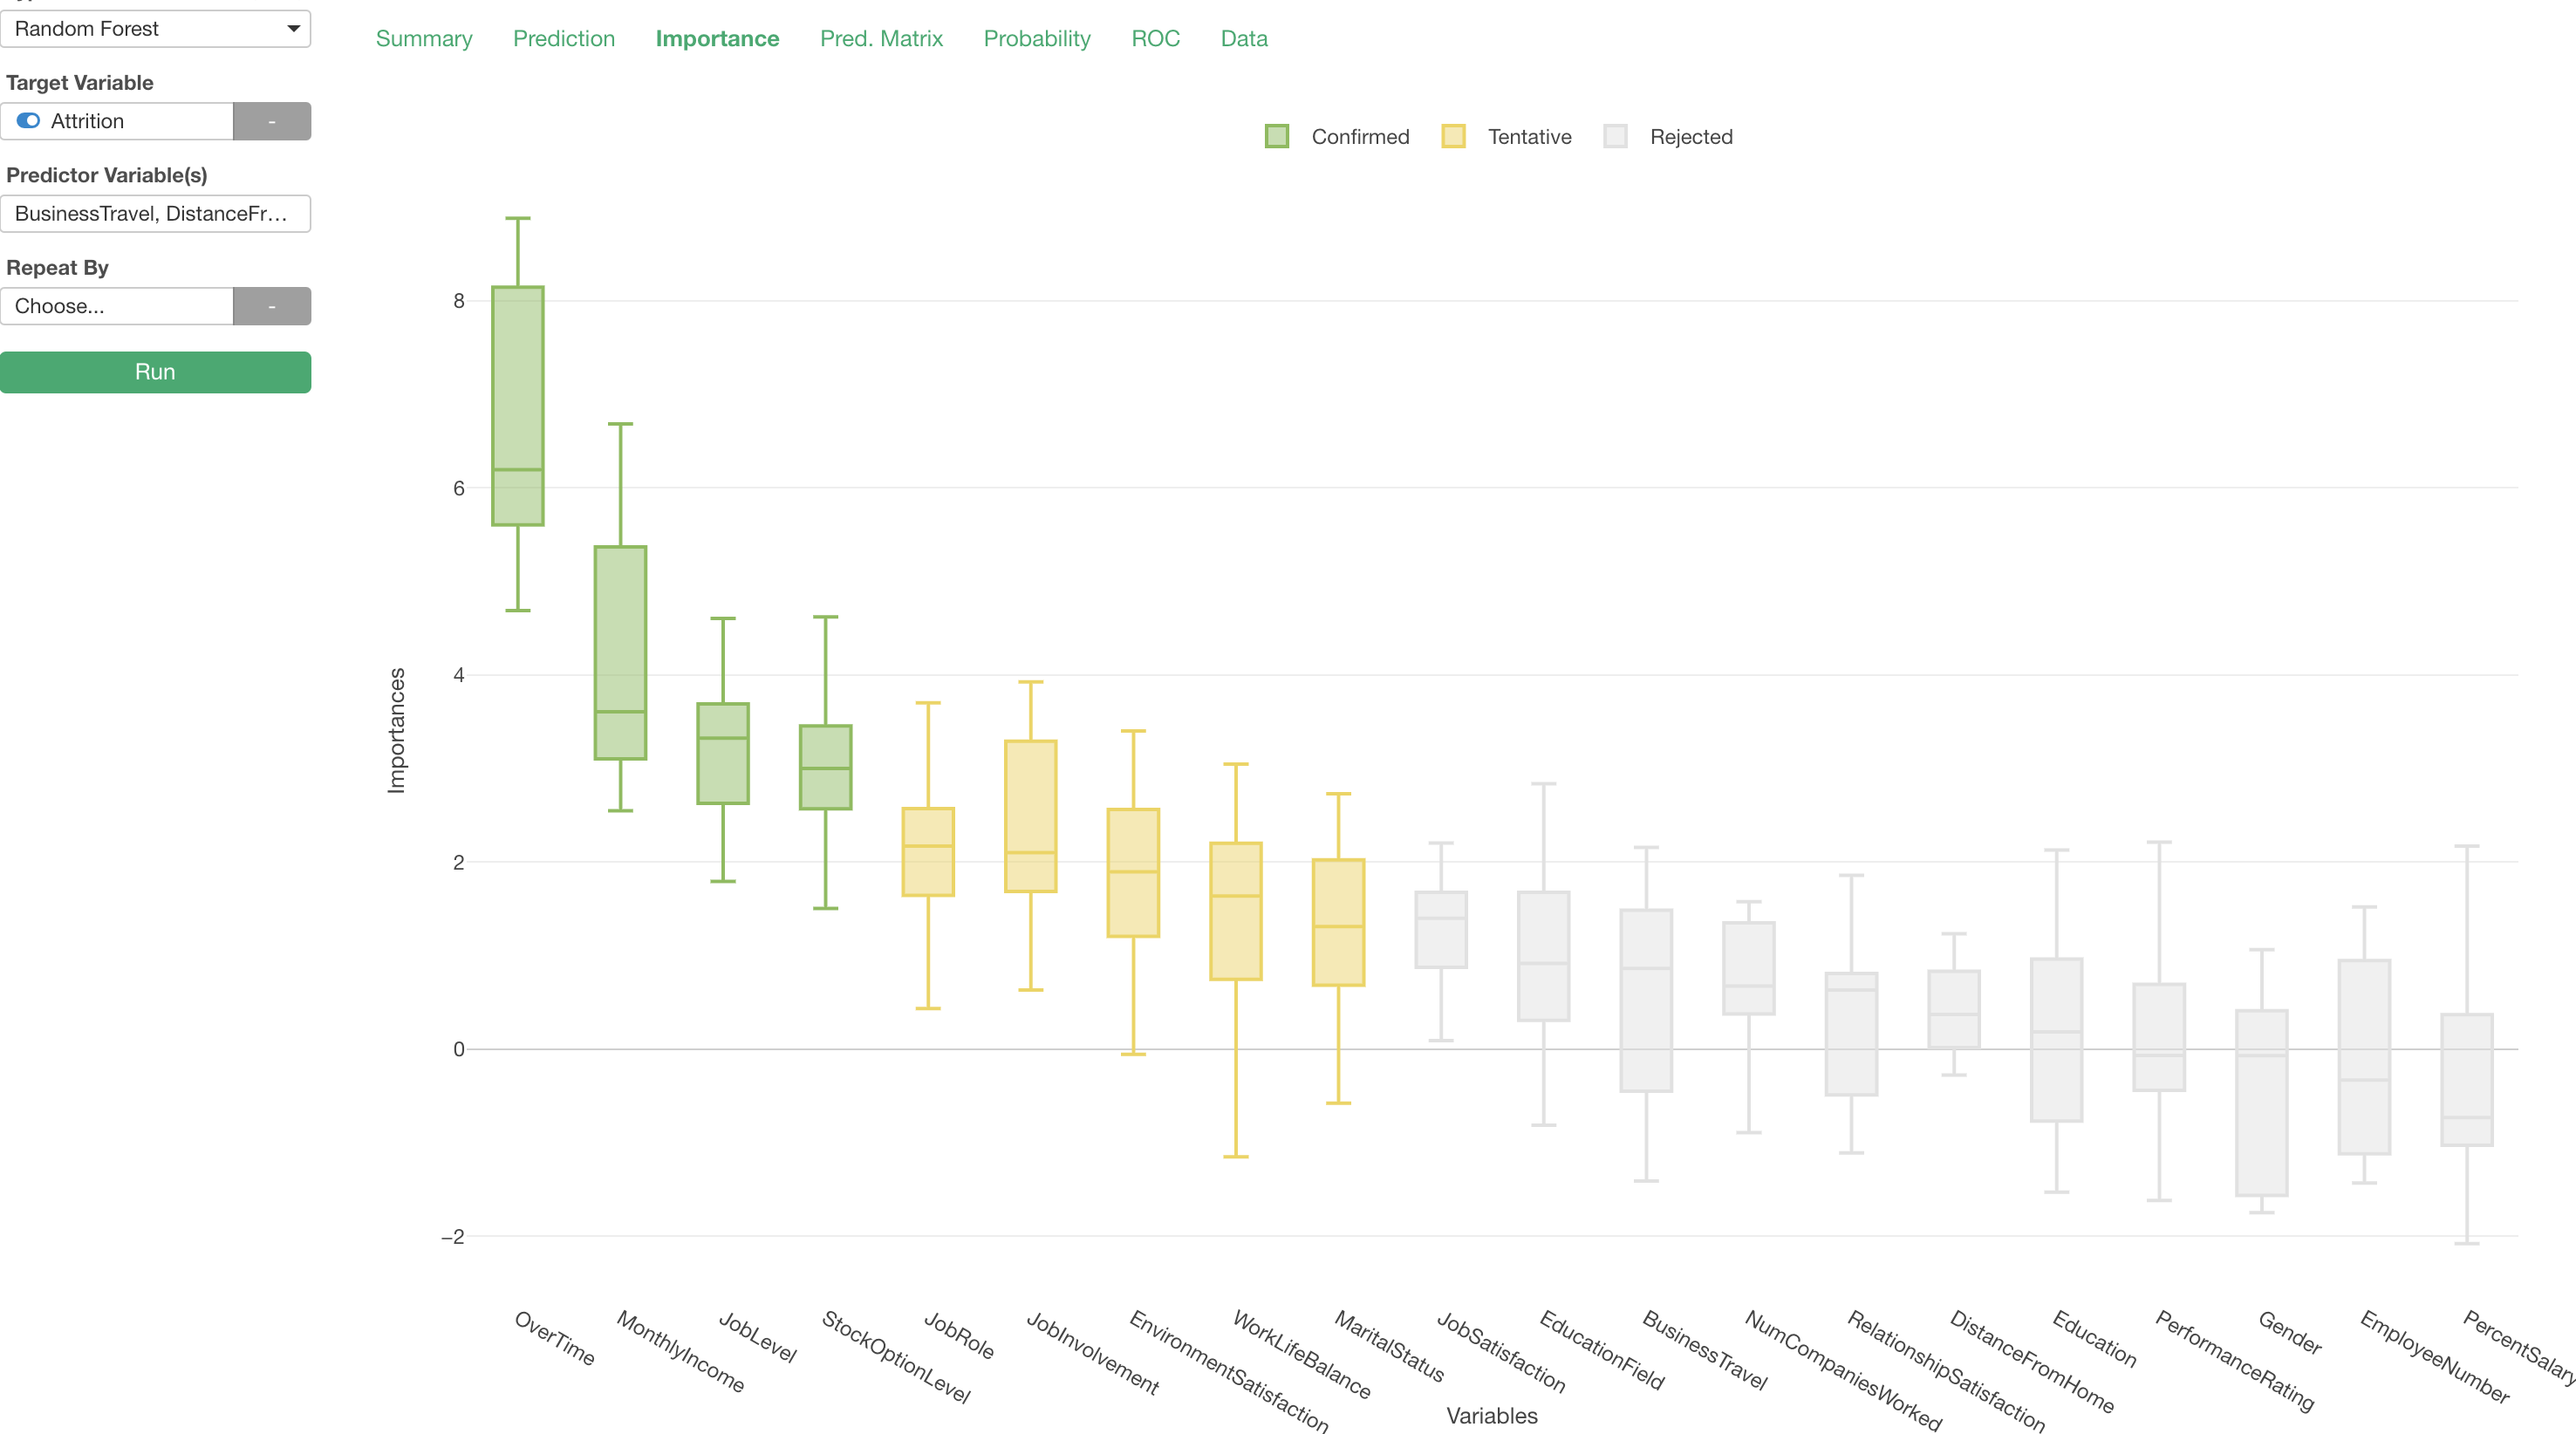
Random Forest
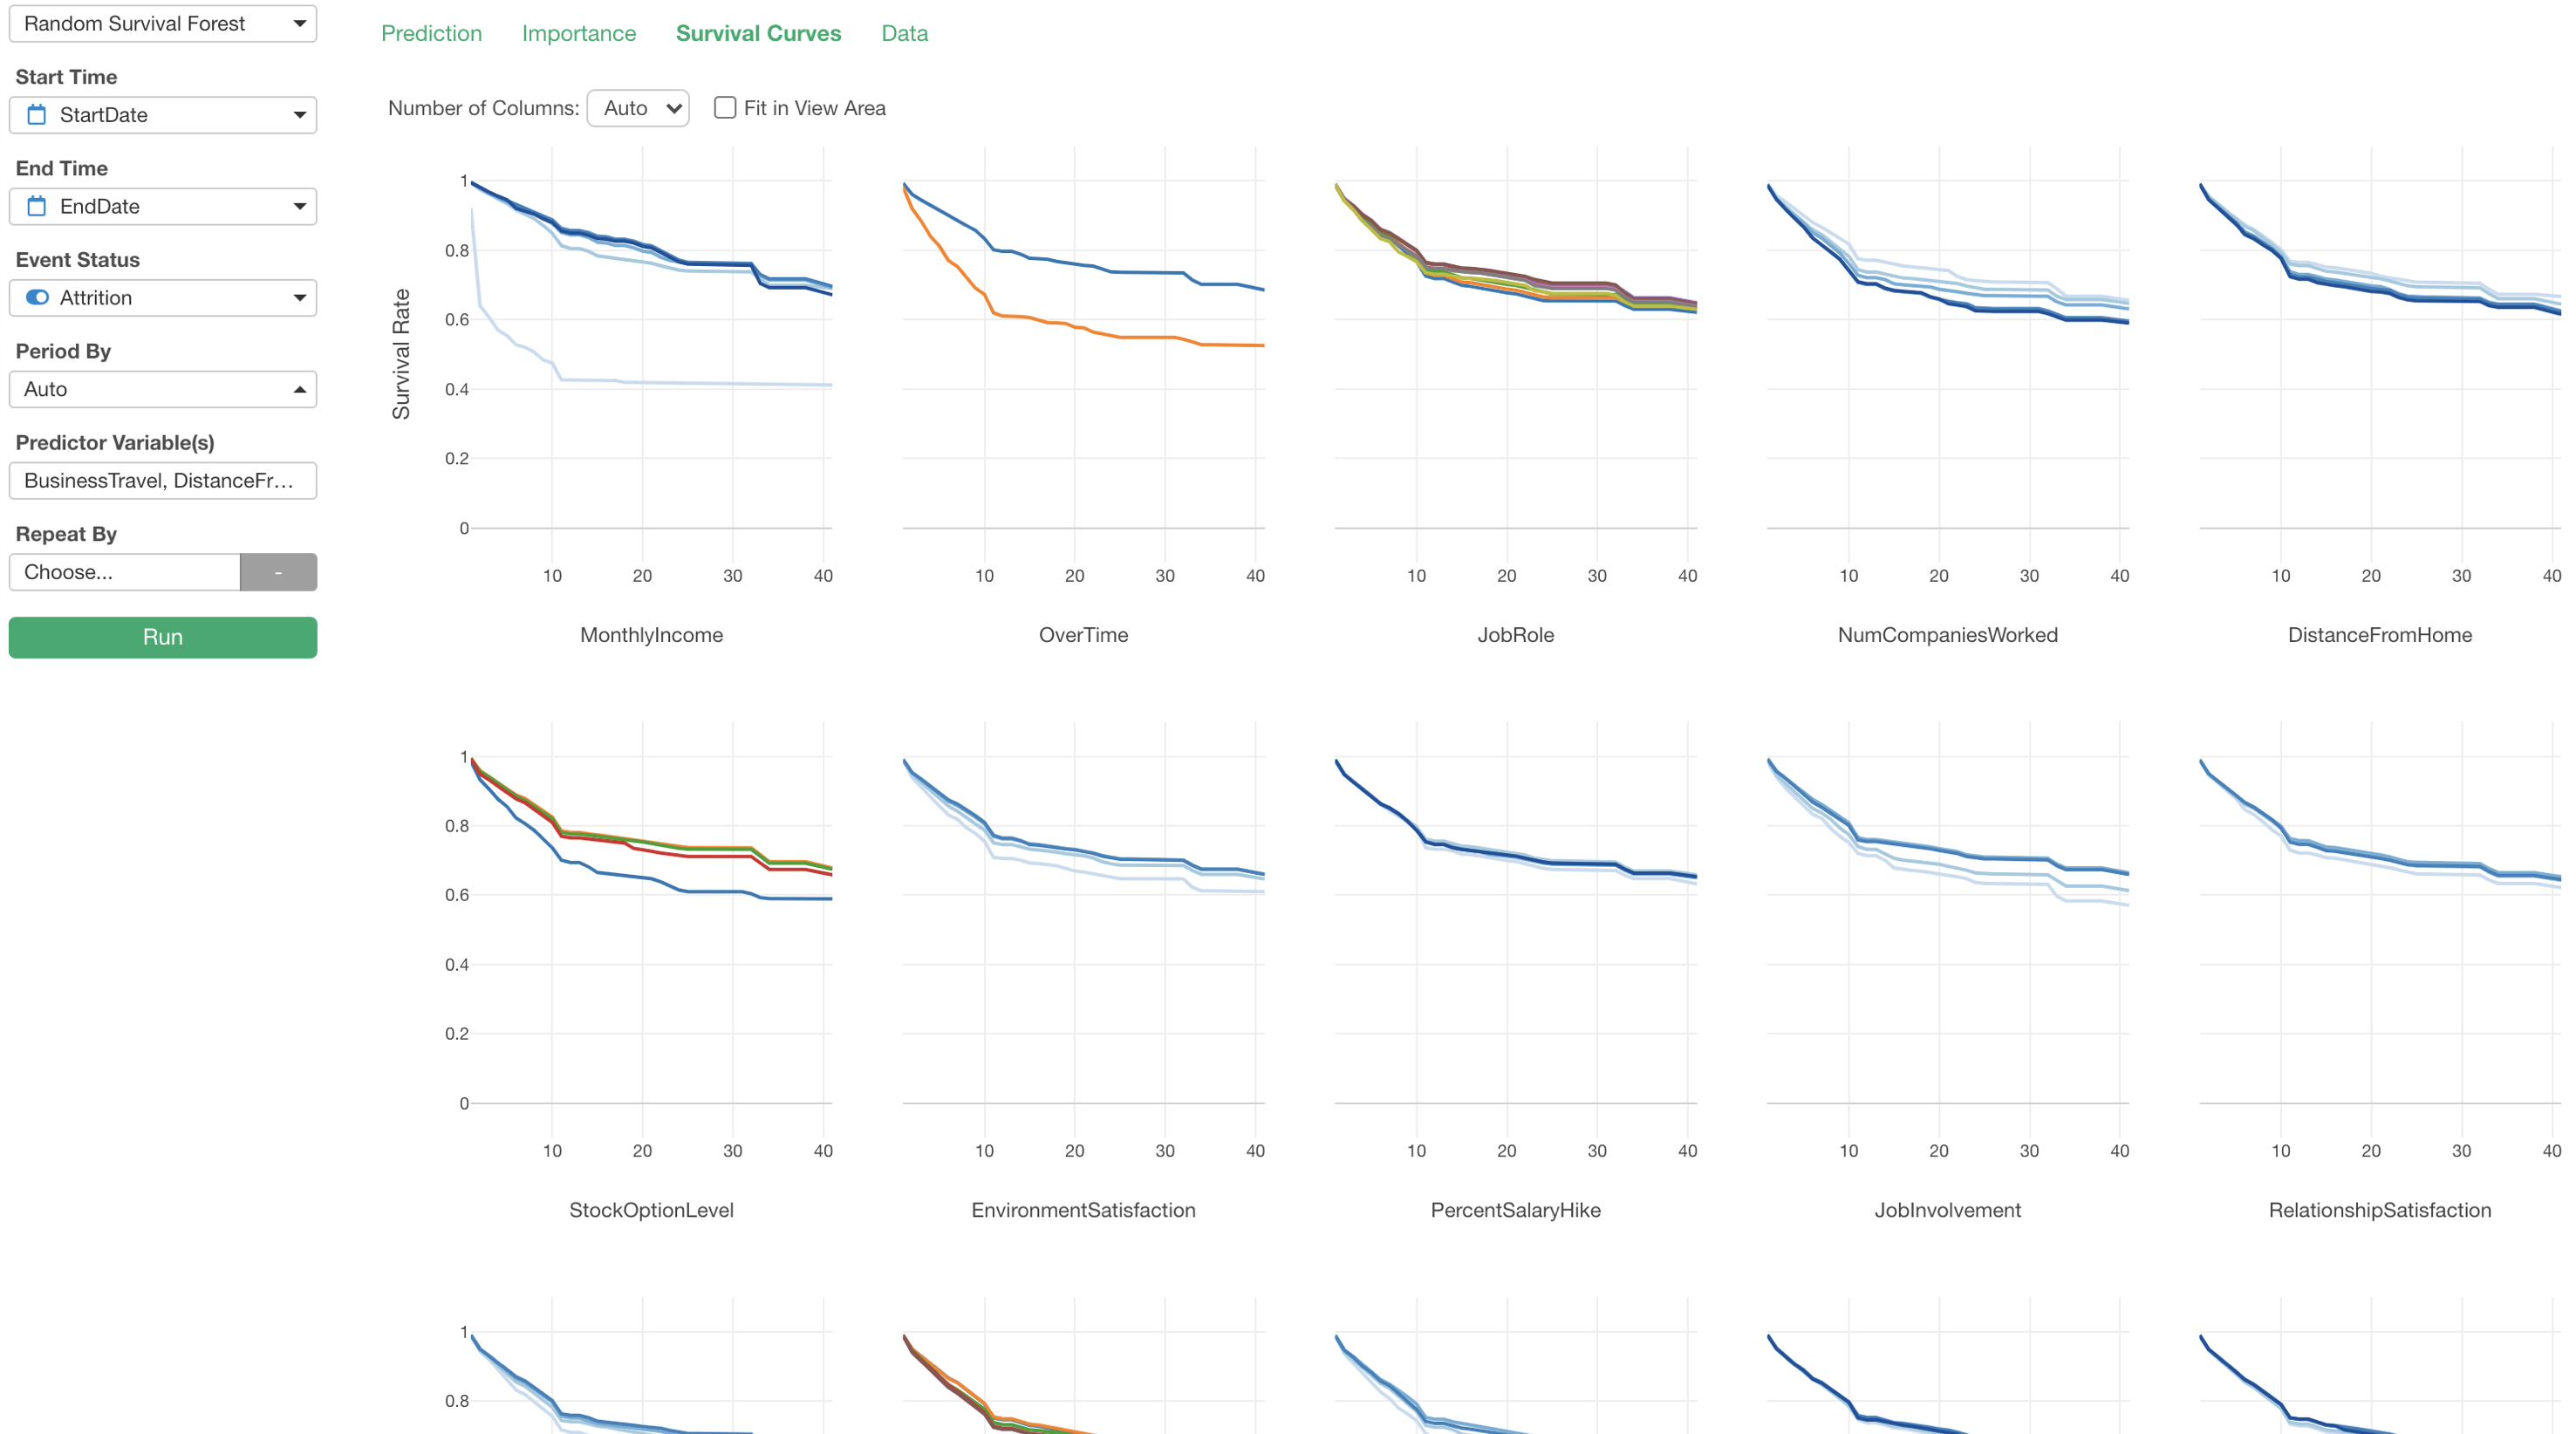
Survival Analysis
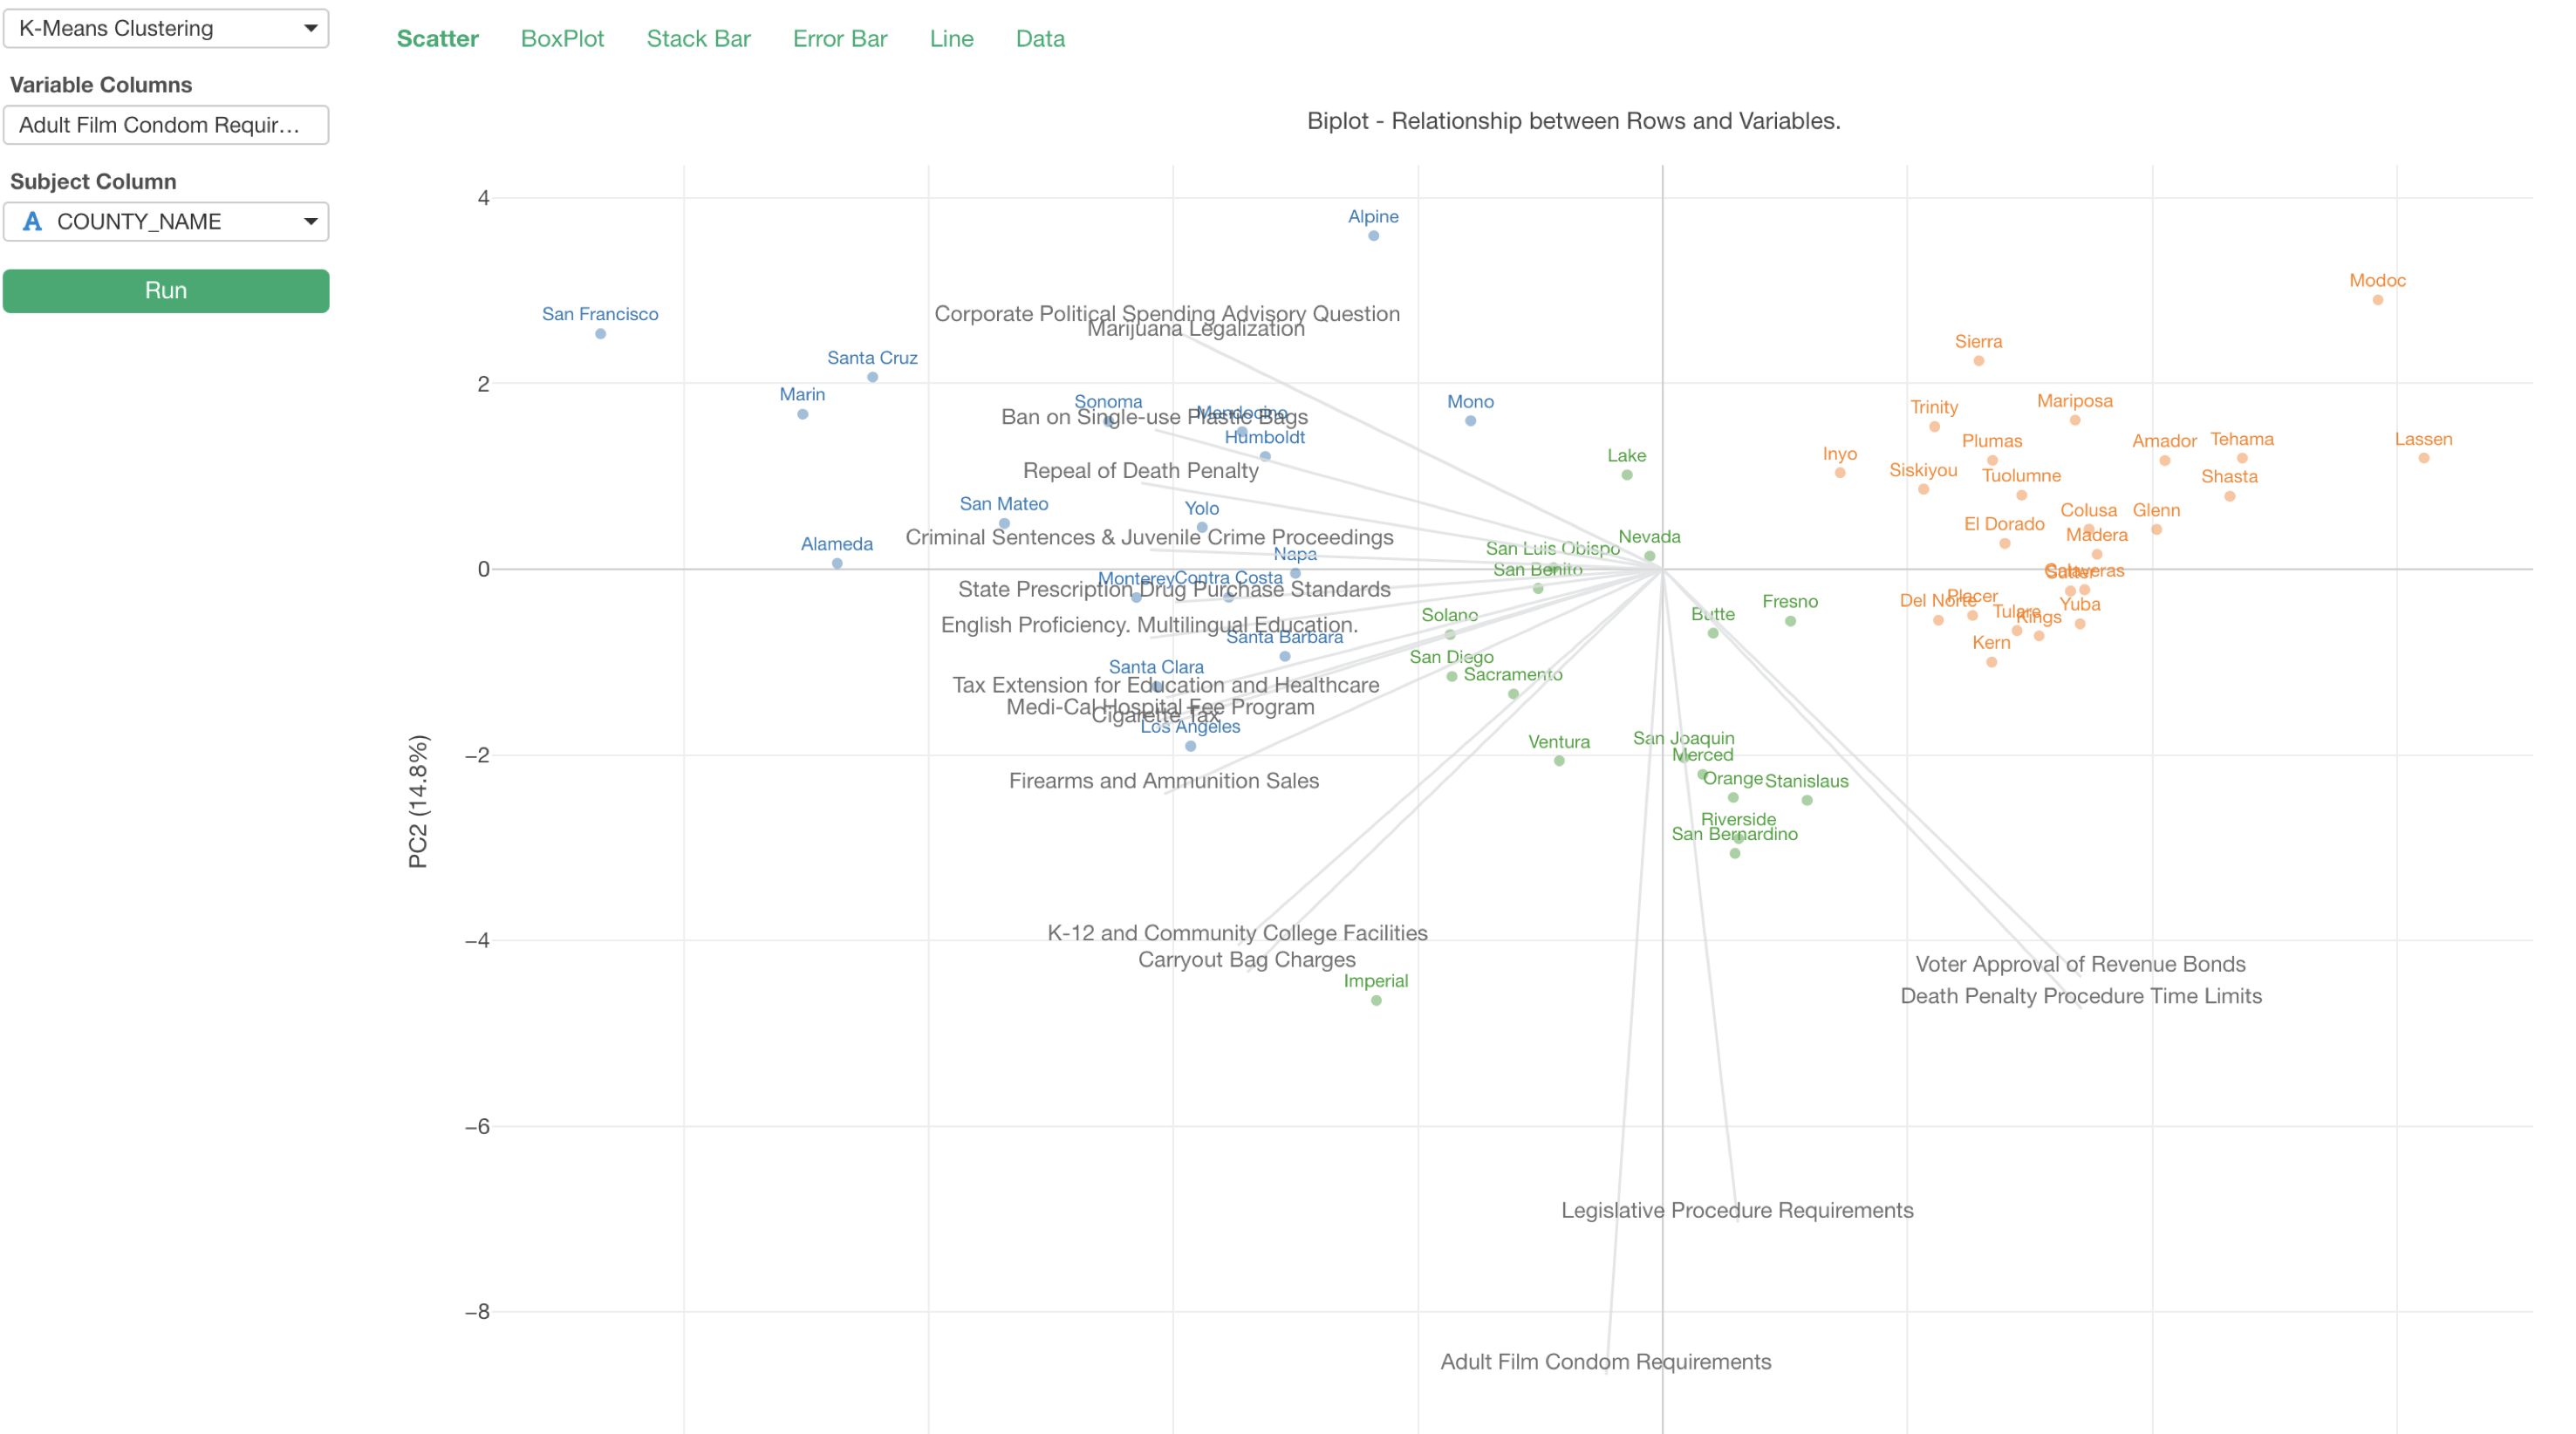
Clustering
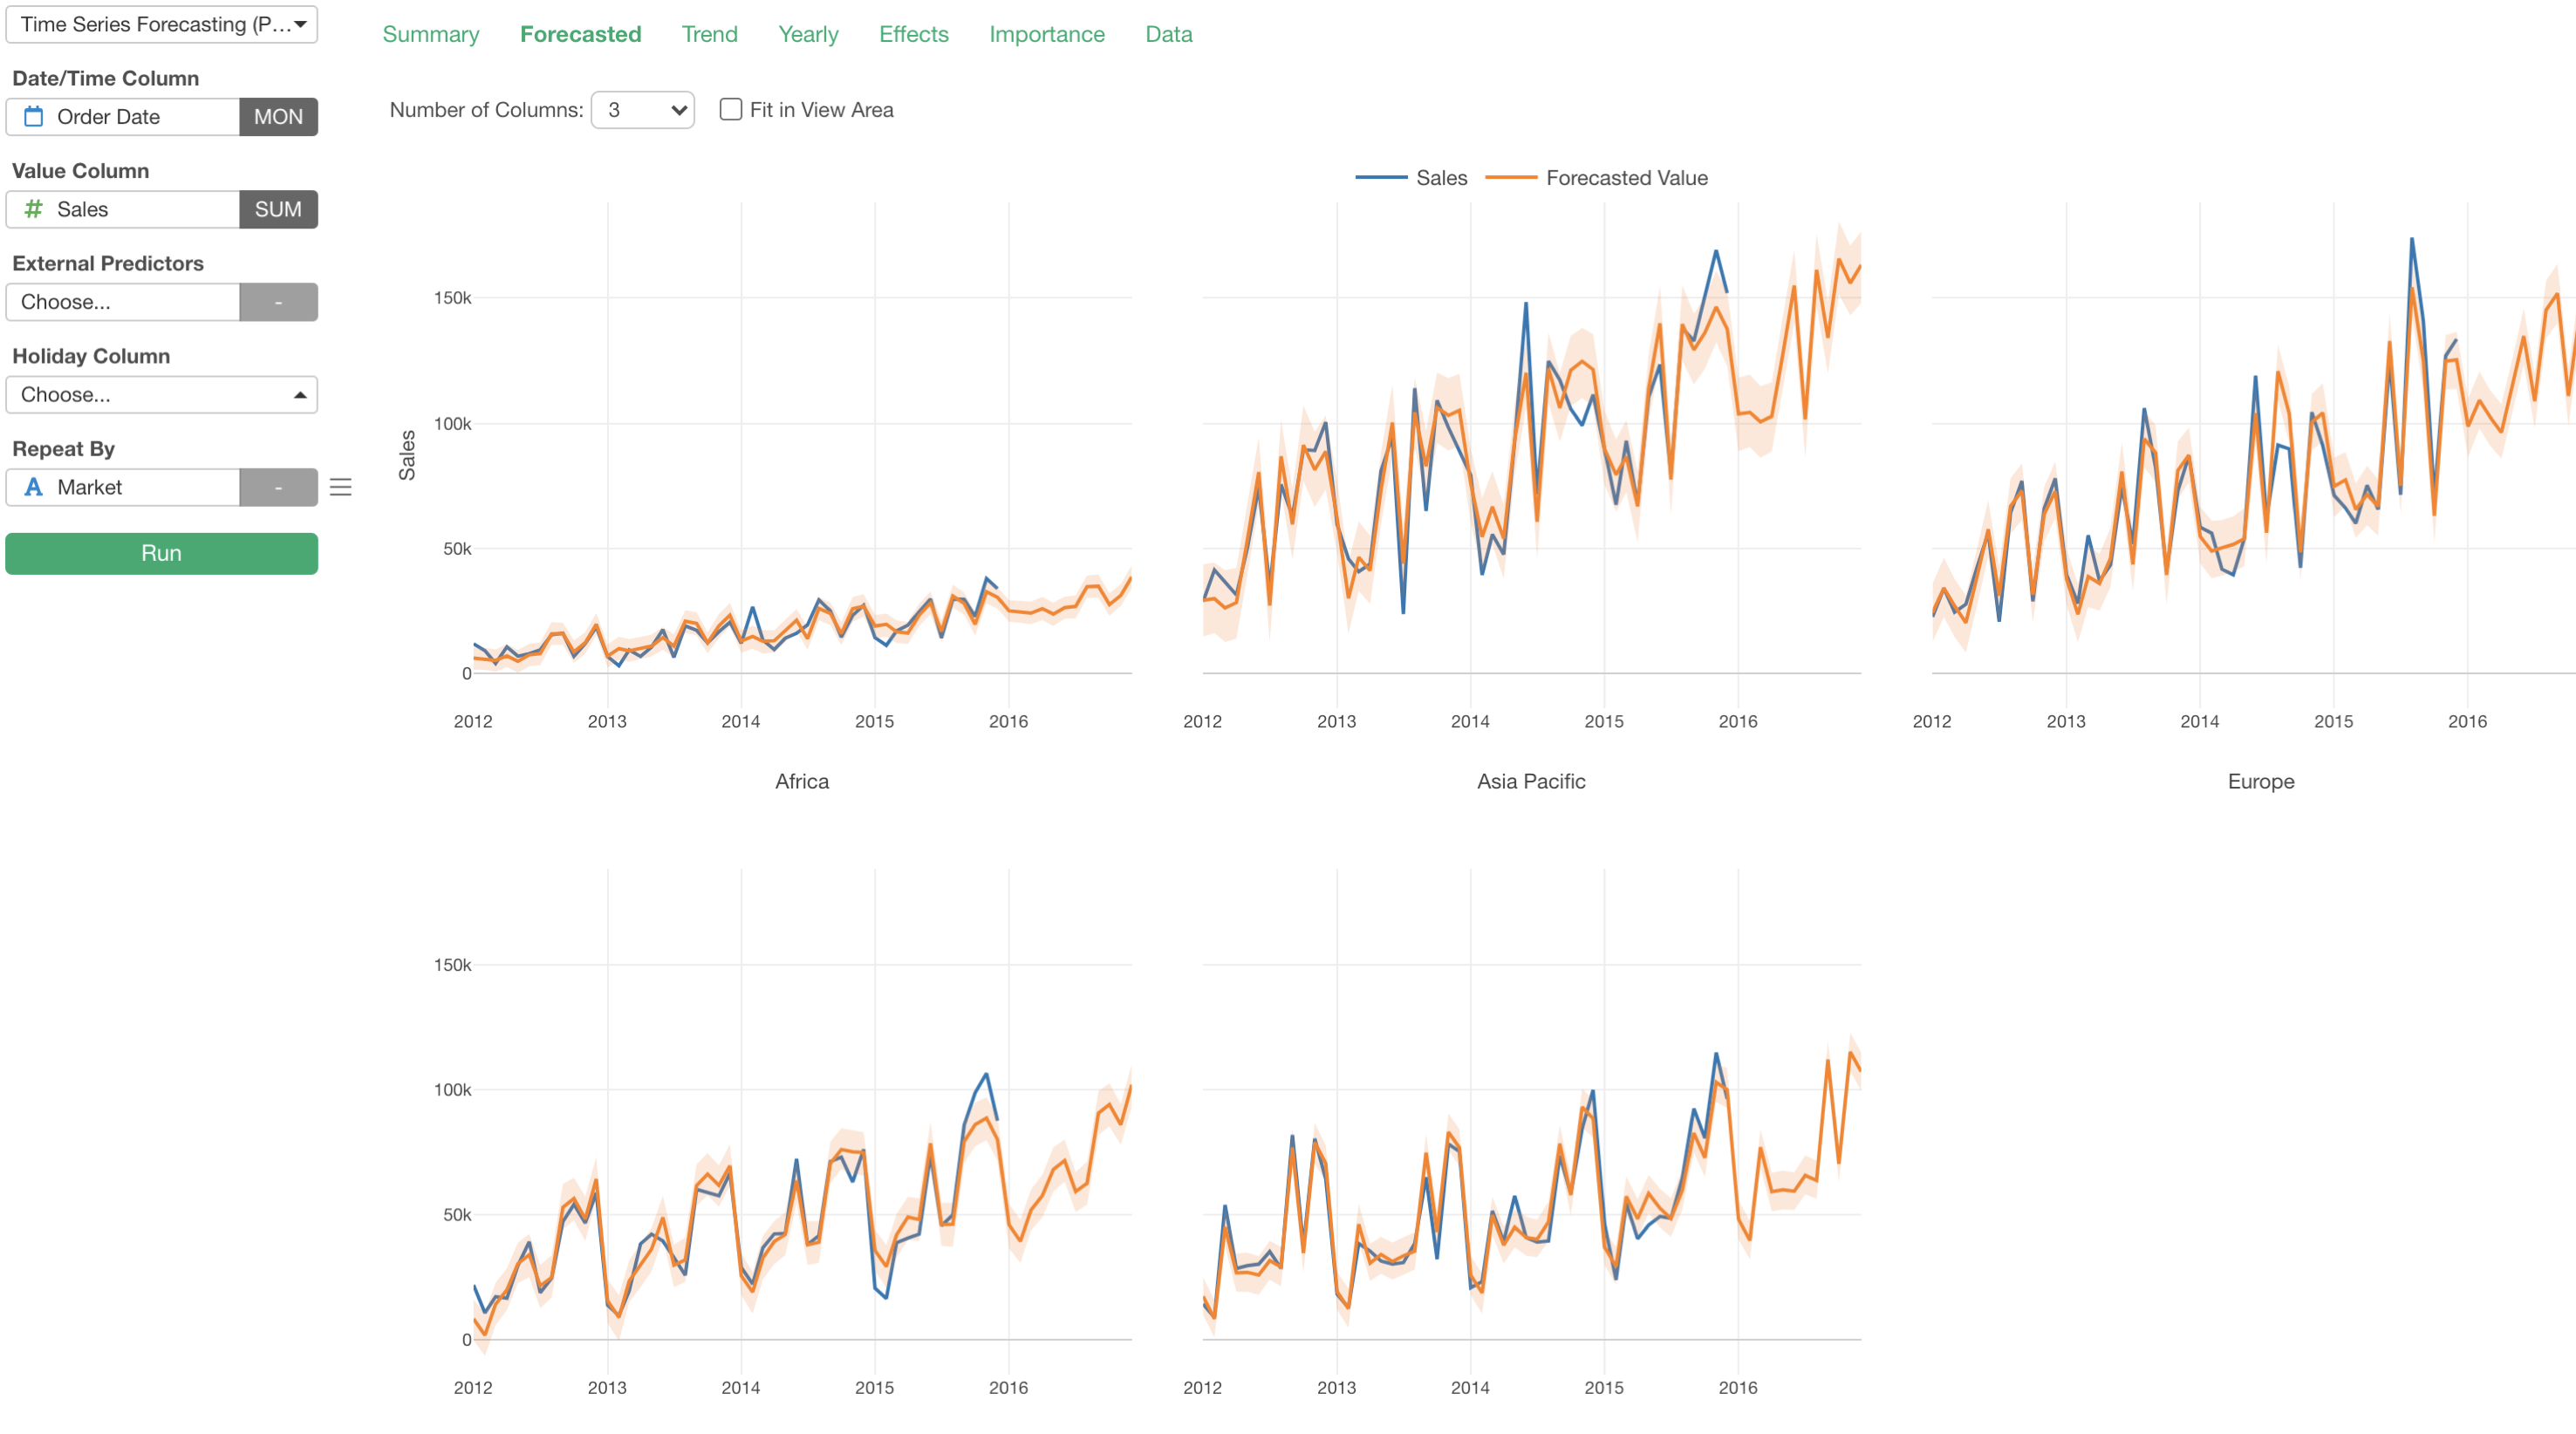
Time Series Forecasting
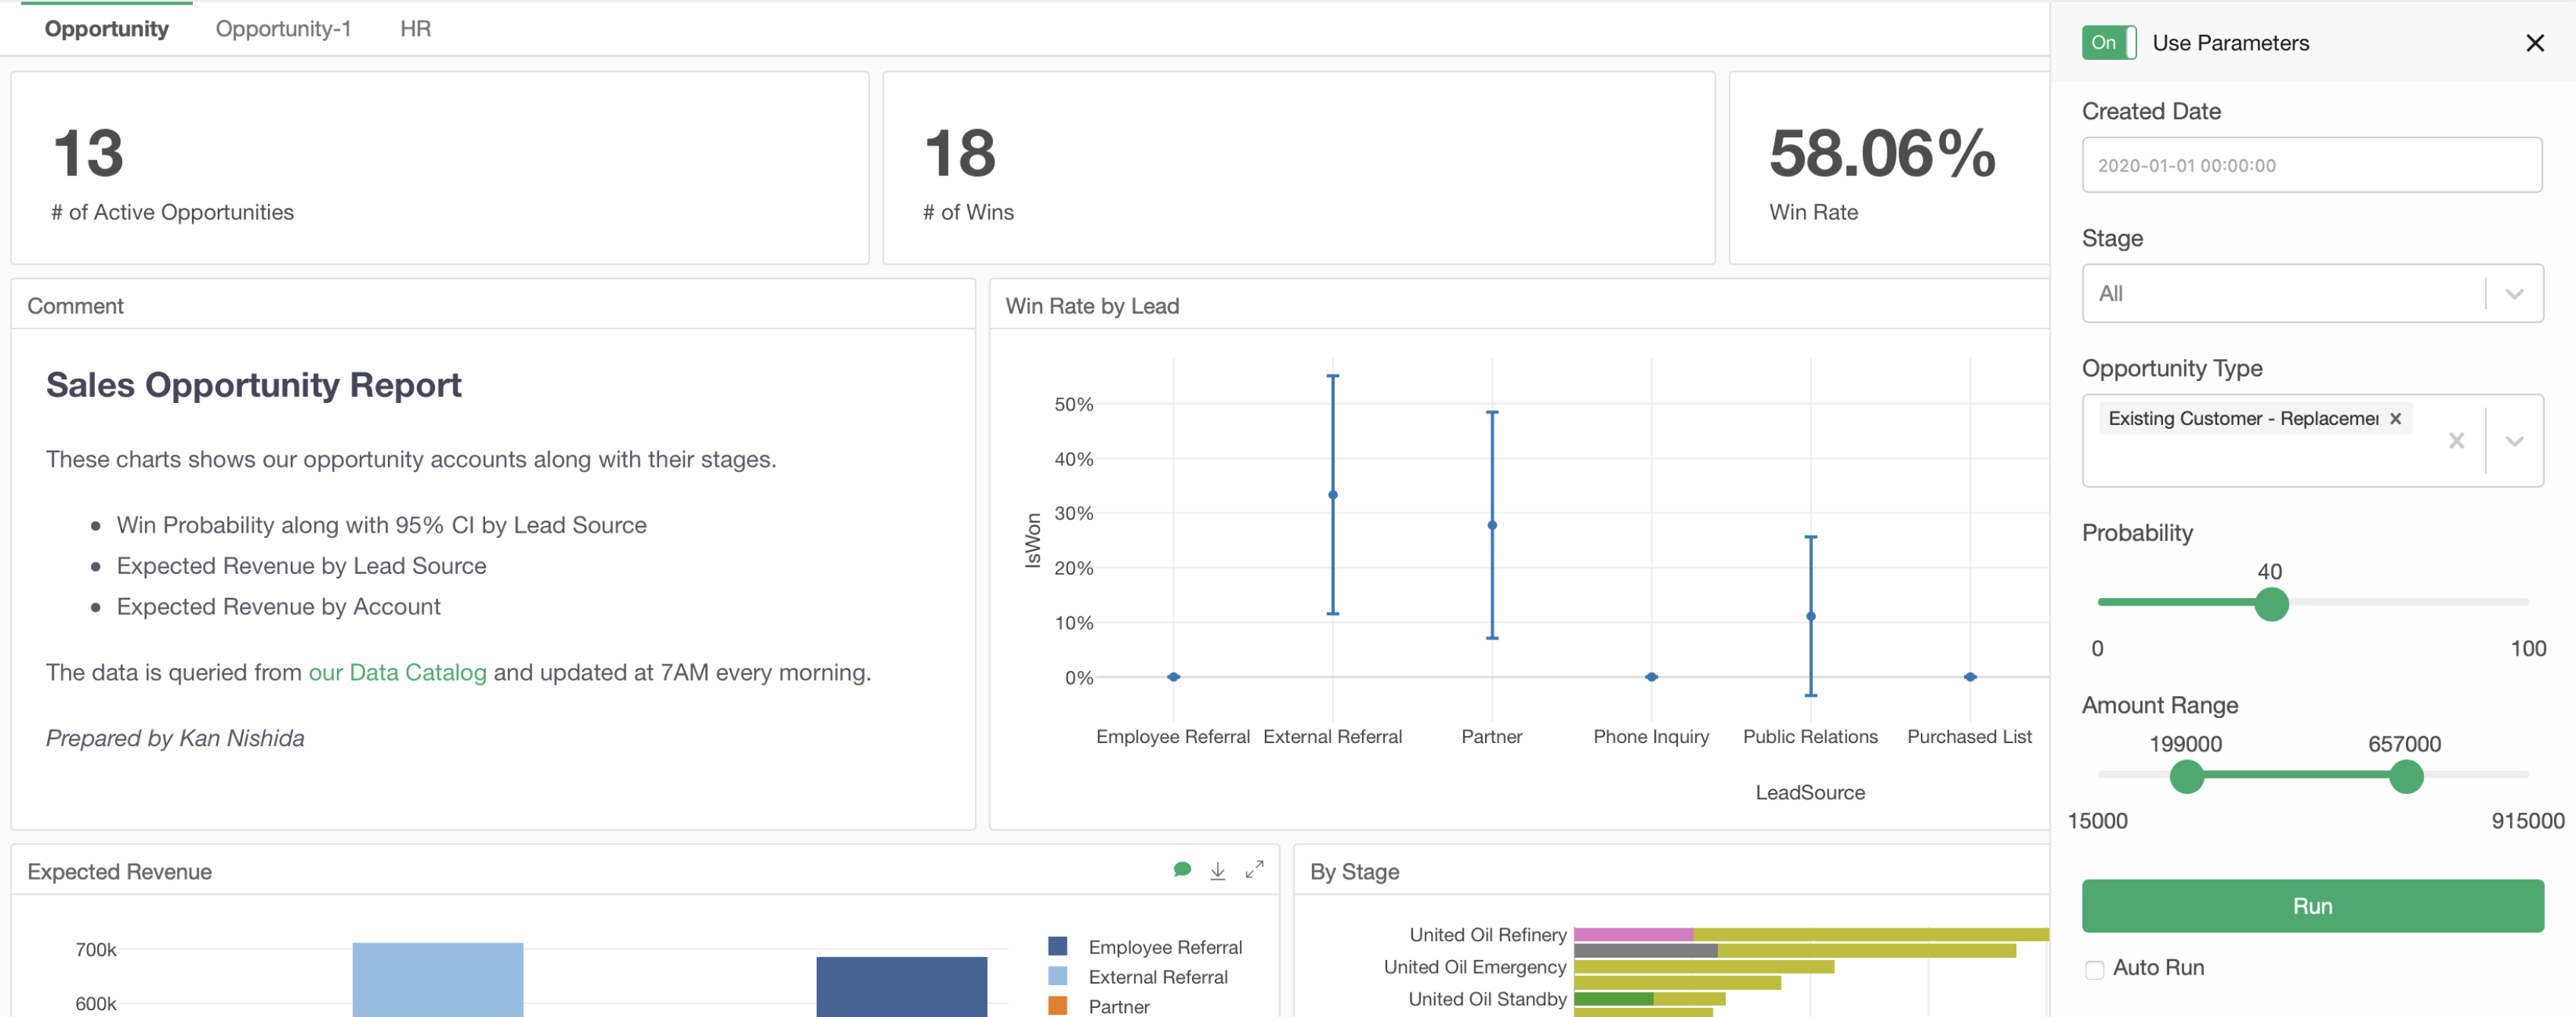
Dashboard
Quickly create your own Dashboards with flexible layouts and interactive charts. Automate for updating the data and generating the latest dashboard outputs at Exploratory Server.
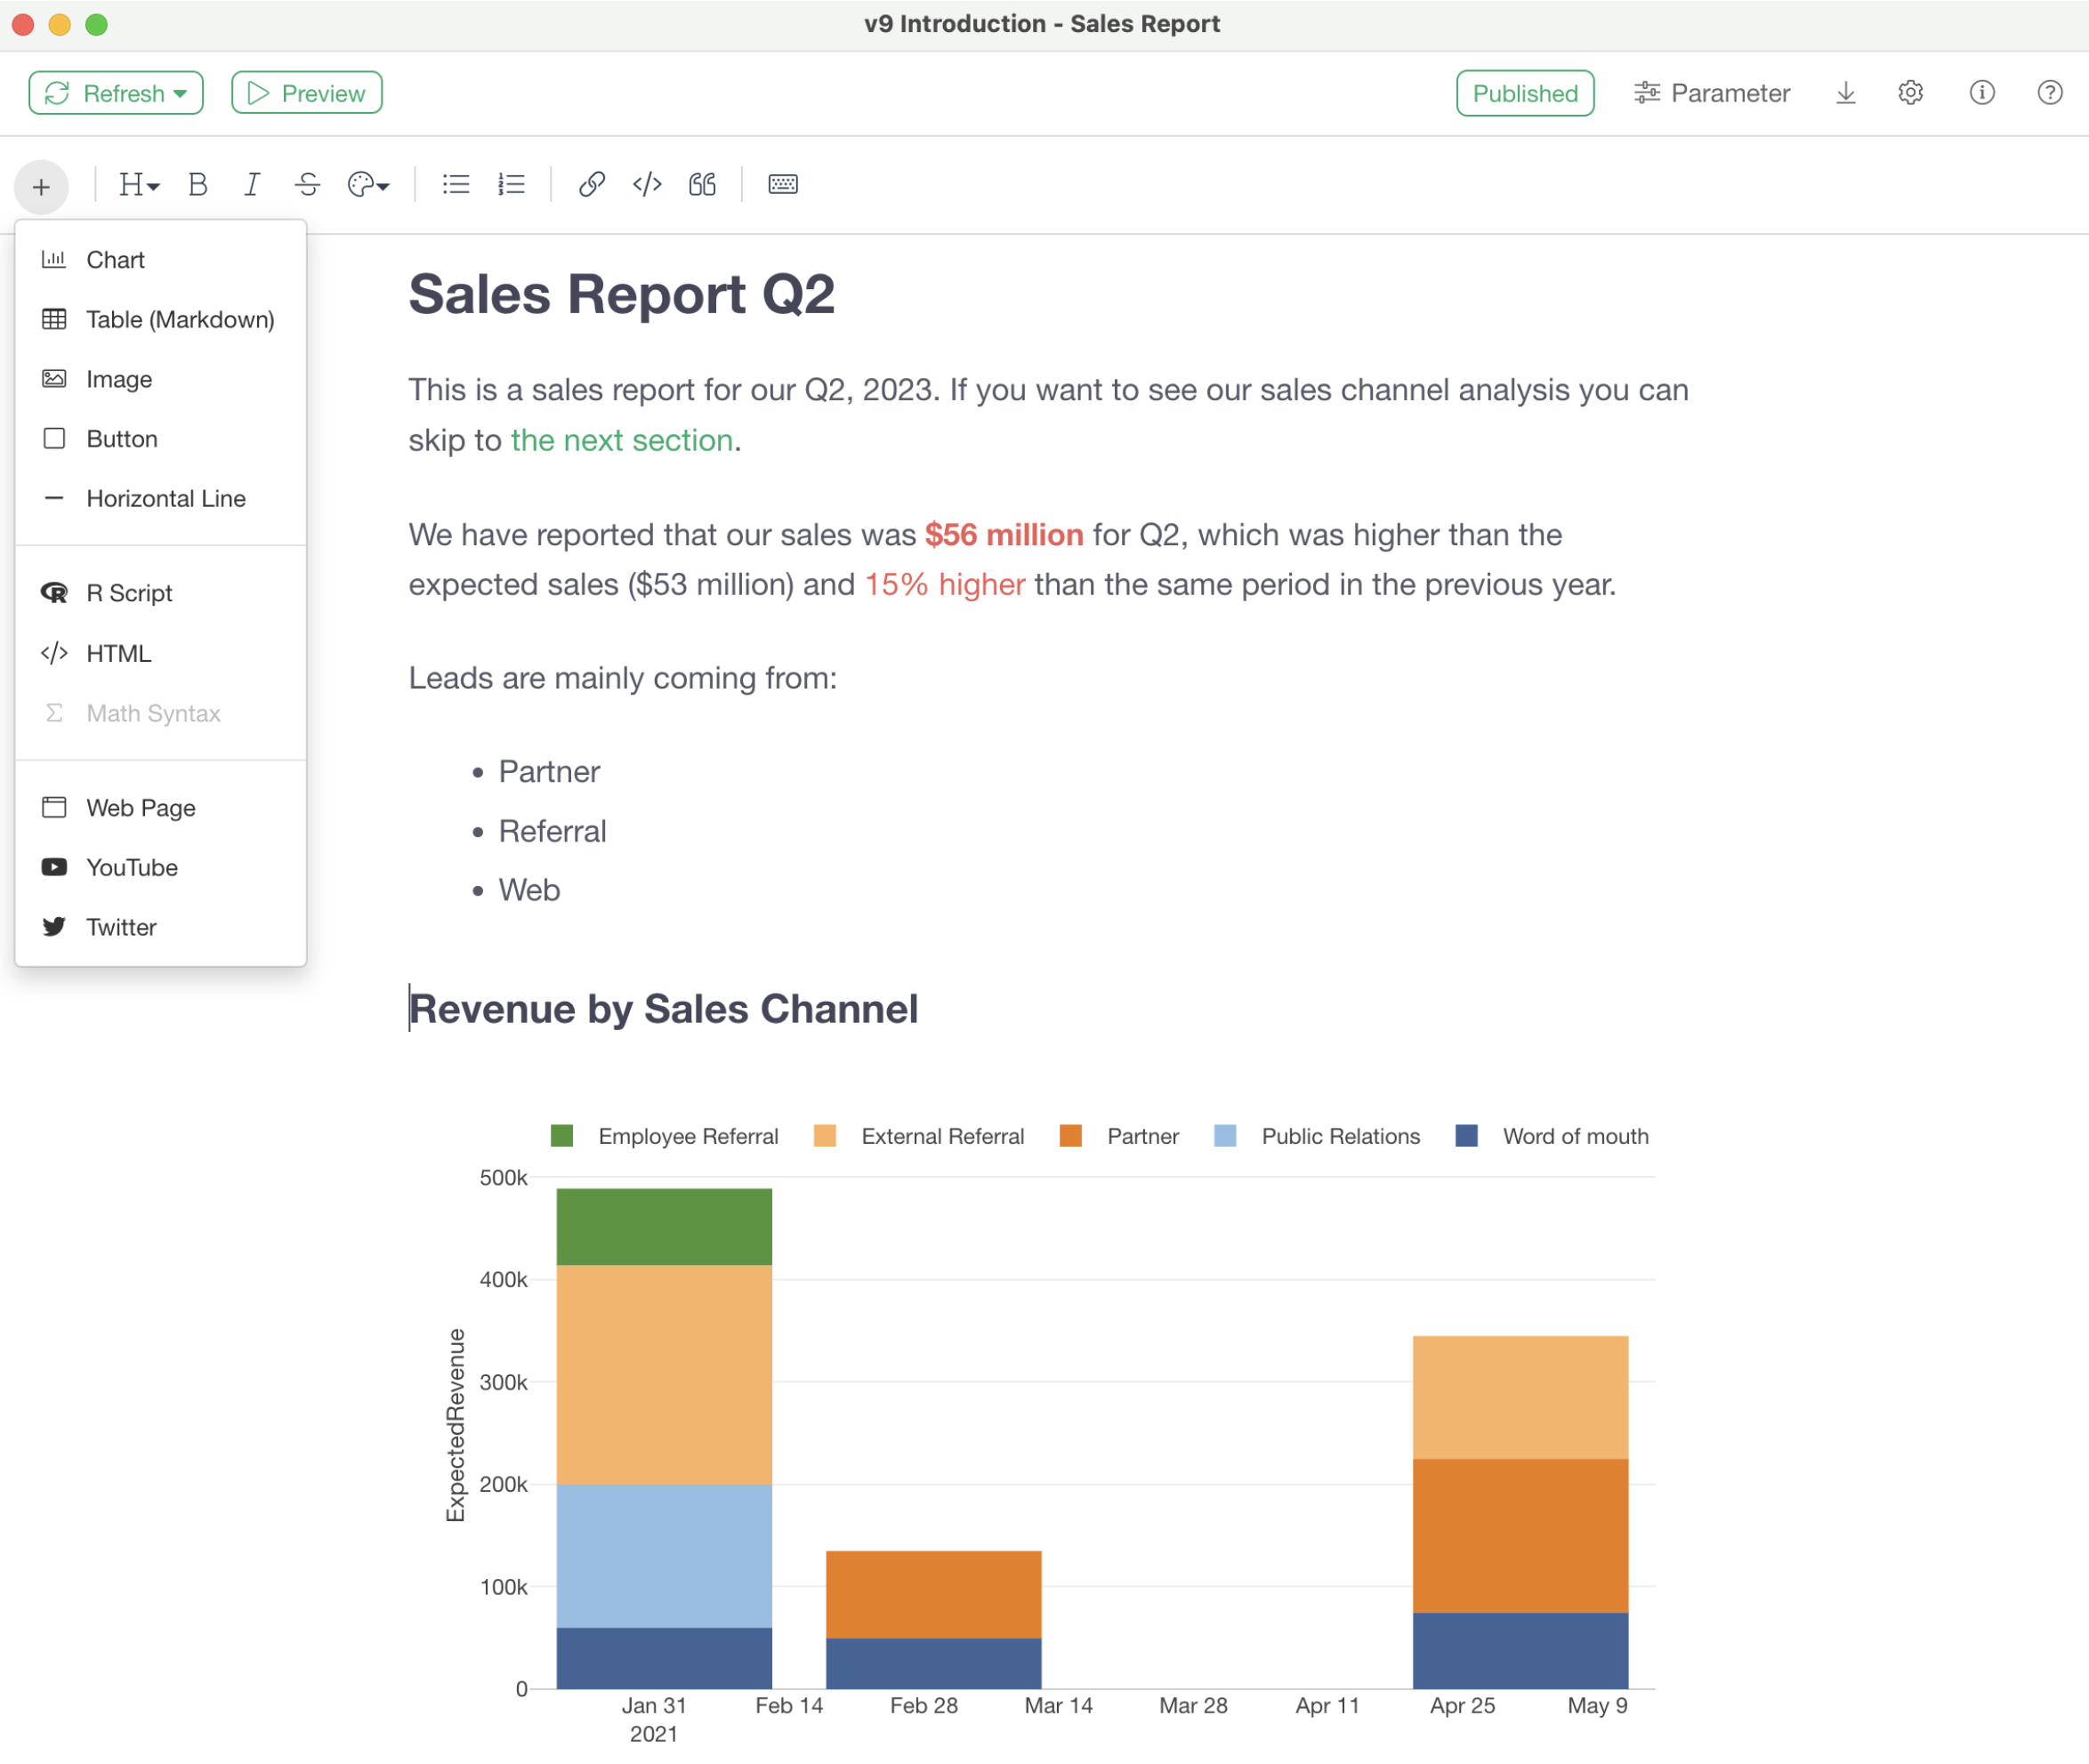
Notes
Exploratory’s Note Editor’s simple and intuitive user experience helps you write your stories about insights you discover from data in an interactive and effective way.
Extend Beyond Exploratory
Exploratory is built on top of R. This means you have access to more than 15,000 data science related open source packages. Extend Exploratory with by brining in your favorite R packages, creating your own custom functions, GeoJSON Map files, data sources, and more.
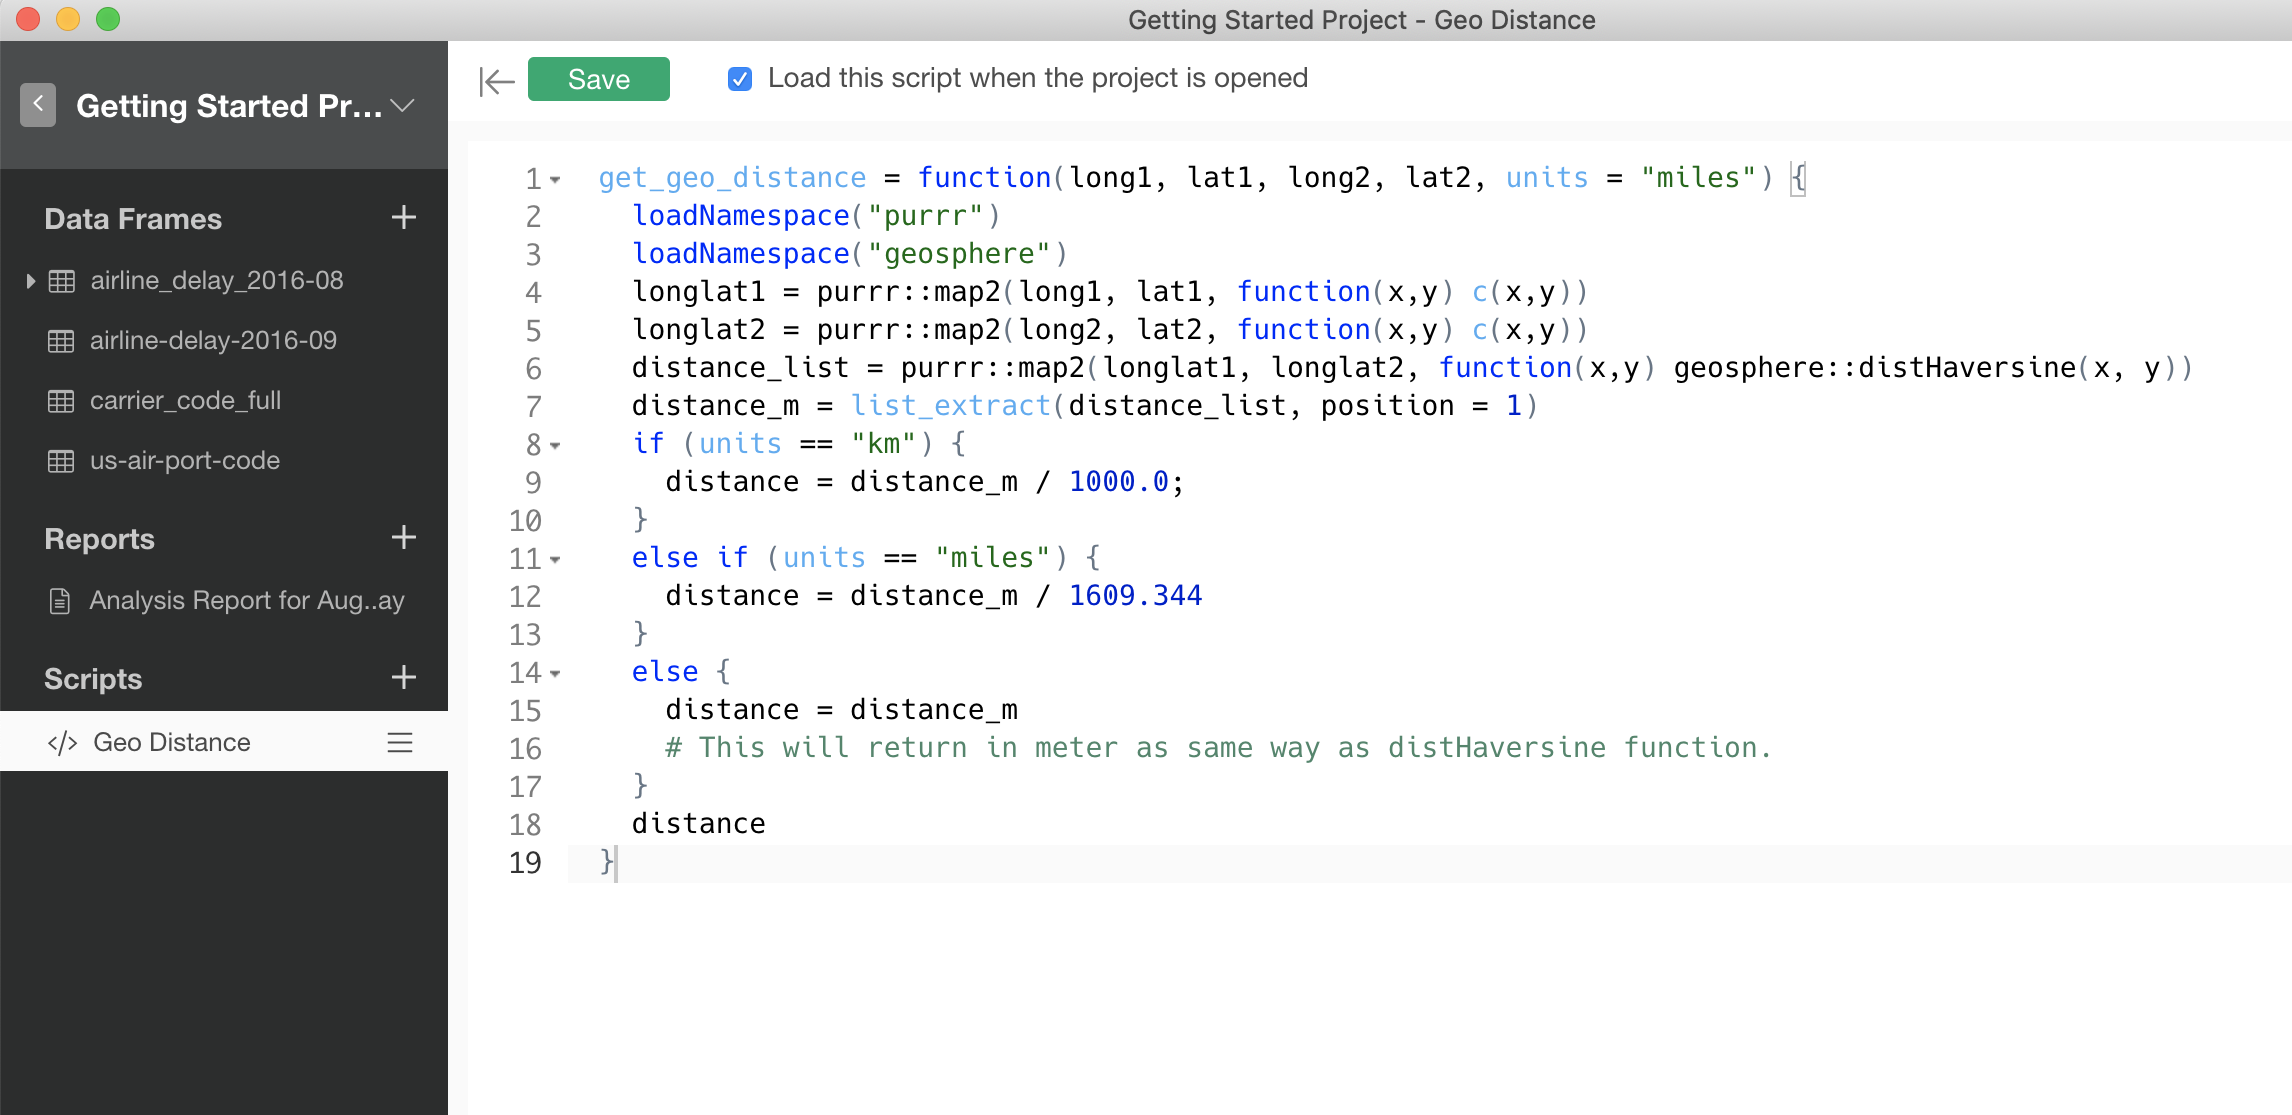
R Script Editor
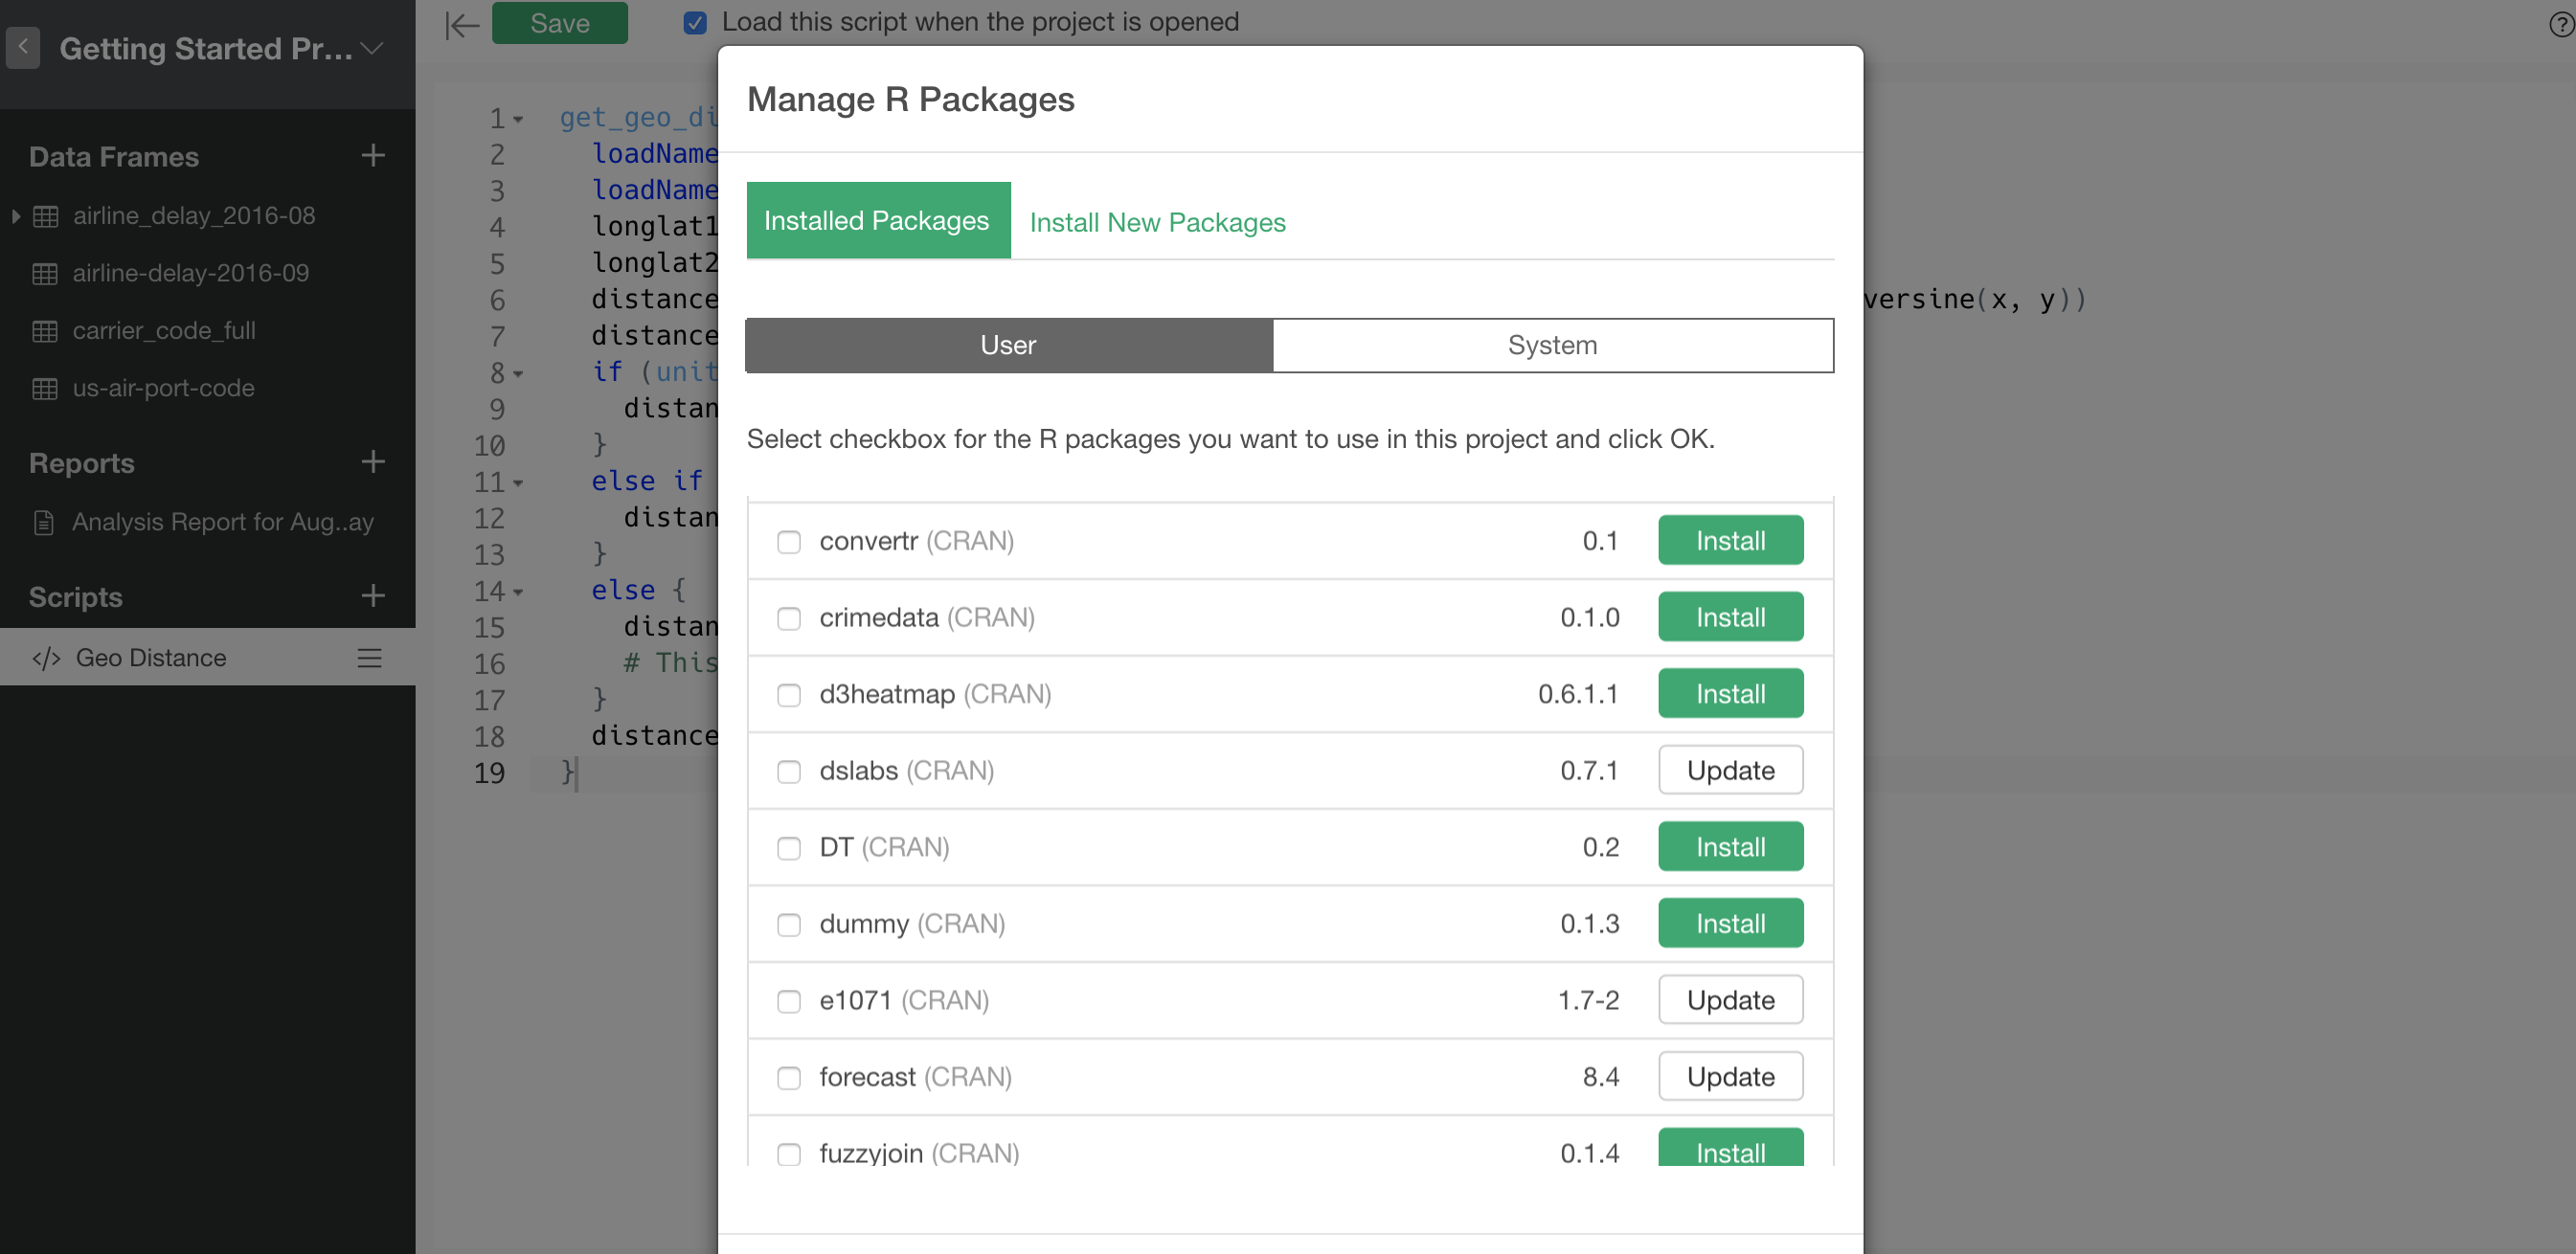
R Package Install
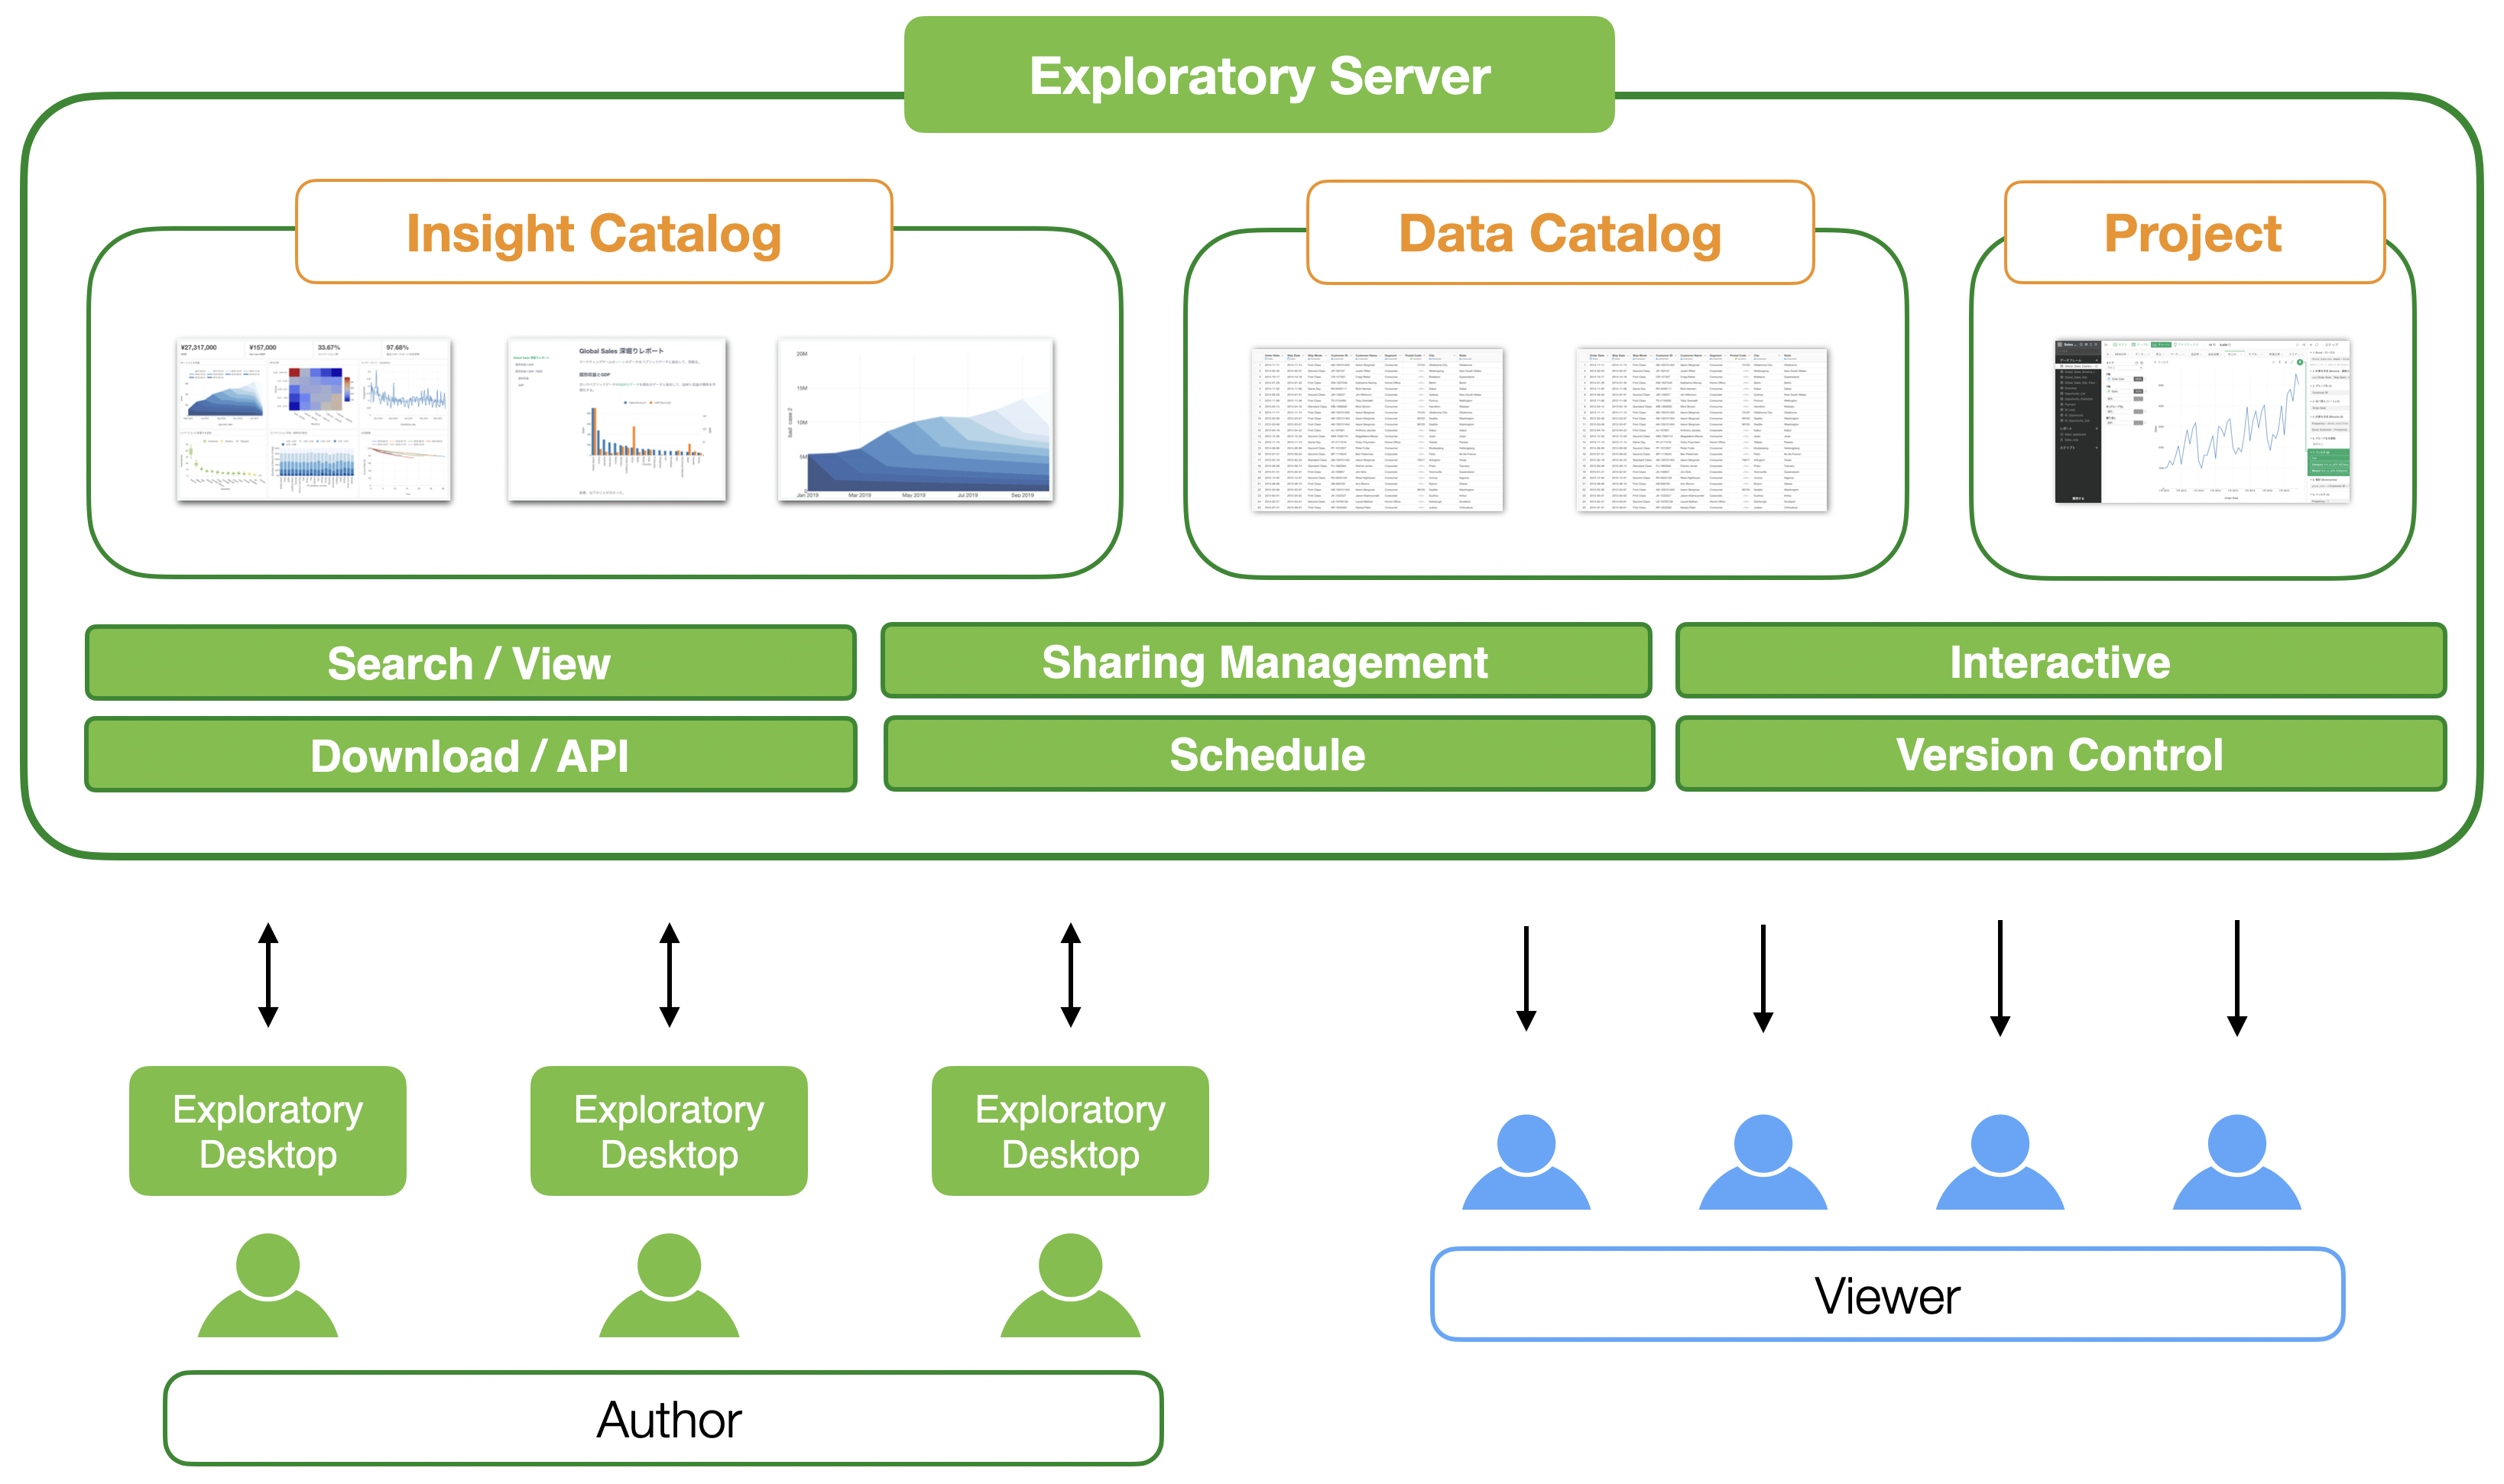
Collaborative Data Science Platform
Any data science projects require multiple people to work together. Exploratory provides the best platform where Exploratory users can work together to discover useful insights from data and communicate with others effectively.
Customer Testimonial
Exploring data is a key part of my duties. Exploratory allows me to quickly walk through different scenarios, add paths, visualize, and revert a few steps when I need to, all in an easy to use interface. It saves me quite a bit of time...
David Meza
Chief Knowledge Officer, NASA
This is an awesome UI experience for Data Scientists.
Marcos M. Campos
Head of AI @BonsaiAI
Exploratory has changed my data analysis workflow. Now I am able to use one tool from data wrangling to modeling, but it is also flexible so that I can use it with other tools if needed by the client.
Sara Vasquez
Data Analyst, Education
I can spend my time thinking about the data and coming up with questions regarding the underlying patterns rather than spending time learning all the details of the R system.
Brian Landes
Consultant at Open Sky Consulting, LLC
You mix the power of R with a beautiful user-friendly interface. I once explored a table with more than 40 million rows in Exploratory!
Dr Anne Jamet
Anne Jamet (MD-PhD), Clinical Microbiology Resident, Hôpital Necker Enfants Malades
日本人エンジニアによる開発ということもあり、日本語対応がびっくりするほどしっかりしており、日本語カラム名など何のそのです。マッピングなども今時ツールらしくしっかりサポートしており、当然ながら予測や回帰などのツールはRの機能そのものを使えるのでおそらく他のツールの追従を許さない豊富さです。特筆すべきは、PowerBIが弱いテキストマイニング系のツールがそろっており、日本語対応も相まって、非常に貴重な存在になっていると思います。
増谷 修 (Osamu Masutani)
Data Scientist at Japan Taxi
