How to access to your Spark from Exploratory with sparklyr (SQL version)
Apache Spark is the most popular in-memory Big Data infrastructure today. In this post, I’ll walk you through how you can connect to Apache Spark from Exploratory using R package called sparklyr and analyse the data in Exploratory.
One of the benefits of using sparklyr is that you can execute SQL queries against Spark from R. For example, if you have US domestic flights delay data in your Spark, you can fetch data by writing a SQL query like below.
flights <- tbl(sc, "flights") %>%
  group_by(CARRIER, ORIGIN_STATE_ABR) %>%
  summarize(DEP_DELAY_AVG = mean(DEP_DELAY)) %>%
  top_n(10, DEP_DELAY_AVG) %>%
  collect()
If you’re familiar with Spark, you might know that you can access to Spark with Scala or Python. But accessing spark with SQL is much easier than writing code with Scala or Python and I’m pretty sure many SQL users can benefit from it. By saying it, let me introduce a way to access your Spark from Exploratory with sparklyr by submitting a SQL query and retrieving result in a smart way.
Before you start
First of all, you need to install the sparklyr and If you haven’t installed Java on your machine yet, you can download it from here so please make sure to install it.
Install sparklyr package
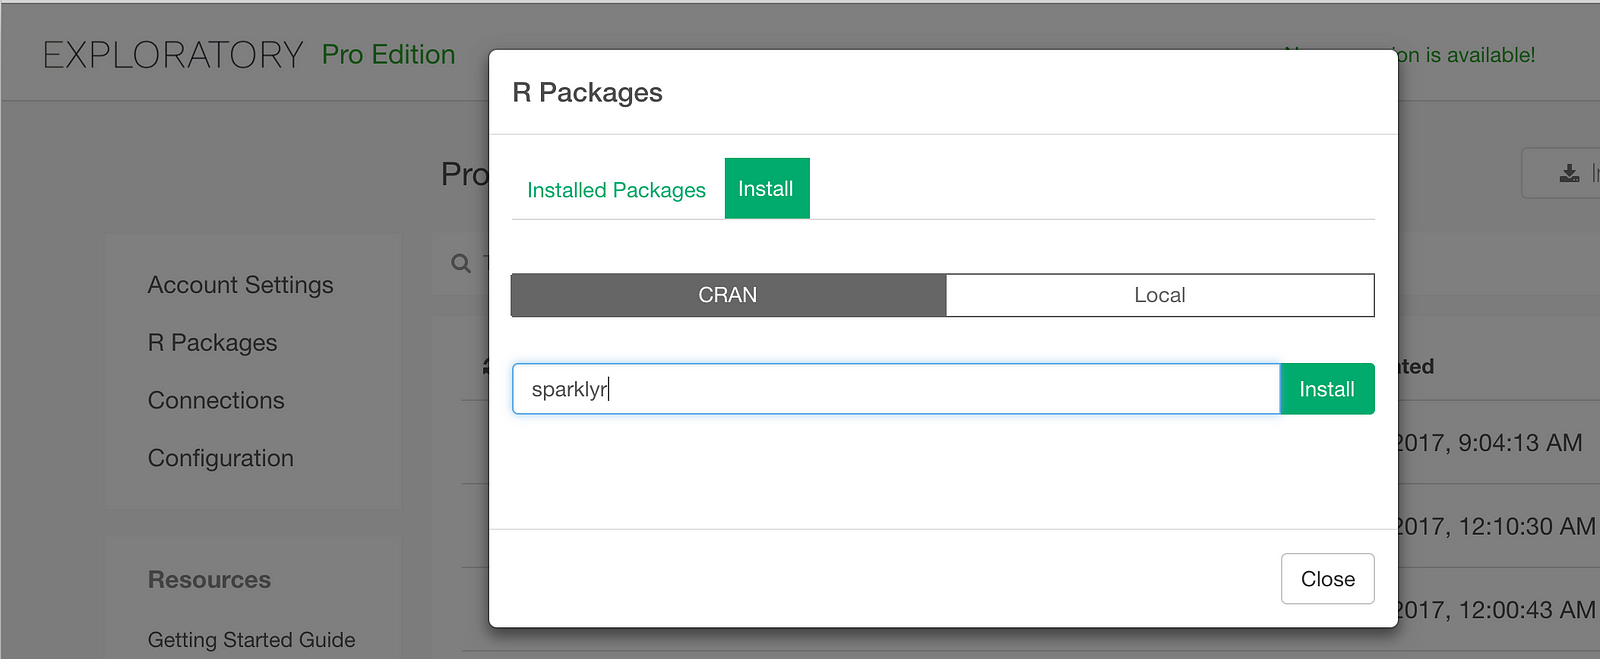
To access your Spark from Exploratory, you need to install the sparklyr, which allows us to directly access Spark from R. You can install the R package in Exploratory from CRAN as follows.
Fetch data from Spark with SQL query
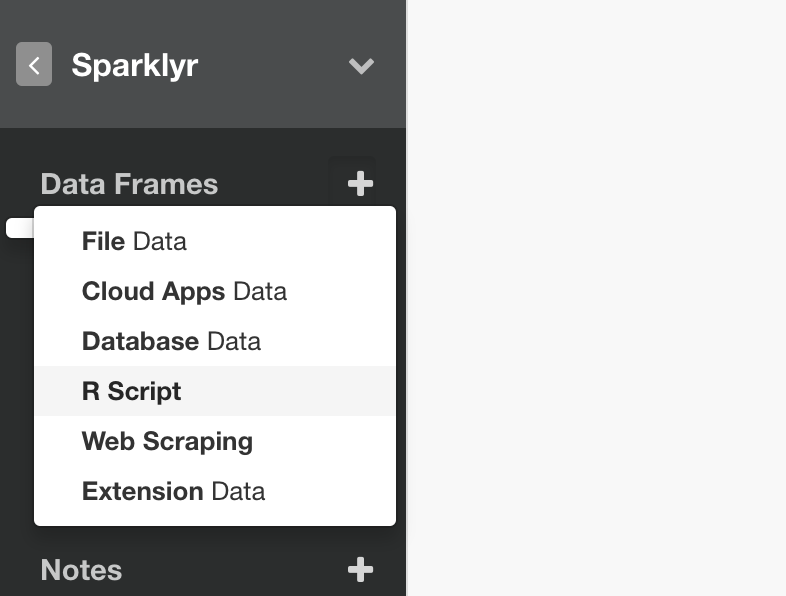
The next step is to write R script to query data from Spark in Exploratory as follows and access to your Spark from the script with sparklyr
In the R Script, you can connect to your Spark as follows. (This example shows a way to access to your Spark deployed on your local machine)
# Access to Spark (local machine)
# Setup environment variable
Sys.setenv(SPARK_HOME = "/Users/hidekoji/spark/spark-2.2.0-bin-hadoop2.7")
# load sparklyr
library(sparklyr)
# Connect to Spark
sc <- spark_connect(master = "spark://Hidetakas-MacBook-Pro.local:7077")
Okay, now let’s assume you already loaded flight Spark Data Frame on your Spark and want to calculate average departure delay per origin state from the flights. To do this, you can submit a query with dbGetQuery function from DBI package and the query looks like this.
# load DBI package
library(DBI)
flights <- dbGetQuery(sc, 'SELECT ORIGIN_STATE_ABR, AVG(DEP_DELAY) AS DEP_DELAY_AVG
FROM flights
GROUP BY ORIGIN_STATE_ABR')
flights %>% collect()
collect() is a function to submit the query. This will return the result as a data frame. At the end of this post, I summarized these two steps in a single script so that you can copy and paste it to test on your Exploratory. Make sure you update the values for SPARK_HOME environment variable and the Spark access information inside ‘spark_connect’ function to fit your machine environment.
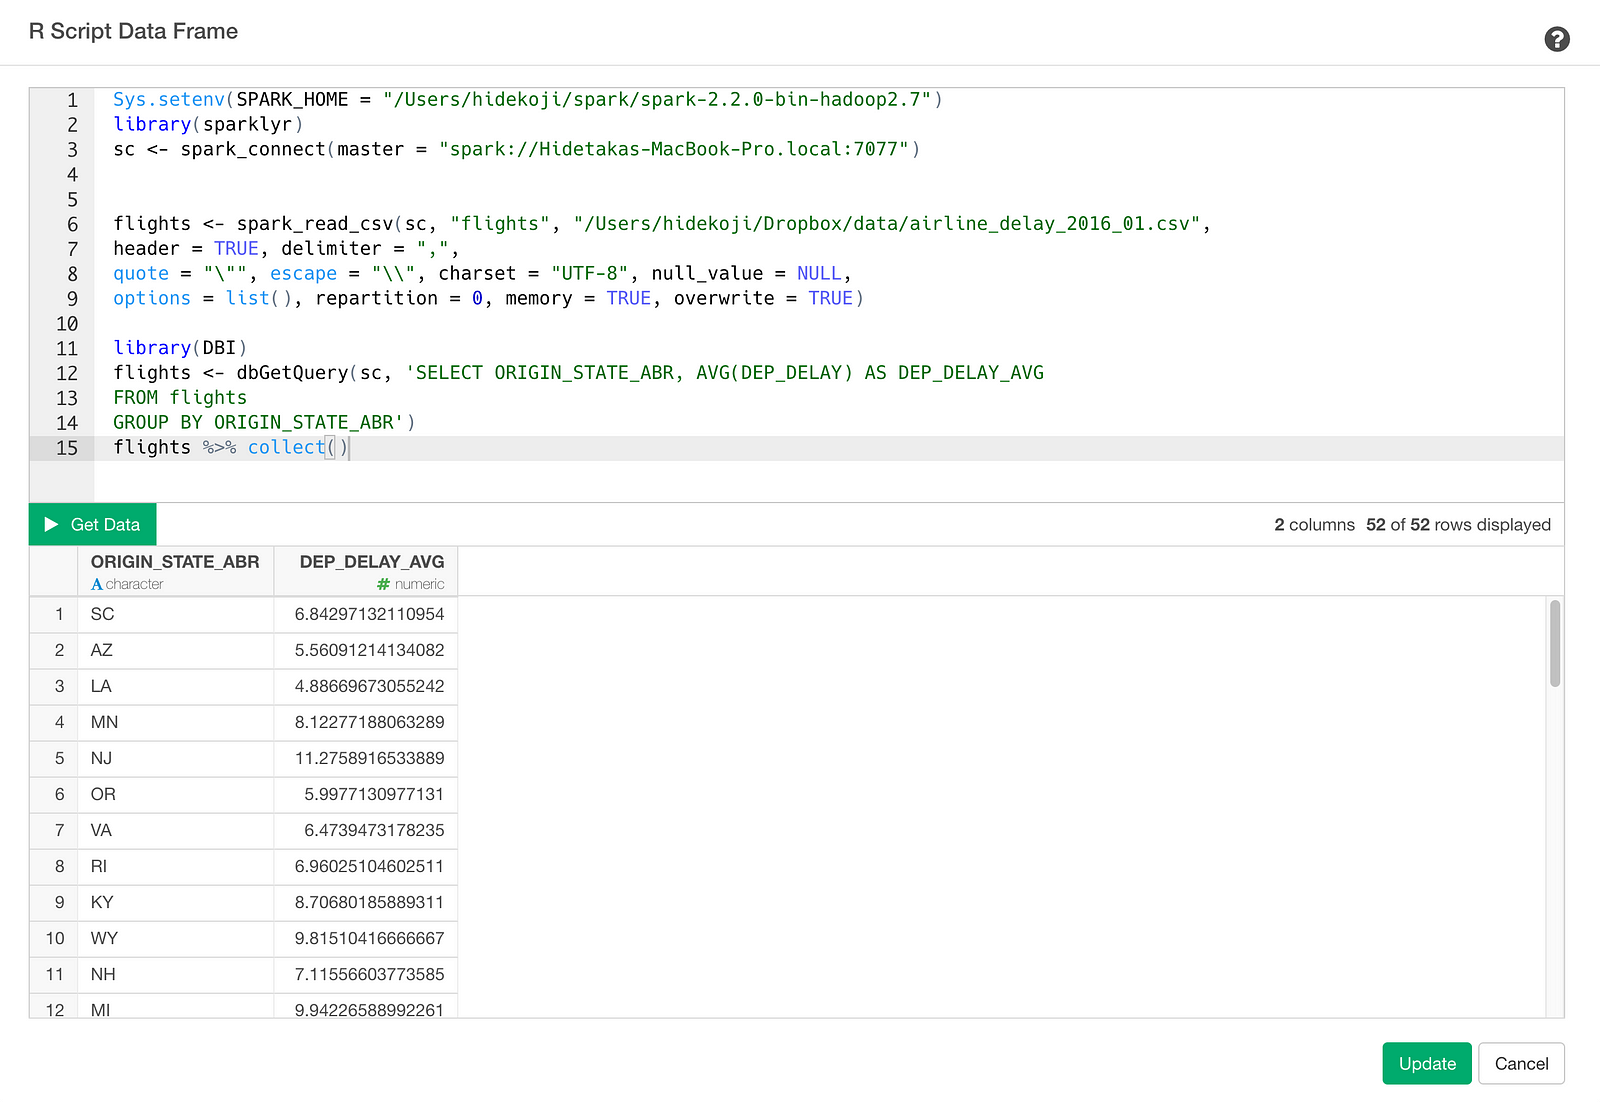
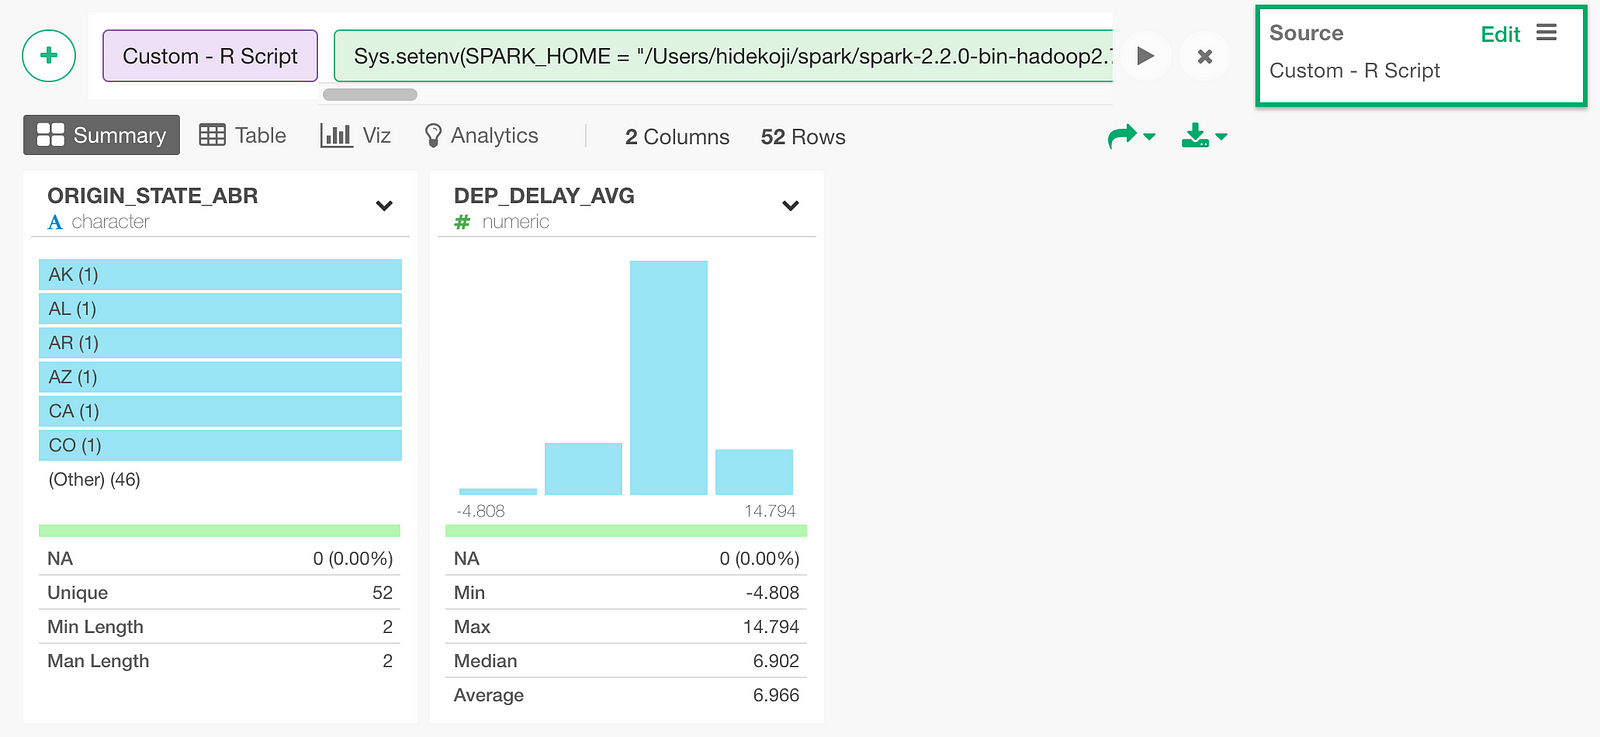
Click Get Data button to see the result and click Save button to import the data as a data frame. Once you saved it, you can see the result in Summary View as follows.
You can visualize the query result, which is average departure delay per state, on a US map as follows.
Summary
With sparklyr in Exploratory, you can quickly write SQL queries to retrieve data from your Spark instances. Once the data is imported, you can quickly visualize it and analyze it with advanced algorithms just like any other data sources.
If you don’t have Exploratory Desktop yet, you can sign up from here for a free trial. If you are currently a student or teacher, then it’s free!