Analyze Google BigQuery data with Exploratory
Google BigQuery, which can query petabytes of data faster with SQL, is an analytics data warehouse used at many companies, including enterprises, startups, etc. and is building a solid position. Today, let’s take a look at how to use Exploratory Desktop to access Google BigQuery, get data and start analyzing easily.
Before we start
If you are not using Google BigQuery so far, you must first create a project on Google Cloud Platform and create a dataset with Google BigQuery.
You must enter billing credit card information in your Google Account in advance.
Create a Google BigQuery Project
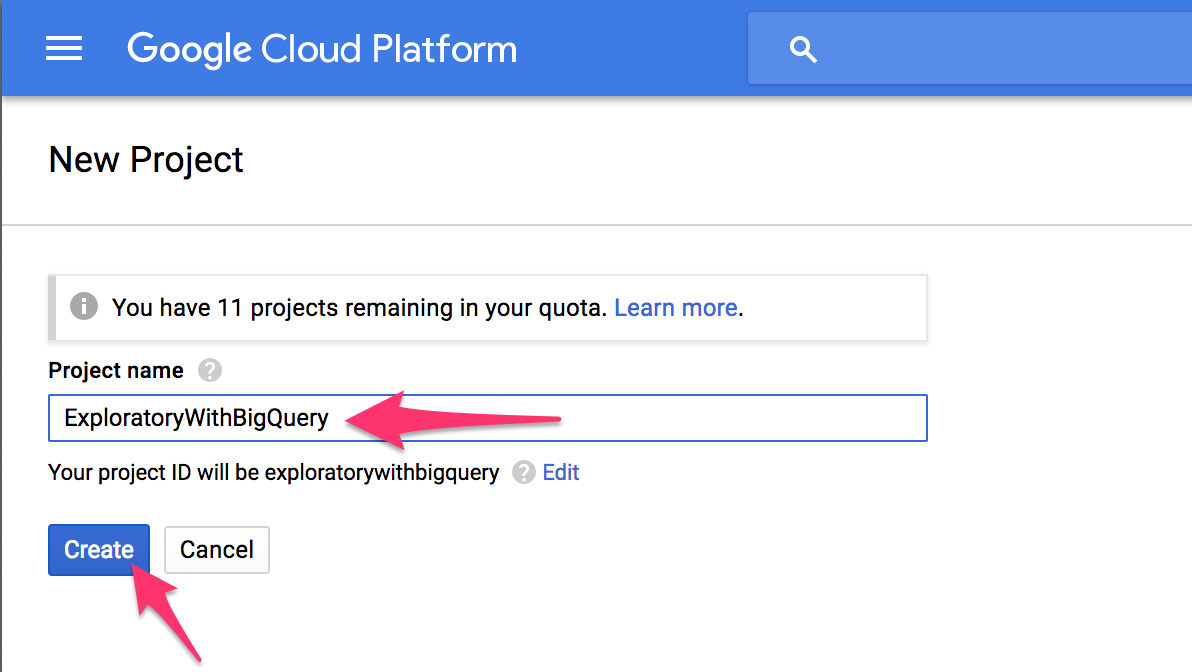
Access Google Cloud Platform Console and create a new project.
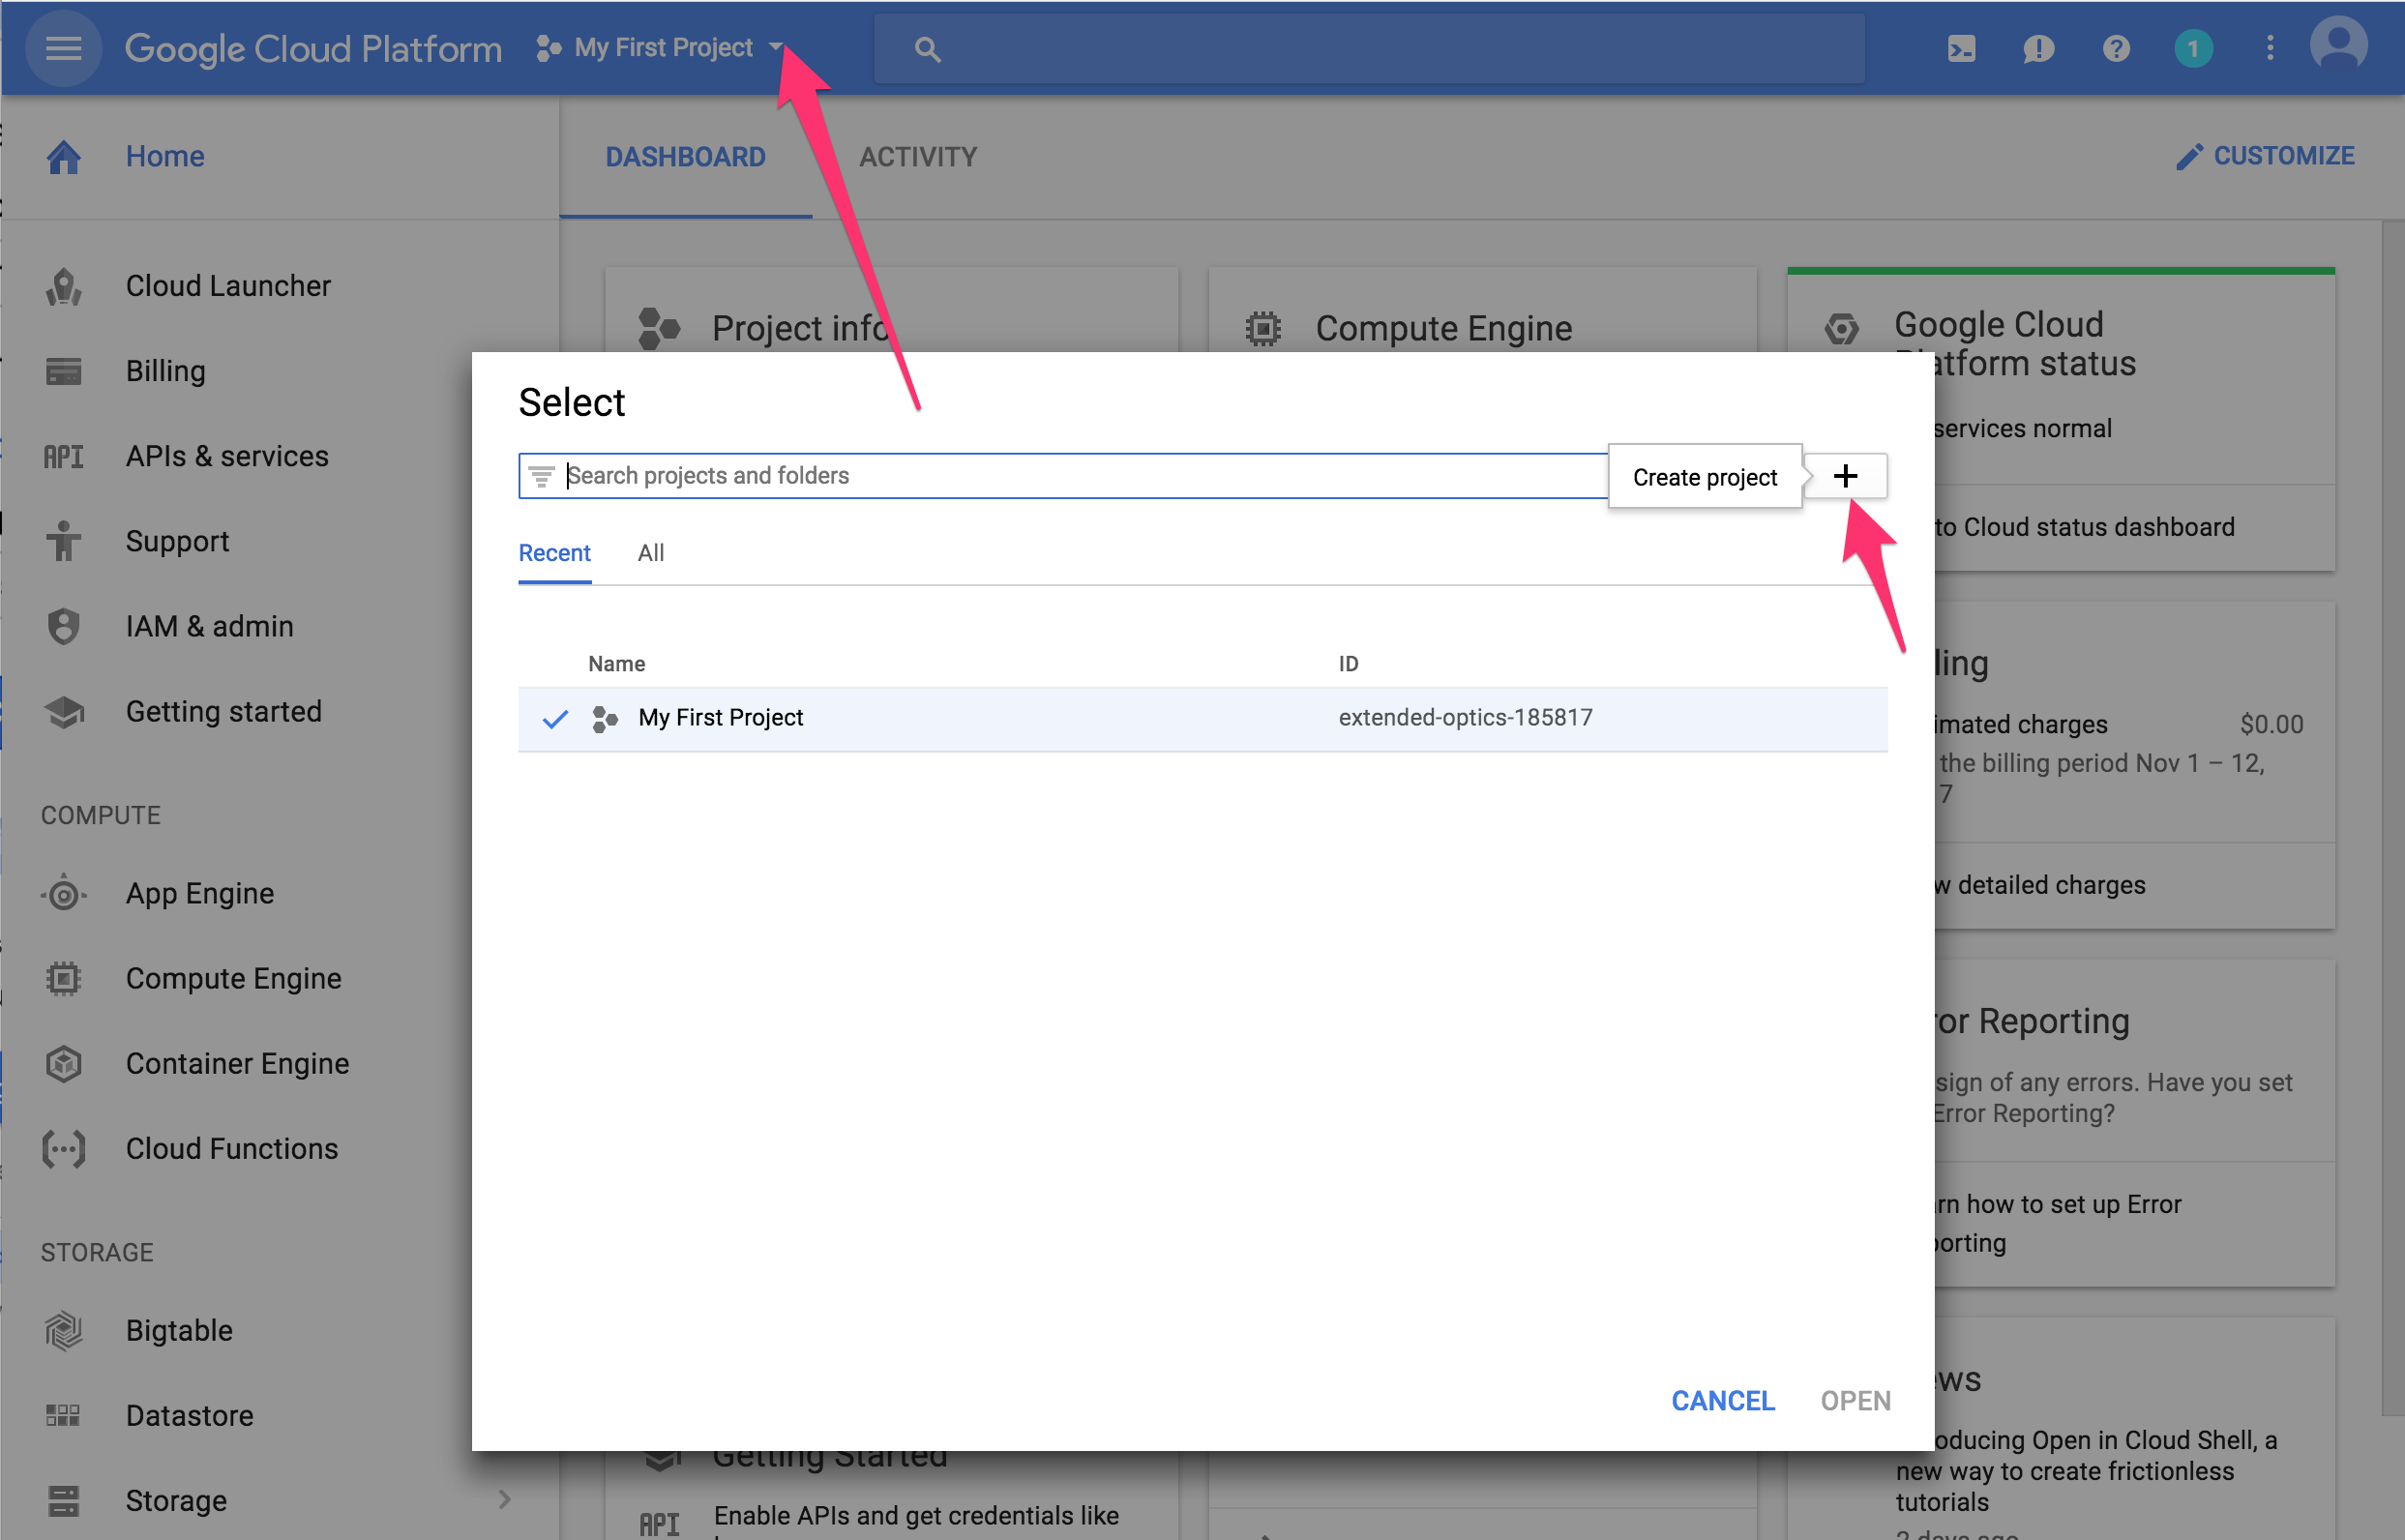
Enter project name and click create button
Create a Google BigQuery dataset
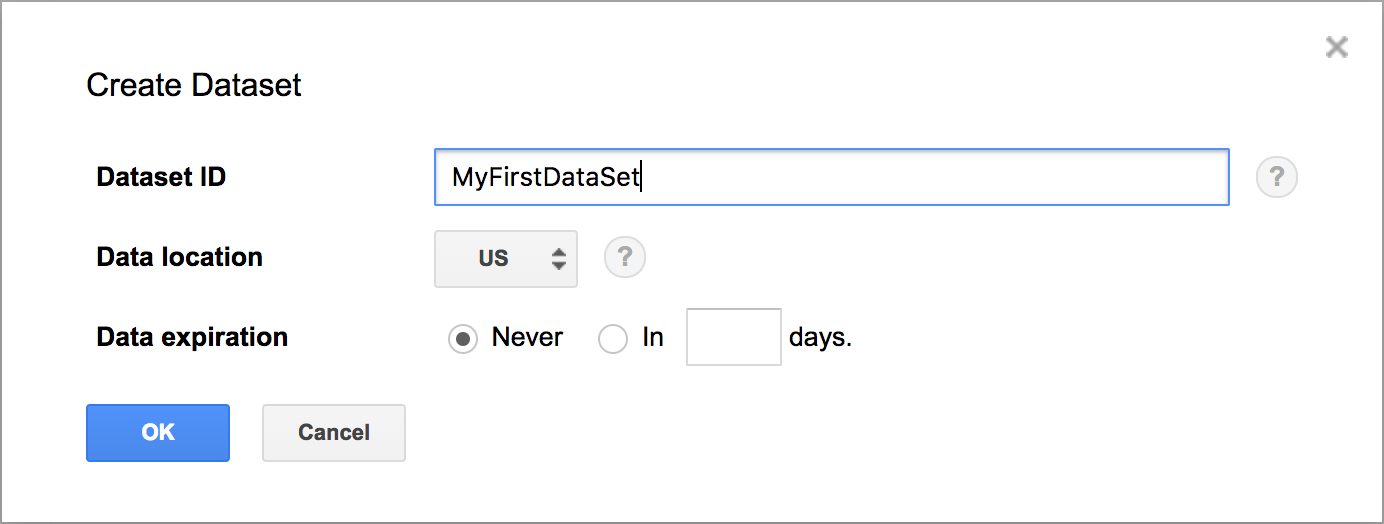
Next, access Google BigQuery Web UI and create a dataset

Enter dataset name and click OK
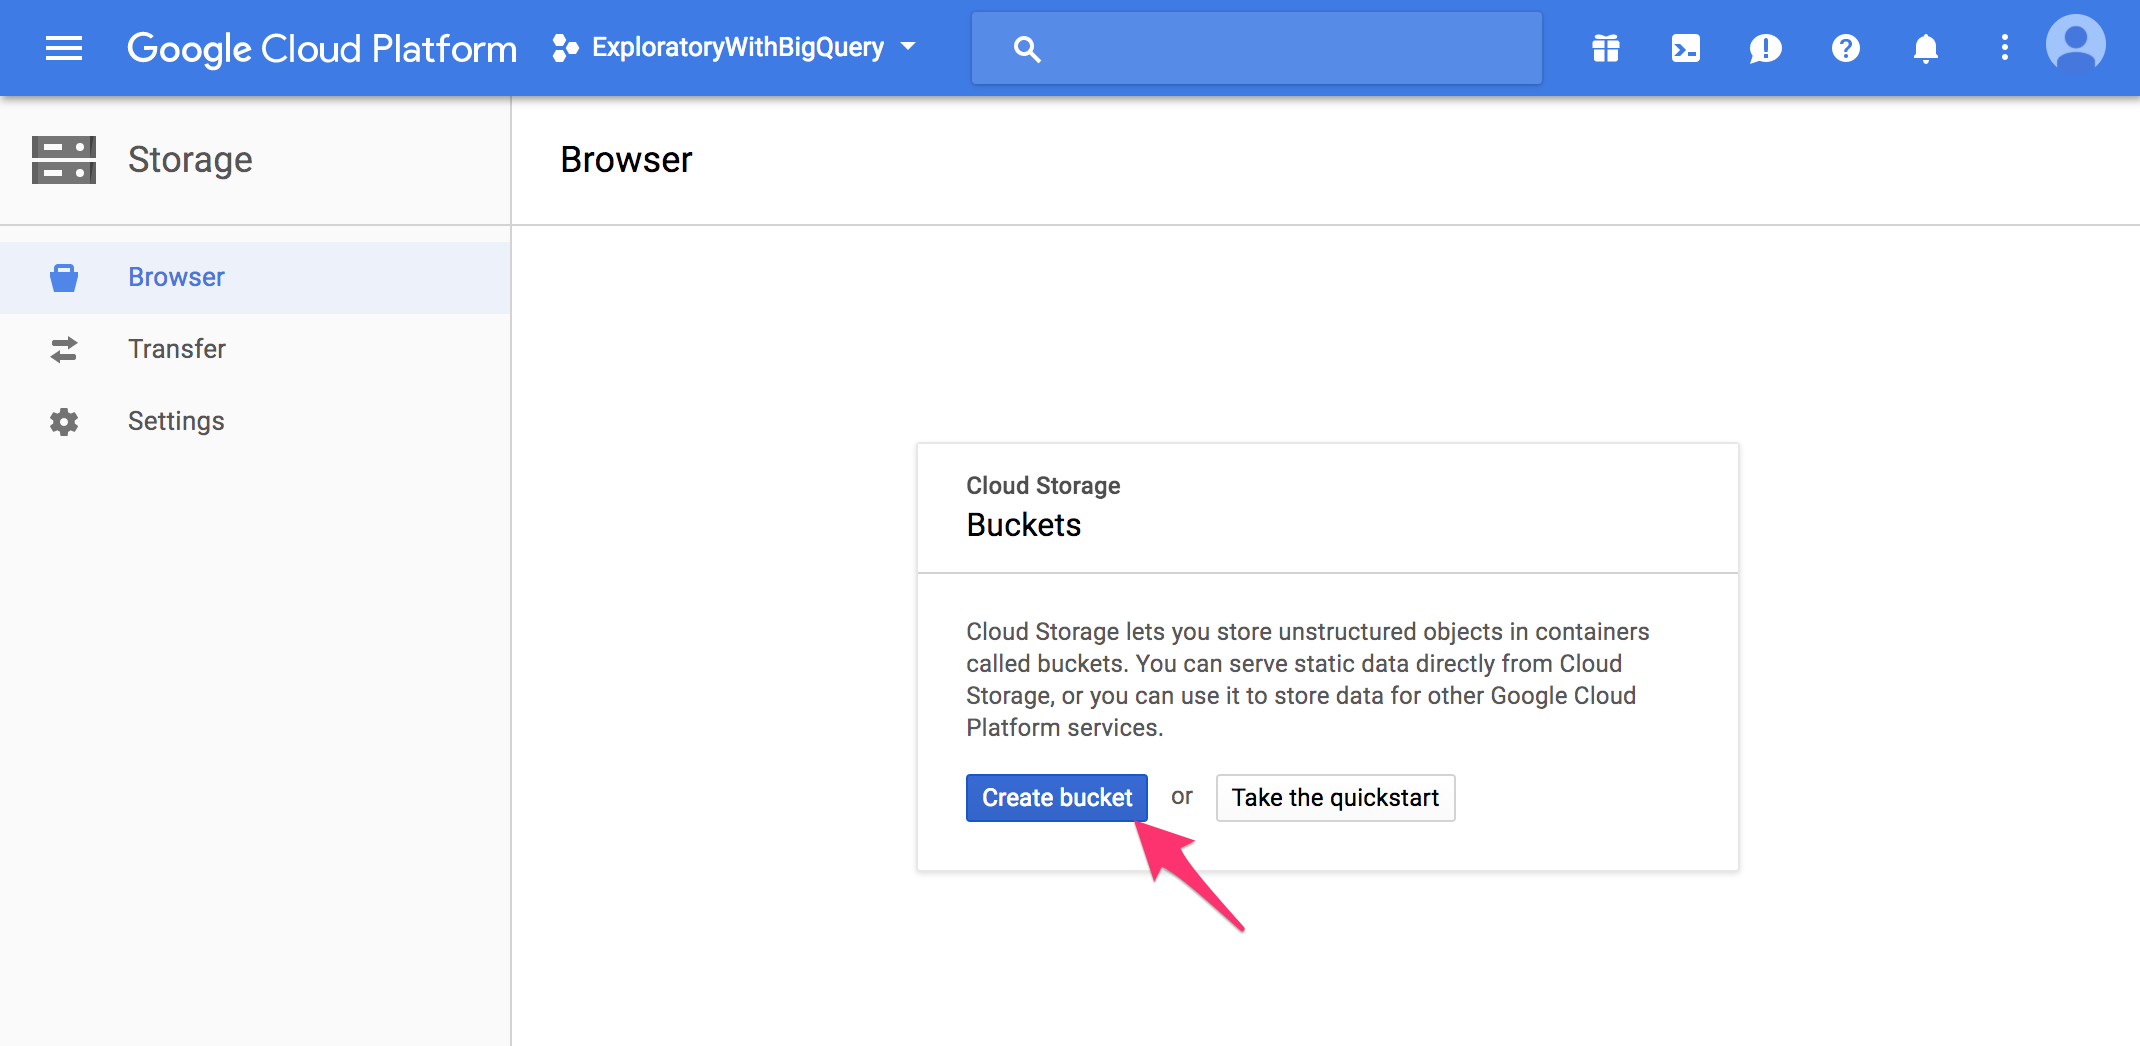
Create a Google Cloud Storage Bucket (Optional)
You can speed up the data import via Google Colud Storage when the results of your query run on Google BigQuery are relatively large. To use this option, create a bucket in Google Cloud Storage in advance.
Go to Google Cloud Storage Browser and click Create Bucket button.
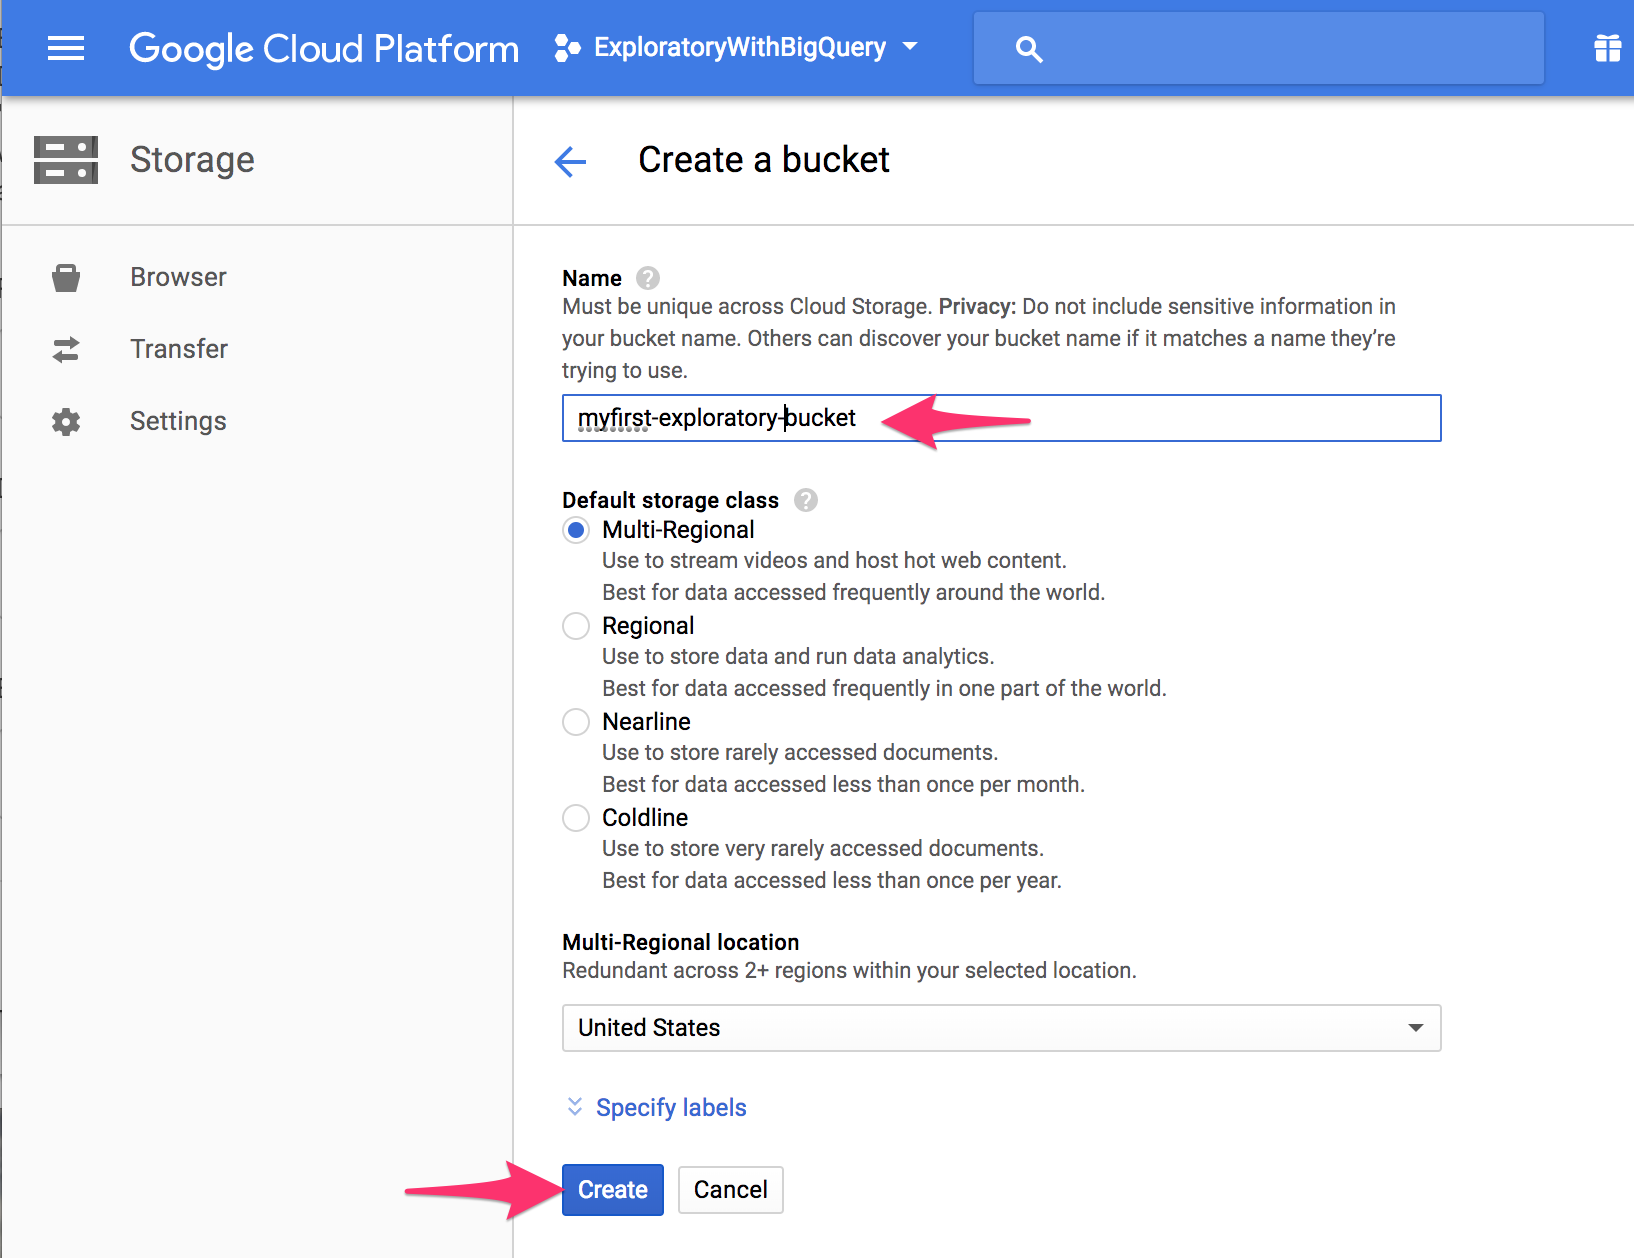
Enter Bucket name and click Create button.
Setup GoogleBigQuery in Exploratory
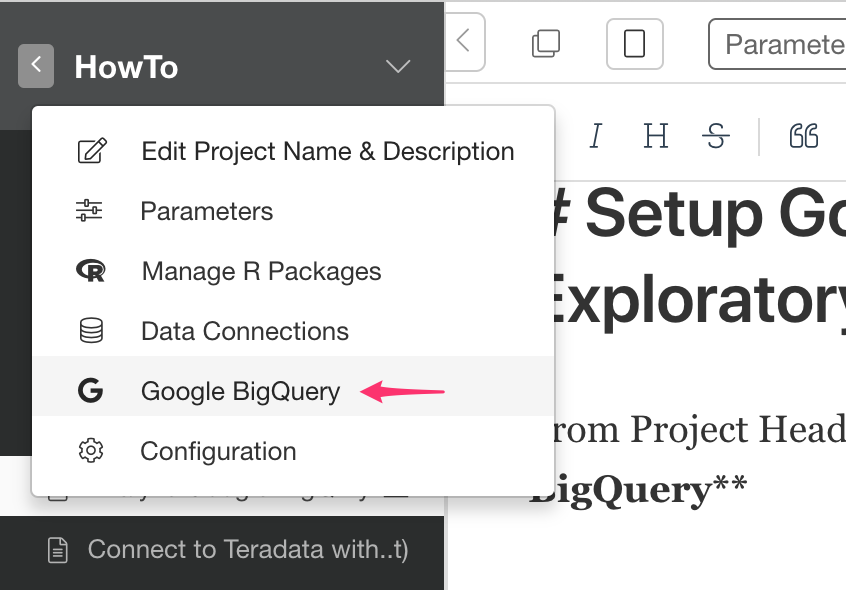
From Project Header Menu, select Google BigQuery
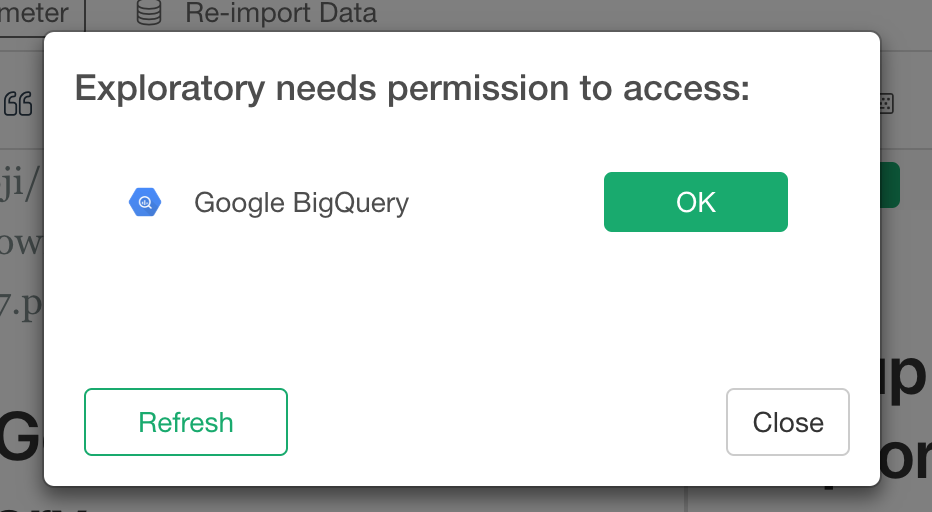
And if this is your first time to access GogleBigQuery from Exploratory Desktop, you’ll get a popup like this so click OK button.
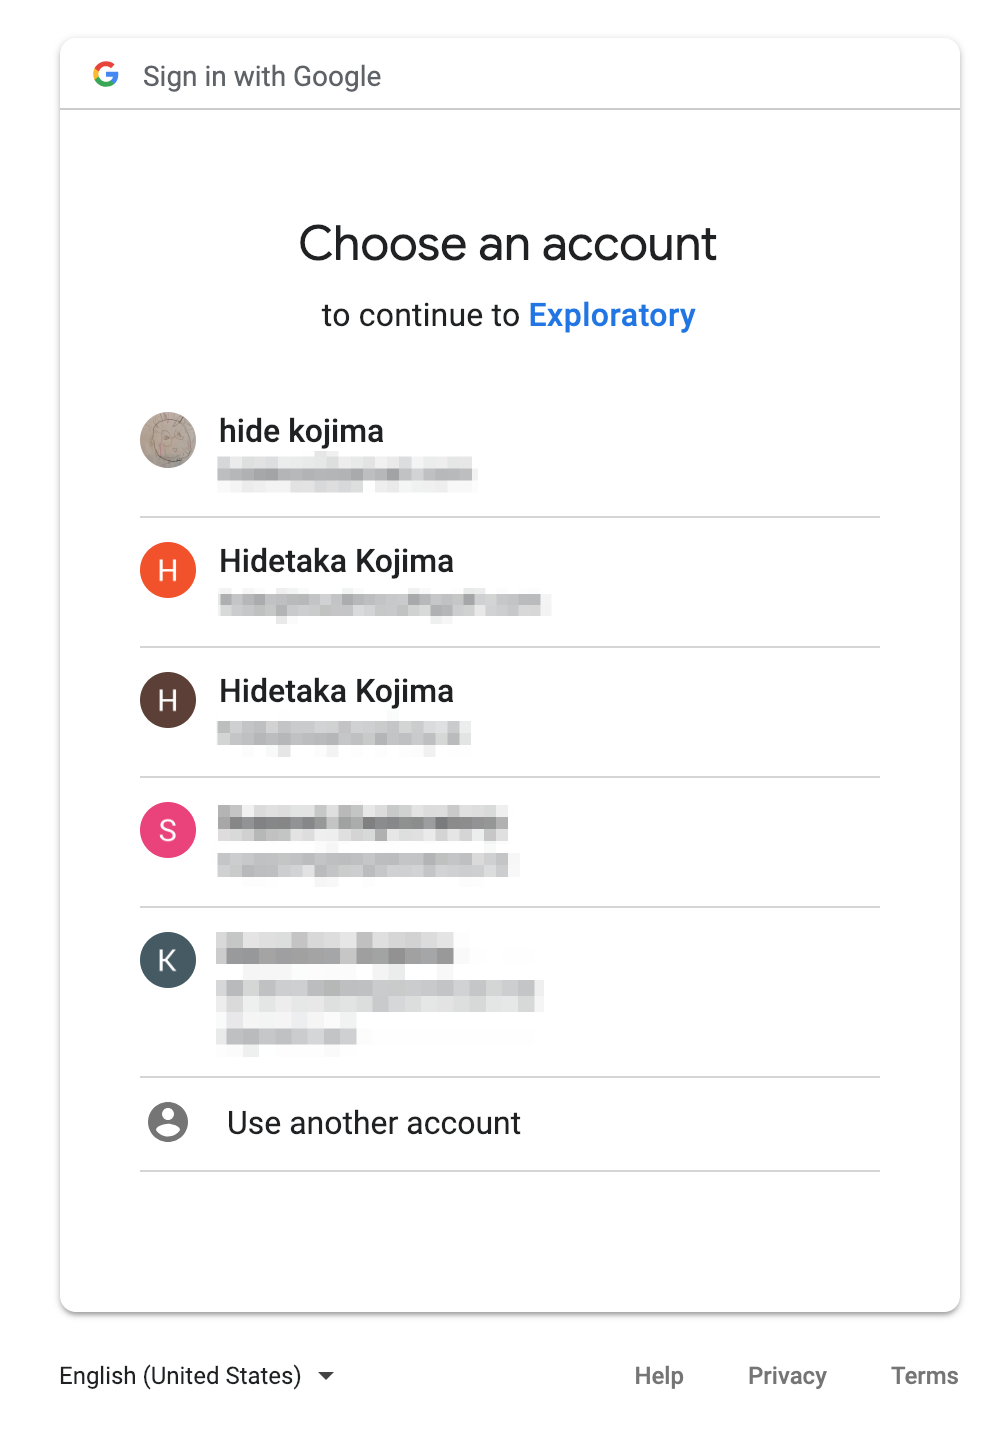
Then, a browser opens and from there you can select your Google account that you want to use for the GoogleBigQuery integration.
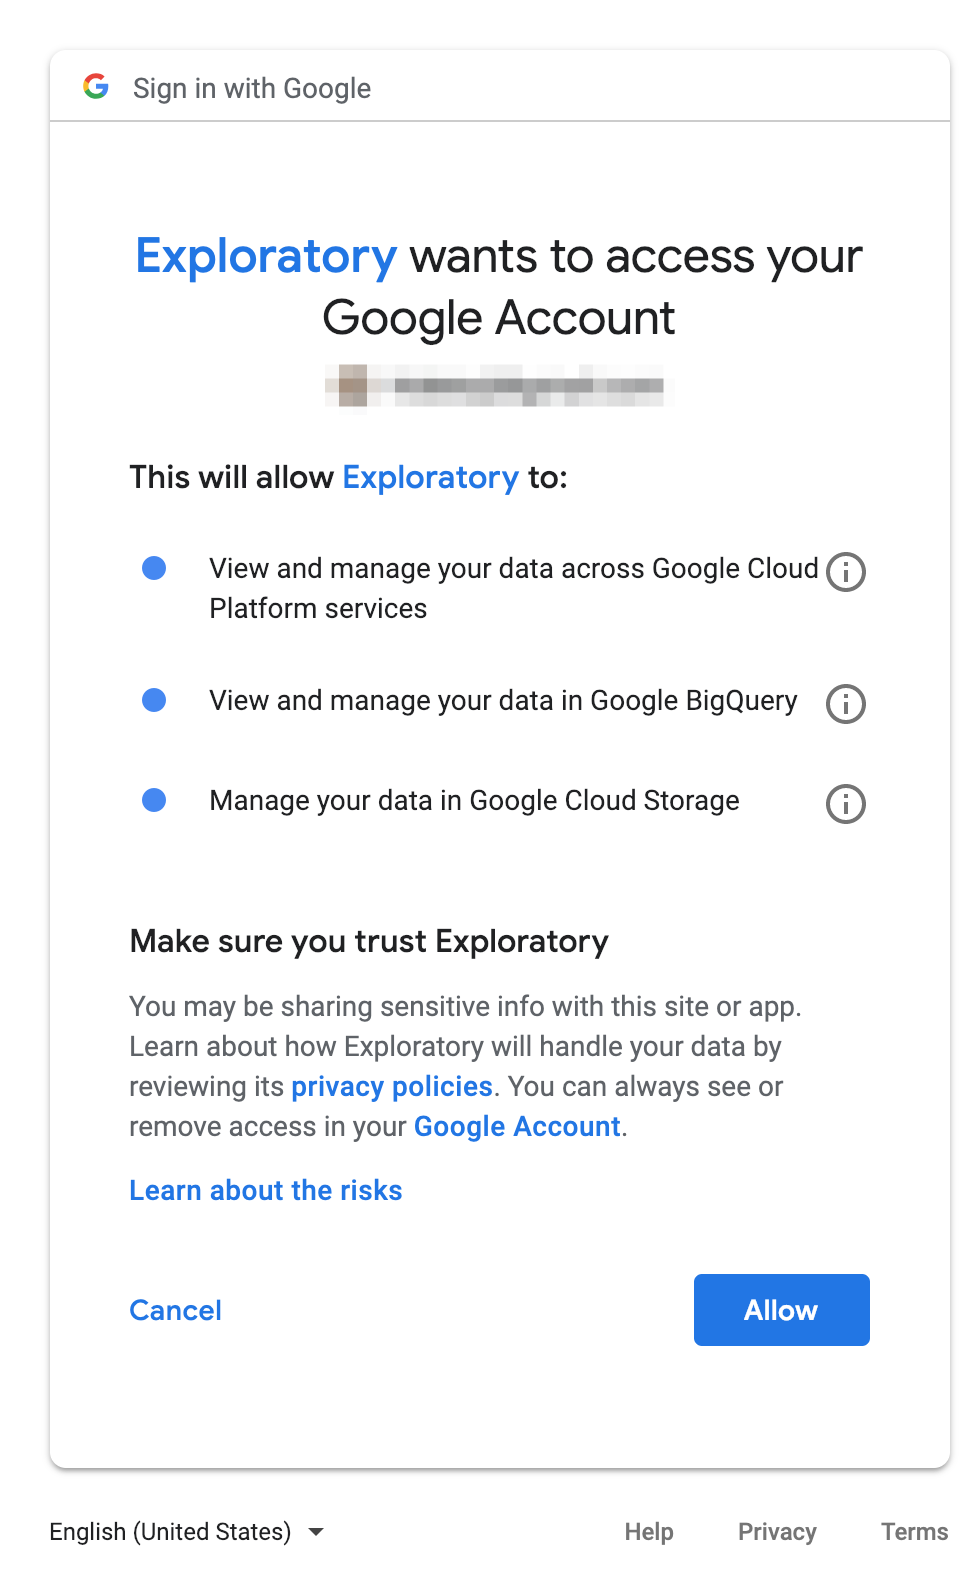
Then the browser displays the screen for authoring Exploratory to access Google BigQuery, click the Allow button.
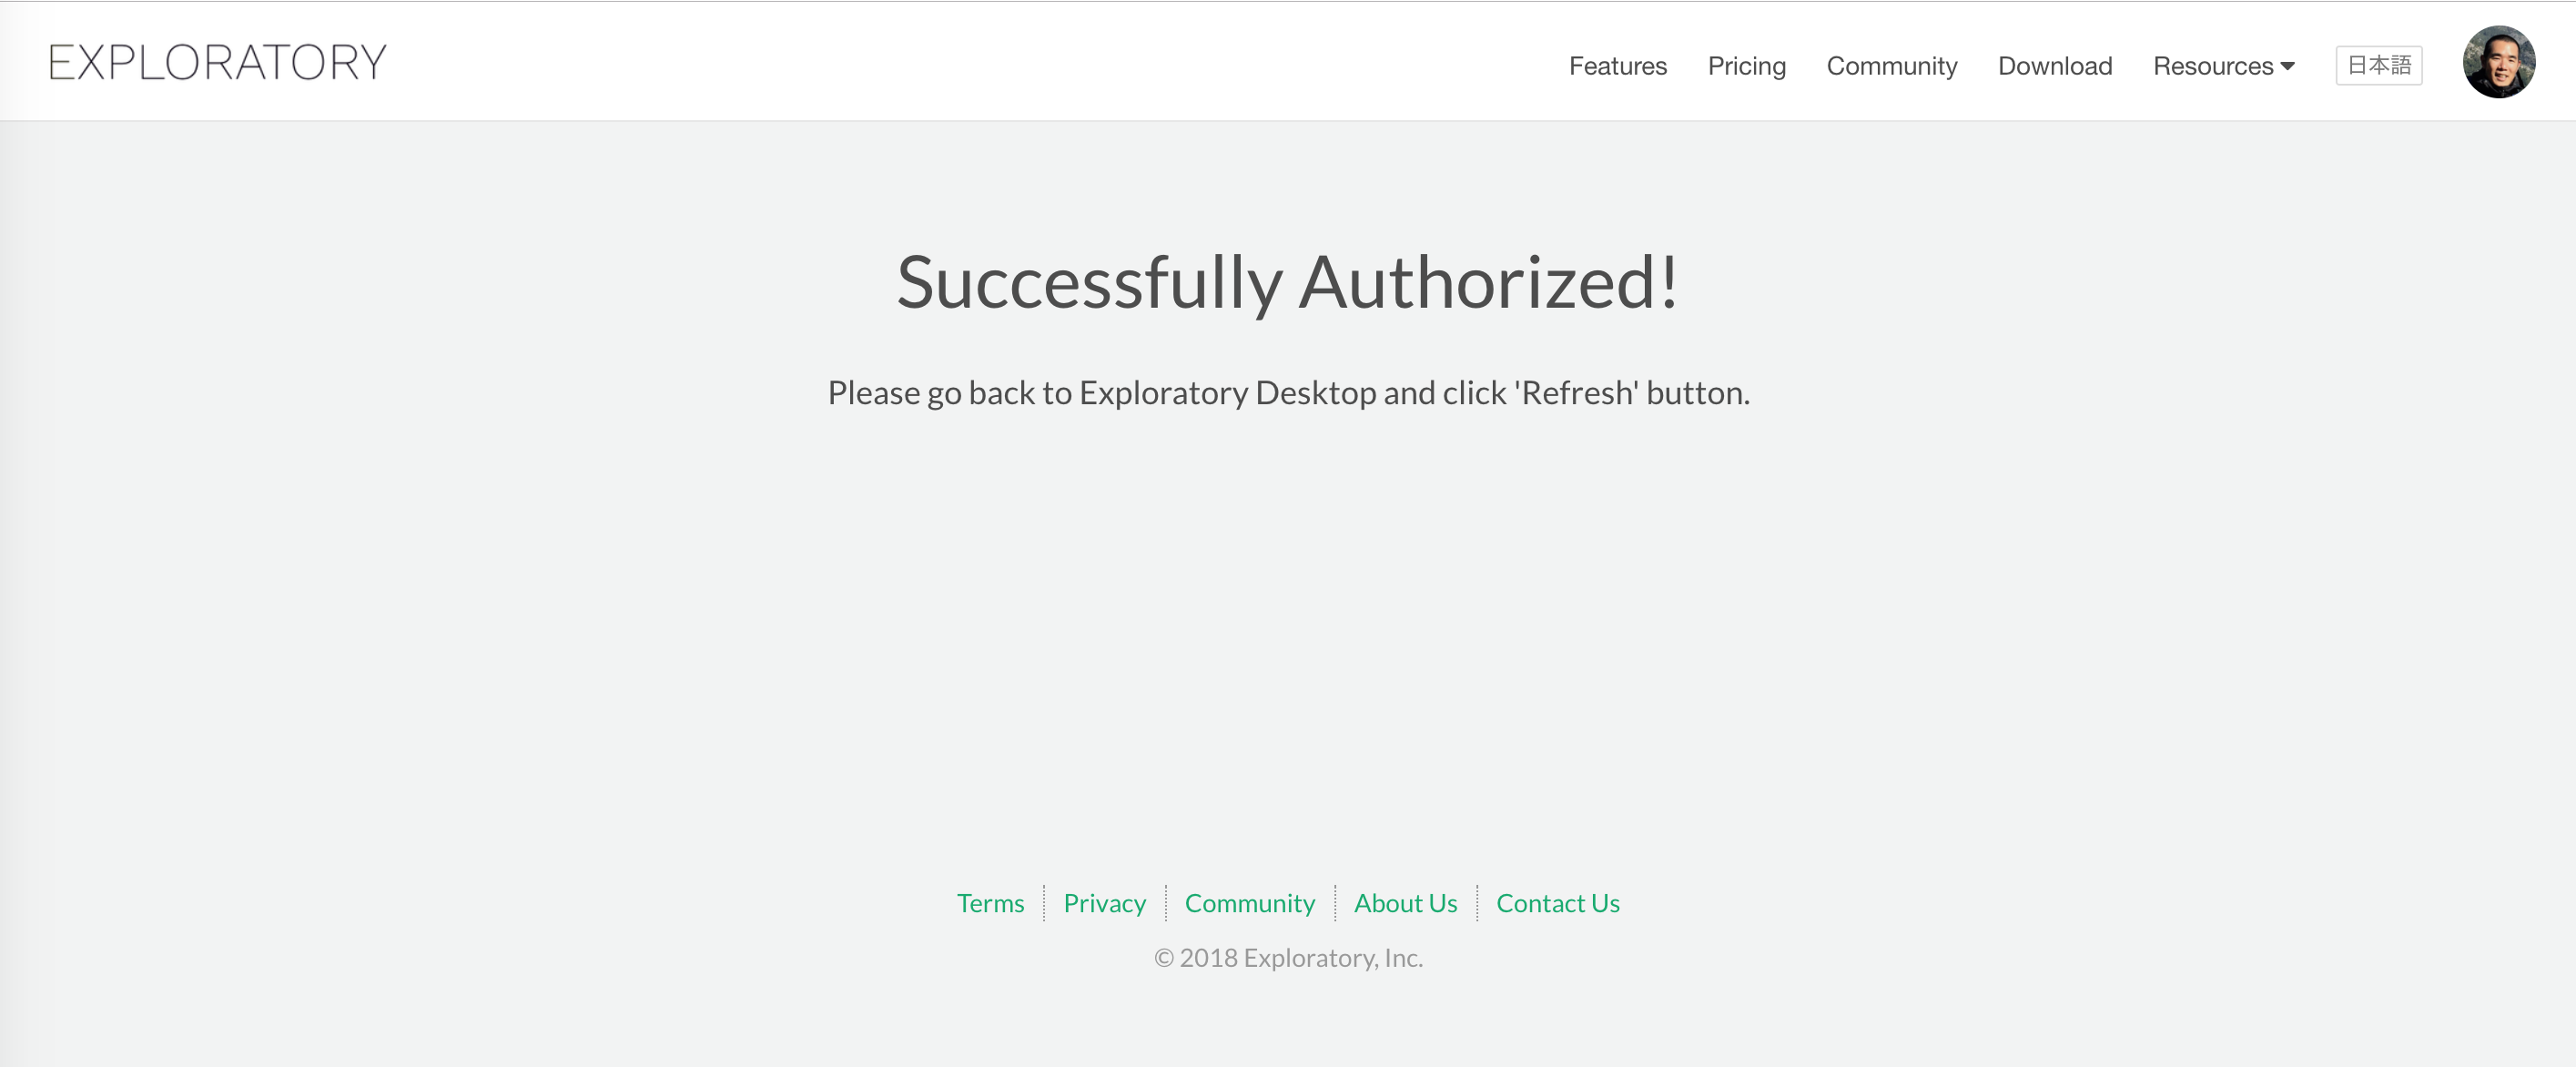
And you’ll see below message on browser once access is successfully granted.
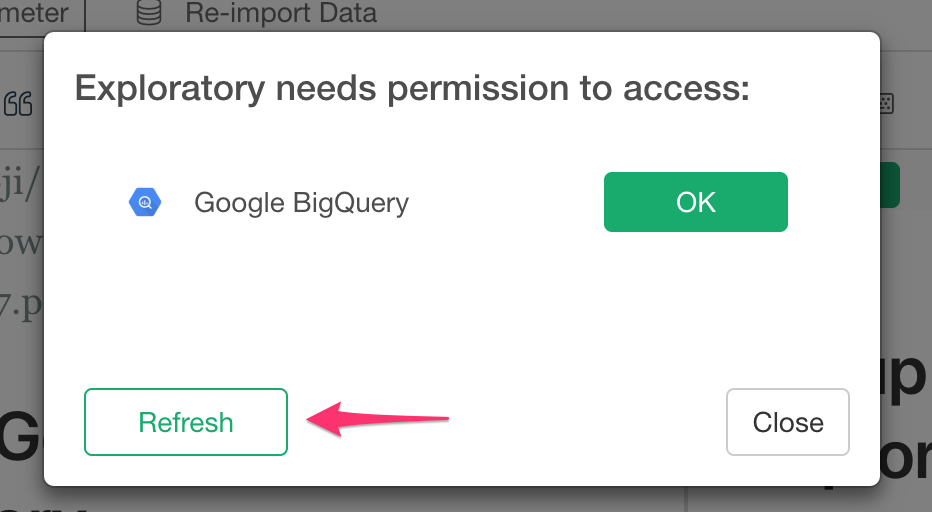
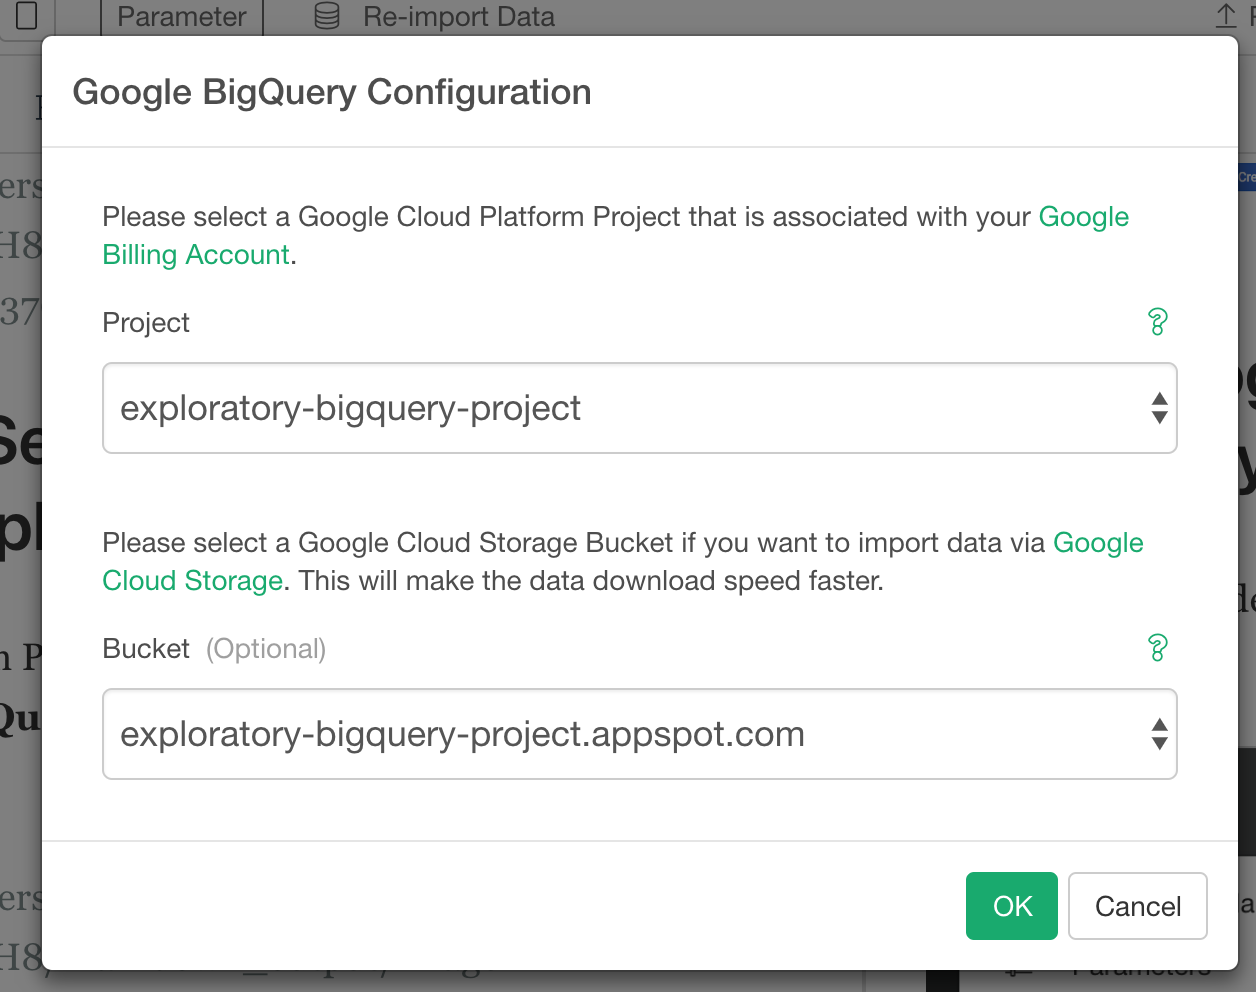
Click Refresh button on the “Exploratory needs permission to access” small popup dialog in Exploratory Desktop and now Google BigQuery Configuration Dialog is displayed.
On Google BigQuery Configuration Dialog, select a Project , Dataset, and a Bucket (optional) then click OK butotn.
Import data from GoogleBig Query
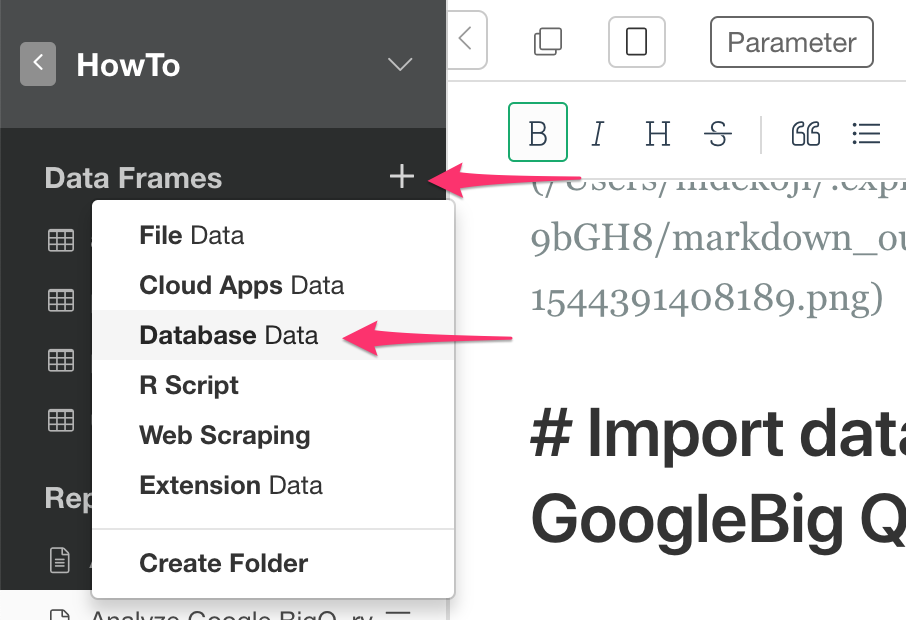
Create a new project (or open an existing project) in Exploratory Desktop and click plus (+) button next to data frame label. Then select Database Data
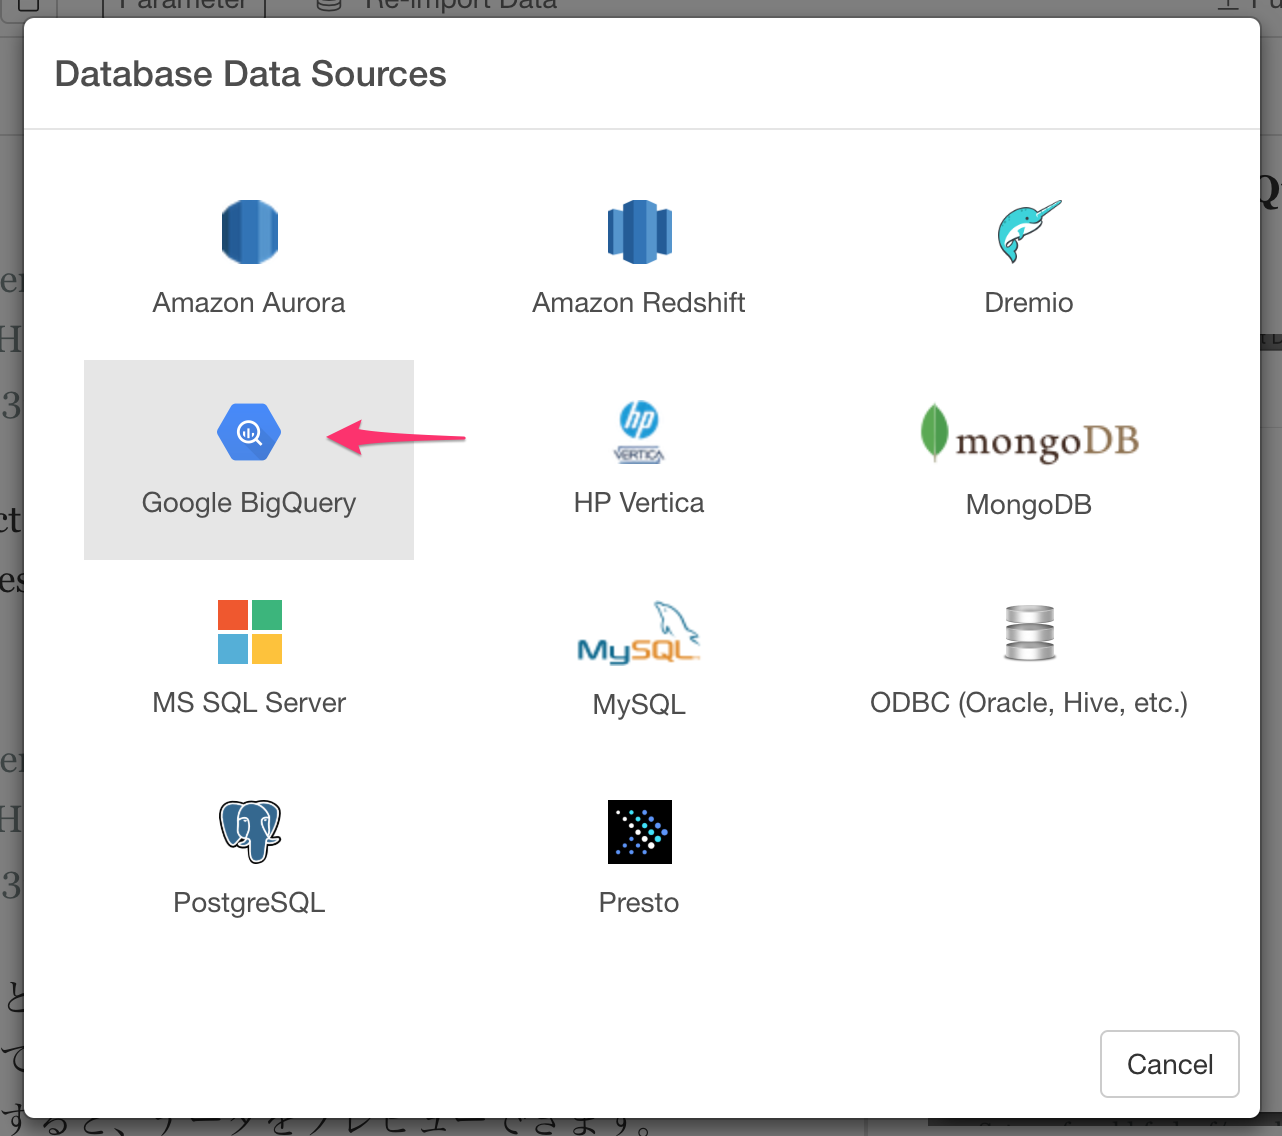
Select Google BigQuery on Database Data Sources Dialog.
Then the Data Import dialog opens, so you can preview the data by writing SQL here and clicking the Get Data button.
As an example, let’s try the sample data provided by Google BigQuery. As part of the sample, natality provides information on new born babies in the United States. So let’s use this natality data. When you run a query agains it, you can obtain data such as baby weight, pregnancy period, state, mother’s race, mother’s age, whether mother smokes or not, etc. The query processes 11.05 GB of data, and you can see that it previews 100 lines out of about 6.1 million rows as a result of the query. By the way, I am adding where clause to get data since 2003 because data from 2003 have “cigarettes use” information. I have also removed the case of dead birth.
SELECT
  weight_pounds,
  state,
  year, month, day
  child_race, plurality,
  mother_race, mother_age,
  cigarette_use, cigarettes_per_day,
  alcohol_use, drinks_per_week,
  father_race,
  father_age,
  is_male,
  gestation_weeks
FROM
  `bigquery-public-data.samples.natality`
WHERE state is NOT NULL
AND gestation_weeks is NOT NULL
AND year >= 2003
AND born_dead = 0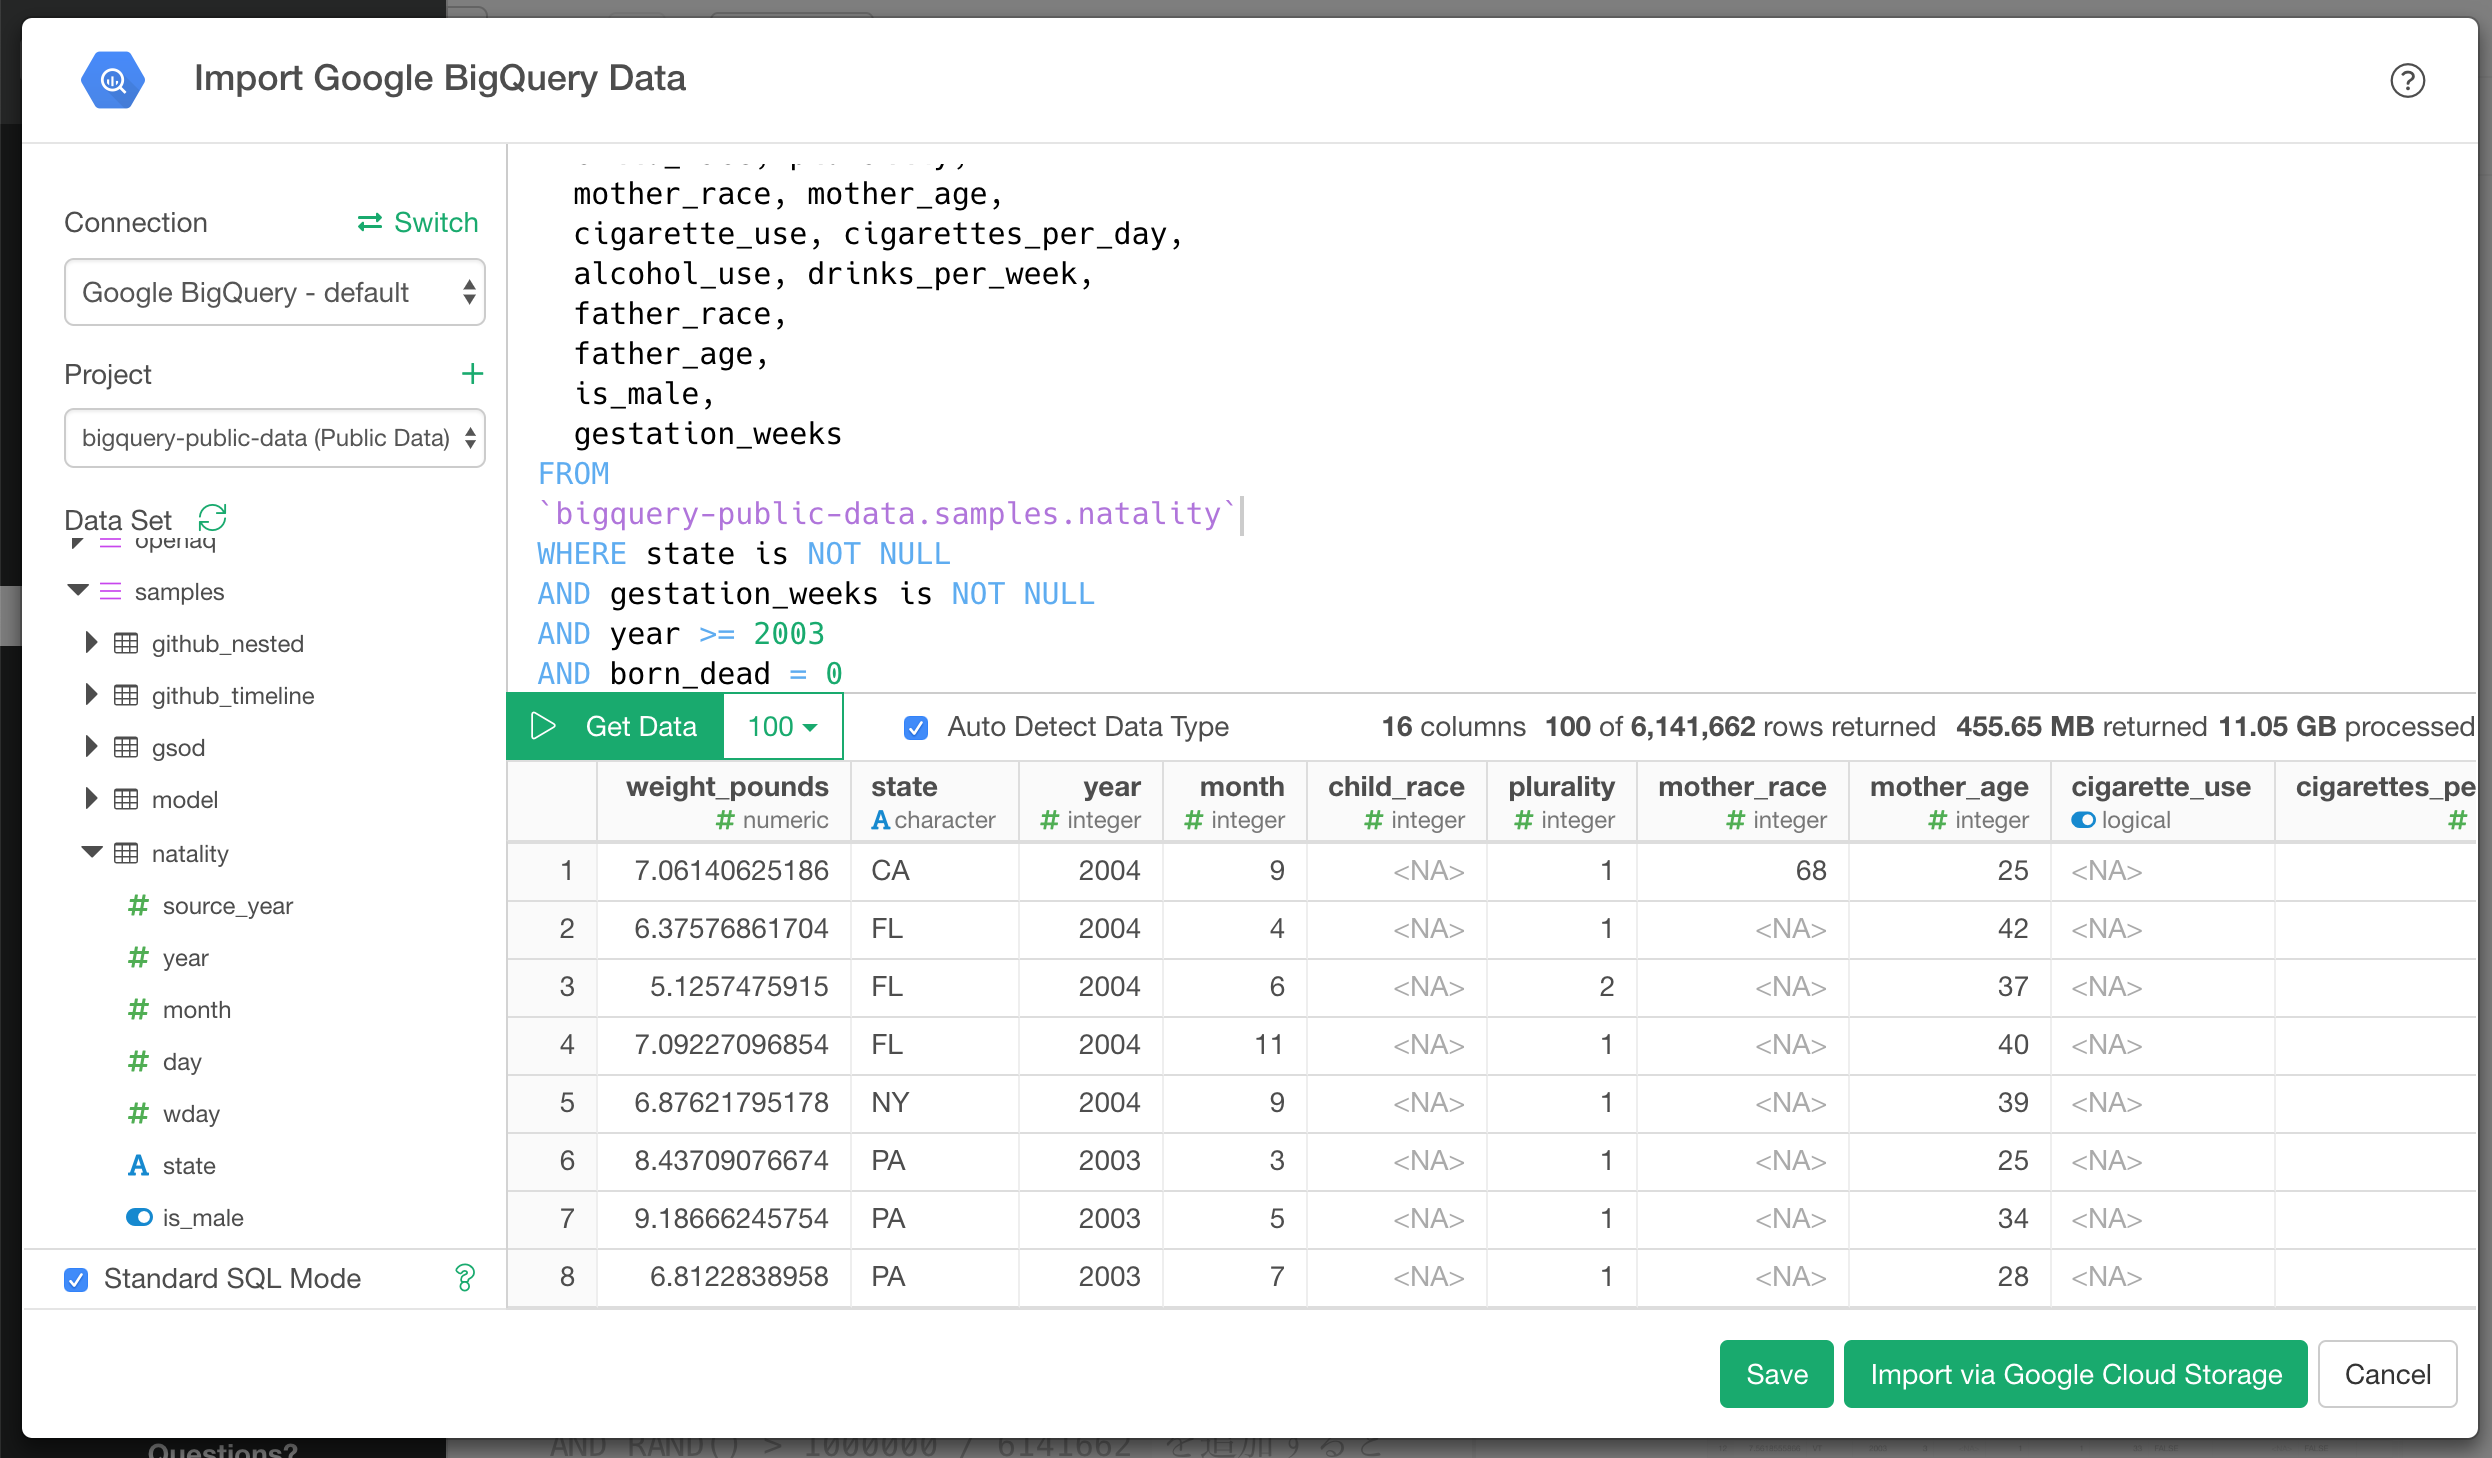
By clicking the Save button, you can import full results of the query into Exploratory. In this example, result data size is relative large (more than 450MB), so let’s import it by clicking Import via Google Cloud Storage button. As I mentioned in the previous section, this option allows you to compress and import data faster. To use this option, you need to setup Google Cloud Storage Bucket before hand.
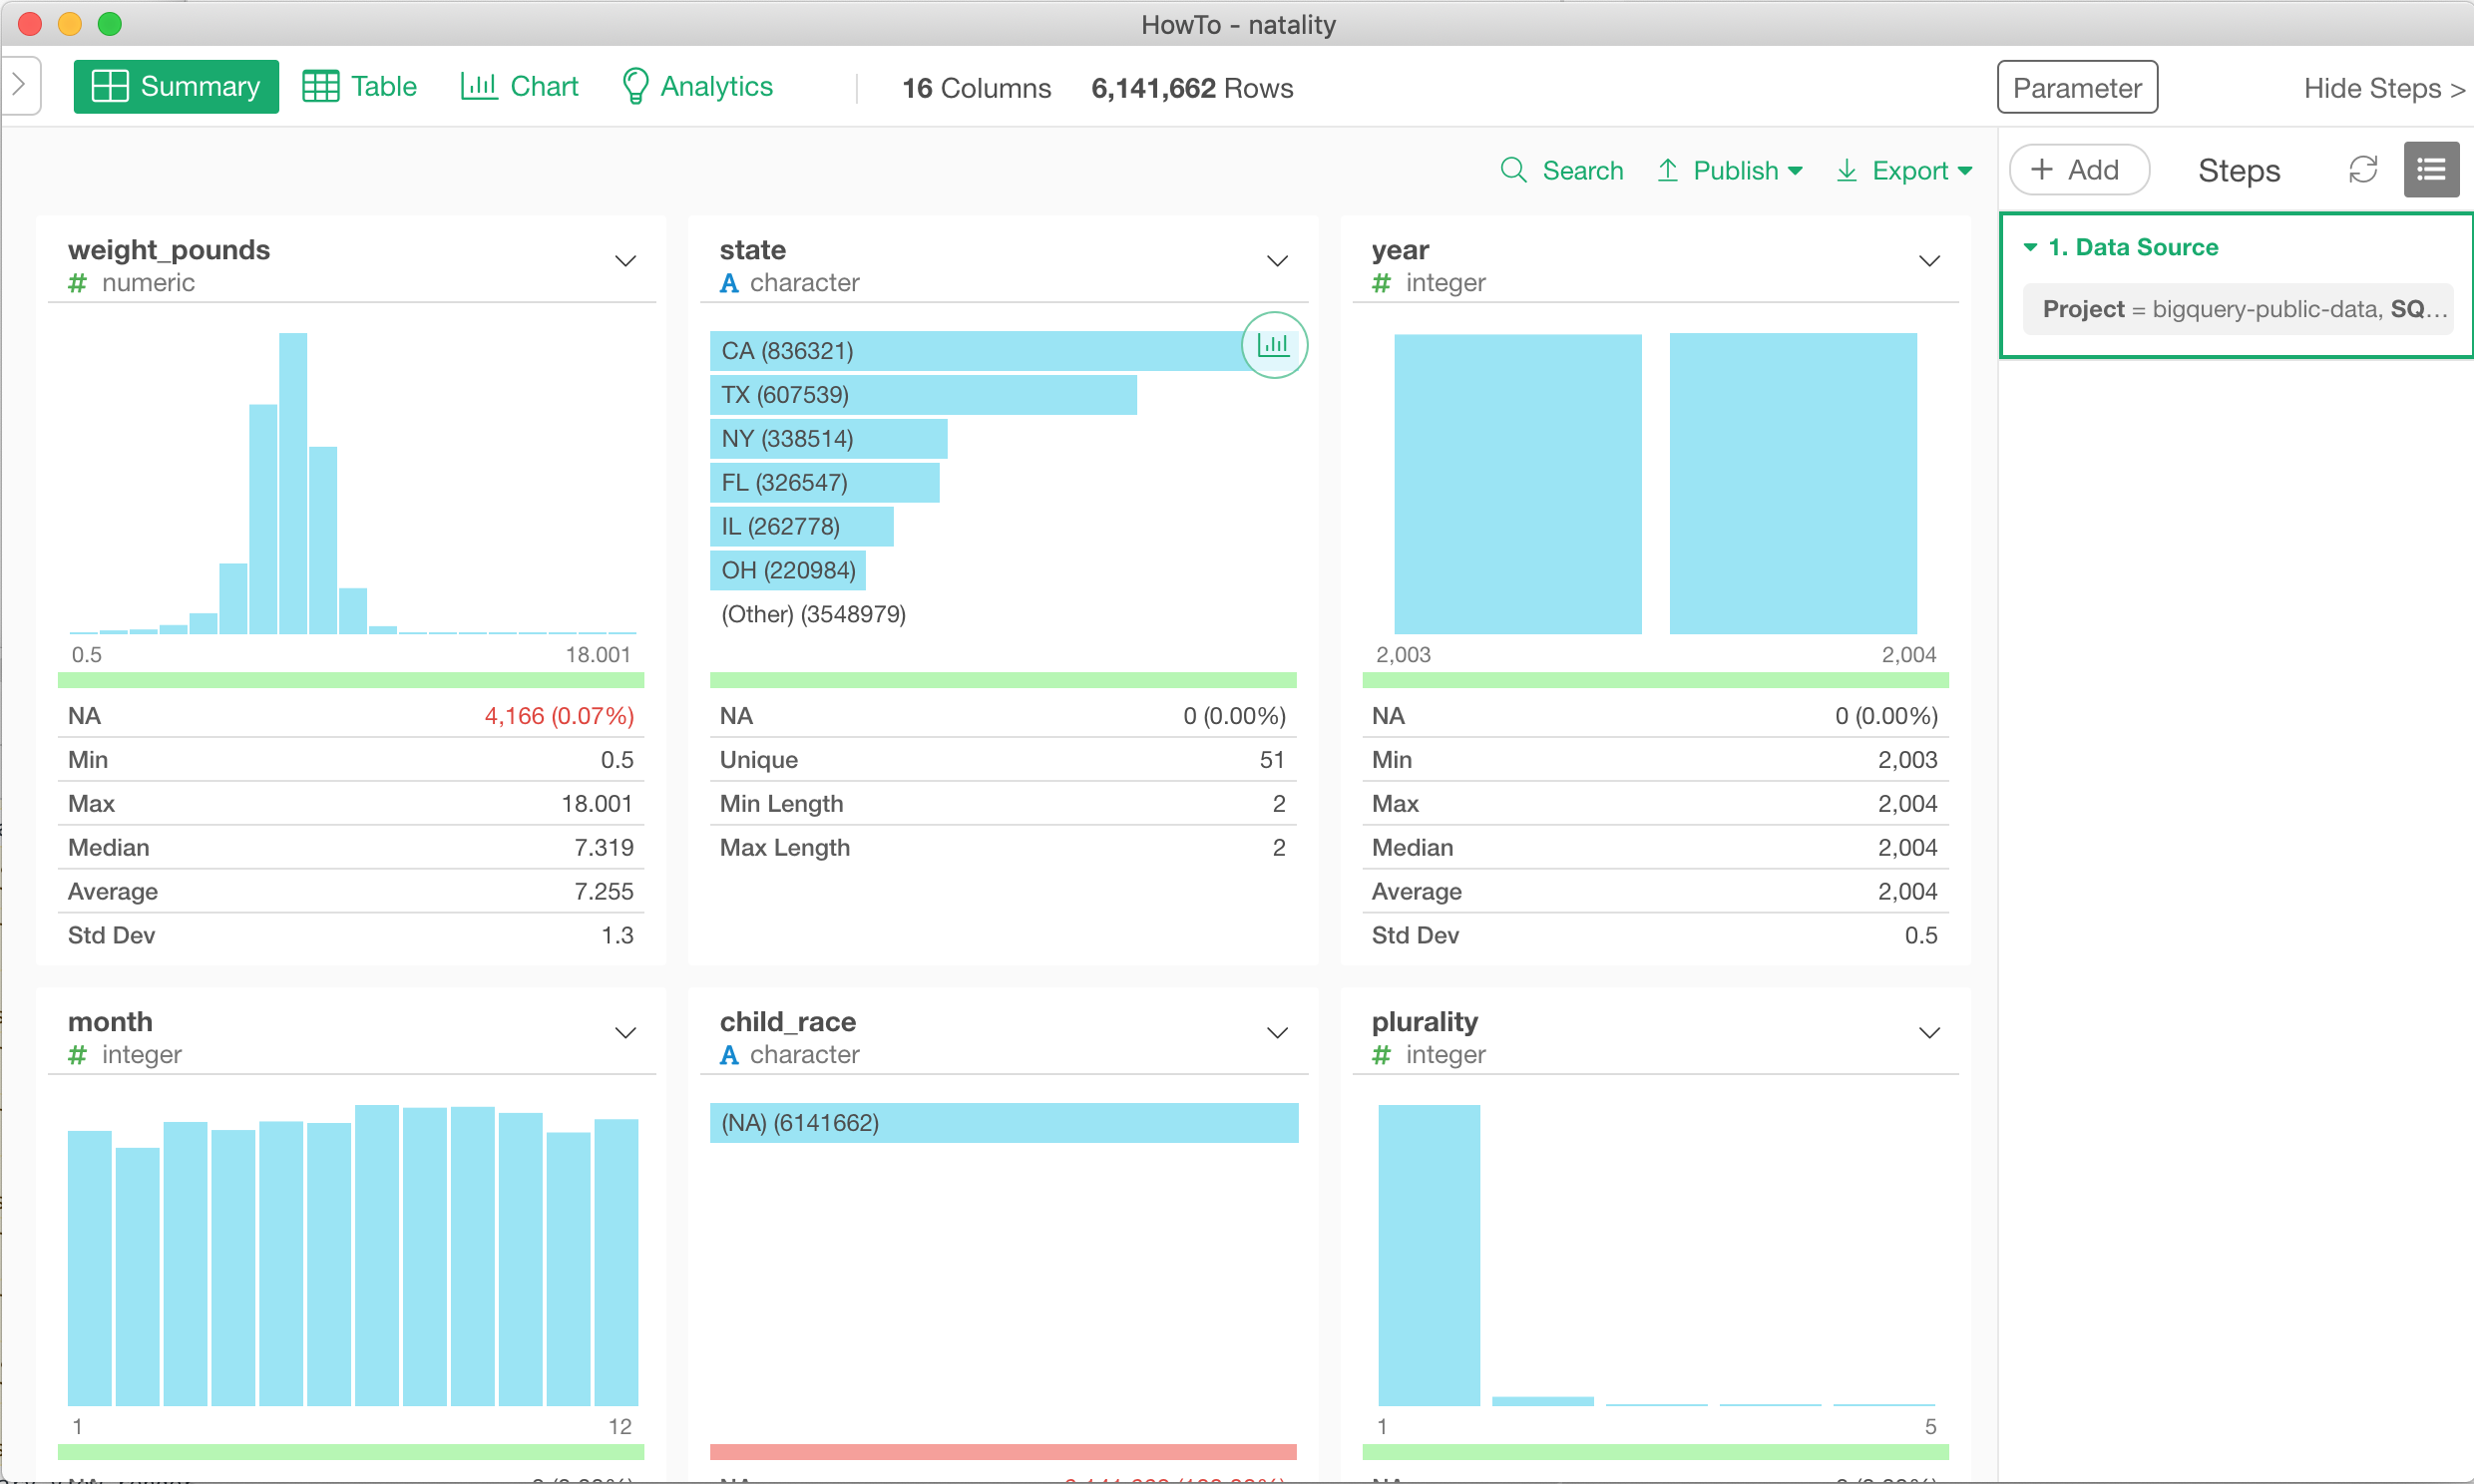
After you import the data, on summary view, you can confirm that around 6 million reocrds are imported to Exploratory Desktop.
Visualize Data
First of all, let’s display the median weight of new born babies on the US States map. Then you can see that the northern part tends to have a darker color (i.e. the median weight is larger) than the southern part.
Analytics:What affects premature birth?
Now, looking at the imported data, you can see there is a column called gestation_weeks that records the period of time between conception and birth, so let’s create a histogram and look at the distribution.
Even though the proportion is small, the “gestation weeks” is distributed to the week of fairly low figures. Generally, when the baby is born before the 37 weeks of gestation , it is considered as premature birth. So I created a new column is_premature based on the gestation_weeks and set a value as TRUE if gestation week is less than 37 weeks and FALSE if not, then assinged the is_premature column to Color By of the Historgram.
So which variable (column) has influence on whether it becomes preterm delivery or not? Let’s try the variable importance analytics to figure this out.
Then, you can see that plurality, mother’s age, father’s age have higher impact on preterm birth than the others. I am surprised because I thought that the use of alcohol and tobacco would had high impact on it.
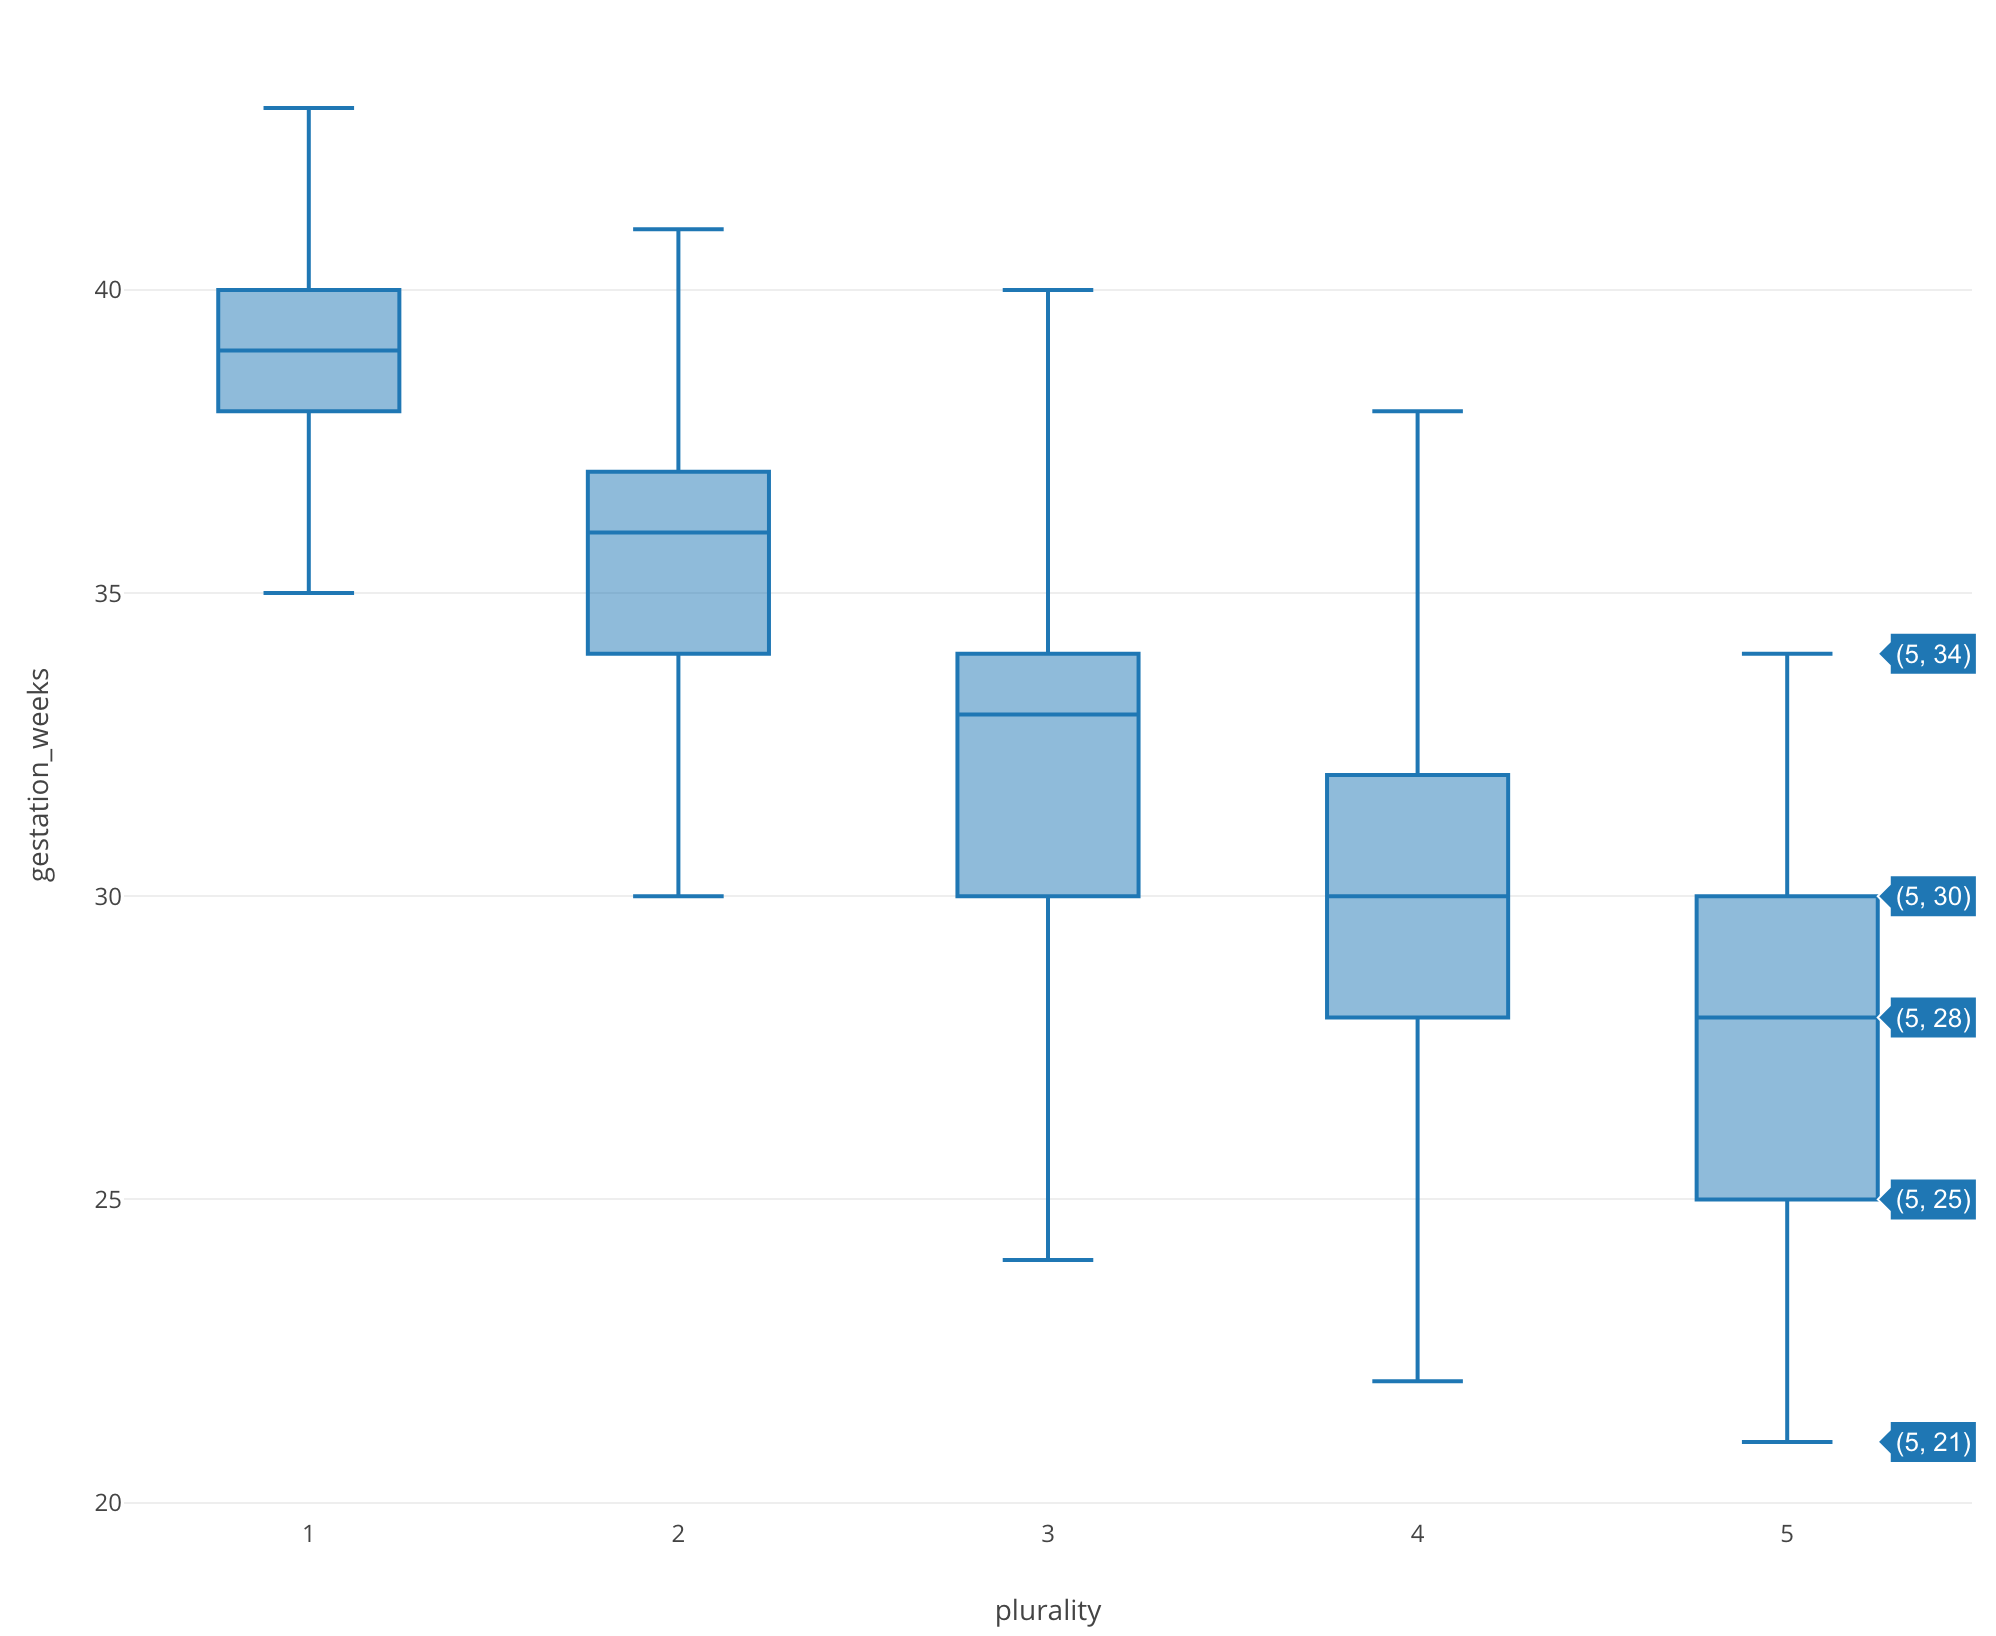
To confirm this result, let’s create a boxplot of gestation_week using plurarity, which has the most influence.
Then it certainly shows that the distribution shifted to early weeks as plurity increases (i.e. twins, triplets, etc).
Summary
In this article, I showed a way to get a data from Google BigQuery by writing SQL and imported it into Exploratory, and made a couple of analysis using visualization and algorithms. At first, I planned to write something like “How-to” ariticle to explain how you can incorporate Google BigQuery data into Exploratory, but by using variable importance analytics, I got unexpected insight! ;)
If you don’t have Exploratory yet, you can sign up from here for 30 days free trial!