Exploratory Desktopで使えるマークダウン記法の説明
Exploratoryのチャートやアナリティクスやステップに付けるコメントや、ノートを作成時に使えるマークダウン記法を説明した文章です。
Headers
# H1
## H2
### H3
#### H4
##### H5
###### H6

Alternatively, for H1 and H2, an underline-ish style:

Alt-H1
======

Alt-H2
------
H1
H2
H3
H4
H5
H6
Alternatively, for H1 and H2, an underline-ish style:
Alt-H1
Alt-H2
Emphasis
Emphasis, aka italics, with *asterisks* or _underscores_.

Strong emphasis, aka bold, with **asterisks** or __underscores__.

Combined emphasis with **asterisks and _underscores_**.

Strikethrough uses two tildes. ~~Scratch this.~~
Emphasis, aka italics, with asterisks or underscores.
Strong emphasis, aka bold, with asterisks or underscores.
Combined emphasis with asterisks and underscores.
Strikethrough uses two tildes. Scratch this.
Lists
If you want a nested list, you can add 4 spaces or 1 tab at the beginning.
(In this example, leading and trailing spaces are shown with with dots: ⋅)
1. First ordered list item
2. Another item
⋅⋅⋅⋅* Unordered sub-list.
1. Actual numbers don't matter, just that it's a number
⋅⋅⋅⋅1. Ordered sub-list
4. And another item.

⋅⋅⋅⋅You can have properly indented paragraphs within list items. Notice the blank line above, and the 4 leading spaces.

⋅⋅⋅⋅To have a line break without a paragraph, you will need to use 2 trailing spaces.⋅⋅
⋅⋅⋅⋅Note that this line is separate, but within the same paragraph.⋅⋅
⋅⋅⋅⋅(This is contrary to the typical GFM line break behaviour, where trailing spaces are not required.)

* Unordered list can use asterisks
- Or minuses
+ Or pluses- First ordered list item
- Another item
- Unordered sub-list.
- Actual numbers don’t matter, just that it’s a number
- Ordered sub-list
And another item.
You can have properly indented paragraphs within list items. Notice the blank line above, and the 4 leading spaces.
To have a line break without a paragraph, you will need to use 2 trailing spaces.
Note that this line is separate, but within the same paragraph.
(This is contrary to the typical GFM line break behavior, where trailing spaces are not required.)
- Unordered list can use asterisks
- Or minuses
- Or pluses
Links
There are two ways to create links.
[I'm an inline-style link](https://exploratory.io)

[I'm an inline-style link with title](https://exploratory.io "Exploratory's Homepage")

[I'm a reference-style link][Arbitrary case-insensitive reference text]

[I'm a relative reference to a repository file](../../index.html)

[You can use numbers for reference-style link definitions][1]

Or leave it empty and use the [link text itself].

URLs and URLs in angle brackets will automatically get turned into links.
http://exploratory.io or <http://exploratory.io> and sometimes
example.com (but not on Github, for example).

Some text to show that the reference links can follow later.

[arbitrary case-insensitive reference text]: https://www.mozilla.org
[1]: http://slashdot.org
[link text itself]: http://www.reddit.com
I’m an inline-style link with title
I’m a relative reference to a repository file
You can use numbers for reference-style link definitions
Or leave it empty and use the link text itself.
URLs and URLs in angle brackets will automatically get turned into links. http://exploratory.io or http://exploratory.io and sometimes example.com (but not on Github, for example).
Some text to show that the reference links can follow later.
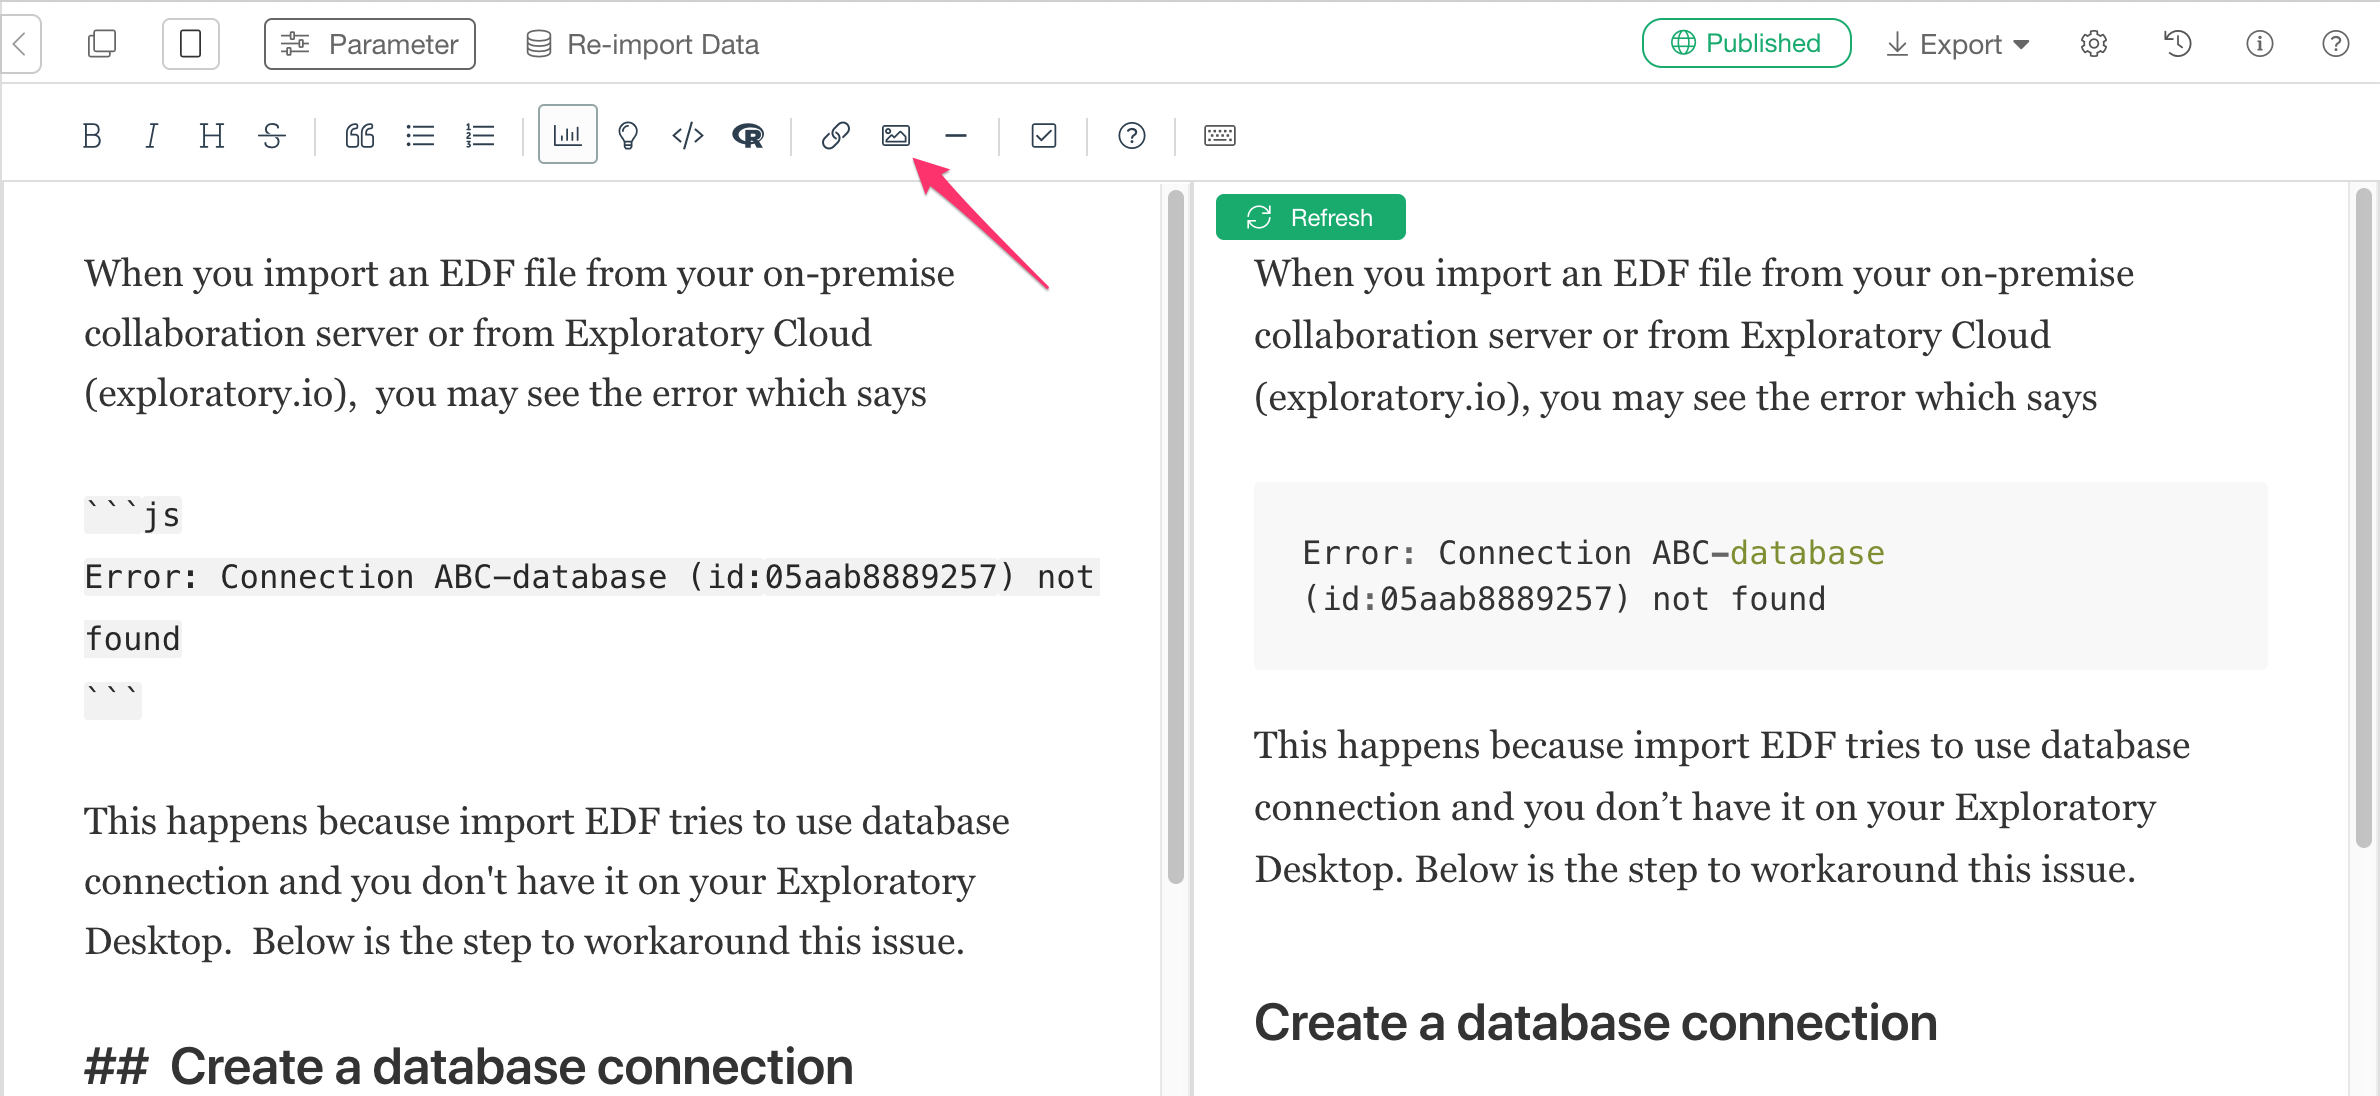
Images
You can use markdonw’s image syntax to show images.
Here's our logo (hover to see the title text):

Inline-style:
![alt text]!(file://Users/exploratory/images/logo_top.png "Logo Title Text 1")

Reference-style:
![alt text][logo]

[logo]: file://Users/exploratory/images/logo_top.png "Logo Title Text 2"
Here’s our logo (hover to see the title text):
Inline-style: 
Reference-style:
Controling image width
You can use the HTML’s img tag with width attribute to control the image width. You can set the width in following ways.
- width=“500px”
- width=“500” (Same as “500px”)
- width=“50%” (50% of the note area width)
- width=“full” (Same as the 100% of the screen width)
Also, you can apply any of CSS styles with the HTML img tag.
Example:
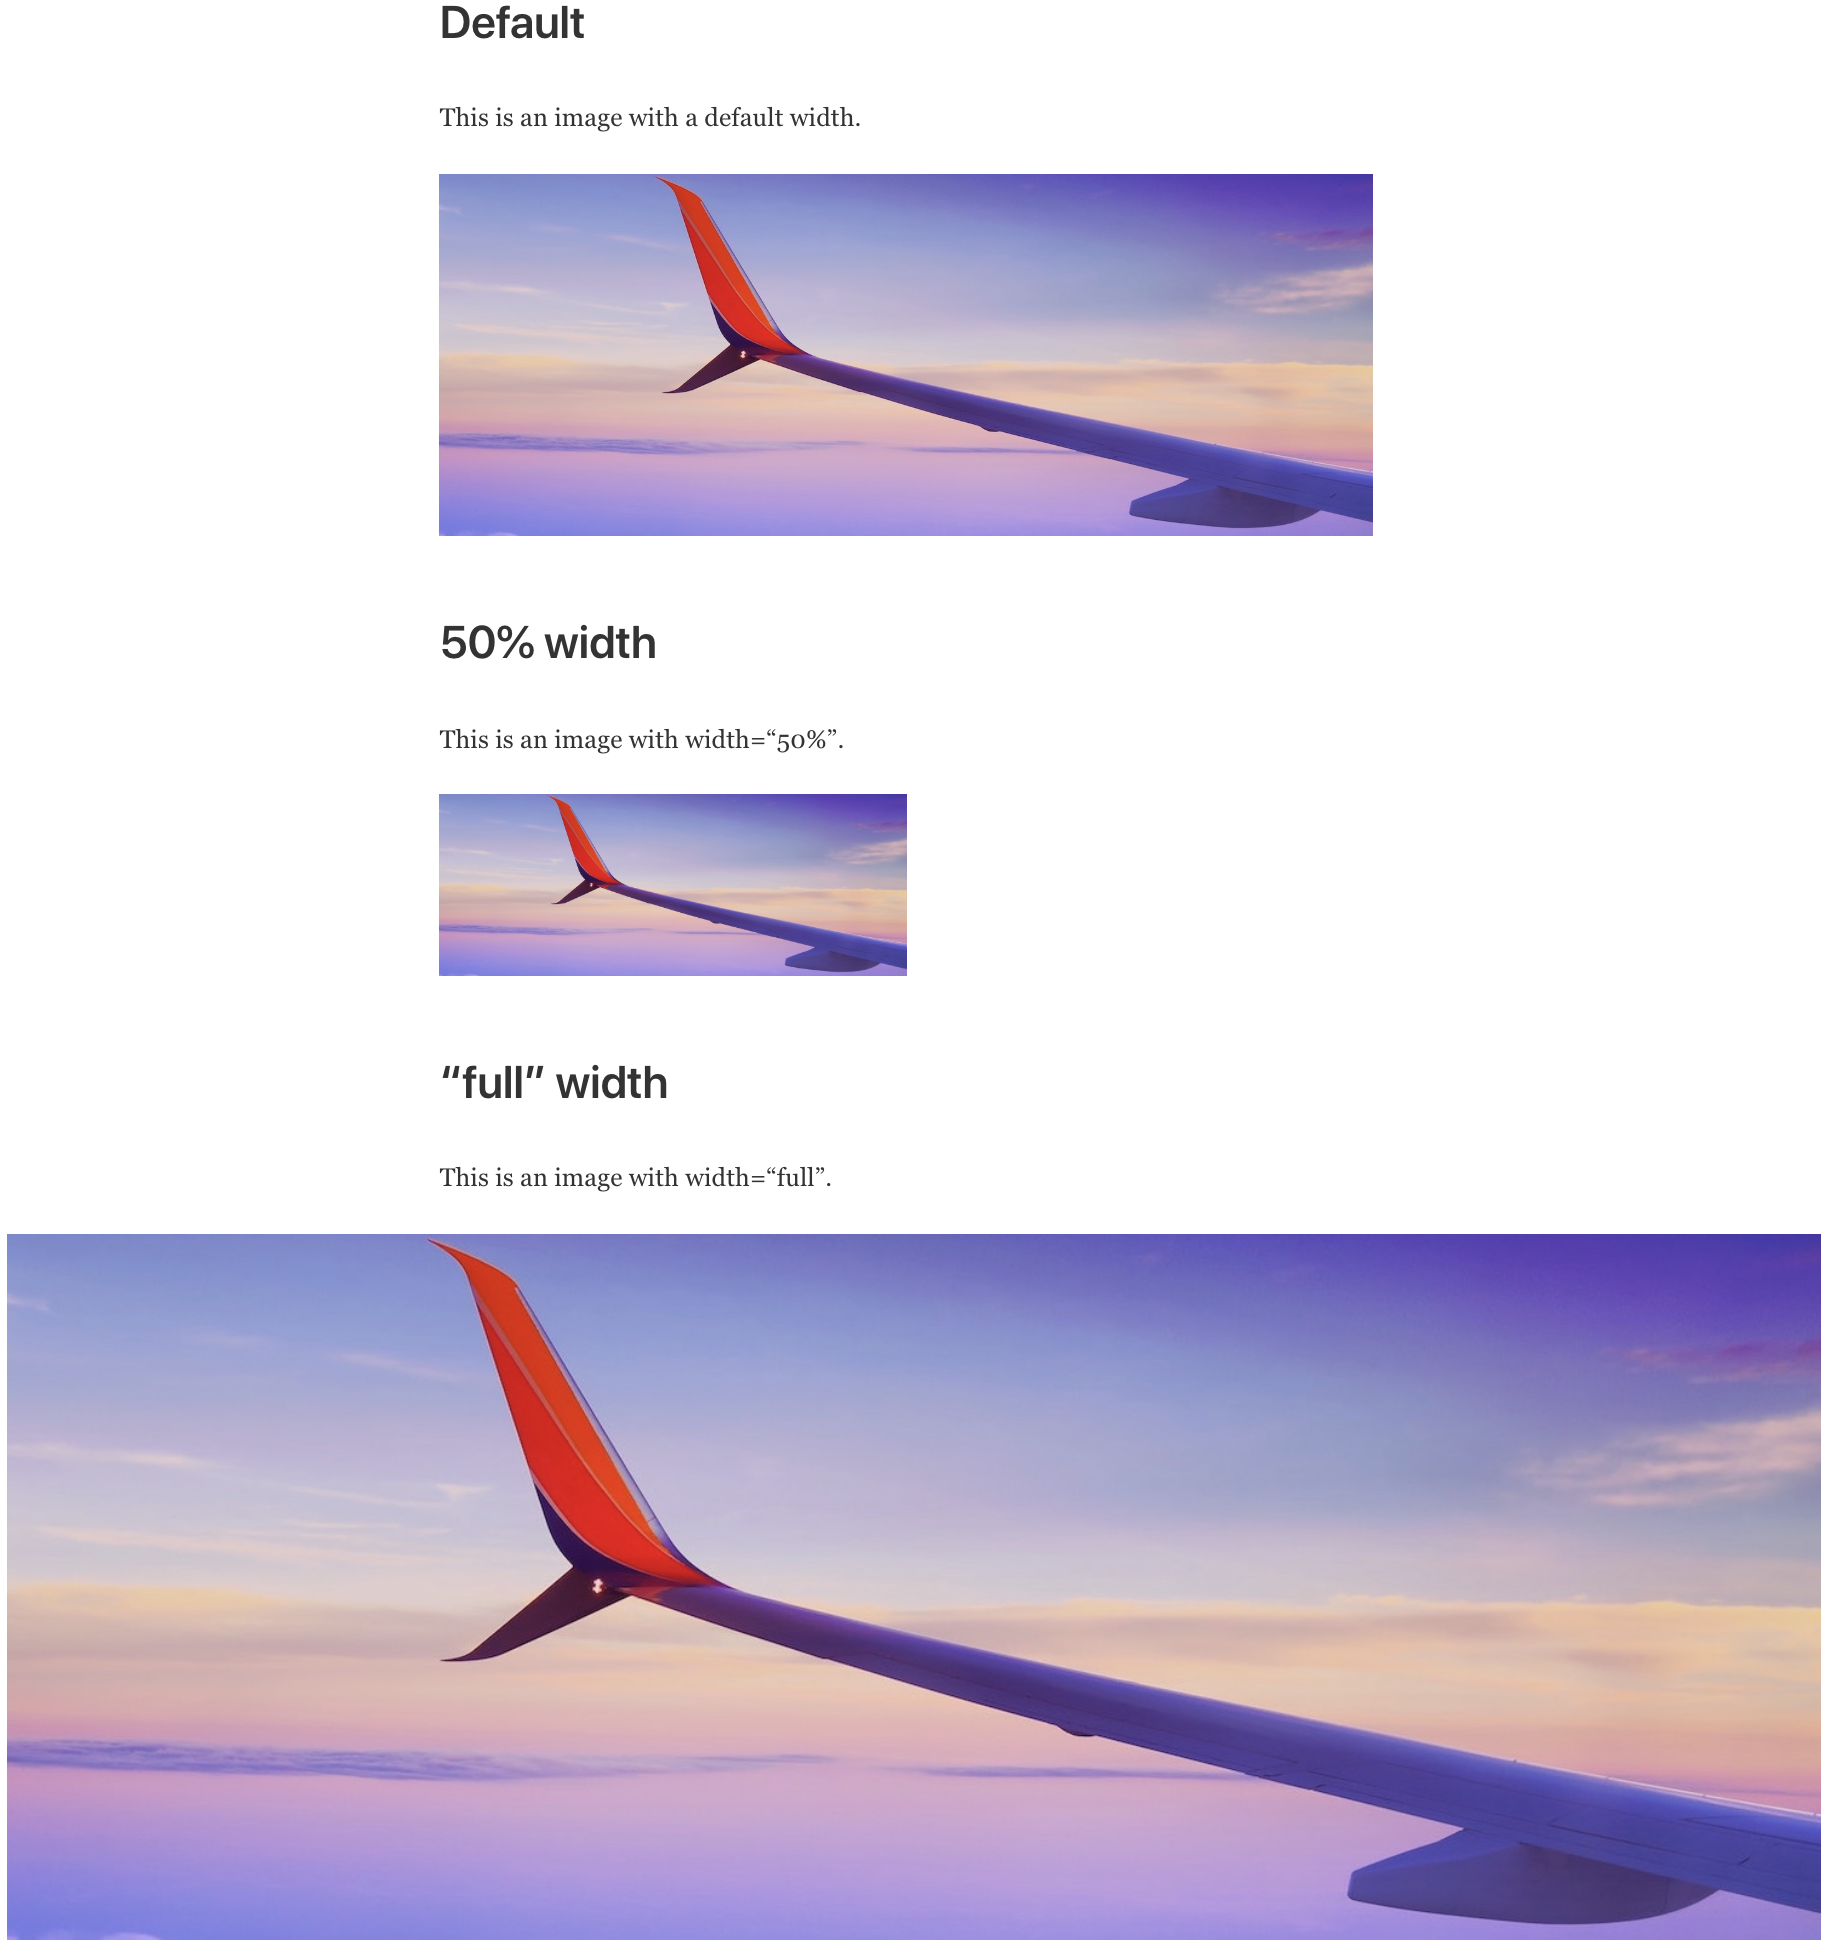
# Default
This is an image with a default width.

# 50% width
This is an image with width="50%".
<img src="/Users/kei/Downloads/airplane.jpg" width="50%"/>
# "full" width
This is an image with width="full".
<img src="/Users/kei/Downloads/airplane.jpg" width="full"></img>
Code
Code blocks are part of the Markdown spec and Exploratory uses R Markdown’s pygments for syntax highlighting.
2020-03-13 14:10:16 is the best time to learn Inline R codes that have `back-ticks around` it.2017-08-18 21:23:21 is the best time to learn Inline R codes that have back-ticks around it.
Blocks of code are either fenced by lines with three back-ticks ```, or are indented with four spaces. I recommend only using the fenced code blocks – they’re easier and only they support syntax highlighting.
```{r}
summary(mtcars)
```

```
No language indicated, so no syntax highlighting.
But let's throw in a <b>tag</b>.
```
summary(mtcars)
##       mpg             cyl             disp             hp
##  Min.   :10.40   Min.   :4.000   Min.   : 71.1   Min.   : 52.0
##  1st Qu.:15.43   1st Qu.:4.000   1st Qu.:120.8   1st Qu.: 96.5
##  Median :19.20   Median :6.000   Median :196.3   Median :123.0
##  Mean   :20.09   Mean   :6.188   Mean   :230.7   Mean   :146.7
##  3rd Qu.:22.80   3rd Qu.:8.000   3rd Qu.:326.0   3rd Qu.:180.0
##  Max.   :33.90   Max.   :8.000   Max.   :472.0   Max.   :335.0
##       drat             wt             qsec             vs
##  Min.   :2.760   Min.   :1.513   Min.   :14.50   Min.   :0.0000
##  1st Qu.:3.080   1st Qu.:2.581   1st Qu.:16.89   1st Qu.:0.0000
##  Median :3.695   Median :3.325   Median :17.71   Median :0.0000
##  Mean   :3.597   Mean   :3.217   Mean   :17.85   Mean   :0.4375
##  3rd Qu.:3.920   3rd Qu.:3.610   3rd Qu.:18.90   3rd Qu.:1.0000
##  Max.   :4.930   Max.   :5.424   Max.   :22.90   Max.   :1.0000
##        am              gear            carb
##  Min.   :0.0000   Min.   :3.000   Min.   :1.000
##  1st Qu.:0.0000   1st Qu.:3.000   1st Qu.:2.000
##  Median :0.0000   Median :4.000   Median :2.000
##  Mean   :0.4062   Mean   :3.688   Mean   :2.812
##  3rd Qu.:1.0000   3rd Qu.:4.000   3rd Qu.:4.000
##  Max.   :1.0000   Max.   :5.000   Max.   :8.000
No language indicated, so no syntax highlighting in.
But let's throw in a <b>tag</b>.
Tables
They are an easy way of adding tables to your email – a task that would otherwise require copy-pasting from another application.
Colons can be used to align columns.

| Tables        | Are           | Cool  |
| ------------- |:-------------:| -----:|
| col 3 is      | right-aligned | $1600 |
| col 2 is      | centered      |   $12 |
| zebra stripes | are neat      |    $1 |

There must be at least 3 dashes separating each header cell.
The outer pipes (|) are optional, and you don't need to make the
raw Markdown line up prettily. You can also use inline Markdown.

Markdown | Less | Pretty
--- | --- | ---
*Still* | `renders` | **nicely**
1 | 2 | 3
Colons can be used to align columns.
| Tables | Are | Cool |
|---|---|---|
| col 3 is | right-aligned | $1600 |
| col 2 is | centered | $12 |
| zebra stripes | are neat | $1 |
There must be at least 3 dashes separating each header cell. The outer pipes (|) are optional, and you don’t need to make the raw Markdown line up prettily. You can also use inline Markdown.
| Markdown | Less | Pretty |
|---|---|---|
| Still | renders |
nicely |
| 1 | 2 | 3 |
Blockquotes
> Blockquotes are very handy in email to emulate reply text.
> This line is part of the same quote.

Quote break.

> This is a very long line that will still be quoted properly when it wraps. Oh boy let's keep writing to make sure this is long enough to actually wrap for everyone. Oh, you can *put* **Markdown** into a blockquote.
Blockquotes are very handy in email to emulate reply text. This line is part of the same quote.
Quote break.
This is a very long line that will still be quoted properly when it wraps. Oh boy let’s keep writing to make sure this is long enough to actually wrap for everyone. Oh, you can put Markdown into a blockquote.
Inline HTML
You can also use raw HTML in your Markdown, and it’ll mostly work pretty well.
<dl>
  <dt>Definition list</dt>
  <dd>Is something people use sometimes.</dd>

  <dt>Markdown in HTML</dt>
  <dd>Does *not* work **very** well. Use HTML <em>tags</em>.</dd>
</dl>- Definition list
- Is something people use sometimes.
- Markdown in HTML
- Does not work very well. Use HTML tags.
Horizontal Rule
Three or more...

---

Hyphens

***

Asterisks

___

Underscores
Three or more…
Hyphens
Asterisks
Underscores
Line Breaks
My basic recommendation for learning how line breaks work is to experiment and discover – hit <Enter> once (i.e., insert one newline), then hit it twice (i.e., insert two newlines), see what happens. You’ll soon learn to get what you want. “Markdown Toggle” is your friend.
Here are some things to try out:
Here's a line for us to start with.

This line is separated from the one above by two newlines, so it will be a *separate paragraph*.

This line is also a separate paragraph, but...
This line is only separated by a single newline, so it's a separate line in the *same paragraph*.
Here’s a line for us to start with.
This line is separated from the one above by two newlines, so it will be a separate paragraph.
This line is also begins a separate paragraph, but…
This line is only separated by a single newline, so it’s a separate line in the same paragraph.
Tabbed Sections
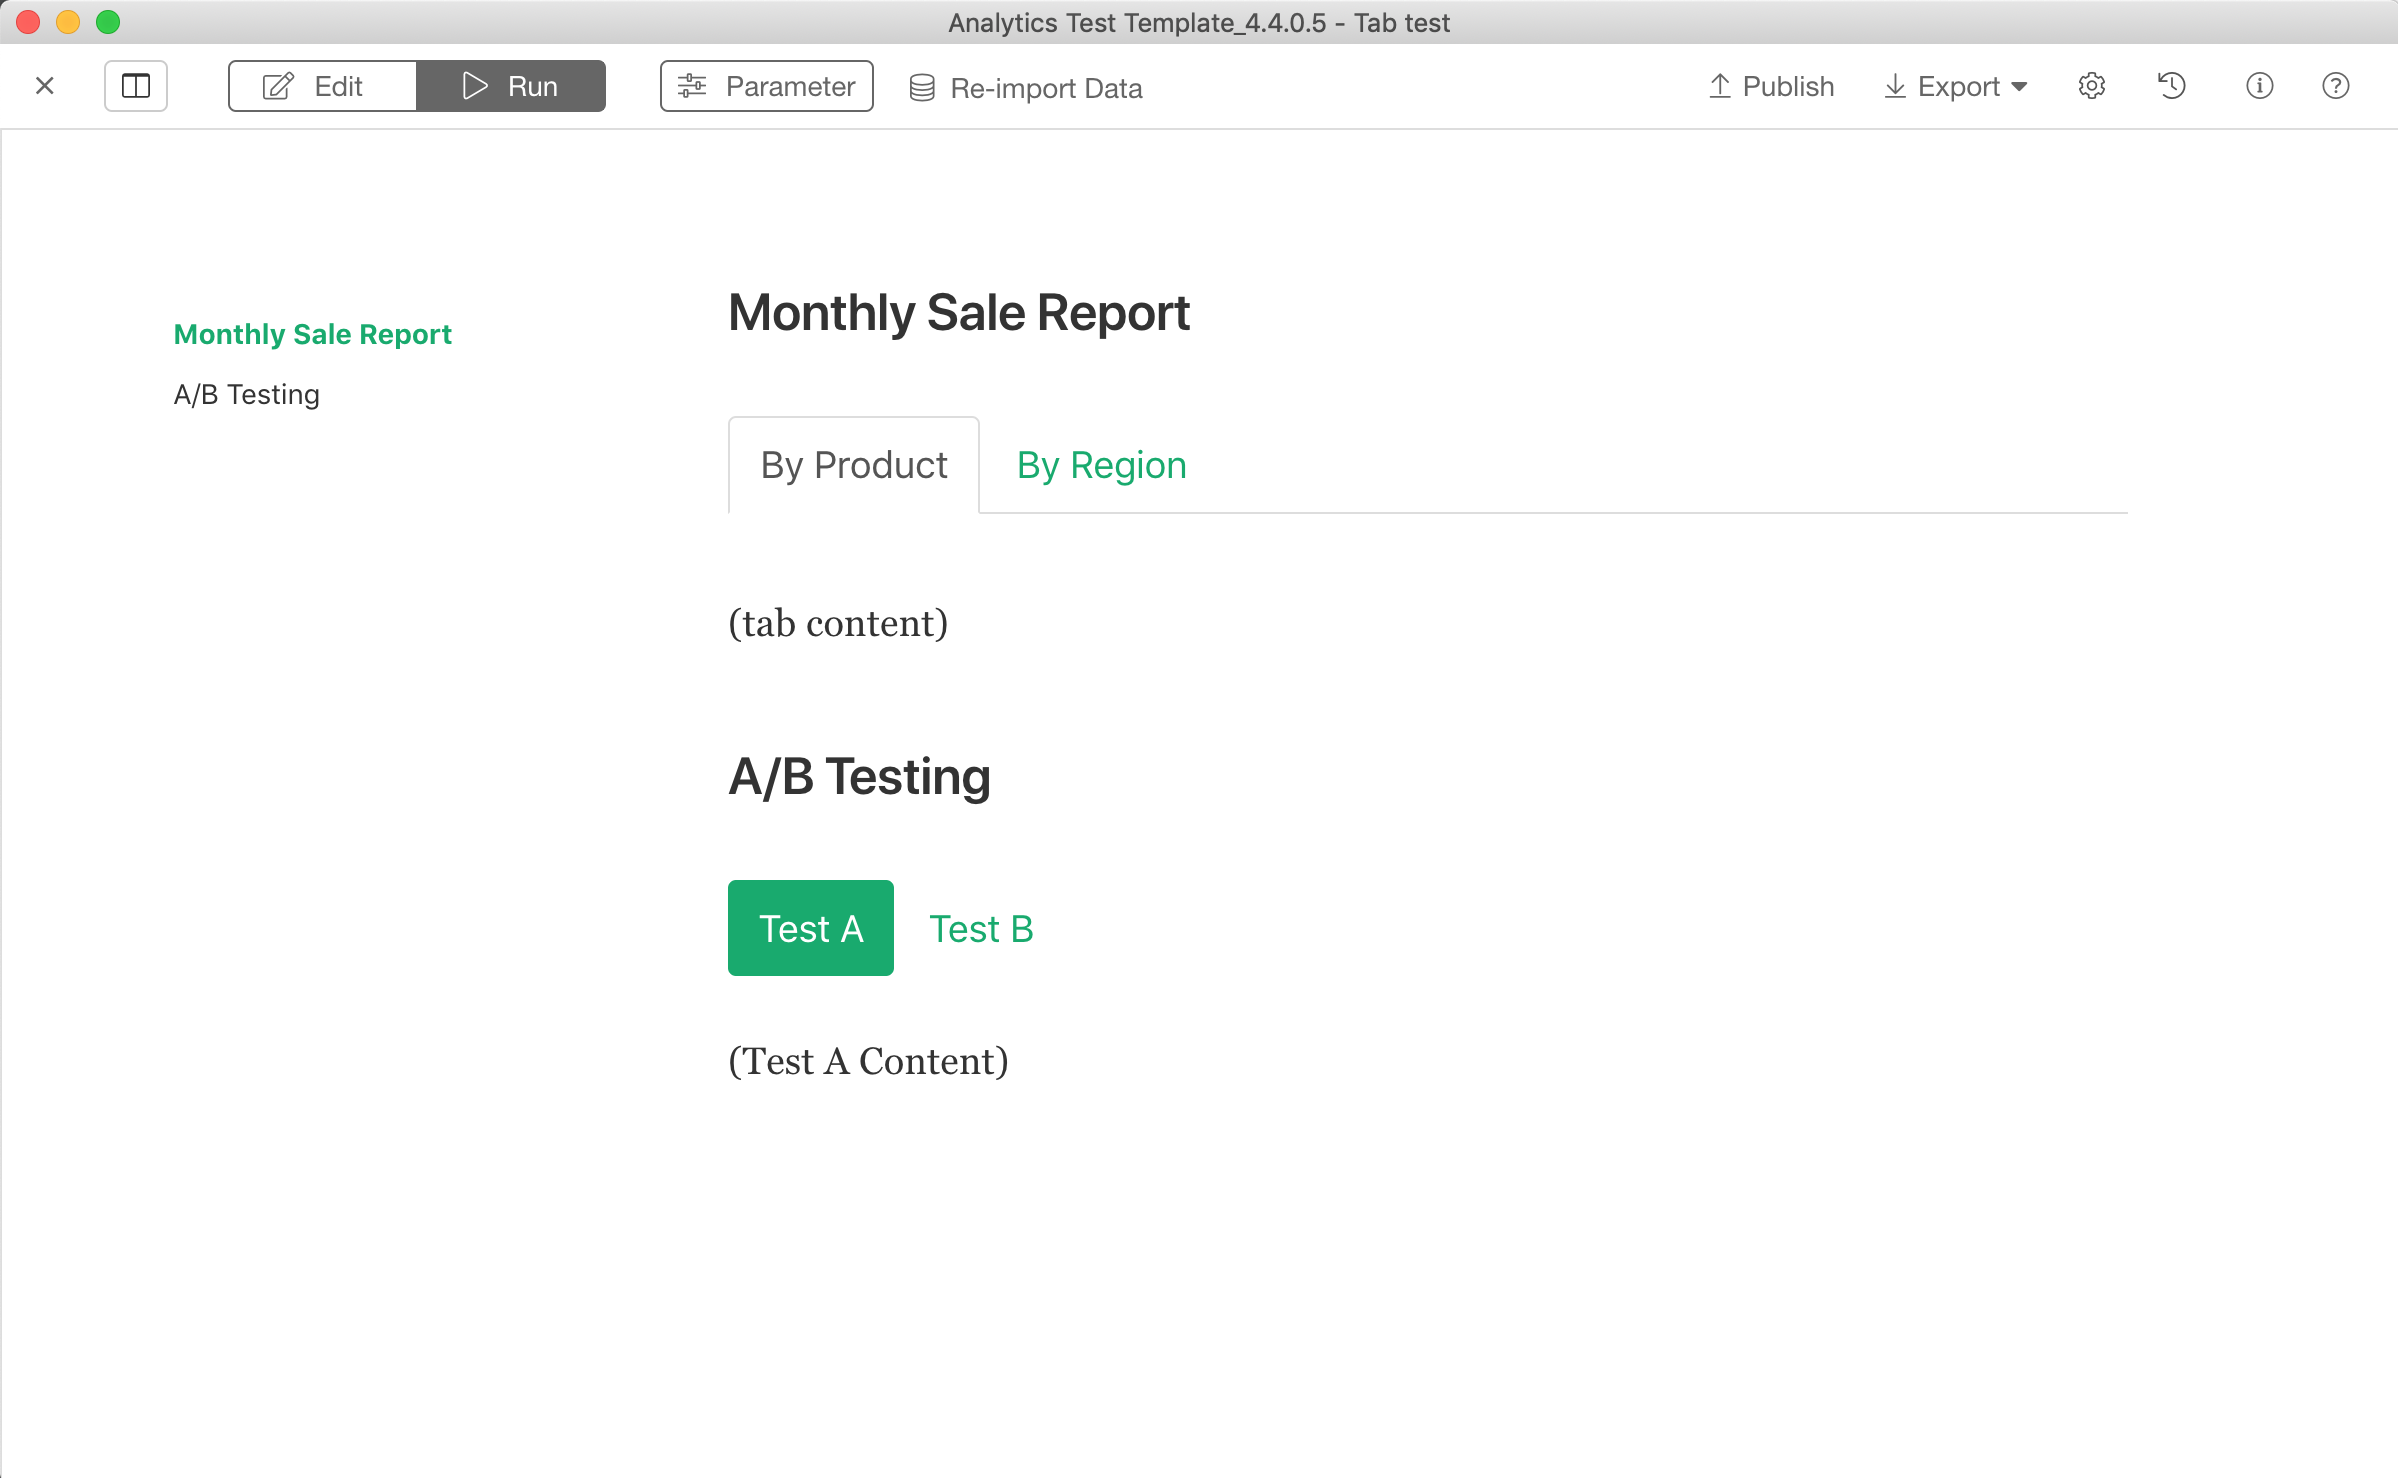
You can organize content using tabs by applying the .tabset class attribute to headers within a document. This will cause all sub-headers of the header with the .tabset attribute to appear within tabs rather than as standalone sections. For example:
## Monthly Sale Report {.tabset}

### By Product

(tab content)

### By Region

(tab content)
You can also specify two additional attributes to control the appearance and behavior of the tabs. The .tabset-fade attribute causes the tabs to fade in and out when switching. The .tabset-pills attribute causes the visual appearance of the tabs to be “pill” rather than traditional tabs. For example:

## A/B Testing {.tabset .tabset-fade .tabset-pills}

### Test A

(Test A Content)

### Test B

(Test B Content)
Exploratory Charts
On Exploratory Desktop, You can select Exploratory Charts when you writing Markdown note. Click Chart Icon on Toolbar.
This will open up Chart Selector Dialog like this.
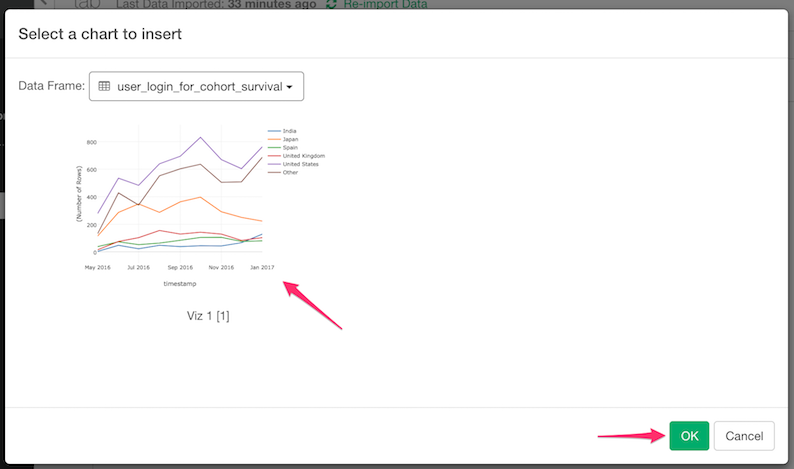
After you select a Chart and Click OK, following Exploratory Code block is inserted into your Markdown content. Syntax is /<dataframe_name>/<type>/<id>
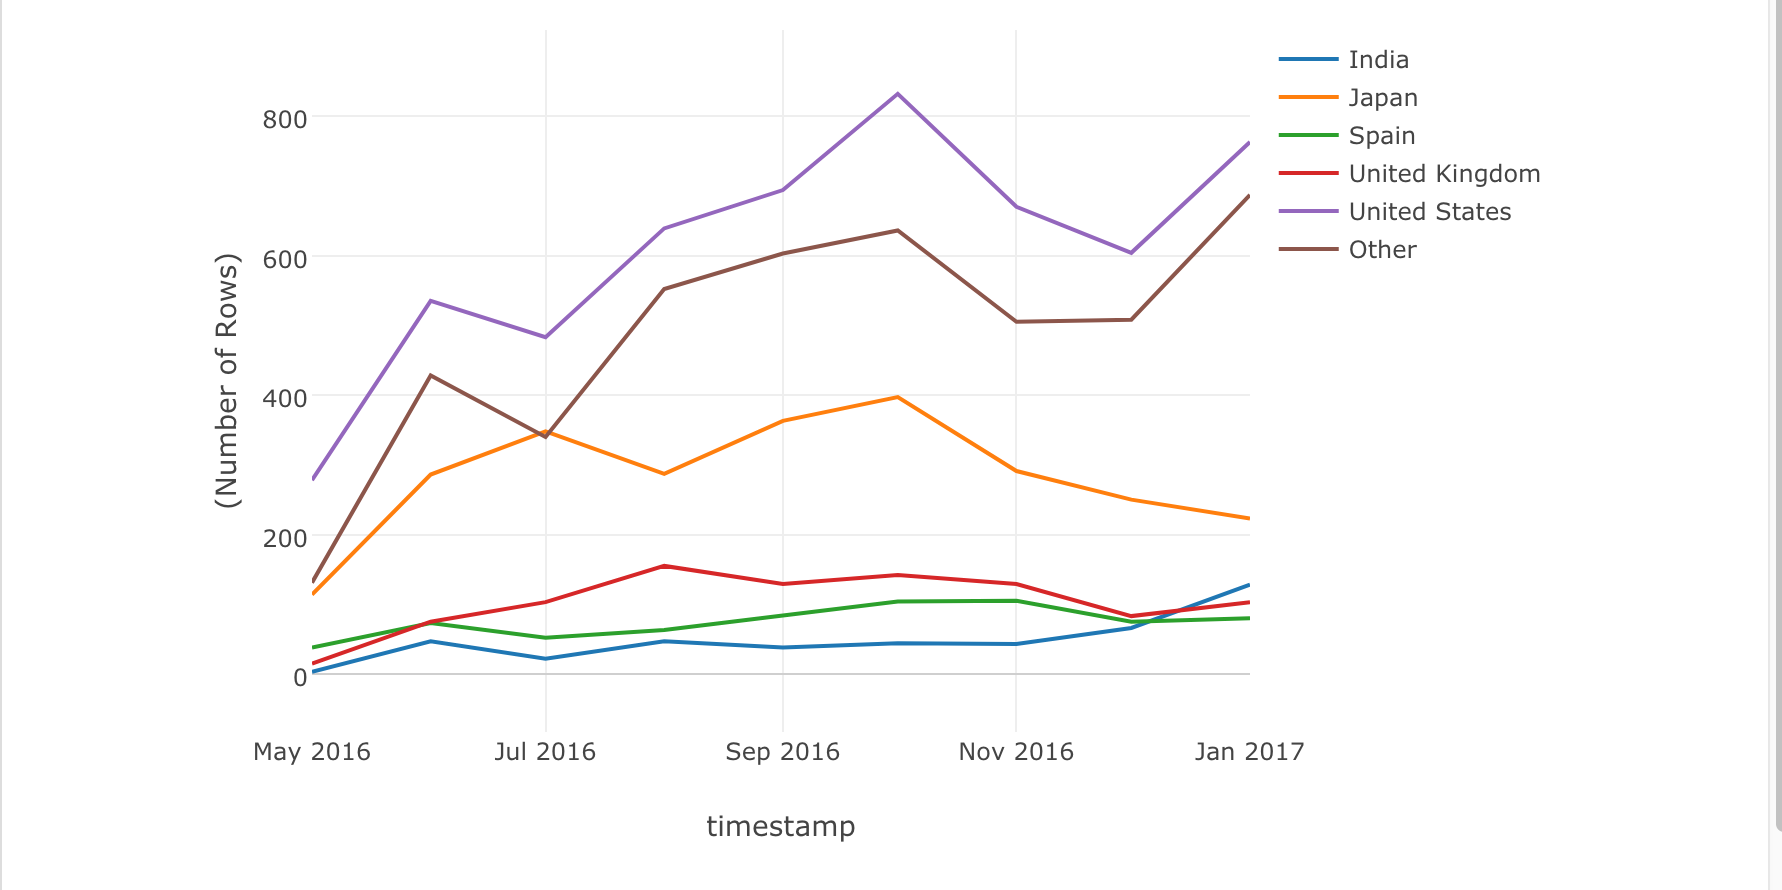
And when you click Run, this code block is converted to Exploratory Chart like below.
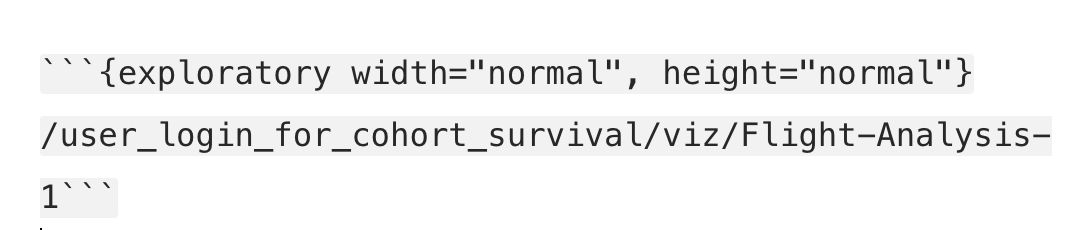
Customize Width
By default, the system sets the document area width to the chart width. You can customize the width by width property. You can set the width in following ways.
- width=“normal” (Default)
- width=“500px”
- width=“500” (Same as “500px”)
- width=“90%” (90% of the screen width)
- width=“full” (Same as the 100% of the screen width)
Example: 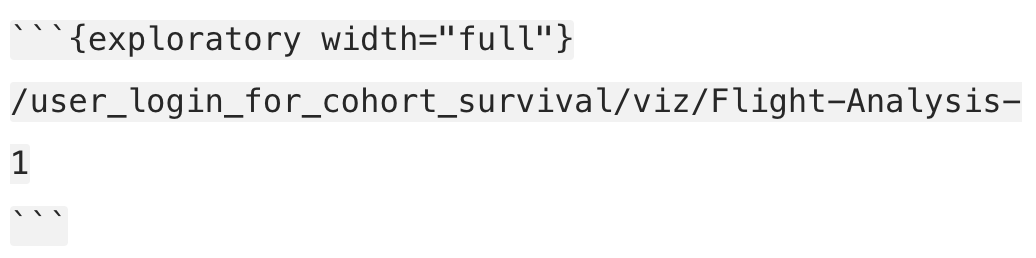
Customize Height
By default, the system calcualtes the chart height automatically based
on the chart width and screen size. You can customize the height by height parameter. You can set the height in following ways.
- height=“normal” (Default)
- height=“500px”
- height=“500” (Same as “500px”)
- height=“90%” (90% of the screen height)
- height=“full” (Same as the 100% of the screen height)
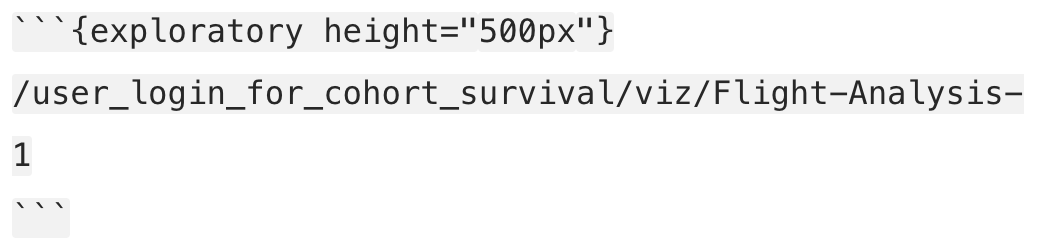
Example:
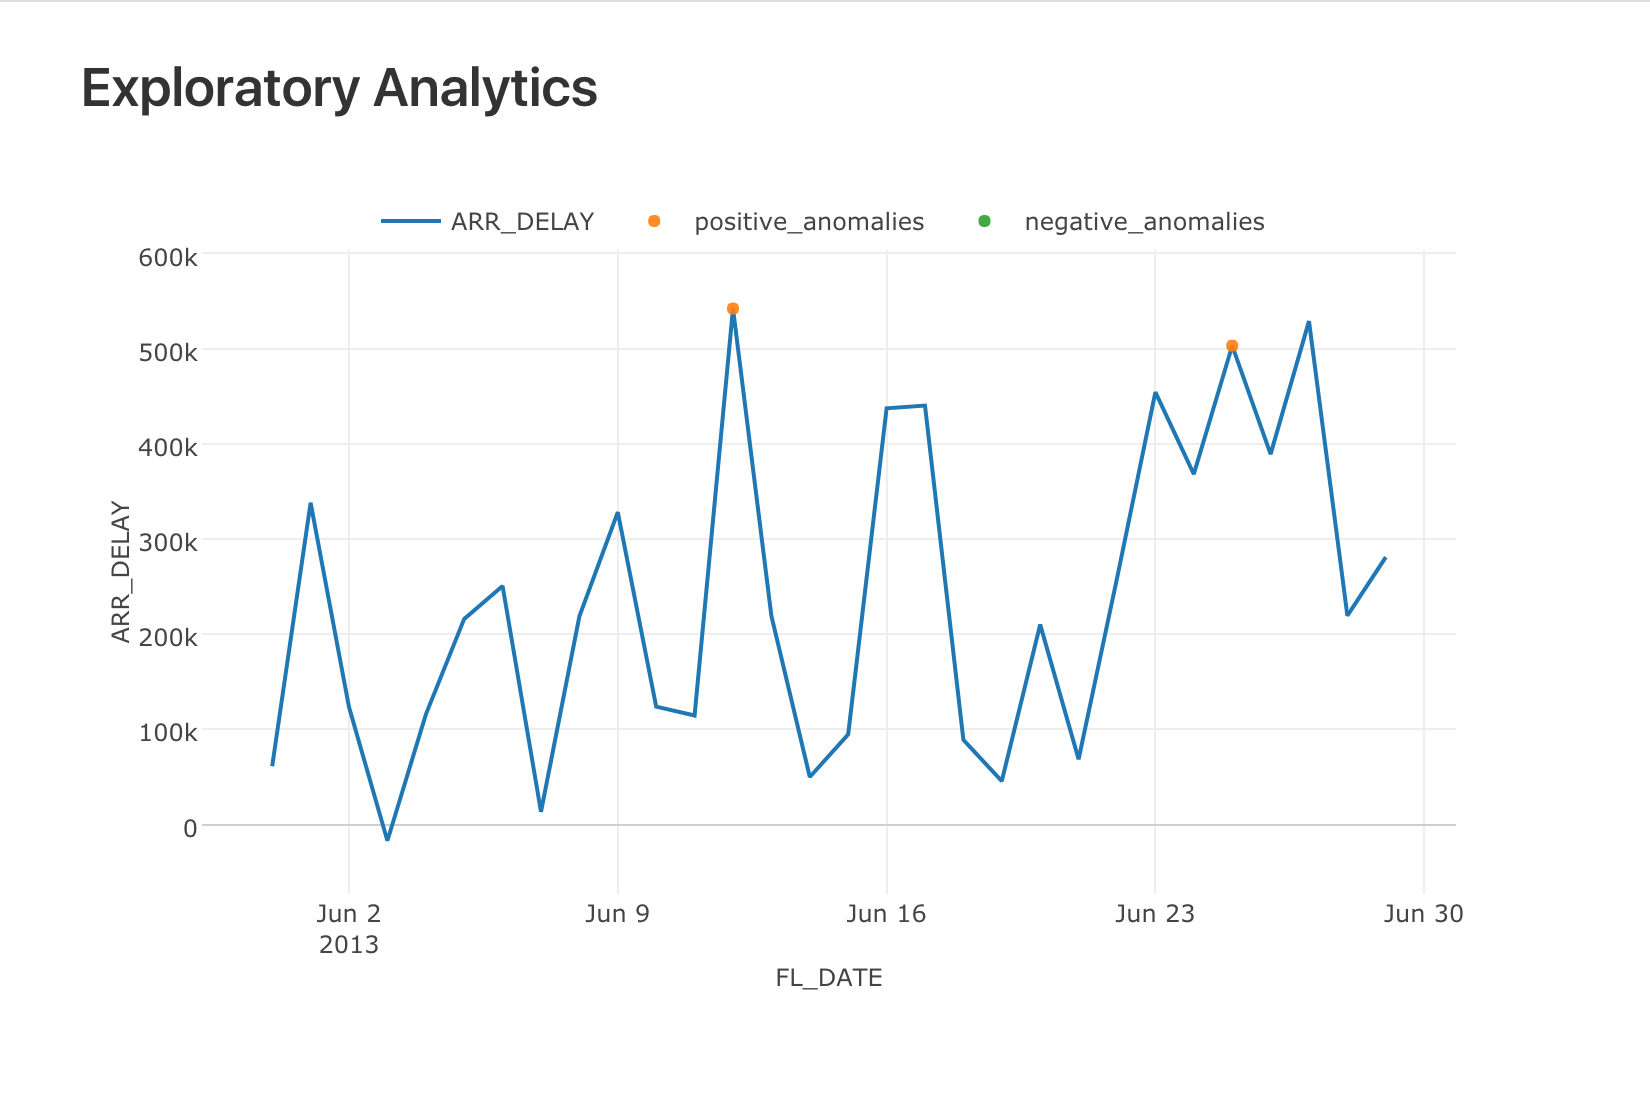
Exploratory Analytics Charts
On Exploratory Desktop, You can select Exploratory Analytics Viz when you writing Markdown note. Click Analytics Icon on Toolbar.
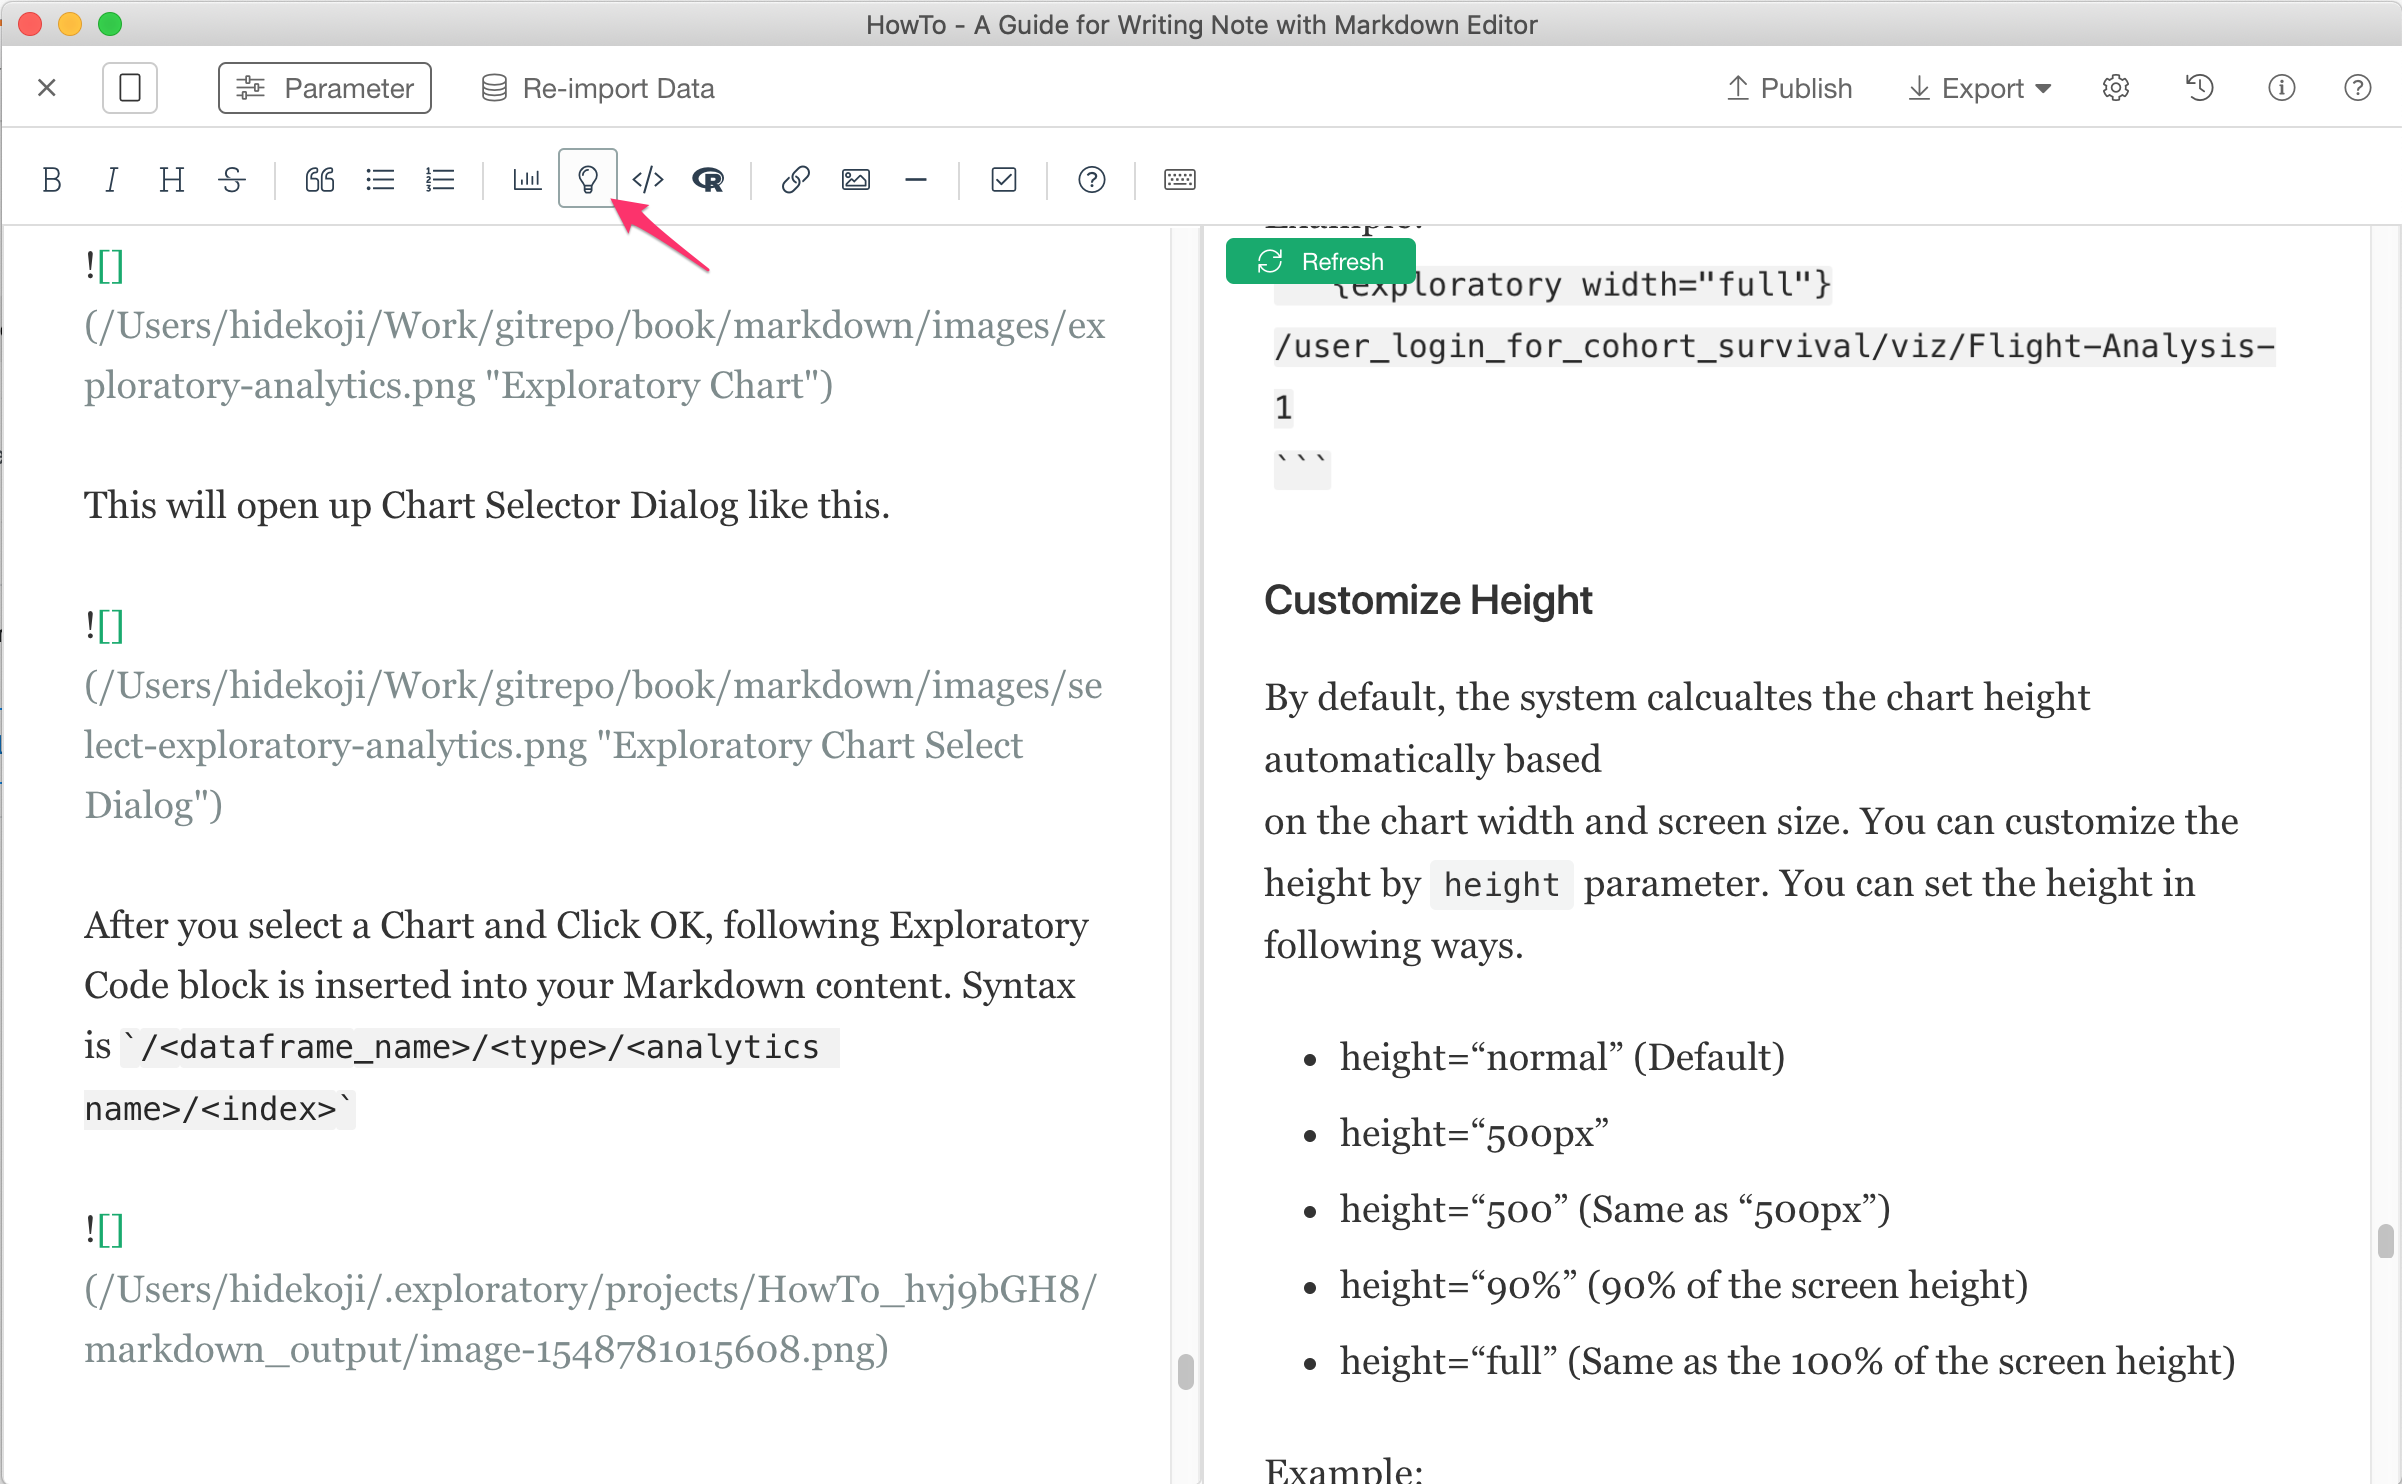
This will open up Chart Selector Dialog like this.
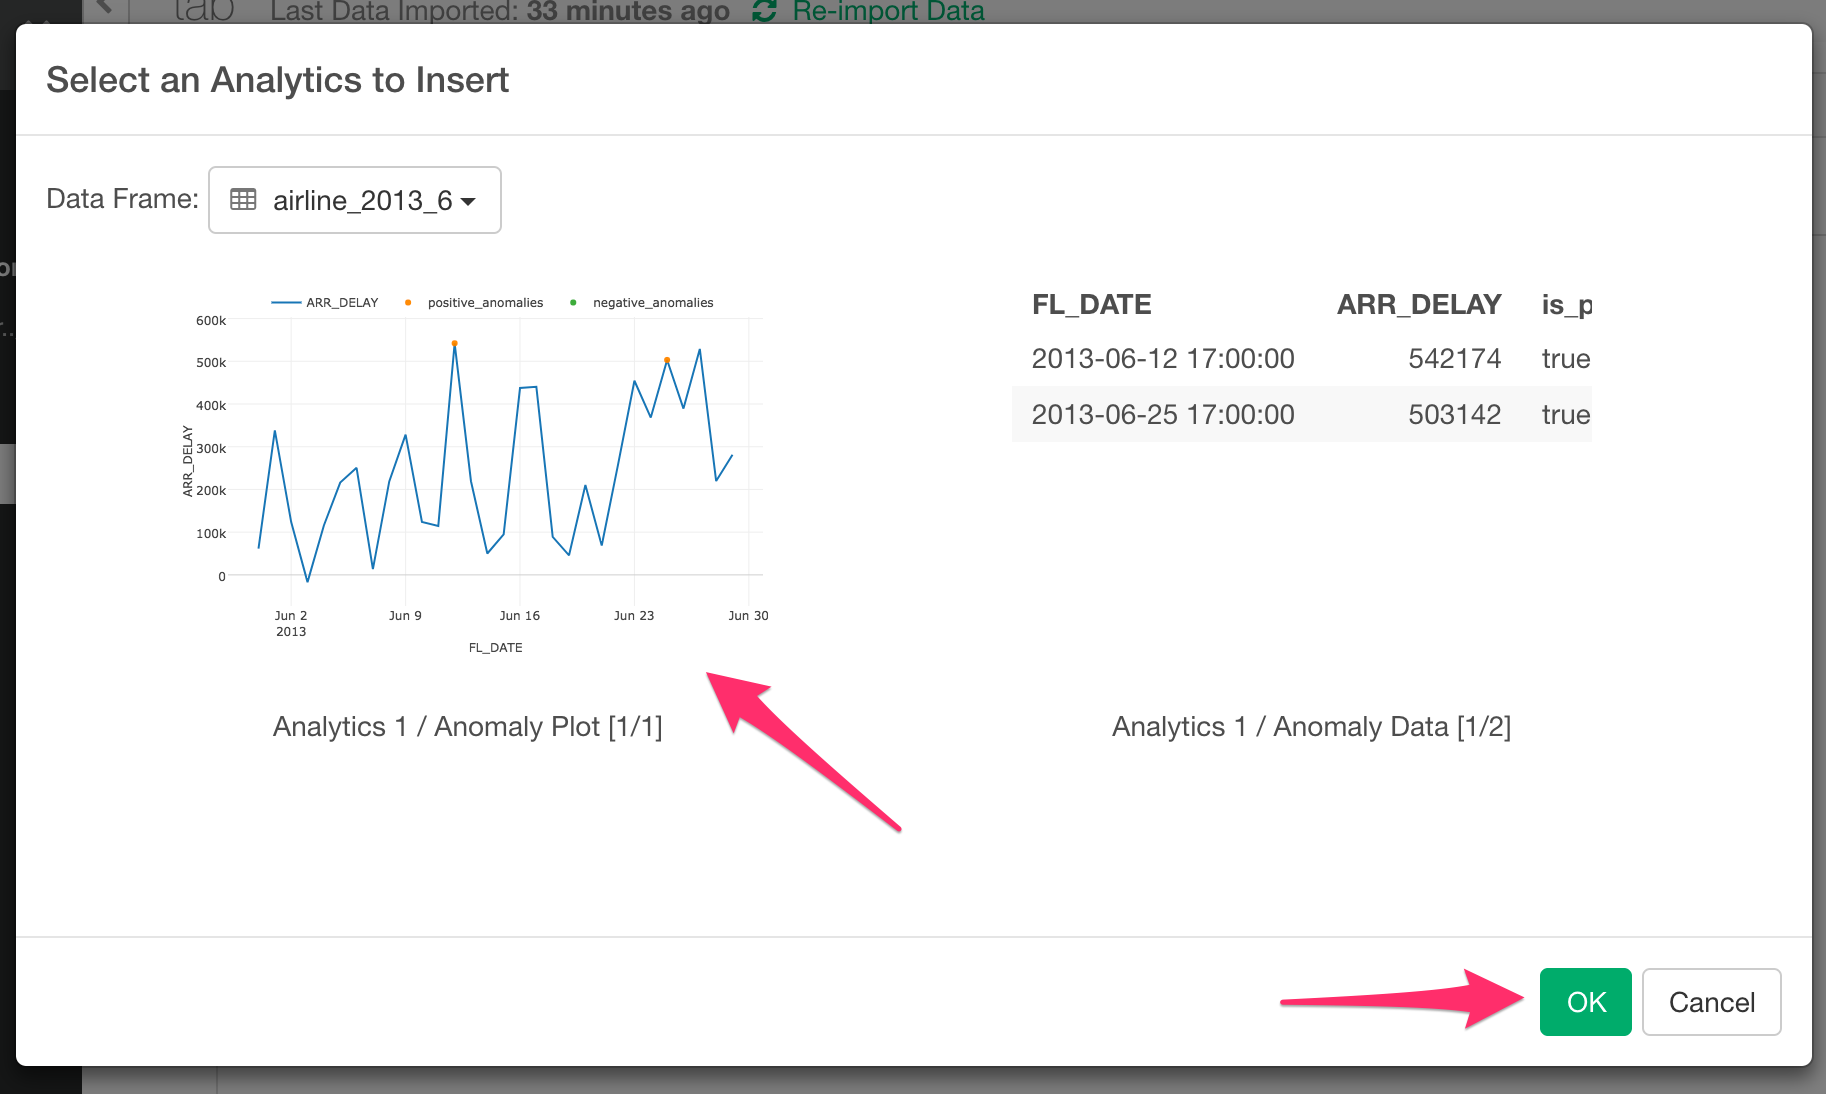
After you select a Chart and Click OK, following Exploratory Code block is inserted into your Markdown content. Syntax is /<dataframe_name>/<type>/<analytics name>/<index>
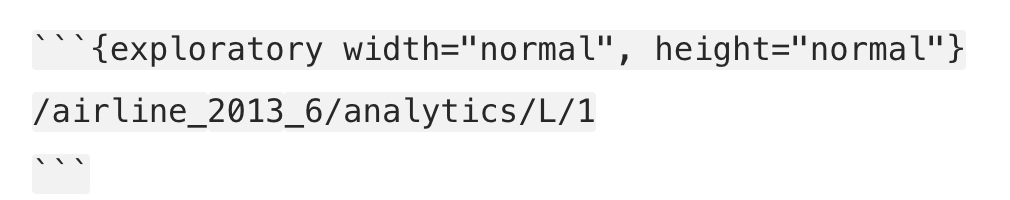
And when you click Run, this code block is converted to Exploratory Analytics Viz like below.
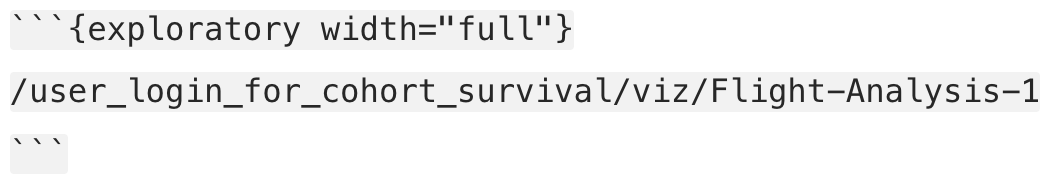
Customize Width
By default, the system sets the document area width to the chart width. You can customize the width by width property. You can set the width in following ways.
- width=“normal” (Default)
- width=“500px”
- width=“500” (Same as “500px”)
- width=“90%” (90% of the screen width)
- width=“full” (Same as the 100% of the screen width)
Example:
Customize Height
By default, the system calcualtes the chart height automatically based
on the chart width and screen size. You can customize the height by height parameter. You can set the height in following ways.
- height=“normal” (Default)
- height=“500px”
- height=“500” (Same as “500px”)
- height=“90%” (90% of the screen width)
- height=“full” (Same as the 100% of the screen width)
Example: 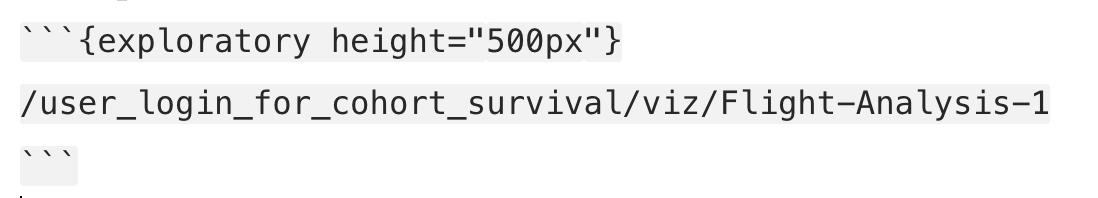
R Script - Code block
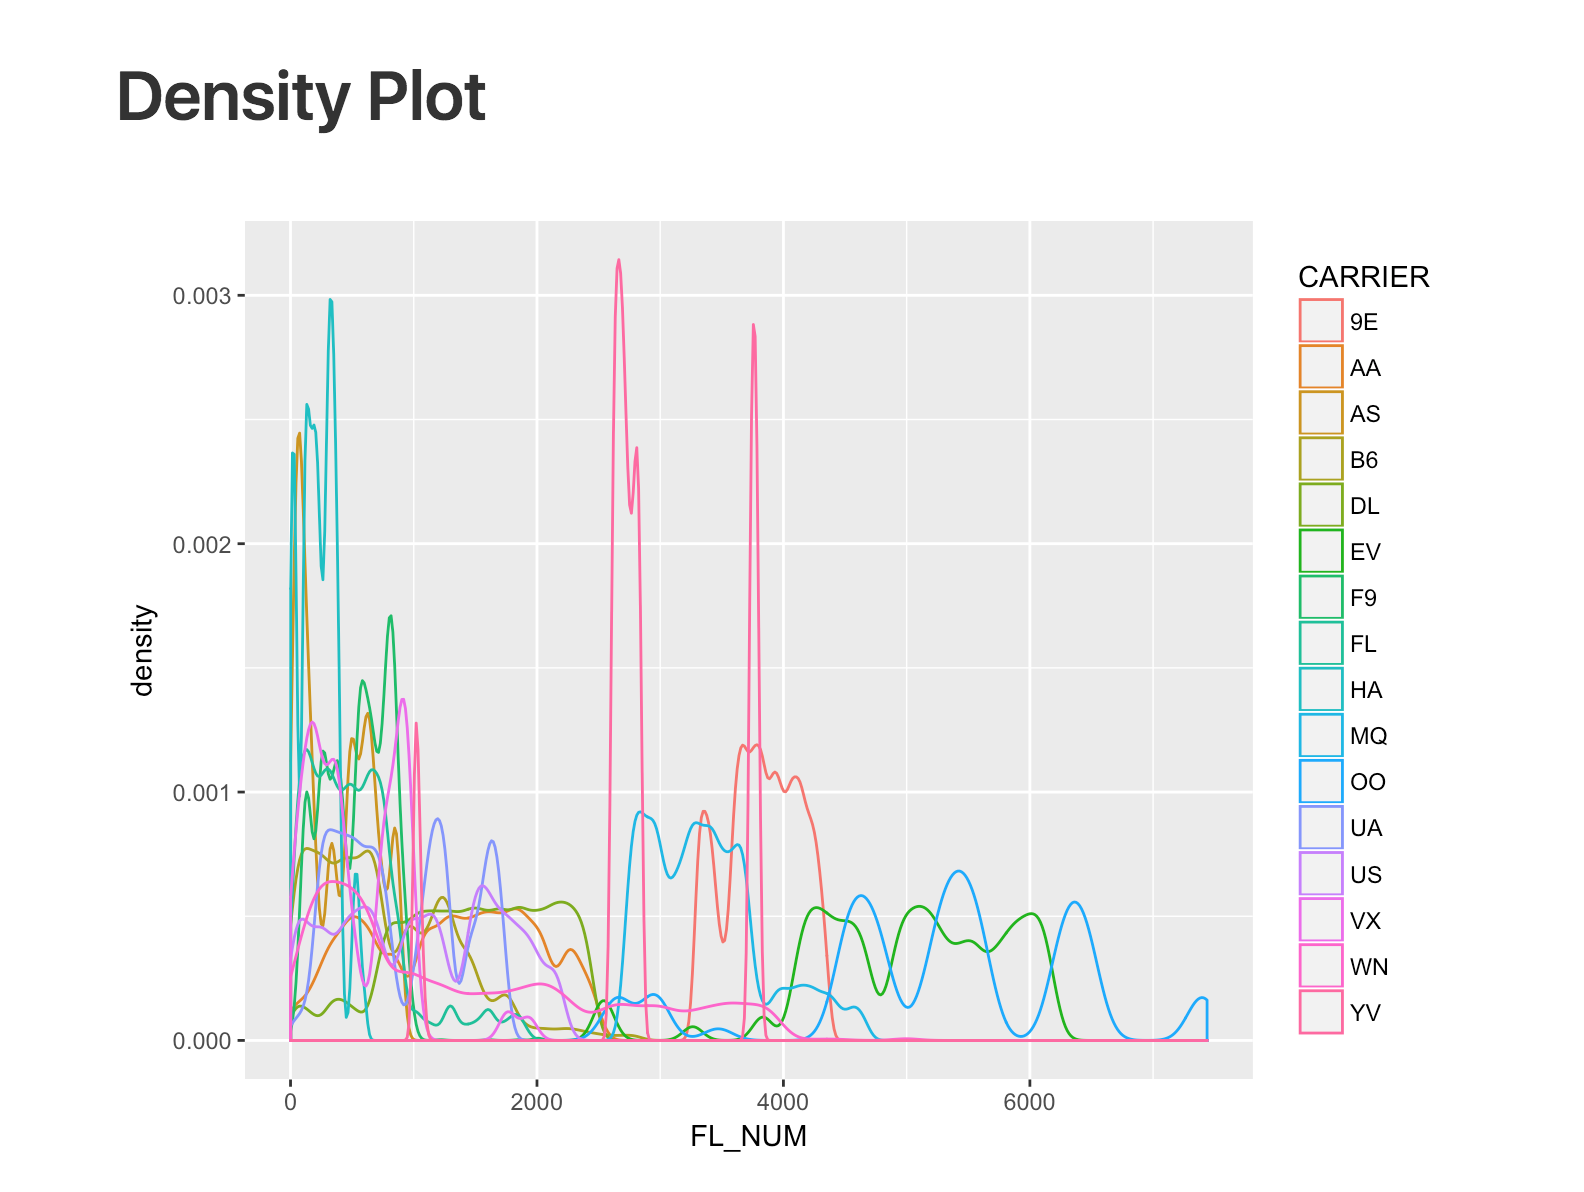
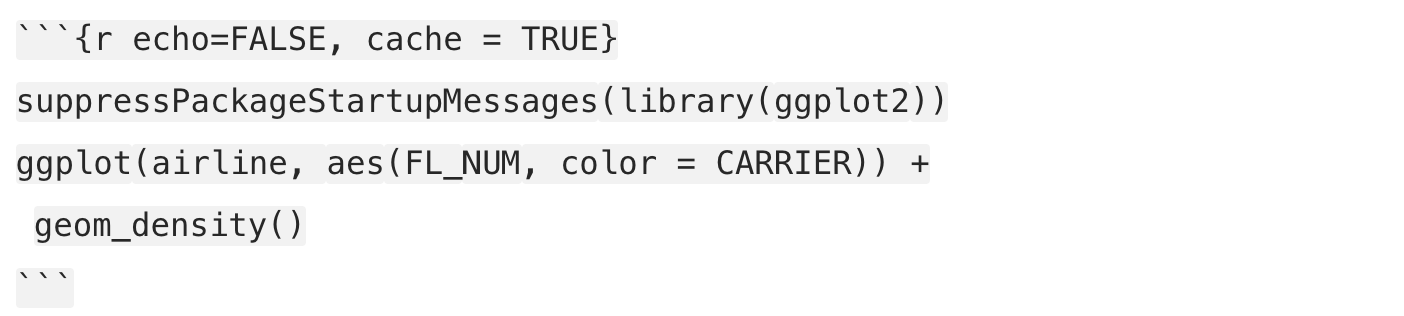
You can embed R codes inside R Code Blocks in order to run the R code on the fly and show the output. The output can be text, or graphical output. Here is an example of the density chart generated by ‘ggplot2’ package.
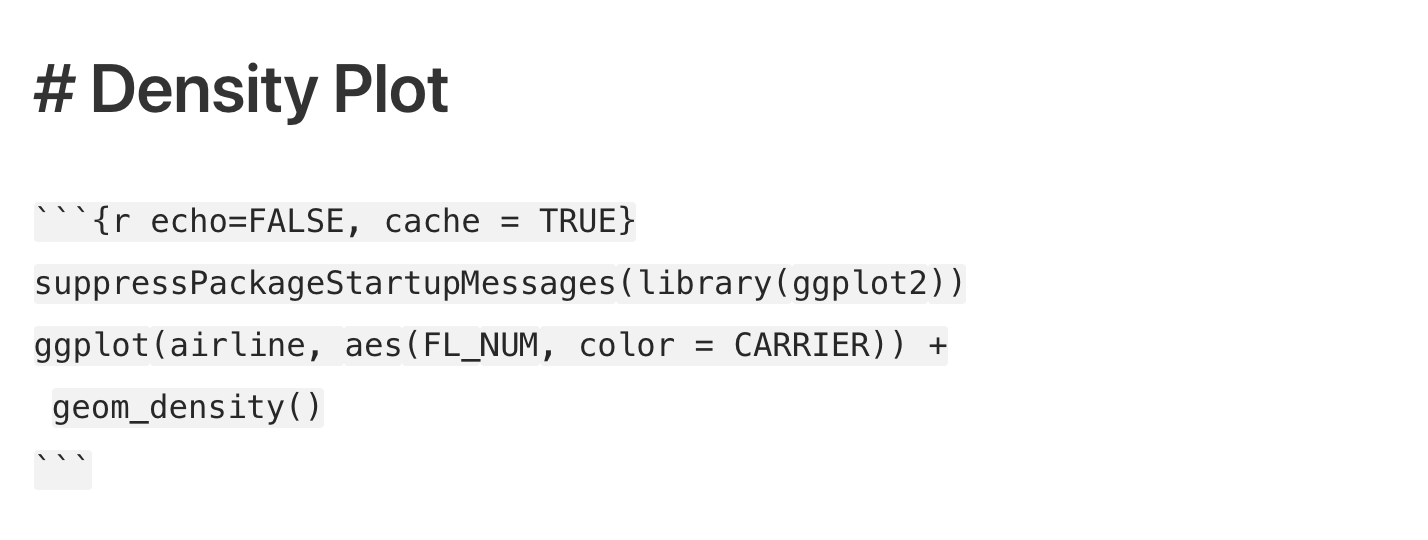
And the result would look like this.
Hide R Code in the Output
By default, each R code block shows its command itself. You can set “echo=FALSE” to disable it.
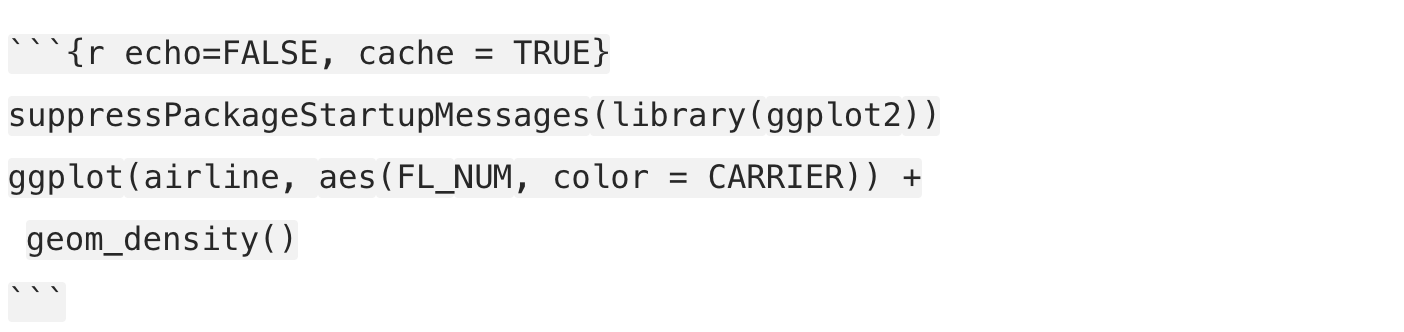
Hide Warning Messages from R Code Block
Sometimes R commands throw warning messages along with the output. By default, R code block shows those warning messages if any. You can set “warning=FALSE” to hide it.
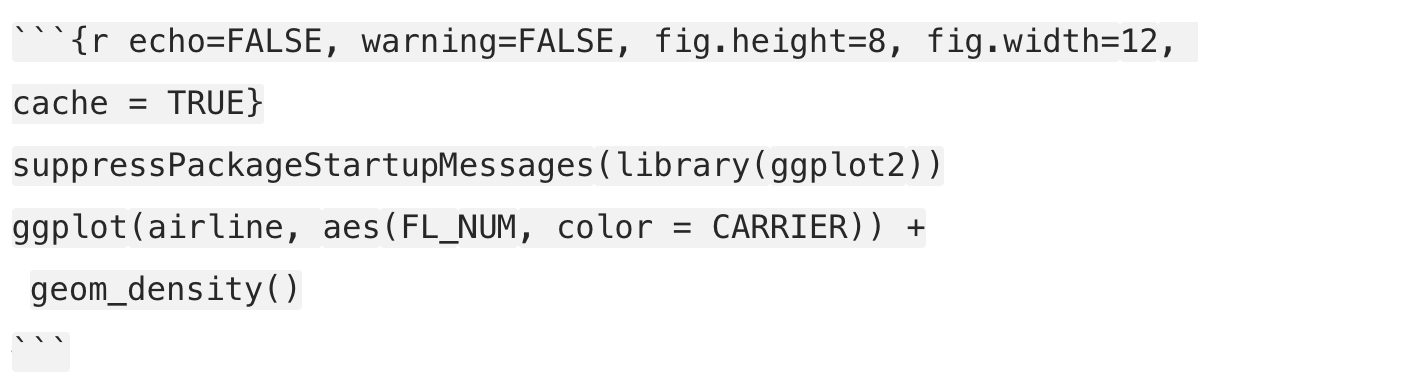
Set a Canvas Size for Graphical Outputs
You can set the canvas size for the graphical output by setting “fig.height” and “fig.width” parameters. The unit is inch. Default is fig.height=5 and fig.width=7.
R Script - Inline
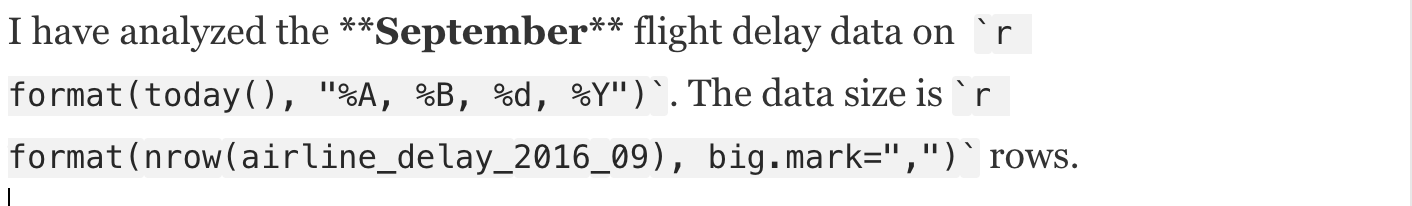
This inline code becomes like this.
I have analyzed the September flight delay data on Monday, September, 04, 2017. The data size is 1,000 rows.Export to HTML/Word/EDF
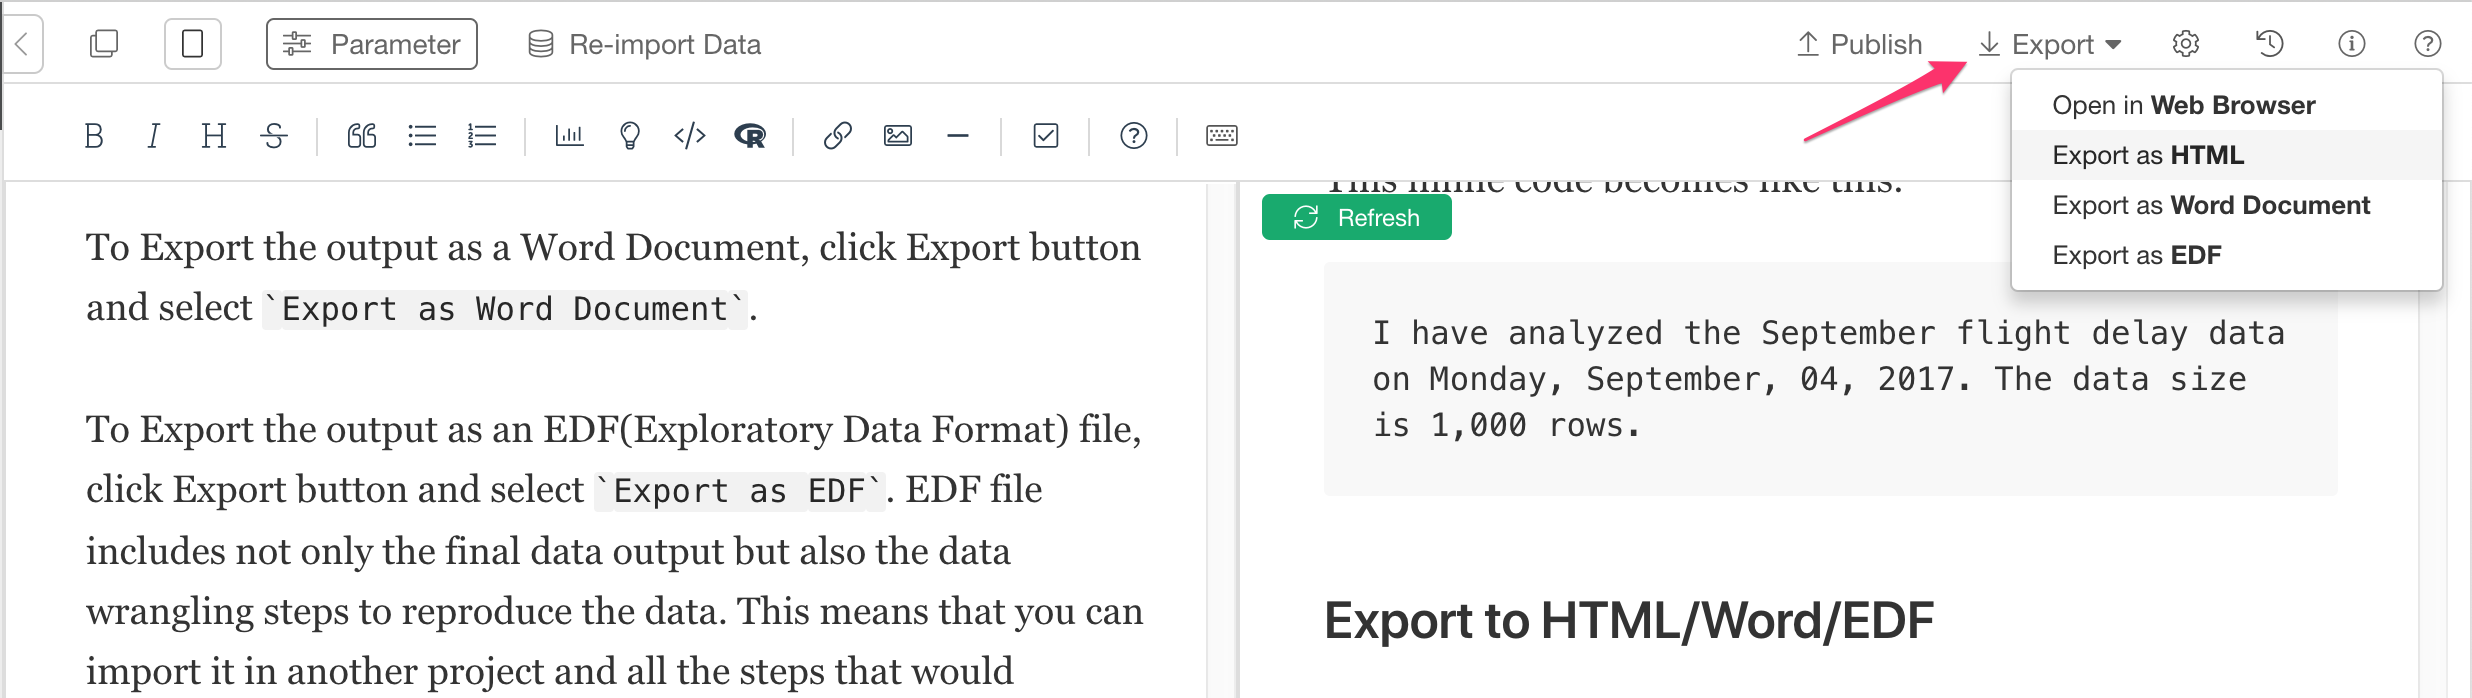
To Export the output as an HTML, click Export button and select Export as HTML.
To Export the output as a Word Document, click Export button and select Export as Word Document.
To Export the output as an EDF(Exploratory Data Format) file, click Export button and select Export as EDF. EDF file includes not only the final data output but also the data wrangling steps to reproduce the data. This means that you can import it in another project and all the steps that would produce the data will be reproduced and shown at the right hand side. This would be useful when others want to not only see the data but also want to understand how the data wrangling has been done and want to update the steps.
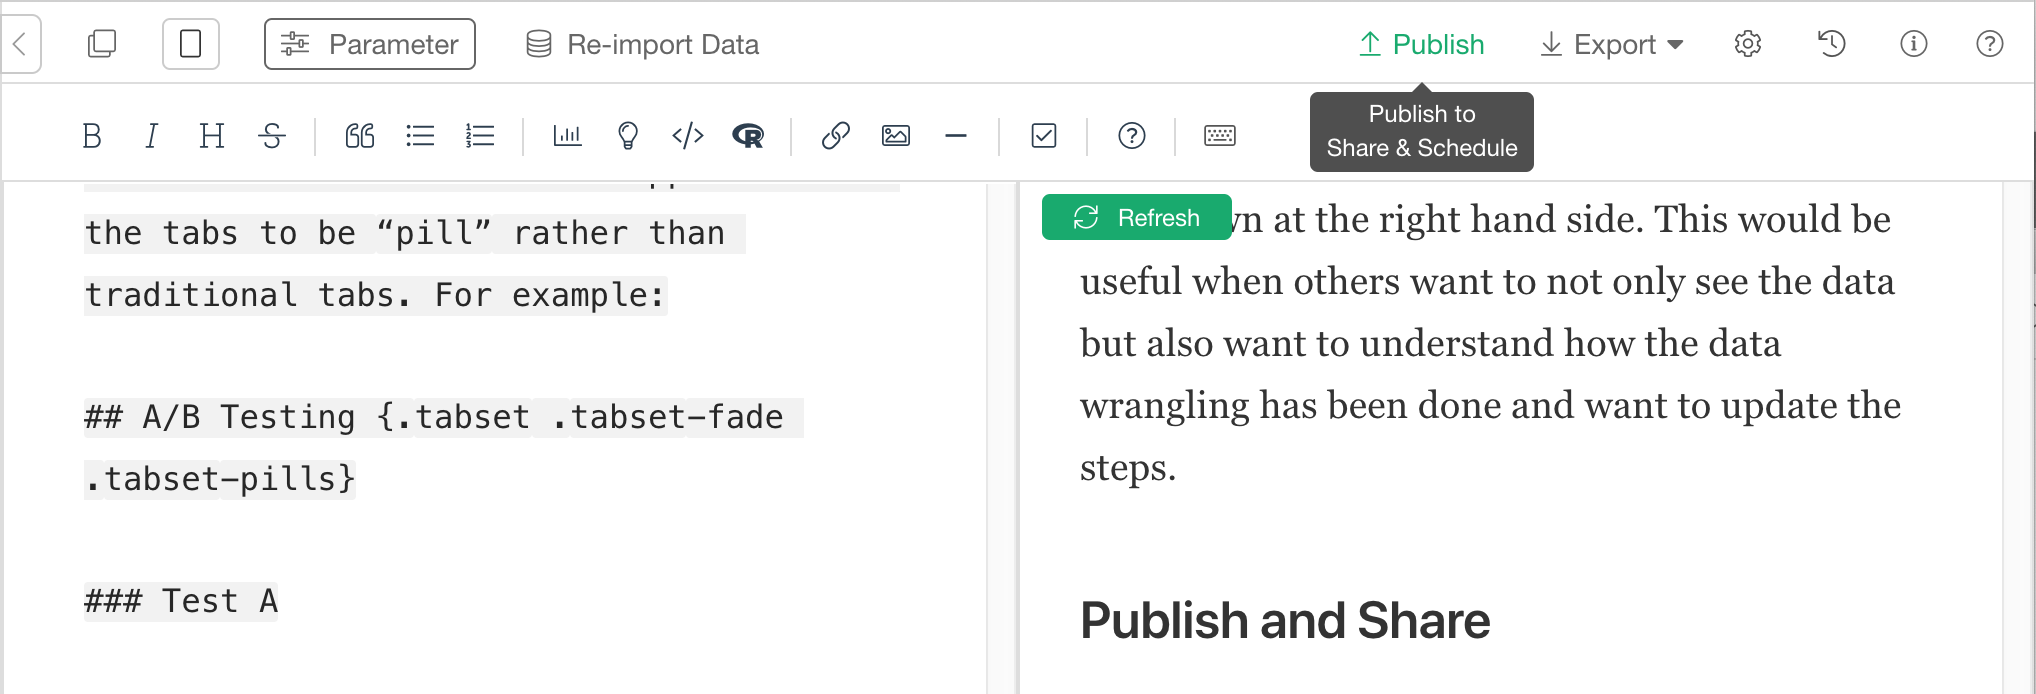
Publish and Share
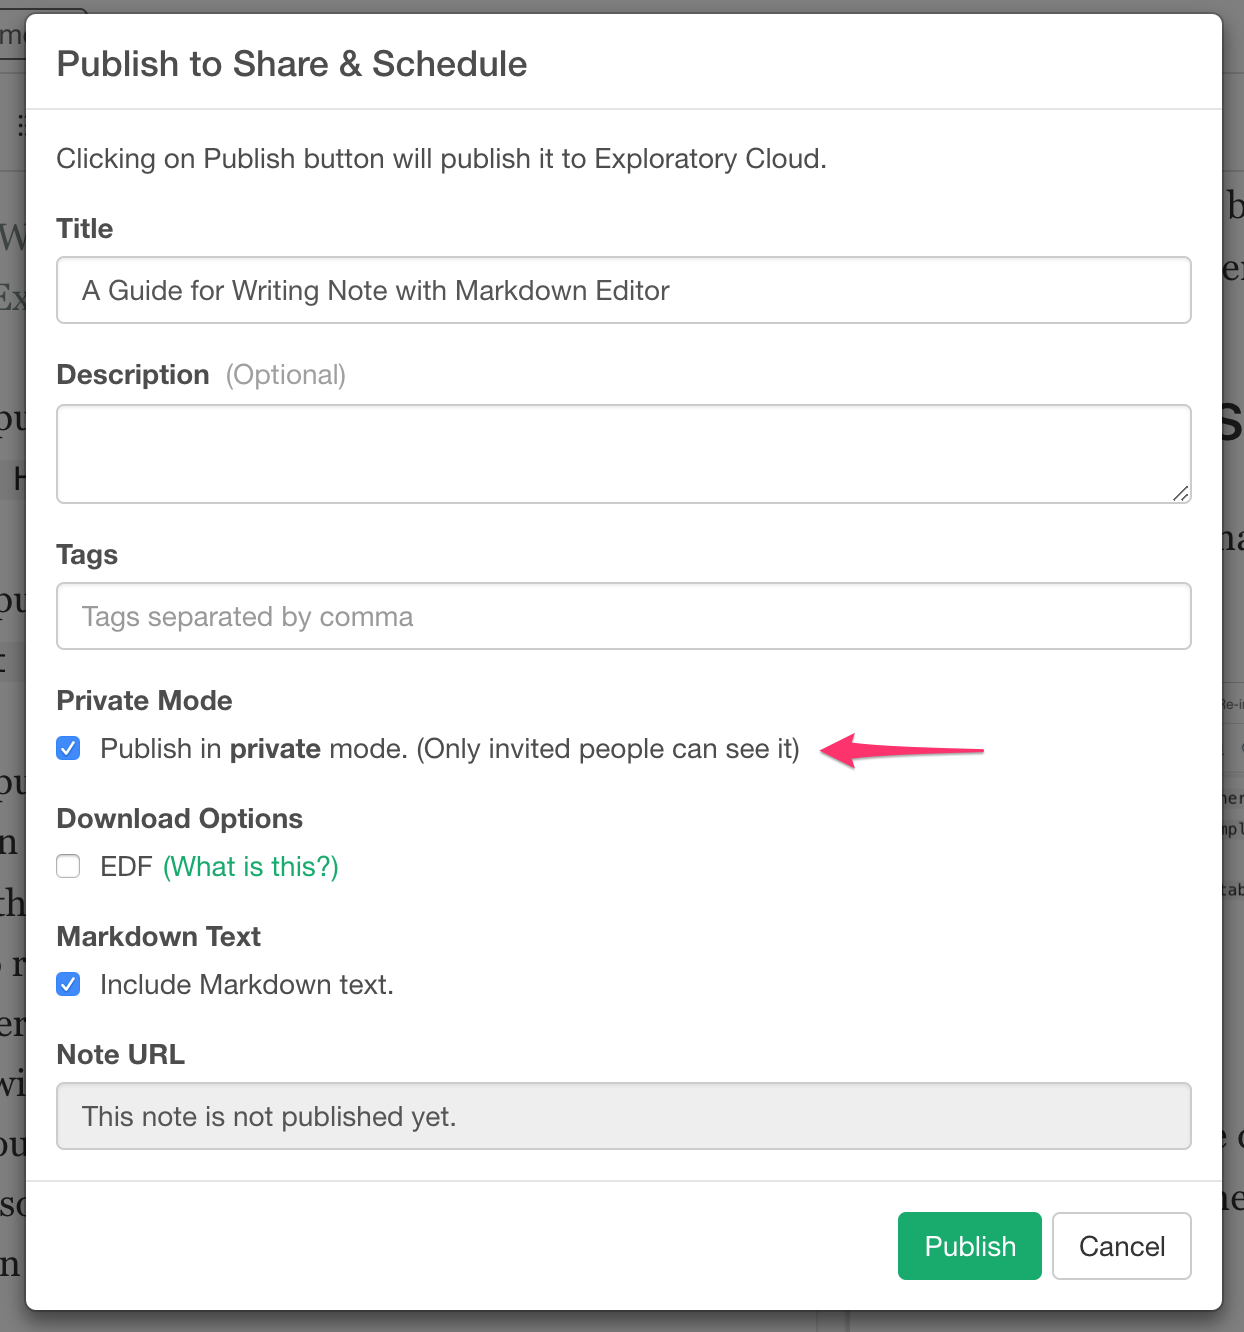
To publish and share your Markdown Note, click Share button.
And on the Share dialog, check ‘Private’ if you want to privately share the Markdown Note and Click Share button.