How to Add Comments to Charts and Analytics and include them on Notes
Starting from Exploratory Desktop version 5.2, you can add comments to your Charts and Analytics and use them to create Notes and Slides.
Chart
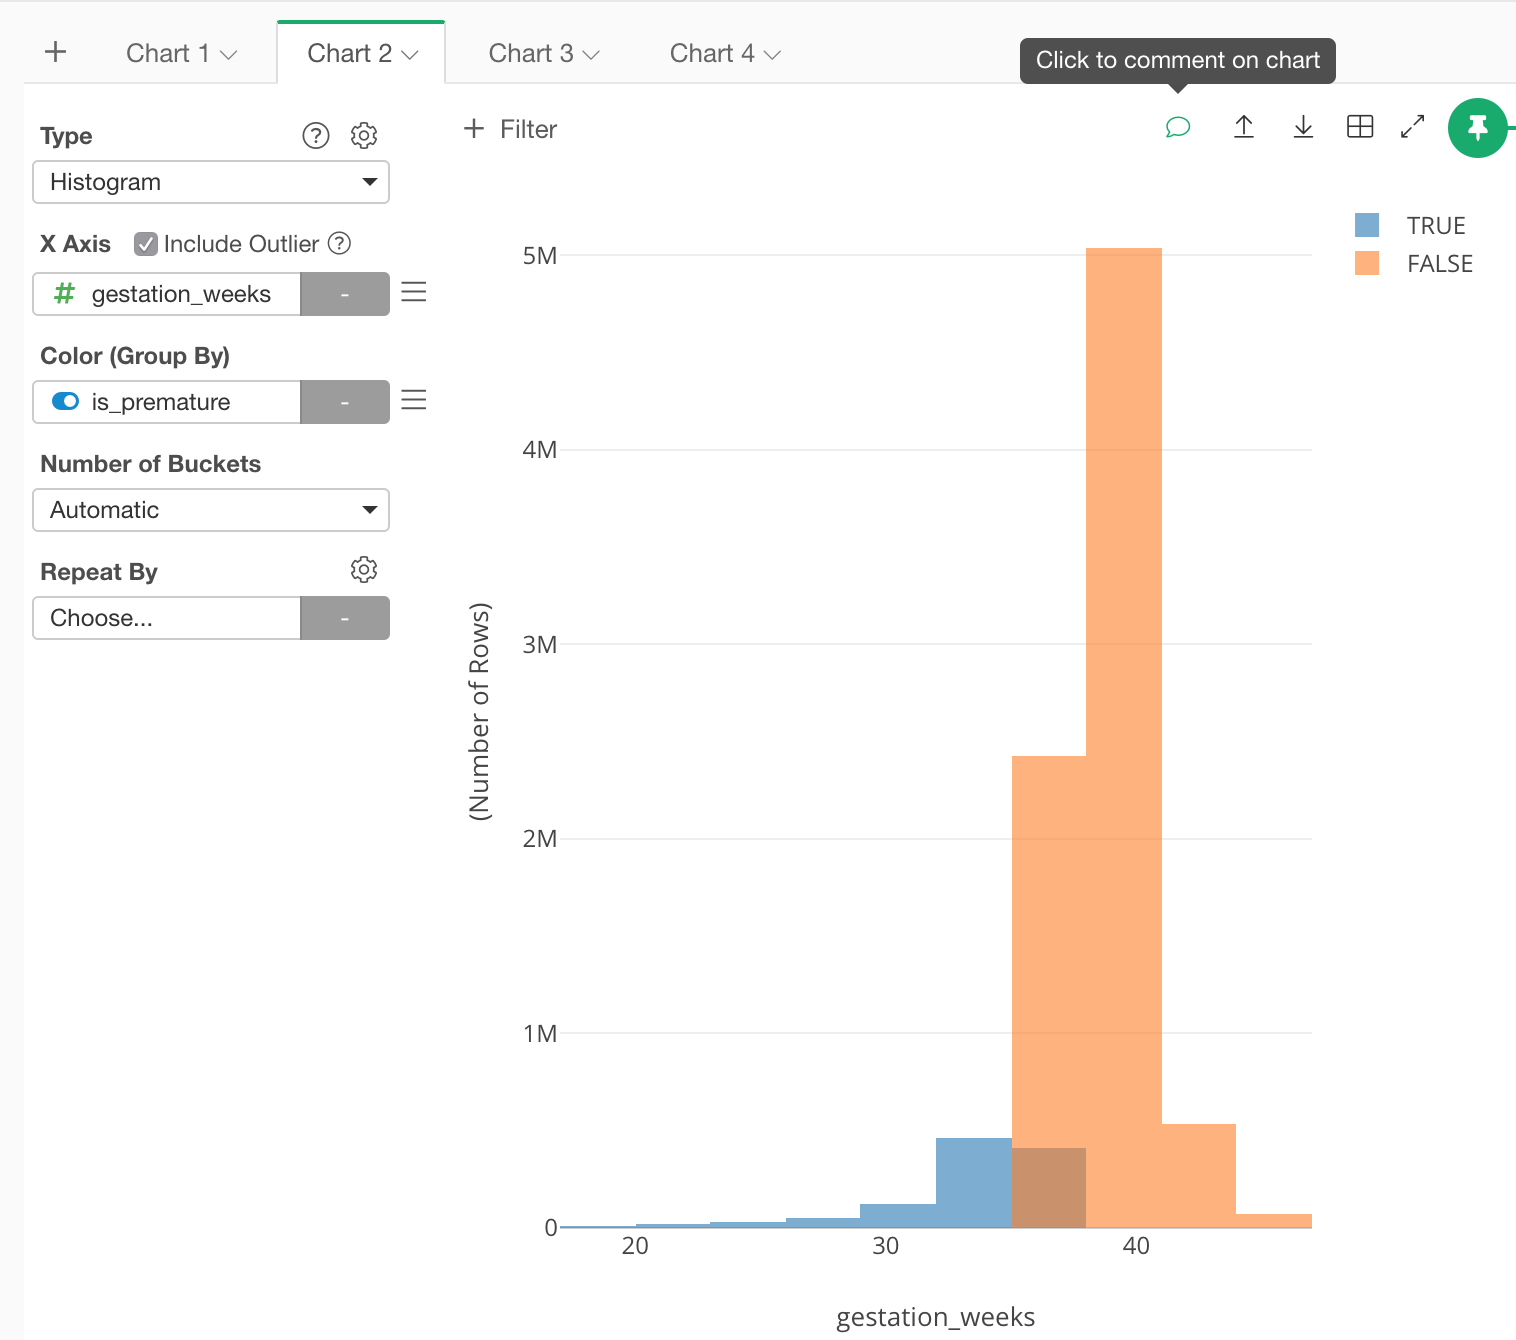
To add comment to your Chart, click the comment icon on the top right hand side of the chart area.
On the Name / Comment Dialog, you can set Chart Name and Comment.
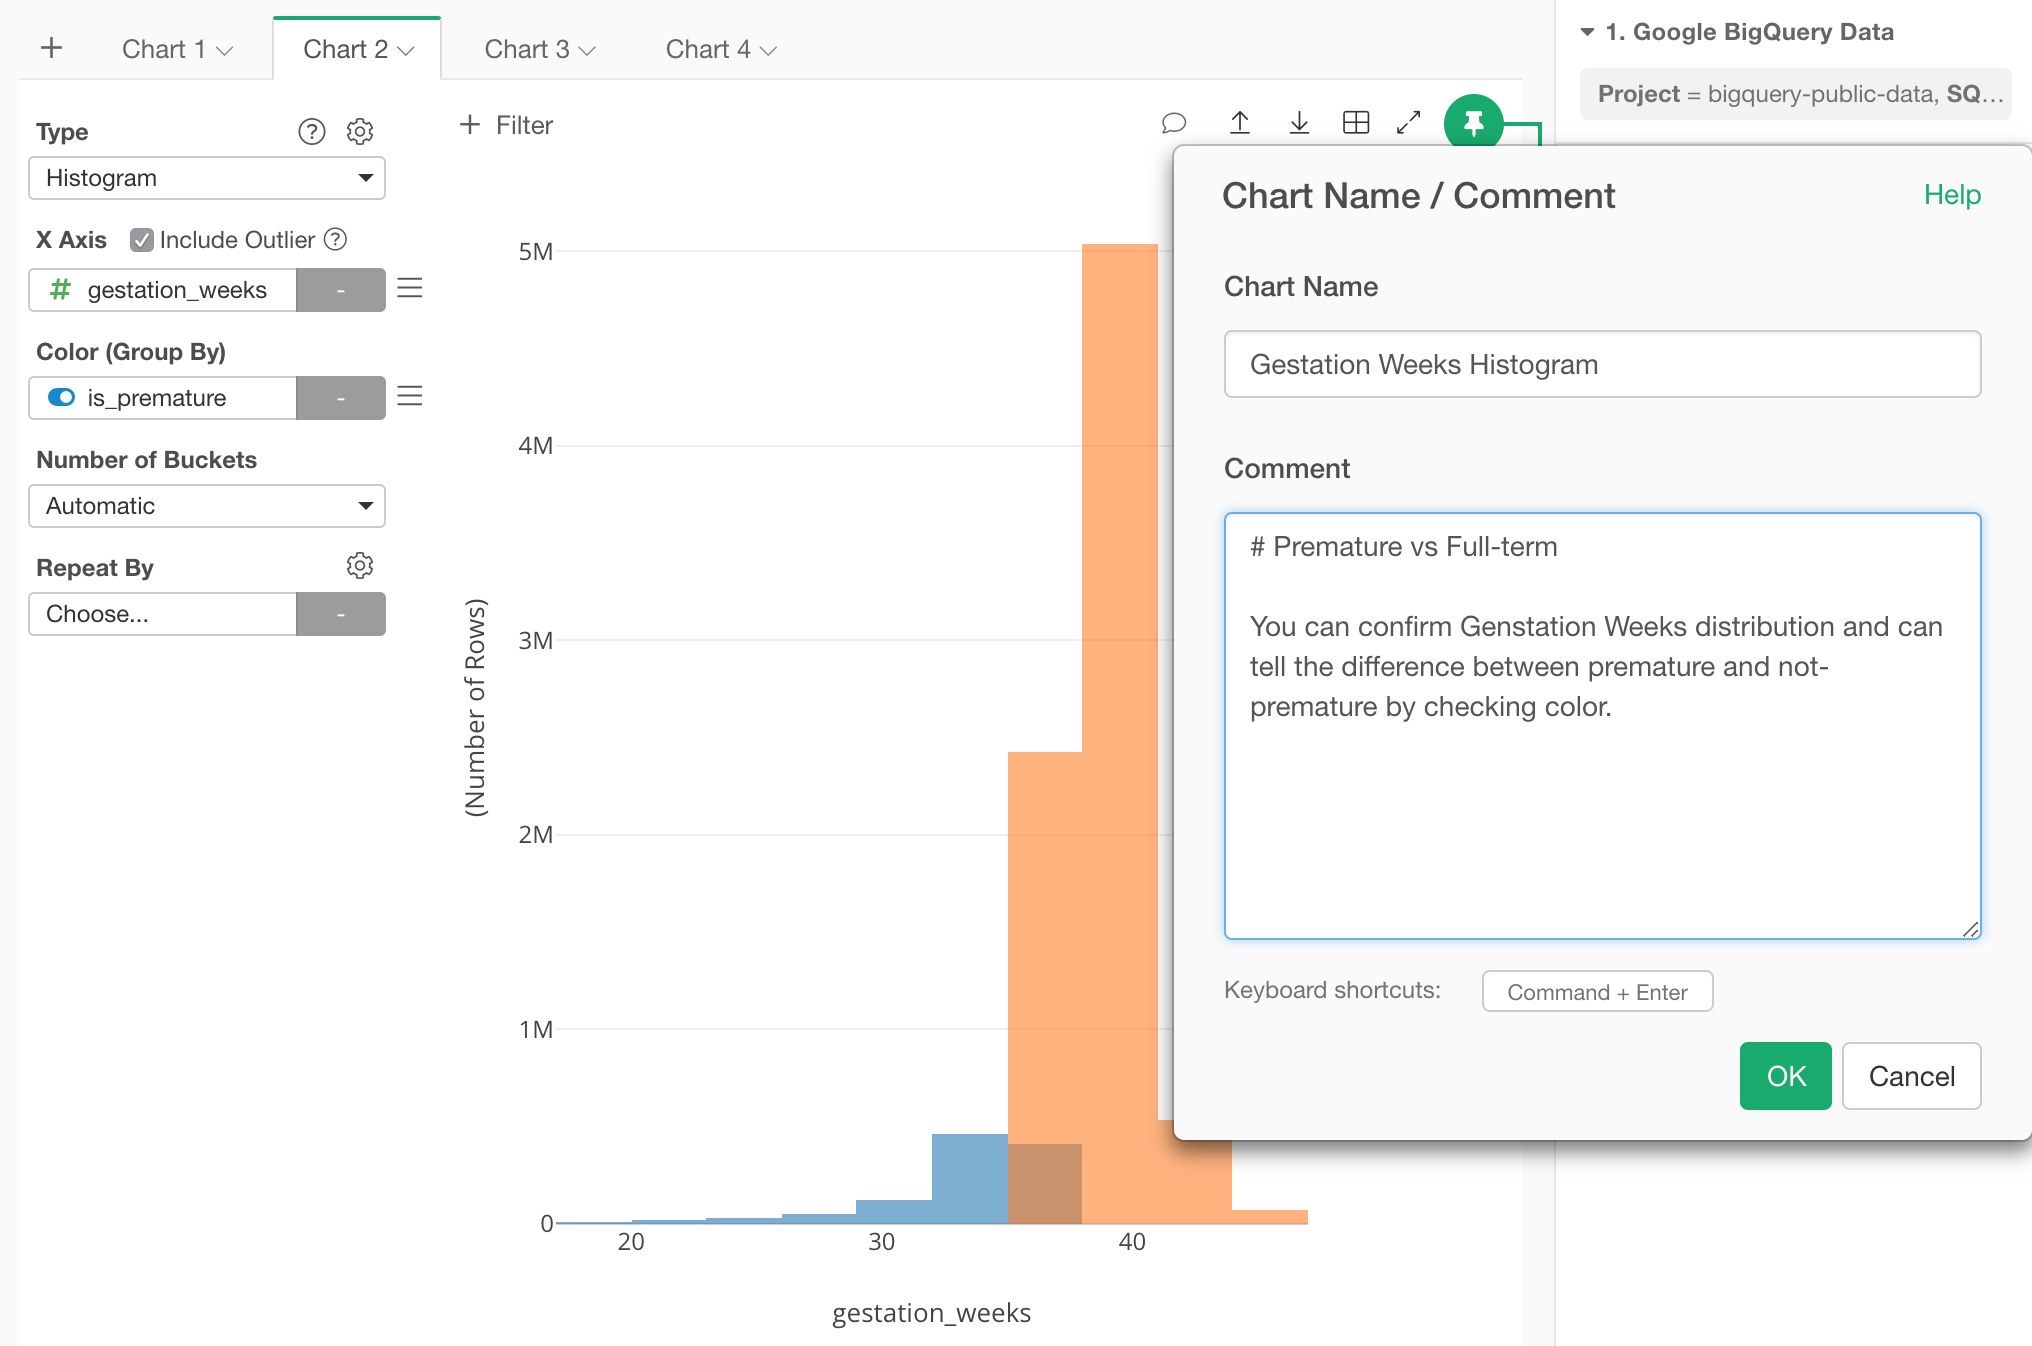
As for comment, you can use Markdown to markup your text.
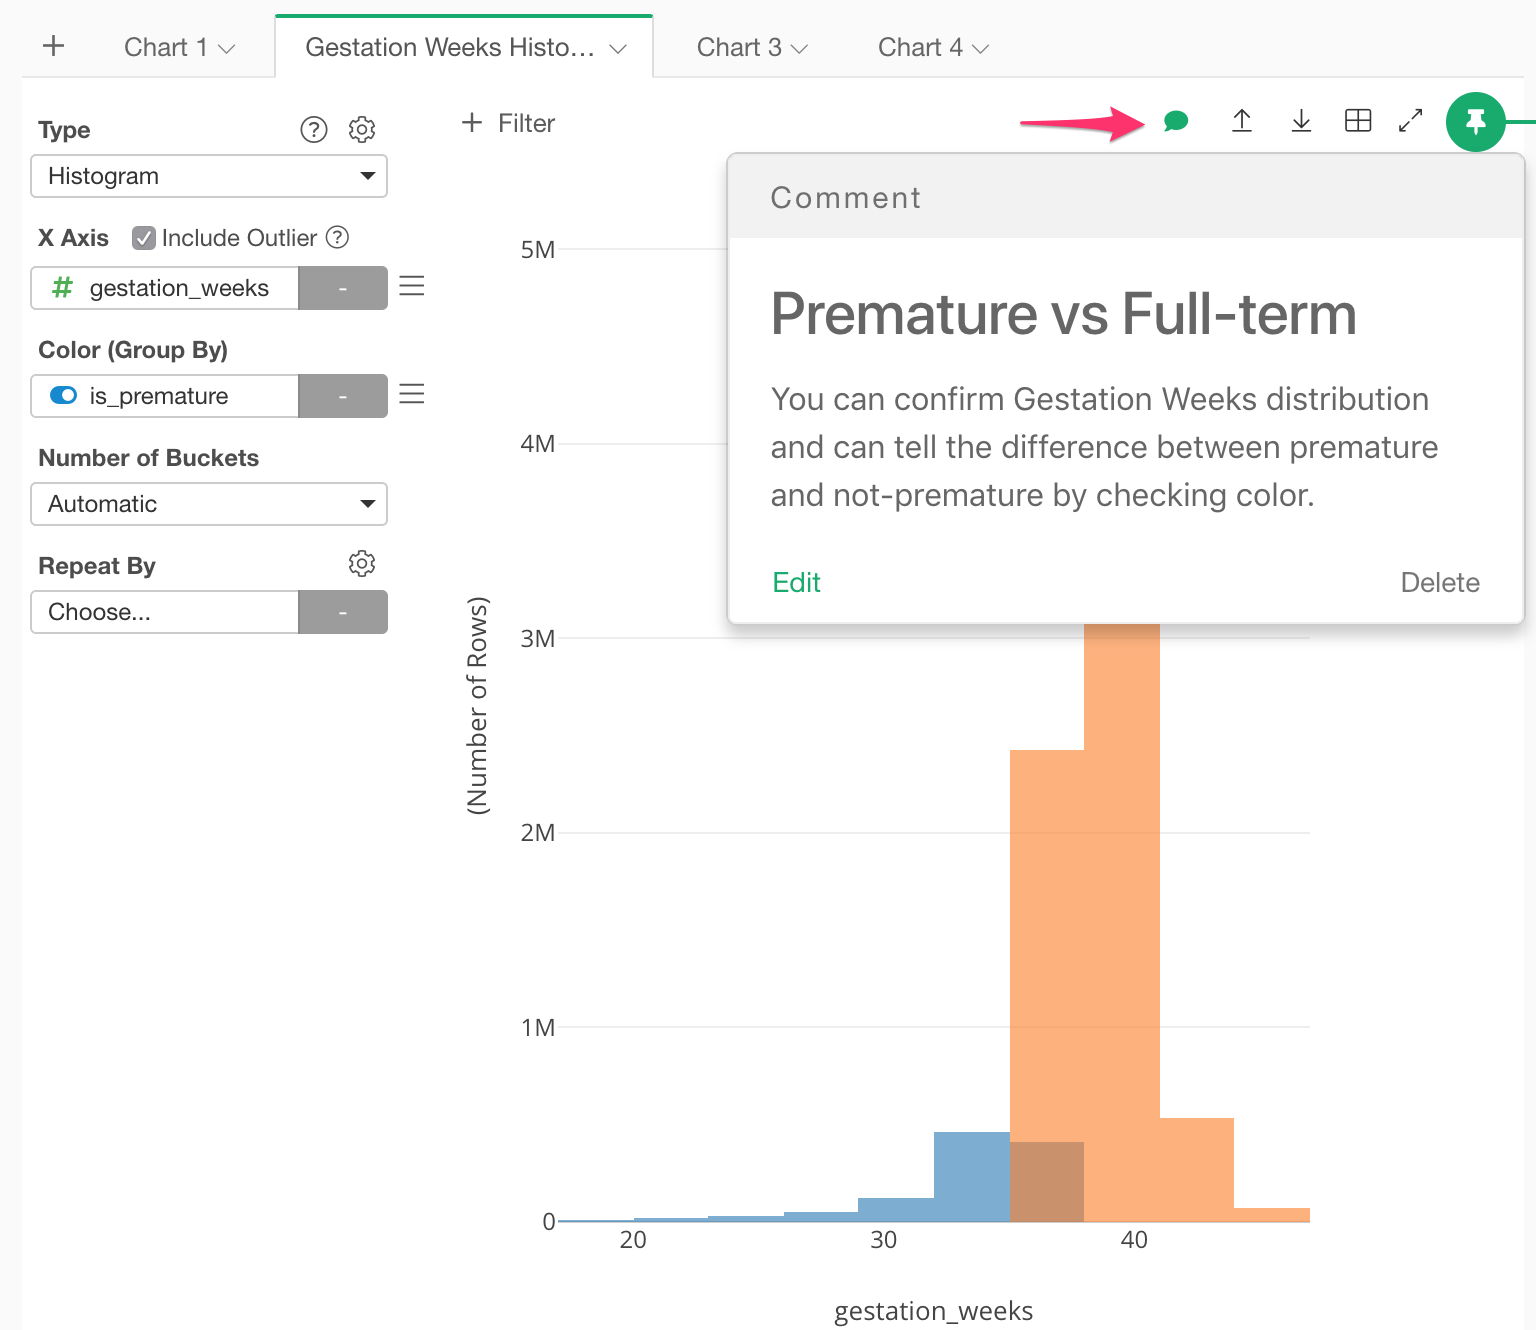
Once finished, click OK button and now comment icon’s color changes to green. By hovering the green comment icon, you can check your comment.
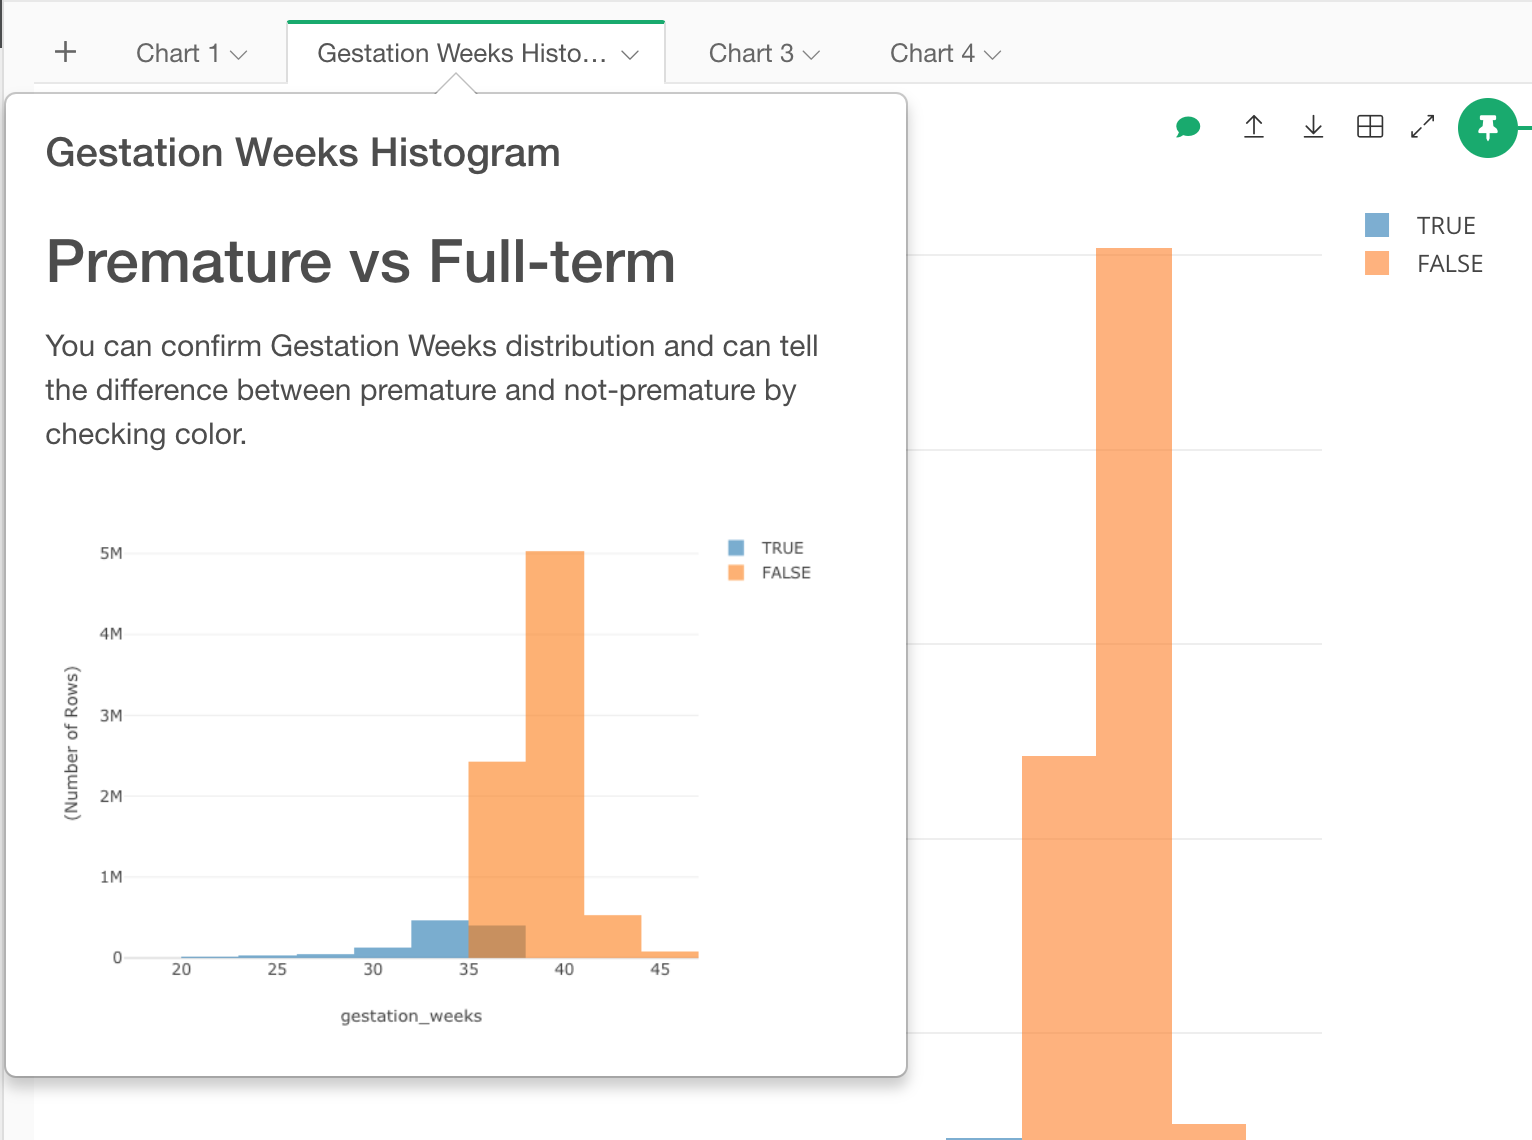
Also, if you mouse over the Chart tab, you can check your comment along with the chart thumbnail.
Analytics
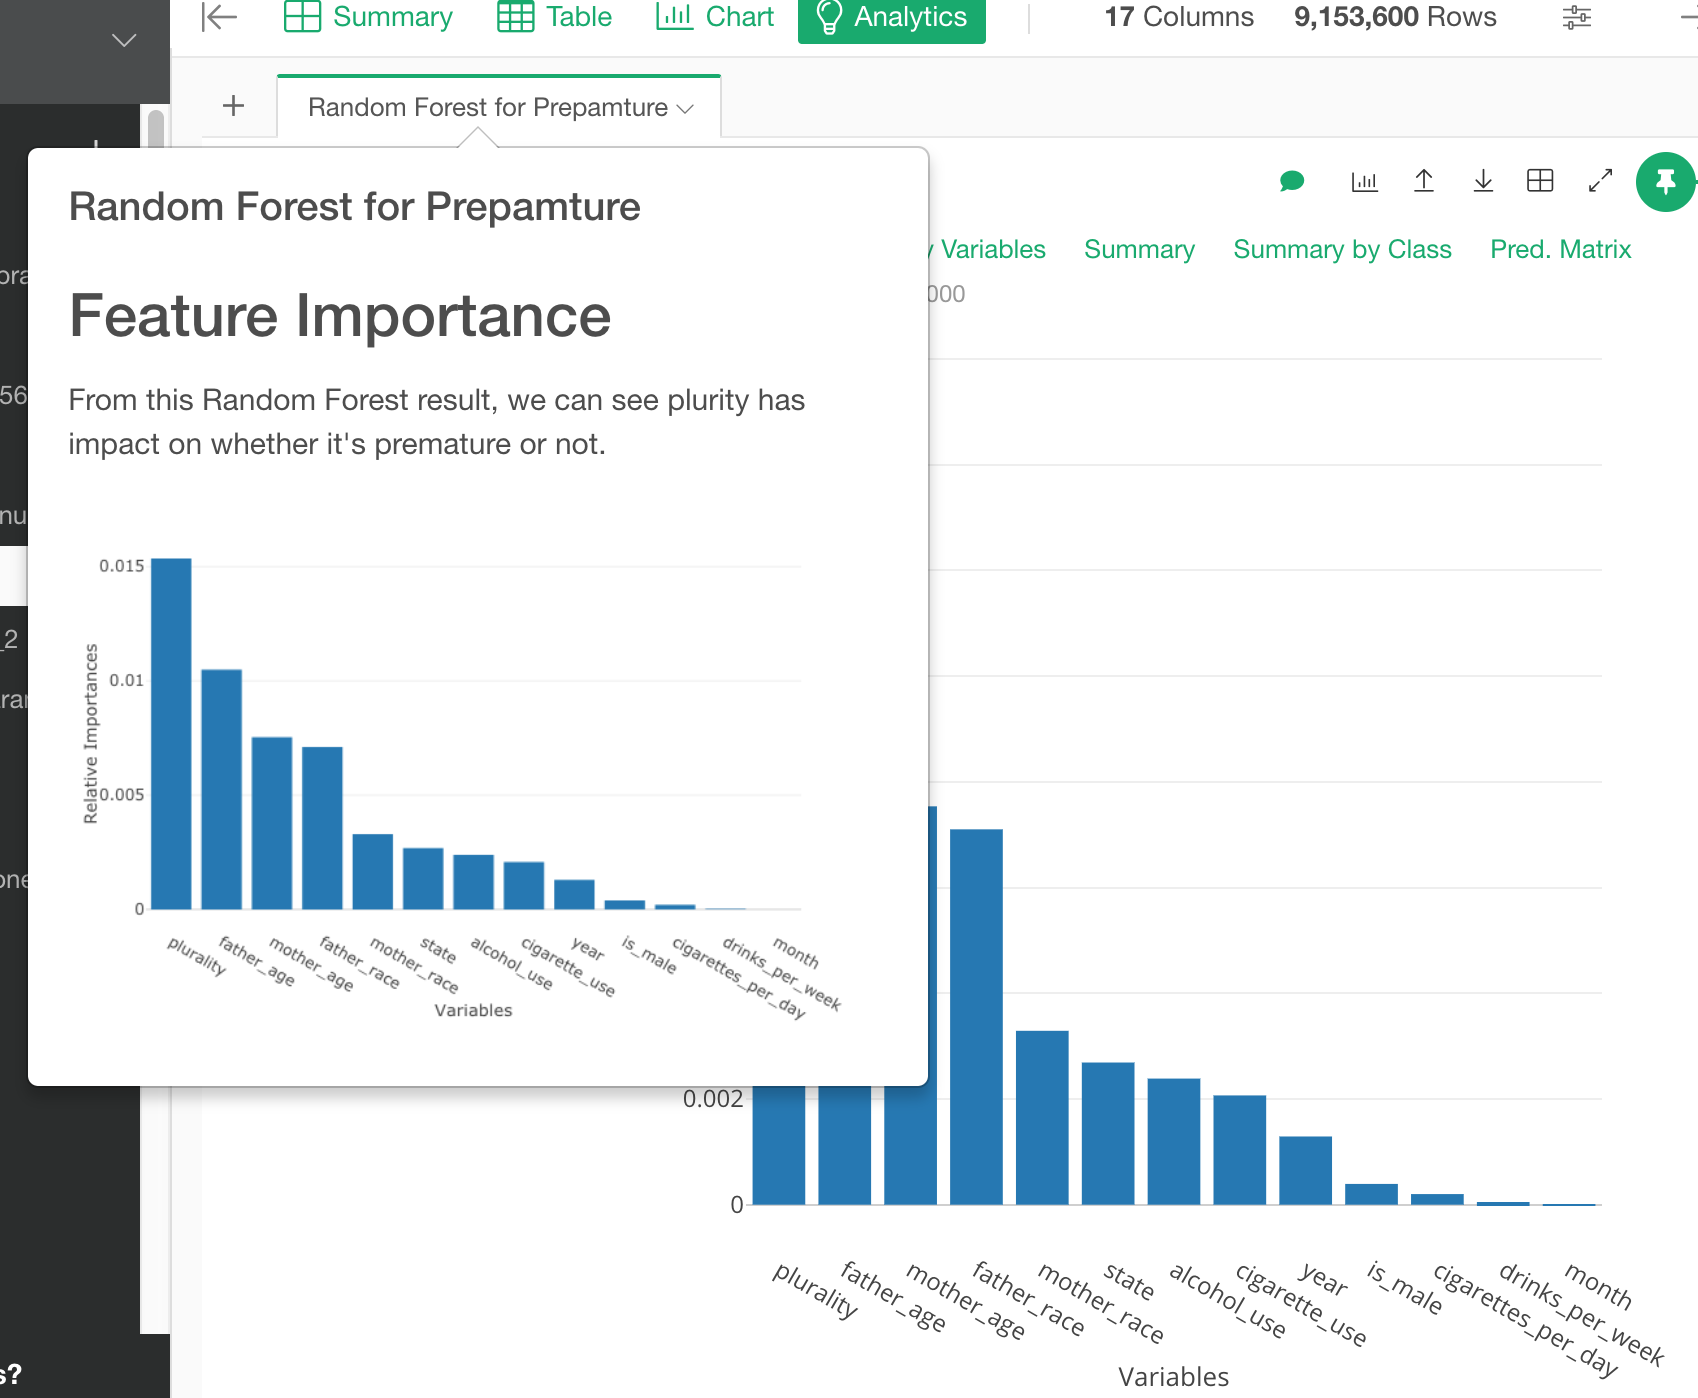
To add comment to your Analytics, click the comment icon on the top right hand side of the chart area.
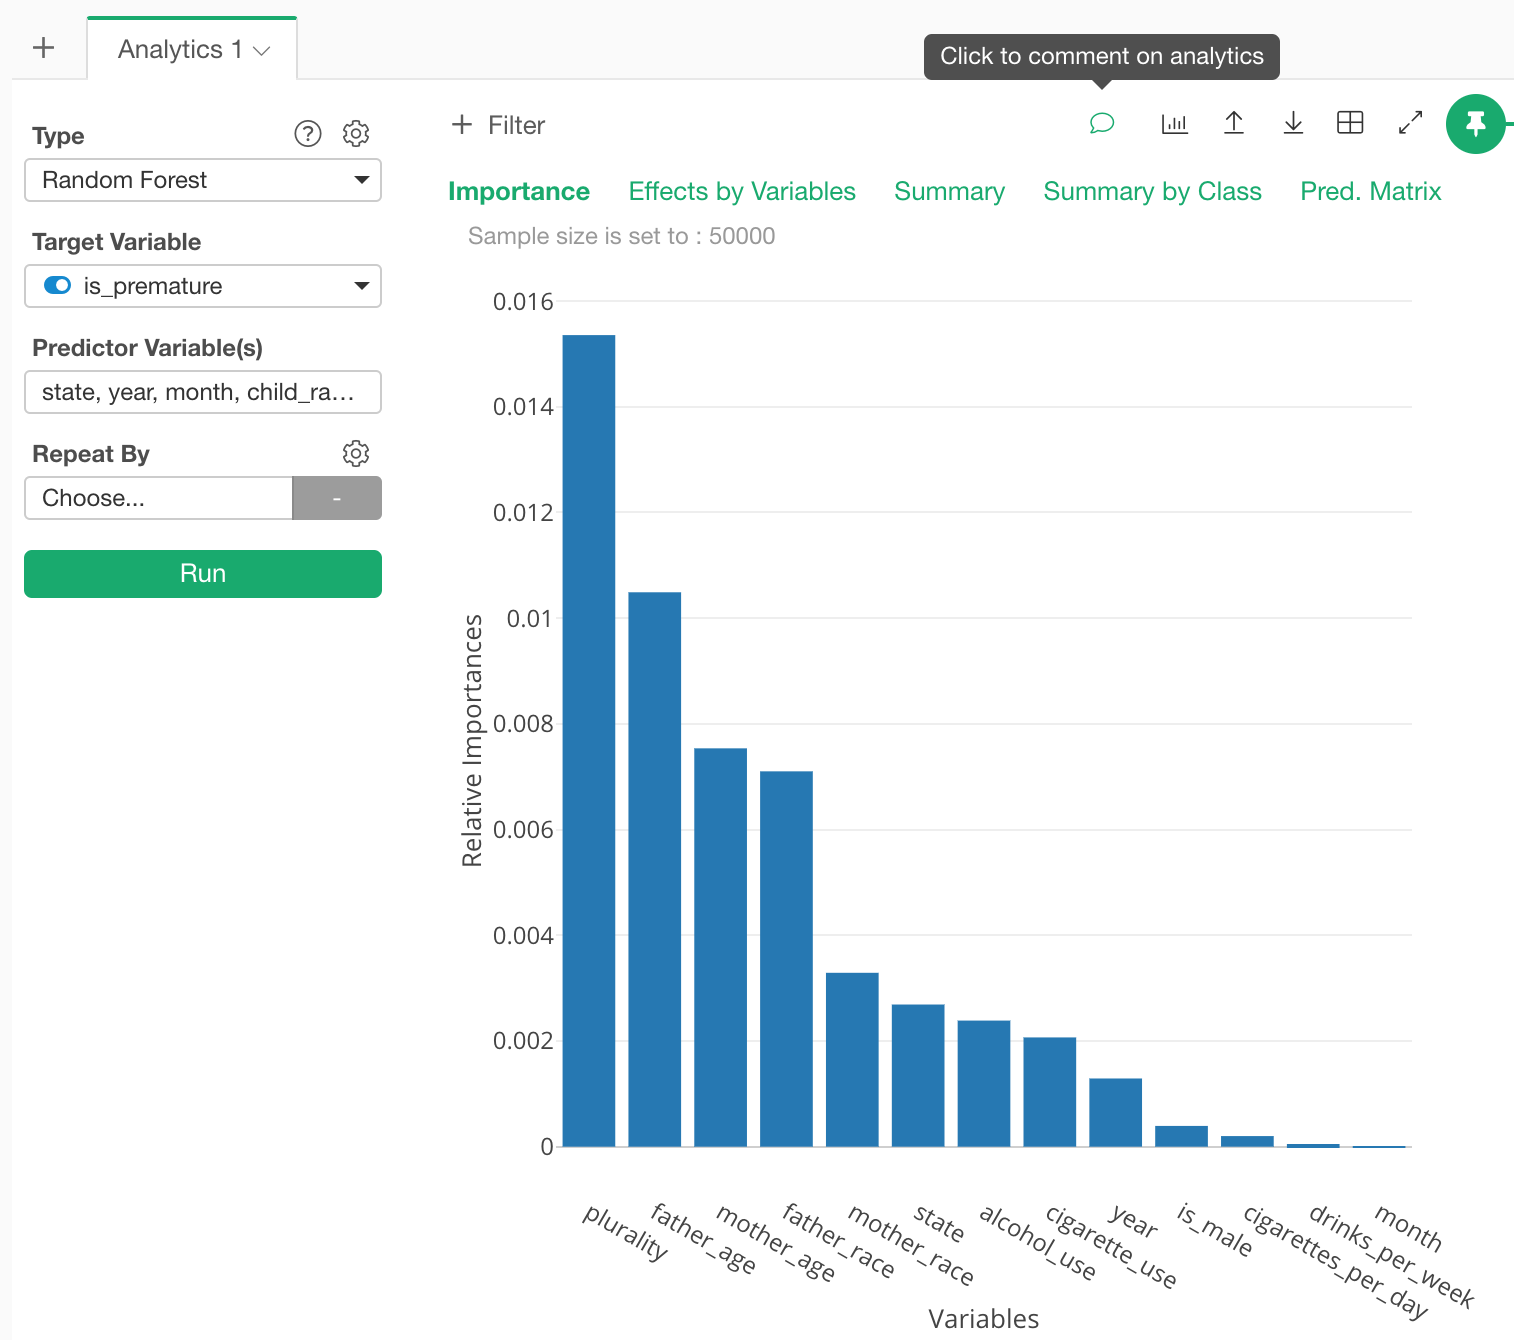
On the Name / Comment Dialog, you can set Chart Name and Comment.
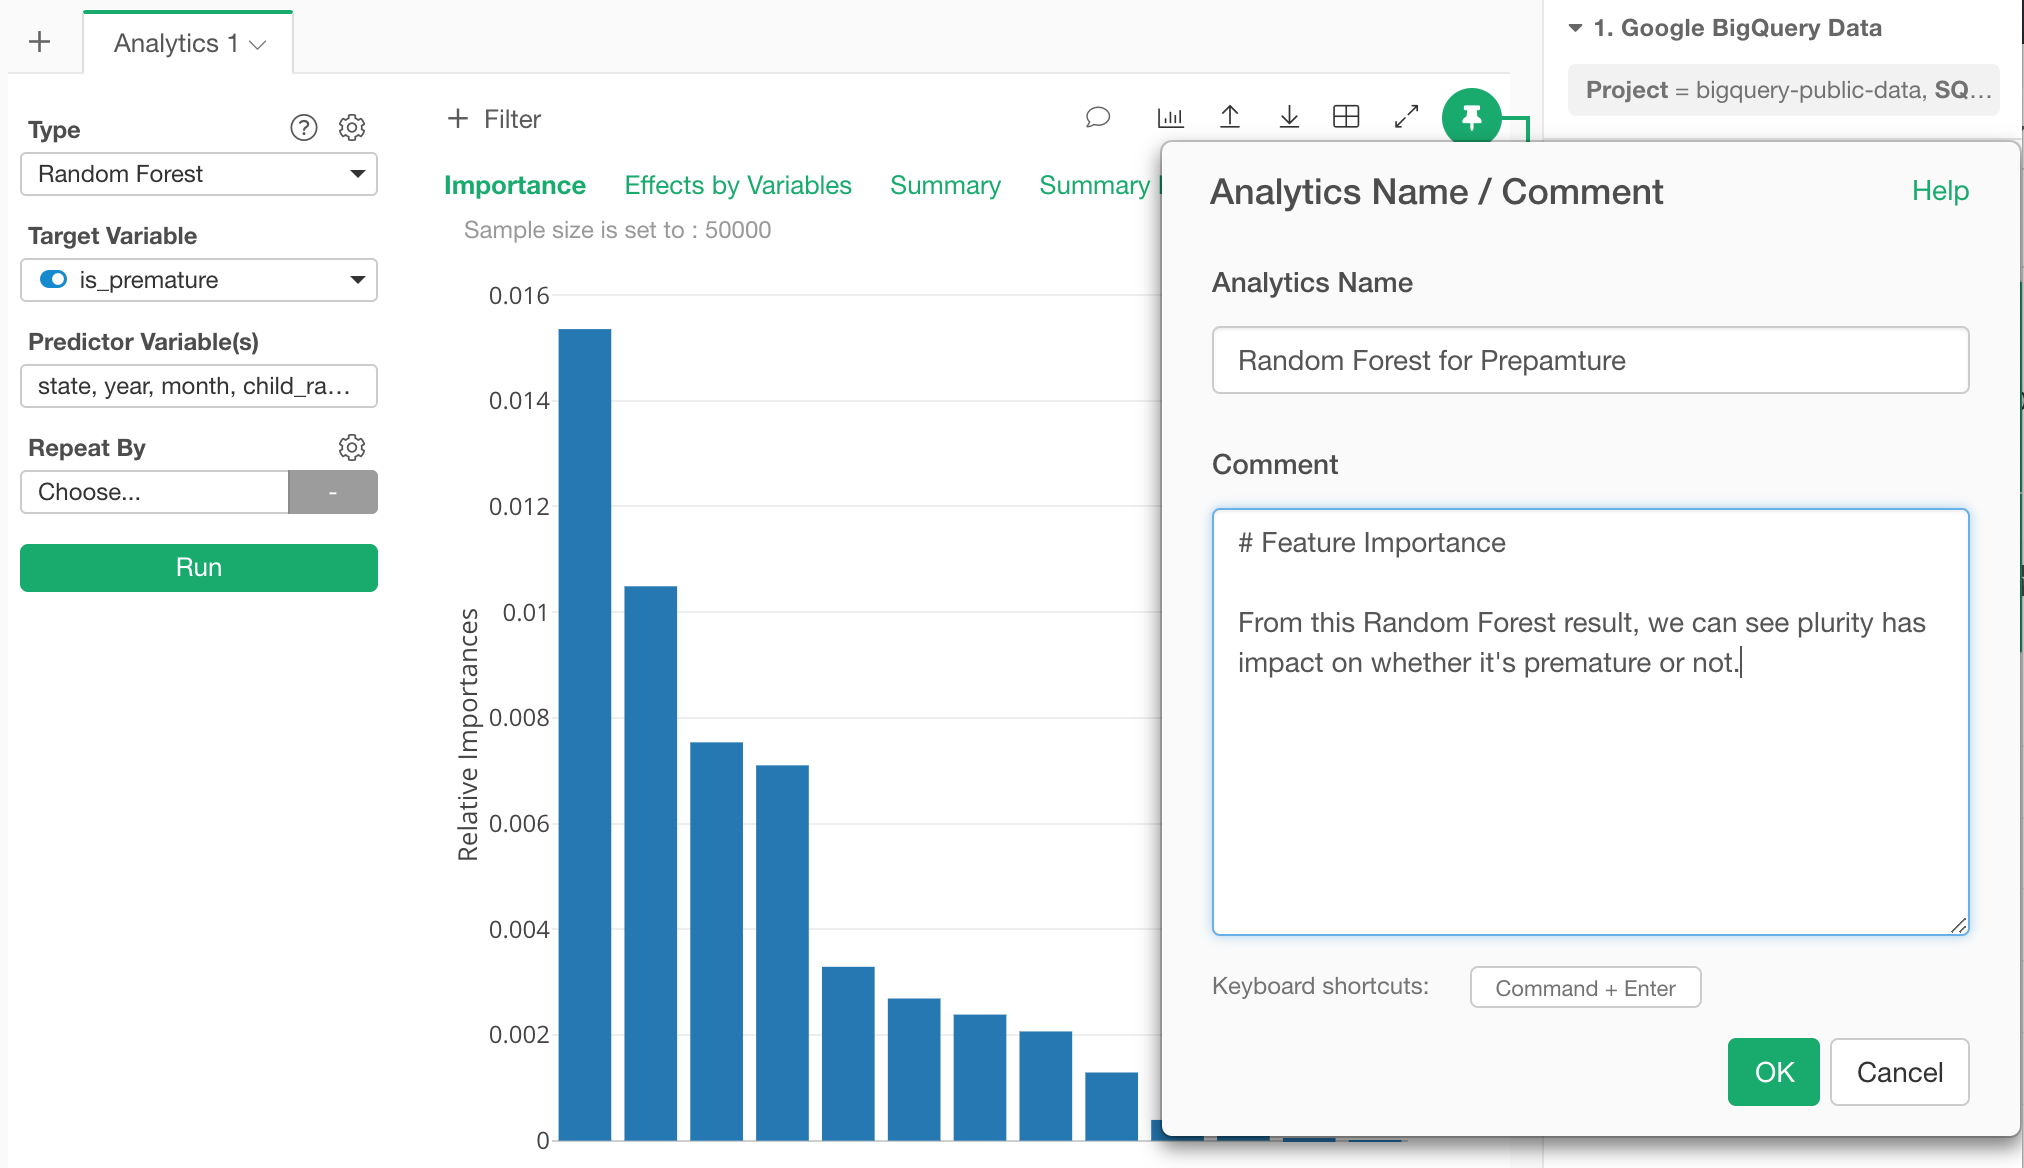
Once finished, click OK button and now comment icon’s color changes to green. By hovering the green comment icon, you can check your comment.
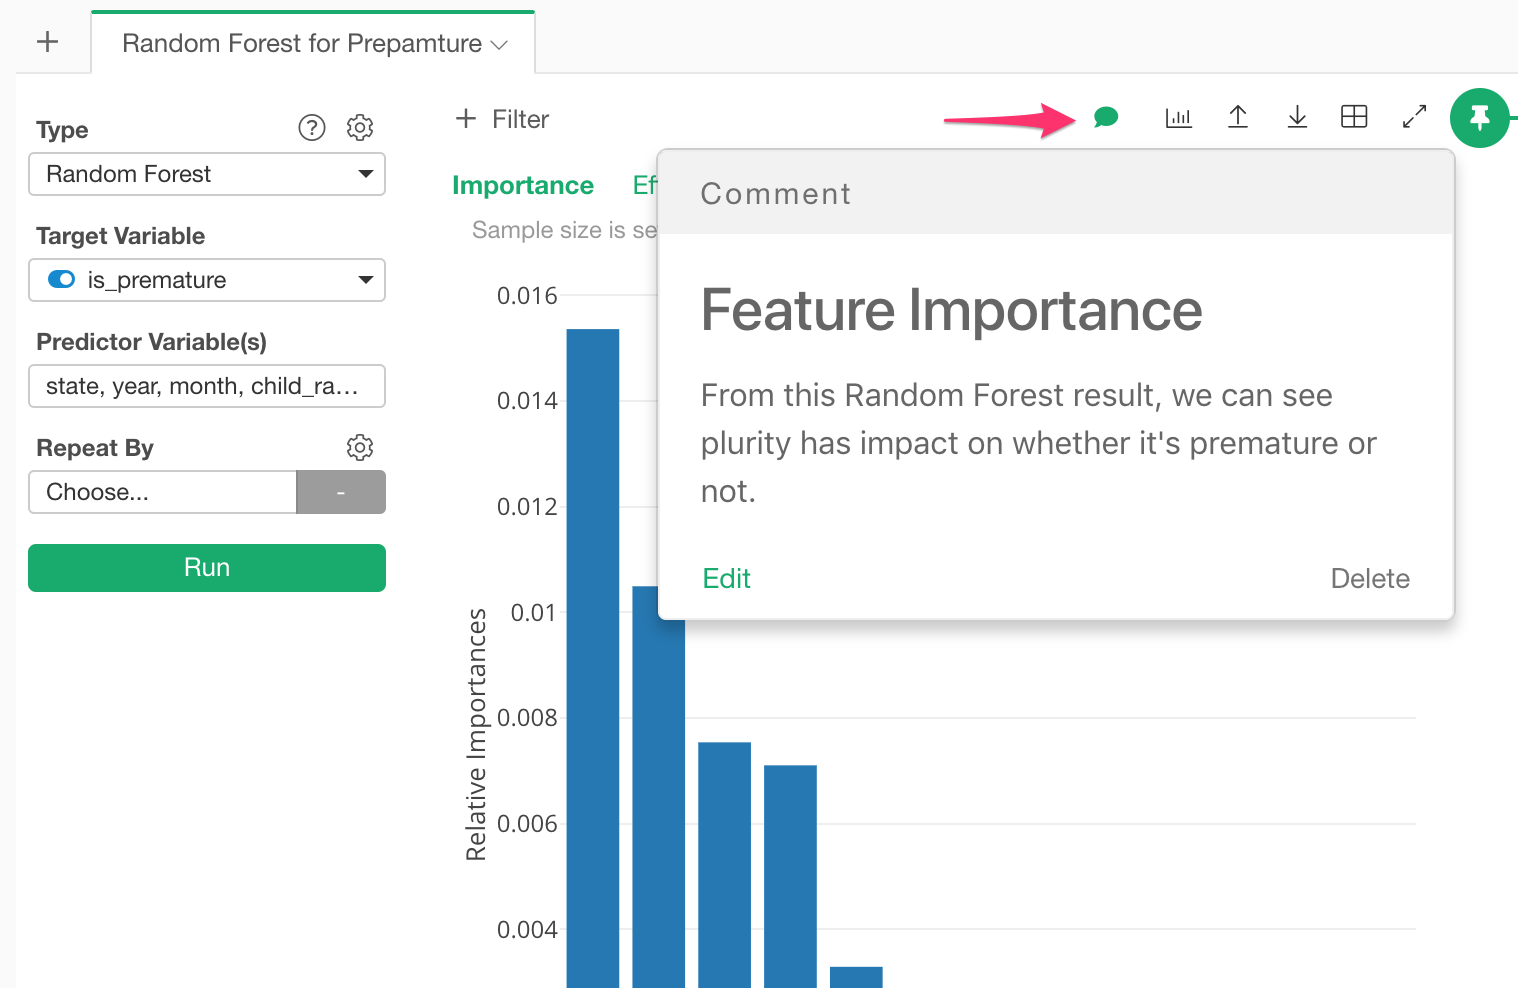
Also, if you mouse over the Analytics tab, you can check your comment along with the Analytics Chart thumbnail.
Insert Charts and Analytics with along with comments
When you insert your Chart and Analytics to your Note and Slide, you can include comments added to Charts and Notes.
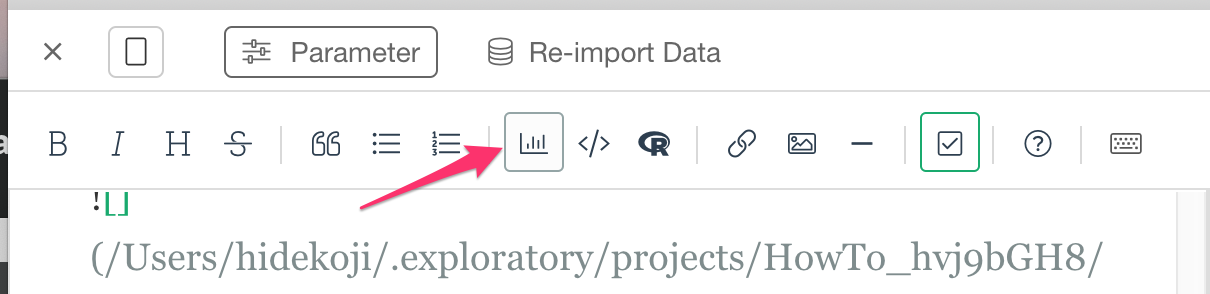
On your note, select chart icon on Note Editor Toolbar
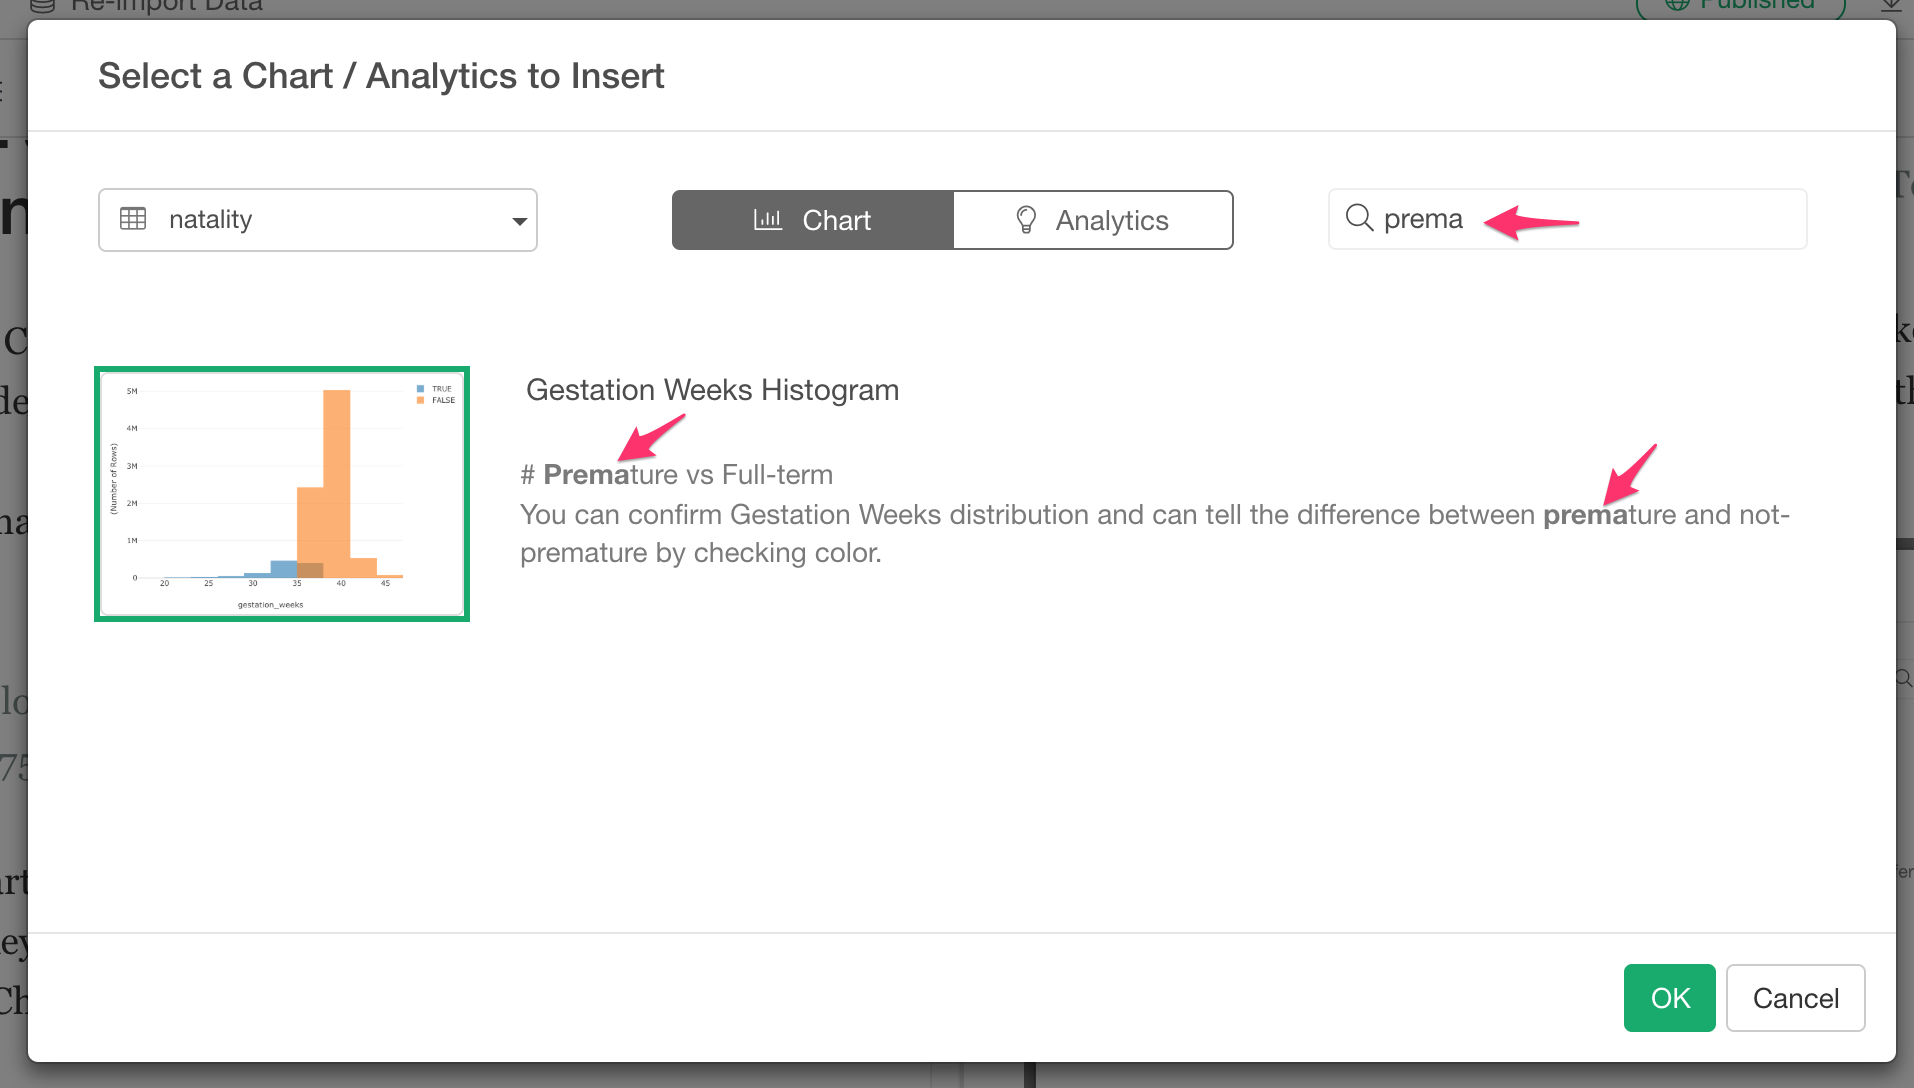
This opens up the Chart / Analytics Picker Dialog like below. Type in search field with the keyword you want to match with Chart Name and Comment. Select the Chart Thumbnail and Click OK.
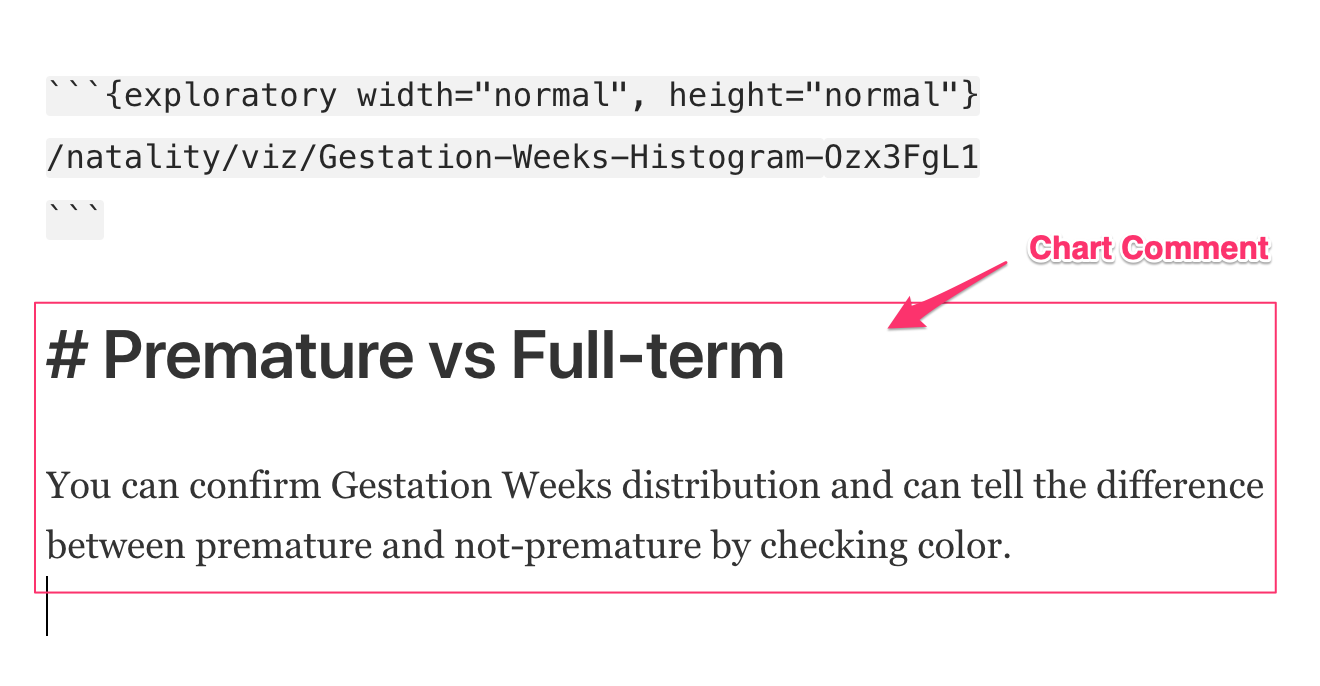
And this will insert your chart code chunk as well as comment like below to your note/slide.