How to create a treemap in Exploratory
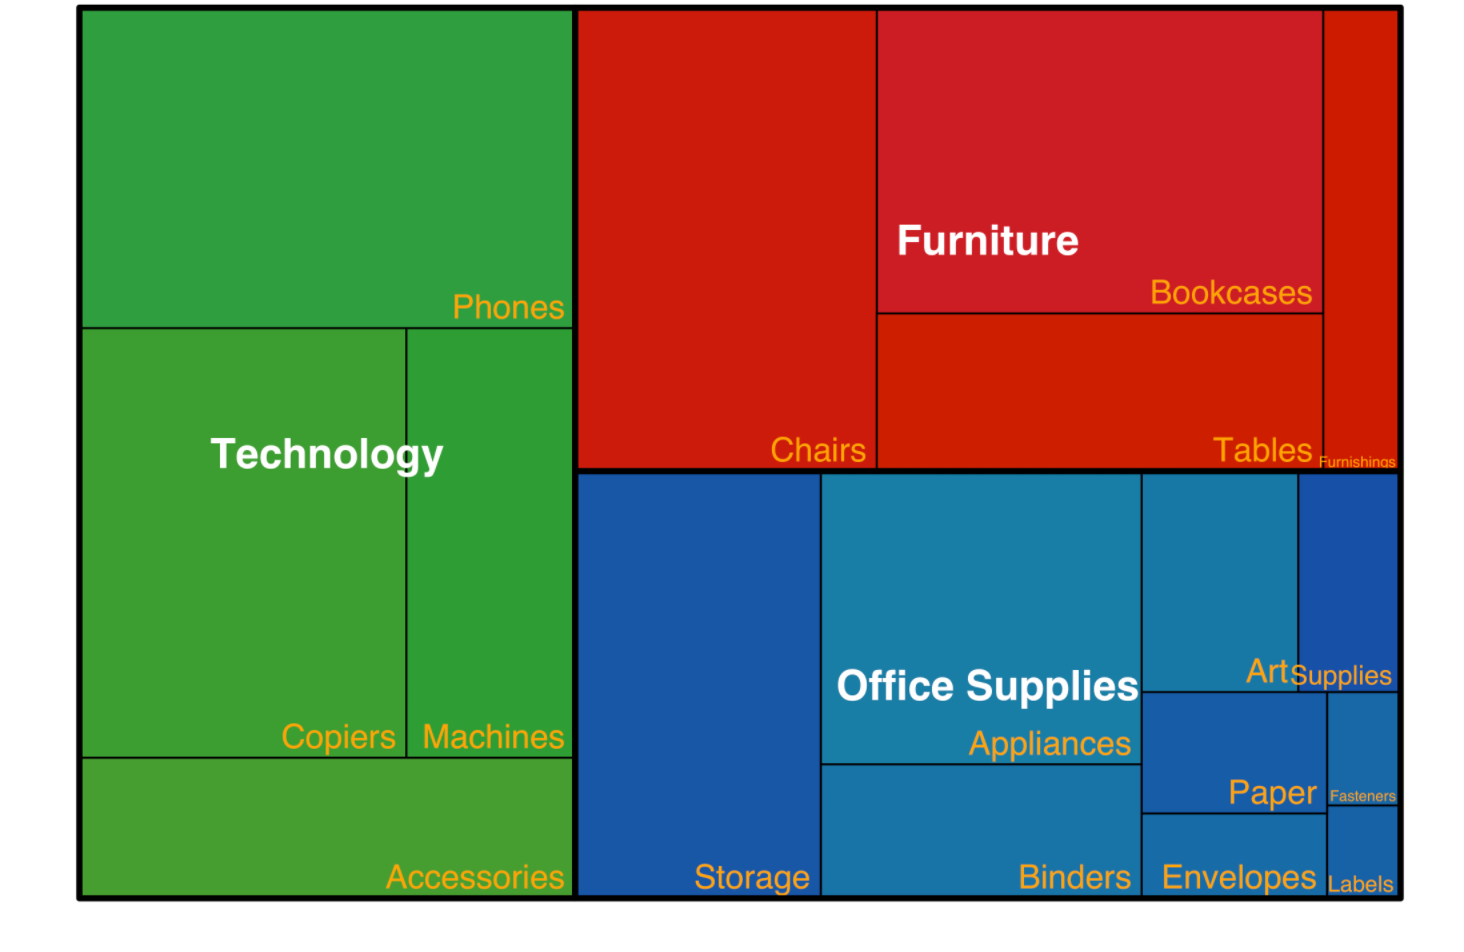
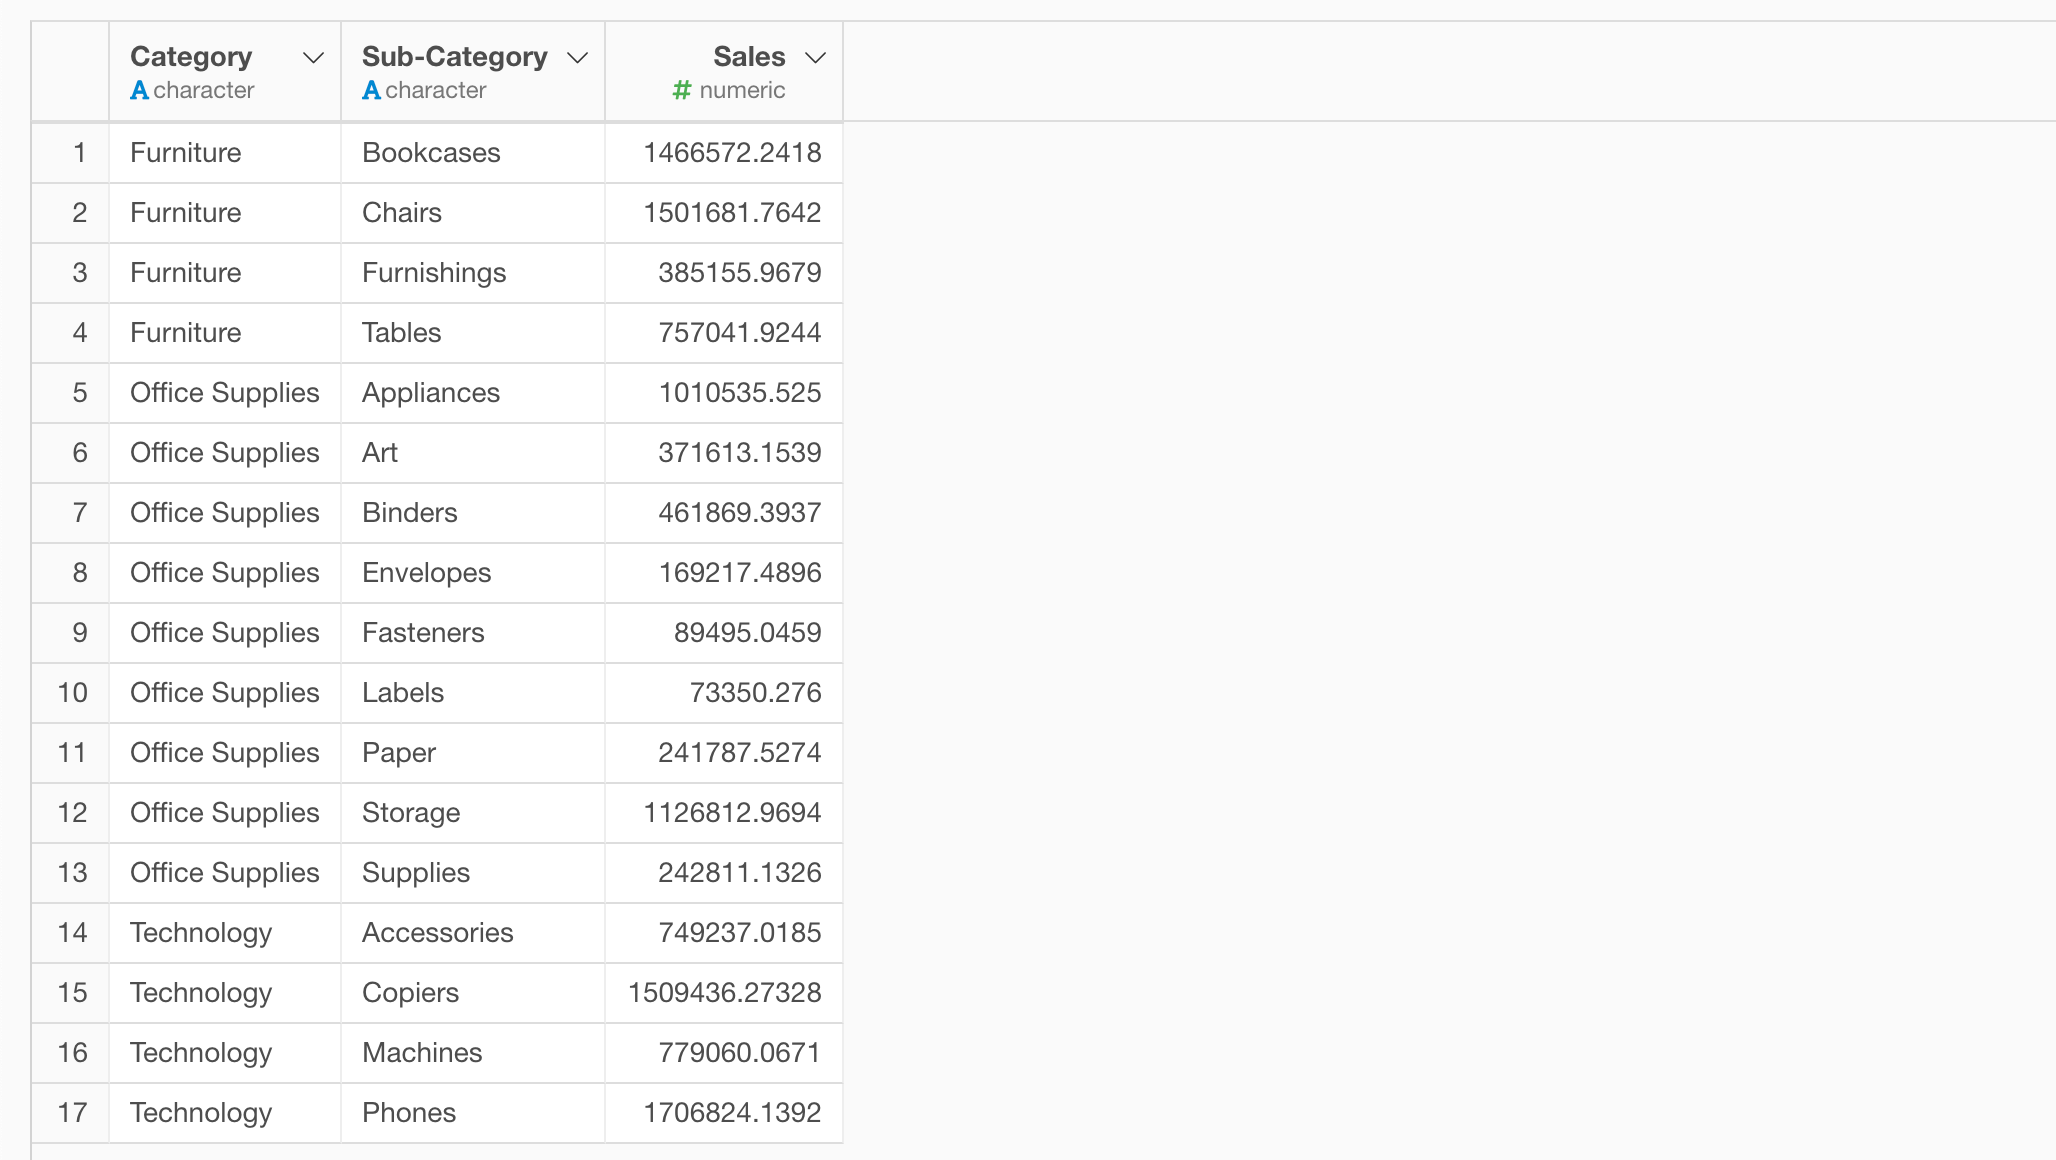
This note explains how to create a treemap chart using aggregated data that has a hierarchical structure, such as categories and subcategories like below.
Install "treemap" library
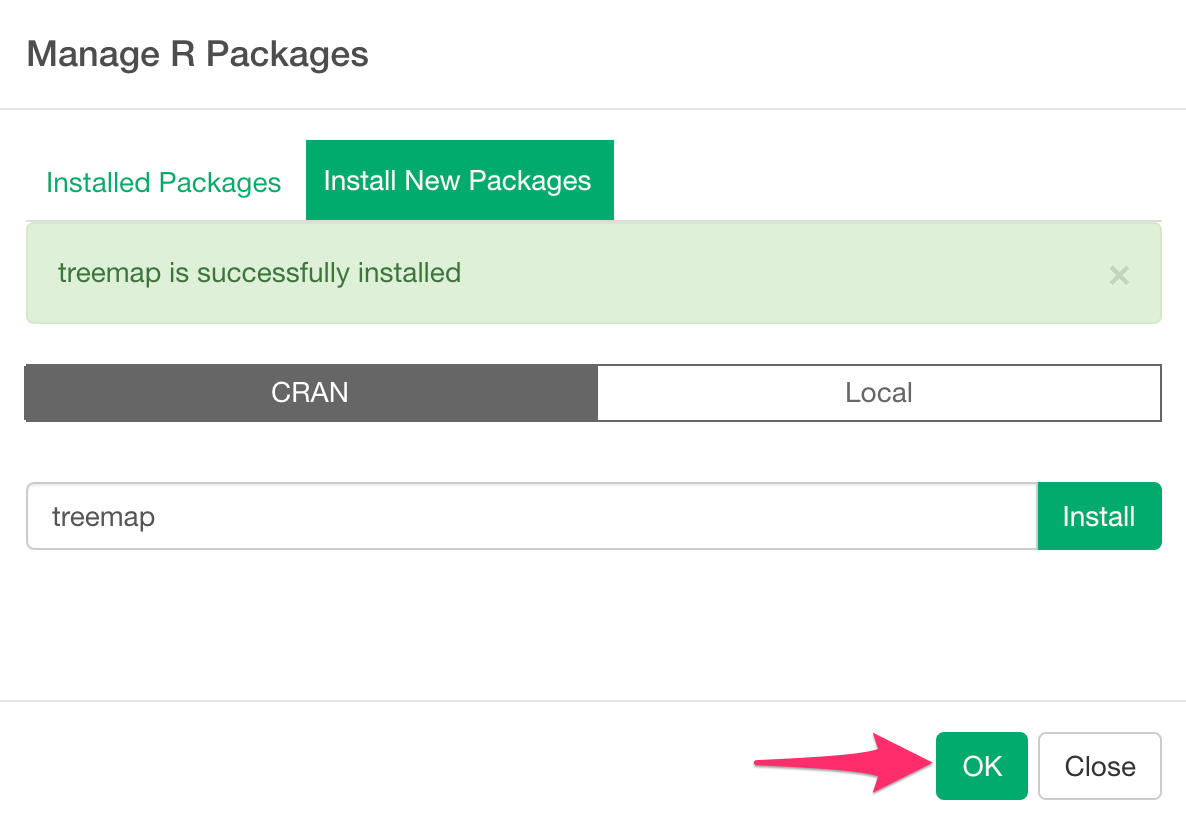
We use the "treemap" library to create a tree map. Select Manage R packages from the Project menu.
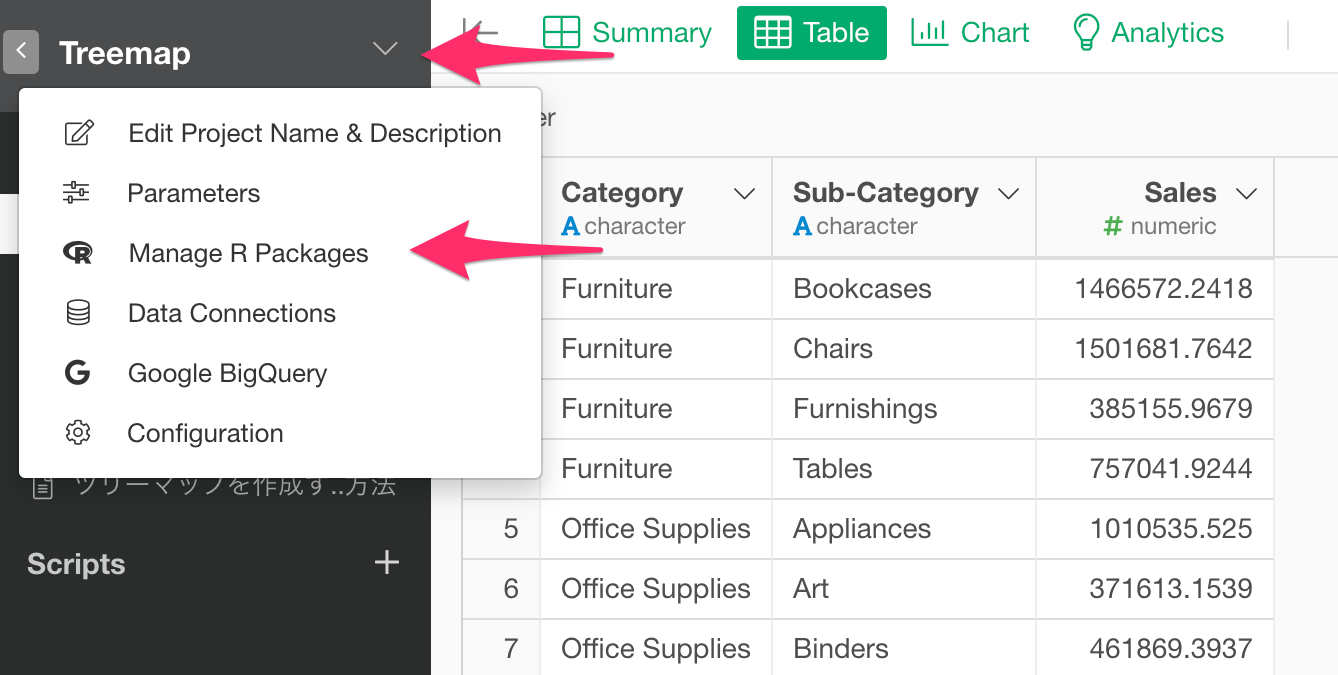
Then, type "treemap" in the text box and click the Install button.
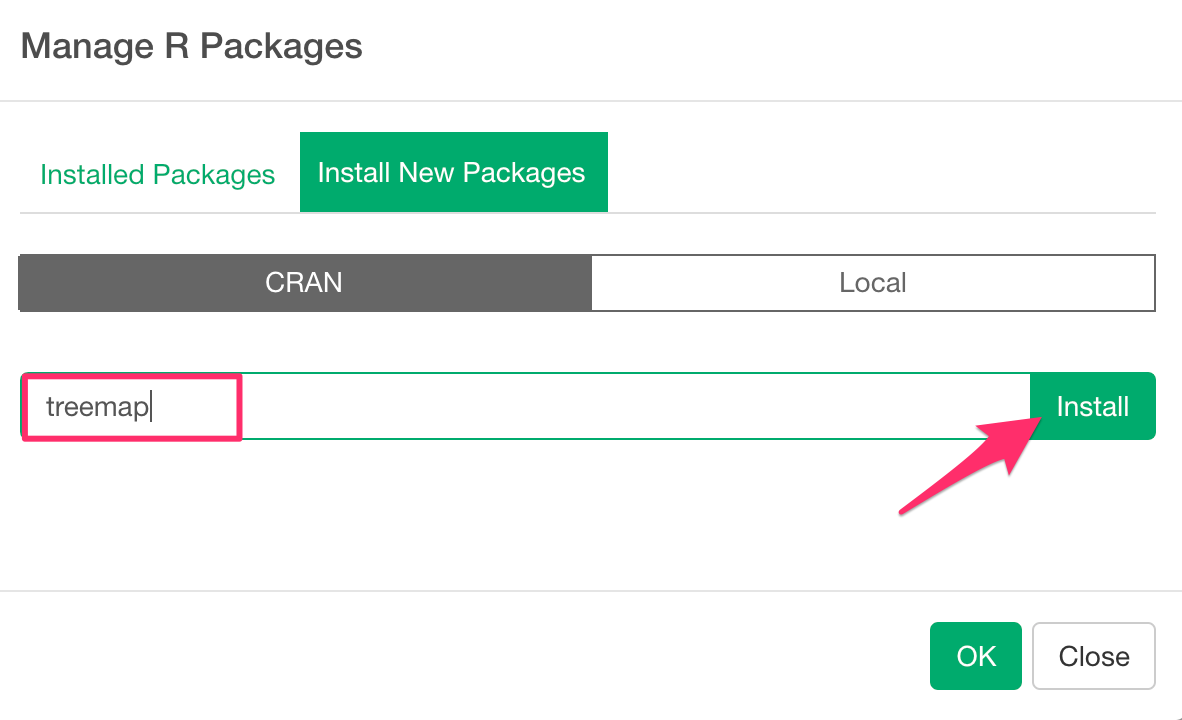
Click the "OK" button when you see a message "treemap is successfully installed".
Now, we are ready to create a treemap.
Create a Treemap
In this case, we will create a treemap in the notebook.
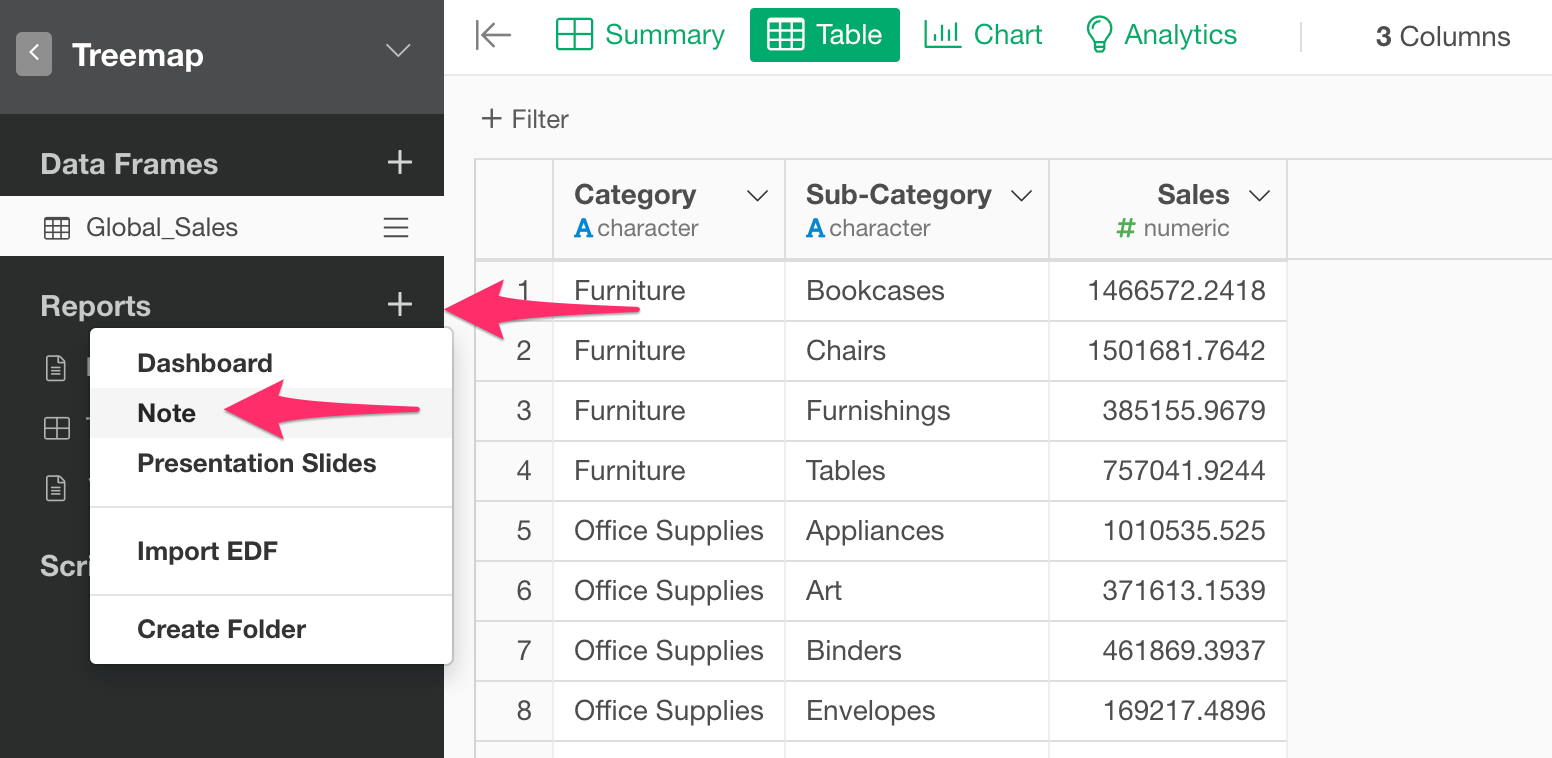
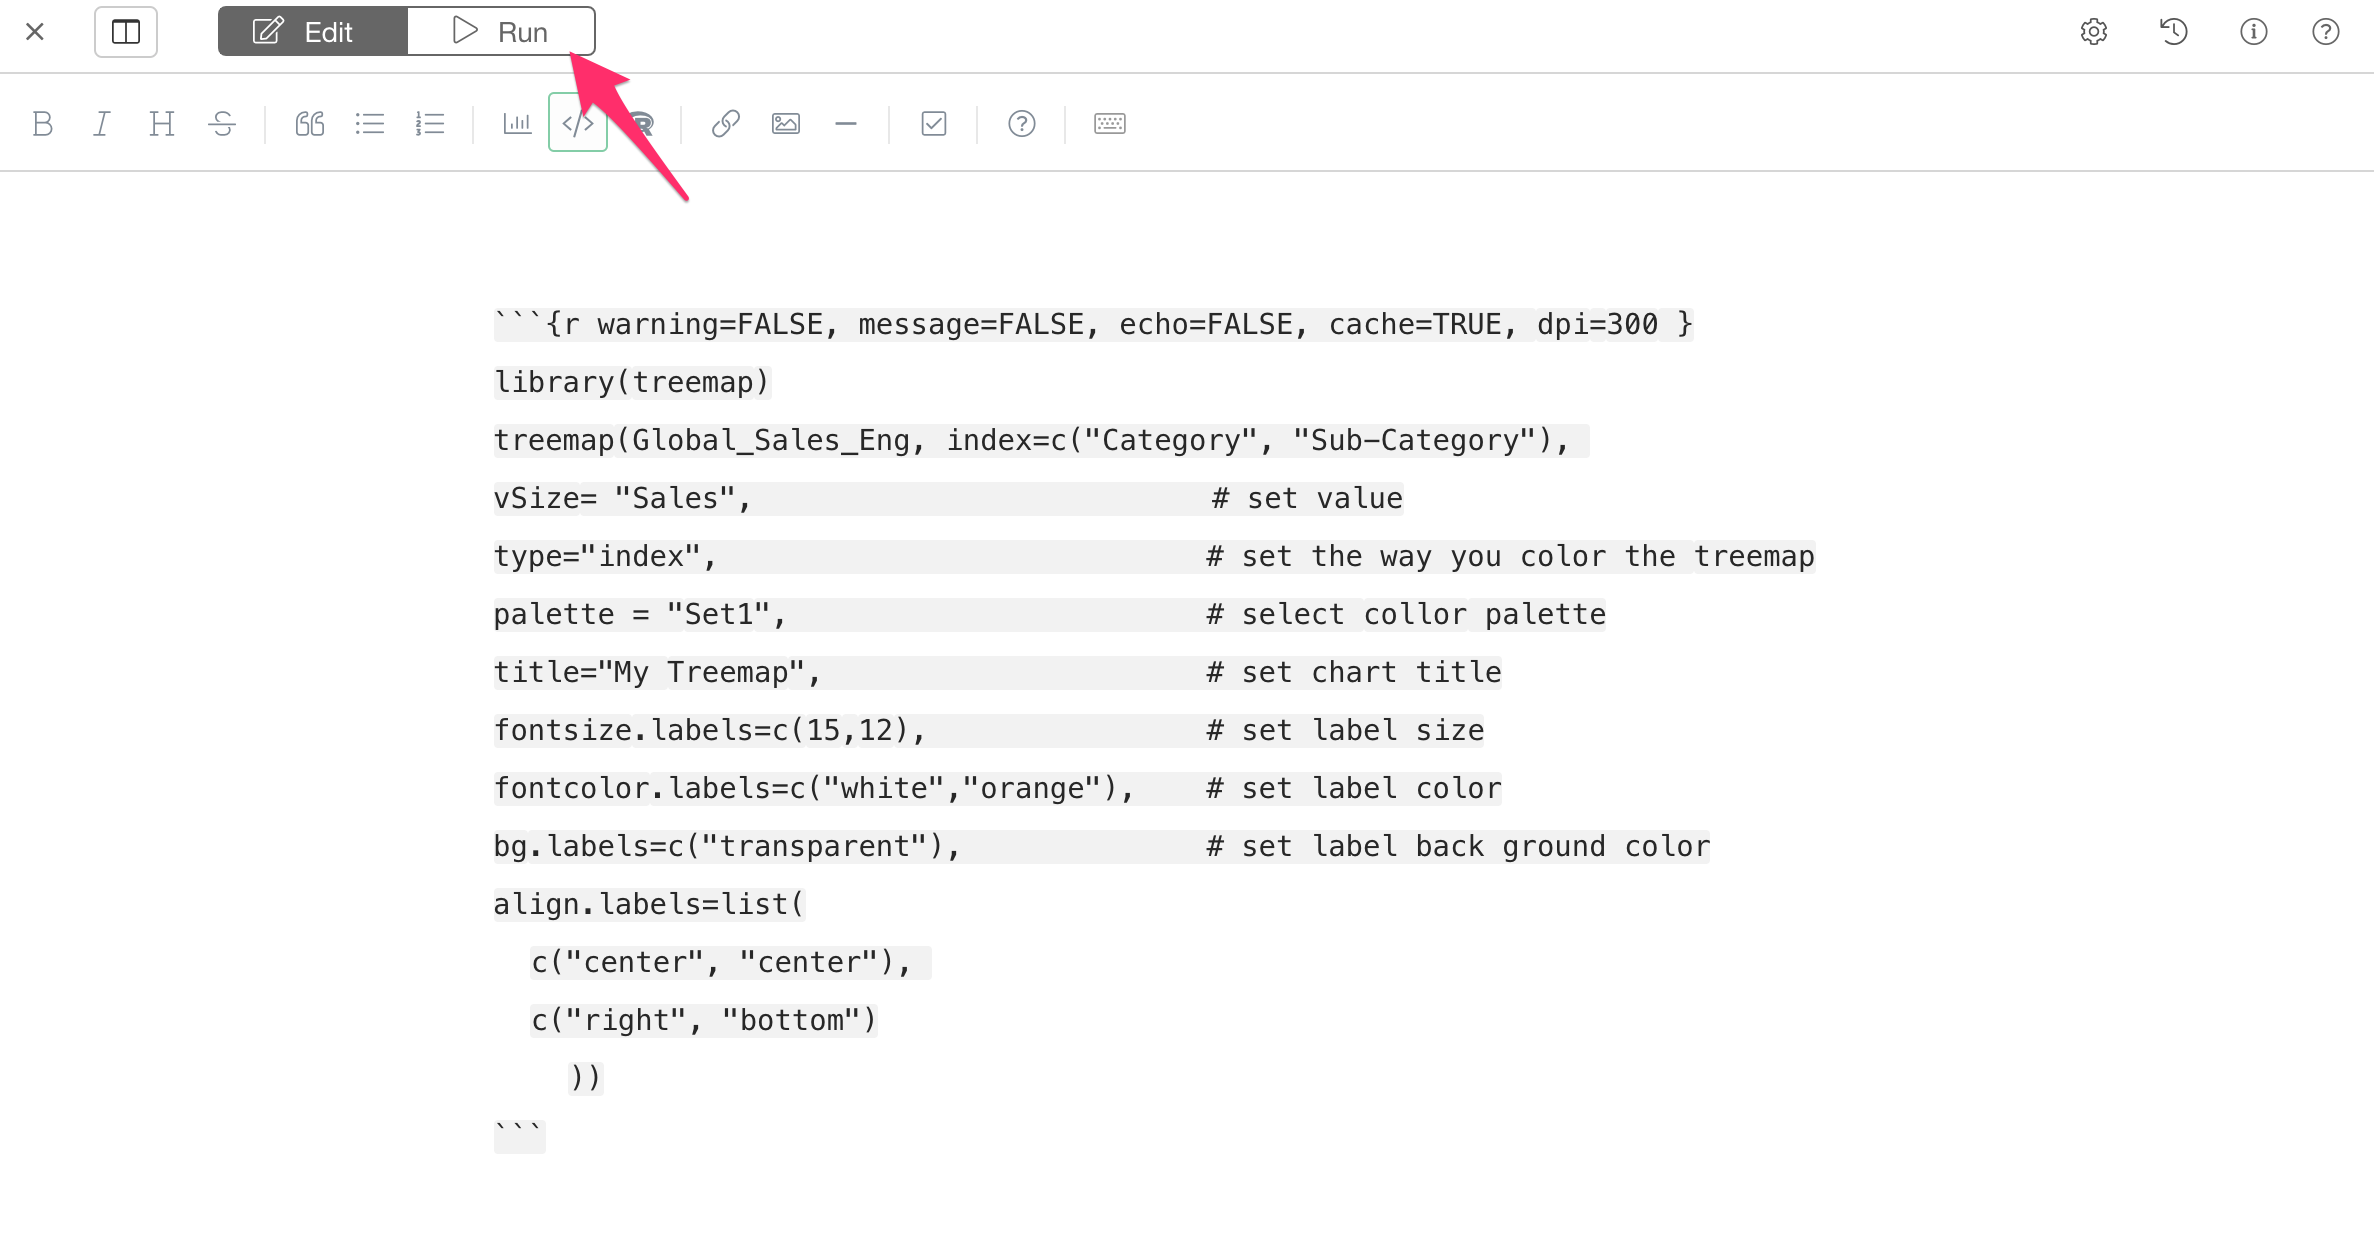
When the note appears, click the R Code icon.
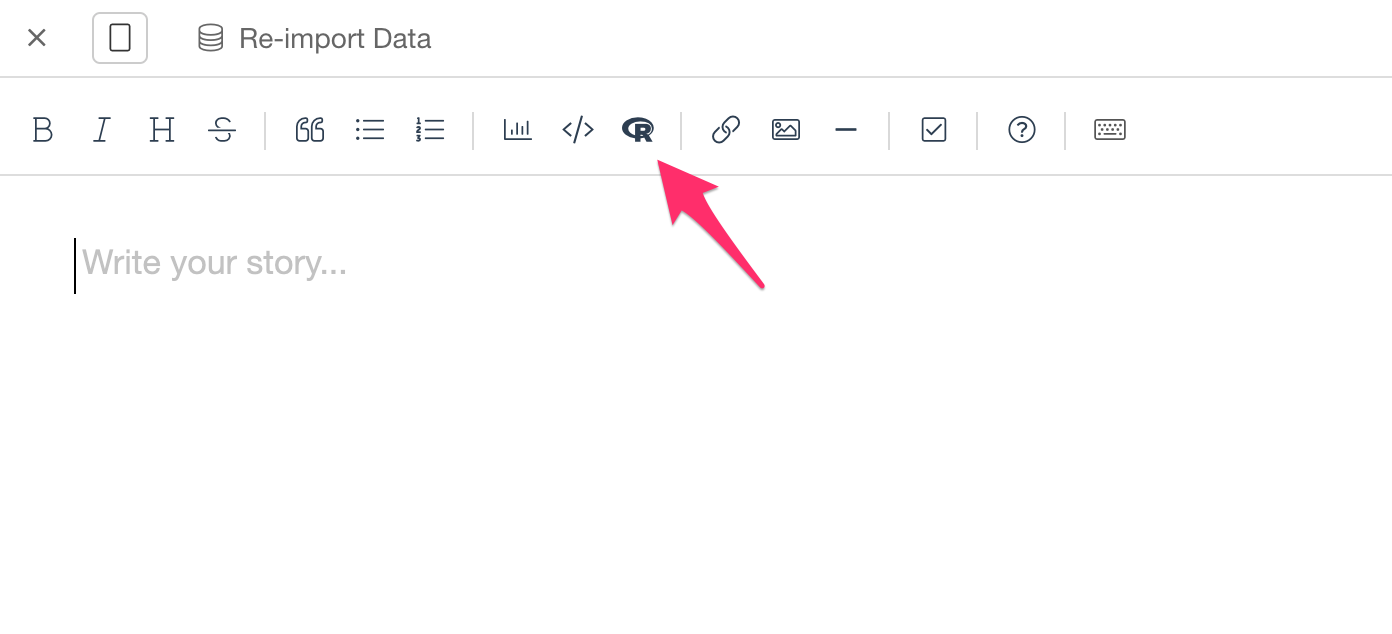
Then, you will see a chunk block where you can type R code.
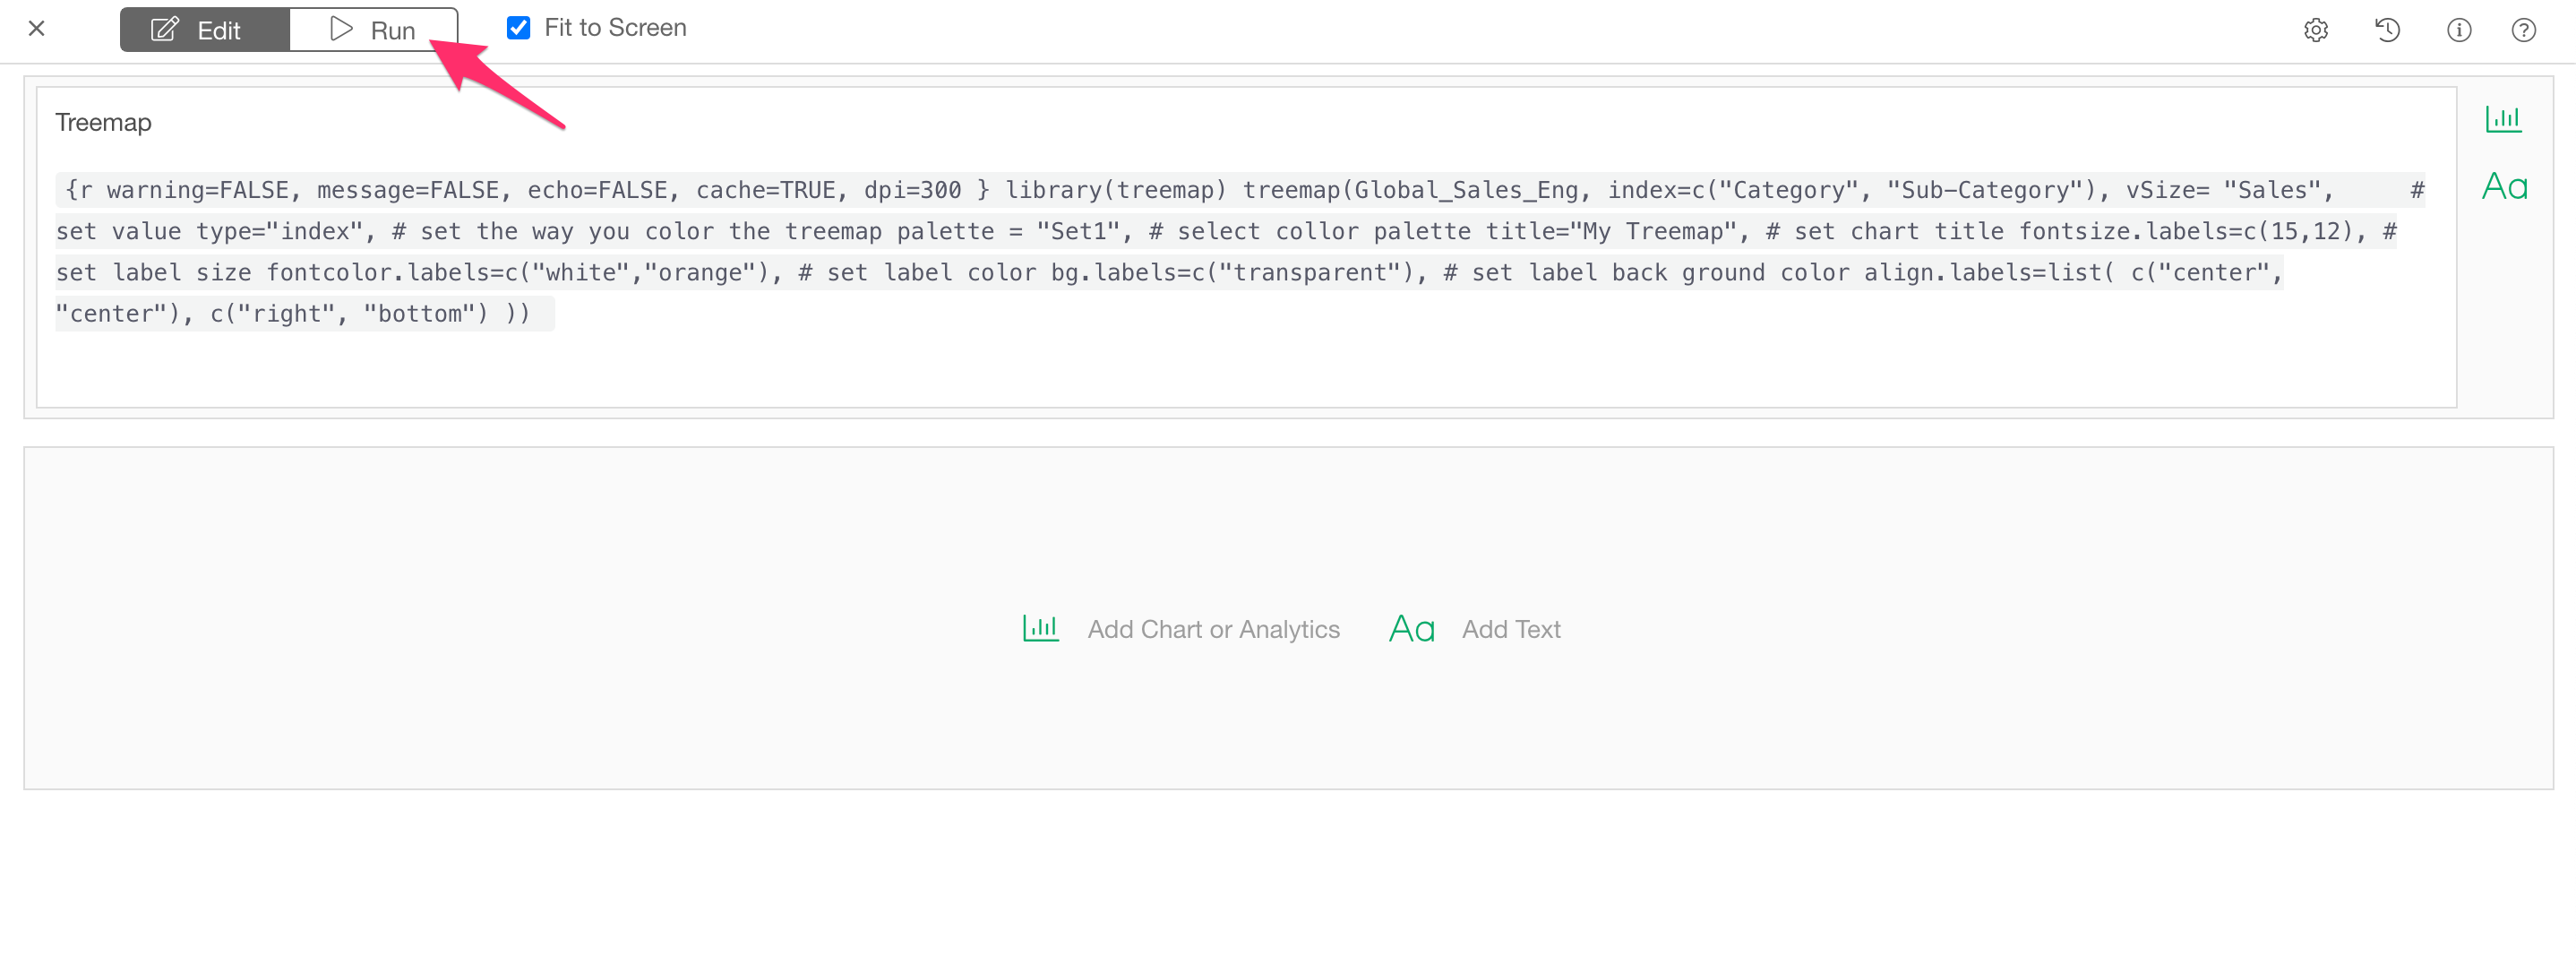
Now type the following code between the quote blocks.
library(treemap)
treemap(Global_Sales_Eng, index=c("Category", "Sub-Category"),
vSize= "Sales",                         # set value
type="index",                            # set the way you color the treemap
palette = "Set1",                        # select collor palette
title="My Treemap",                      # set chart title
fontsize.labels=c(15,12),                # set label size
fontcolor.labels=c("white","orange"),    # set label color
bg.labels=c("transparent"),              # set label back ground color
align.labels=list(
    c("center", "center"),
    c("right", "bottom")
        ))
Click the Run button, once you finished typing the code.
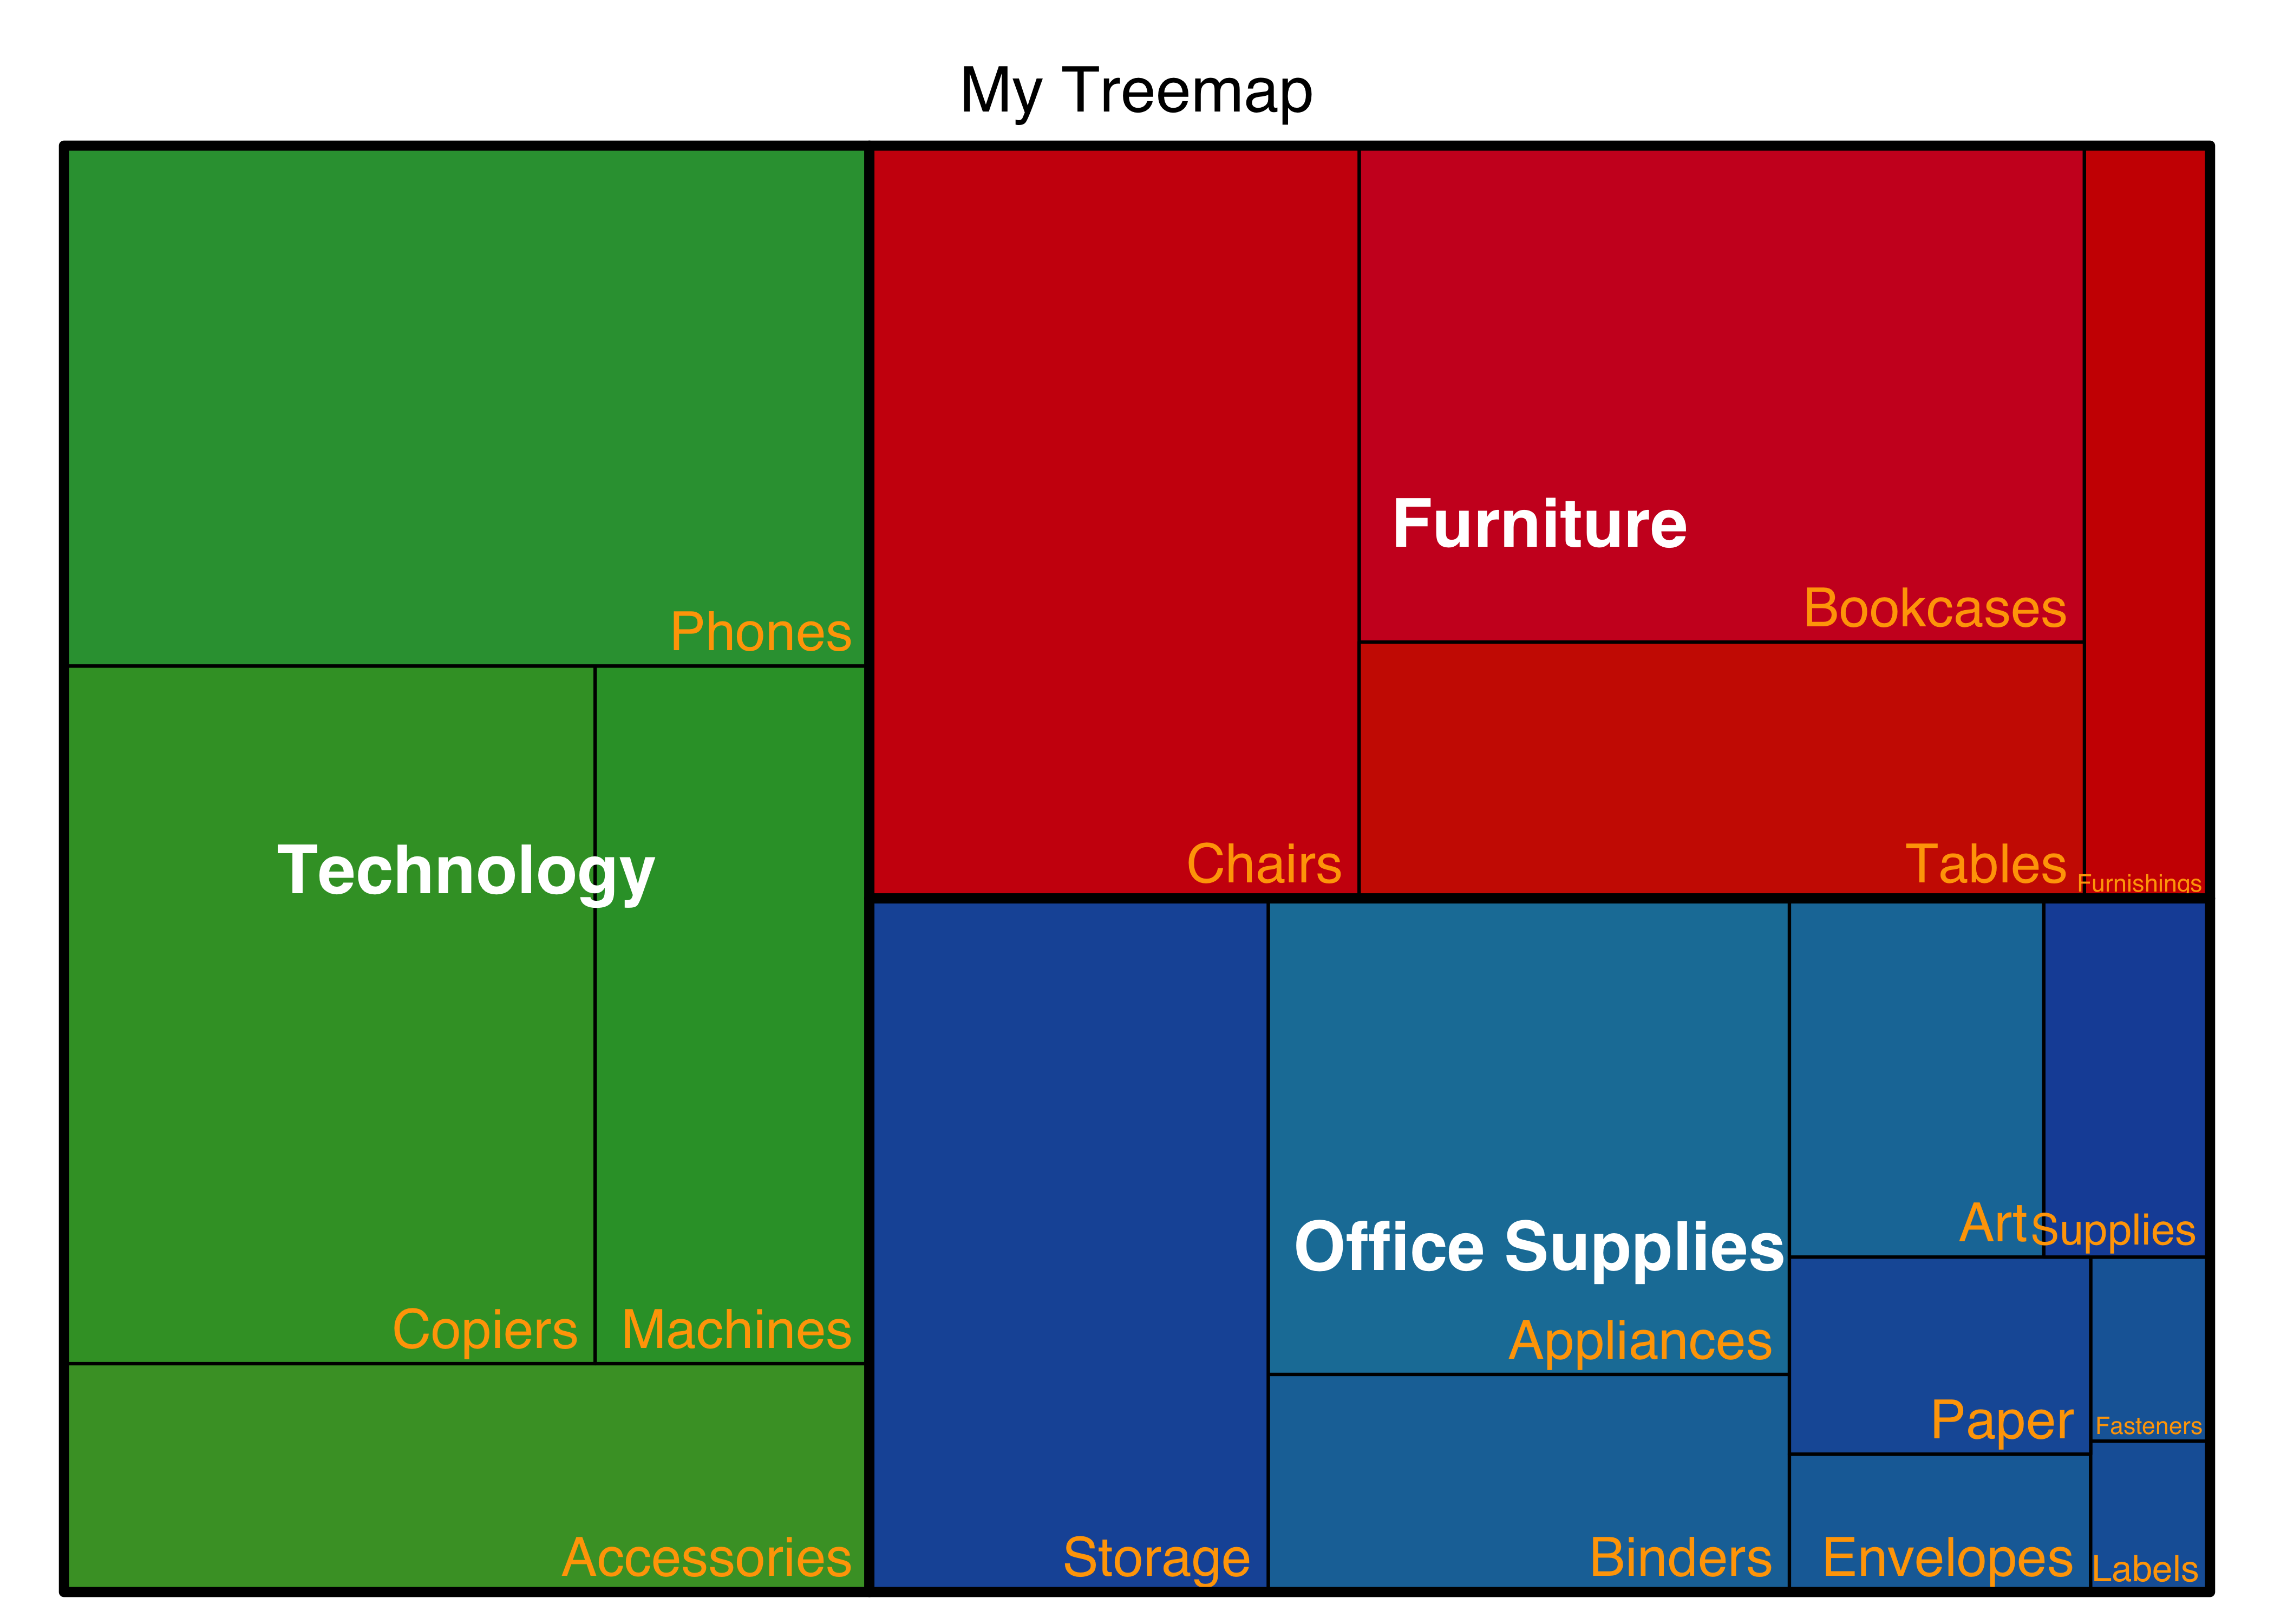
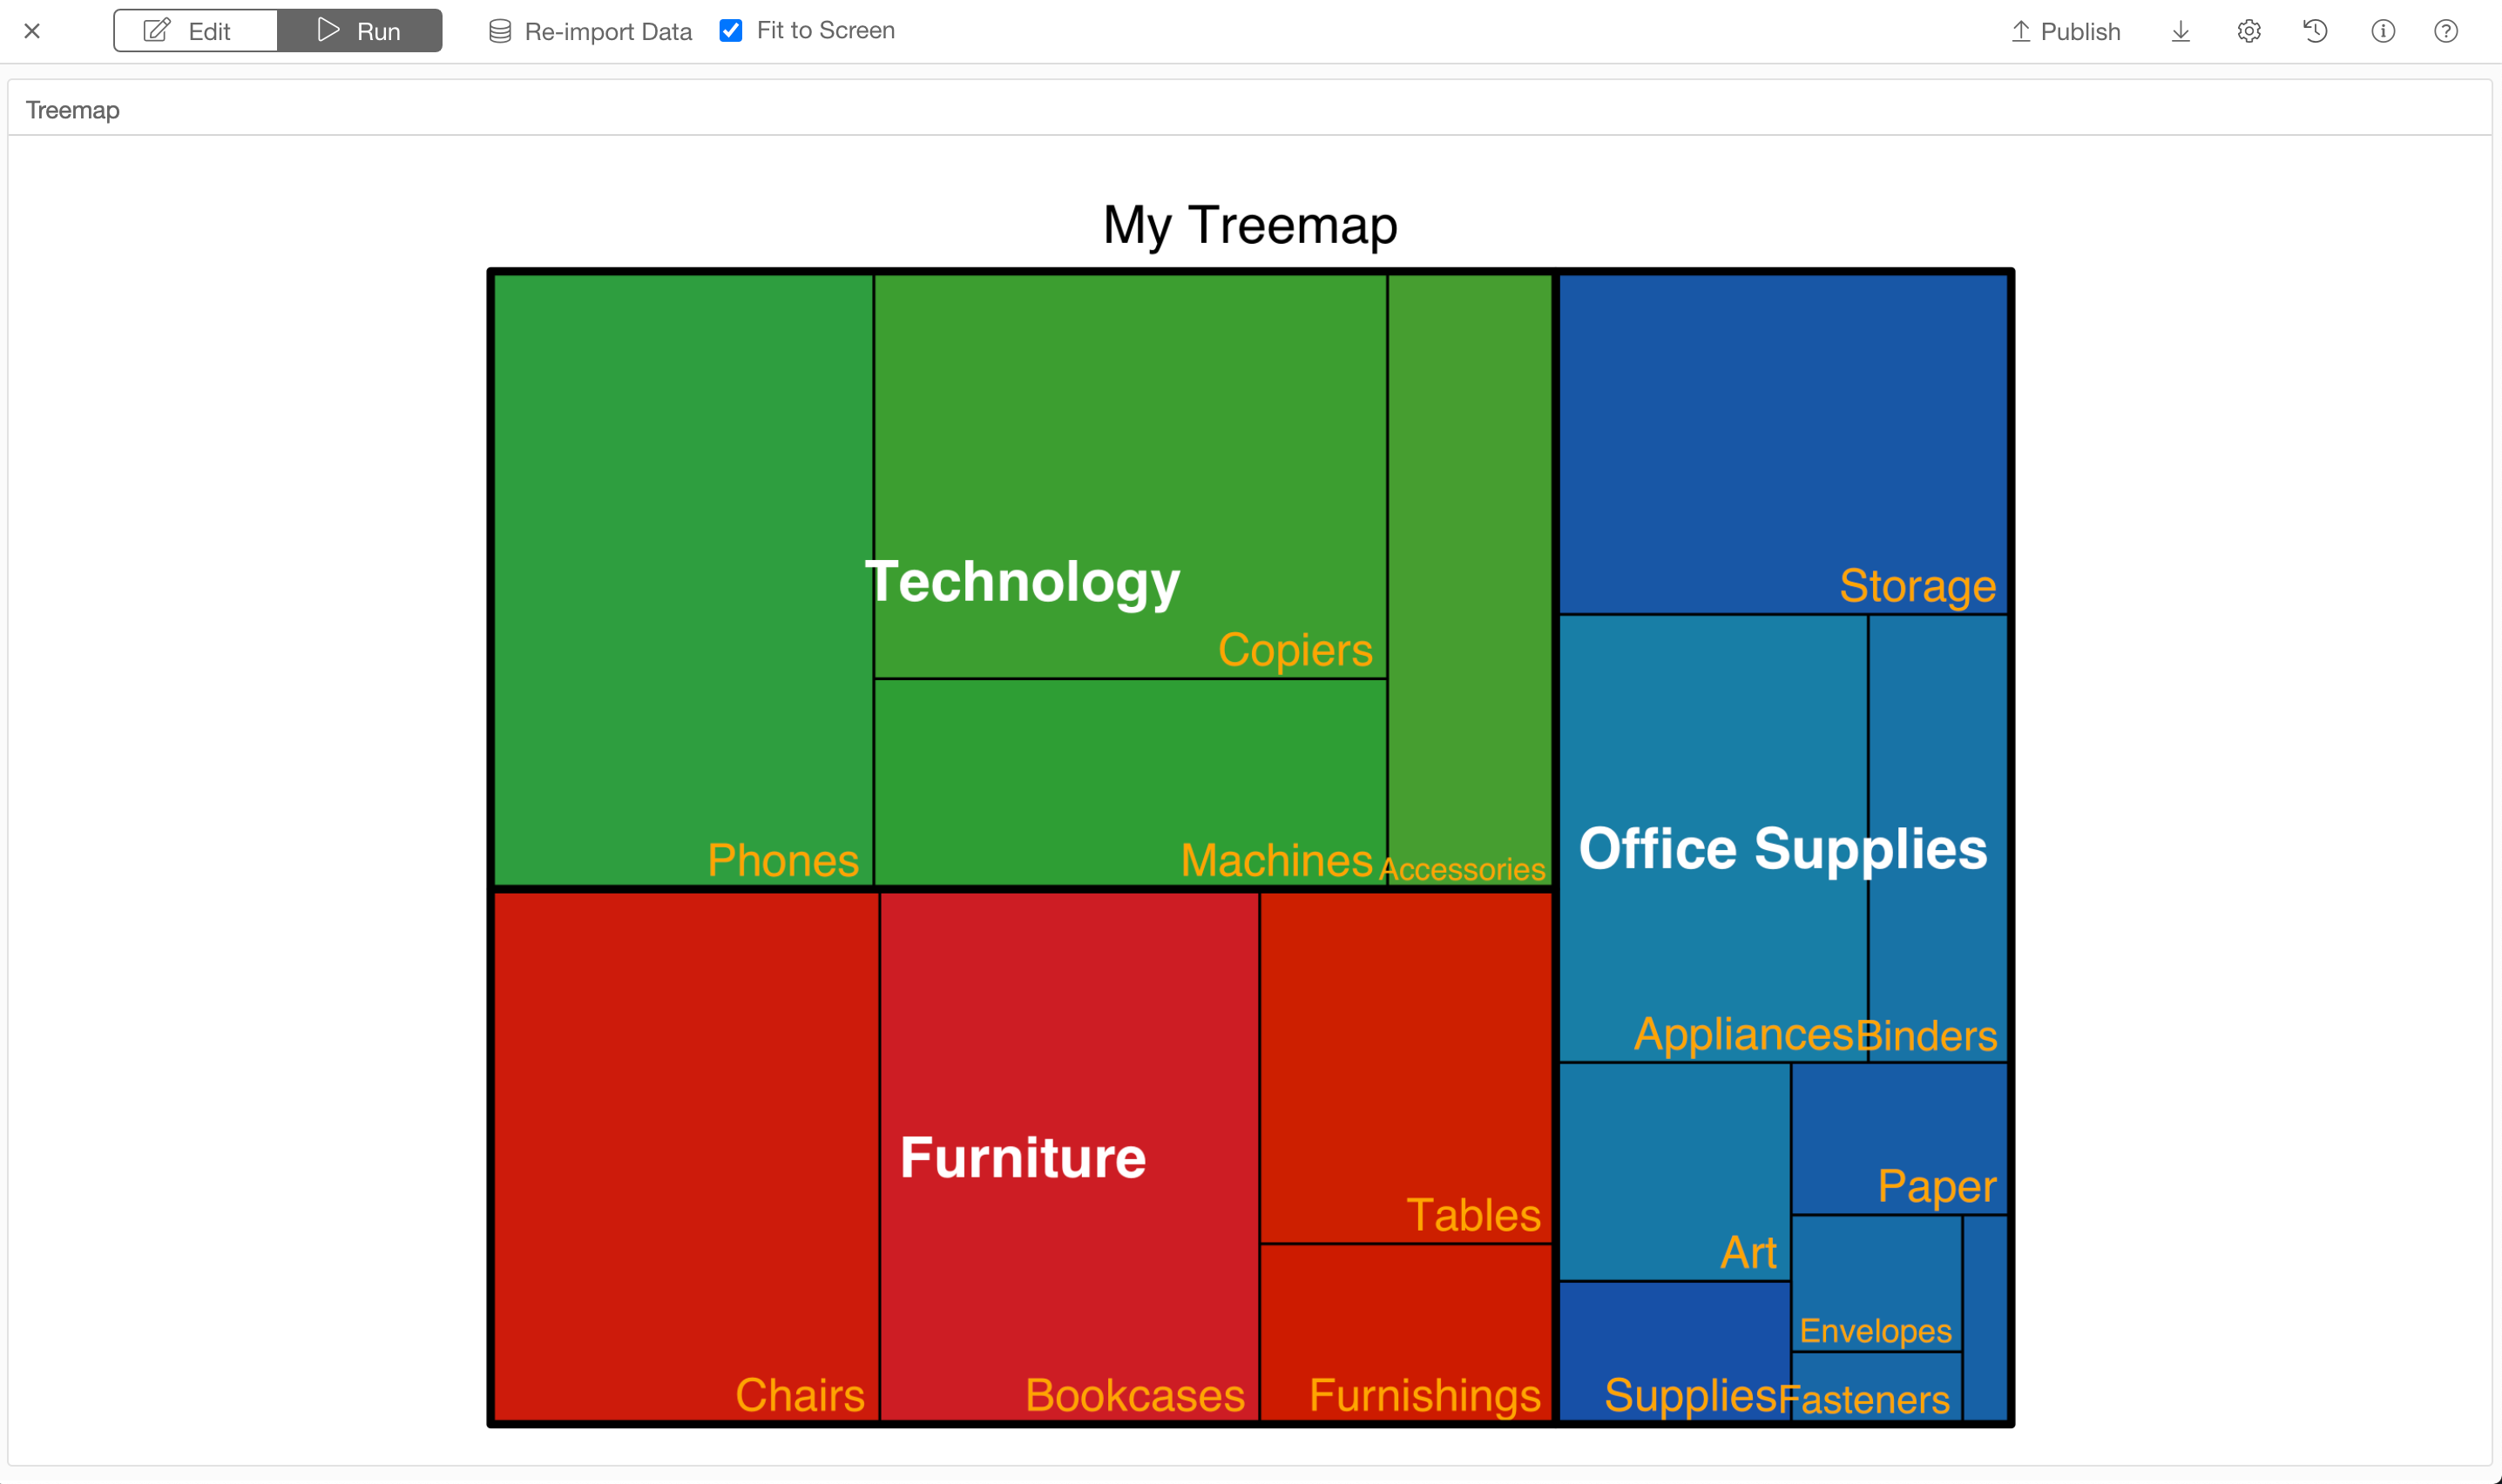
Now the Treemap is createds.
library(treemap)
treemap(Global_Sales_Eng, index=c("Category", "Sub-Category"),
vSize= "Sales",                         # set value
type="index",                            # set the way you color the treemap
palette = "Set1",                        # select collor palette
title="My Treemap",                      # set chart title
fontsize.labels=c(15,12),                # set label size
fontcolor.labels=c("white","orange"),    # set label color
bg.labels=c("transparent"),              # set label back ground color
align.labels=list(
    c("center", "center"),
    c("right", "bottom")
        ))
Add Treemap to the dashboard
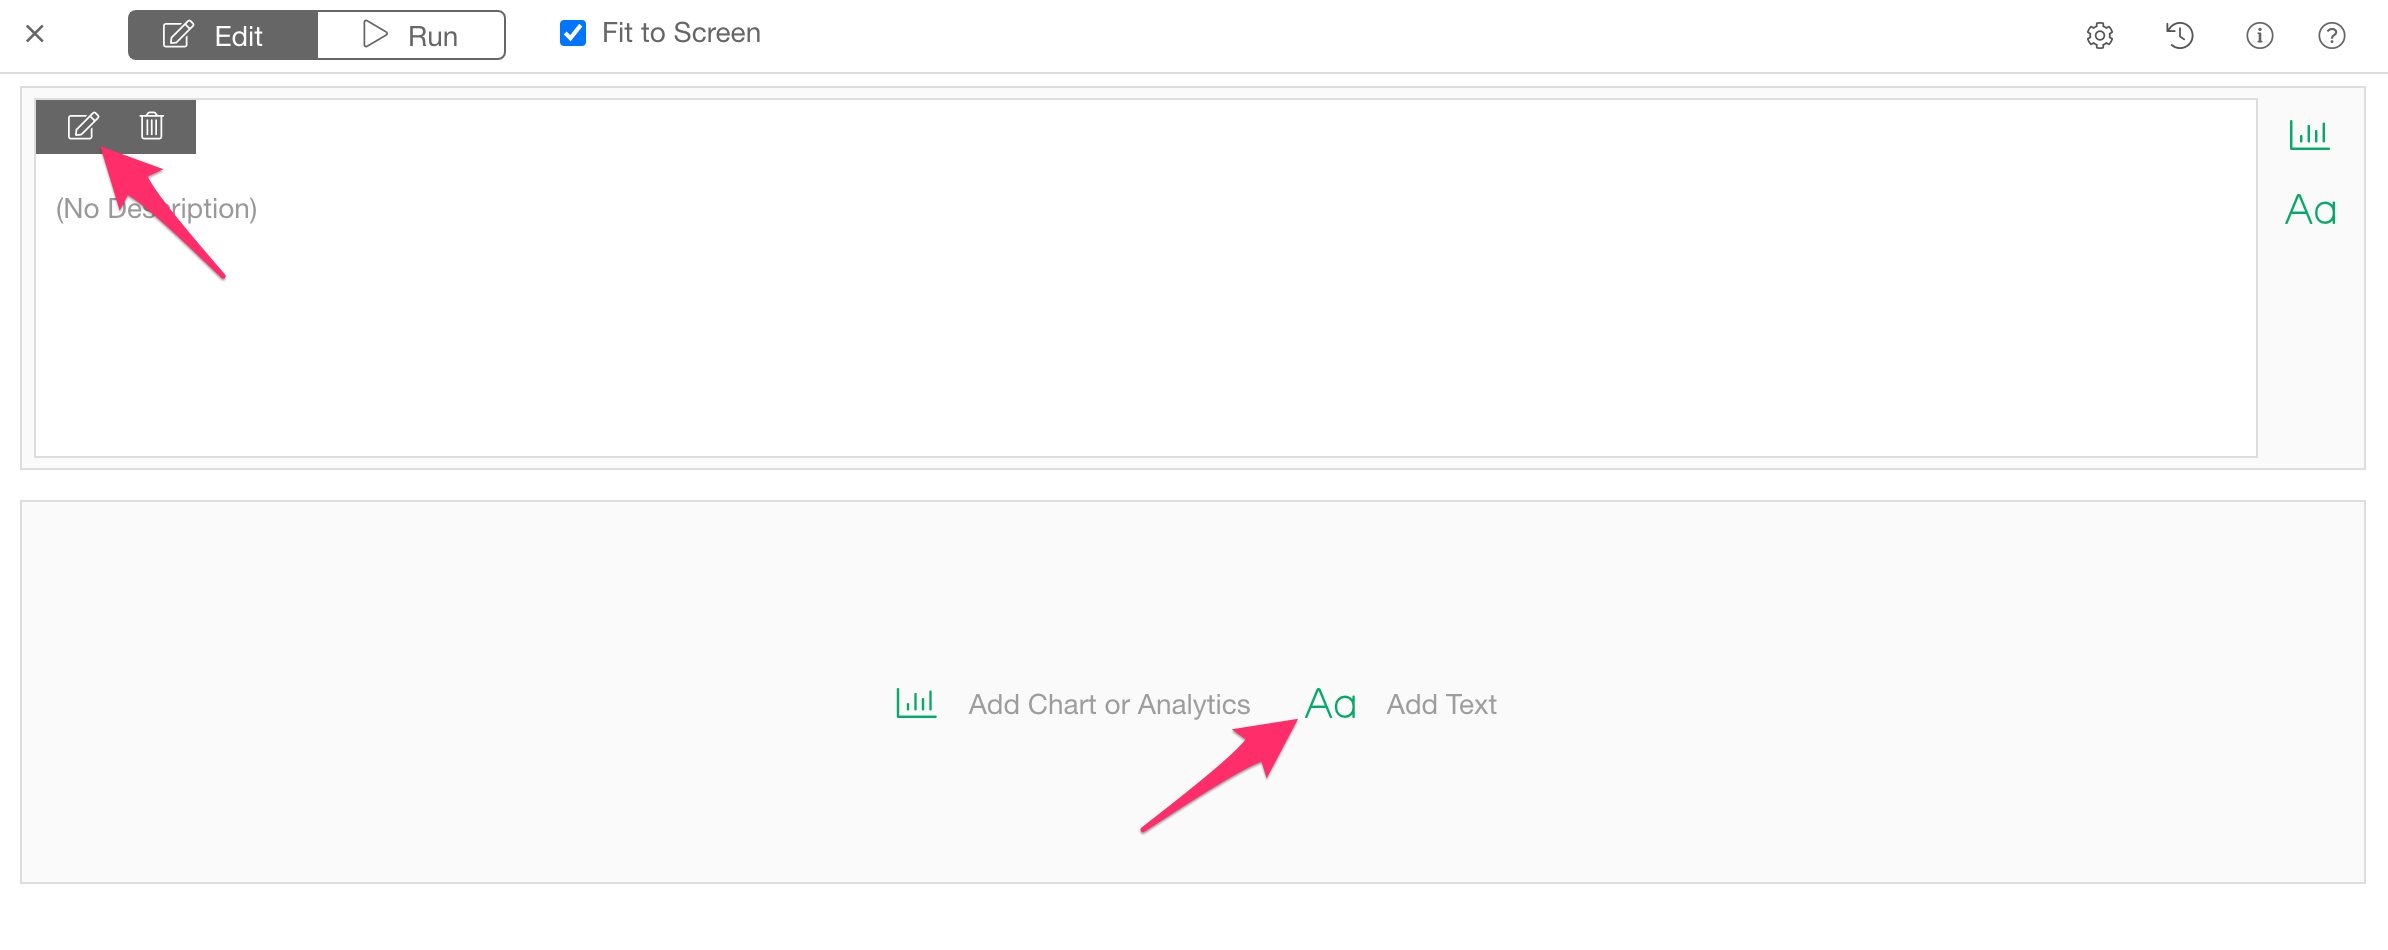
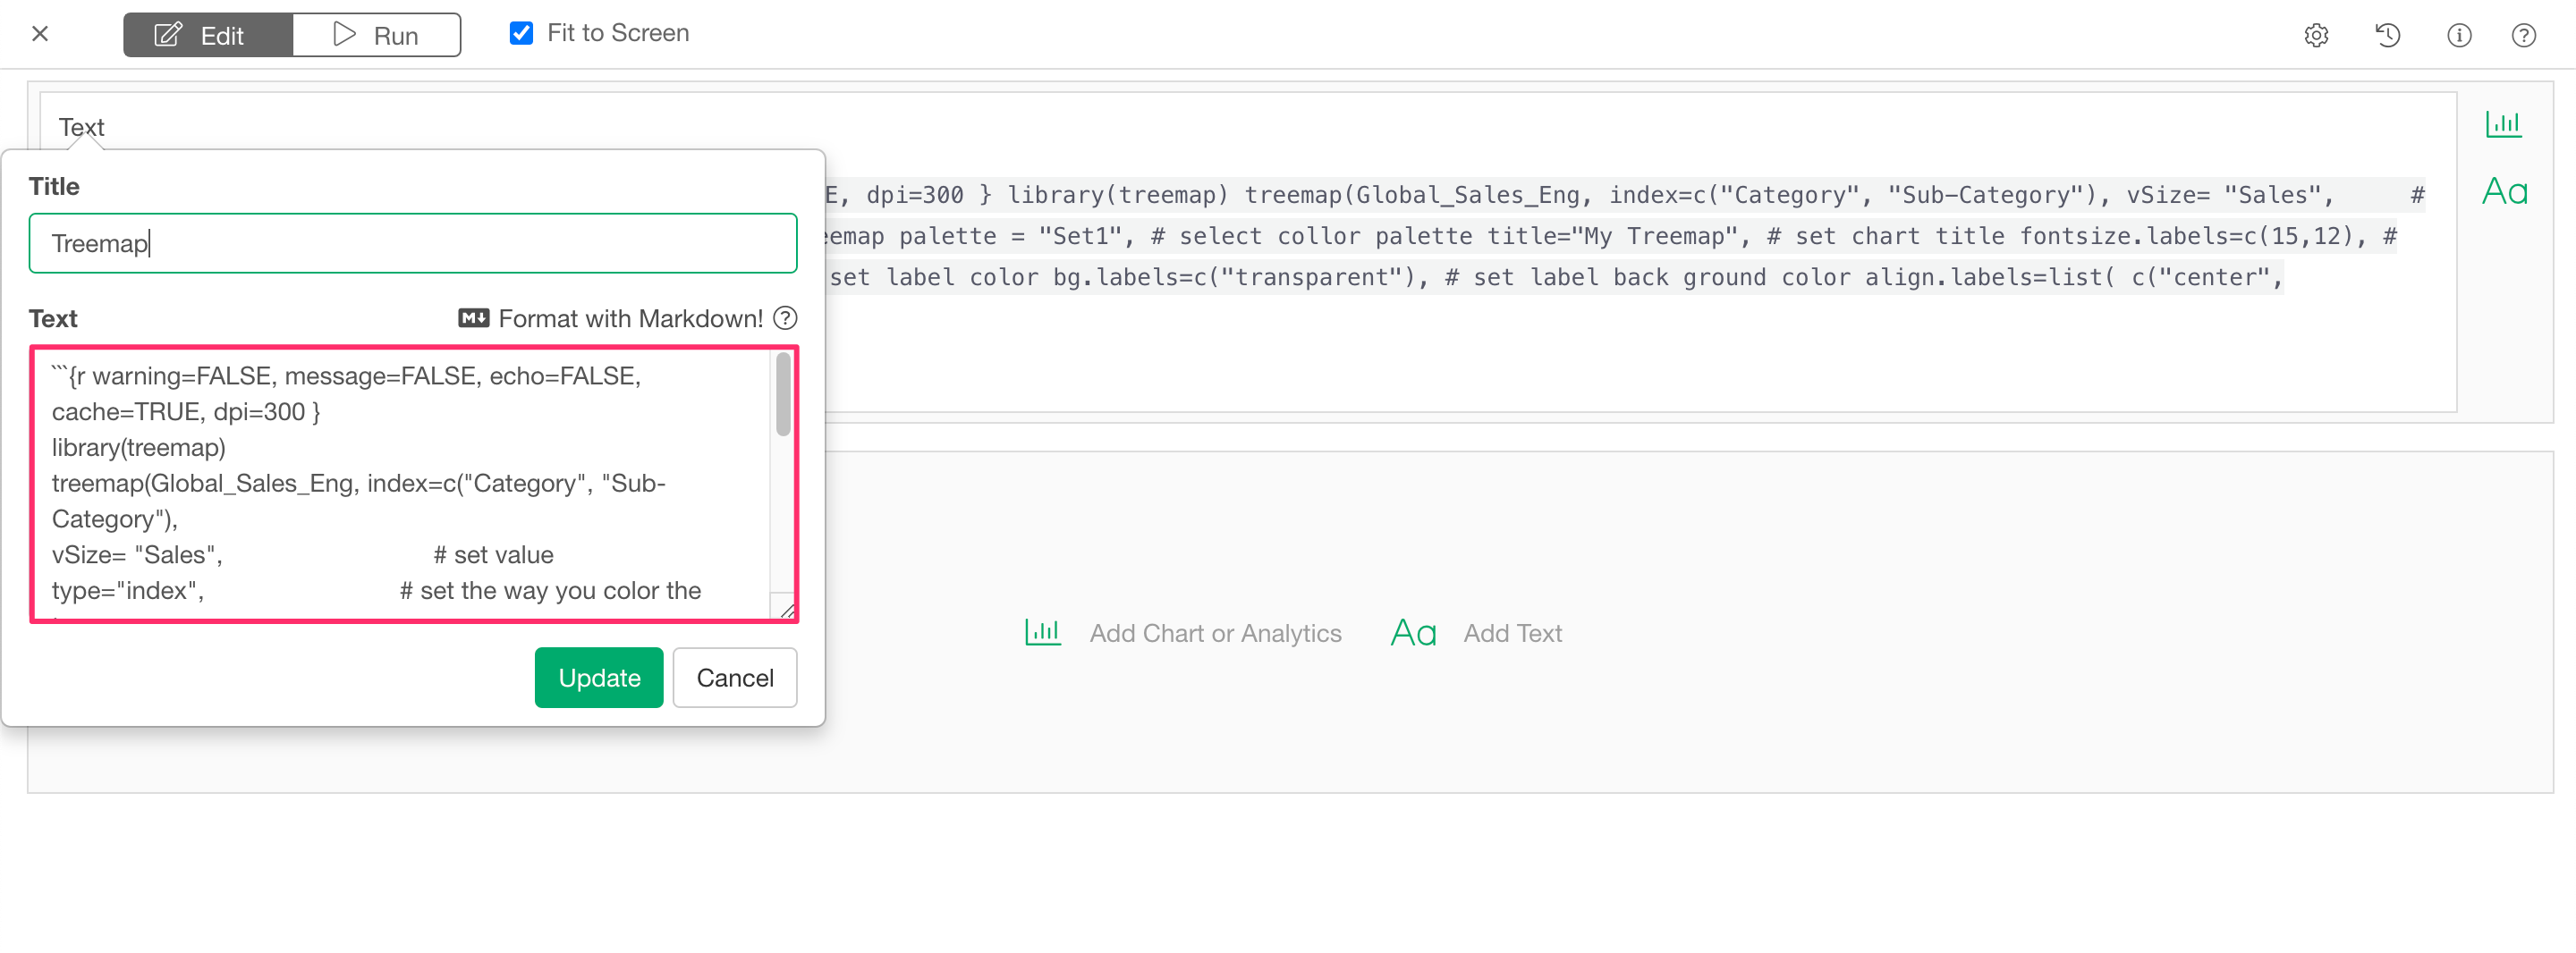
If you want to add a treemap to dashboard, create a new text panel and click the edit button.
Then, add the R Markdown code we used in the note to the text area.
Run the dashboard.
Now we could add a treemap to the dashboard.
You can download the dashboard in EDF format and try it on your own Exploratory!