 Photo by Kelly Sikkema on Unsplash
Cluster Analysis
By Marian Tes
Context
This week in Learning Analytics, we’re working on clustering data. Specifically in this analysis, we’re using data that was collected by the lead instructor of a first-year chemistry course at a mid-sized state university in northeastern U.S. This is a required course for all science majors and consistently has an enrollment of around 100-120 students. The main learning objectives of the course relate to knowledge of core chemistry concepts and manipulation of chemical equations. It is a class that students often struggle with, particularly if they do not have strong prior preparation from high school.
In 2018, the instructor gave students a short quiz in the first week of the class with questions on each of the two key areas to assess their incoming knowledge about chemistry concepts and ability to work with chemical equations; she gave another quiz in the third week on the concepts and equations covered in the first two weeks of the semester to see how, if at all, the students were improving. We’ll perform a cluster analysis on this data to see if we can identify profiles of common student types. This information could be useful to help the instructor better understand the class and how to support them. We will first need to clean and tidy the data to get it ready for analysis (though actually this data comes to us in pretty good shape), then we will be performing a cluster analysis to see if we can identify some number of “groups” (clusters) of students who have similar patterns of data.
Understanding the Data
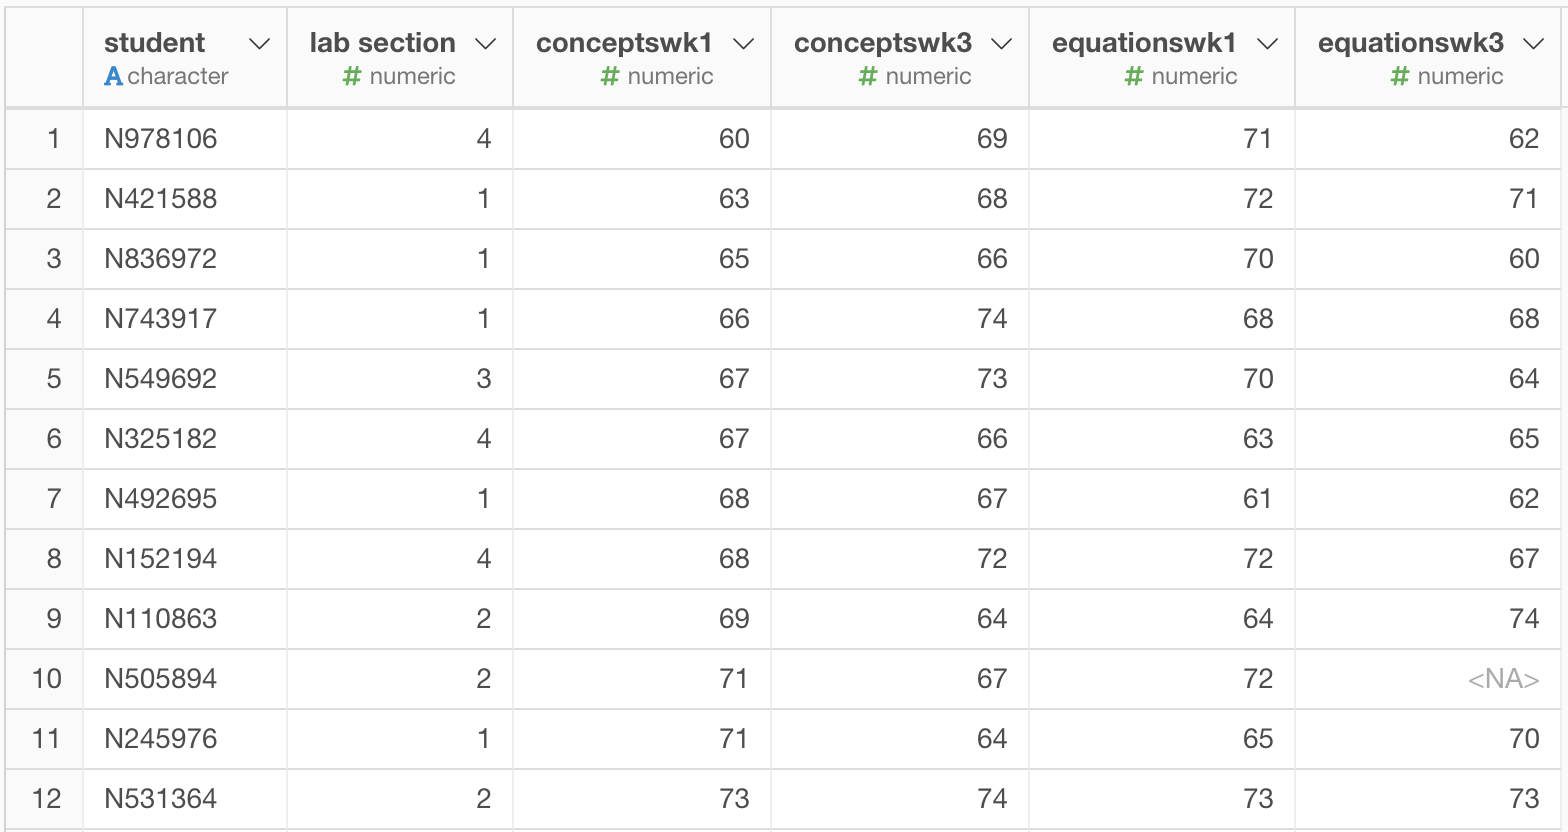
Let’s take a look at the data and characterize it:
First, there are 95 cases in this dataset. This represents the number of students enrolled in the course at the time the data was collected. Below, you’ll observe the summary table from Exploratory. As you can see, there are 95 unique values in “student”; they’re identified by a string of values with a length of 7.
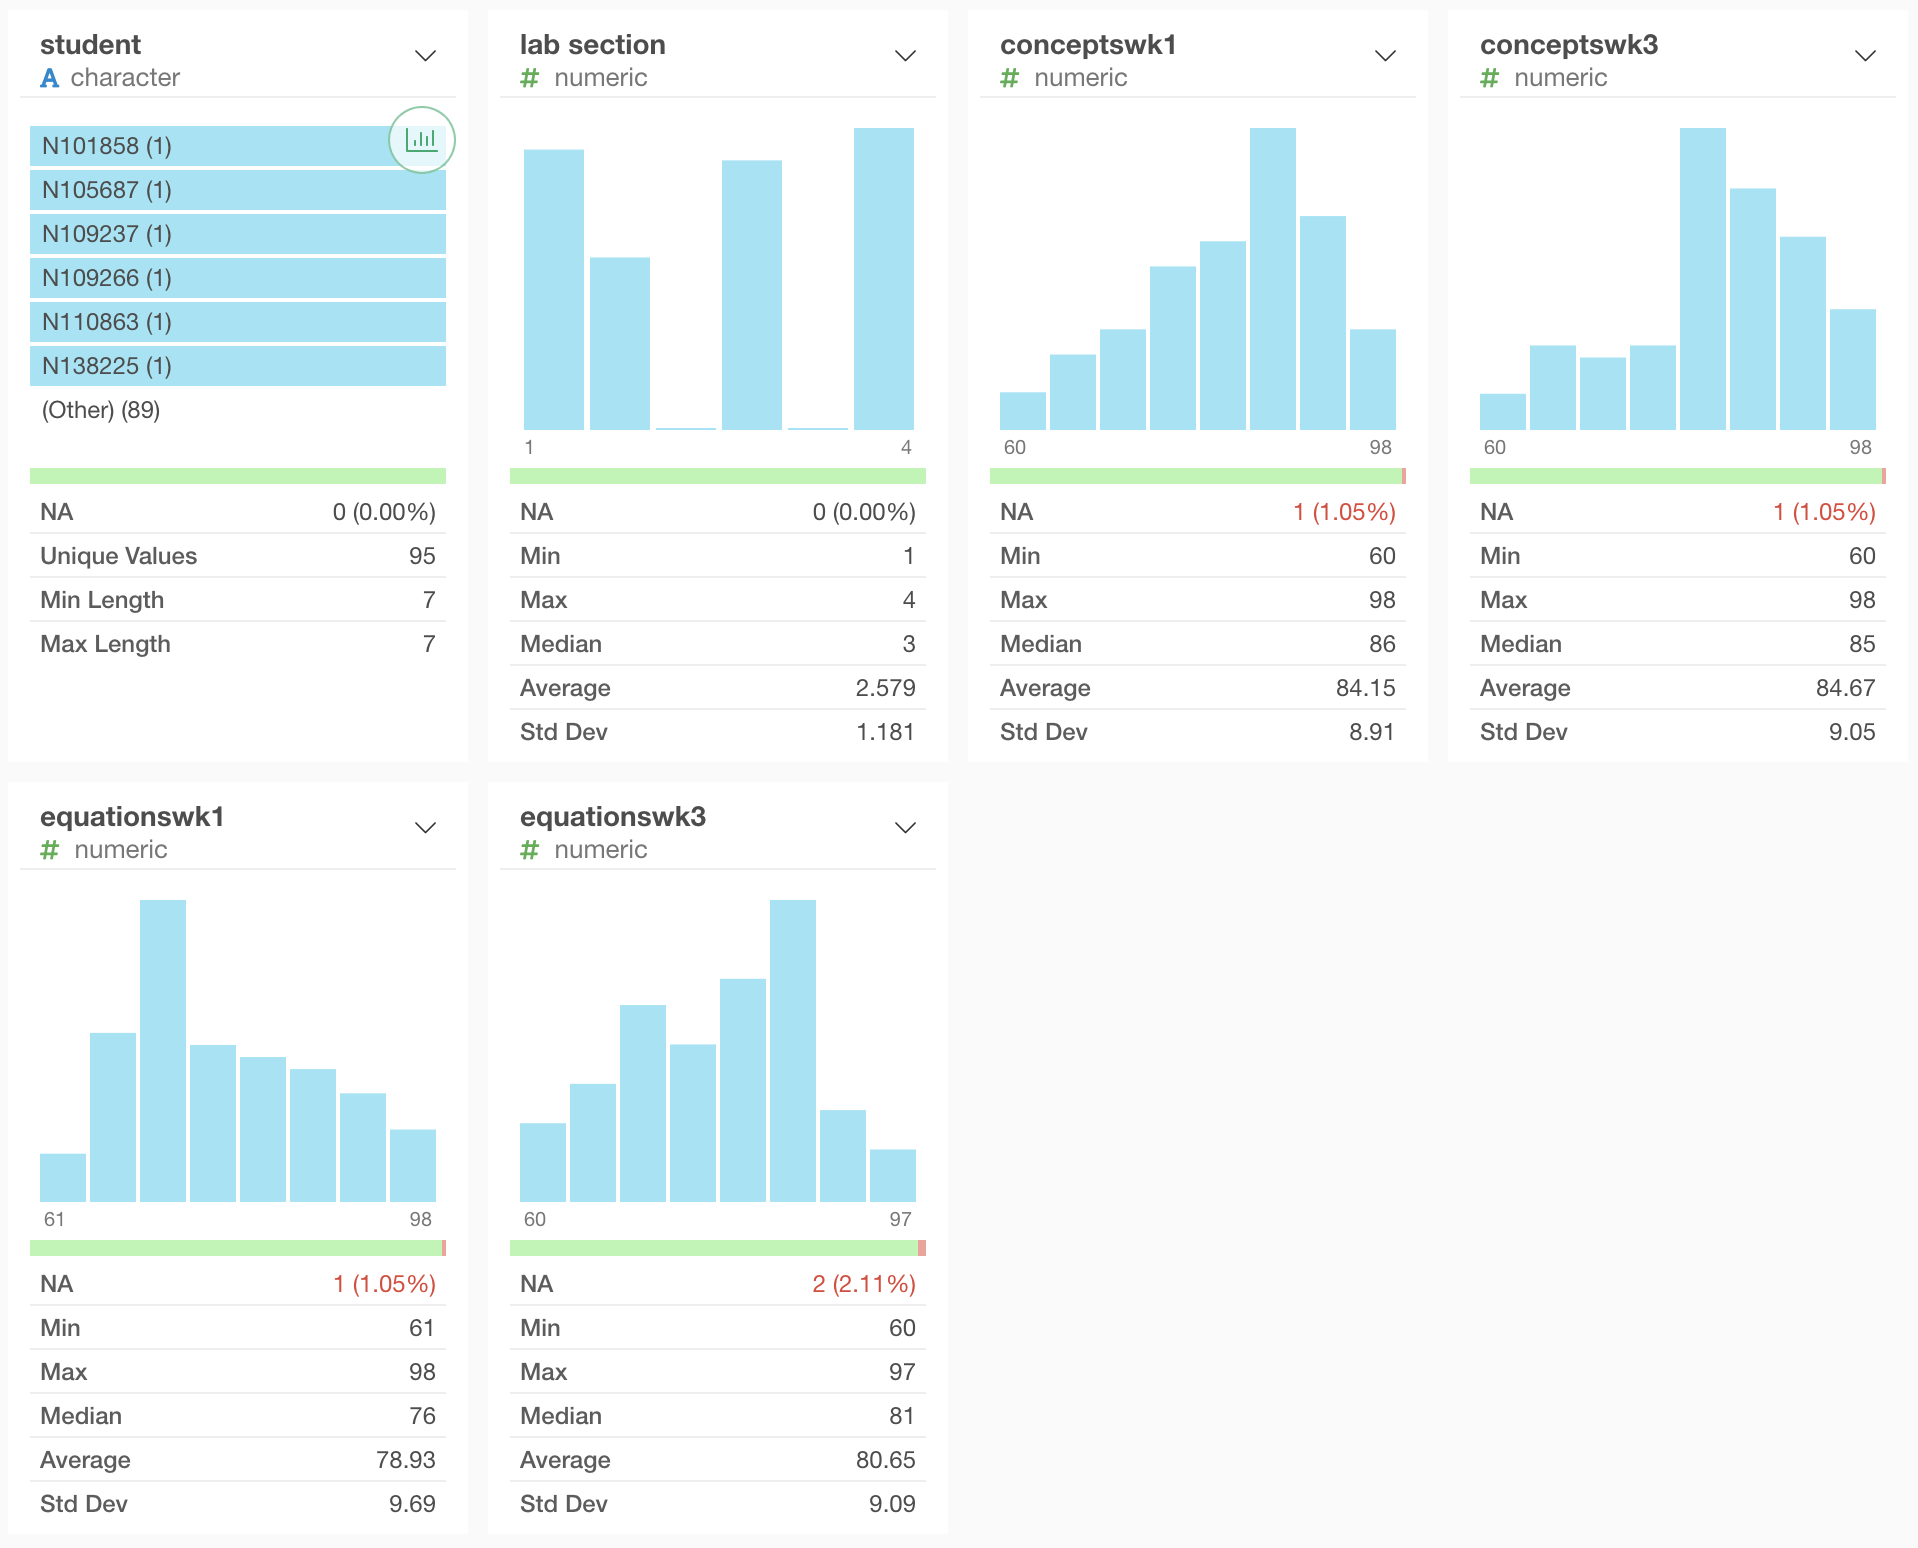
Furthermore, the dataset includes 5 variables that lab section, conceptswk1, conceptswk3, equationswk1, and equationswk3.
- lab section: This represents the section in which each student is enrolled.
- conceptswk1: This represents the scores from the questions taken in Week 1 assessing students’ incoming knowledge about chemistry concepts.
- conceptswk3: This represents the scores from the questions taken in Week 3 assessing students’ knowledge on chemistry concepts learned from Weeks 1-2 of the semester.
- equationswk1: This represents the scores from the questions taken in Week 1 assessing students’ ability to work with chemical equations.
- equationswk3: This represents the scores from the questions taken in Week 3 assessing students’ ability to work with chemical equations learned from Weeks 1-2 of the semester
At first glance, there may be some potential problems with the data. For example, there are missing values (NA) from these variables: conceptswk1, conceptswk3, equationswk1, and equationswk3. This could’ve been caused by a number of factors, such as absences on the days when those quizzes were administered, late enrollment, dropout, and simply errors in data entry.
Examining the Distributions
Here are the histograms of the aforementioned variables:
lab section
Data entry errors might have occured on these cases:
- N505894 - equationswk3 is missing but there is a value for conceptswk3
- N947943 - missing both equationswk3 and conceptswk3 (perhaps, this student dropped out or missed class?)
- N276373 - missing both conceptswk1 and equationswk1 (perhaps, this student dropped out or missed class?)
Potential outliers:
- conceptswk1 - students scoring below 63.8
- conceptswk3 - students scoring below 66
- equationswk1 - no outliers
- equationswk3 - no outliers
In terms of clustering, we don’t want to include lab section as it is categorical and does not have enough variation to be useful for clustering. There is a decent amount of variation with the other variables (conceptswk1, conceptswk3, equationswk1, and equationswk3). This is clear in their histograms as well as the standard deviation values in the summary table from Exploratory, ranging from 8.91 to 9.69.
Since we’re clustering all students across the sections based on unknown characteristics, the variable ‘lab section’ is no longer relevant and should have no implications on the analysis.
If I could go back in time, I would collect more information on prior knowledge (do you enjoy chemistry? have you taken chemistry in high school? what extent are you interested in this topic?) as well as intended major if known. Perhaps, there is a connection with students’ interest and motivation to performance that can’t be explained by performance in the first few weeks of class.
Which variables do you think should be included in the cluster analysis and why?
- conceptswk1 - very important to gather student’s baseline knowledge in concepts.
- conceptswk3 - we want to know if students have improved on this skill
- equationswk1 - very important to gather student’s baseline knowledge in manipulating equations.
- equationswk3 - we want to know if students have improved on this skill
Deciding How Many Clusters to Look For
Let’s glance at the various scatterplots:
conceptswk1 & conceptswk3
- Those who performed well in Weeks 1 and 3
- Those who performed poorly in Weeks 1 and 3
- Those who improved from Week 1 to 3
- Those who did performed well in one area and poorly in another
Clustering the Data
Now, it’s time to run some cluster analysis on the dataset.
X=conceptswk1, Y=equationswk1, & Z=conceptswk3
X=conceptswk1, Y=equationswk1, & Z=equationswk3
I created 4 clusters, but from the above analysis, it doesn’t seem to be clear separations of the data in the plots. It might be because of the angle of the default view, or perhaps the optimal number of clusters is not 4, given the groups look pretty close together.
Below are images of the two at different angles to see the clusters more clearly:
Recapturing x=conceptswk1, y=equationswk1, & z=conceptswk3 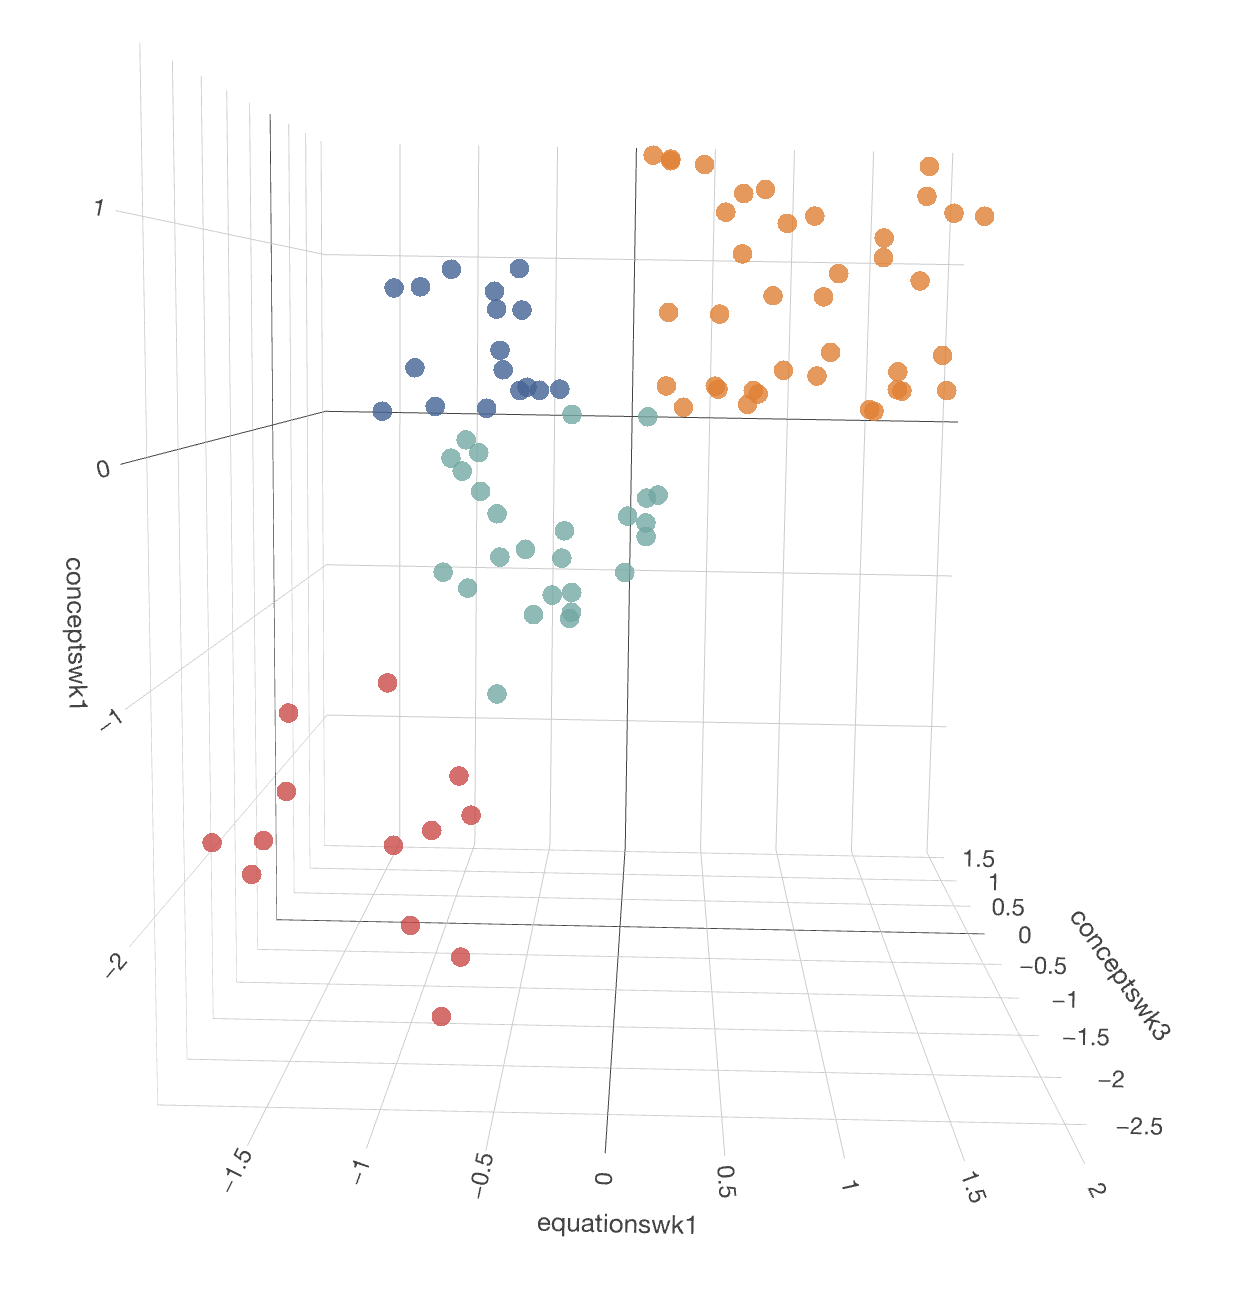 Recapturing x=conceptswk1, y=equationswk1, & z=conceptswk3
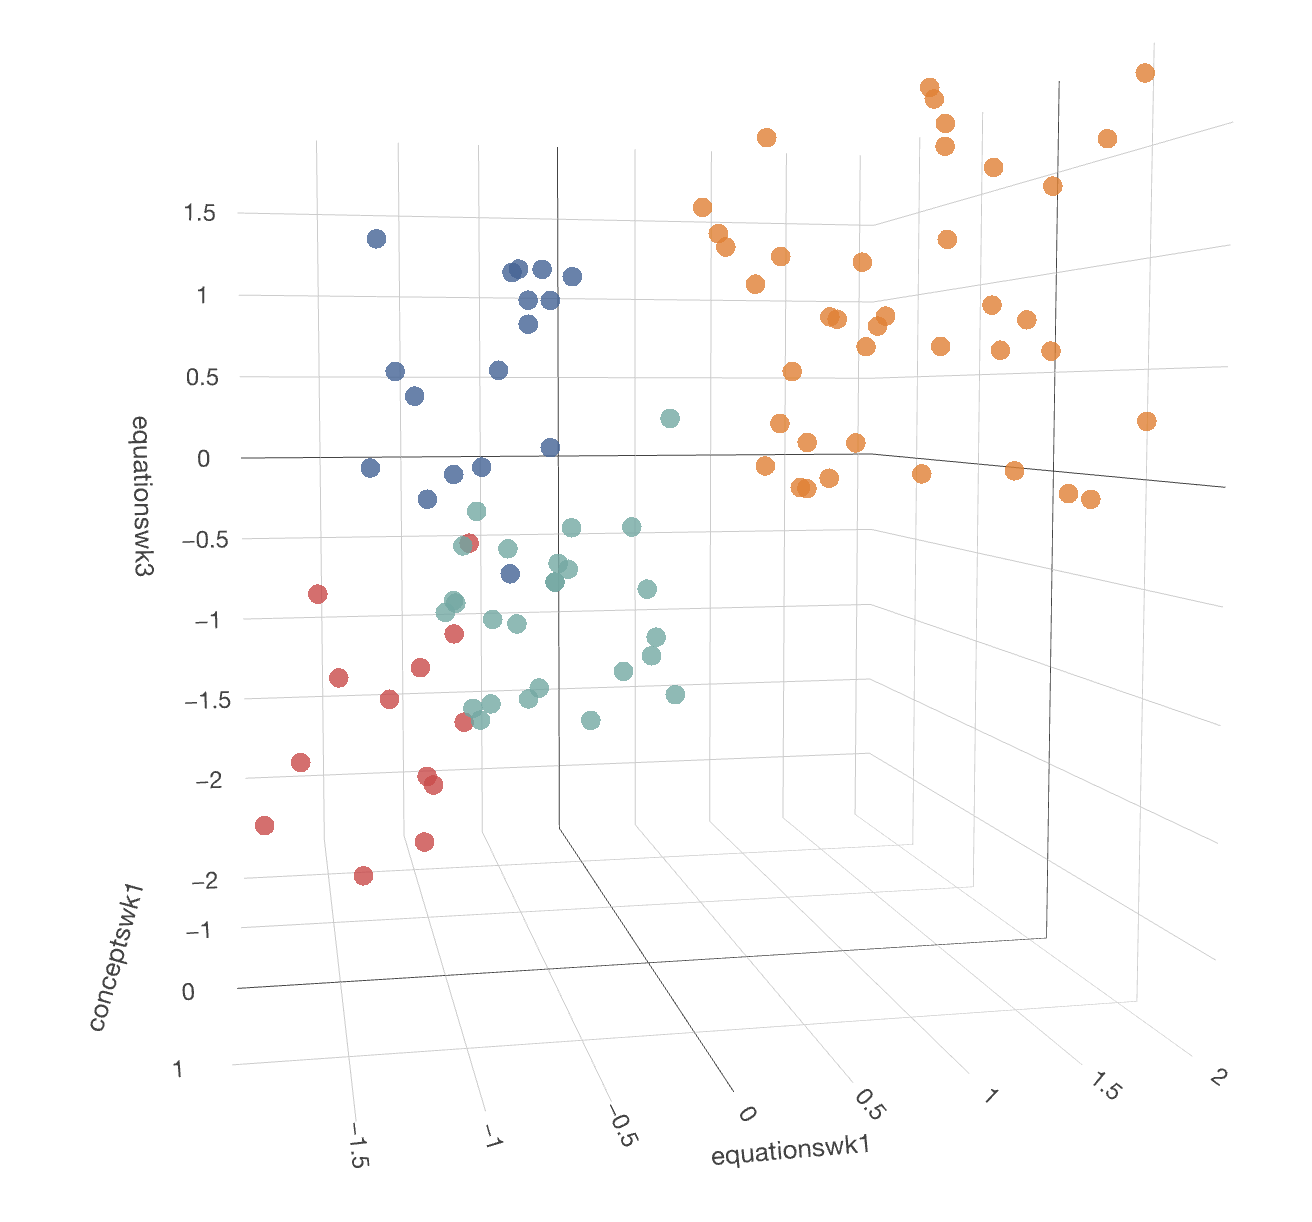
Verifying the Number of Clusters
Based off of the elbow graph and corresponding bar graph and table, it seems likely that the ideal number of clusters is in fact 3, which is different than my initial assessment.
Exploring and Making Sense of the Clusters
Let’s explore the cluster solutions in depth:
For k (number of clusters) = 2
x=conceptswk1, y=equationswk1, and z=conceptswk3
Lows & Highs. For this clustering (k=2), I would describe those with high prior knowledge and those who have low prior knowledge. This grouping reinforces the assumption that prior knowledge of the chemistry concepts might have more advantages than any gains found in the first few weeks of class. As the instructor, this information would lead me to implement different strategies to pair ‘novices’ with ‘experts’ in the classroom and really focus on improving scaffolding for novices.
For k (number of clusters) = 3
x=conceptswk1, y=equationswk1, and z=conceptswk3
Middle Ground. For this clustering, there is one group of high performers. Another that are low performers. Then, there are those whose performance improved in those first two weeks. If I were the instructor in this course, I would be interested in learning more about the group of students who improved their scores. What strategies are they using? How do we leverage these strategies for low performers, who might benefit from additional supports. Moreover, I would be interested in assessing my materials to see what was really effective for those who improved.
For k (number of clusters) = 4
x=conceptswk1, y=equationswk1, and z=conceptswk3
Two by Two. As mentioned before, the groups in this clustering consists of:
- Those who performed well in Weeks 1 and 3
- Those who performed poorly in Weeks 1 and 3
- Those who improved from Week 1 to 3
- Those who did performed well in one area and poorly in another
Looking at these clusters, I would need more information on the group that performed poorly in both assessments. Also, I might consider adding more time between assessments. There could be more gains simply through maturation as students progress through the course. For those who performed well in one area and poorly in another, I would go back to the questions on the quiz to check for whether the questions were representative, ask students informally for feedback on the questions (was it written at the appropriate level of knowledge and competency at the time in the semester?), and I would run a class session reviewing the common questions and pitfalls that the class had.
For k (number of clusters) = 5
x=conceptswk1, y=equationswk1, and z=conceptswk3
Splitting Hairs. This clustering would include all the other groups aforementioned but might include a somewhat arbitrary division between average performers. I would implement similar strategies as described with k=3 and k=4.
Final Discussion
What do you think is the best cluster solution for the data in this situation and why?
I think the best cluster solution for the data is k=3. If the goal of cluster analysis is to find similar groups of students in order to improve learning, then this solution makes the most sense. We were able to isolate between high and low performers with those who improved even during those short few weeks. Initially, I had proposed that the data included 4 distinct groups including, (a) those who performed well in Weeks 1 and 3, (b) those who performed poorly in Weeks 1 and 3, (c) those who improved from Week 1 to 3, and (d) those who did performed well in one area and poorly in another. Groups (c) and (d) might not be significantly different in terms of characteristics.
How good is it and are there any other solutions that come close?
From the elbow graph, it seems that k=4 comes pretty close with 100.28 total within-cluster sum of squares as compared to 113.47 with k=3.
What, if any, ethical issues are there related to the application of this analysis to inform instruction?
First, if students aren’t aware of how their data is used it could raise some ethical issues. If they are informed, how would this change students’ behavior? Any potential ethical issues would really depend on how this analysis informs instruction, especially if there is any mistreatment or bias towards one group of students over another.
Do you think clustering was a useful approach in this situation? Why or why not?
The goal of this analysis was to identify profiles of common student types. While I feel we’ve gotten closer to doing this, the instructor might need to find out more information. The quiz in the third week was really to see if students were improving, if any, and the cluster analysis revealed this. This information could be useful to help the instructor better understand the class and how to support them.
What additional data would you want the instructor to collect if she repeats the exercise next year?
If the instructor were to repeat this exercise next year, I would want her to gather the following information:
- What relevant courses have they taken?
- Why are they taking this course?
- Are any of these students majoring in this subject?