Cohort Analysis - Retiontion/Churn Analysis with Survival Curve
To see the retention/churn rates over time and compare them among various cohorts (groups) of customers.
- Over the customer lifetime when do the customers churn the most, at the first month, or in the first few months?
- Does the churn stabilize after a certain time period? Or, would the retention rates keep dropping until everybody churn?
- If the retention becomes stable, when is it? And what is the retention rate when it becomes stable?
- Is the customer retention getting better or worse over time?
- Are the recent customers tend to churn more or less compared to the older customers?
Objective
- Survival Curve - Understand Customer Retention / Churn Better
- Survival Rate - How to Calculate?
- Cohort Analysis - Compare Customer Retention among Groups
Get Data
Data Requirement
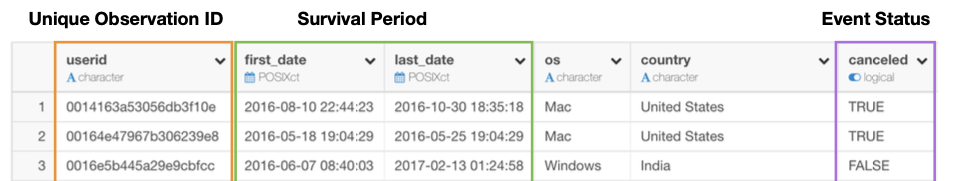
One row represents one observation. Each observation needs to have the following information.
- Unique ID
- Start Time
- End Time
- Event Status: e.g. Cancelled, Quit, Died, etc.
Run Survival Curve under Analytics
- The X-Axis shows how many months have passed and the Y-Axis shows the survival rate (or retention rate).
- The survival rate at the first month is 67%, which means that about 33% of the customers have churned by the end of the first month.
- After that, the slope of the curve becomes stable, which indicates that the churn seems to settle.
- After the 7th month or so the curve flattens at 50%. So a half of the users retained after a certain period of time.
Survival Curve Data
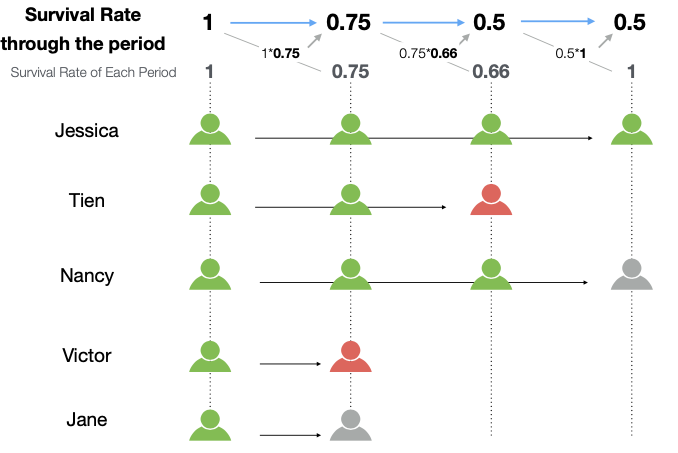
- Algorithm ‘Kaplan-Meier estimator’ calculates the survival rate though the lifetime taking into an account for the censored data.
- Time - (e.g. months since sign up) In survival data, one row represents one point of time.
- Observations - Number of observations whom the event hans’t happened to yet at a given • Events - Number of observations whom the event happened at a given time. Censored - Number of observations censored at a given time.
- Survival Rate - Survival Rate through this point of time. These are the values visualized as Survival Curve
- Std Error - Standard error for the estimates
- Conf Lowq - Lower limit of the confidence interval for the estimate Conf High - Upper limit of the confidence interval for estimate
| Time | Observations | Events (cancelled) | Censored | Survival Rate of the Month | Survival Rate through the Month |
|---|---|---|---|---|---|
| M 0 | 2914 | 0 | 821 | 2914/2914 = 1 |
1 |
| M 1 | 2127 | 692 | 183 | (2127-692)/2127 = 0.674 |
1*0.674=0.674 |
| M 2 | 1252 | 70 | 120 | (1252-70)/1252 = 0.944 |
0.674*0.944=0.636 |
Compare among Multiple Cohorts
Cohort-OS - Survival Curve
The Mac users are performing better and the Windows users tend to churn earlier than the Mac users, although both of them eventually flatten around 50% to be very similar.
The confidence intervals of the two are not overlapping up through the 3rd month.
*There is no much difference between the two after the 4th month.
Cohort-Country - Survival Curve
Keep only the 3 most frequent countries and put all the other countries in a group called ‘Others’.
The curve for United Kingdom looks better than the others.
The 95% confidence intervals are overlapping on each other. There is no significant difference between United Kingdom, Japan, and United States.
Cohort-JoinedDate - Survival Curve
- Create the cohorts based on when the customers joined (converted).
mutate(joined_date = first_date)Assign the joined_date column to Color By and round by month.
The cohorts of 2016-08 and 2016-09 are not performing well. The customer retention rate gets better after that and keeps above 60%.
Summary
Cohort Analysis (or Retention Analysis) helps you understand the health of your SaaS or Subscription business better.
By looking at the survival curve we have a clear view into how our customers retain or churn, which would help us calculate the customer lifetime value.
And comparing the survival curves among the cohorts we can see if the business is performing better from the customer retention point of view and see where the problems are.
Reference
Online Seminar #43 - Cohort Analysis Part 2 - Retention / Churn Analysis with Survival Curve https://exploratory.io/note/kanaugust/Online-Seminar-43-Cohort-Analysis-Part-2-Retention-Churn-Analysis-with-Survival-Curve-Aax5TJP4gg
Transform real life data for survival analysis. https://blog.exploratory.io/an-introduction-to-cohort-and-survival-analysis-29a8cc74a5d
An Introduction to Cohort Analysis with Survival Curve https://blog.exploratory.io/an-introduction-to-cohort-and-survival-analysis-29a8cc74a5d