- Prediction of Final Grade based on first and second evaluation
viii. Reflect about if we could predict the final grade based on the previous two grades
G3~G1 R-Squared 60%: 60% of the G1 fit to the final grade in the regression model. A Scatterplot displays, with exception of a few outliers (e.g., G3 actual value of zero vs predicted value of 5.6), that a predicted final grade is fairly close to the actual final grade (G3) if G1 is used as a predictor variable.
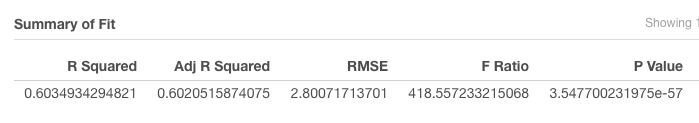
G3~G1
G3~G2 R-Squared 87%: 87% of the G2 fit to the final grade in the regression model. A Scatterplot displays, with exception of a few outliers (e.g., G3 actual value of zero vs predicted value of 7.7), that a predicted final grade is strongly close to the actual final grade (G3) if G2 is used as a predictor variable.
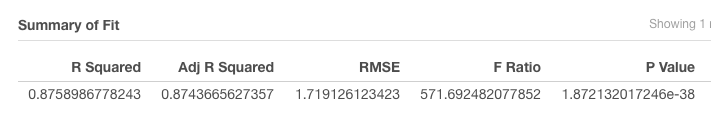
G3~G2
G3~G1+G2 R-Squared 90%: 90% of a combined of G1 and G2 fit to the final grade in the regression model. A Scatterplot displays, with exception of an outlier (e.g., G3 actual value of zero vs predicted value of 7.9), that a predicted final grade is extremely close to the actual final grade (G3) if the combination of G1 and G2 is used as a predictor variable.
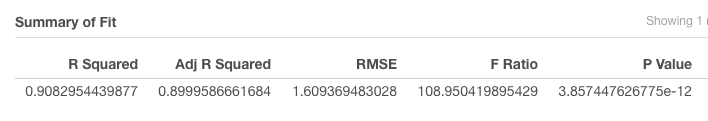
G3~G1+G2
G3~All other variables R-Squared 26%: 26% of a combined all variables (except G1 and G2) fit to the final grade (G3) in the regression model. This indicates that the combination of all other variables than G1 and G2 doesn’t correlate to the final grade well. In other words, some predictor variables don’t affect the final grade much. A Scatterplot displays that a predicted final grade is widely scattered away from the actual final grade (G3) if the combination of all variables is used as a predictor variable.
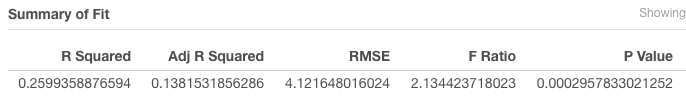
G3~All Var
ix. Reflect about what of the created models (G3~G1, G3~G2, G3~G1+G2 or G3~All variables) is more accurate. Based on the above 2.viii analysis, G3~G1+G2 provides the most accurate prediction. A combined G1 and G2 provides 90% R-Square which represents and the combined two predictor variables is highly correlated to the final grade (G3) in the regression model. By using the combined G1 and G2 variables, the scatterplot validates that a prediction value is also highly close to the actual final grade.
x. Reflect about what of the created models is more useful and why. The regression model is useful to validate correlation between variables. The model can facilitate to predict a future outcome by using actual data (variables). The key for the prediction accuracy is driven by use of relevant predictor variable(s). If more than one predictor variables are meaningfully relevant in predicting a model, the combination of the predictor variables generate a stronger fit-to-model, meaning that strong fit between the actual outcome and a predicted outcome.
- Prediction of risk of Failing (Logistic Regression)
v.1. How good is the model? Out of 95 students who actually fail based on the average of G1, G2 and G3 <12, 73 students are predicted to fail if all other predictor variables are taken into the account. The fail prediction probability of 63% (73 actaully fail and predicted fail /116 total predicted fail students) implies that all other variables also fairly support the fail prediction.
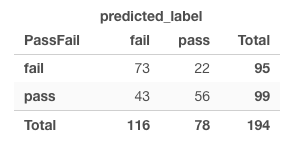
Out of 99 students who actually pass based on the average of G1, G2 and G3 >12, only 56 students are predicted to success if all other predictor variables are taken into the account. The pass prediction probability is 72% (56 actually pass and predicted pass / 78 total predicted pass students). It implies that all other variables also support the pass prediction strongly (See matrix above).
So the question is whether all other predictor variables support fail/pass prediction regardless of student’s actual pass/fail performance. The binary result doesn’t provide a full picture which side (pass or fail) each variable support, neither does provide the magnitude.
v.2 Is there any problem with the model? The initial logistic regression outcome is generated by taking all other variables into the account. However, we don’t know the accuracy of the outcome if we eliminate certain predictor variables. In other words, we can’t assume that all variables support the risk of fail prediction.
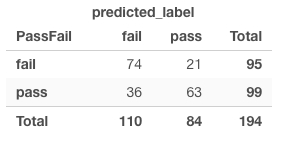
v.3 If there is a problem with the model, create a new model without the problem and check its confusion matrix. I eliminated some variables from the original model. The eliminated variables include both positive and negative strong coefficient. The eliminated variables include: SexM (-1.07), Nurseryno (-0.18), SchoolMS (-0.97), Internet (-0.11) Walc (-0.05), FamsizeLE3 (+0.56), Reasonothe (+0.52), Medu (+0.36), Activitiesy (+0.27), Freetime (+0.12), Famsupno (+0.38).
The revised outcome generated a different result. Students who actually passed based on the grade are predicted to fail less with selective predictor variables than the original model with all variables included.
v.4 What is your conclusion? Based on the results above, the confusion matrix based on the logistic regression provides a limited picture even if it is easier to generate an easy-to-read binary outcome. Logistic Regression provides a measure of coefficient and a direction of association (positive or negative). Therefore, a key point is to select relevant variable predictor(s) to produce more accurate prediction.
- Decision Tree
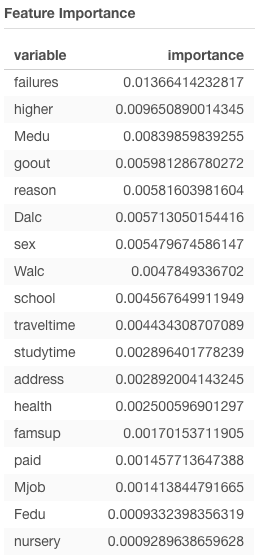
d.i What are the most important variables according to the decision tree? Failures. The importance tab displays the importance level of Failures is valued at ~16 compared to the second important variable valued at ~9. That being said, Failures is the most important variable by an outstanding margin. In addition, Failures the first decision-making category in the decision tree.
Analytics 1 - Importance
d.ii What are some patterns/rules that appear to be present in the data In decision-tree, the variables for decision-making from top to bottom are not categorized consistently with their respective importance level. In overall, most variables that have a high-value of importance (e.g., Failures, Absences, Reason, Dalc) are clearly used in the upper decision-making category to predict the risk of student’s fail.
Another pattern is that the percentage of erroneous classification is lower in predicting the risk of fail and higher in predicting the risk of pass. This percentage of erroneous classification indicates to support the prediction of fail risk, meaning that the more satisfying the fail-of-risk variables, the less erroneous of fail prediction.
The partition rules (threshold value) in the decision tree makes sense to determine the risk of fail or not (pass) logically. The data analytic proves the sense-making logic by showing the percentage of erroneous classification.
Analytics 1 - Tree
d.iii Do these rules make sense to you or are they just coincidence? The rules (categorizing variables by their importance level) generally makes sense. A series of categorizing decisions (yes/no) are preconditioned to the previous (upper category) decisions. As long as the variables are rationally categorized from top to bottom based on their importance level related to a prediction outcome, a chain of tree decisions provides a logical outcome in prediction with a lower percentage of erroneous classification.
e.i Could this model be used to identify students at risk? We can apply each decision category with the respective partition rule to sort out students at risk. The exemplary process can be: a) The first category: previous failures >=0.5 --> identify students who failed >=0.5 b) The second category: previous failures <0.5 and daytime alcohol consumption >=3 --> identify students who never failed but consume alcohol weekdays >=3 times
e.ii Would you use this model? How? As noted above, by using the decision-tree outcome and partition rules on each predictor variables, I can apply it to the database table and pivot individual students at risk.
- Random Forest
f.i Is Random Forest better than the others? Random Forest ranks the importance level of all variables in predicting an outcome. If a tree-based algorithm that leverages the multiple decision trees in predicting the outcome, it is better than a decision tree model. If each node (predictor variable) works in the subset of multiple decision trees first, then combines the individual outcomes, the final outcome will be more accurate than a simple decision tree approach.
f.ii Which Threshold selection value would you use to create an application guide instructor-led intervention for students at risk of failing the course? I tested 4 different threshold: manual (0.5), F-score, accuracy rate, precision. Then compared the student matrix of actual pass/fail vs. predicted pass/fail. The test using accuracy rate for optimization as threshold value provide the best outcome. Given that all variables (Except grades) taken into consideration based on the importance level in prediction, the matrix shows that students who actually fail (average of 3 grades <12) are predicted to fail at ~69% range (78 students who actually fail and are predicted to fail / total 113 students who are predicted to fail). Students who actually pass (average of 3 grades >=12) are predicted to pass at ~74% (60/81). The other tests diaplay either pass prediction rate is too high and fail is too low or vice versa. The test with Accuracy rate threshold provides more balanced high prediction rates on both fail/pass.