Assignment 2: Predictive Analytics
Working on student_mat dataset
1, b, i) List at least 2 things that you find noteworthy in the distribution of values in the different columns
- So the first thing I noticed was that there was quite a lot (personal) information about the learners that really does not have a lot to do with education per se. Or at least connecting some of the columns to eduction or impact on eduction would be a bit of a stretch.
- The second thing I noticed was the fact that there were a bunch of categories or columns where likert scales have been used. This kind of measure gathers very subjective data, and as a result we should be very careful in considering whether to involve it when building predictive models, especially when you are trying to predict who will fail or pass from an early stage.
2, a, viii) Reflect about if we could predict the final grade based on the previous two grades.
So as we can see in the graph below the G3~G1+G2 model is pretty good at approximating what the score for G3 would be. The linear regression trend line has an R2 value of 0.87 meaning that the model could explain 87% of the variance in the data. This is very good and if you use the mouse to hover over the trend line, moving up and down, one will see that the predicted value is always relatively close to the final score. In the middle of the line there are points where the predicted value is off with less than 0.5 (G3: 10.17 and PV 10.02). All in all the G3~G1+G2 model is a great tool (for an instructor) to give you an indication of where a studnet is heading and whether or not they need assistance. It will not be a good idea to provide students with these insight as it will negatively impact motivation in both directions. Students who are predicted to do well might think that they don't need to work so hard anymore and students who are predicted do do badly might give up eniterly.
Scatter plot for predicted value (G3~G1+G2 model) and G3
2, a, ix) Reflect about what of the created models (G3~G1, G3~G2, G3~G1+G2 or G3~All variables) is more accurate.
Scatter plot for predicted value (G3~G1 model) and G3
After examining the scatter plots and their linear regression trend lines above, it is clear that the models of G3~All Variables, G3~G2 and G3~G1+G2 are the most accurate at predicting G3. The All Variables Model has R2 value of 0.84, the G2 Model has a R2 value of 0.87 and the G2+G2 Model has a R2 value of 0.87. So they are all relatively good at predicting G3. The G1 Model has a R2 value of 0.72. Although they are all relatively evenly matched the most accurate models are that of G2 and G2+G3.
2, a, x) Reflect about what of the created models is more useful and why.
So I suppose it depends what you goal is in predicting G3, but if you are trying to determine who, according to the model will perform badly, so that you can step in a help them better prepare for the test or exam, then I think the G3~G1+G2 Model would be the best one to use. It can give you a pretty decent approximation of how a student wil perform in G3 based on their performances in G1 and G2.
Working on Student_por dataset
3, v, 1) How good is the model?
Let's have a look at the confusion matrix for the test set.
#Confusion Matrix for Pass/Fail Prediction Test Using all the variables
As we can see the model was pretty good at predicting who would pass and who would fail. In total it made two mistakes. This margin of error is very low and the predictive model is nearly 100% accurate. BUT...
3, v, 2) Is there a problem with the model?
Yes, there are a few problems actually. First of all if you are trying to create a predictive model for Pass/fail we can ussume that the model will be used to identify potential "fail" students early on or at least midway through a semester or year. So if the model includes G3 it is pointless, because there is no way to intervene or help. At this stage the studnet has already passed or failed. This is also why the model is so accurate. So all in all it is accurate, but serves absolutely zero purpose. Also, it includes some predictor variables that are definetly not related (or at least could be considered a bit of a stretch) to whether or not a students will pass or fail.
3, v, 3) If there is a problem with the model, create a new model without the problem and check its confusion matrix.
So to fix this problem and create a model that is relevant, useful and valuable the first thing you can do is exclude G3, and even G2, depending on how early you want to start identifying and assisting potential "fail" candidates. I have only included G1. So we could say we are attempting to identify potential "fail" candidates as early as possible in the year. That way there is ample time to intervene and assist students who might need help. Next, I have only included predictor variables that (I feel) very clearly impact, or could impact, whether or not a student fails. See screenshot of the included variables below. 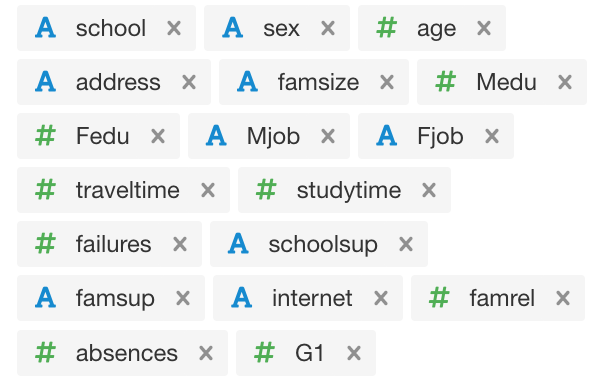
After testing the new model I was able to generate a confusion matrix for predicted pass/fail and actual pass/fail that looked like this.
#Confusion Matrix for new improved (more relevant) model test reults and actual results
As we can see, with a threshold value of 0.5 the model made 15 mistakes. 9 of those mistakes are false negatives (which is fine) and 6 of them are false positives (which is not good). In the context of what the model is trying to achieve we can deal with mis-identifying passing students as failing students, but we can not mis-identify failing students as passing students. After increasing the model's threshold value to 0.92 the confusion matrix looks like this Screenshot:
Confusion matrix with a value threshold of 0.92 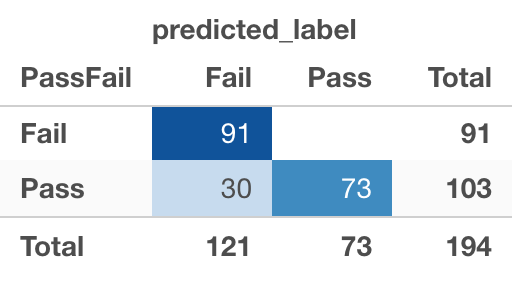
3, v, 4) What is your conclusion?
Well, as you can see the more useful and valuable model is not entirely as accurate as the model that includes all the variables (G2 and G3), BUT after its value threshold was adjusted to 0.92 the test contained zero false positives (predicted pass, but did not), making my model much more valuable and useful to an instructor who wants to start identifying students who need extra attention or help from an early stage in the year. (After the first test/exam). It will enable an instructor to help everyone that needs it. The 30 false negatives (that technically don't need the help) can only benefit from receiving additional help or assistance.
Stu_por Decision Tree
4, d, i) What are the most important variables according to the decision tree?
Past failures, the amount of time spent studying each week, number of absences, the reason for attending a school, mother education level, and family educational support.
4, d, ii) What are some patterns/rules that appear to be present in the data?
Well it appears that if you have failed before it plays a big role in predicting your likelyhood to fail. So if you have failed a course before you are more likely to fail. For 13% of the fail population this was the case.
If your studytime is less than two hours a week you are more likely to fail. This was the case for 30% of the fail population.
If you have not failed before, study less than 2 hours a week and don't have a mother that has a higer eduction you are also more likely to fail. This was the condition for 12% of the fail population.
It also (kind of) appears that if you have more 3 absences you are more likely to fail. For 5% of the fail population this is the case.
4, d, iii) Do these rules make sense to you or are they just coincidence?
Some of them do and some of them don't. Rules relating to past failure, the amount of time spent studying, the mother (typically the homemaker) education, family educational support and number of absenses all make sense, but the reason for choosing a school does not make sense. This might be a coincidence or it might not be. One could argue that if the reason for choosing a school is because it is close to home or other, and not course or reputation for example it could signify that a household does not prioritize academic achievement, but that is a bit of a stretch. I think it might just be a coincidence.
4, e, i) Could this model be used to identify students at risk?
I guess it could, but not in a very effective way. It is a bit difficult to read and use in my opinion.
4, e, ii) Would you use this model? How?
No, I would not use this model. And if I had to, I think I would bring the amount of variables down to a list similar to the one I used in question 3, v, 3 (screenshot) above. I think this current tree has been over fitted with variables.
5, f, i) Is Random Forest better than the others?
Off the bat it does not seem that way. Have a look at the confusion matrix of the test results using a value threshold (VT) of 0.5.
Confusion matrix for Random Forest Model Test (VT=0.5)
This result is not as accurate as the logistical regression models used ealier.
BUT, and this is a big but, this is partly due to the fact that neither G1, G2 or G3 has been included as predictors. In the first logistical regression model, we tested (only 2 mistakes) we used every variable except pass/fail and final_grade.
So it is hard to say whether or not Random forest is more accurate.
A good way to test it would to use the same predictors I used in my improved logistical regression model in order to compare.
After changing the list of predictors to the same as I used in the logistical regression model above (question 3, v, 3) and running a test on the new RF model using a theshold value of 0.5 this was the result for the confusion matrix...
Confusing matrix for RF Model with adjusted predictors (VT = 0.5)
As we can see this is a much better model as it only made 19 mistakes vs the 64 mistakes of the previous model. Of these 19 only 5 were false positives which is a good start for the model we are trying to build. We want this to be zero. After adjusting the value threshold to 0.23 the confusion matrix looked like this... 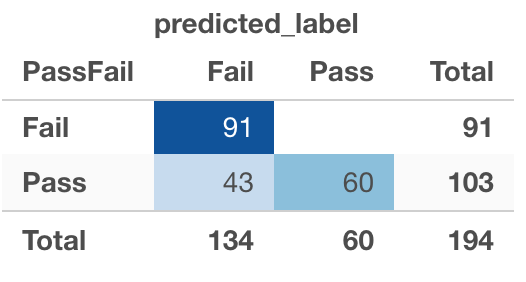 So all in all, when we compare the improved Logistical Regression Model (VT=0.92) and Random Forest Model (VT=0.23) (that both have identical (relevant) predictors) we can see that the logistical regression model outperforms the random forest model by only making 30 mistakes (30 false negatives and zero false positives) as opposed to random forest's 43 mistakes (43 false negatives and zero false positives). So it seems, that for the purpose of identifing students who are going to fail, the logistical regression model is slightly better than the random forest model, but only just. But this is all very dependant on what predictors are used, the VT and, ultimately, what you are trying to achieve.
5, f, ii) Which Threshold selection value would you use to create an application guide instructor-led intervention for students at risk of failing the course?
Considering all of the above, and the predictors that I have added to my logistical regression model, I would use a value threshold of 0.92. See question 3, v, 3.