Understanding the Data
- The dataset is academic data with various data types: Nominal, numeric, binary.
- There are several (382) students that belong to both datasets
- The distribution of some set of data are multimodal (for example, health, Fedu, etc.)
- Some distributions are right skewed (absences, dalc, etc.)
Prediction of Final Grade based on first and second evaluation
Predict G3 based on G1:Based on the charts, we can see that there is a positive linear association between the data. This means we can somewhat predict G3 based on G1, G2, G1+G2, and all variables. When predict G3 based on G1, the association is not strong, and there are still outliers. The association is stronger when we predict G3 based on G2, but less so when predict G3 based on G1+G2. I think the most useful model is to predict G3 based on all variables. The plots are dense with few outliers, showing strong association and more accurate result.
Prediction of risk of Failing
Using Logistic Regression
The model is pretty accurate. The accuracy rate of the model is (102+90)/194 = 90.53
I was not sure how to create a new model without the problem. I ran Logistic Regression model after I changed the 8 values from numeric to feature. Then I checked its confusion matrix and found better result:
My conclusion is to always check data types to see if there are any type of data related directly to the results, before running any prediction models to get better prediction.
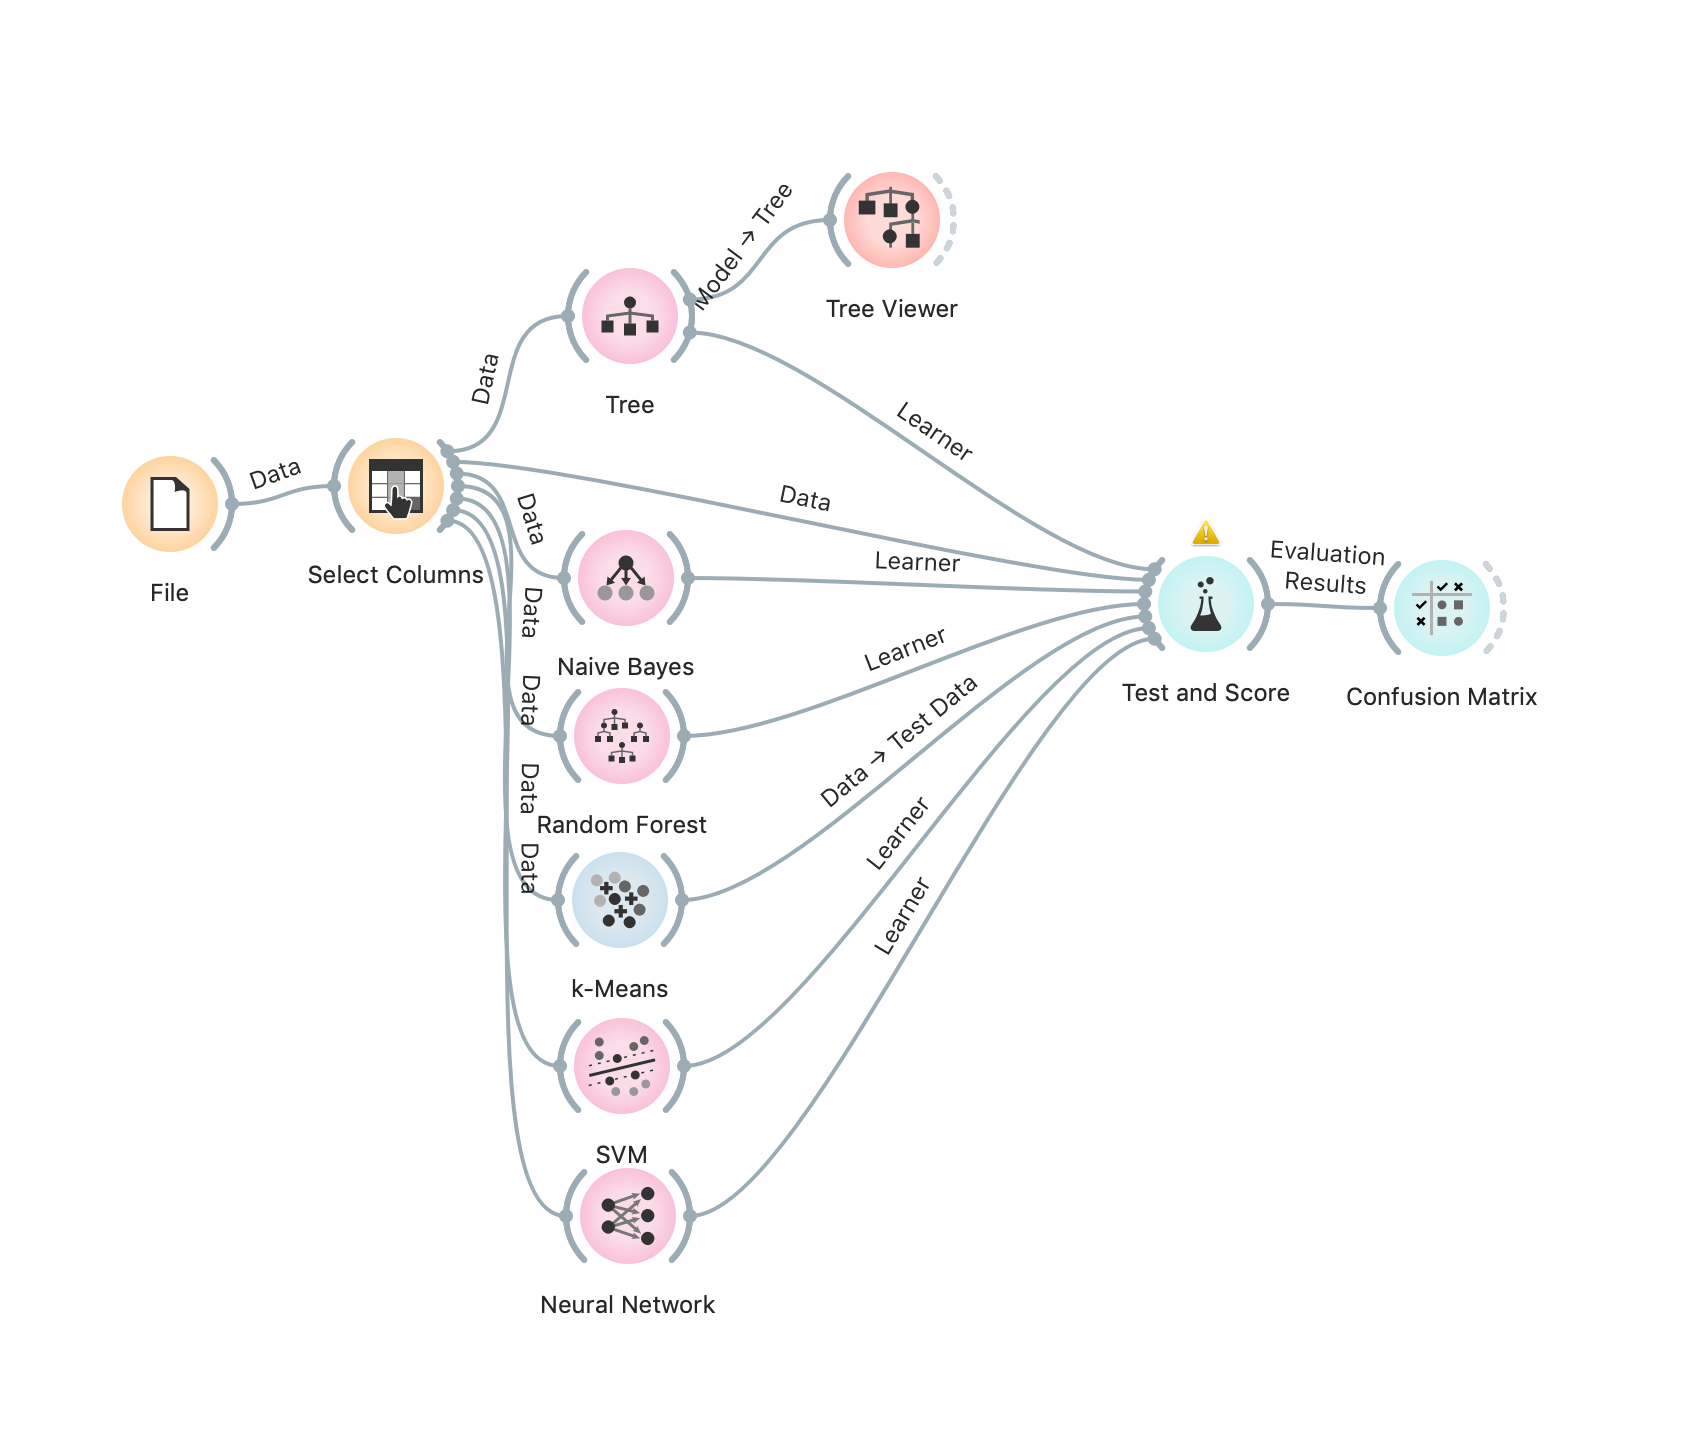
Decision Tree using Orange
I created a decision tree below using Orange: 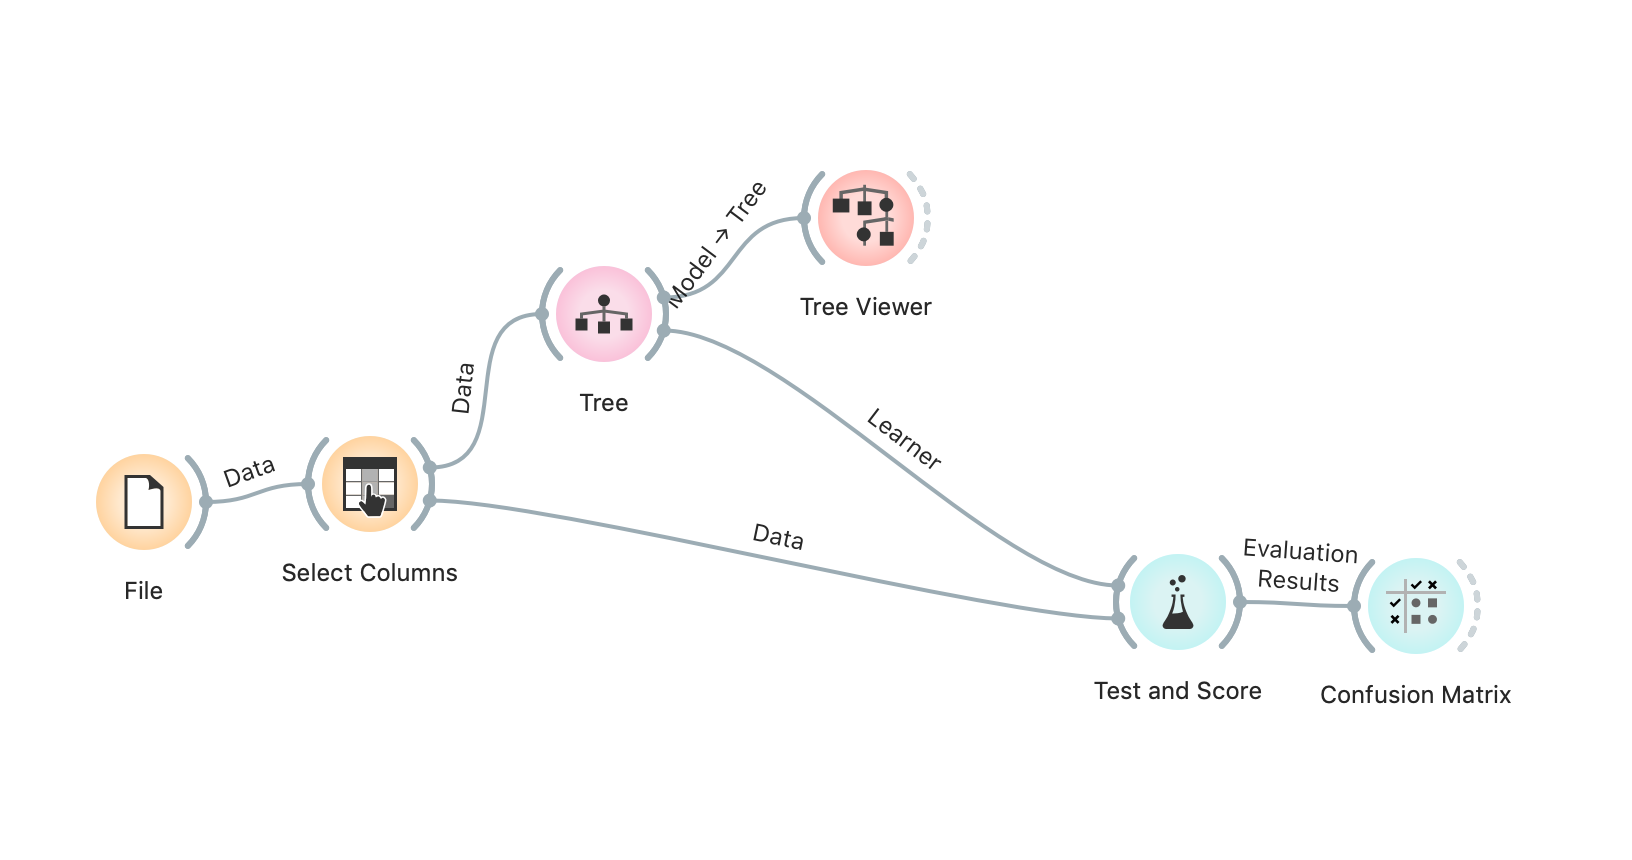
9-level decision tree: 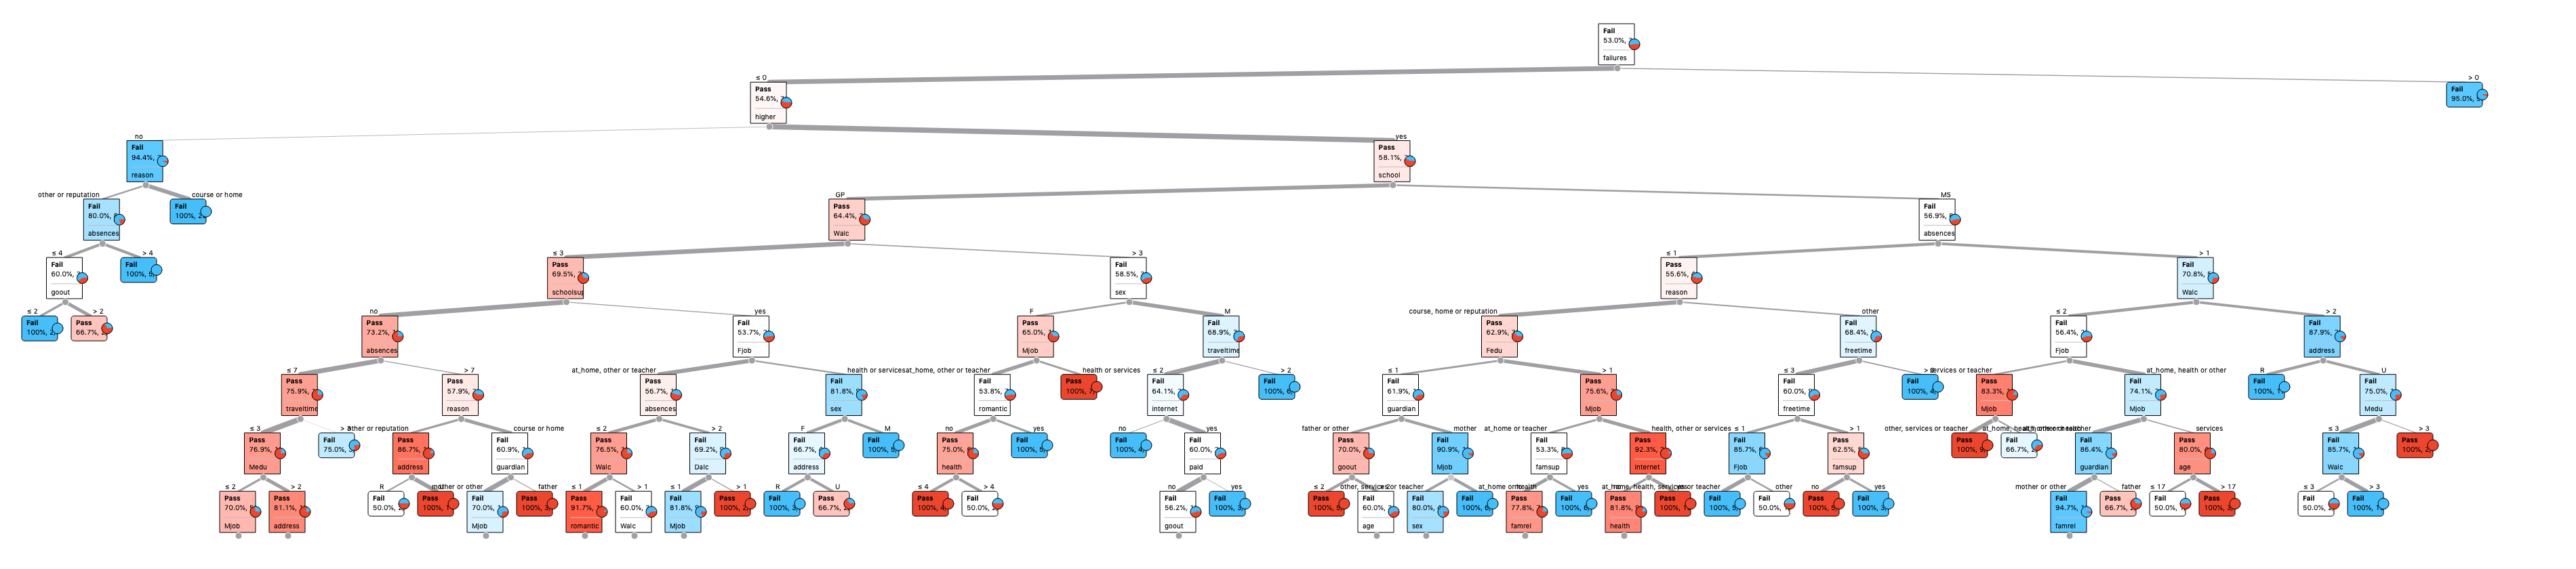
6-level decision tree: 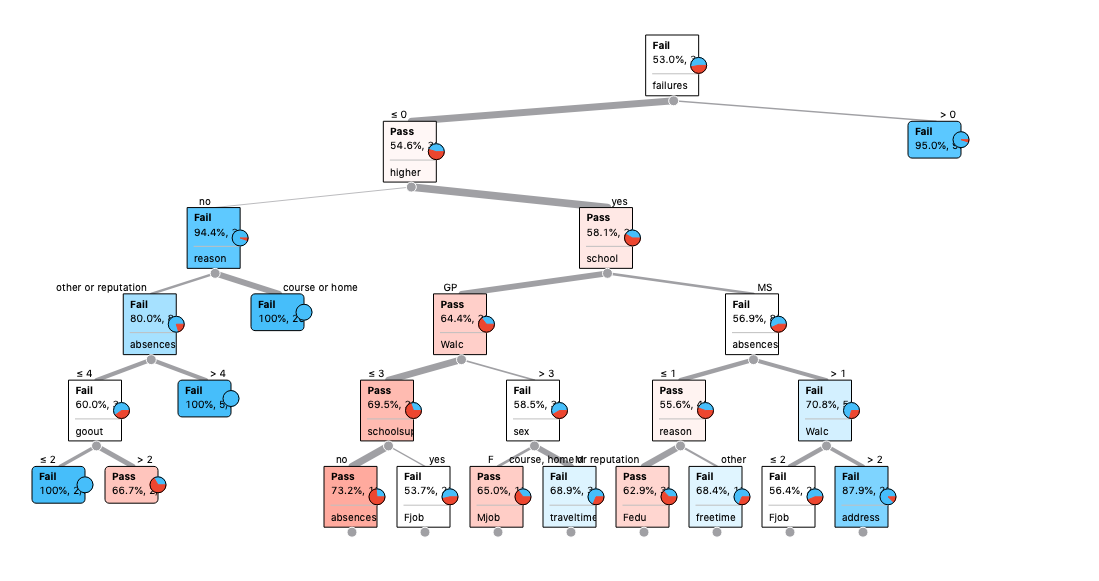
According to the decision tree, the most important variables is “Higher” (Does the student wants to take higher education? Yes/No.)
The more I read into the decision nodes and leaf nodes, it seems to be random and not based on any set of rules. For examples, “school” was a decision factor at level 3, and if a student goes to GP, they will pass. Vice versa, if a student goes to MS, they will fail. I do not think this is logical. I suspect that these rules are just coincidence, because some do not make sense to me.
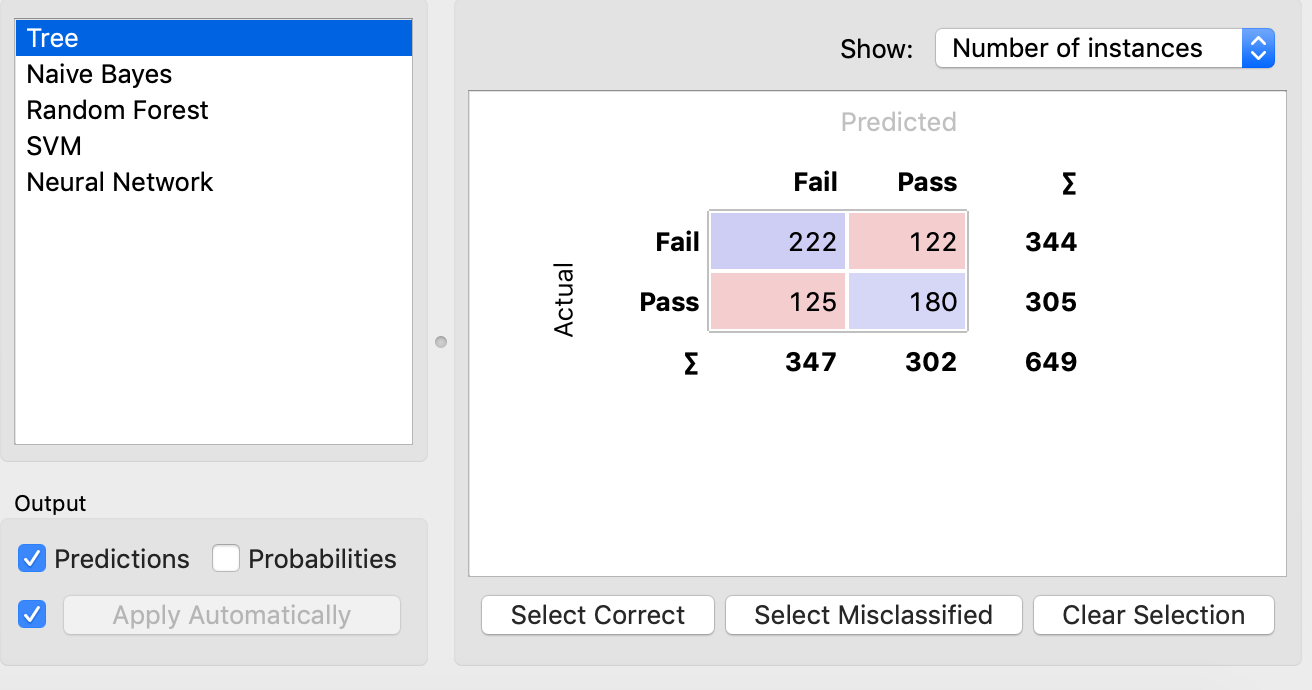
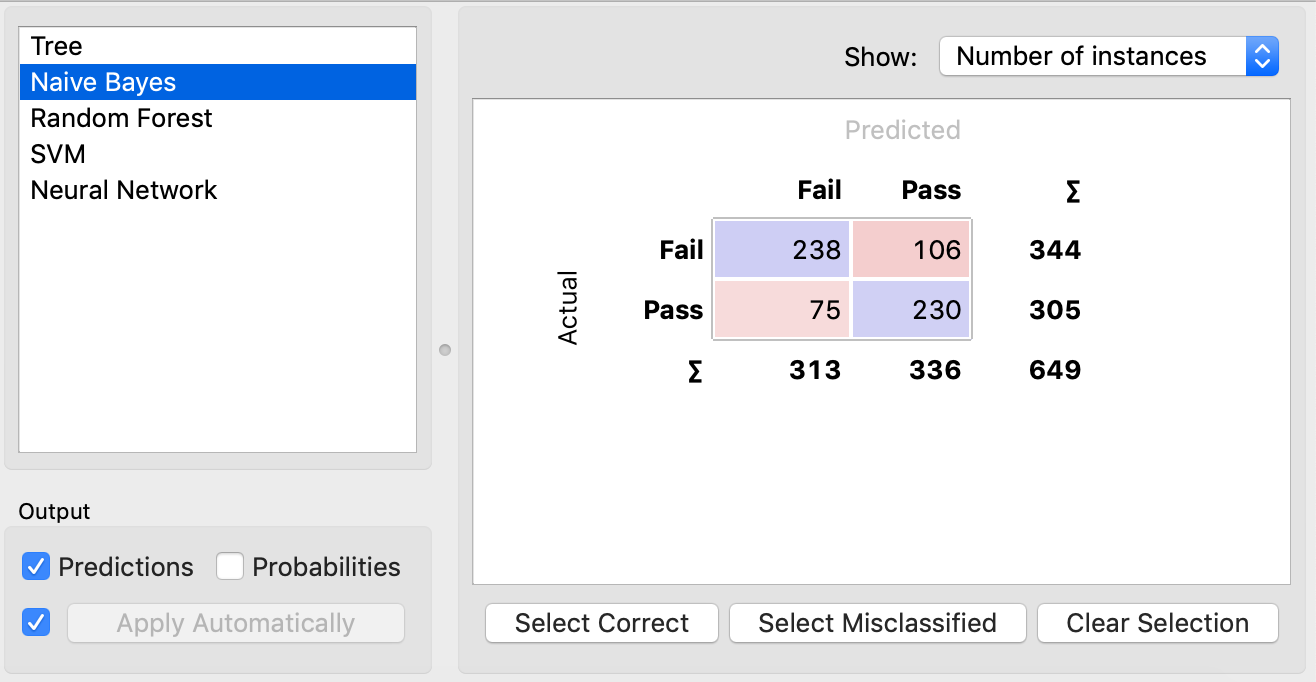
Looking at the Confusion Matrix that Decision Tree generates, we can see that it identified 122 False Positive and 125 False Negative. Those are large numbers of students. According to the Test and Score node below, the precision rate of decision tree is only 0.619. Recall rate is also 0.619. The model predicts almost half of results wrong. I would not use this model to identify the students at risk.
If I must use this model, I might use it to alert me, notify me the students that have some chance to be at risk, so that I can observe and pay attention more to the students.
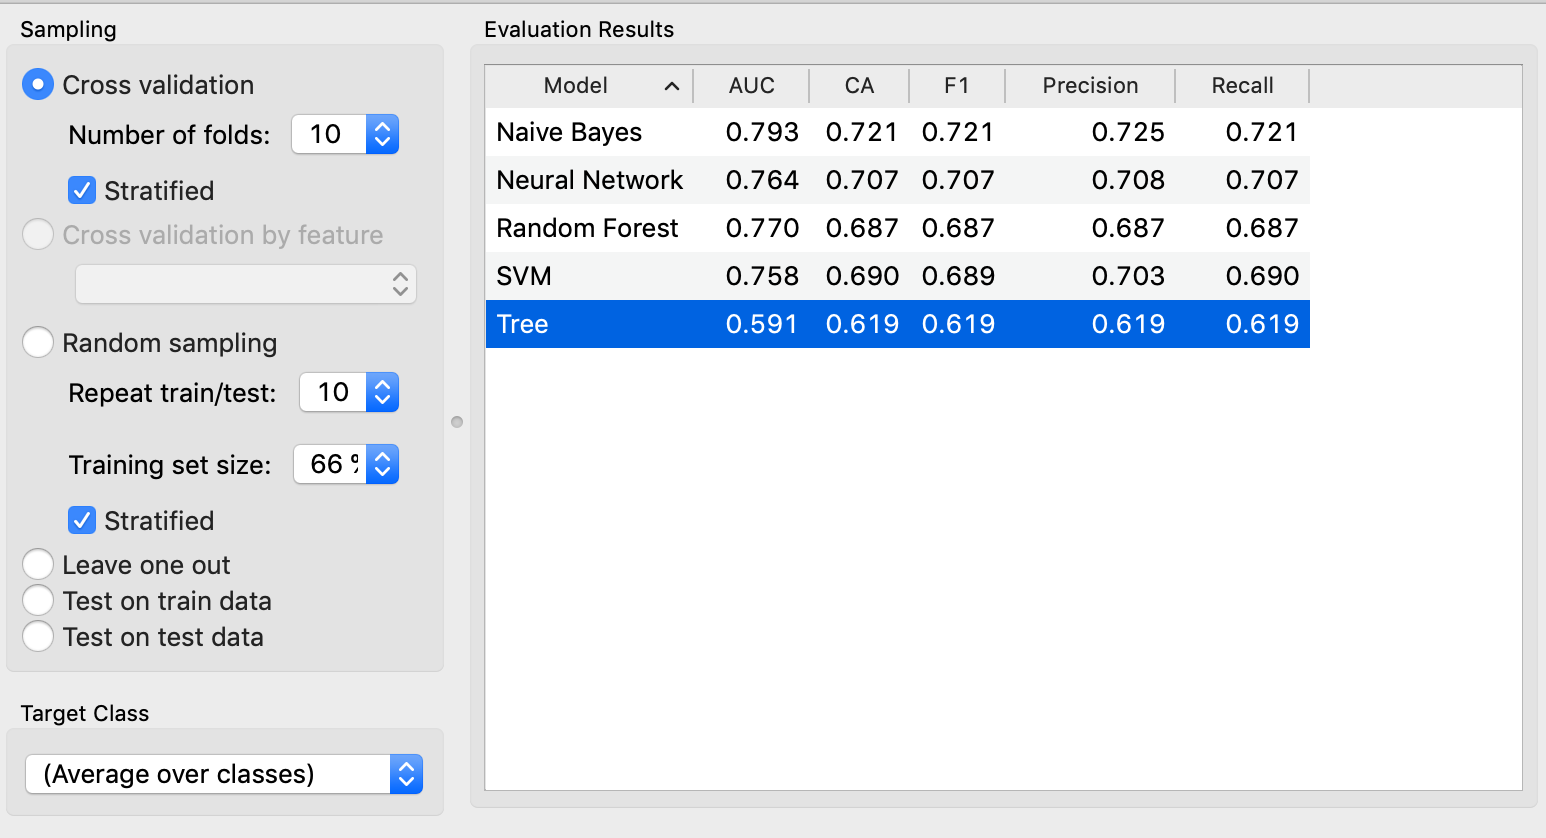
Testing other models
Based on the evaluation results above, we can see that Naive Bayes model is the best, because its precision rate and recall rate are the highest among others.
Therefore, I will usse Naive Bayes model to create an application guide instructor-led intervention for students at risk of failing the course.