AI Data: Frequently Asked Questions
Most datasets do not arrive ready to analyze. Sheet names differ from one workbook to the next, a survey renames its questions every year, a government statistics table carries three rows of title before the header even starts. Getting past all of that is the work that happens before the analysis begins.
AI Data, added in Exploratory Desktop v16, is the feature that does that work for you. You describe the data you want in the chat, and it inspects the files or the database structure, decides what processing is needed, and imports the result as a data frame in a shape you can analyze directly.
This page answers the questions we hear most often about AI Data.
About the Data You Can Use
What kinds of data are supported?
Every data source you can already use in Exploratory is available in AI Data as well. Connections you have already set up appear as a list on the AI Data screen, so there is nothing to configure again.
The main supported sources are:
- Files: Excel, CSV, PDF, Word, JSON, XML, Parquet, and statistical software formats such as SPSS and Stata.
- Databases: PostgreSQL, MySQL, SQL Server, Oracle, BigQuery, Snowflake, Redshift, MongoDB, and others.
- Cloud storage: files stored in Google Drive, Google Sheets, Amazon S3, SharePoint, Dropbox, and Box can be imported directly.
Beyond these, data can be retrieved from public statistics portals, from a wide range of public APIs, and from documents published on the web. Even for a source we have not prepared a dedicated procedure for, AI Data will look up the specification and attempt the retrieval, so the best starting point is simply to describe what you need.
How do I give it the files?
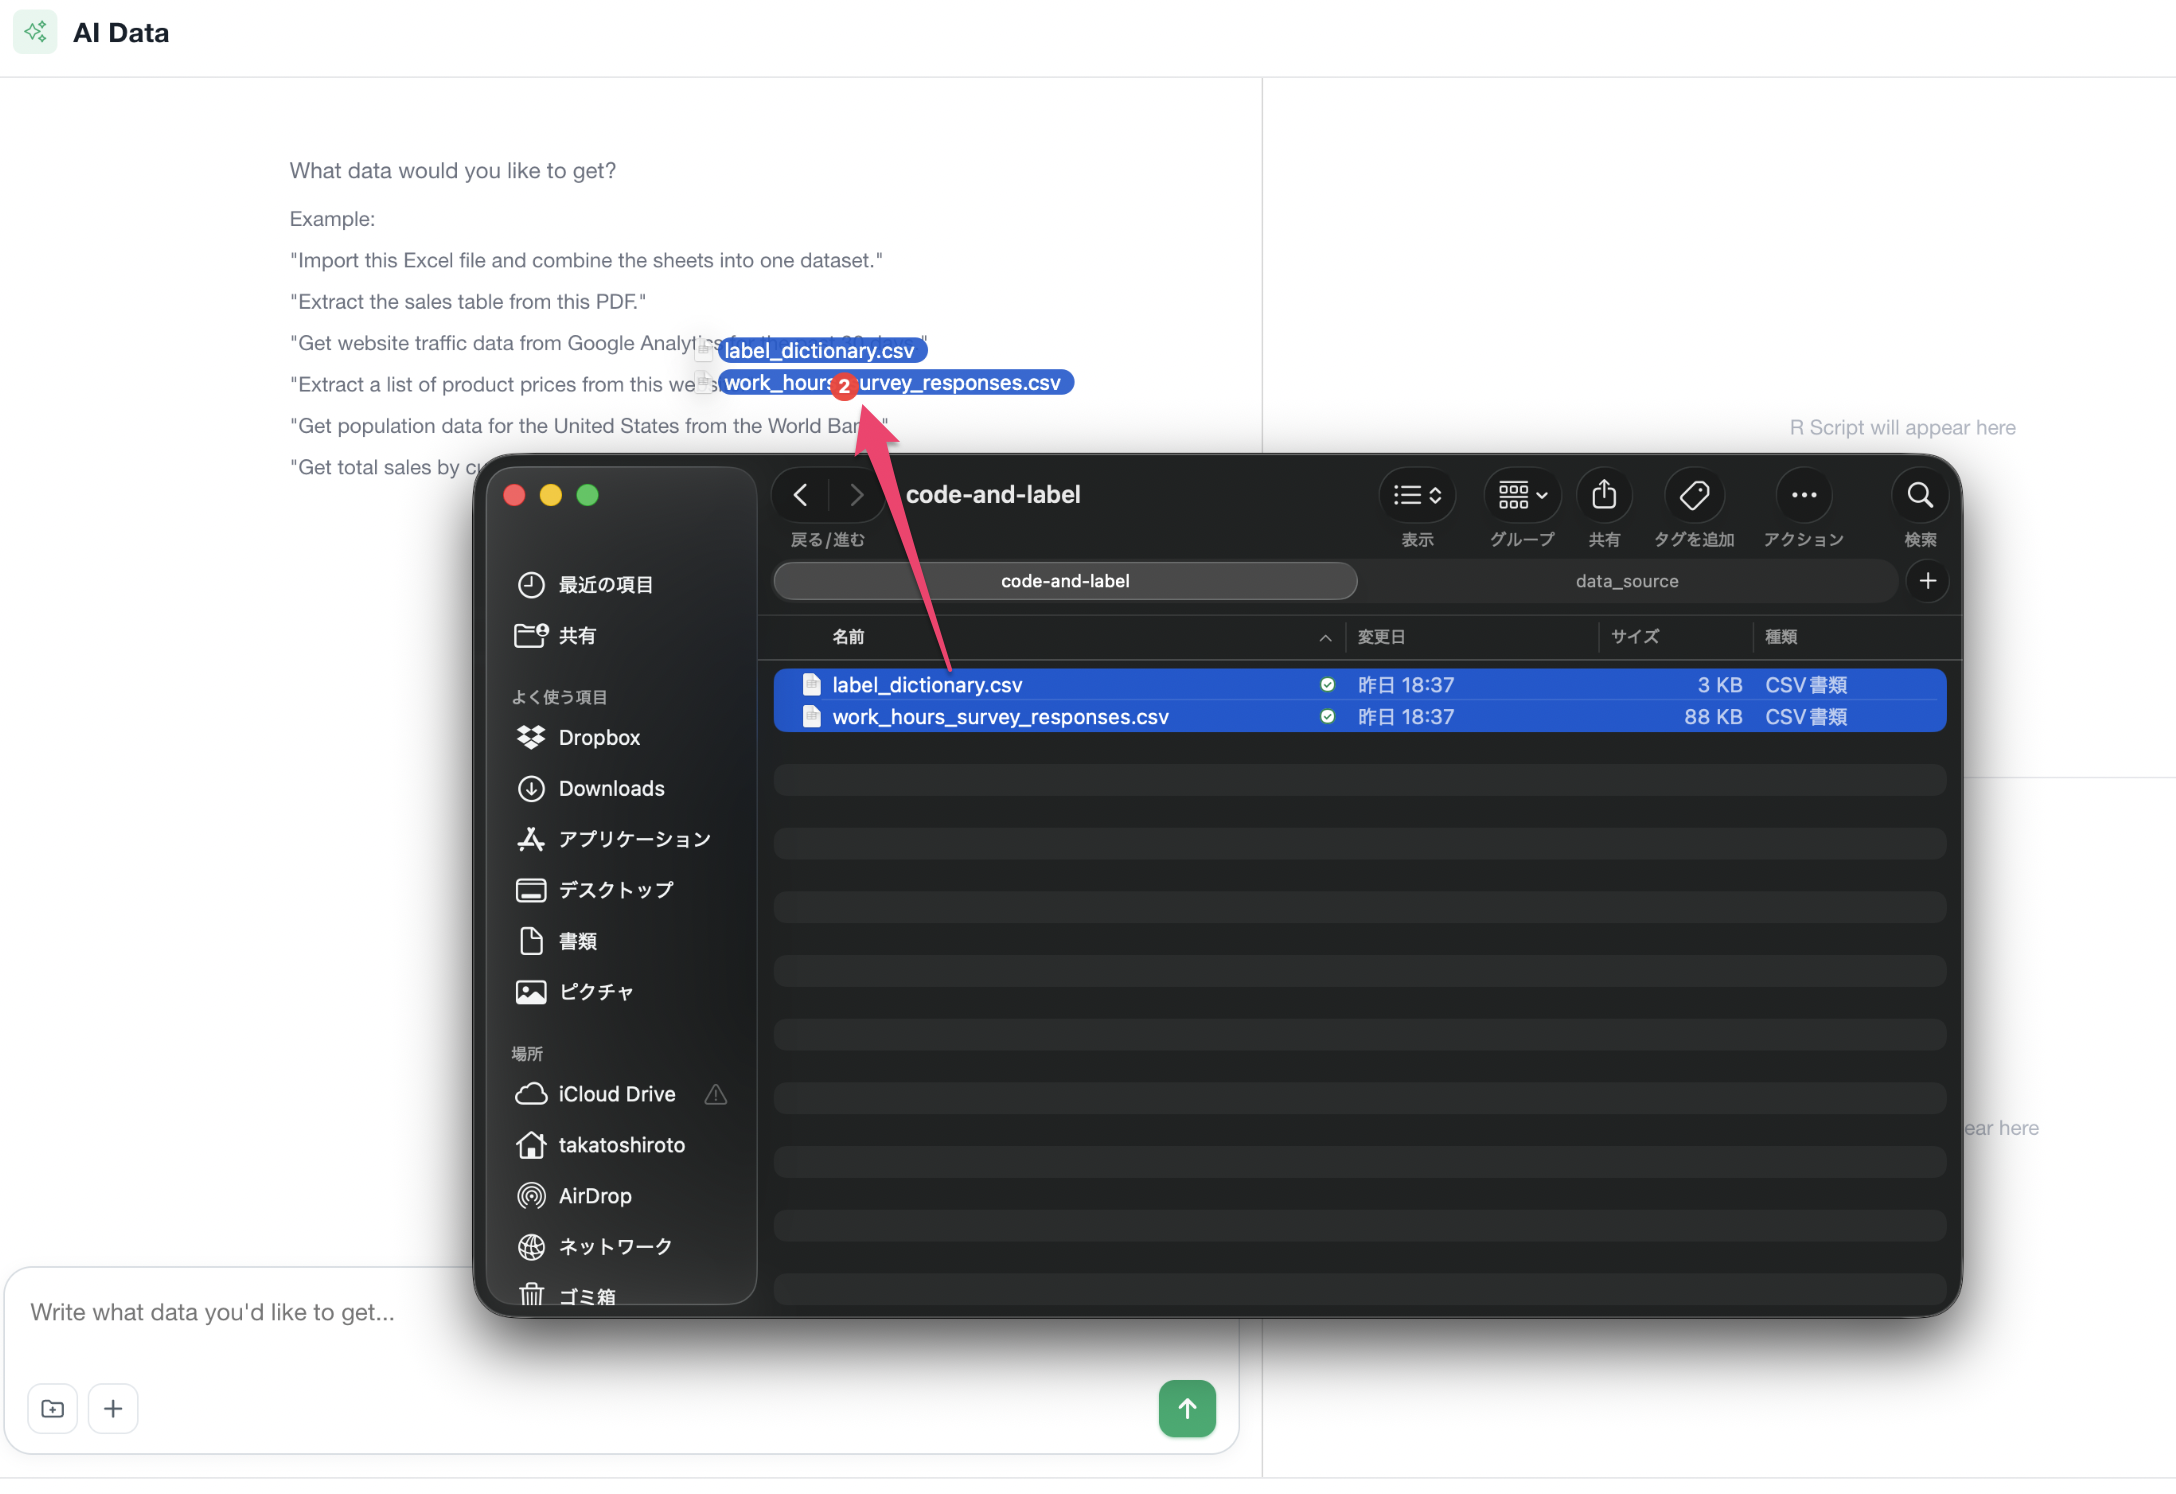
Files are dragged and dropped onto the AI Data screen. Several can be dropped together.
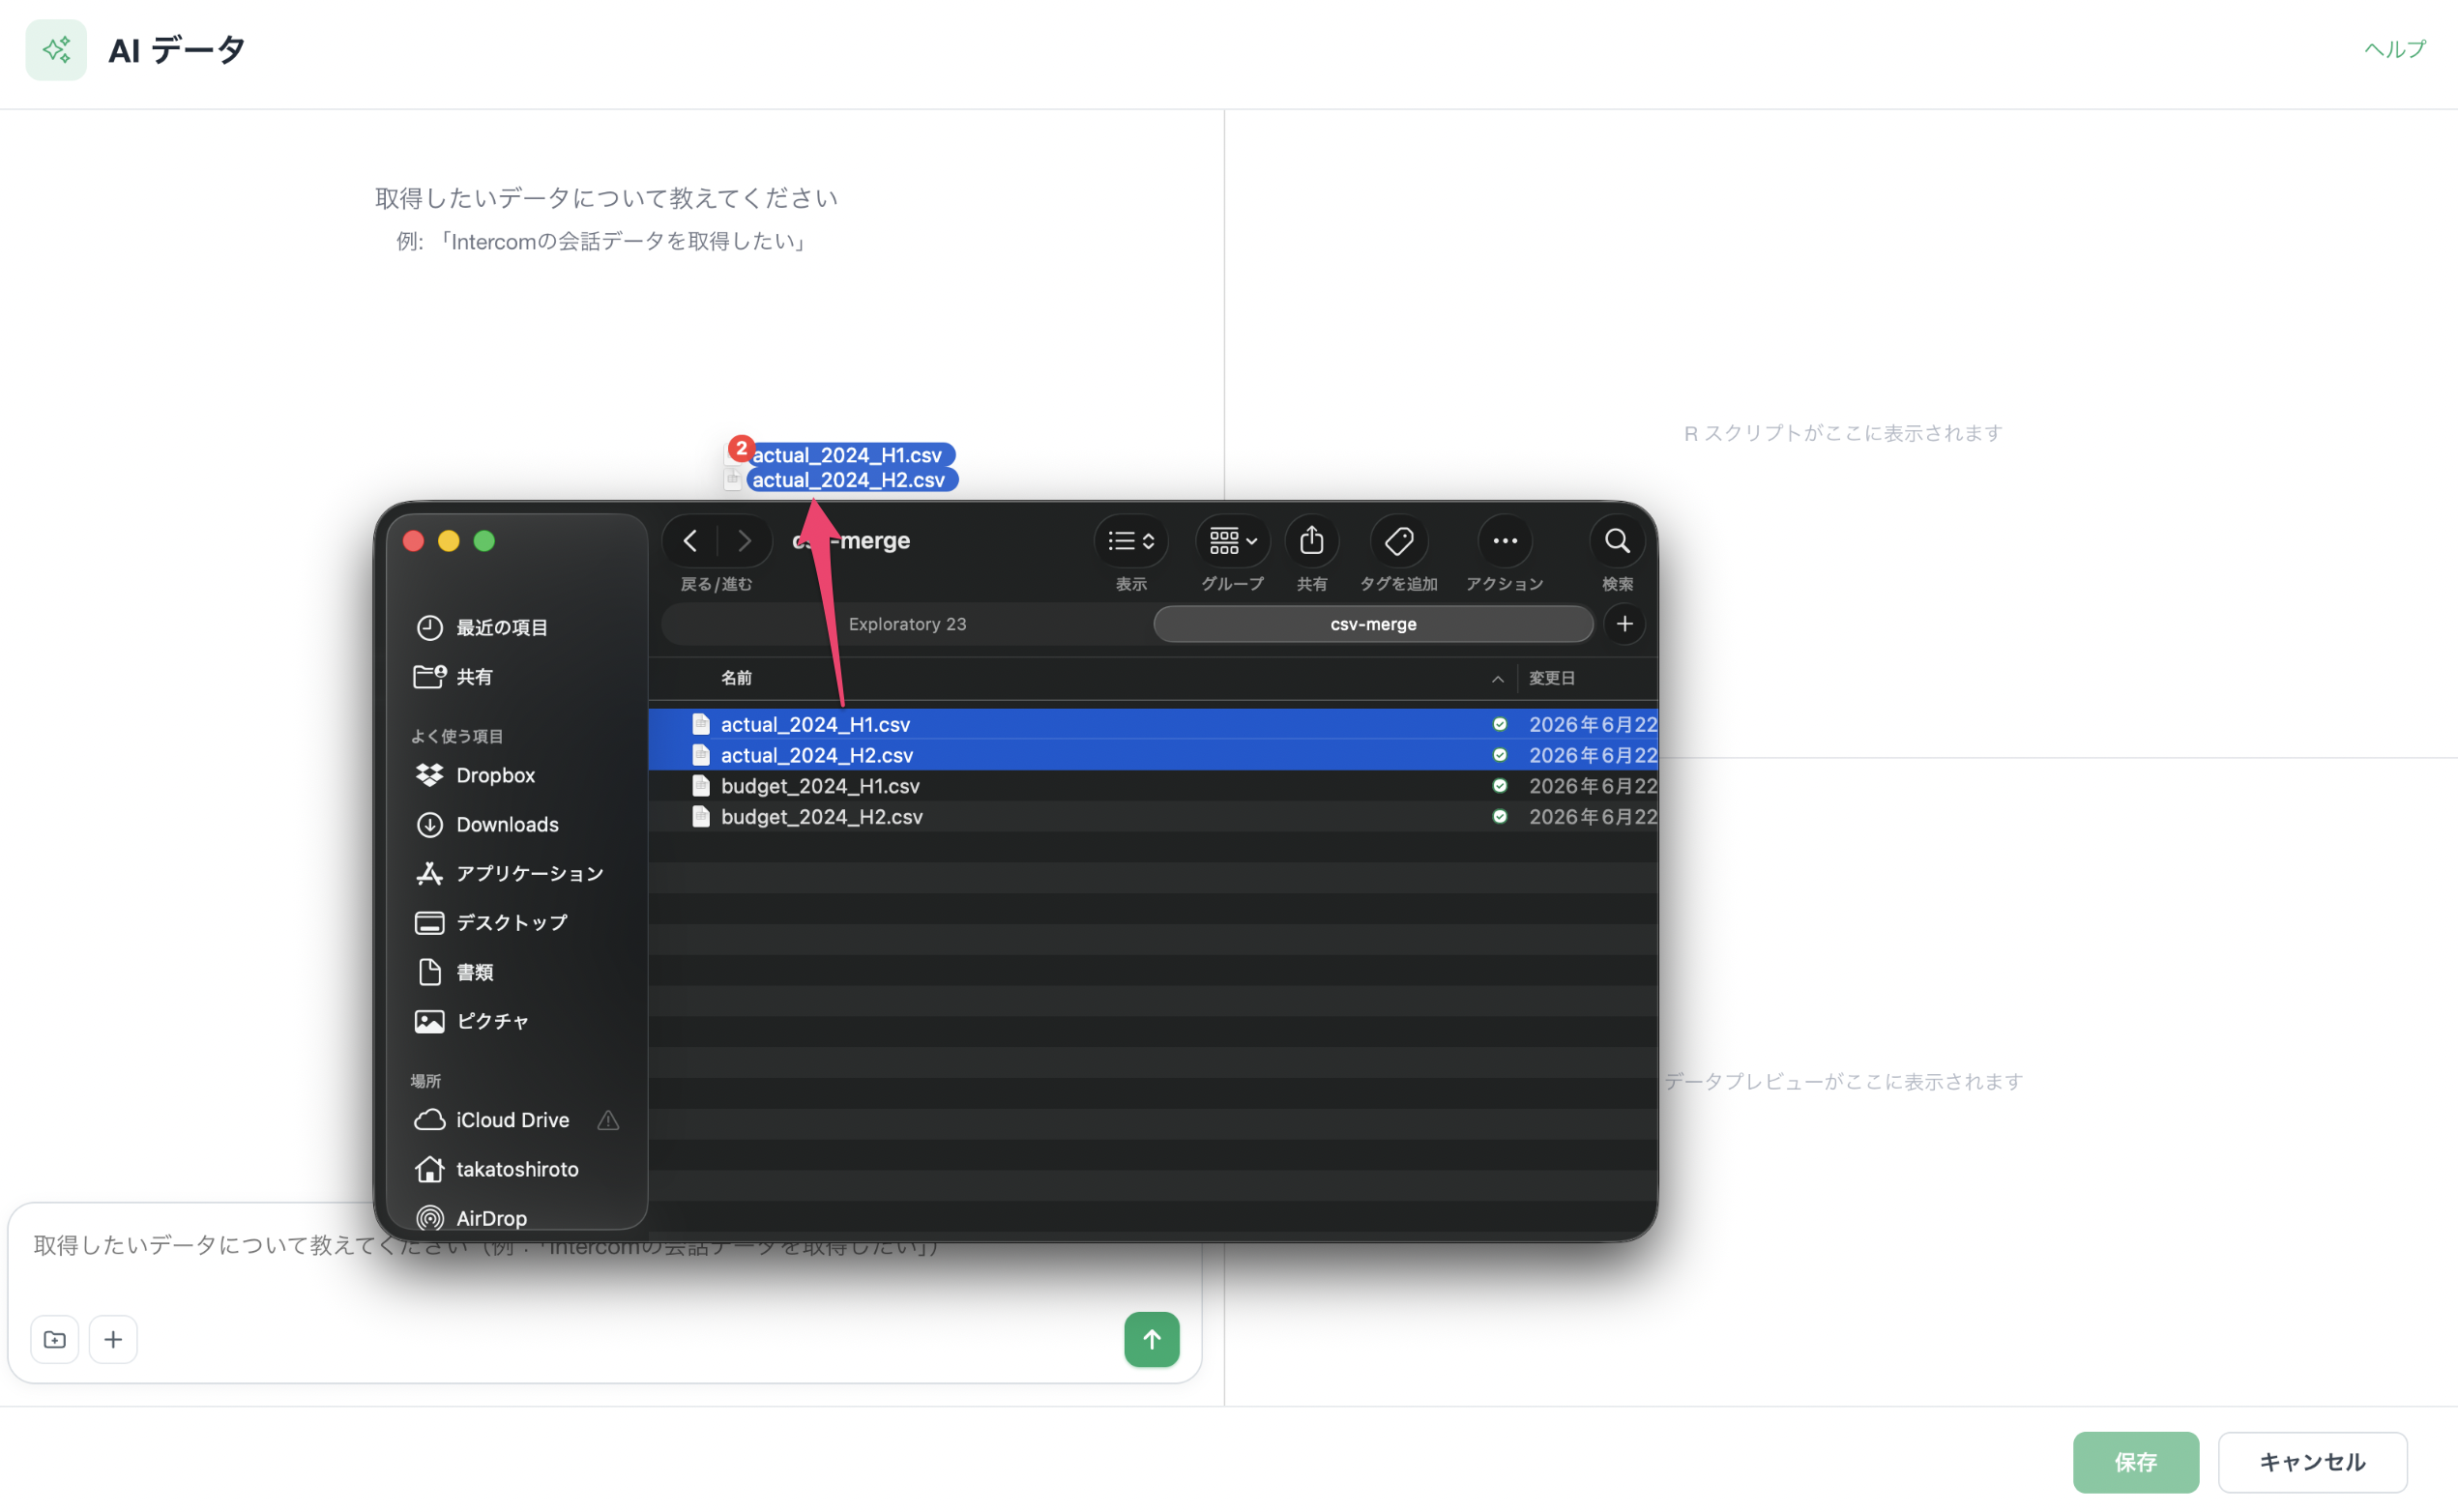
If the files sit inside a nested folder structure, pointing at the top folder is enough; AI Data searches the folders underneath it to find the files it needs. Data split into one folder per region or per year can stay exactly as it is.
Every file format except images is supported. Tables inside PDF and Word documents are also treated as data.
Combining Multiple Files
Can Excel files with different sheet names still be combined?
Yes. When files are split by month or by year and the sheet names differ from file to file, you can select them as they are.
The three regional workbooks used here are a fair example of what
real files look like. West.xlsx, East.xlsx,
and South.xlsx hold 13 sheets between them, and only 9 of
those are the city sheets you actually want: the rest are
Prior Year, Budget, Notes, and
Index. Every sheet starts with a title row, so the header
is on the second row rather than the first. The Los Angeles
sheet carries an extra YoY column the others do not have,
San Francisco stores its sales figures as text, and
Boston calls the same column Revenue where the
others call it Sales.
Doing this by hand means opening 13 sheets to work out which 9 are cities, then copying 12 rows of monthly figures out of each one, adding a city column to every block, and reconciling three different column layouts along the way.
With the traditional Import & Merge, the sheet names had to be made identical before the files could be read together. AI Data checks the sheet structure of each file and decides which sheets to use, so there is no need to standardize sheet names in Excel first.
When it is not obvious which sheets should be used, AI Data says what it intends to do and asks before writing the script, so an unintended sheet is never picked up silently.
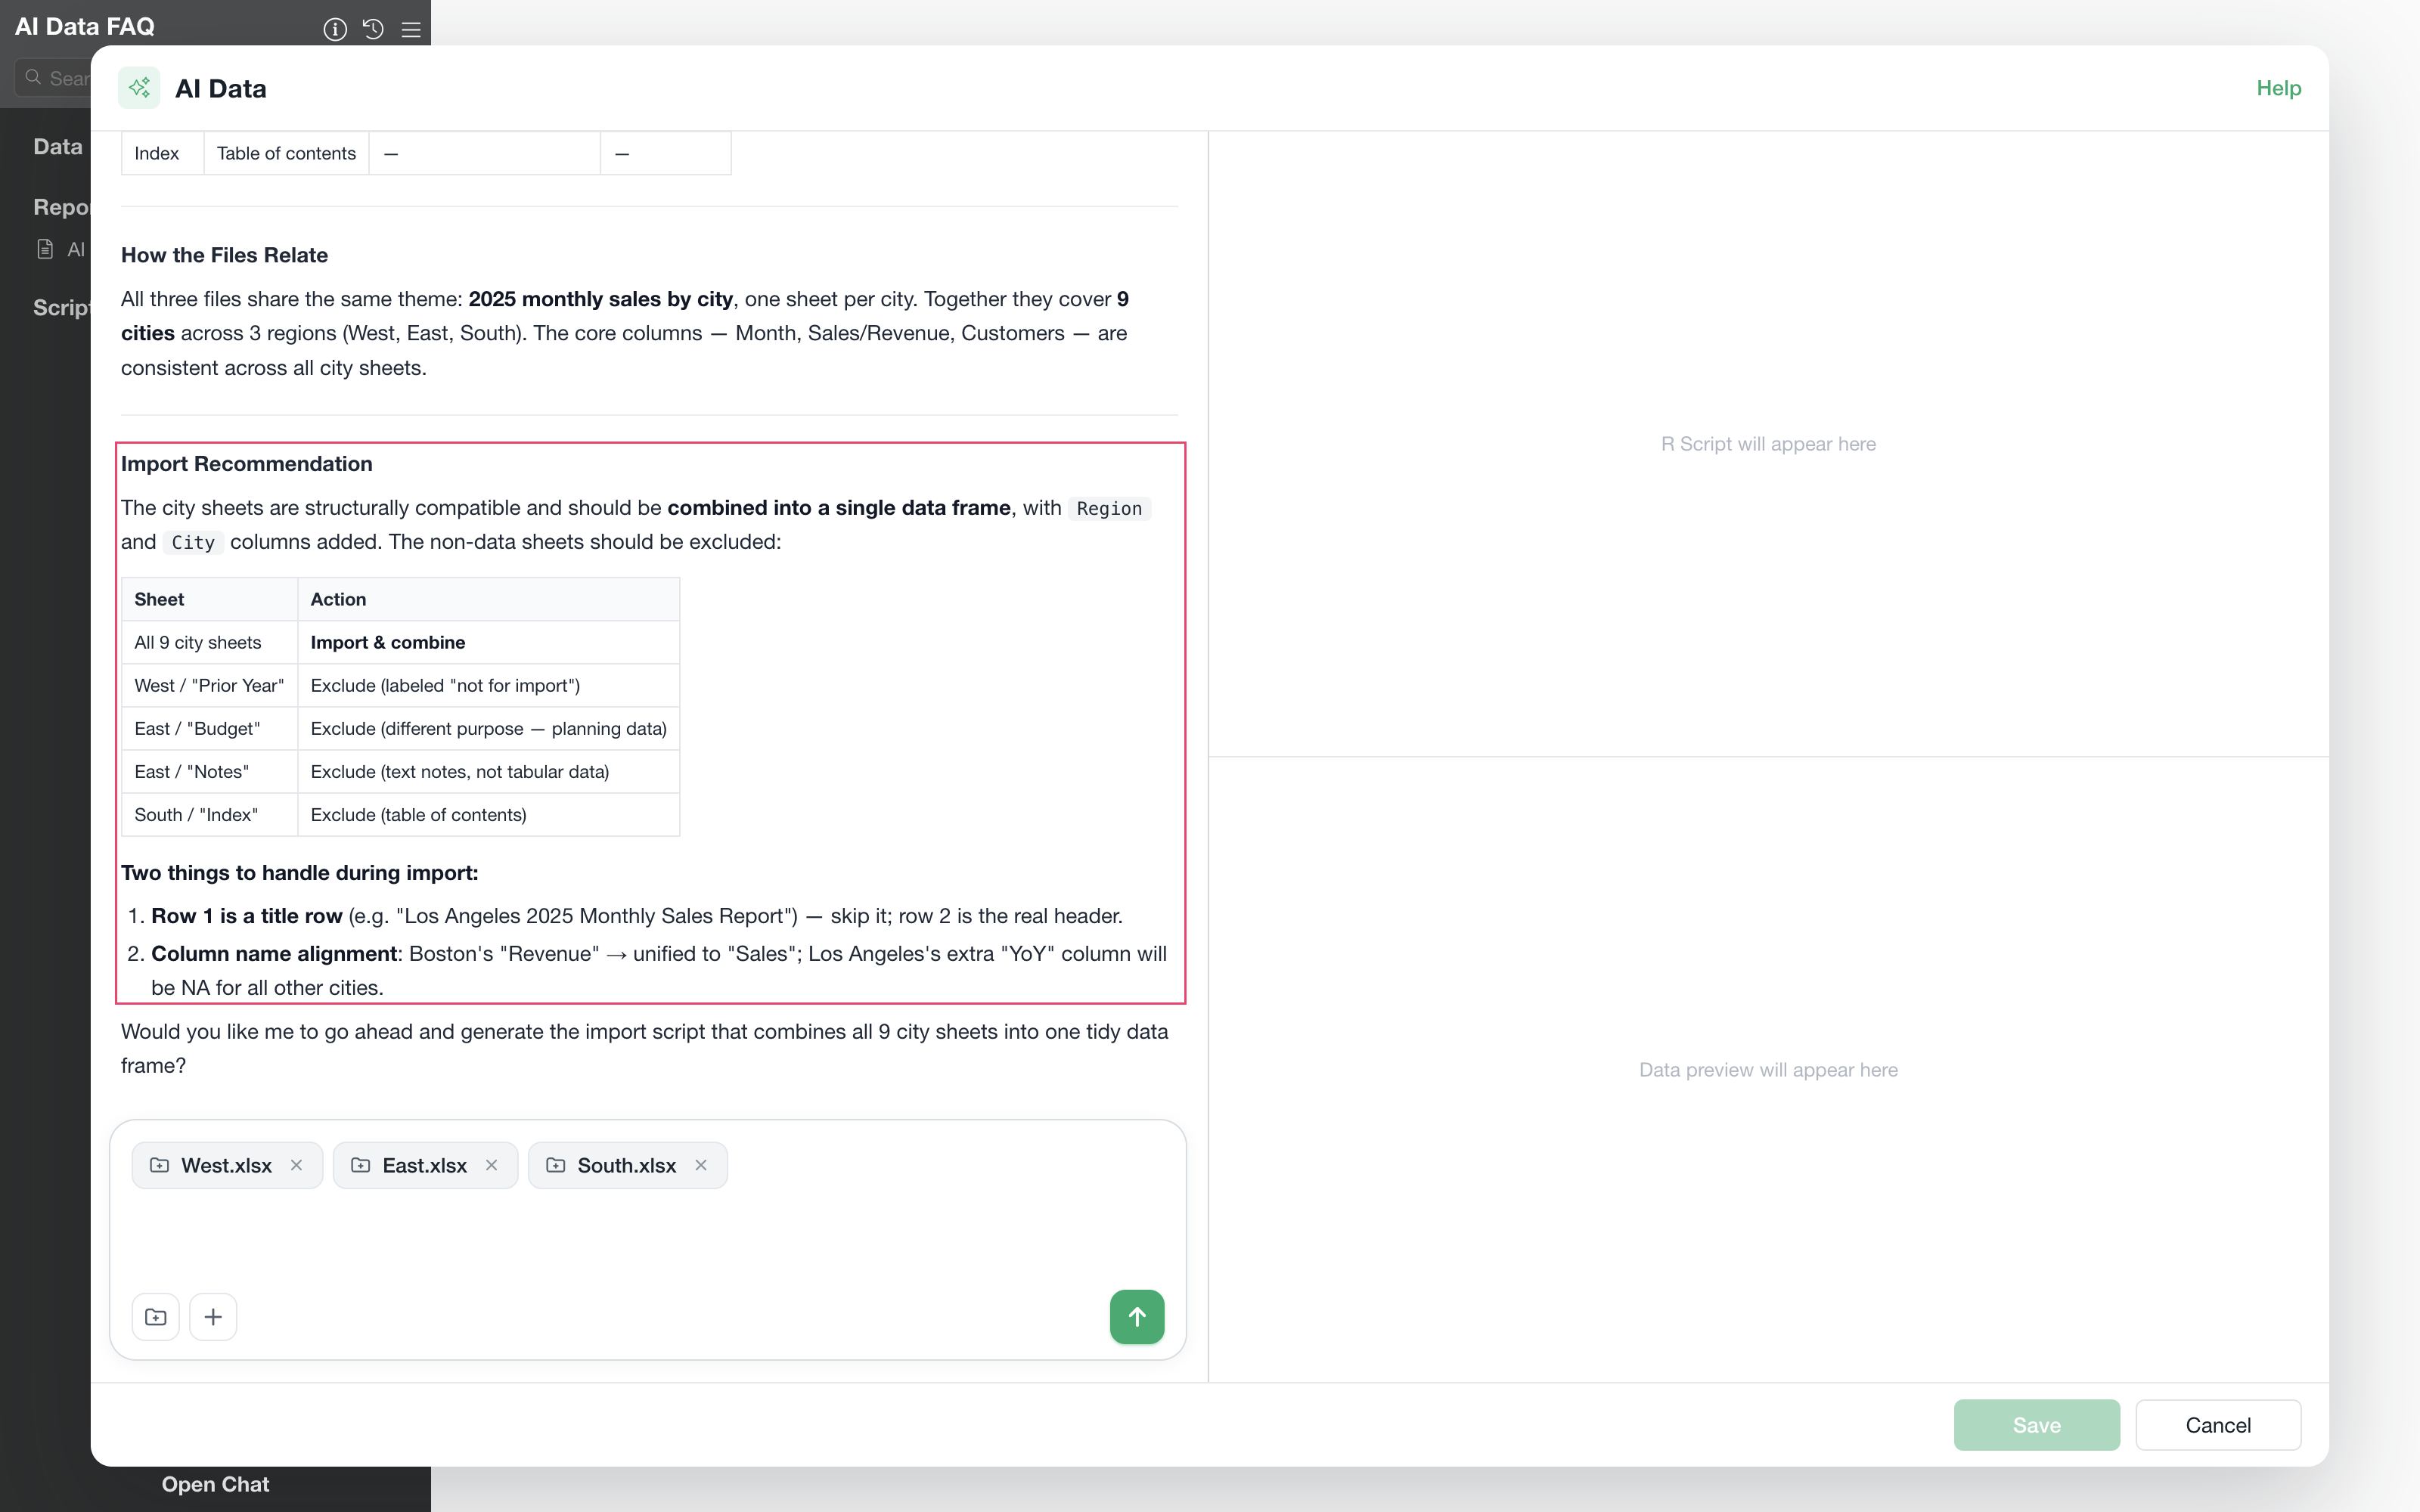
Before writing any script, AI Data lists what it found: which 9
sheets are the city sheets and which 4 to leave out, that row 1 is a
title so row 2 is the real header, and that Boston’s
Revenue has to be folded into Sales while Los
Angeles’s extra YoY column will be empty for everyone
else.
What happens with files whose column names change from year to year?
AI Data builds a column mapping automatically and uses it to unify the names. For survey data where the wording of a question changed between years, you do not have to prepare the mapping yourself.
The three annual survey files here have 1,000 responses each and 50,
49, and 50 columns respectively. The same concept is worded differently
in each year: Speed Satisfaction in 2023 becomes
Satisfaction With Processing Speed in 2024 and
Performance Rating in 2025. The column order is shuffled as
well, and each year has questions the others do not.
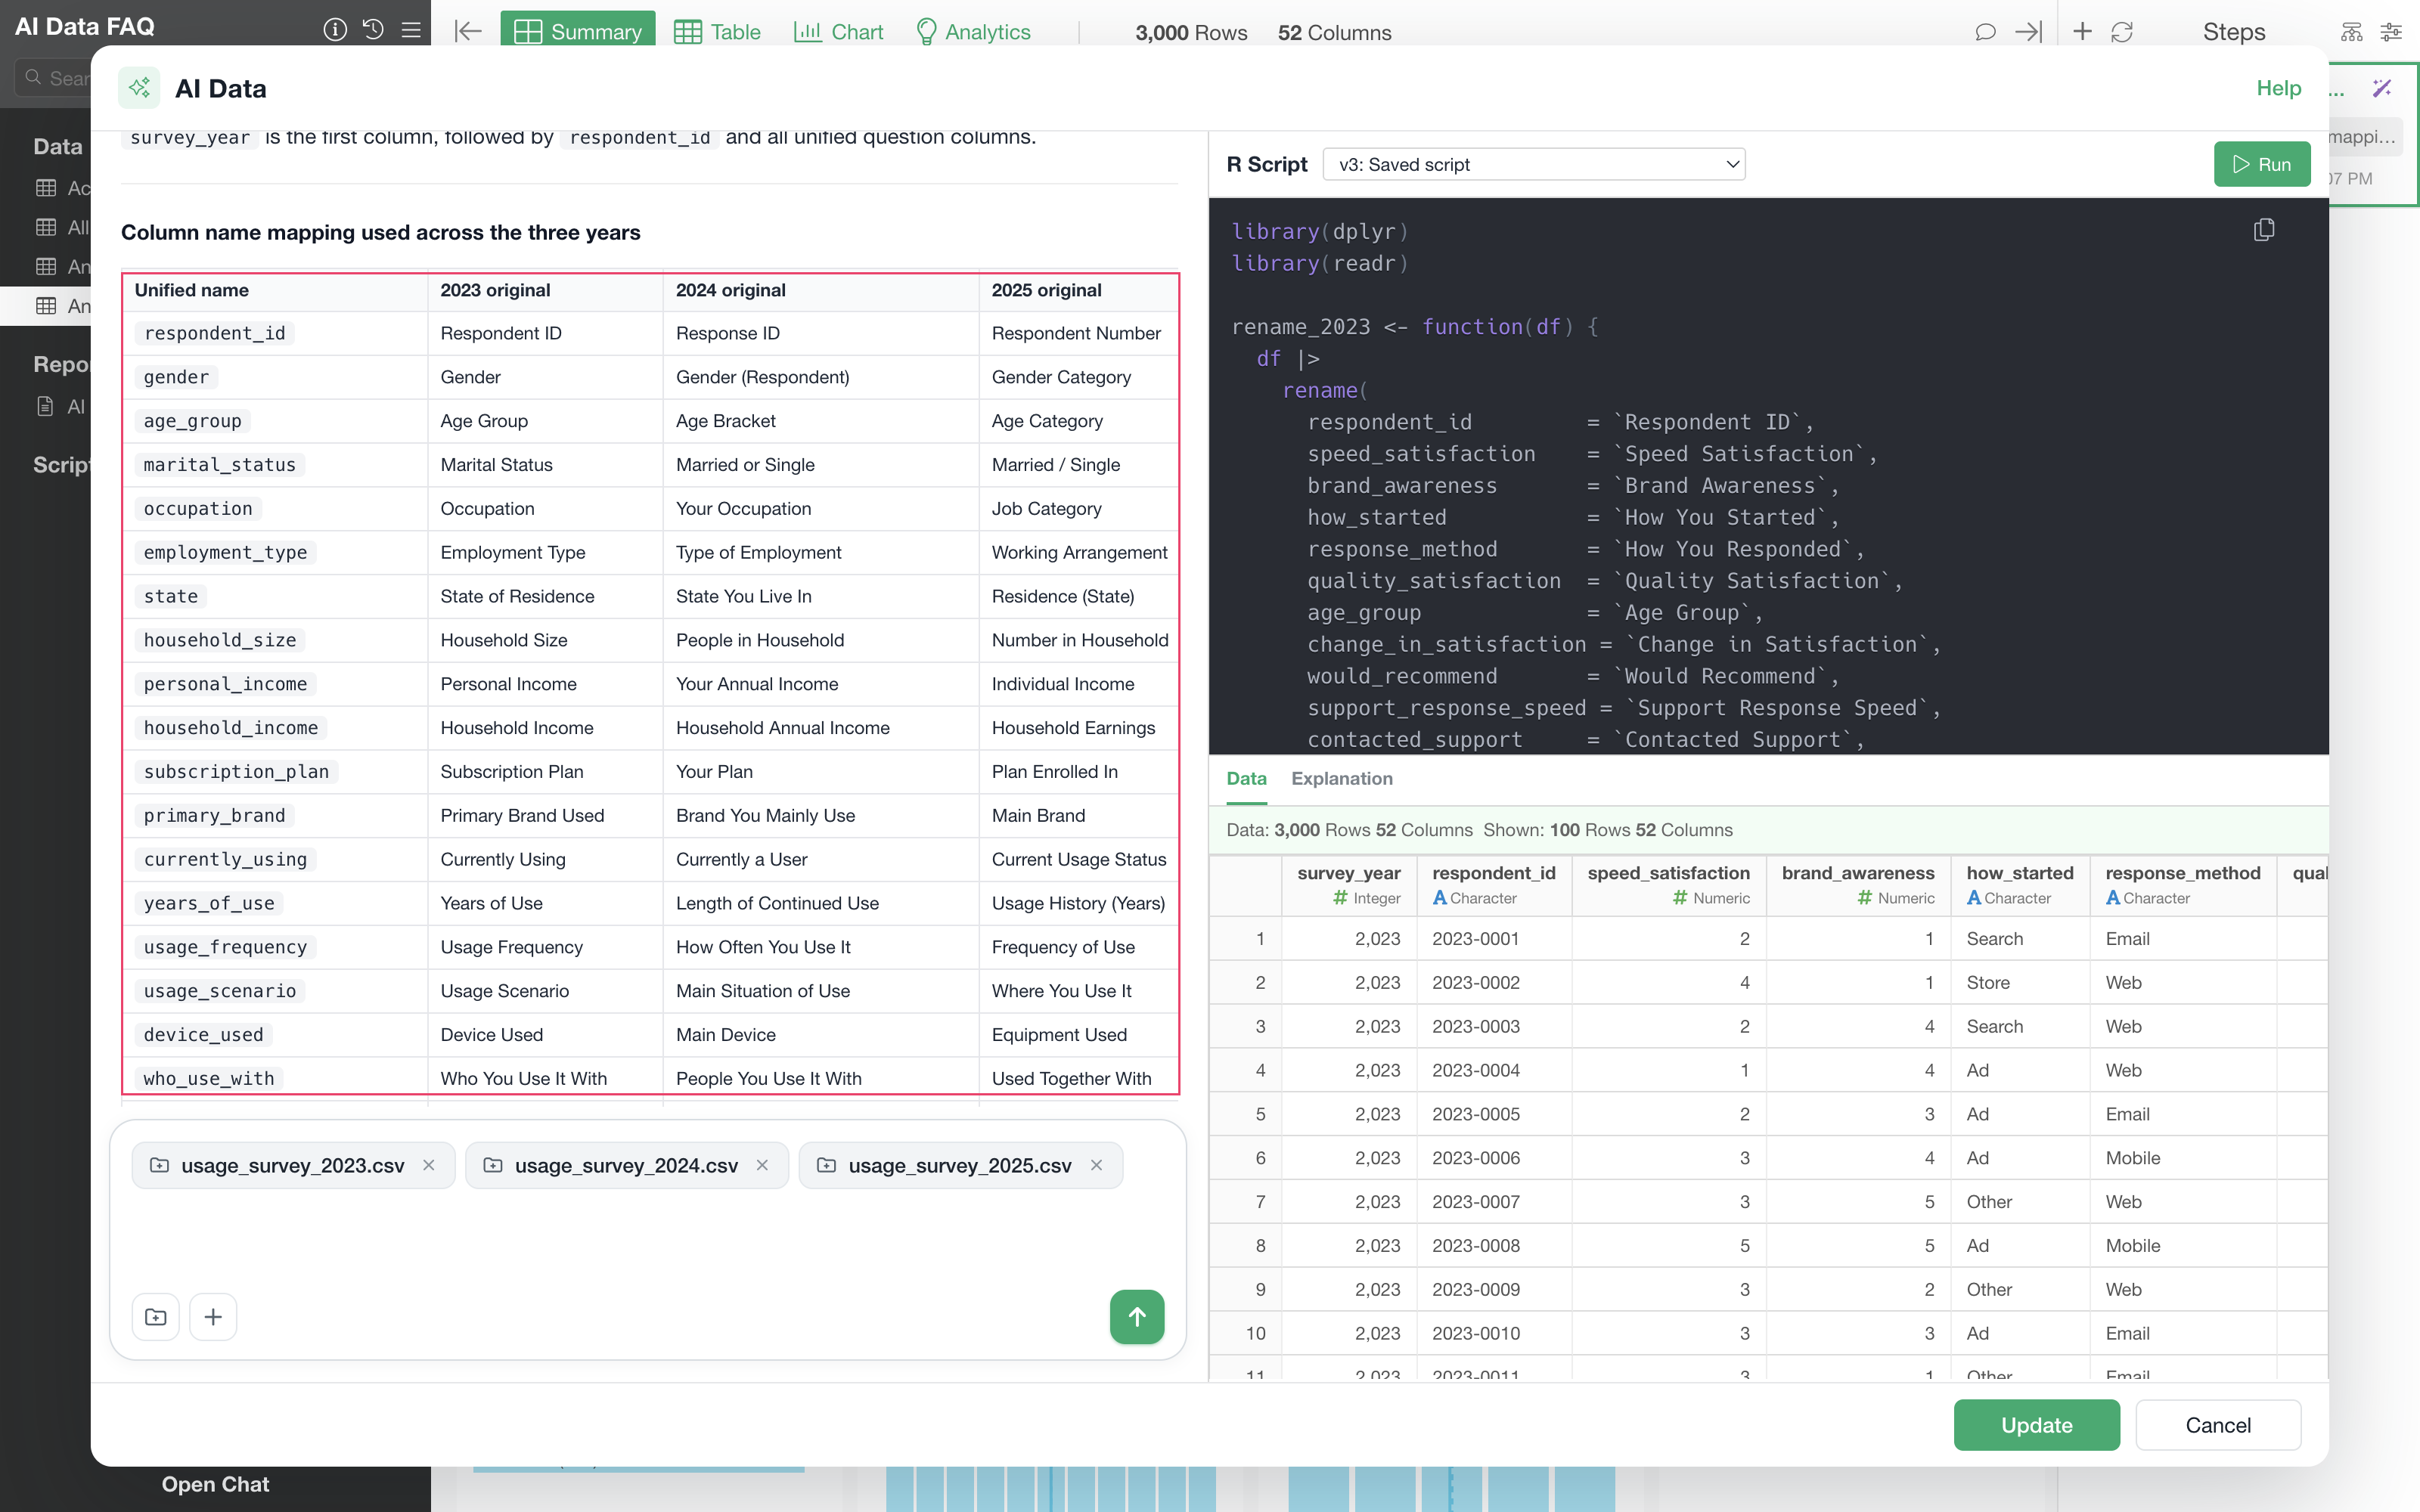
The three files come back as one dataset of 3,000 rows by 52 columns:
a survey_year column that AI Data adds so the years stay
distinguishable, respondent_id, and 50 unified question
columns. The 50, 49, and 50 columns of the individual years settle into
those 50 because questions that were only worded differently collapse
into one column each, while the two that exist in a single year only, on
pandemic impact in 2023 and on generative AI tools in 2025, stay
separate and are left empty for the other years.
The mapping AI Data built can also be kept as a data frame of its own. This is useful when you want to check later which column was mapped to which, or share how the mapping was decided with colleagues. Asking for it in the chat, for example “Please also save the column mapping as a separate data frame,” creates it alongside the import.
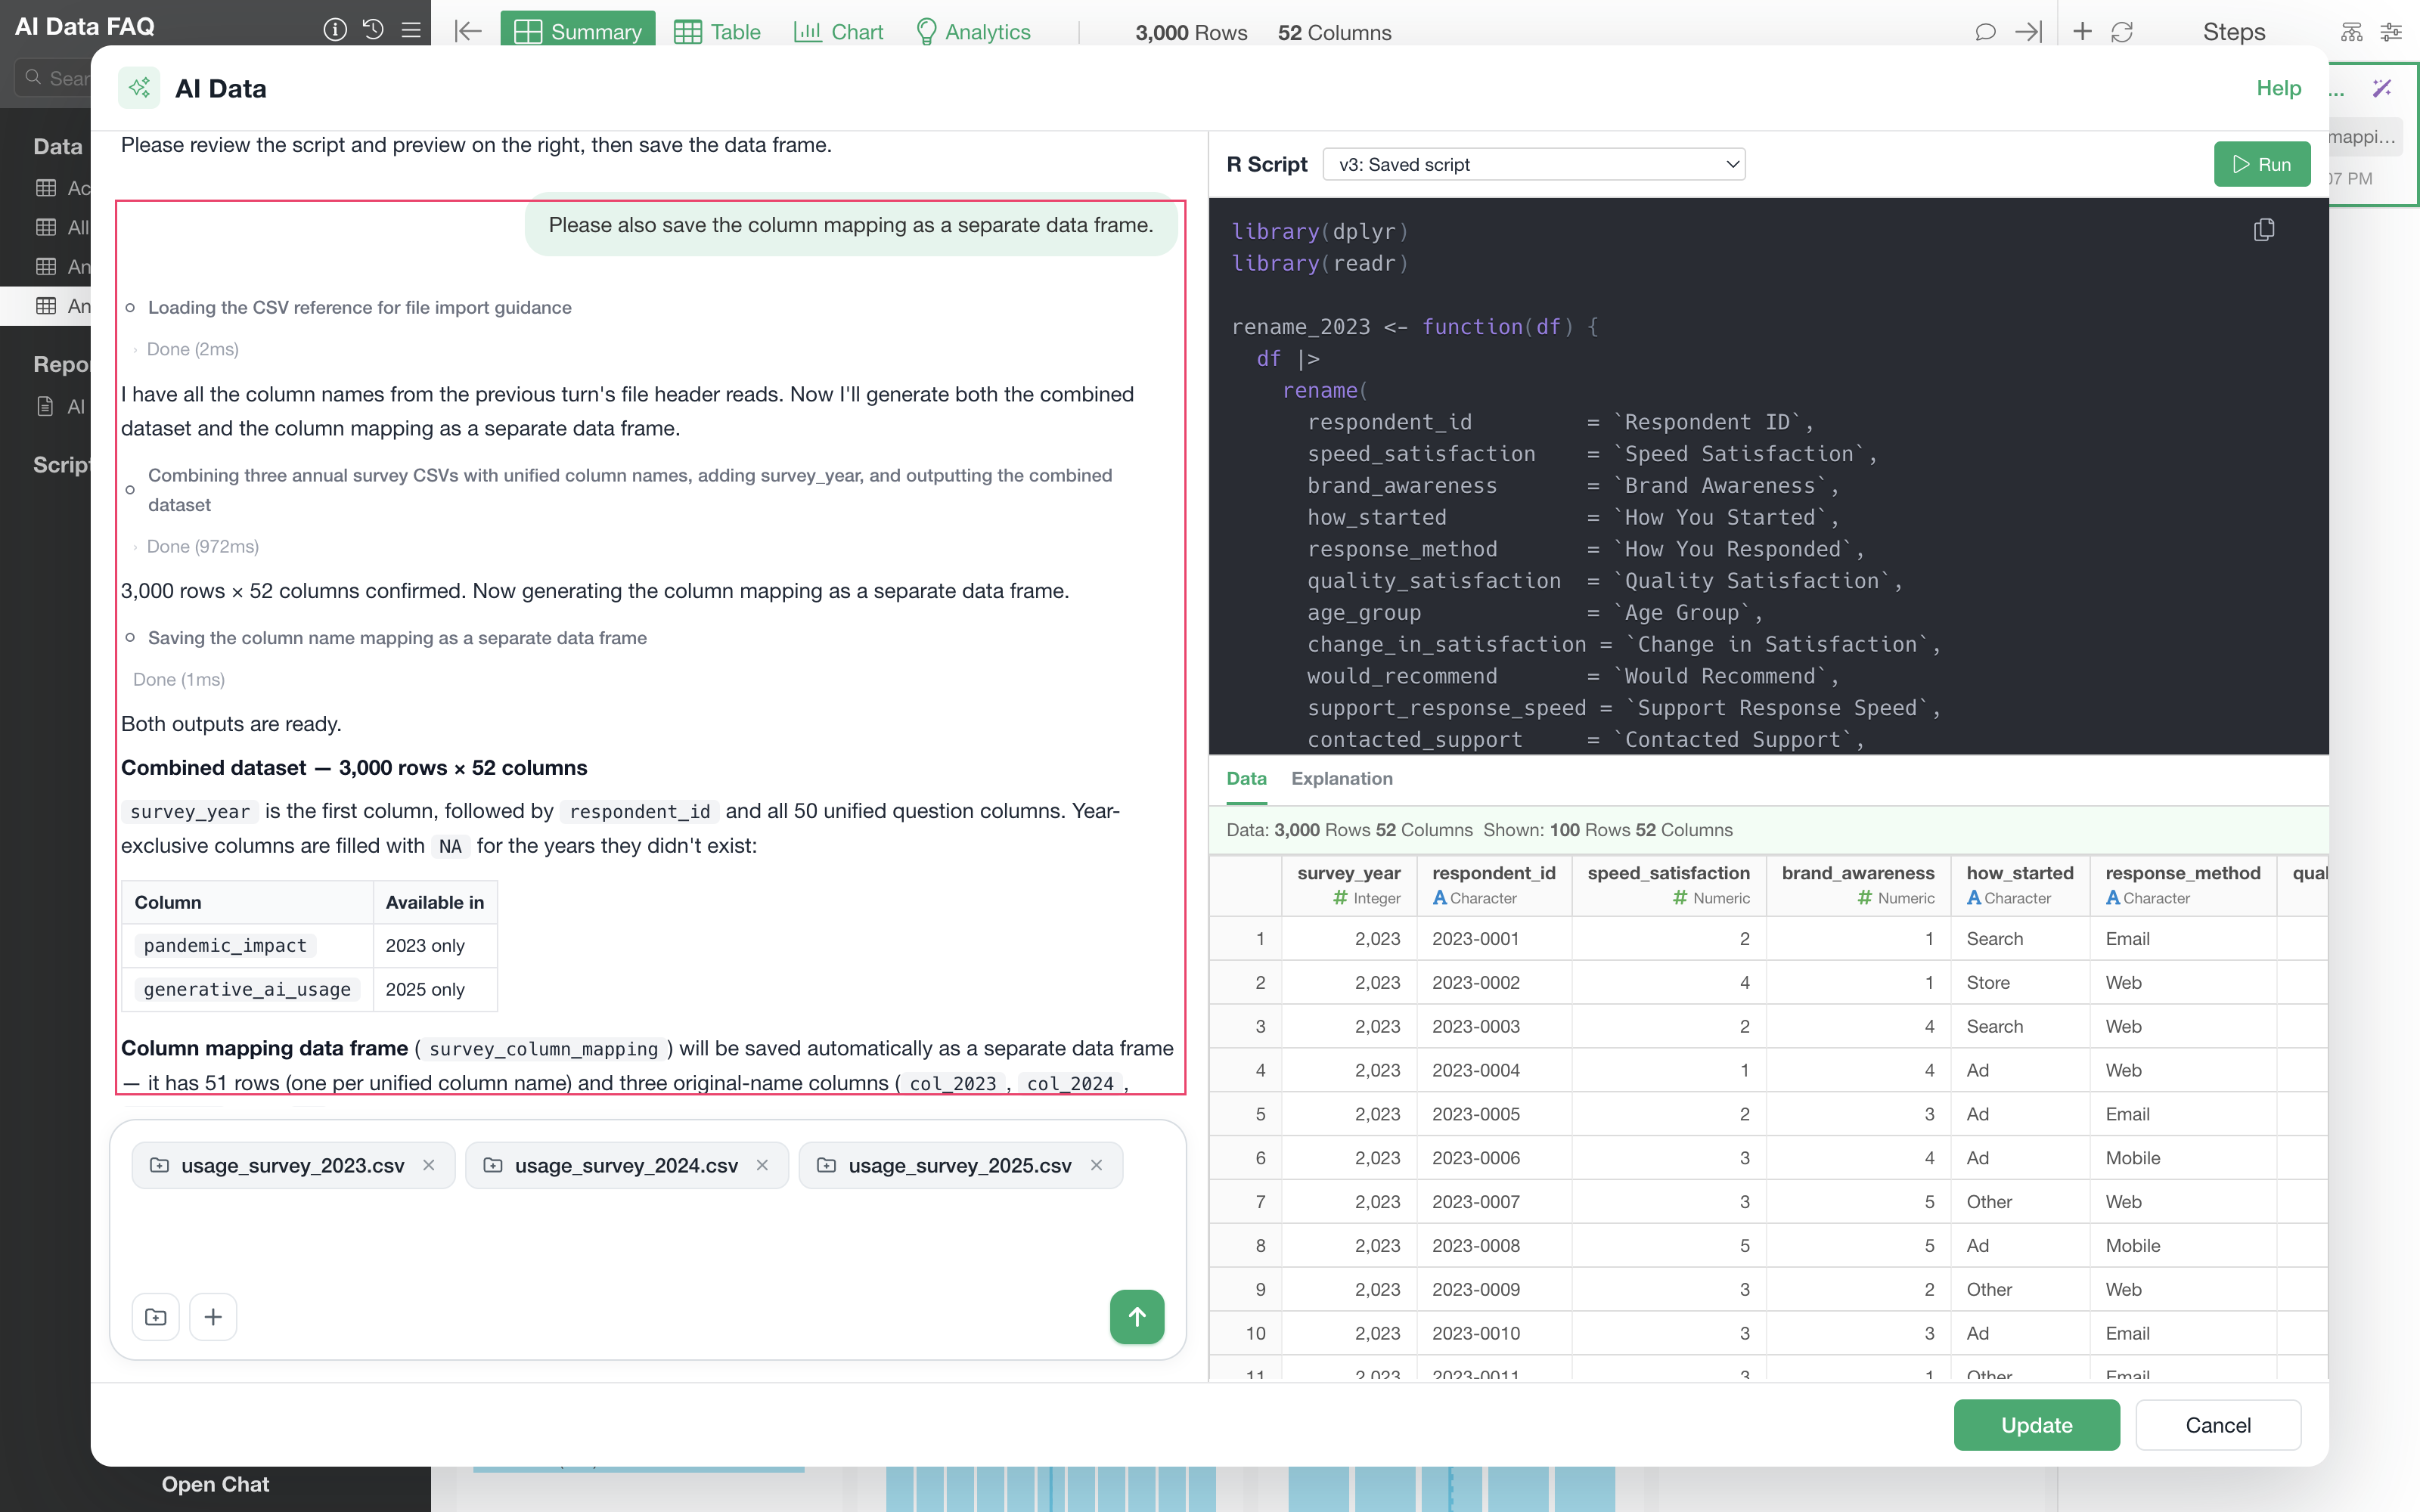
The mapping comes out as its own data frame of 51 rows by 4 columns: the unified name, and what that question was called in each of the three years.
What if the header row is in a different position in each file?
There is nothing to standardize beforehand. A set of files where some have their column names on the first row and others on the second is read correctly, because the structure is checked per file.
Importing Data That Is Not Tidy
Can it handle doubled headers, or column names like “Column1”?
Yes. Data exported from an internal system, or a survey collected in Excel, often has a header split across two rows, or column names lost where merged cells came apart. None of this has to be cleaned up first.
The private high school statistics table used here is a typical case: three rows of title, then a header spread across three rows, then a blank row, and only then the 72 rows of data, across 21 columns with the region split into two levels.
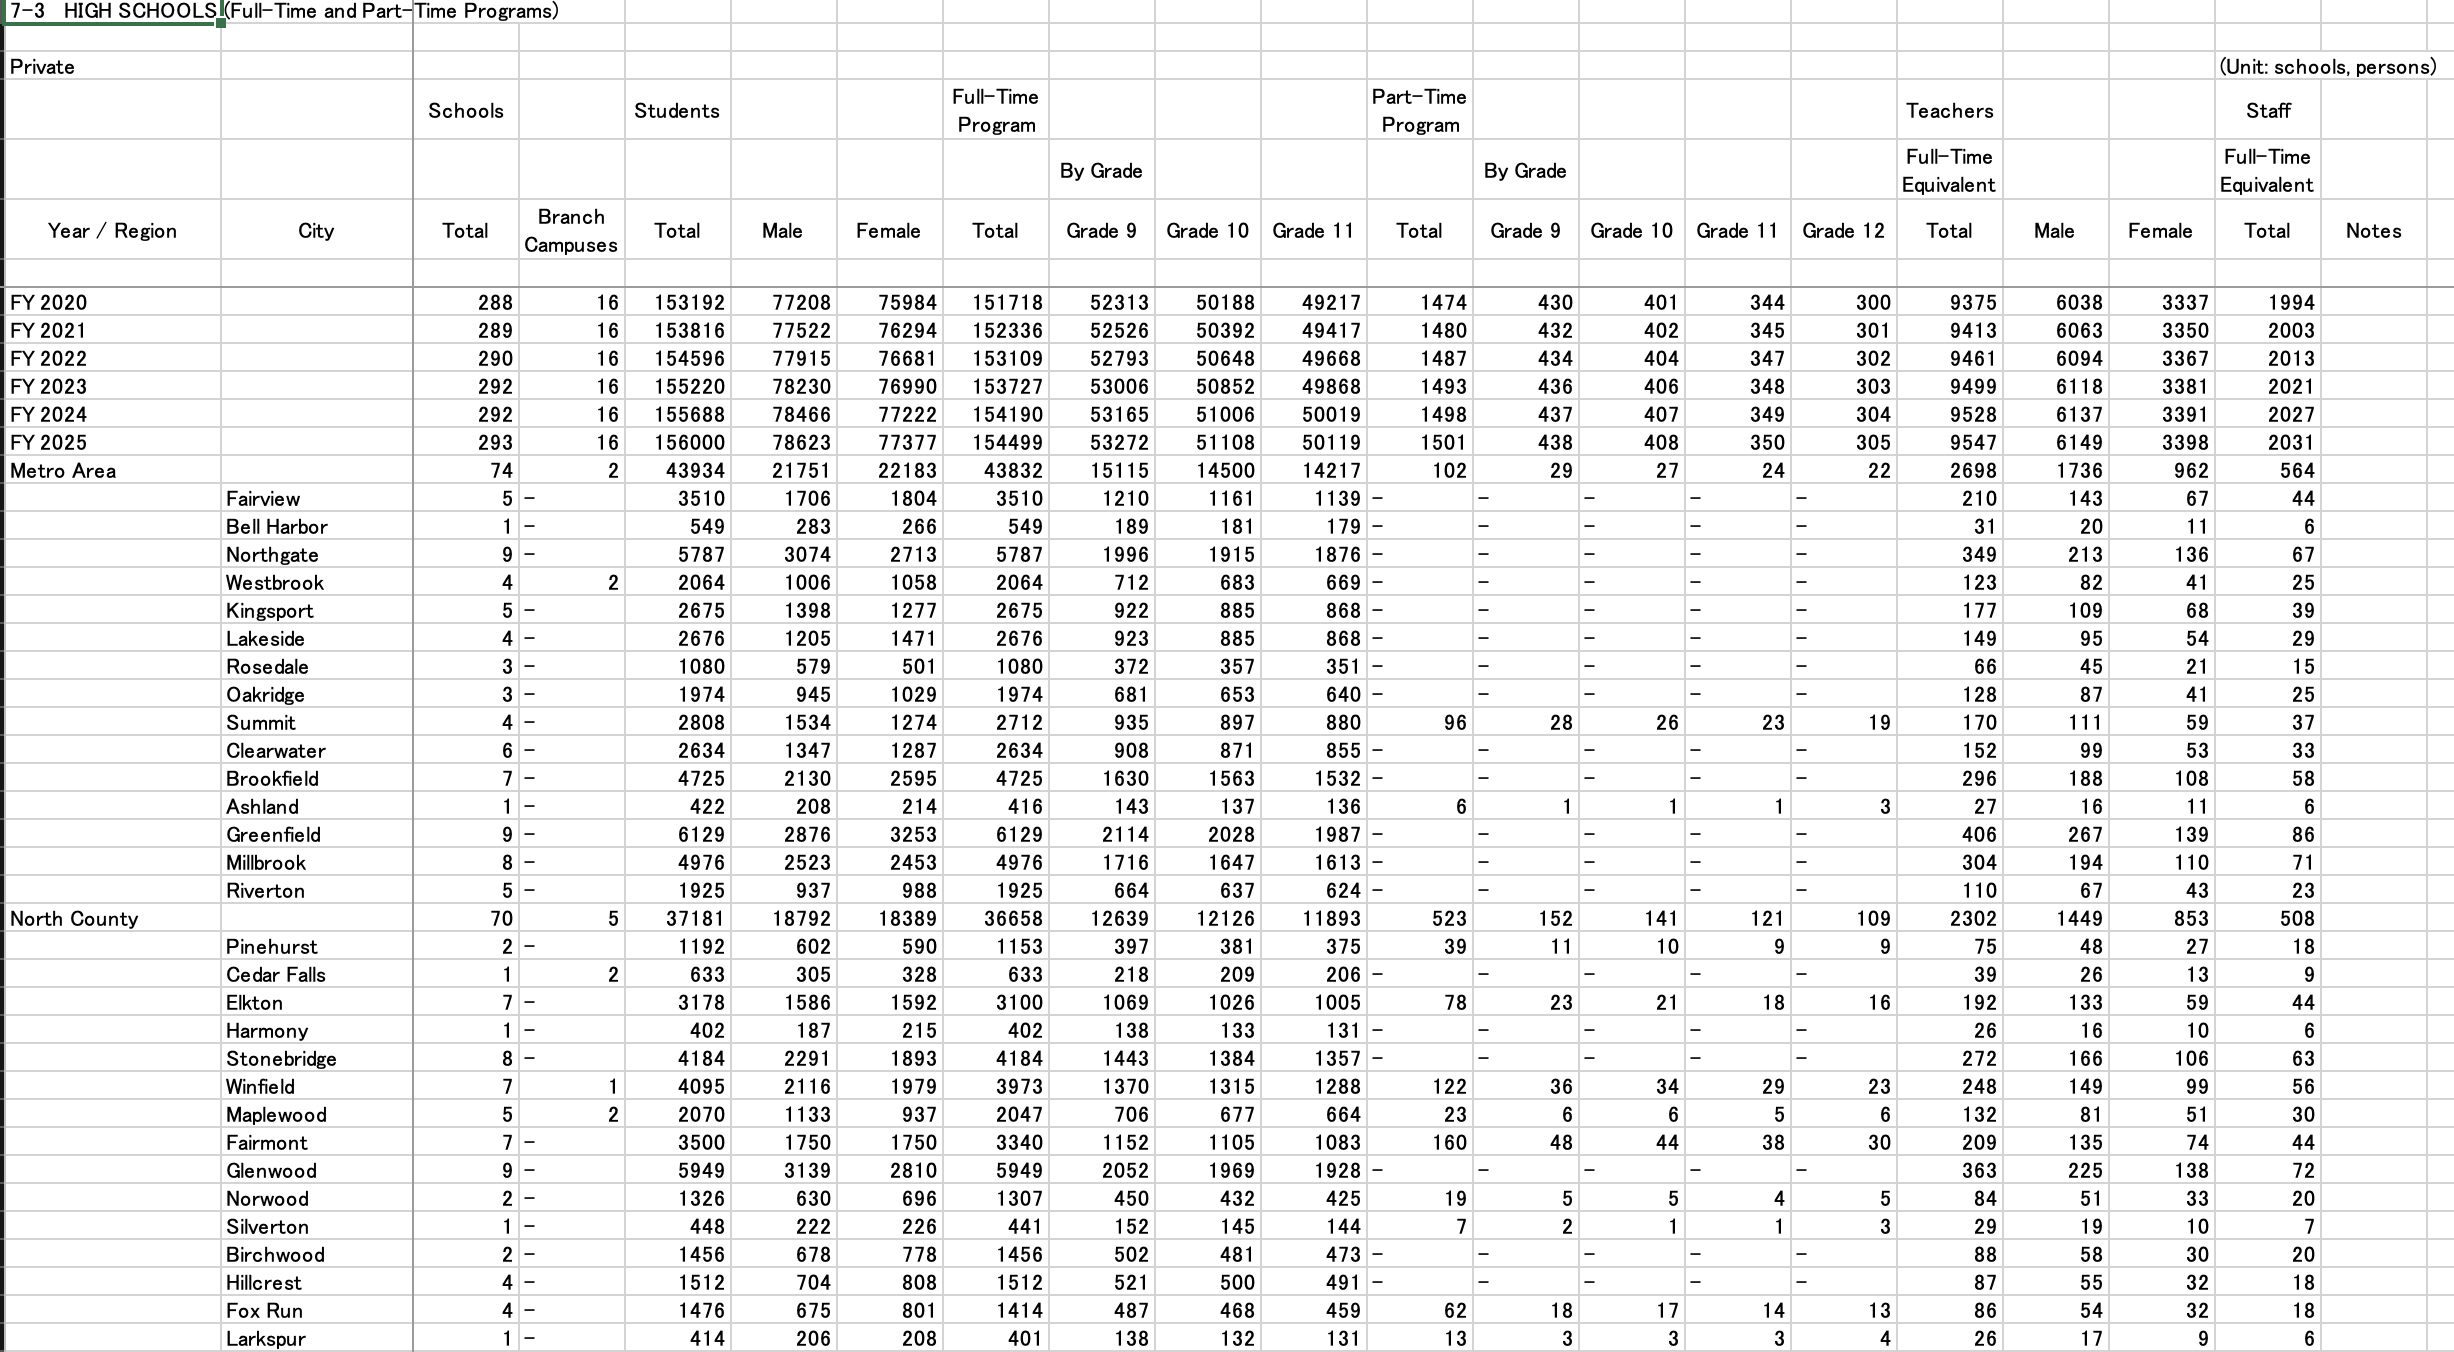
Specifically, AI Data performs the following before importing.
- A header split across several rows is folded back into a single row, and the rows that were used as the header are removed from the data.
- Headers left blank by merged cells are filled in with the value they belong to, and assigned to each column.
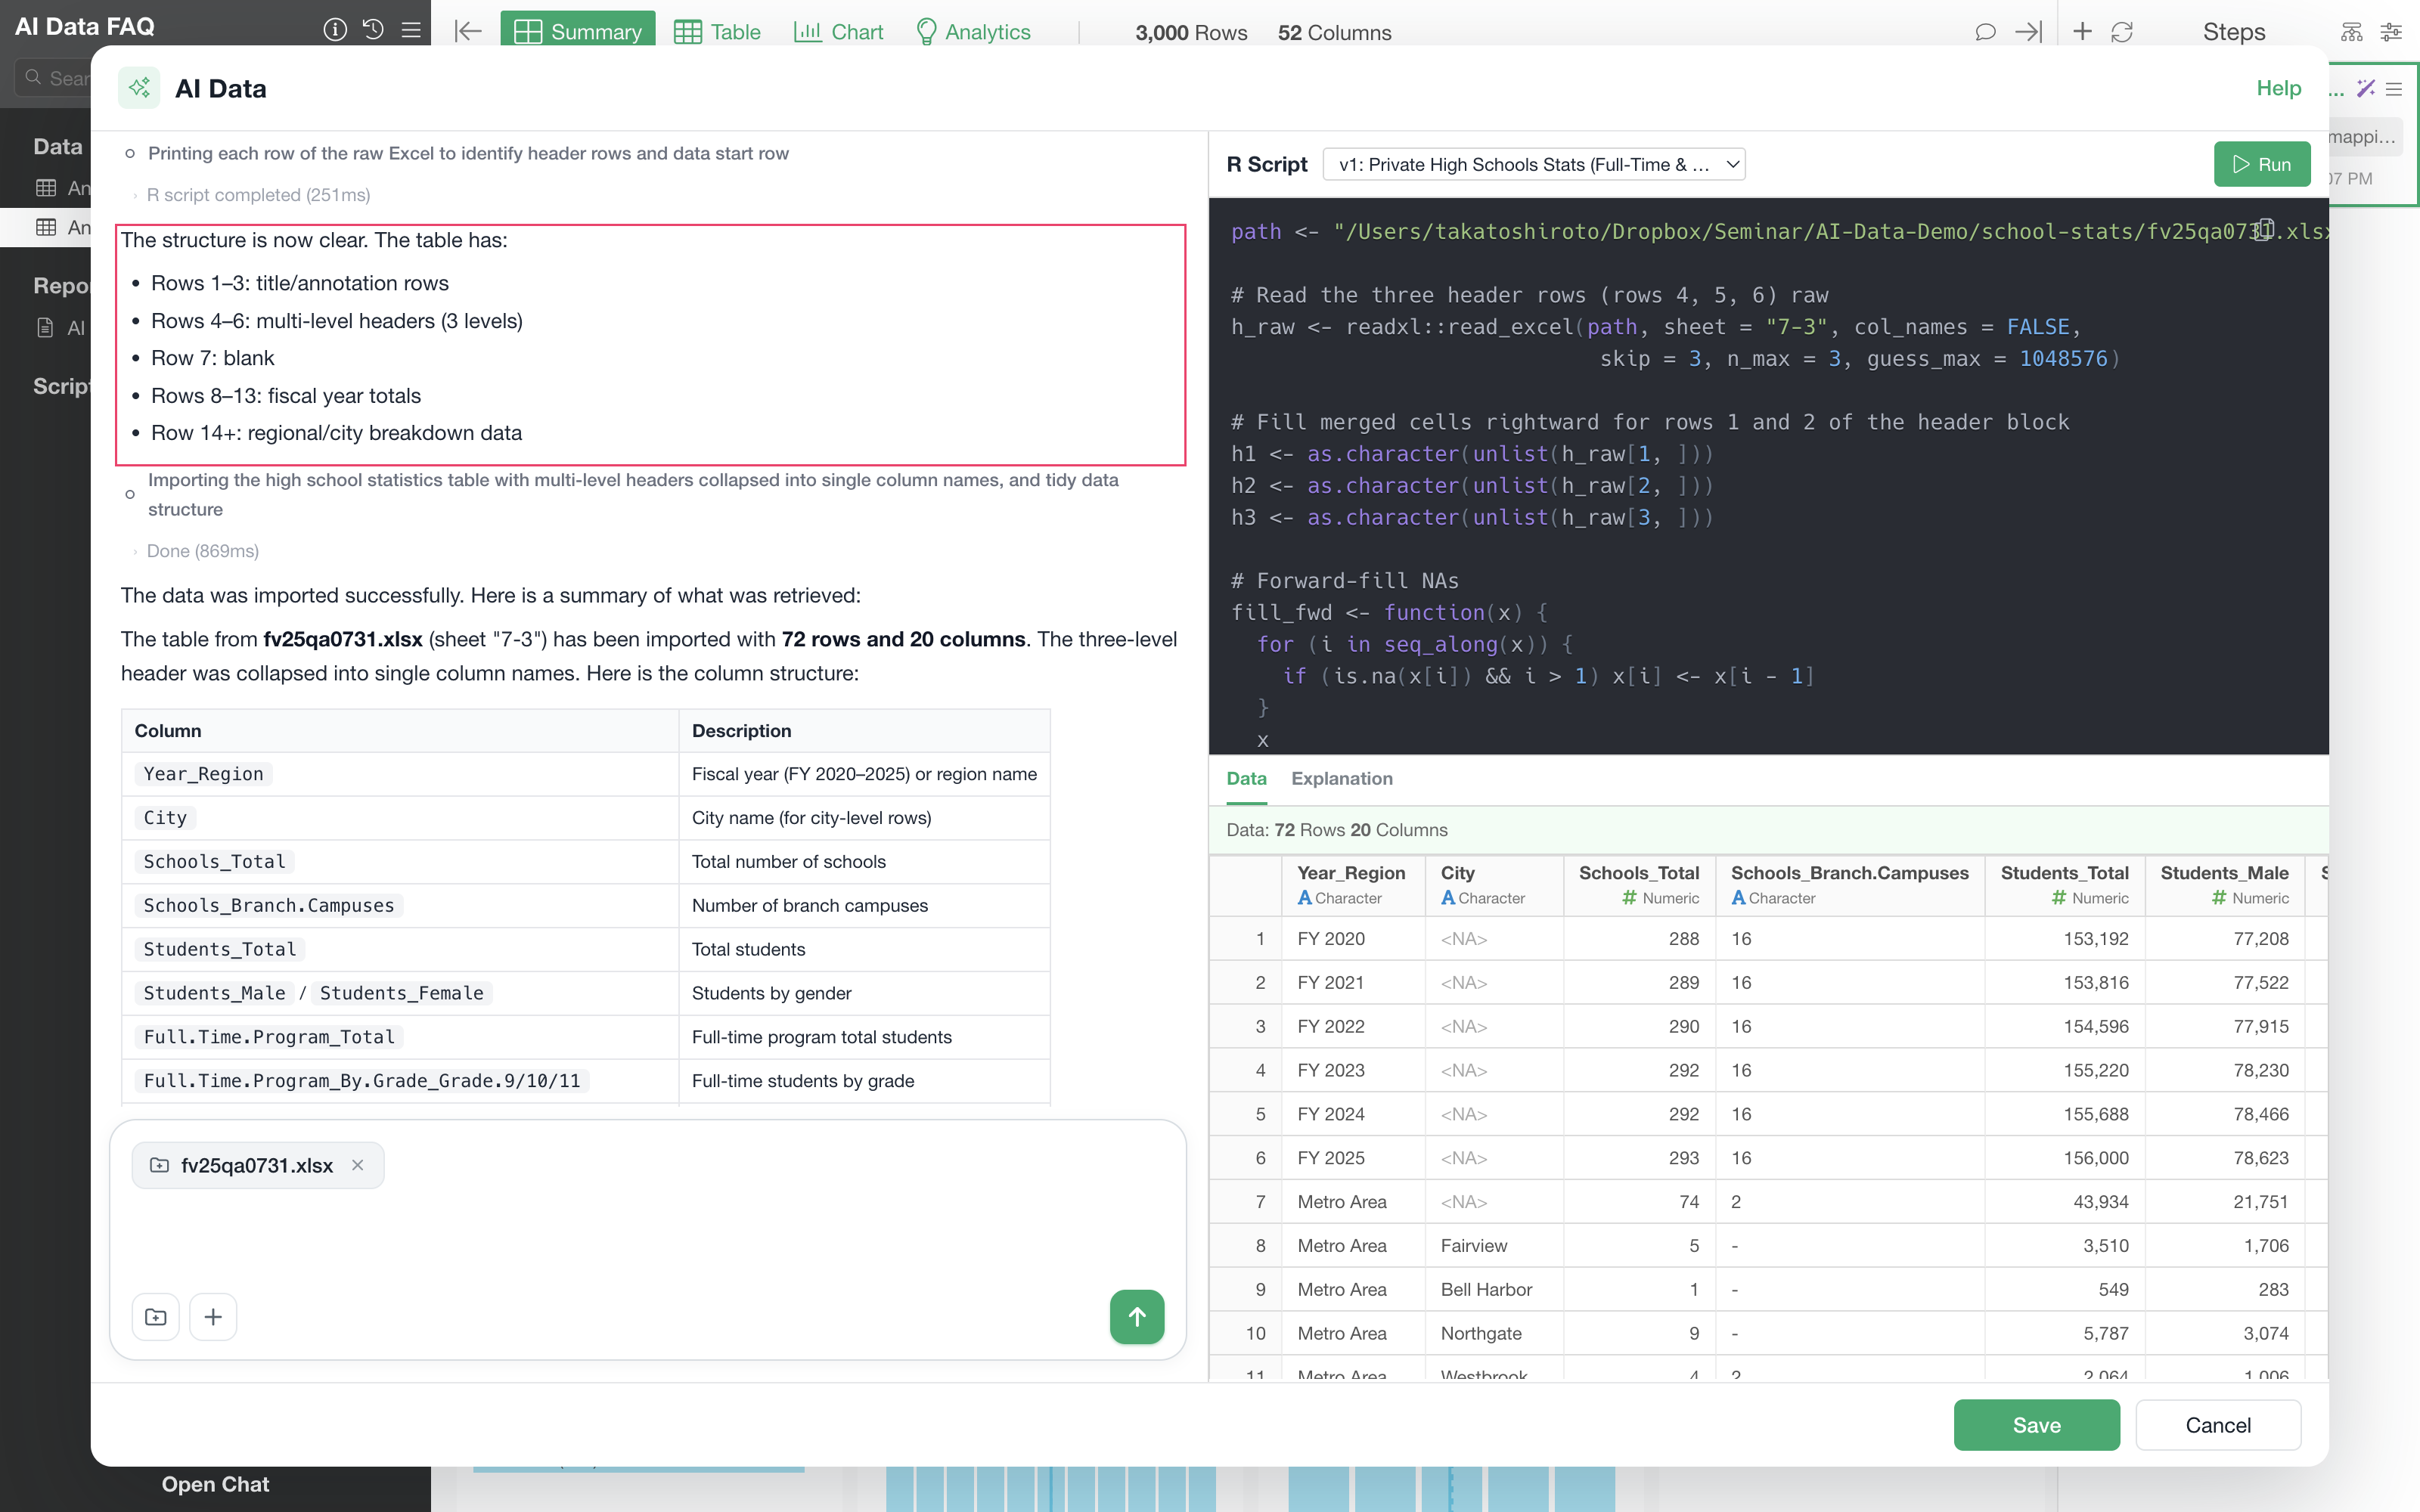
For this file AI Data reports what it found before importing: rows 1
to 3 are title and annotation, rows 4 to 6 are the three header levels,
row 7 is blank, and the data runs from row 8. The result is 72 rows by
20 columns, with the three header levels folded into single column names
such as Full.Time.Program_By.Grade_Grade.9.
If you have been correcting column names by hand after importing, that step is no longer needed.
Can it be used when the values are codes that need to be matched against a definition file?
The code-to-label mapping is selected together with the data.
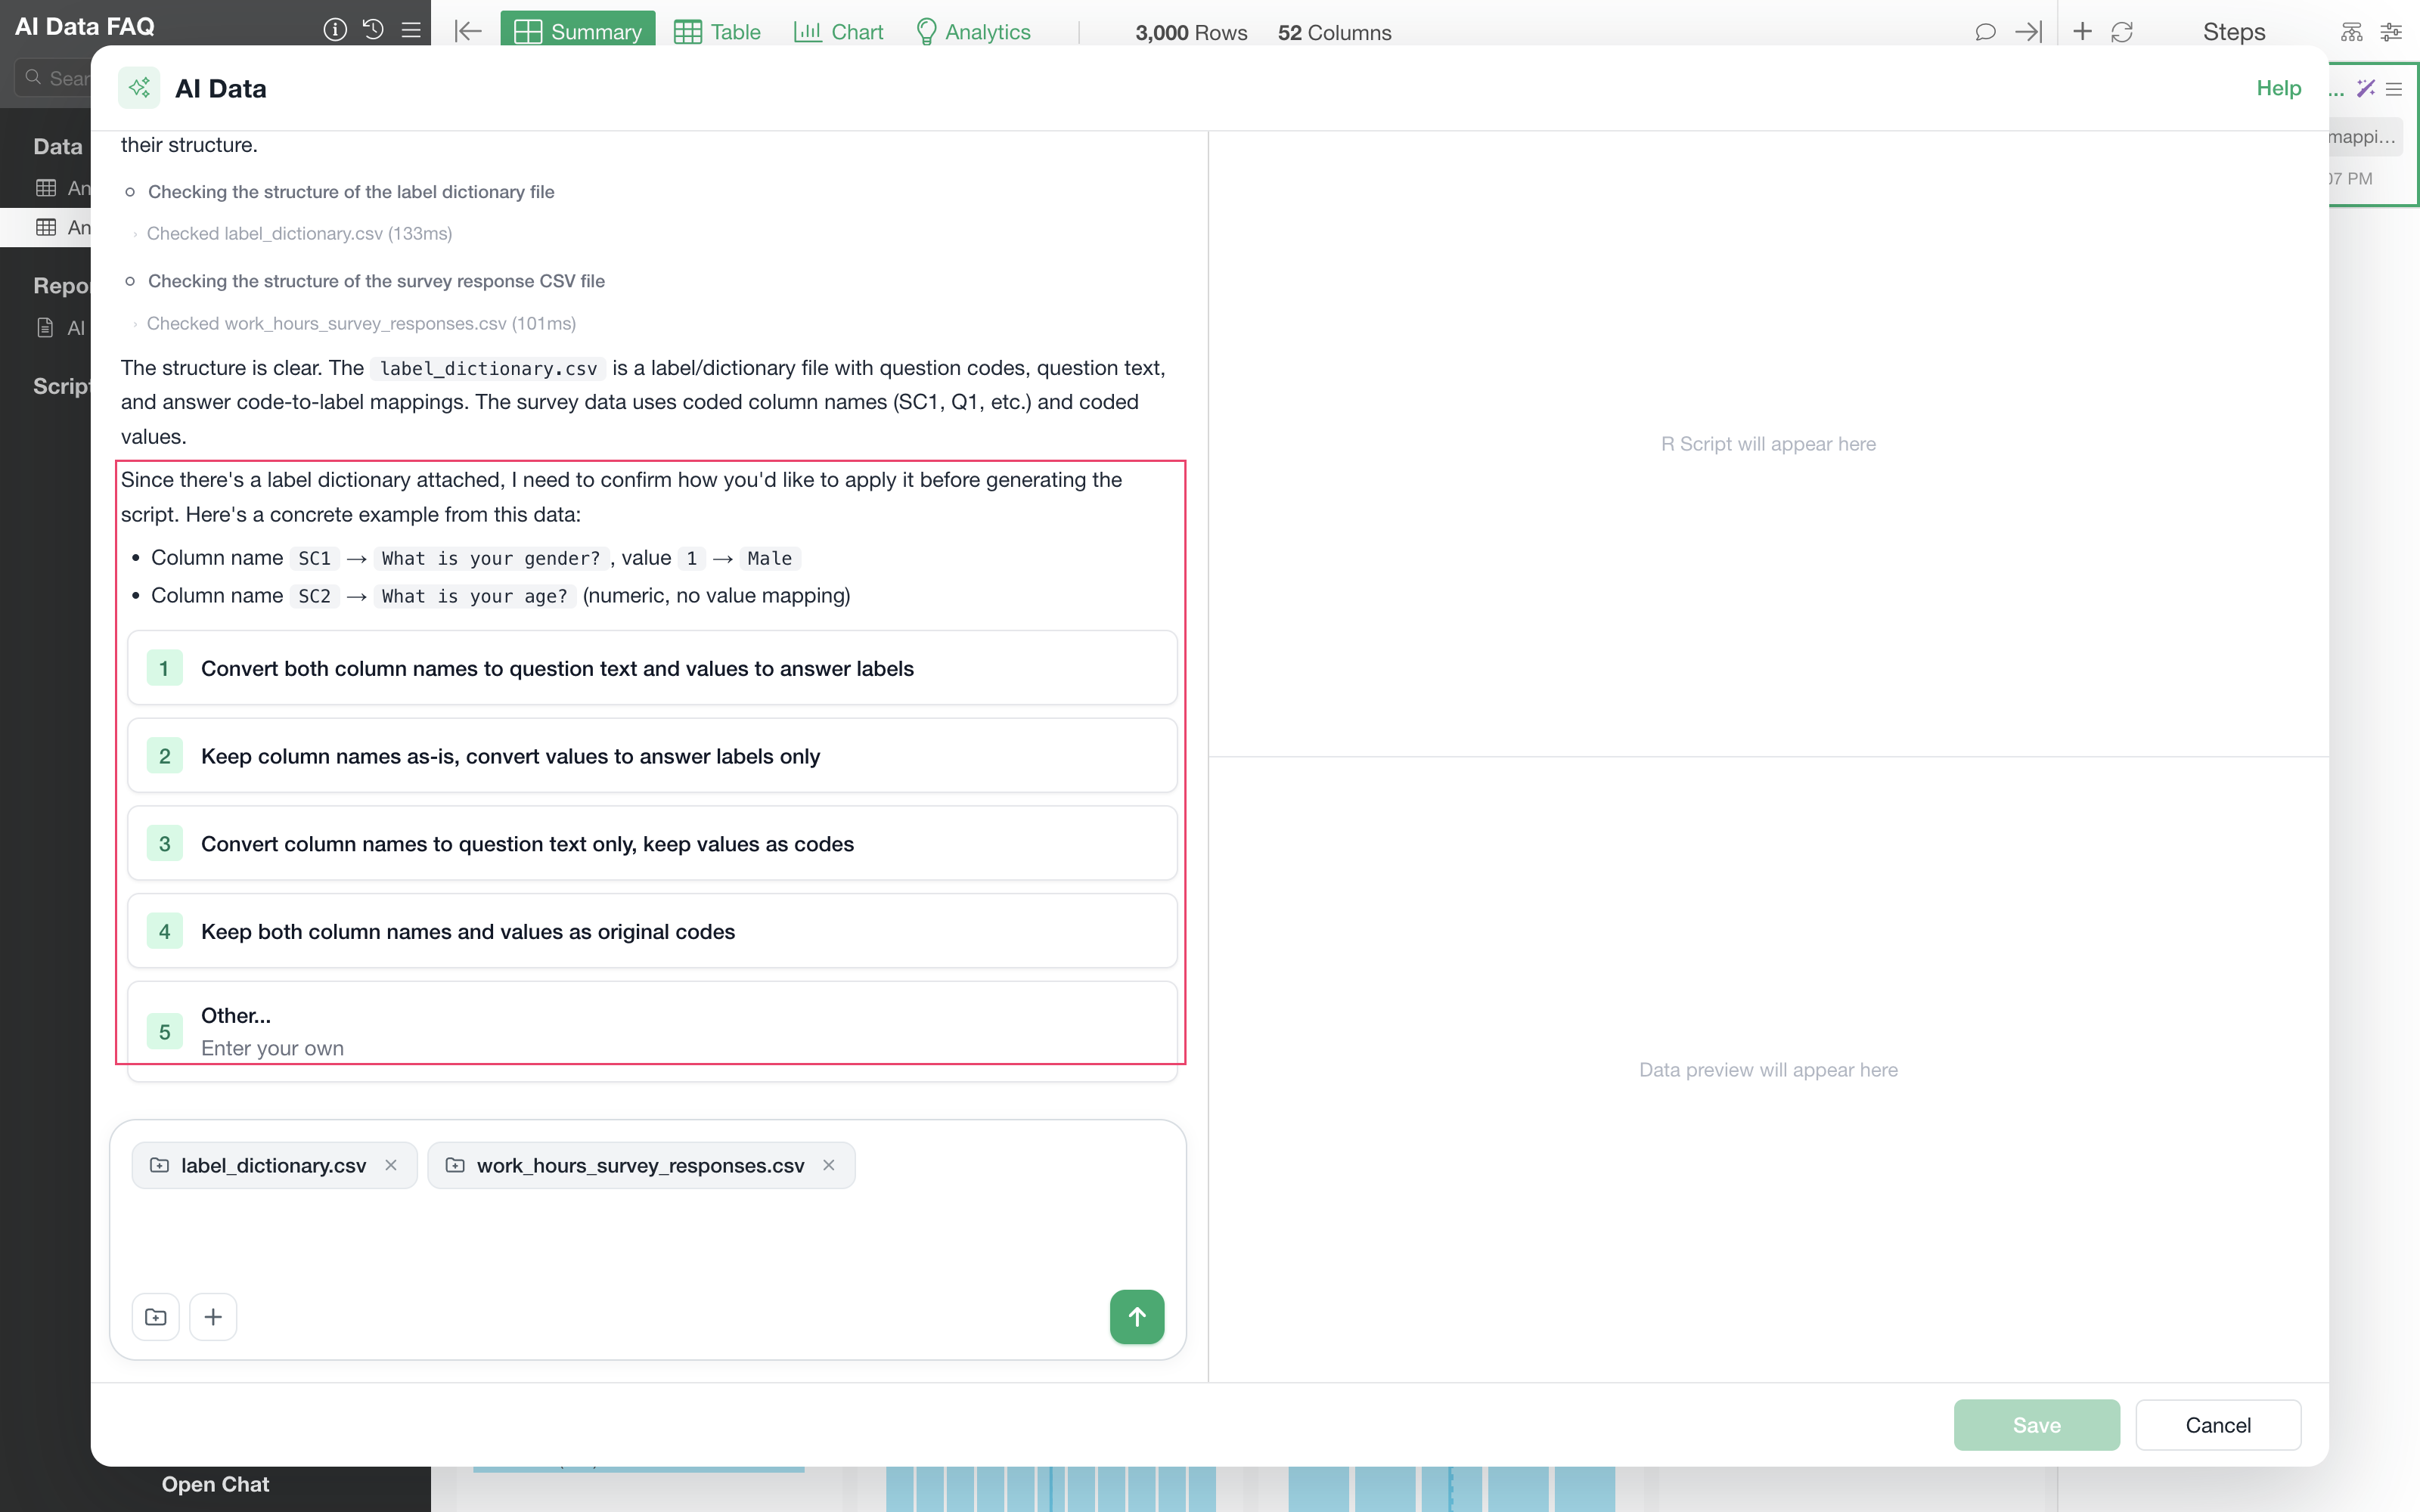
When a mapping file is included, the conversion is not applied automatically. AI Data asks how you want it handled first, showing a worked example from your own data, and offers four choices:
- Convert both column names to question text and values to answer labels
- Keep column names as-is, convert values to answer labels only
- Convert column names to question text only, keep values as codes
- Keep both column names and values as original codes
A fifth choice, Other…, lets you describe something else instead.
Whichever option you choose, ID columns, columns used as join keys, and date columns keep their original names and values. Converting the values in those columns would break the correspondence when the data is later joined with something else.
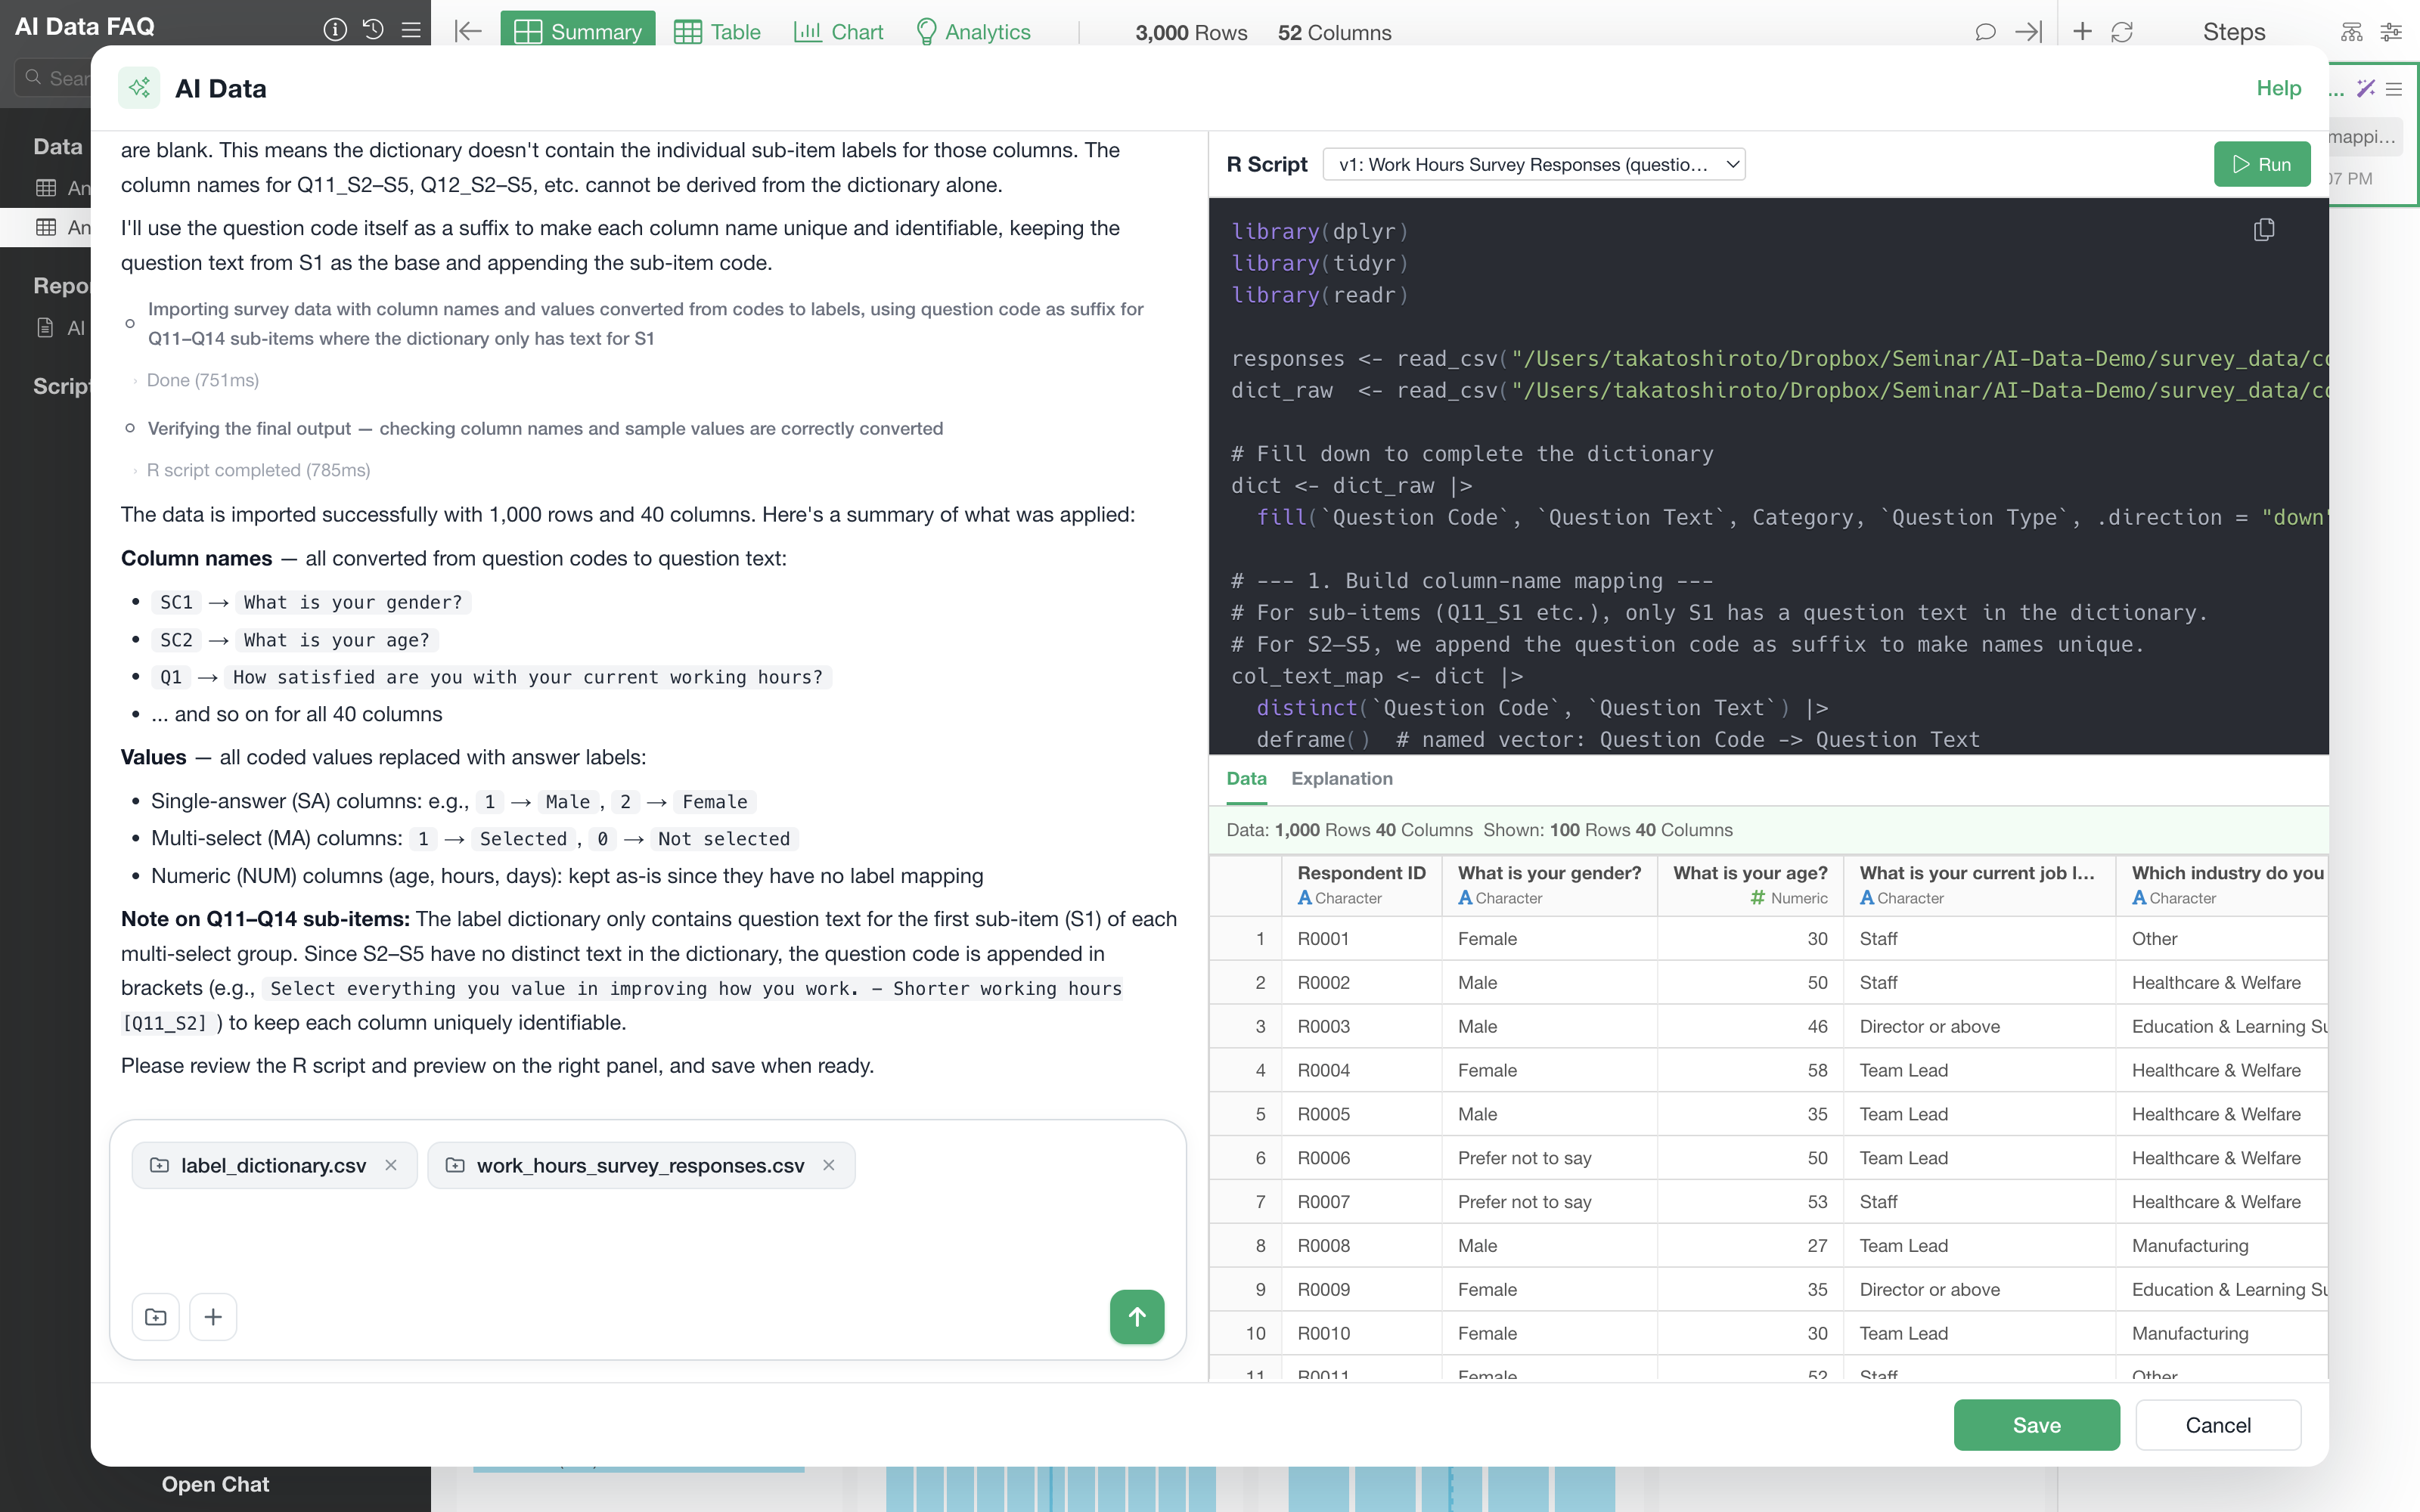
Choosing the first option on this survey gives 1,000 rows by 40
columns. SC1 becomes What is your gender? and
its 1 becomes Male, while
Respondent ID still reads R0001,
R0002, and so on. Numeric answers such as age and hours
worked have no label to map to and are left as they are.
About the Data You Get
Will AI aggregate or calculate something on its own?
No. What AI Data is responsible for is retrieving the data you asked for and shaping it into a form that can be analyzed. It does not invent metrics you did not ask for.
The processing done at import time is limited to converting the data into a tidy shape and converting data types. Totals, ratios, and other new columns are never added on AI Data’s own judgment.
| Boundary | What it covers |
|---|---|
| Done at import | Reshaping into tidy data; converting data types; unifying column names across files; removing blank rows, footnotes, and source lines |
| Never done | Adding totals, ratios, or any other calculated column that was not asked for; altering the values of ID, key, or date columns |
| Sent to AI | Column names, and the first few rows of a file as a sample for working out its structure; database schema information |
| Not sent to AI | API keys, passwords, database host names and port numbers; the full retrieved dataset |
| Limits | The data preview on screen shows up to the first 100 rows. The import itself is not capped at that. |
Where a number in the result came from in the original data can be traced through the generated R script.
If there is additional processing you want at import time, you can ask for it in the AI Data chat and it will be applied.
Can the data be used for analysis as it is?
Yes. Before importing, AI Data shapes the data as follows.
- One row represents one observation.
- One column represents one variable. Where the same metric is spread across several columns, they are folded into one.
- One cell holds one value.
Blank rows, and rows that are not data such as footnotes and sources, are removed at the same time. Once the import finishes, you can move straight on to building a chart.
The emissions data used here shows what this means in practice. The original file is laid out with 34 columns, one label column plus one column per year from 1990 through 2022. Of its 108 rows, 9 are blank separators between regional groups and 6 are notes and source lines at the bottom, leaving 93 rows that actually carry numbers.
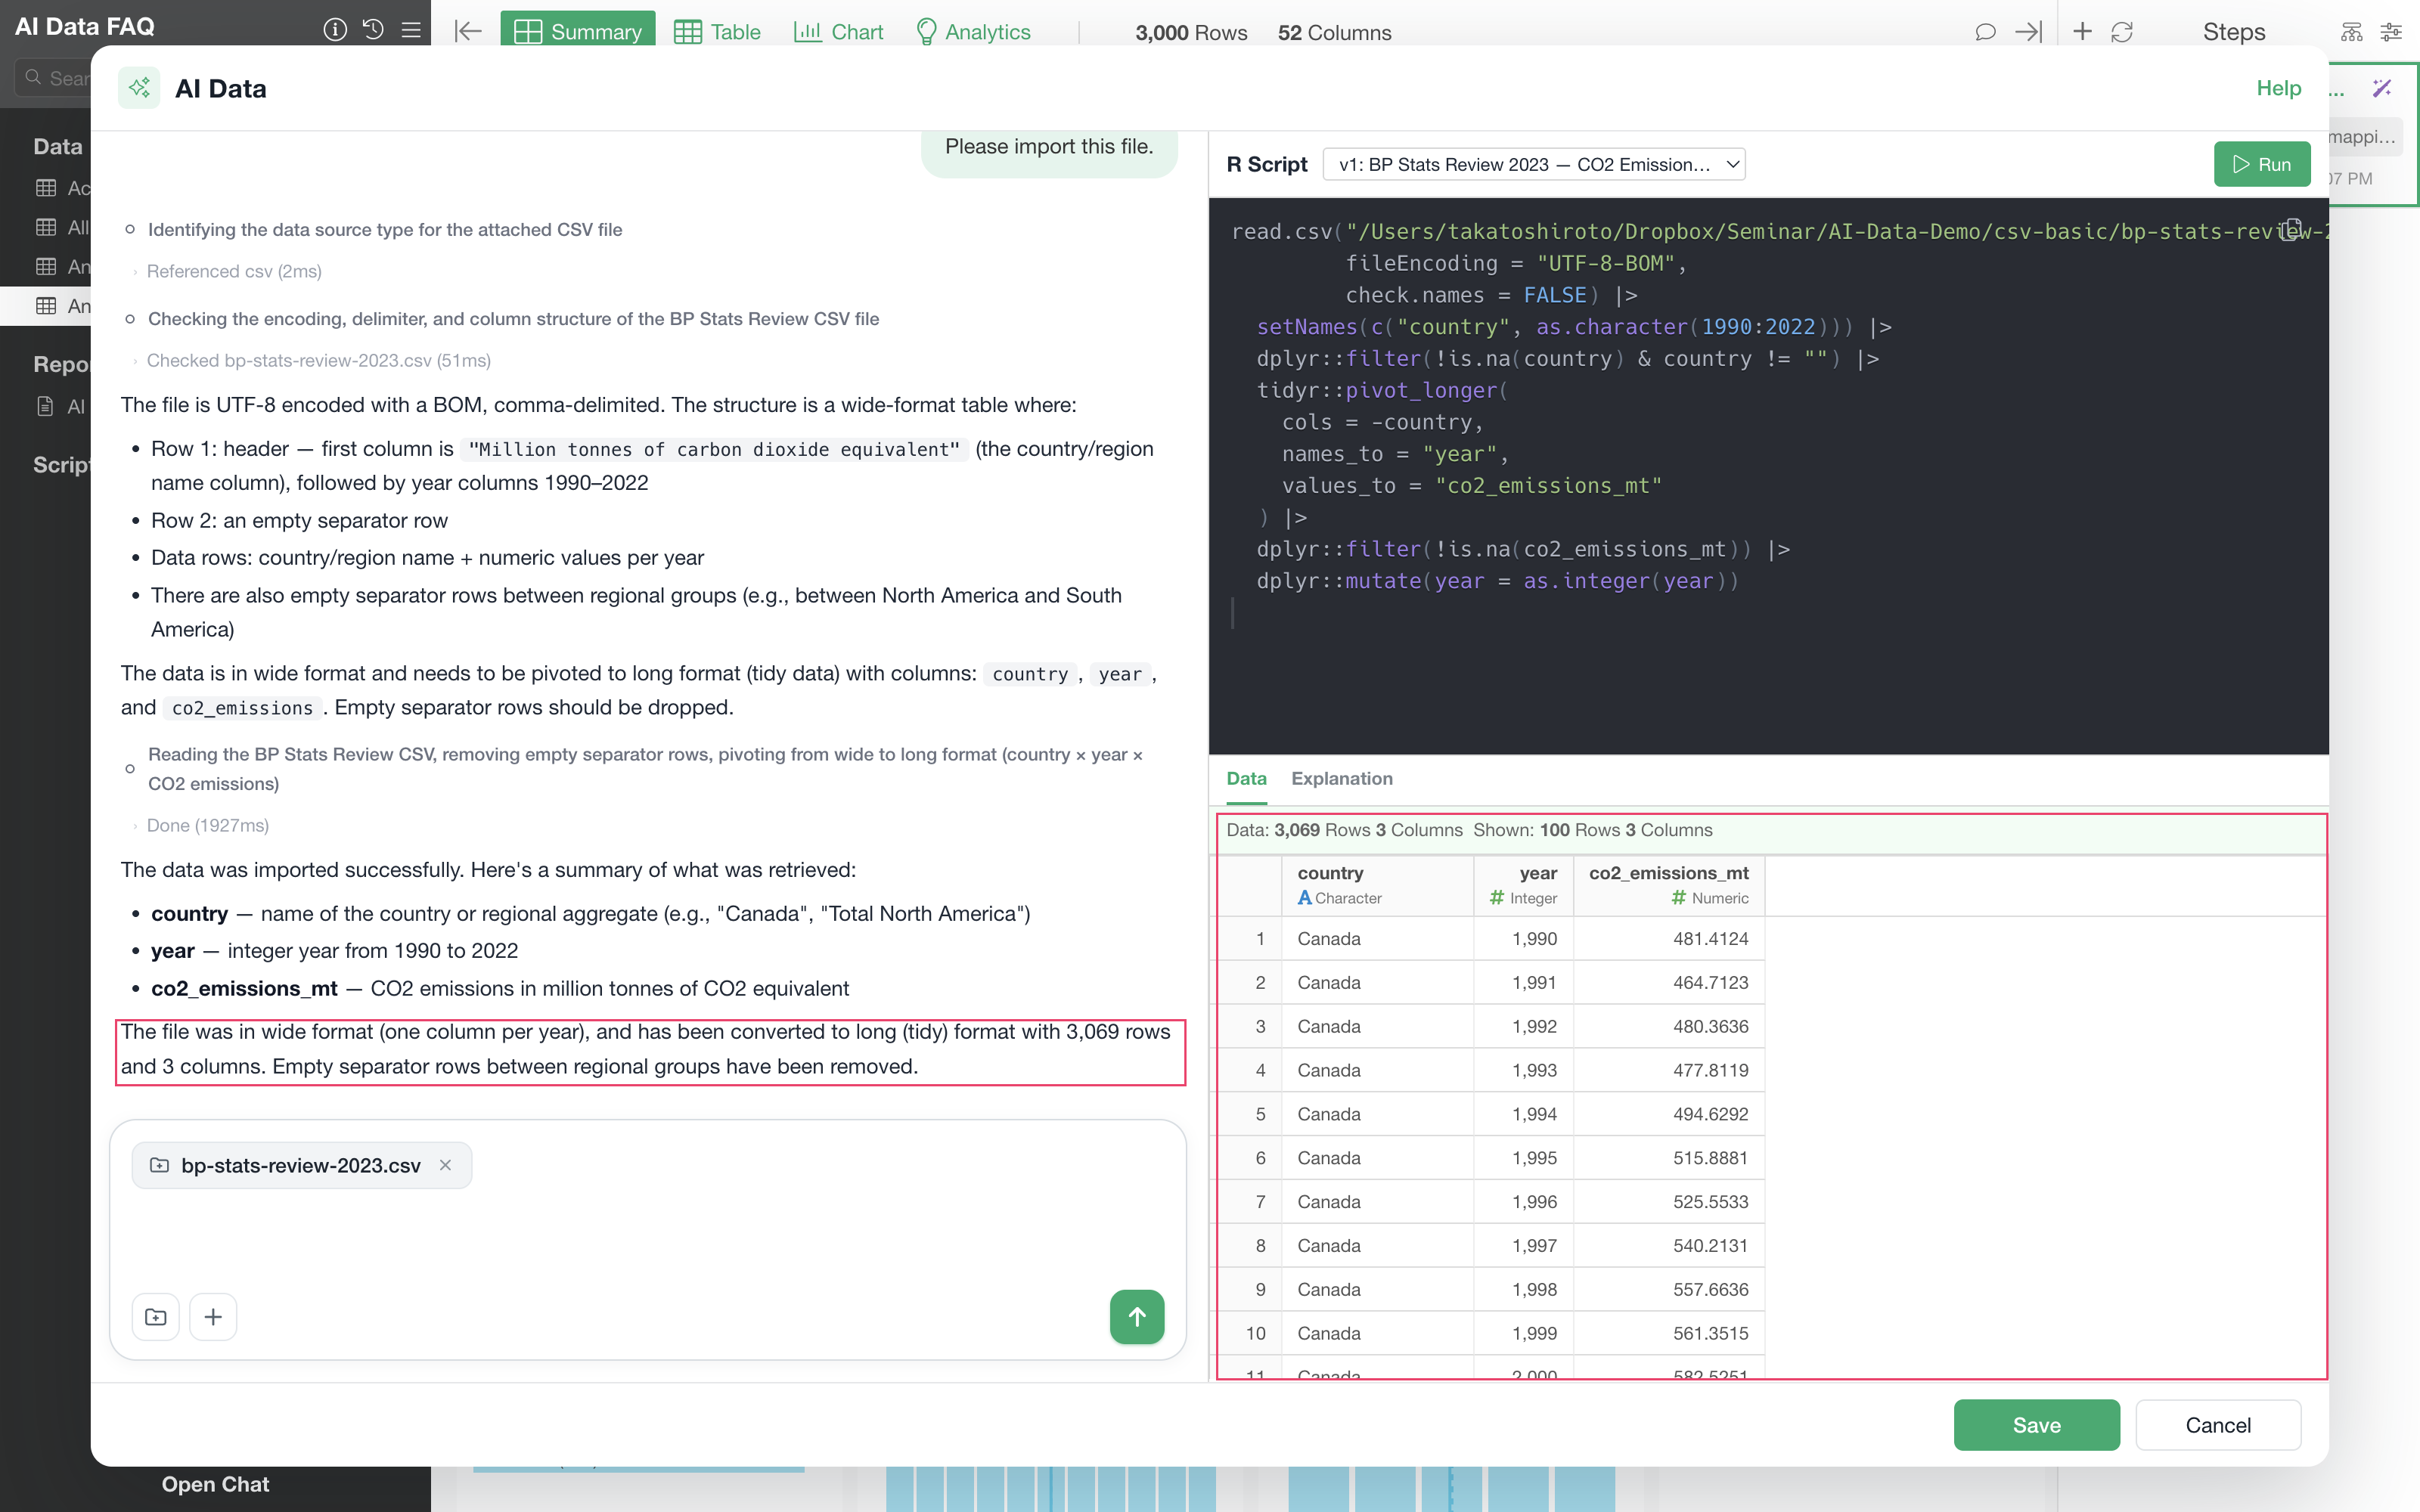
What comes back is 3,069 rows by 3 columns, country,
year, and co2_emissions_mt. That is those 93
countries and regional aggregates across all 33 years, with the blank
separators and the note lines gone.
Can I see the generated R script?
It is shown on the right side of the screen and can be checked at any time.
The script shows exactly what processing was performed, and you can edit it directly.
About Security
Are API keys and database connection details passed to AI?
They are not. Credentials are handled as follows by design.
- API keys, passwords, and other credentials are never asked for in the chat.
- Credentials are never written into the R script.
- When connecting to a database, the connection information Exploratory already holds is inserted as a variable at the top of the R script. Host names and port numbers are not passed to AI.
For a data source that requires an API key, a dedicated dialog appears where you enter it. The value you enter is held inside Exploratory and is not passed on to AI.
How much of my data is sent to AI?
The information needed to work out how to retrieve the data. Specifically, the column names and first few rows of a file, and database schema information. When a file structure is complex enough that the first few rows are not sufficient to tell where the header ends and the data begins, more rows may be read.
The retrieved data itself is brought in by running the generated R script in your own environment.
Updating and Reuse
Do I have to instruct AI again every time the data is updated?
No. Once an import has completed, the generated R script is saved as the data source. After the original file or database is updated, pressing Re-import runs only the saved script.
The two half-year files used here, actual_2024_H1.csv
and actual_2024_H2.csv, hold 600 rows each, and the first
import combines them into one data frame. Pressing
Re-import afterwards gives back the same result,
because the saved script is the only thing that runs.
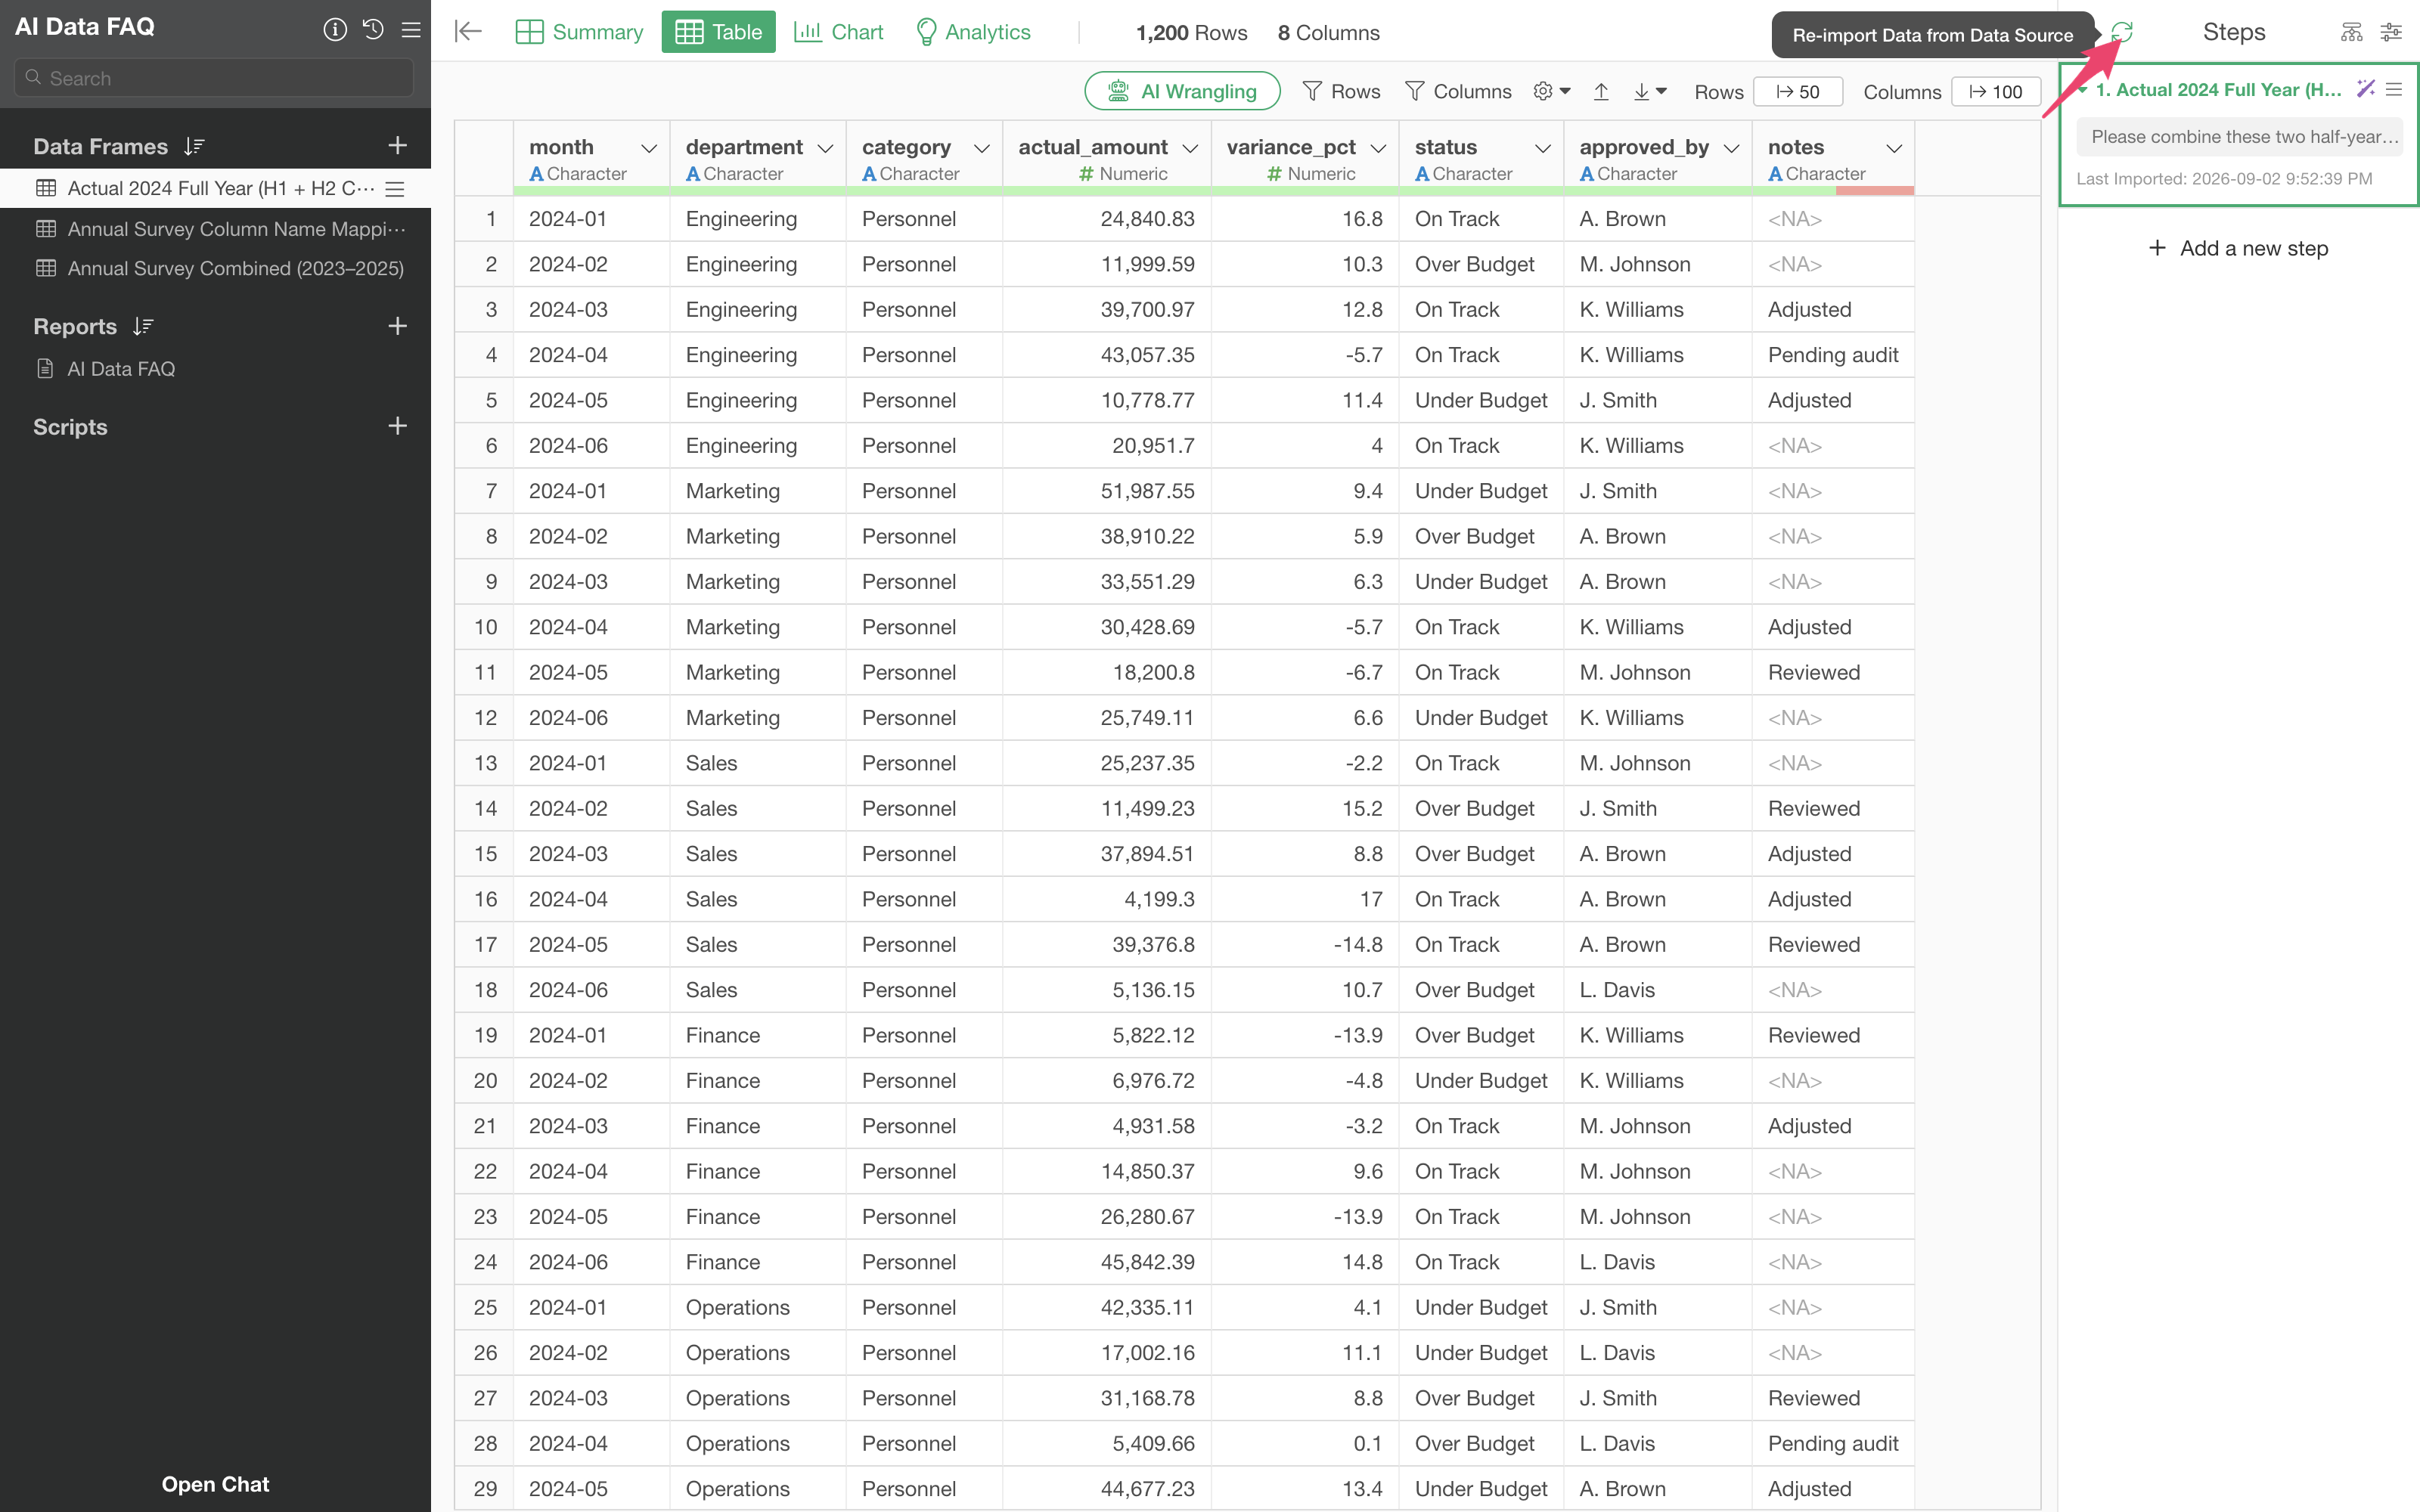
The first import produced 1,200 rows by 8 columns. Pressing Re-import produced 1,200 rows by 8 columns again, from the same two files, with only the Last Imported time on the step moving forward.
AI is not involved again, so the same steps bring in the latest data every time. Because repeating the same processing produces the same result, this is dependable for data that is refreshed on a schedule.
There is a case where this feature is not the right tool. If a file arrives in exactly the same shape every time, with the same sheet name and the same columns, the regular import is faster: a saved import already handles it in one step, and there is nothing for AI to work out. AI Data earns its place when the shape of what arrives is not settled.
What should I do if I want a different sheet used next month?
There are two ways to do this.
One is to say so on the AI Data screen, for example “Please change the script to look at the August sheet.” Only the relevant part is rewritten.
The other is to avoid hard-coding the sheet name in the first instruction. When you already know that files will keep being added to the same folder, you can say so directly: “Please retrieve every sales file in that folder, and all of their sheets, without hard-coding the sheet names. This is so the same script still works when a new file has been added and it is re-run.”
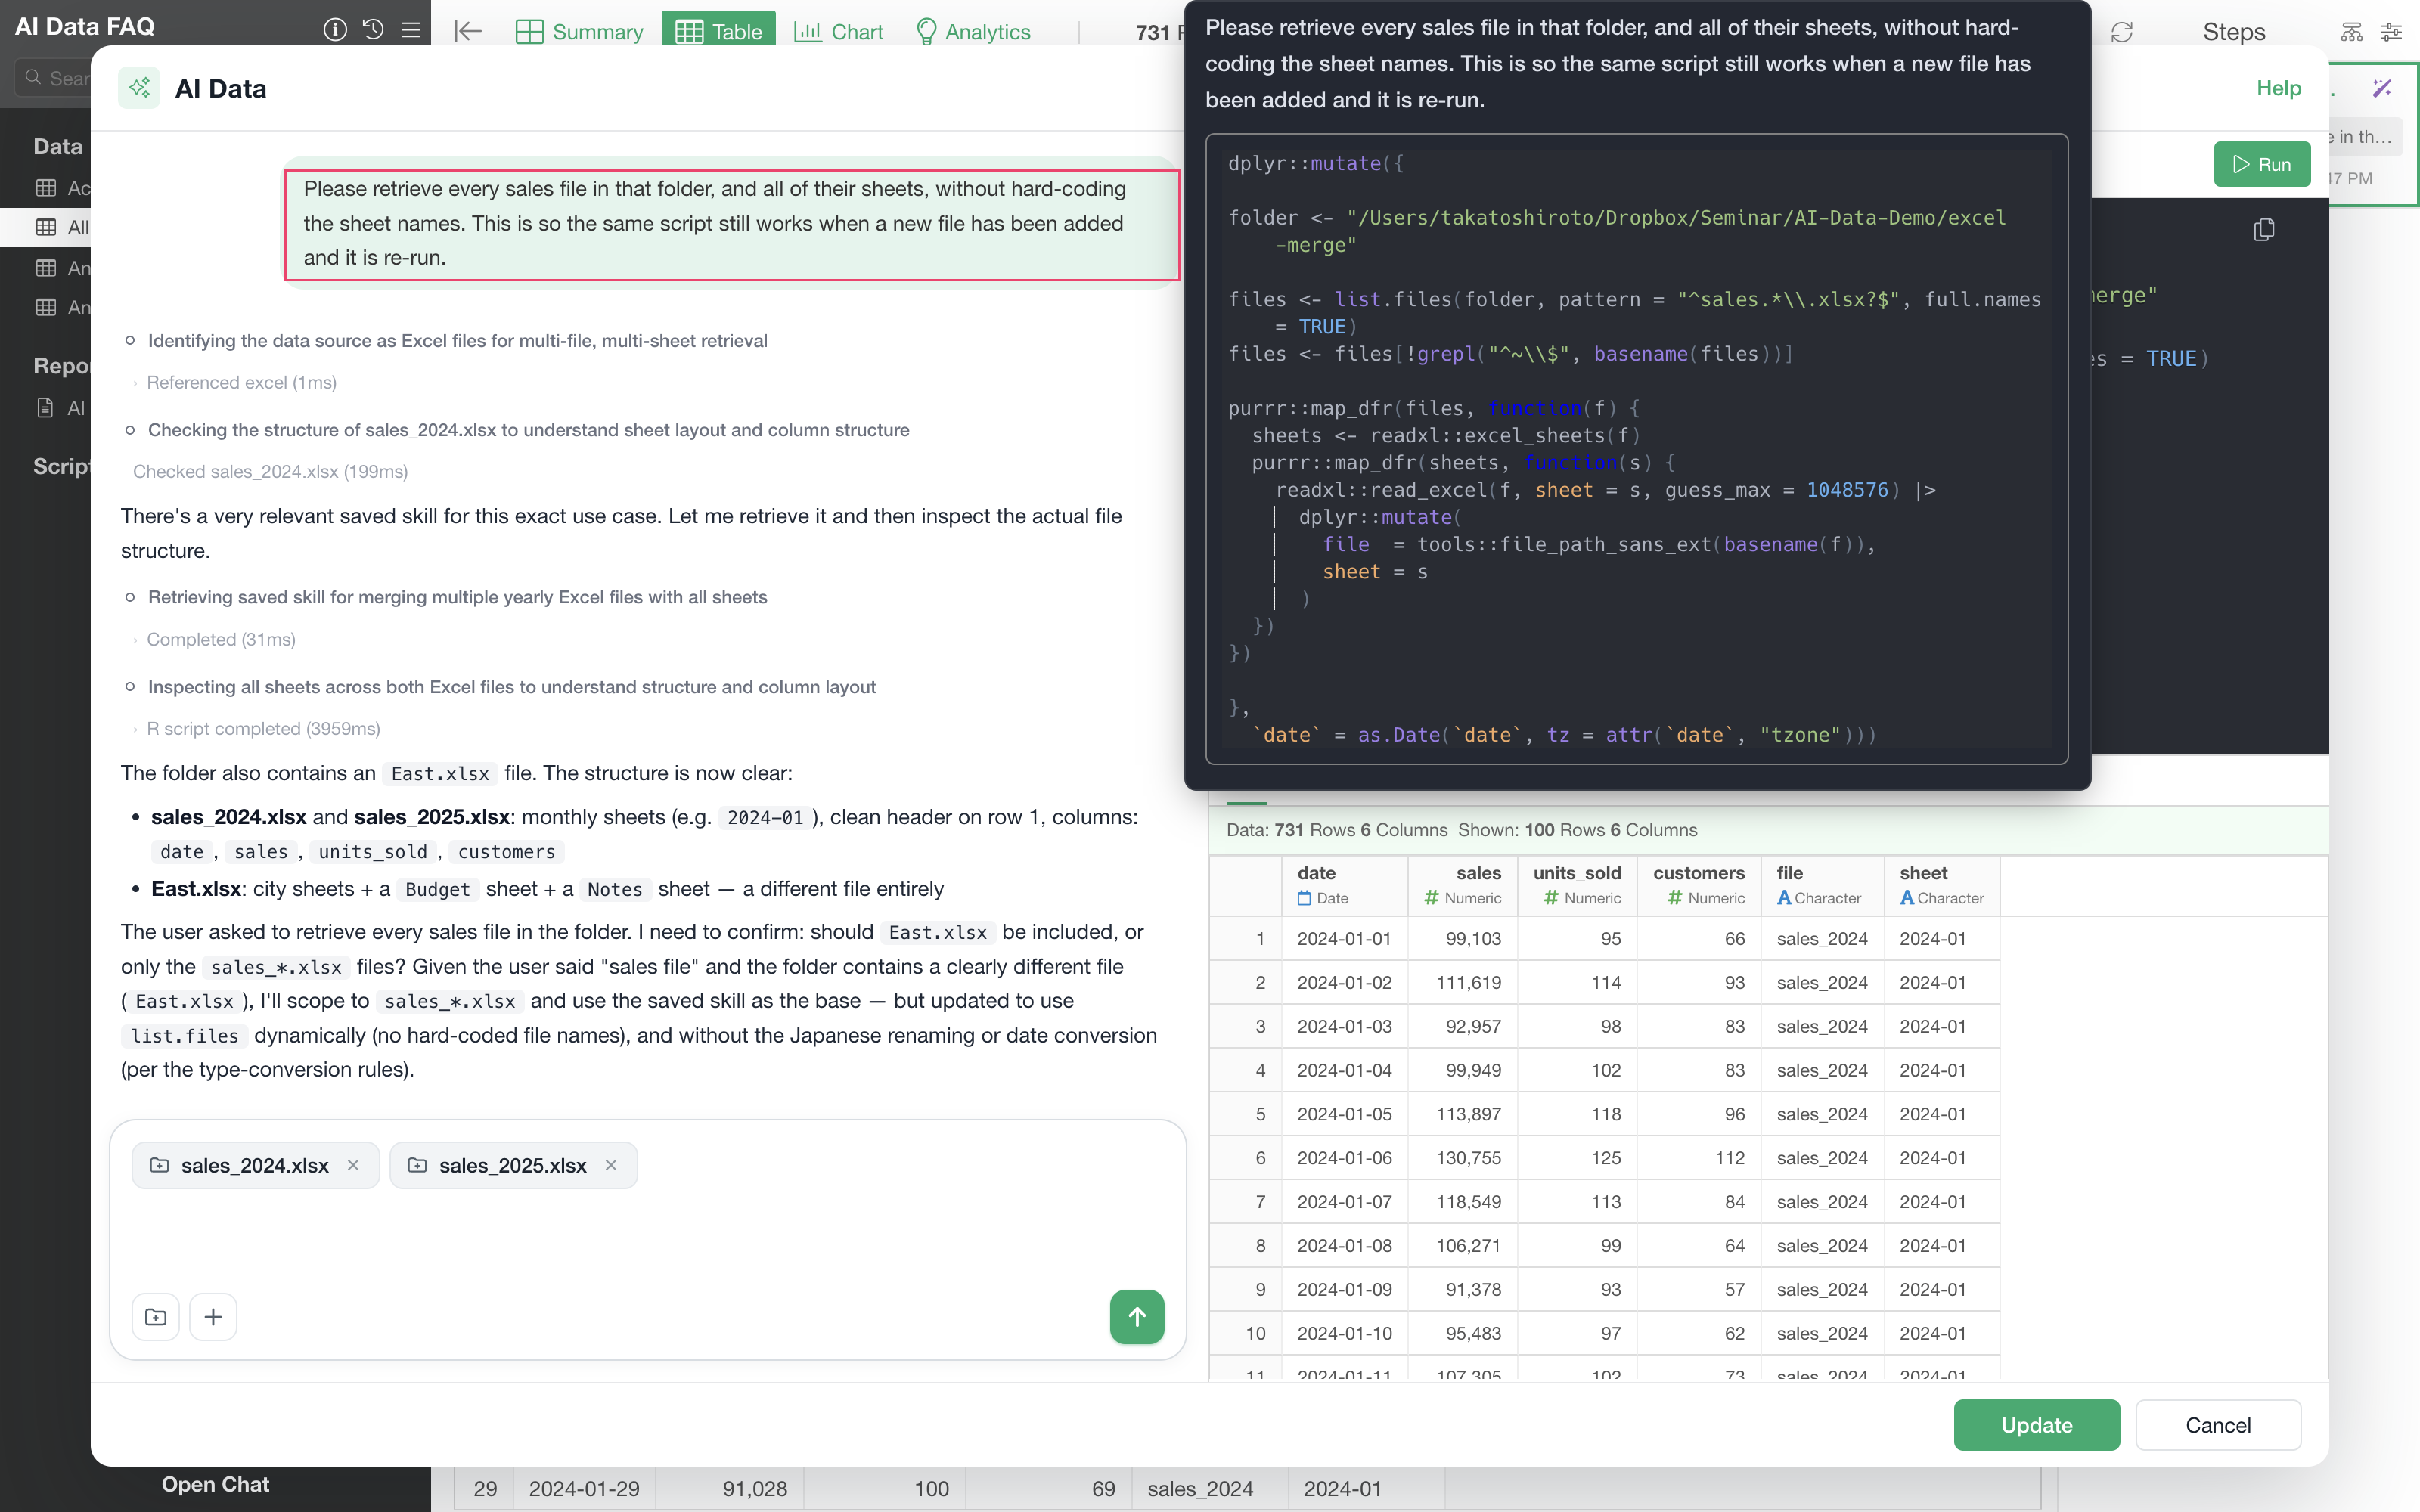
The script that comes back uses list.files() with a
pattern to find the files and readxl::excel_sheets() to
find the sheets, so neither a file name nor a sheet name is written into
it. The result is 731 rows by 6 columns, with a file and a
sheet column recording where each row came from.
This did not go through cleanly on the first pass. The same folder
also holds East.xlsx, which is not a sales workbook at all,
and AI Data stopped on that before writing anything: it noted that the
folder contained a clearly different file and worked out whether “every
sales file” was meant to include it, then said which way it had decided
and why. That reasoning is visible in the screen above. Naming the
files, rather than just saying “that folder”, is what avoids the
question.
The two sales workbooks used here hold 12 monthly sheets each, 24 sheets in total. Combining them by hand means 24 rounds of opening a sheet, copying, and pasting, plus filling in the year and month for every block, and the whole cycle repeats the next time a workbook is added. After this change, adding a file is enough for it to be included, and the update is just Re-import.
Can I give additional instructions after the data has been imported?
Yes. Imported data behaves like any other data frame in Exploratory. Even after it has been brought in, you can carry on adjusting it, changing conditions or removing rows you do not need.
To do this, open AI Data again from the gray instruction box on the source step, which is the first step.
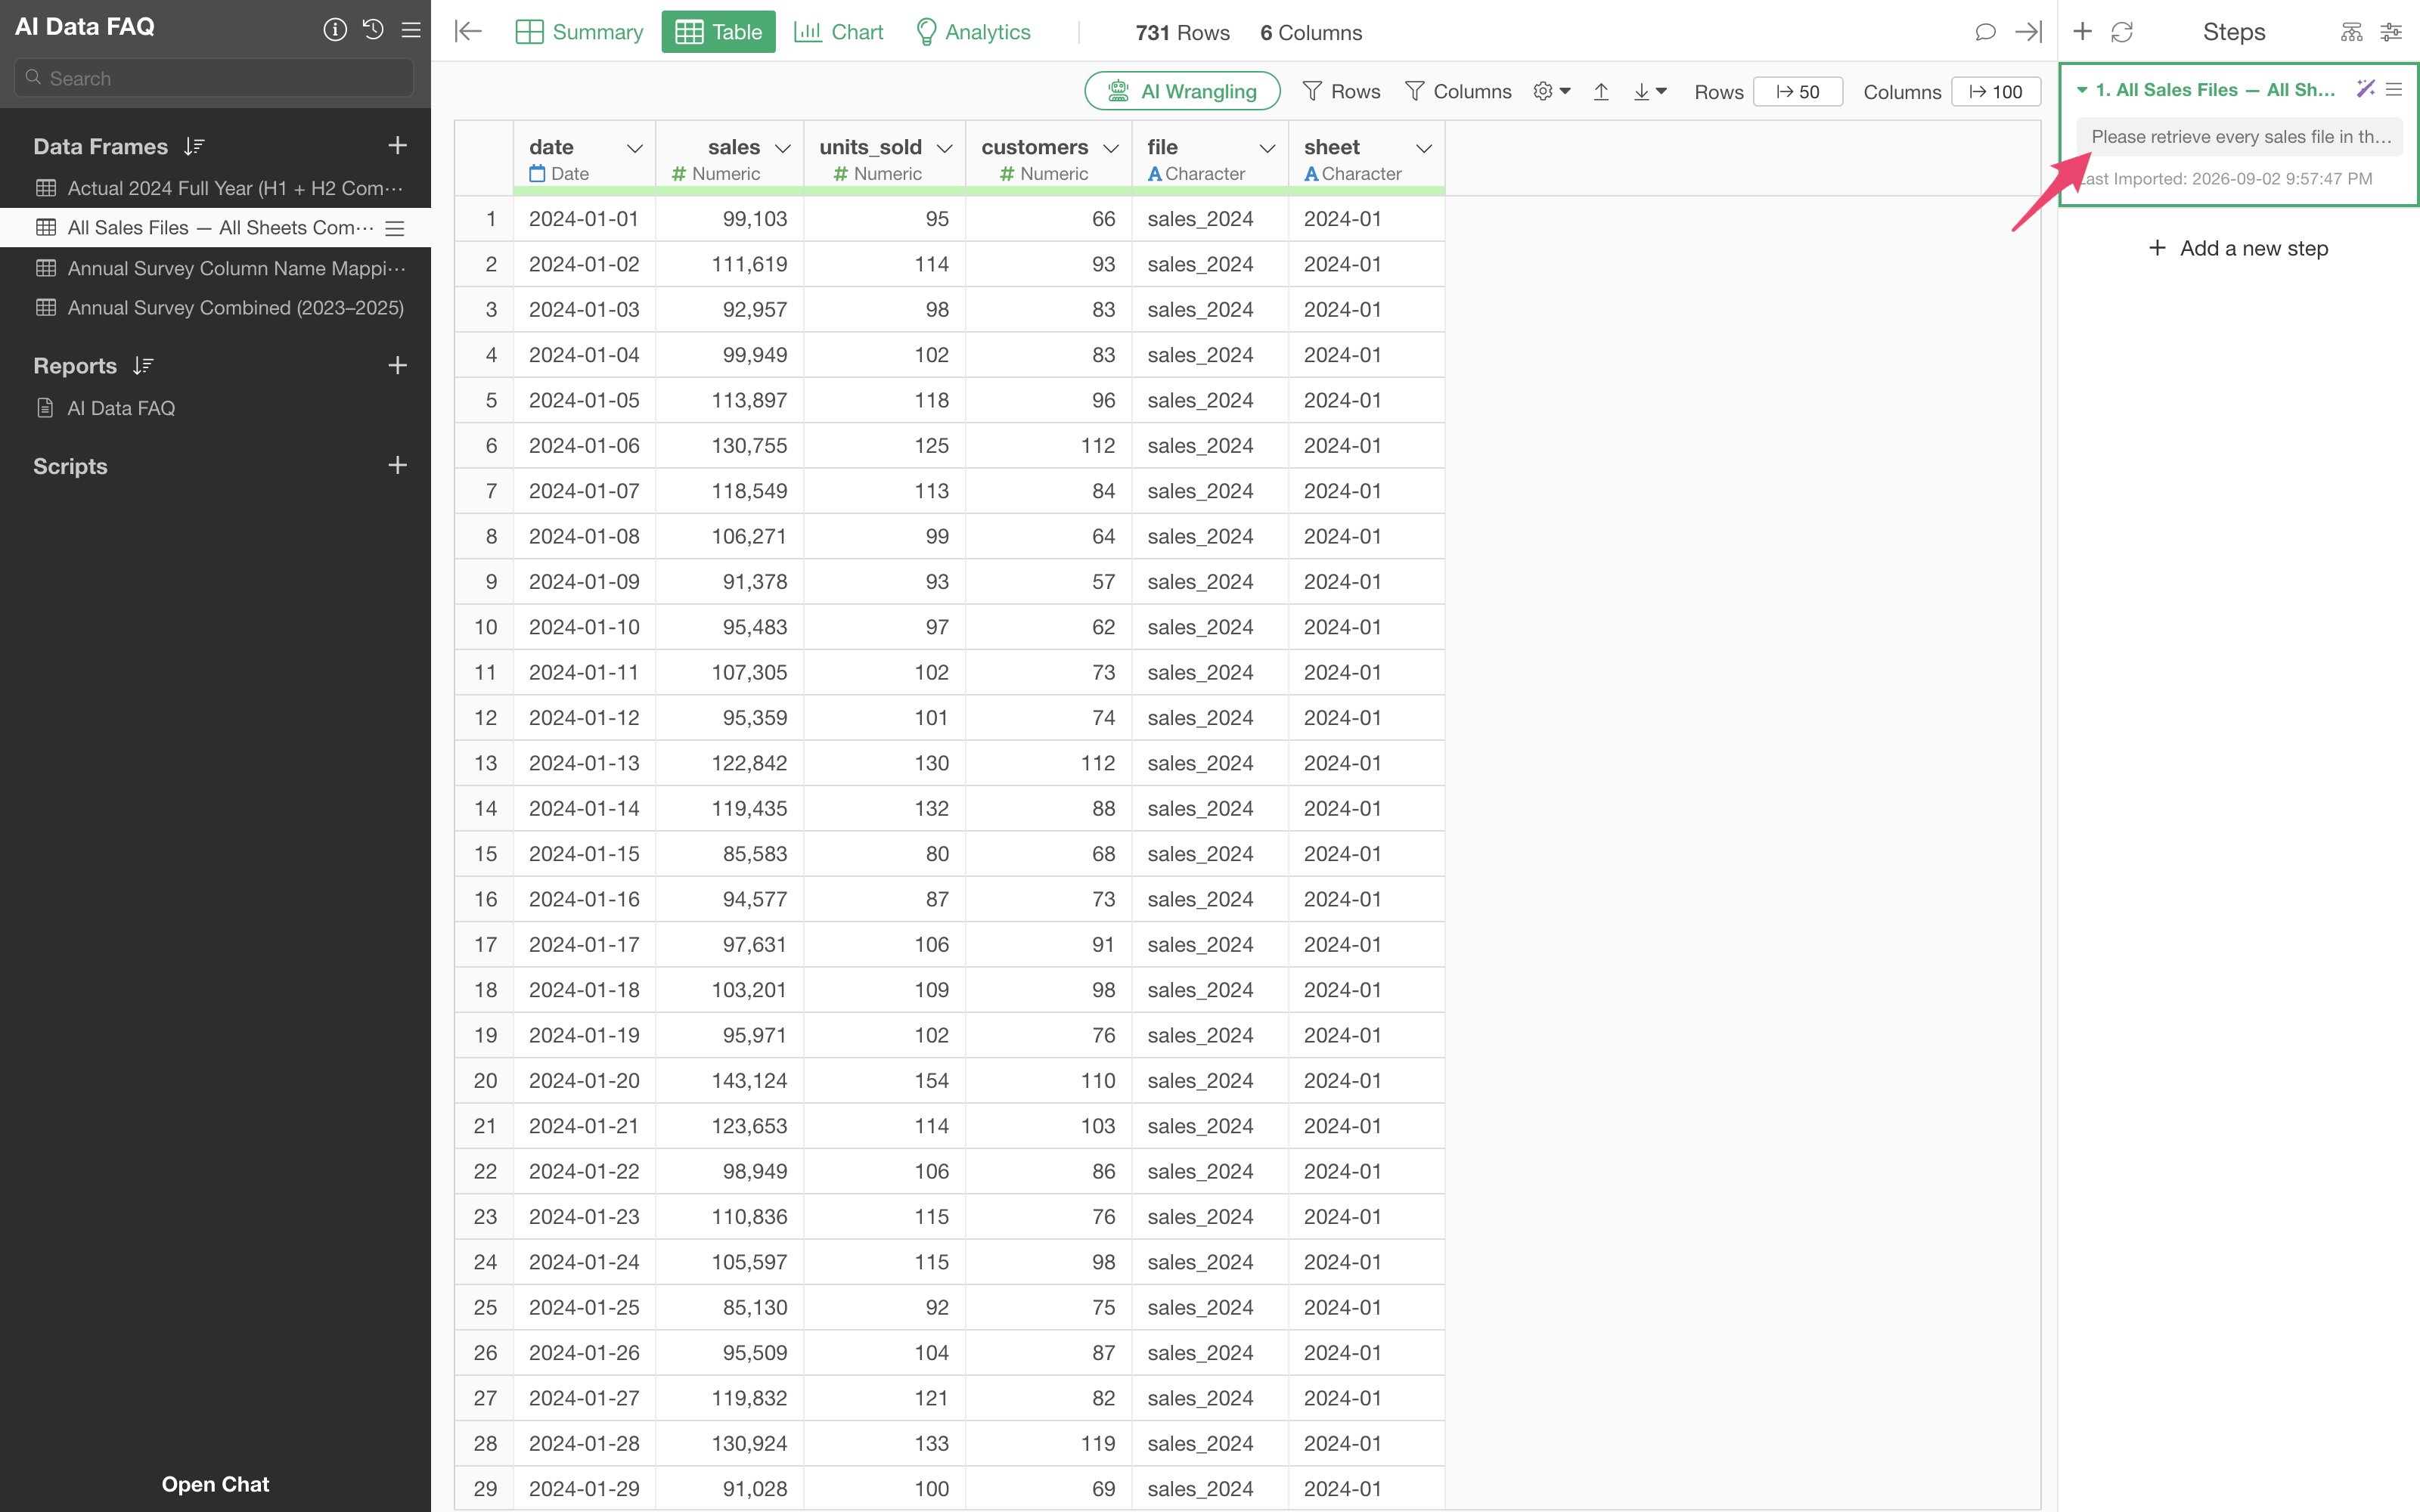
The conversation from the import is still there, so entering an additional instruction and sending it applies only the change you asked for, on top of what came before. There is no need to start the instructions over.
Do I have to give the same kind of instruction again every time?
No. When a data frame is created or updated, the procedure used at that moment is saved automatically as a skill. The next time you select data with a similar structure, that saved procedure is used as the basis, and differences such as column names are adjusted as the same processing is applied.
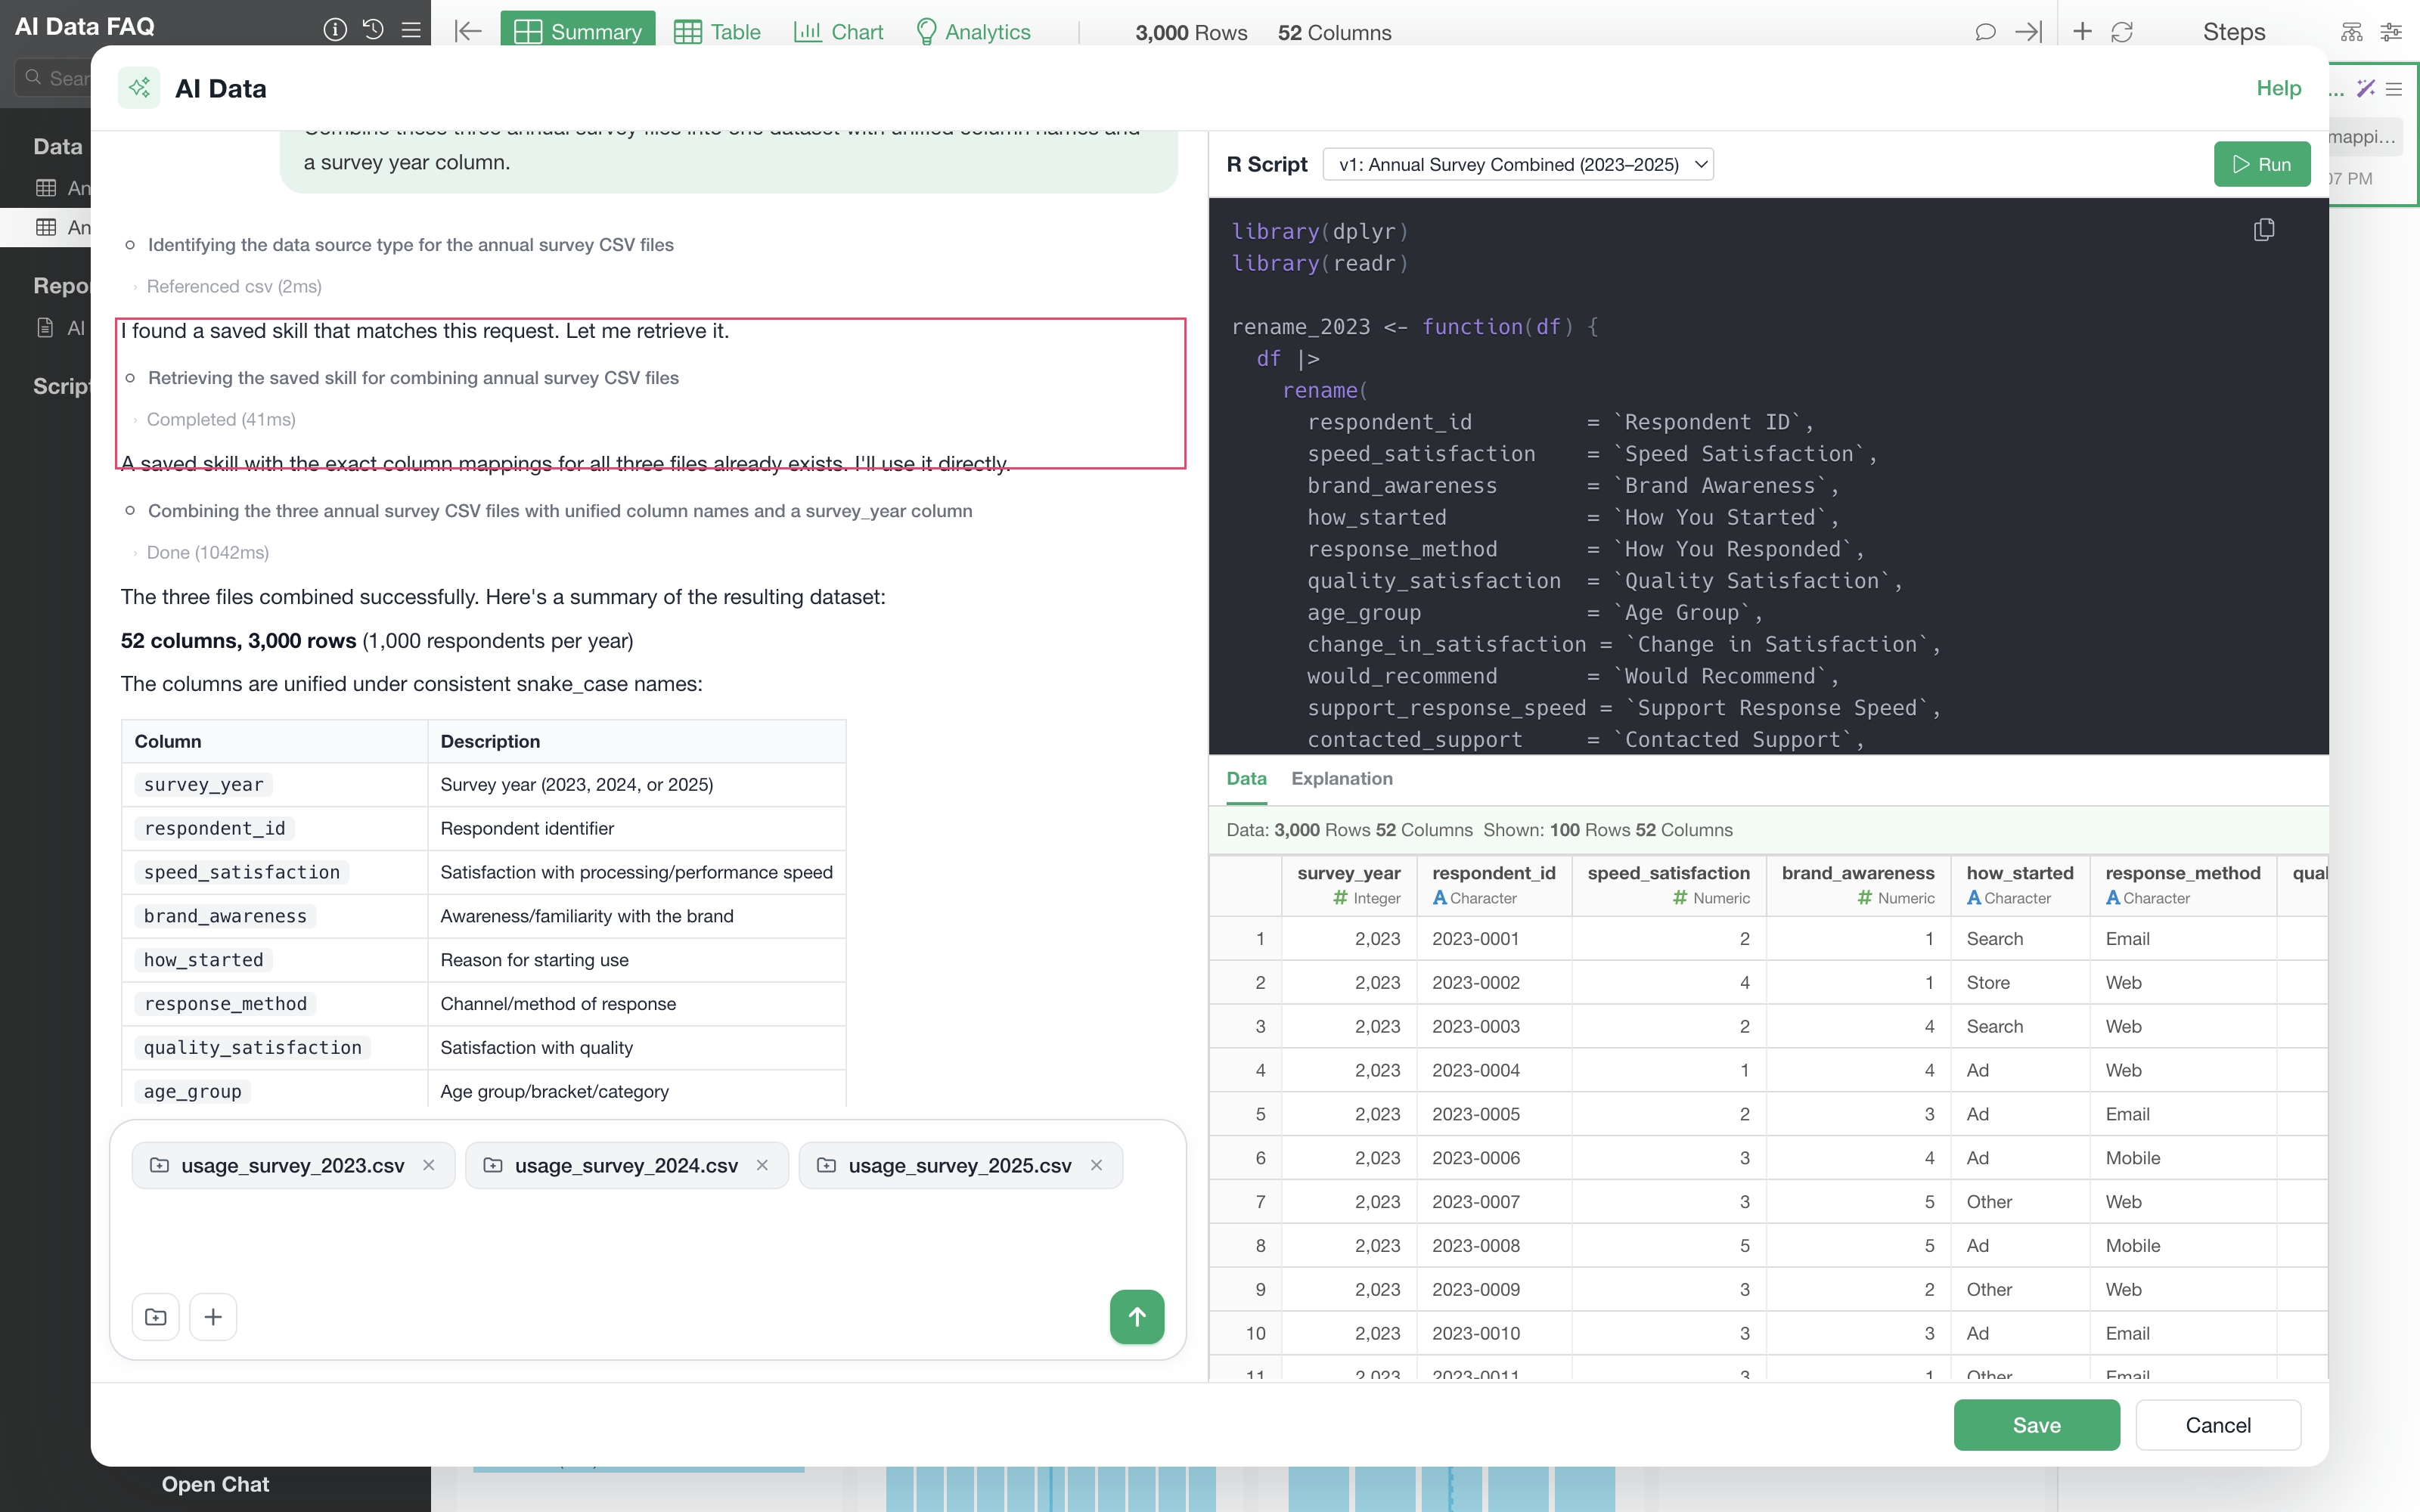
Asking for the same three survey files again in a fresh chat, AI Data replies that it found a saved skill matching the request, retrieves it, and applies it directly. The result is the same 3,000 rows by 52 columns, and it gets there without investigating the column structure again.
A skill is a Markdown file recording what R script to write for what
kind of request. Skills are saved under the ai_skills
folder, in the data_source path, inside the
.exploratory repository, so you can read them afterwards
and confirm that nothing unintended has been saved.
When the Result Is Not What You Expected
Instructions to gather material from the web take a long time
When the location and the format of the published material differ from one target to the next, AI Data works through them one at a time, which can take several rounds of conversation.
Including the following in your first instruction gets you to the data faster.
- The formal name of the material, in the form a search would find.
- The scope, specific about the region, the year, and the organization.
- The columns of the table that are wanted, such as the school name, the capacity, and the enrollment.
The simplest way to try this on your own data is with a single Excel file. Dropping one workbook onto the AI Data screen and describing what you want out of it is enough to see how the structure is read and what script is produced.