Add Total Row & Column to the Data itself with 'adorn_totals' function
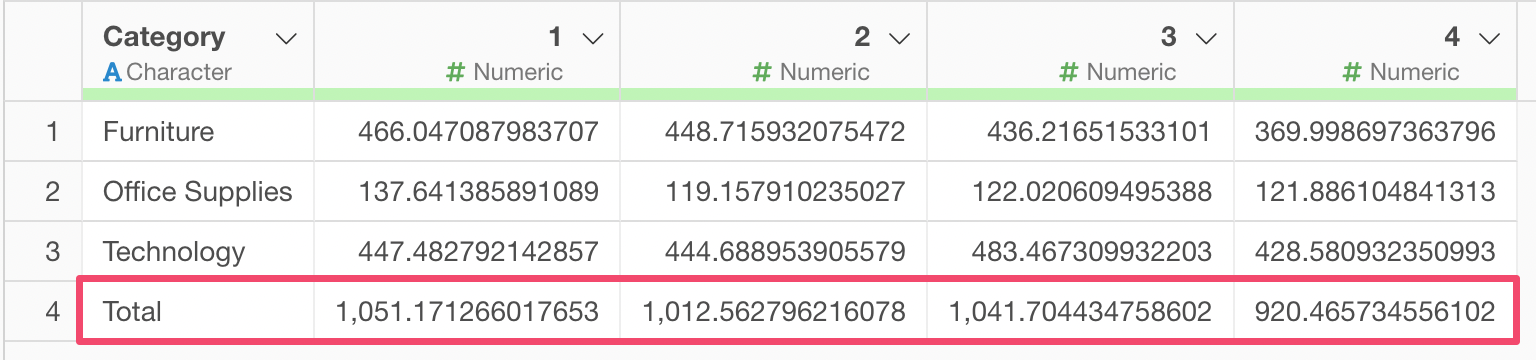
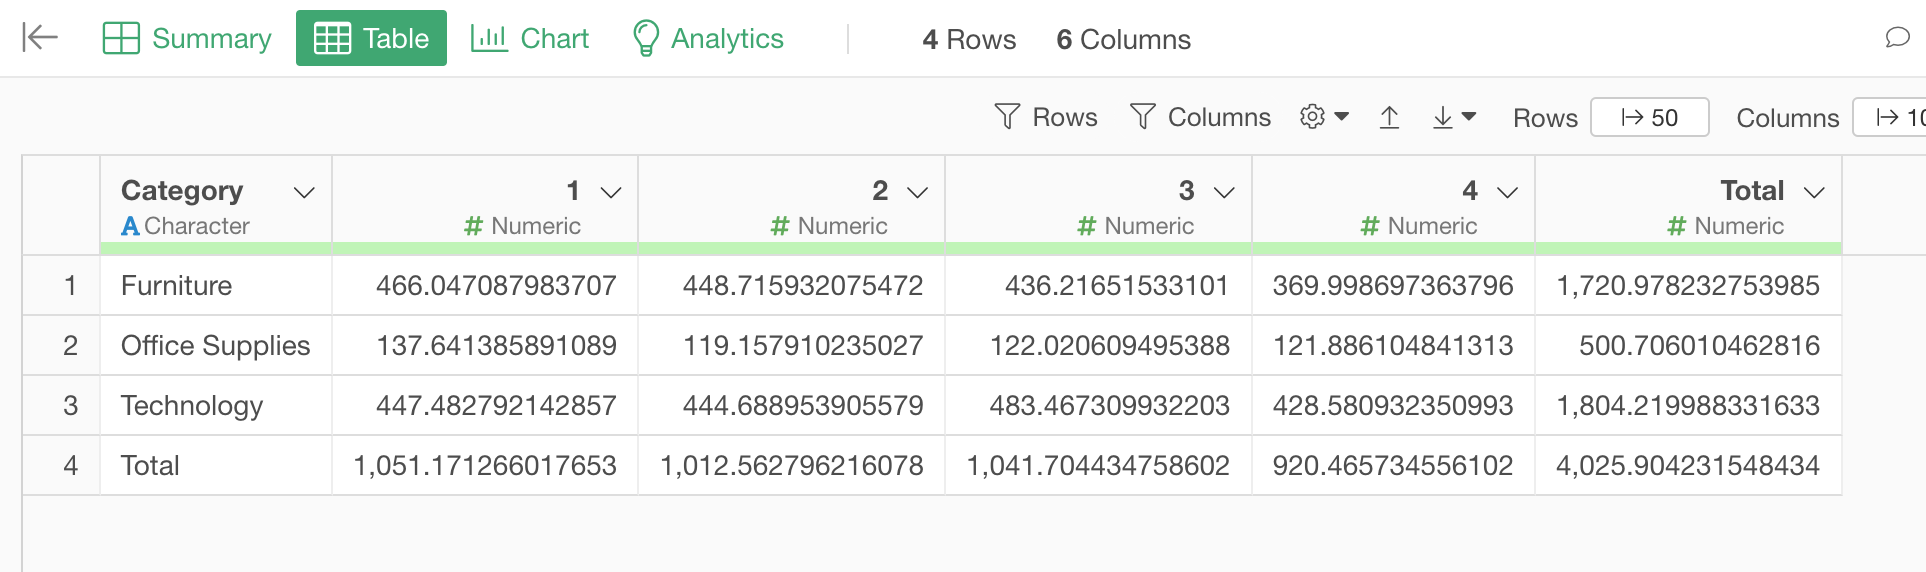
Let's say you have a data like below.
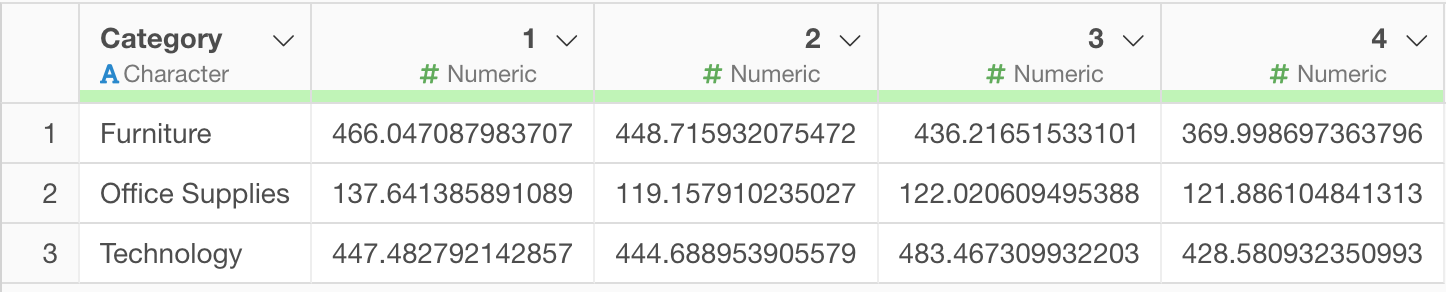
The first column is Product Category, and the rest of the columns represent months starting from 1 (January) through 4 (April)
And now, you want to add a total row as the 4th row or add a total column as the 6th column as part of the data itself.
Although you can do such by using Pivot Table under the Chart view quickly, sometimes you might want to add such total row or column as part of the data itself so that you can publish or share the data with the total information.
The good new is, you can do this by using a R command in Exploratory.
Here's how!
Add Total as Row and/or Column with Data Wrangling Step
There is a function called 'adorn_total' from the 'janitor' R package, which does exactly that. And you can call it inside Exploratory easily.
You can check how you can use the function in their reference doc. But it's pretty straightforward.
And since the 'janitor' package is pre-installed inside Exploratory, you can use it with the 'Custom R Command' step right away. You don't need to install it!
1. Add a Total Row with 'Custom R Command' Step
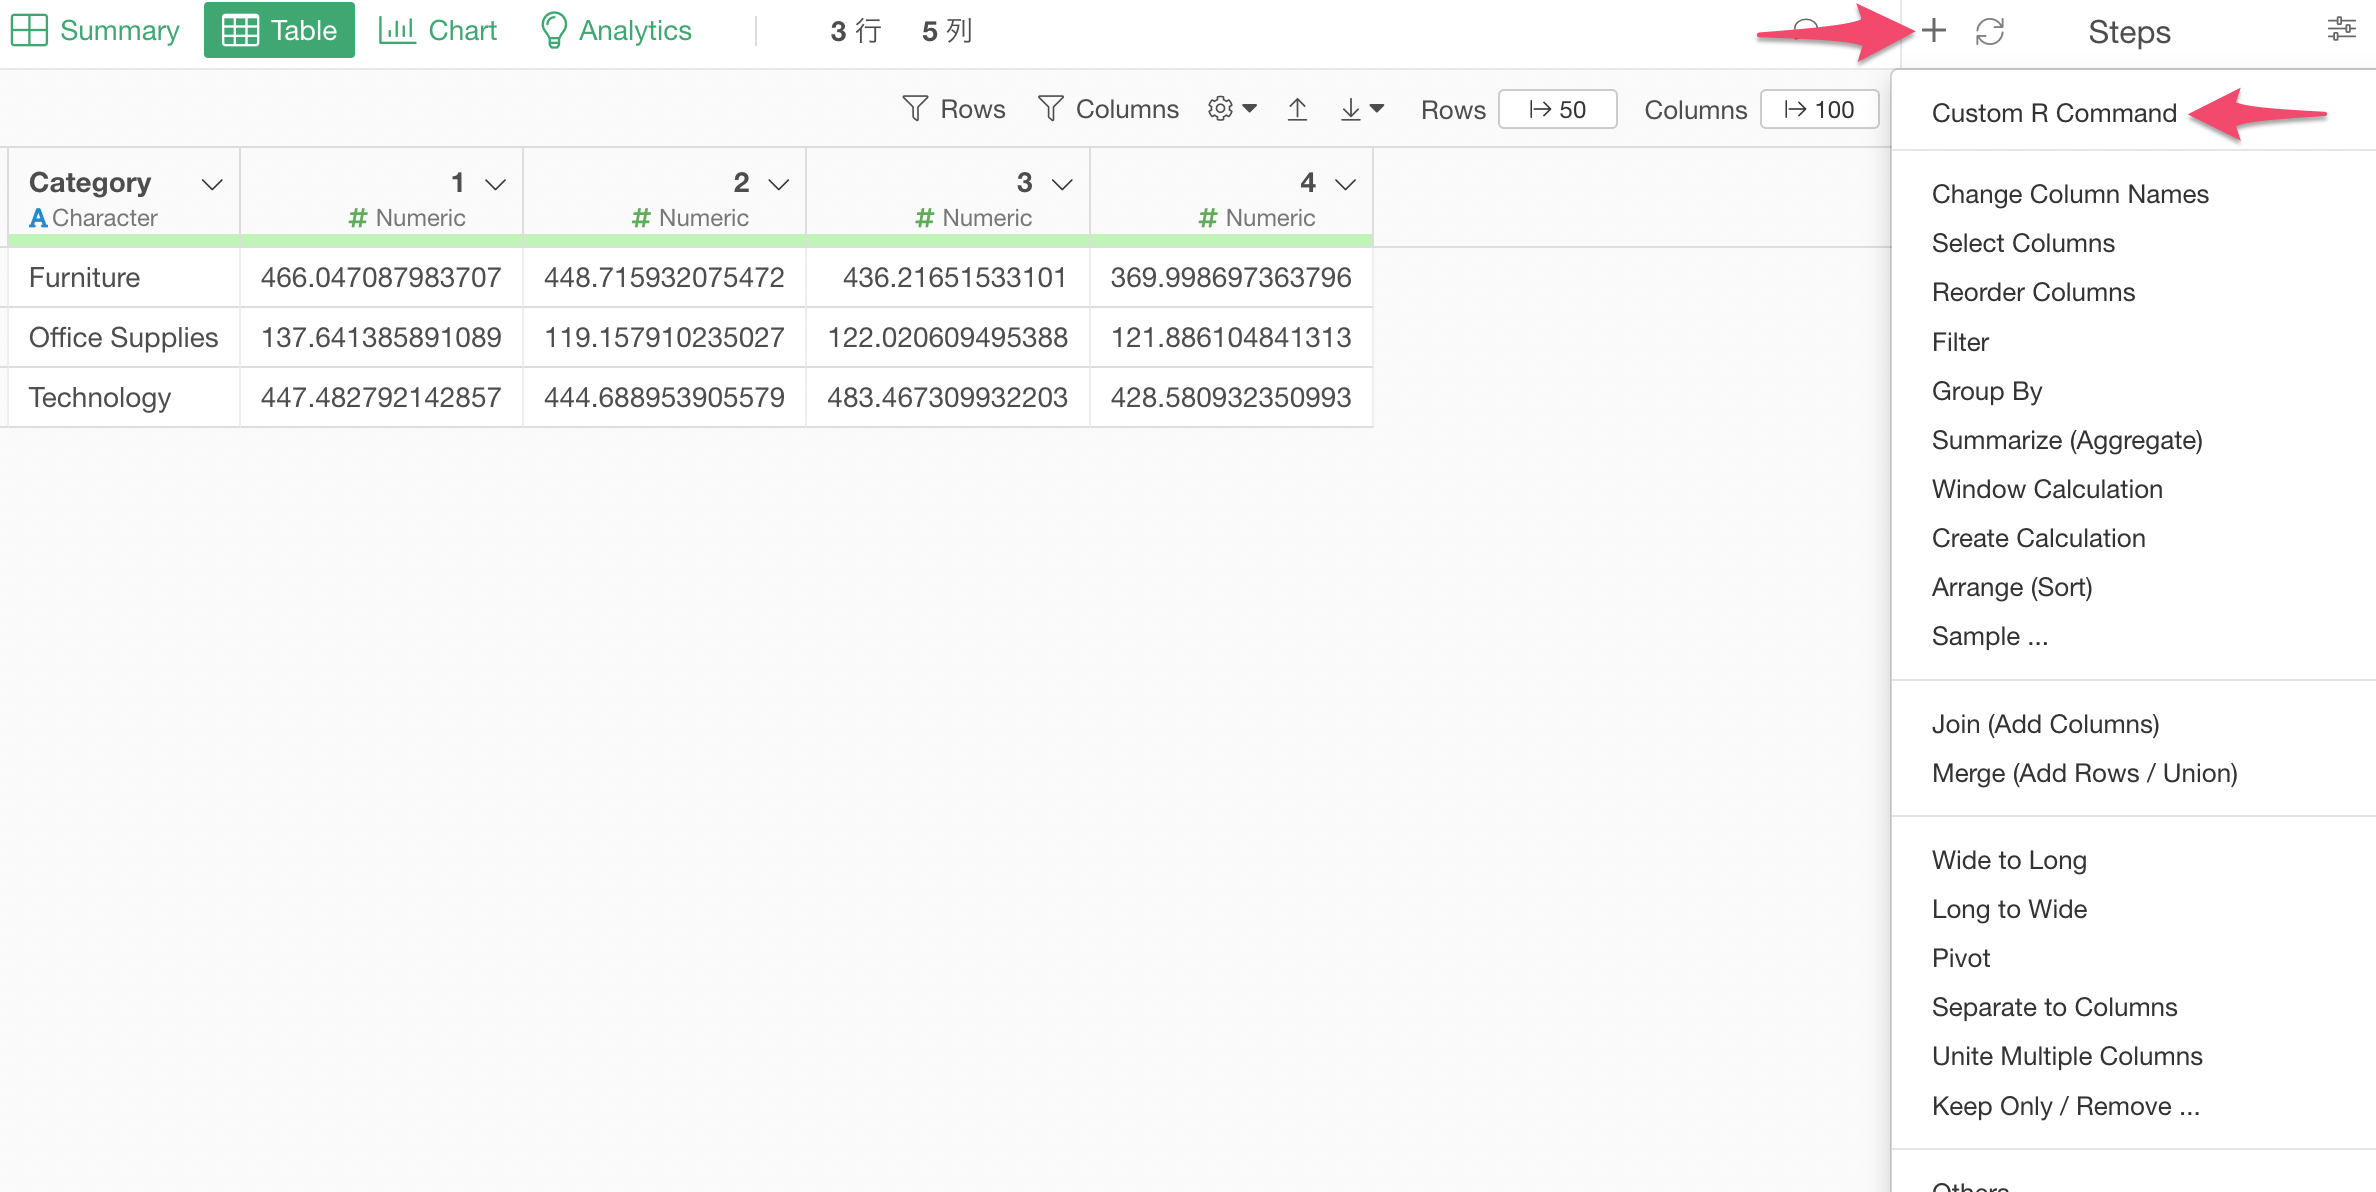
Select 'Custom R Command' from the Step menu.
Simply, type 'adorn_total' function.
adorn_totals()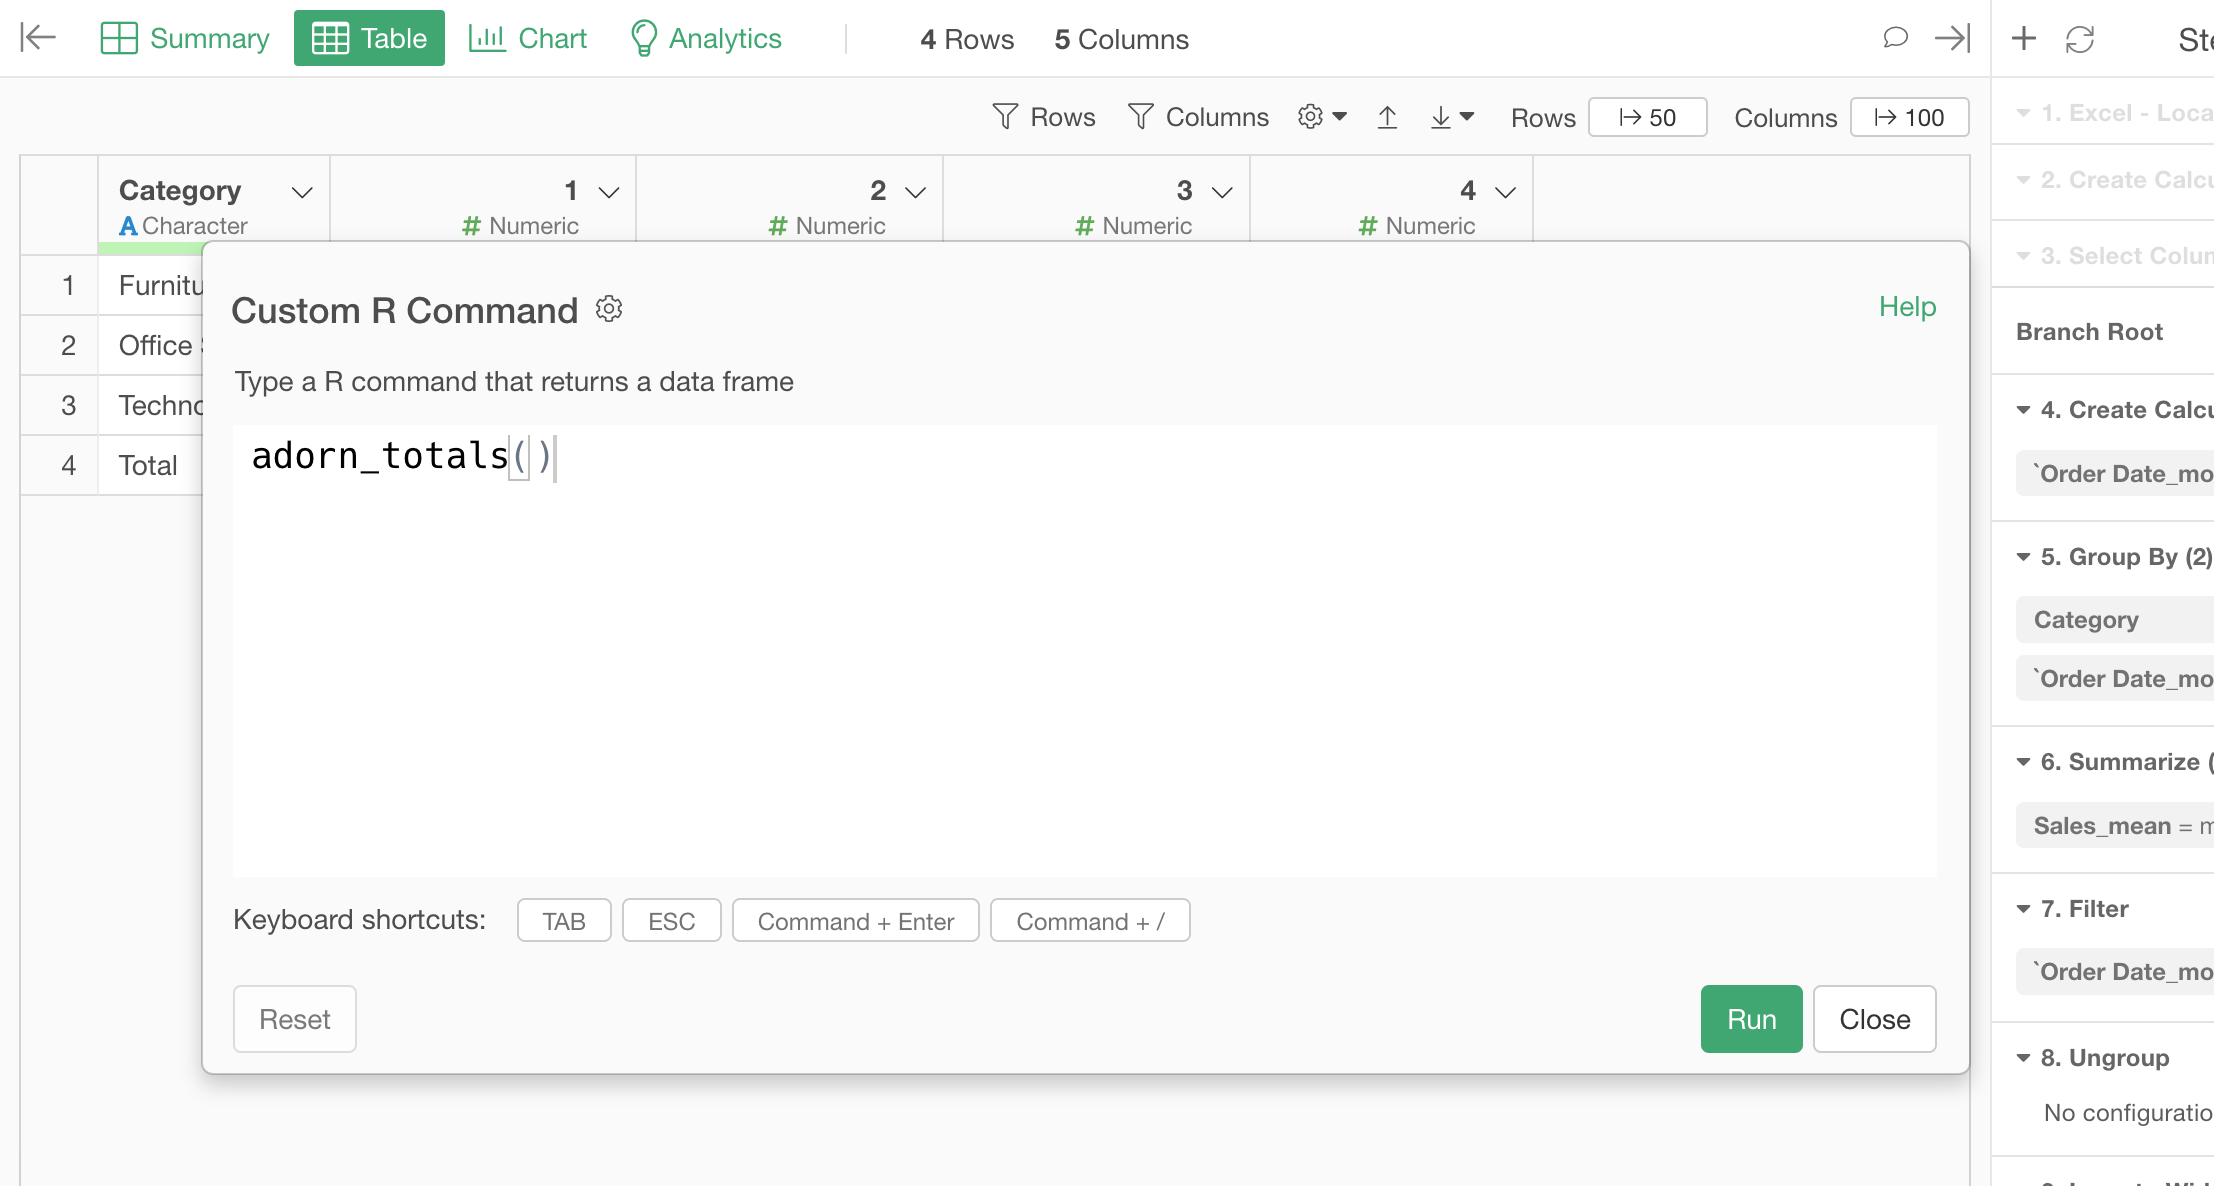
The default behavior this function is to calculate the total for each column and add the totals as a new row.
2. Add a Total Column with 'Custom R Command' Step
But what if we want to add a total column, not row?
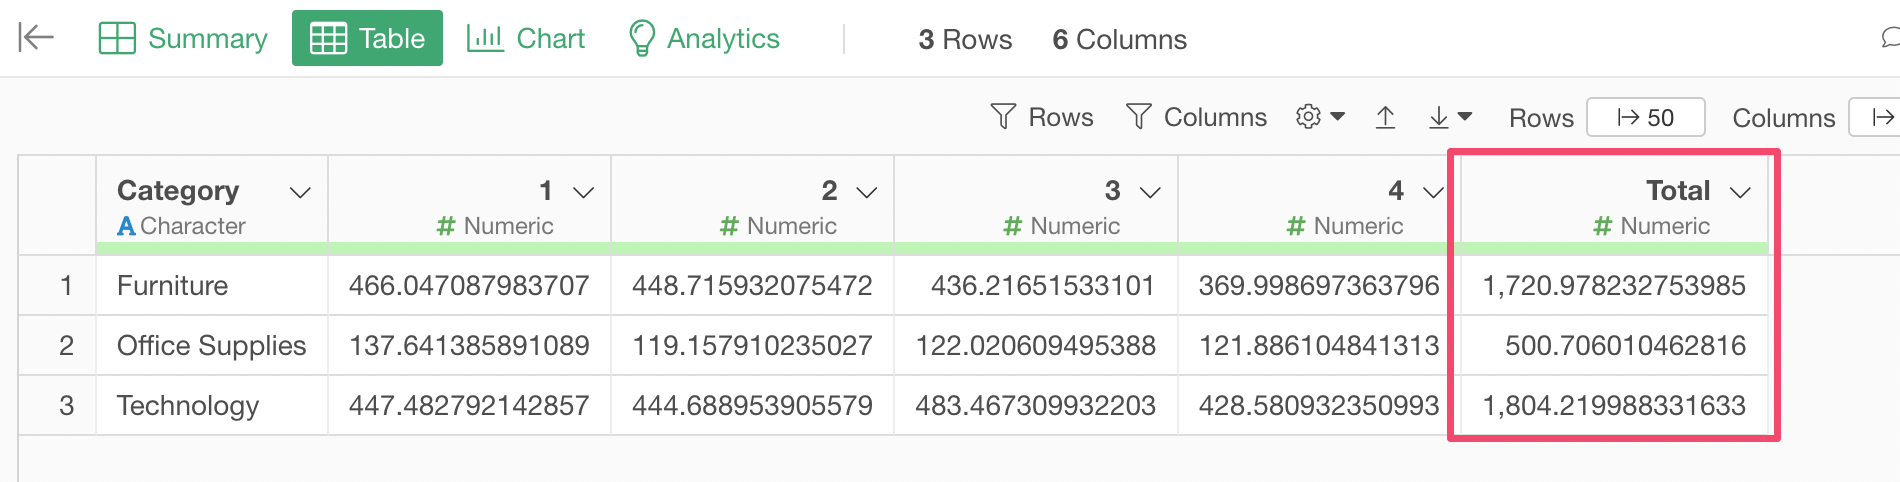
You can simply set 'col' with the 'where' argument inside the 'adorn_totals' function as follows.
adorn_totals(where="col")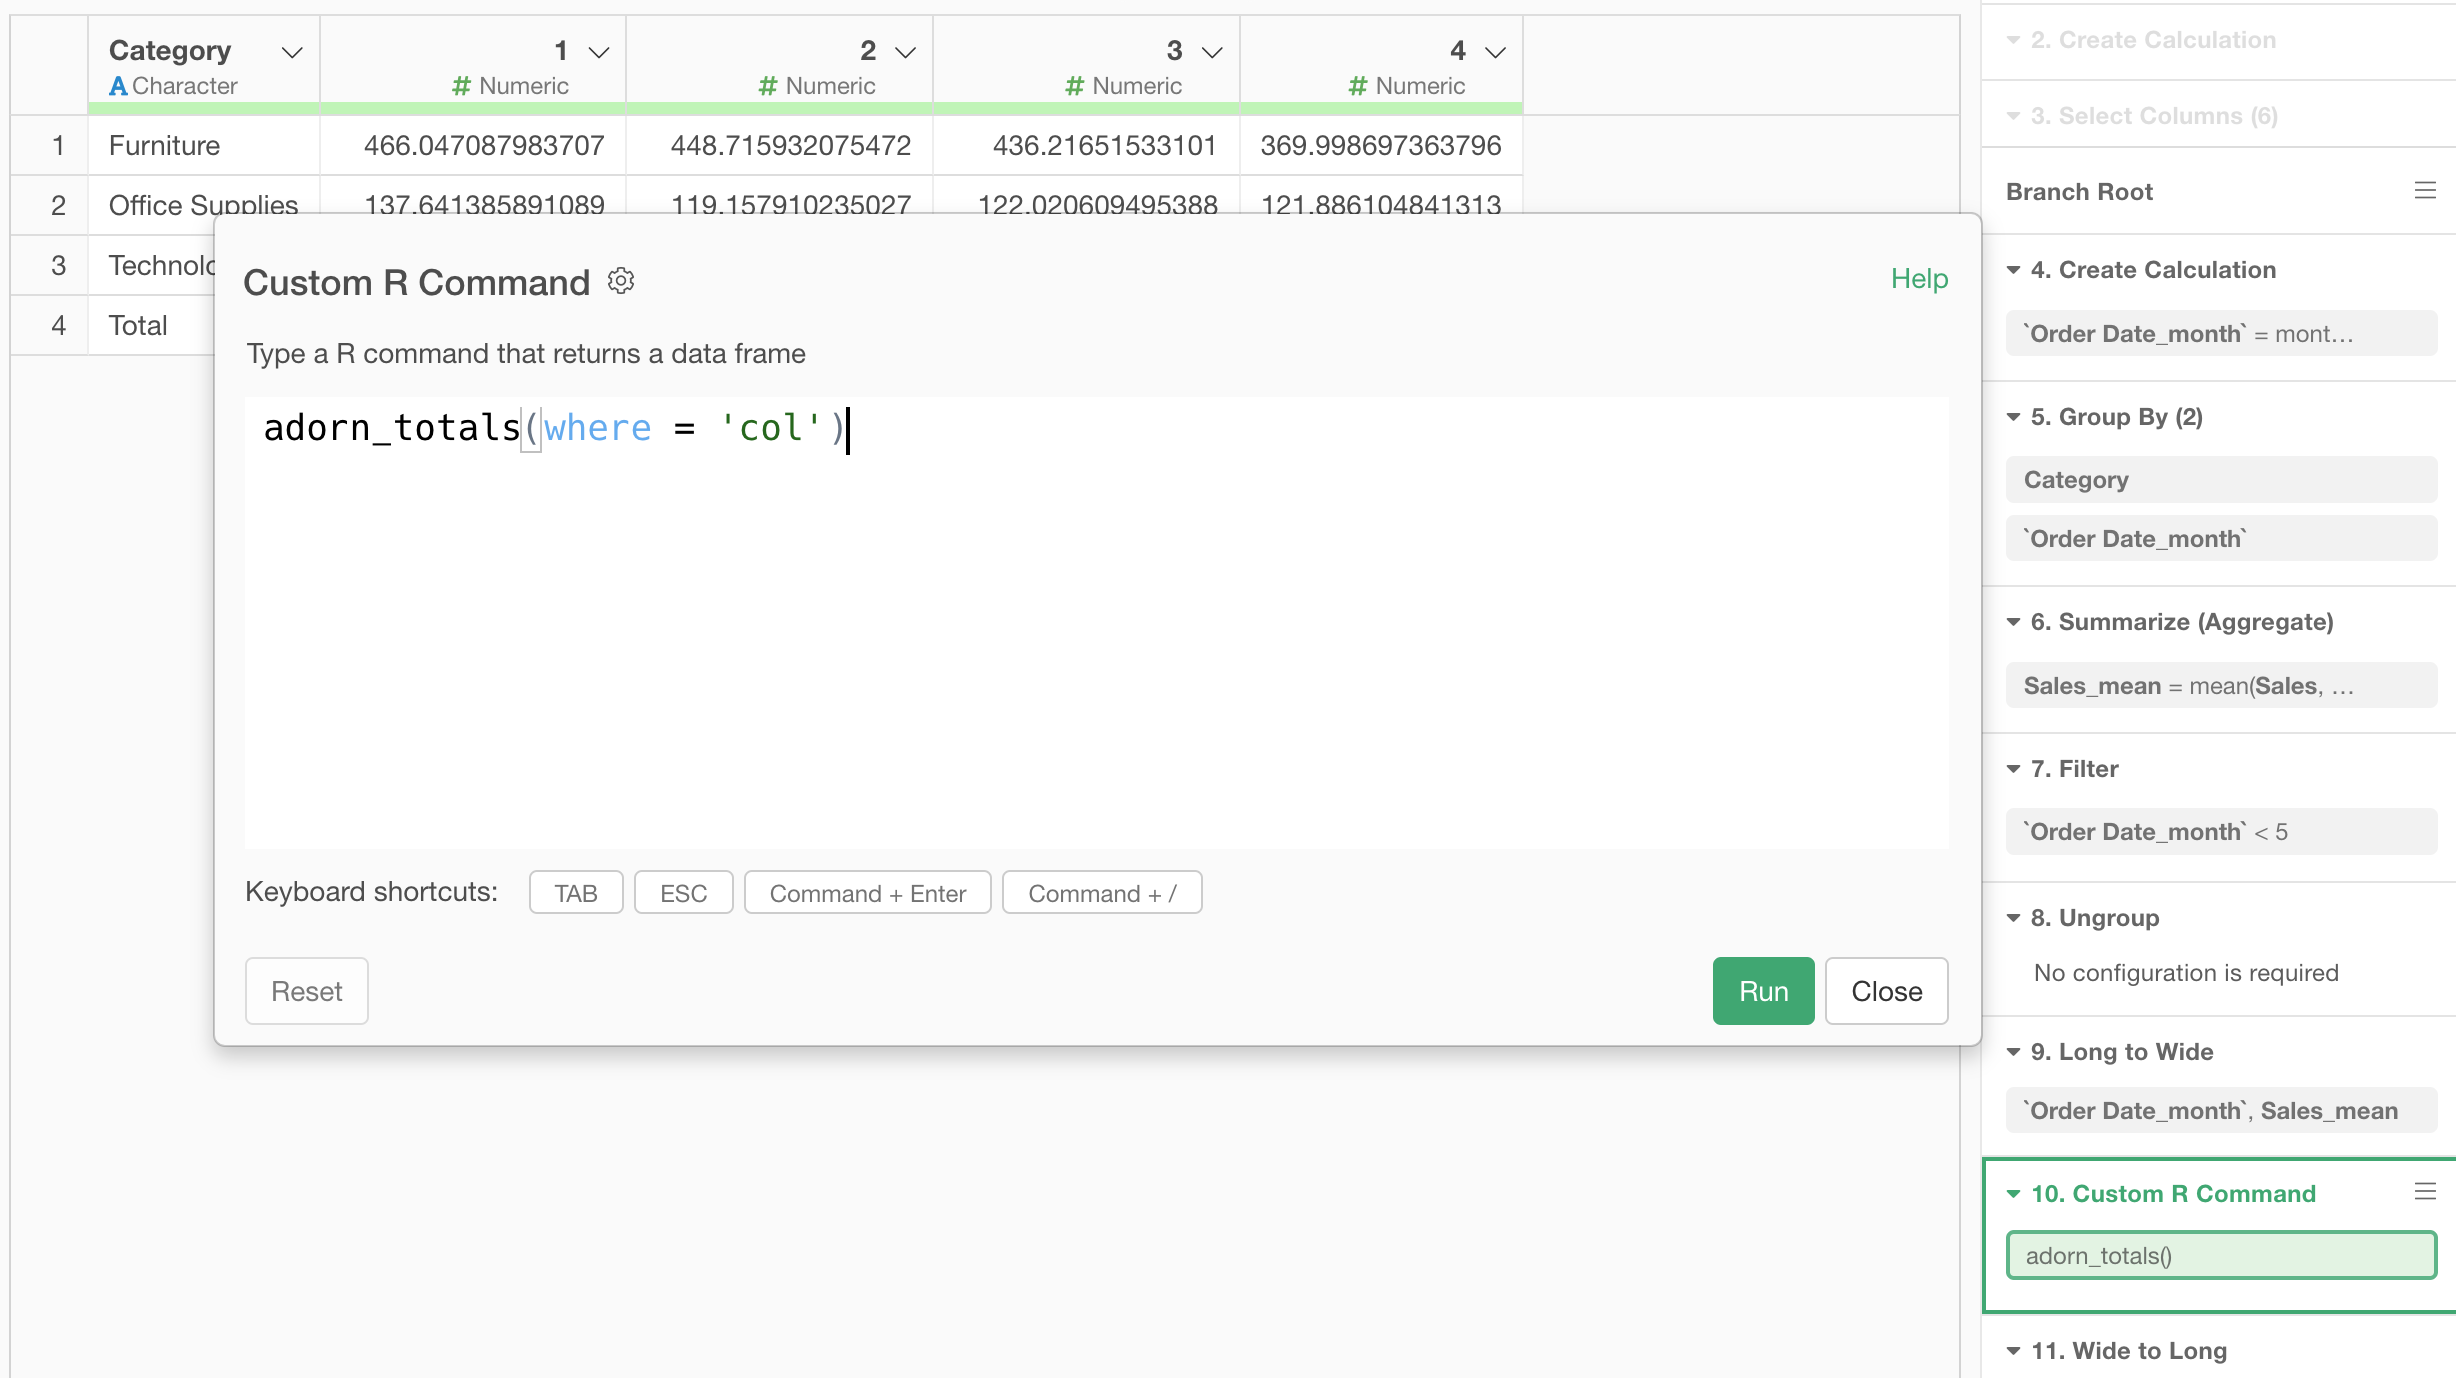
You will have the total column!
3. Both a Total Row AND a Total Column
Now you'd ask, what if we want to have both?
Well, you can!
You can set 'row' and 'col' inside the function as follows.
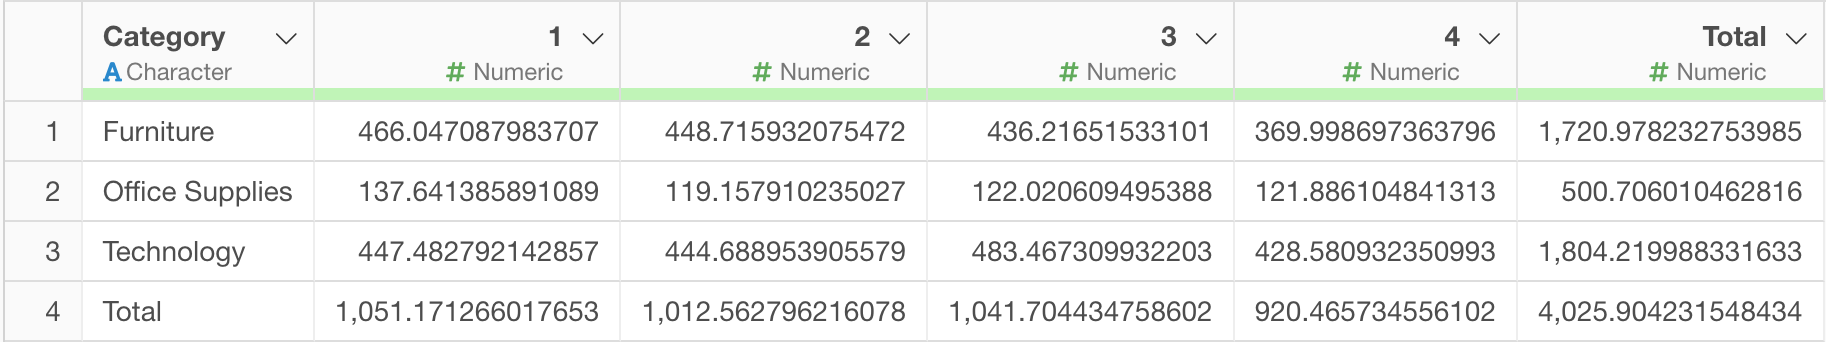
adorn_totals(where=c("row","col"))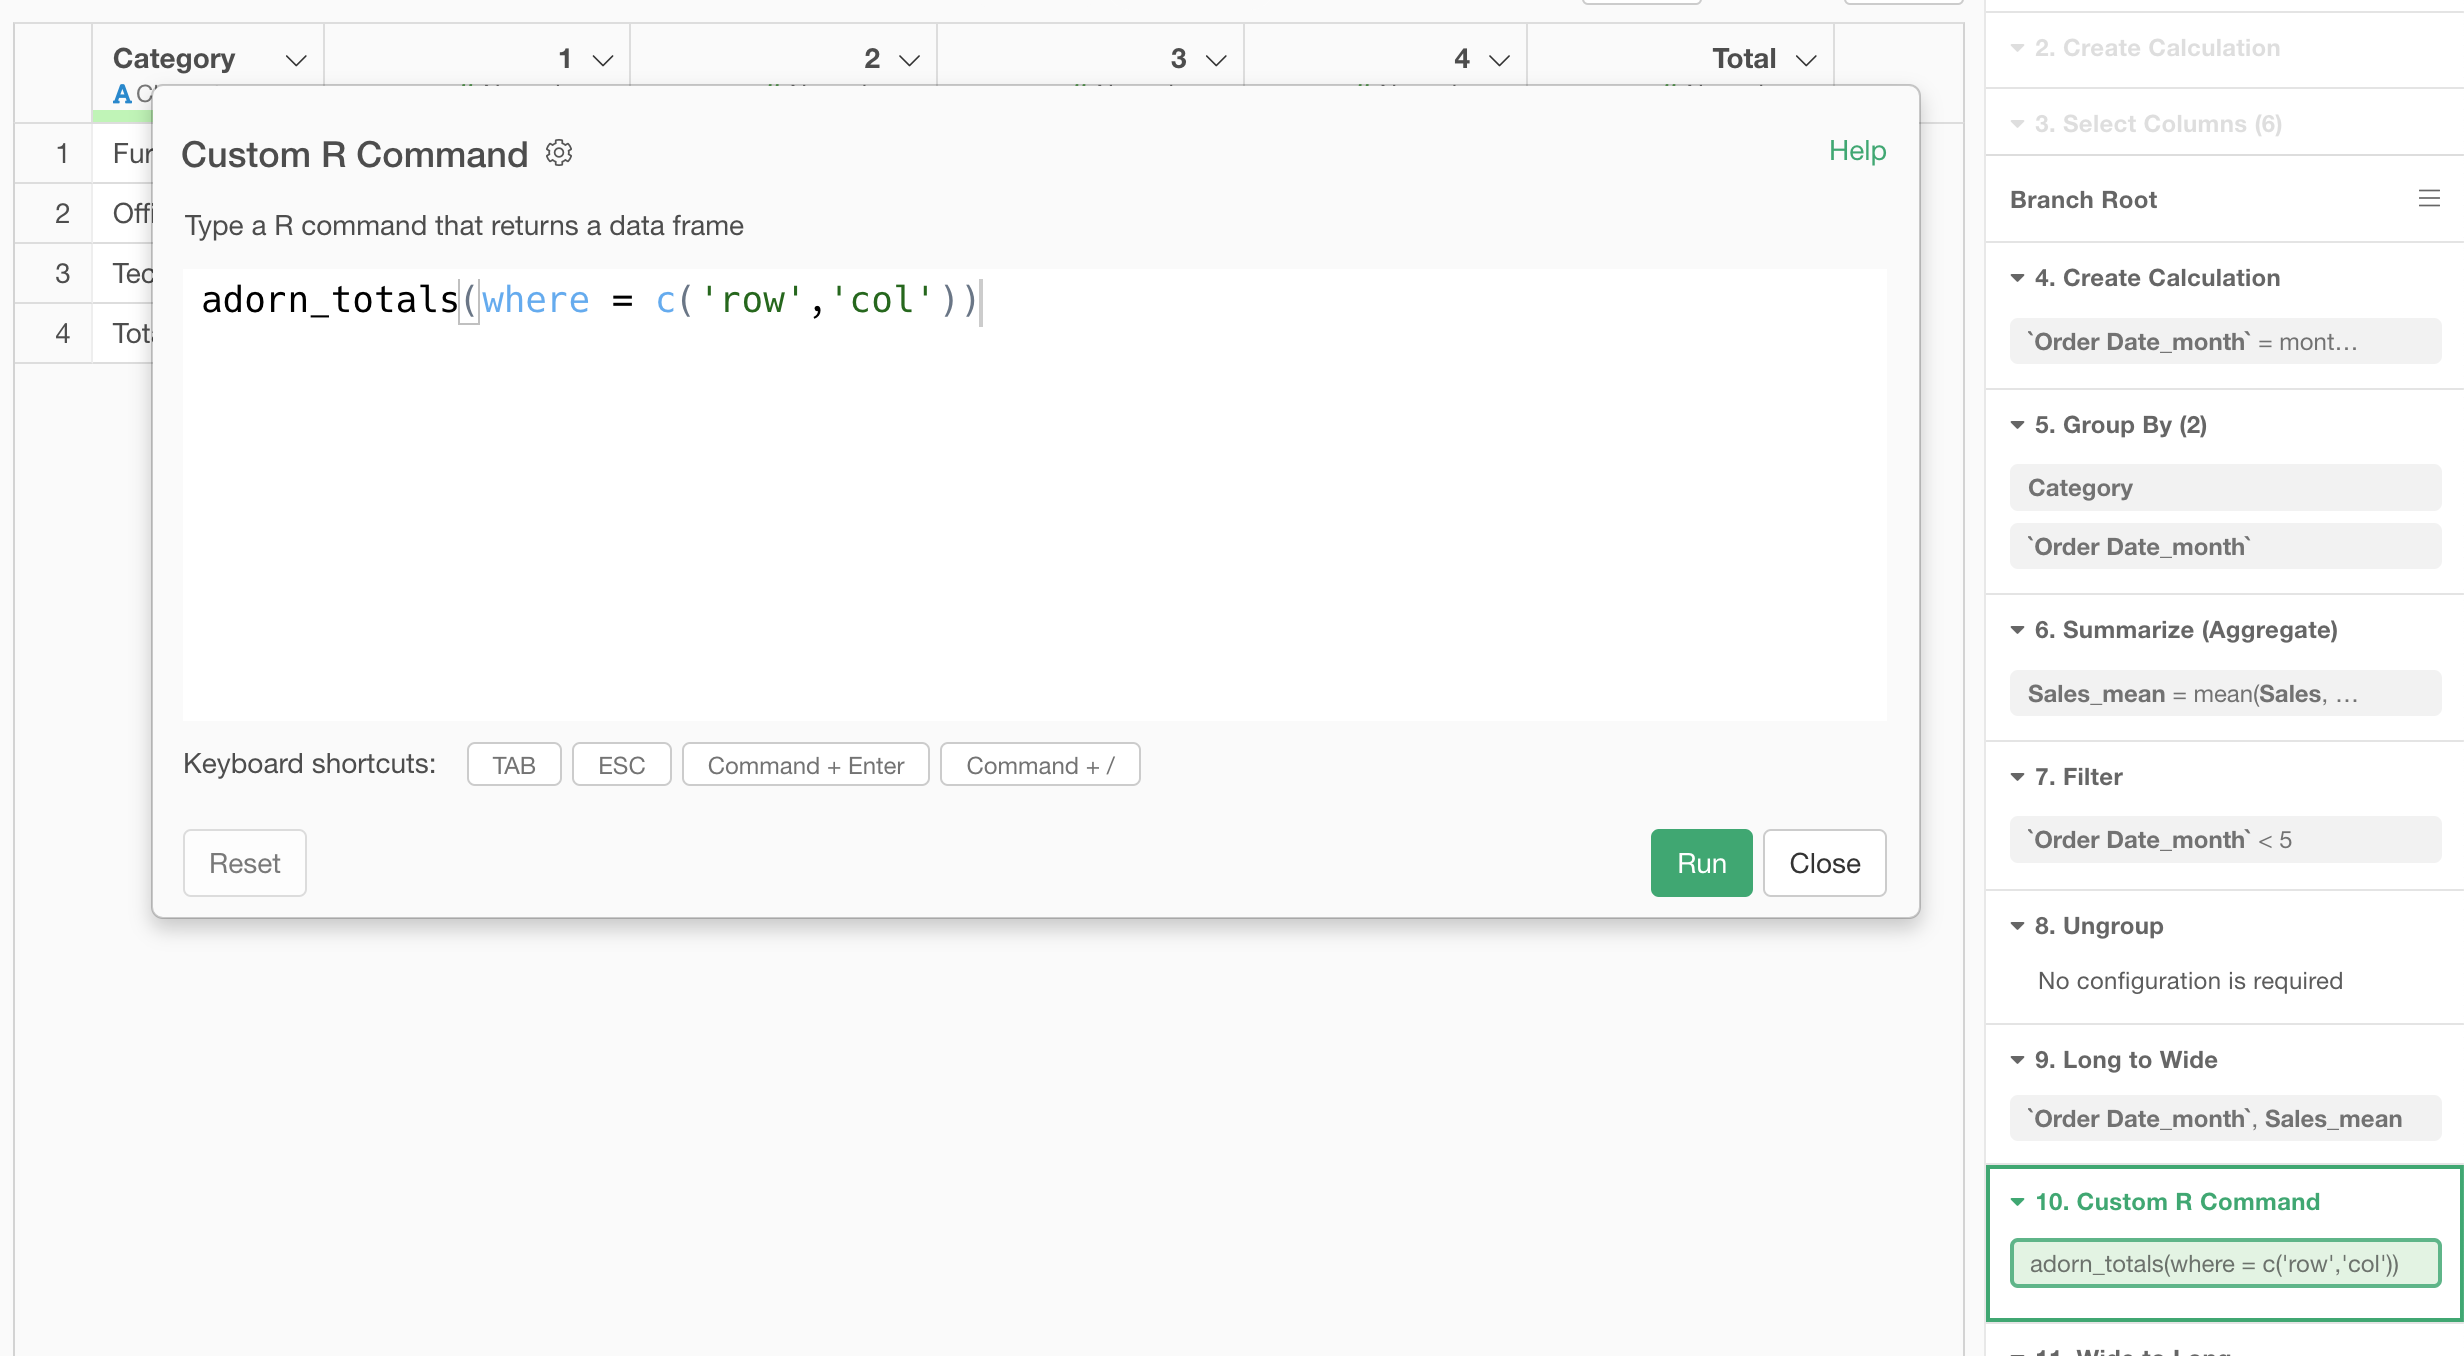
And here it is!
Appendix: Arguments for the 'adorn_total' Function
Here is a list of the arguments that are supported by 'adorn_total' function.
- where - one of "row", "col", or c("row", "col")
fill - if there are multiple non-numeric columns, what string should fill the bottom
row of those columns?na.rm - should missing values (including NaN) be omitted from the calculations?