
An Introduction to Bayesian A/B Testing in Exploratory
A/B Testing Framework that Business People Can Understand
I’m sure many of you have heard about A/B Testing. You create two groups — A and B — and measure the performance of each group and see which one has performed better.
Let’s say you deploy two versions of your web site landing pages to see which pages help more visitors sign up for your service.

And, your test result came back after a week or so and it looks like this.
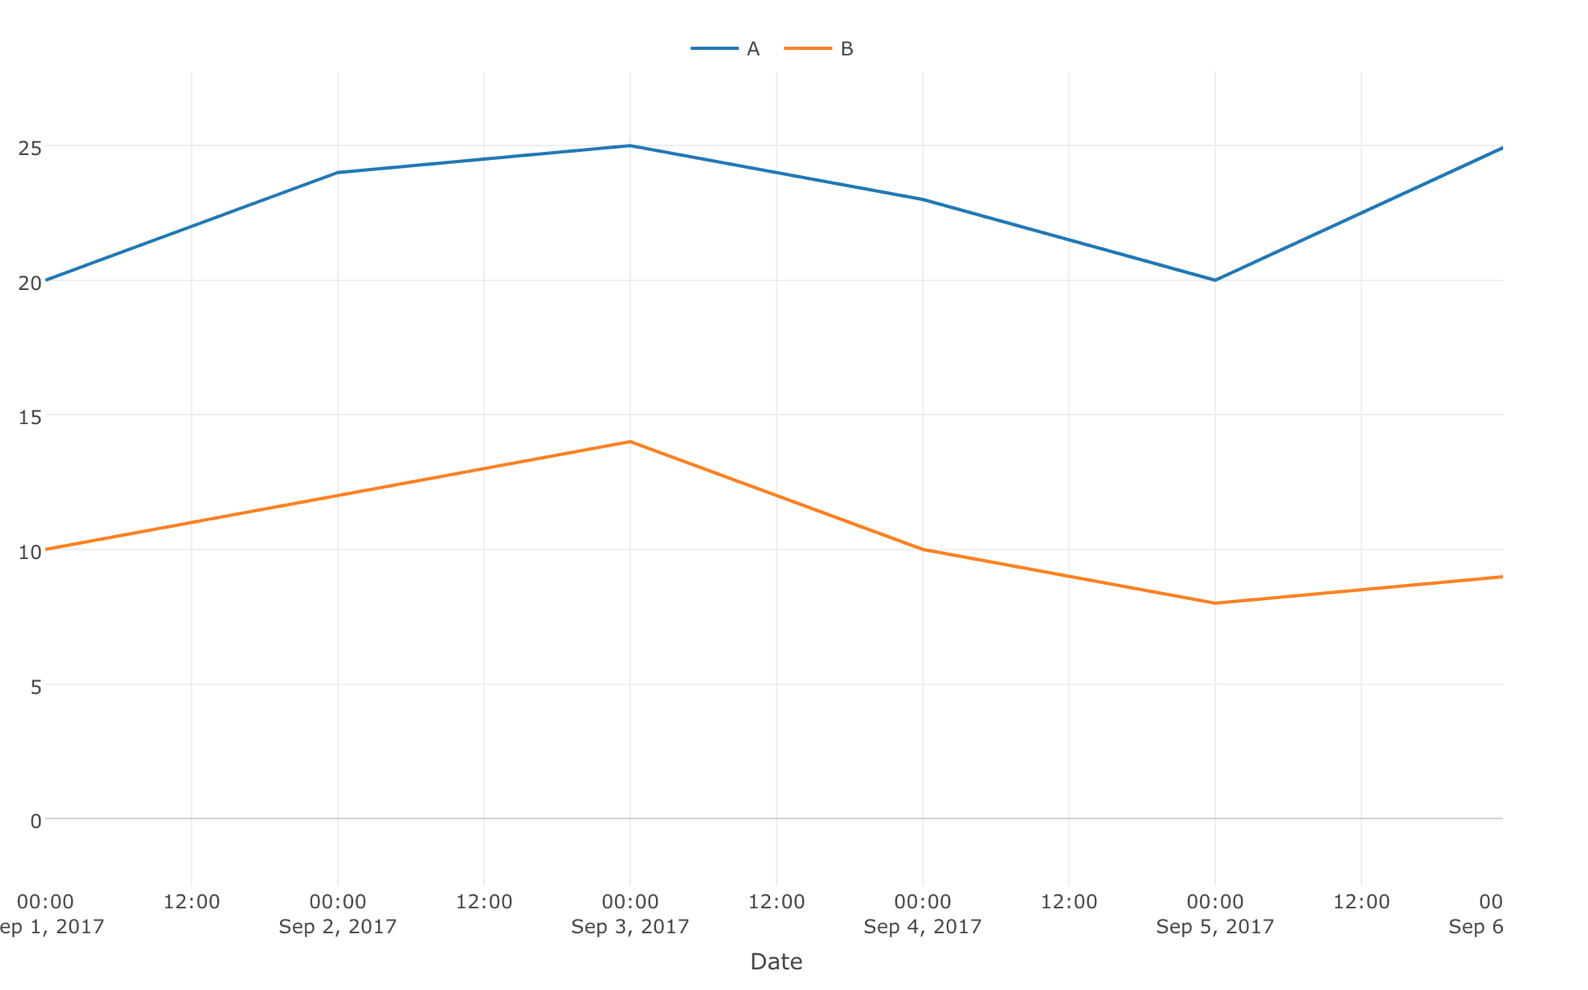
This is clear.
Page A (blue color) is consistently performing much better than Page B (orange color)! It’s obvious, why didn’t we do that earlier?!
Except, in the real world things rarely go that simple. The difference between A and B can be very subtle and it can look something like below.
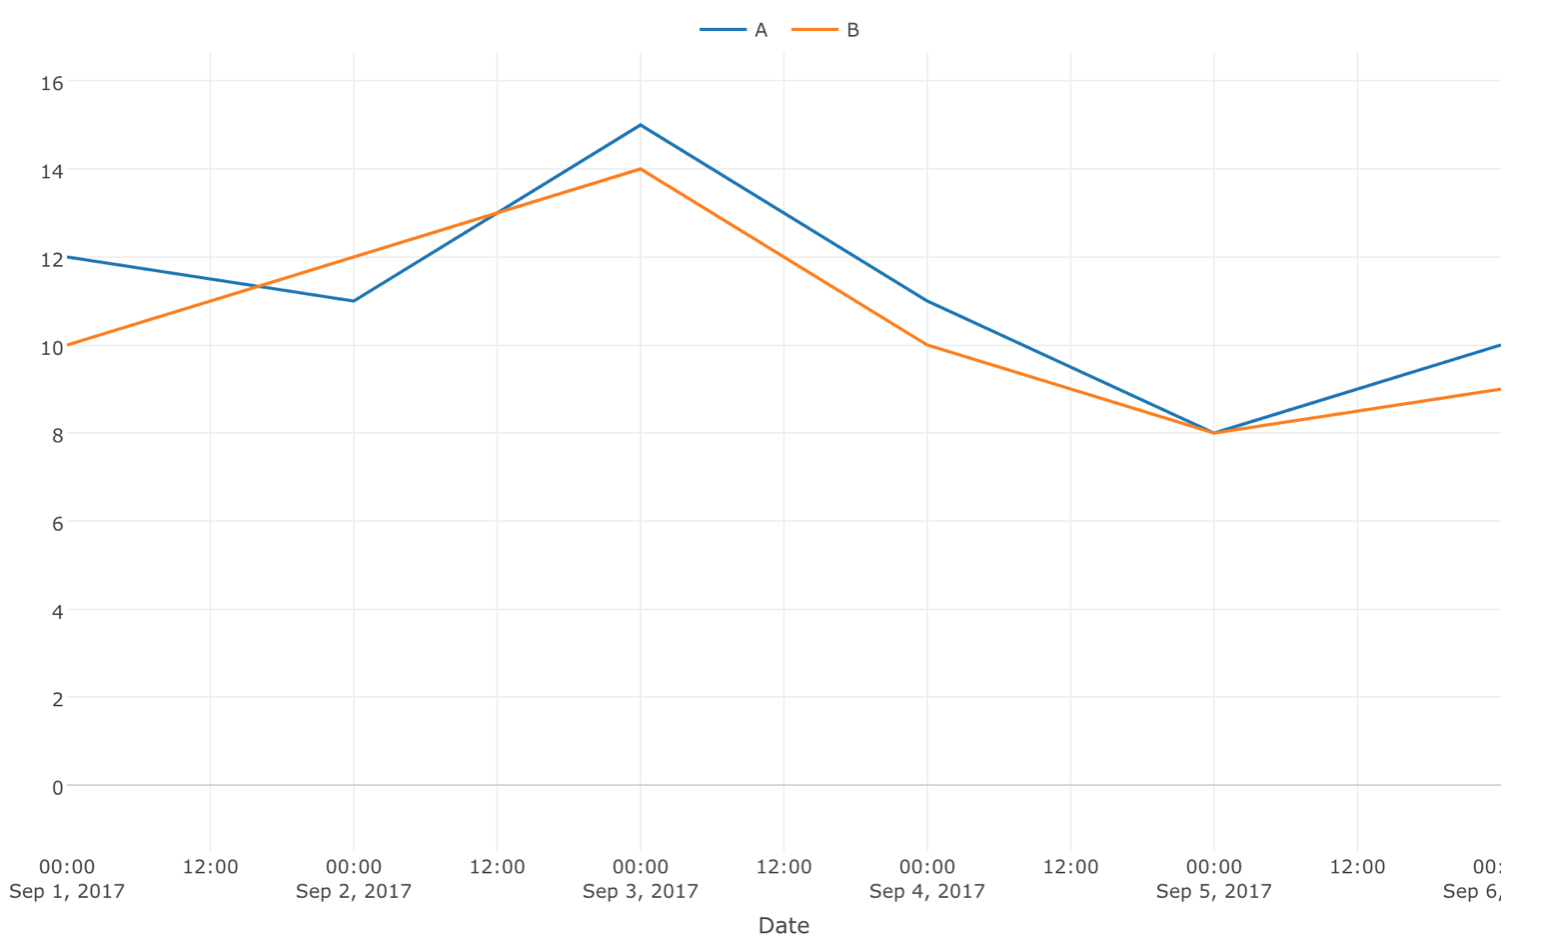
Just by looking at this, you might think that Page A seems to be better than Page B, but are you sure? There are some days Page B is actually better than Page A, and even when A is better than B the difference is very small.
Would you be confident making a decision to say Page A is better based on this result? Are you sure to say that B won’t be performing better than A tomorrow? If you decided to go with A it will cost you additional times and money in the development, the design, the deployment, etc. so you'd better be really certain that Page A is better than Page B for sure.
This is where the power of Statistics comes in.
There are two popular ways to do. One is a frequentist way called ‘Chi-Squared Test’ and another is a bayesian way called ‘Bayesian A/B Test’.
In this post, I’m going to talk about how Chi-Square Test works in a context of A/B Test and the challenges you would face with this approach. Then, I’ll introduce Bayesian A/B Test as another way to approach in order to evaluate the result of A/B Test.
But before that, first we need to prepare the data, regardless of which way you want to go with. If you are just interested in Bayesian A/B Test itself, you can skip to the next section.
Preparing Data
Let’s say we are testing two versions of our landing page and monitoring how much ‘sign ups’ each of the pages is bringing in each day.
I have uploaded a sample data here, which you can download as CSV.
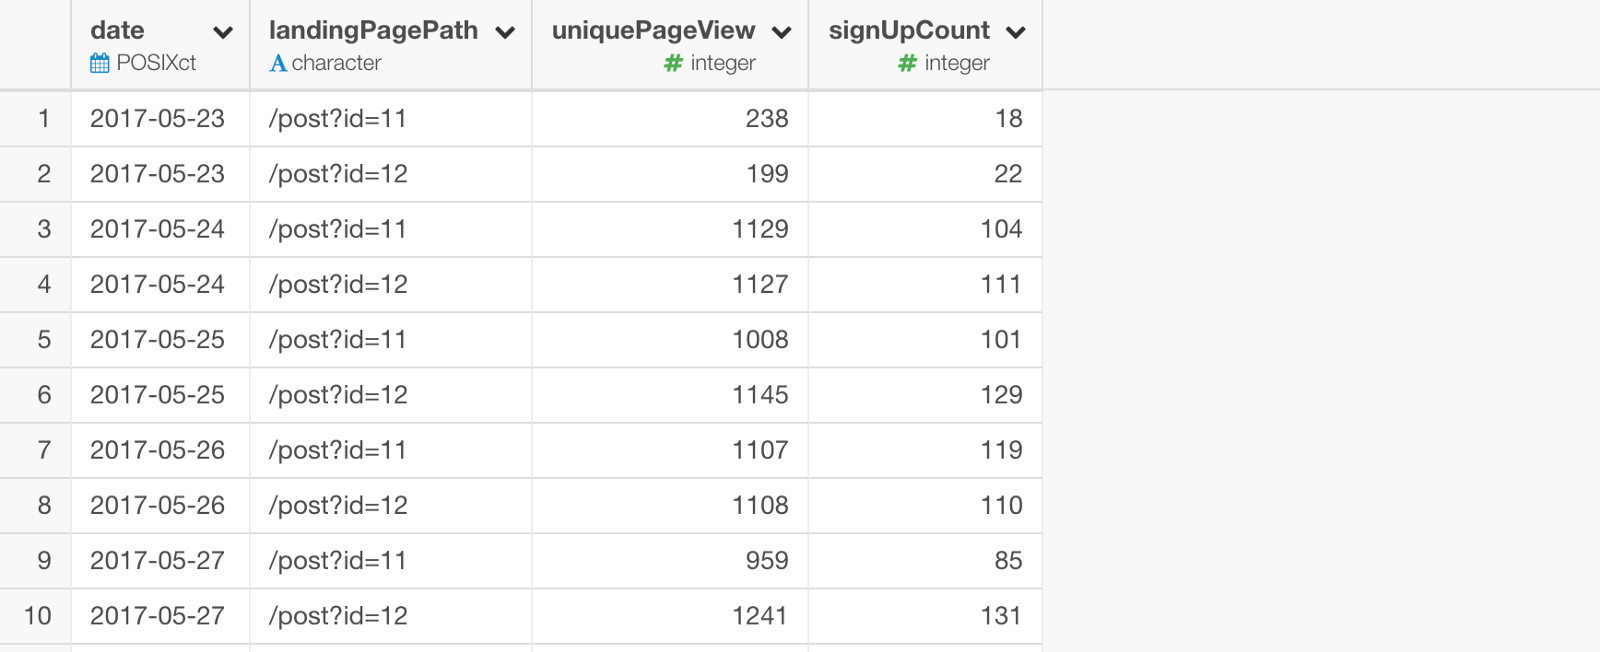
It is aggregated at date level with the following columns.
- date
- landingPagePath - there are two pages as the landing page. This is our A and B information.
- uniquePageView - unique counts for users accessing each landing page
- signUpCount - number of the user accesses that ended up signing up. This is the conversion counts.
To run either Chi-Square or Bayesian A/B, we have two pre-requisites for the data.
First, we need to aggregate the data to have a total number of the accesses (or views) and a total number of the conversion for each group (A and B).
Second, we need to calculate the conversion rate for each group (A and B).
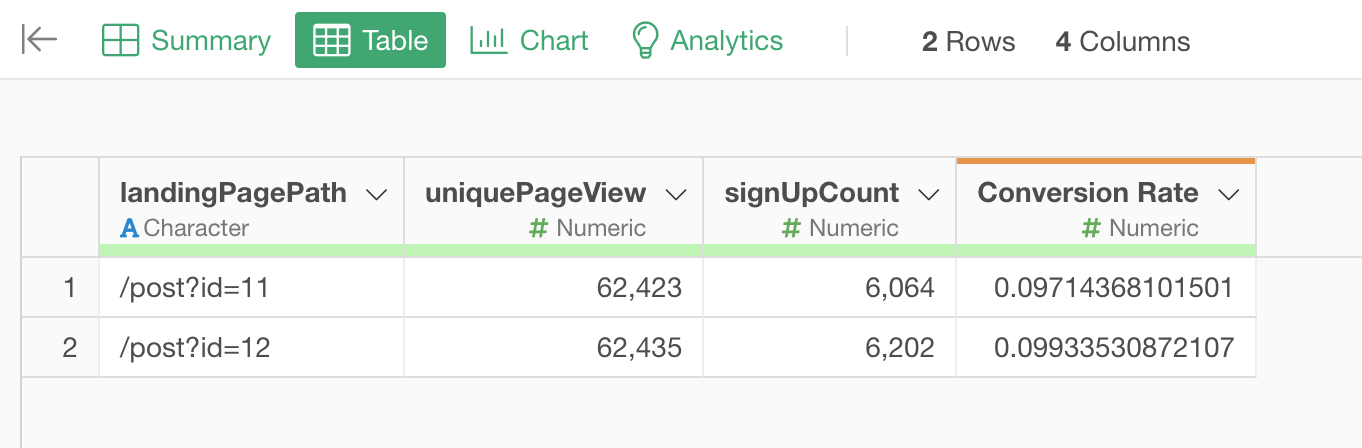
Eventually, we want to have a data like the below.
Once we get the data in this format we can move on to run either Chi-Square or Bayesian A/B. If you already have the data in this format then skip the following data wrangling section.
But most of the times, the data is not presented in this format, especially when you are pulling data from some services like Google Analytics. In such cases, you want to follow the next data wrangling section.
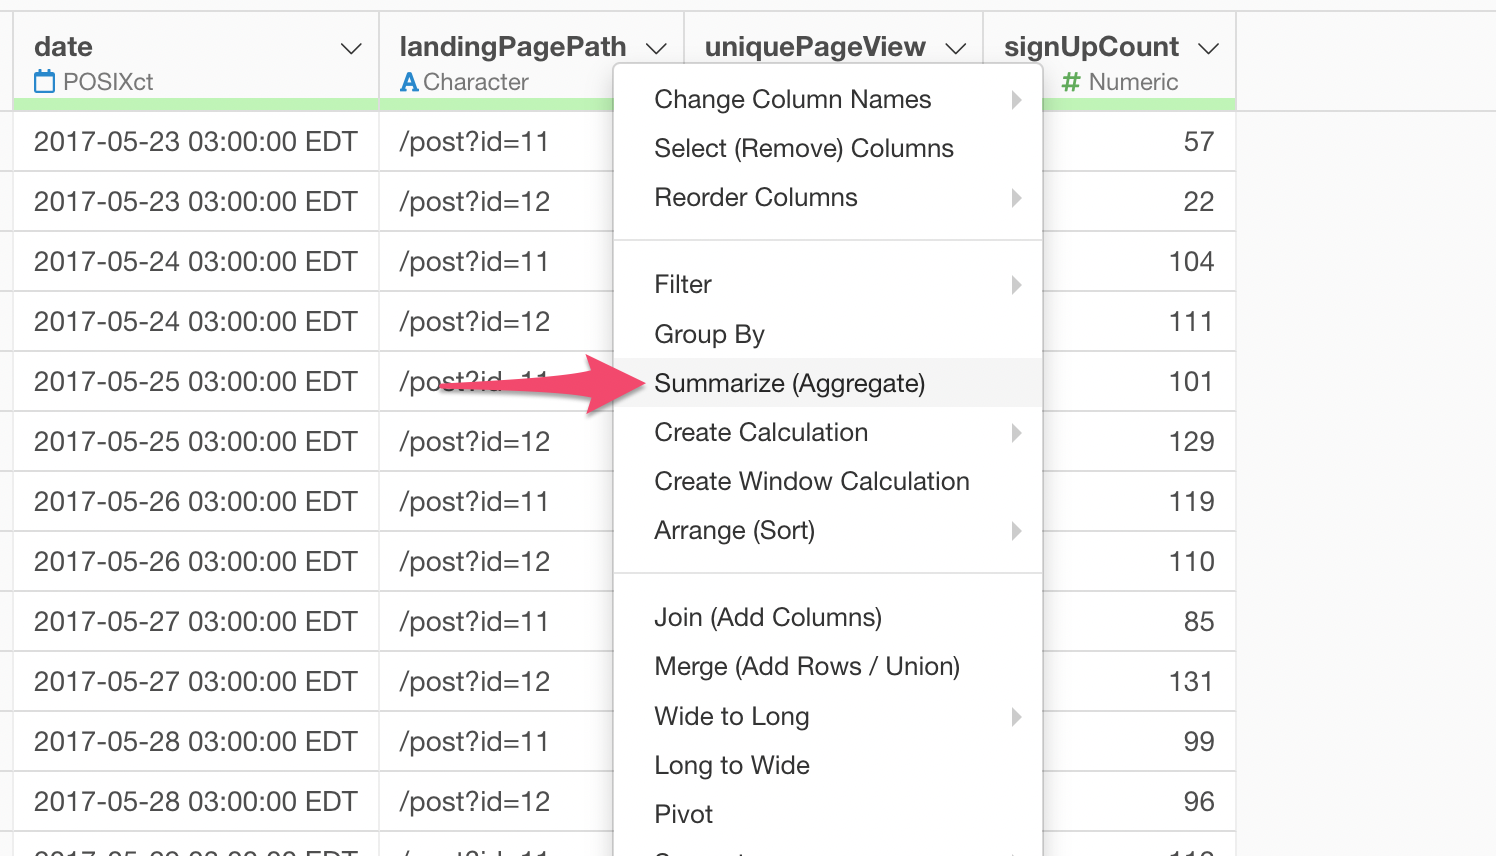
Aggregate (Summarize) Data
Select 'Summarize' from the column header menu of 'landingPagePath' column.
Select 'uniquePageView' and 'singUpCount' columns under the Value section. Make sure the aggregate functions are set to 'SUM' for both columns.
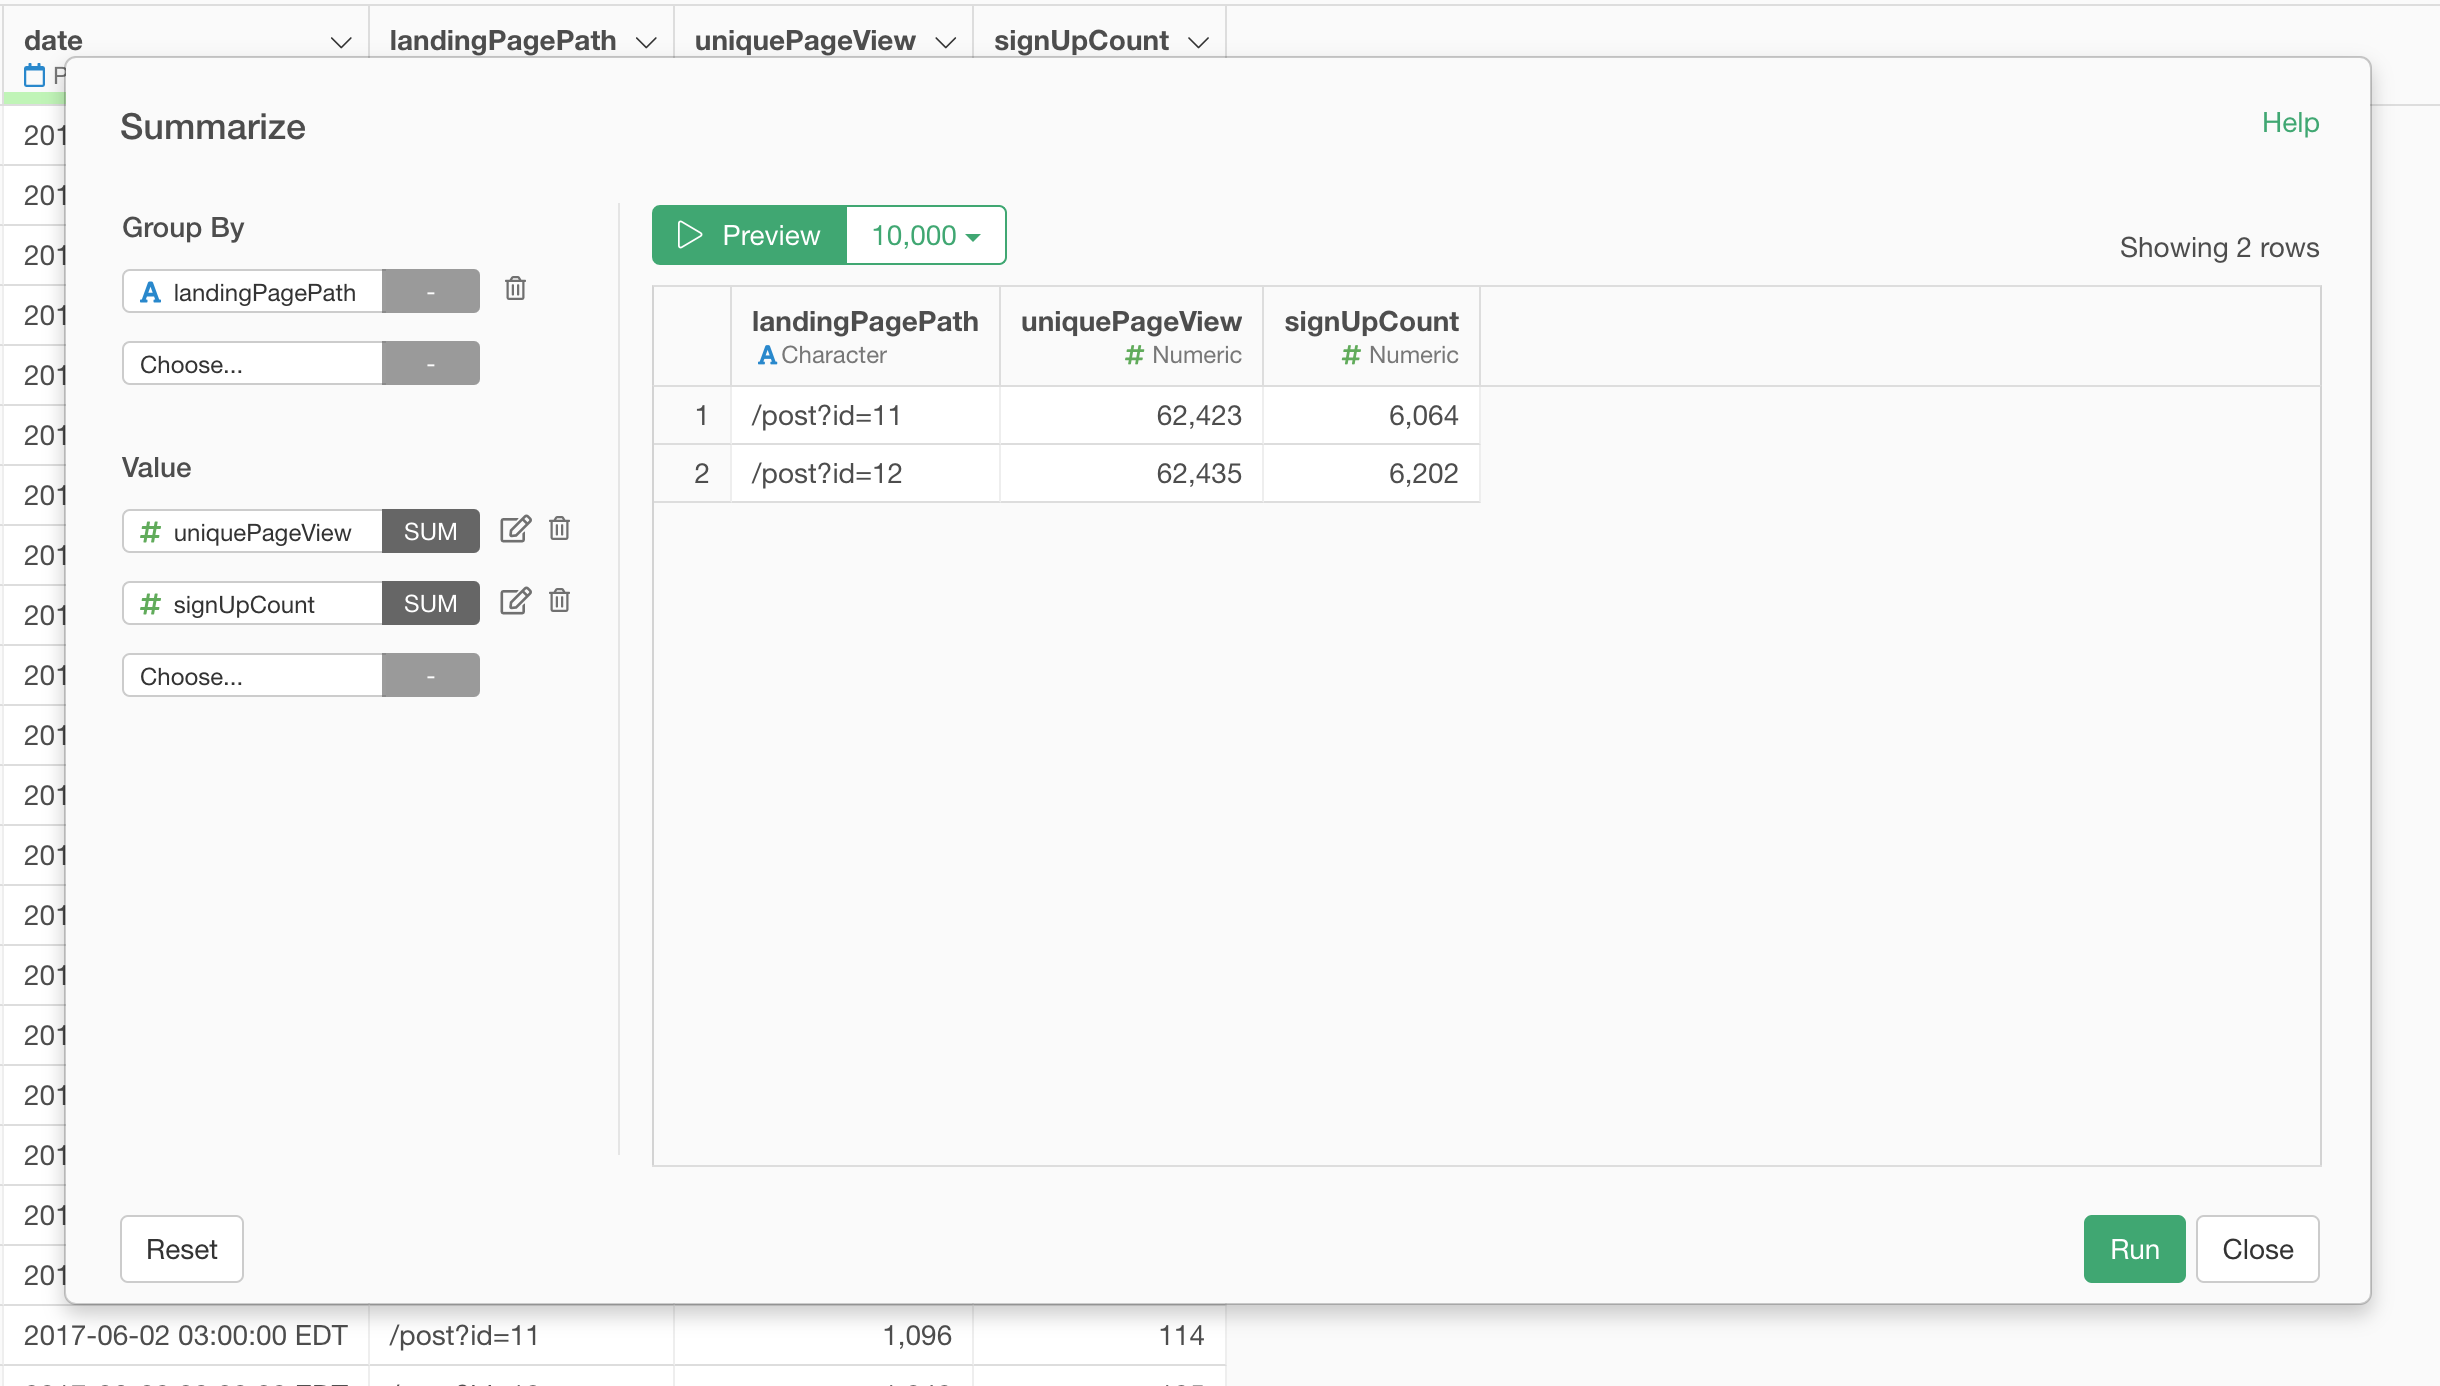
And click 'Run' button.
Now we have the aggregated data with a total number of the views and a total number of the sign ups (conversions).
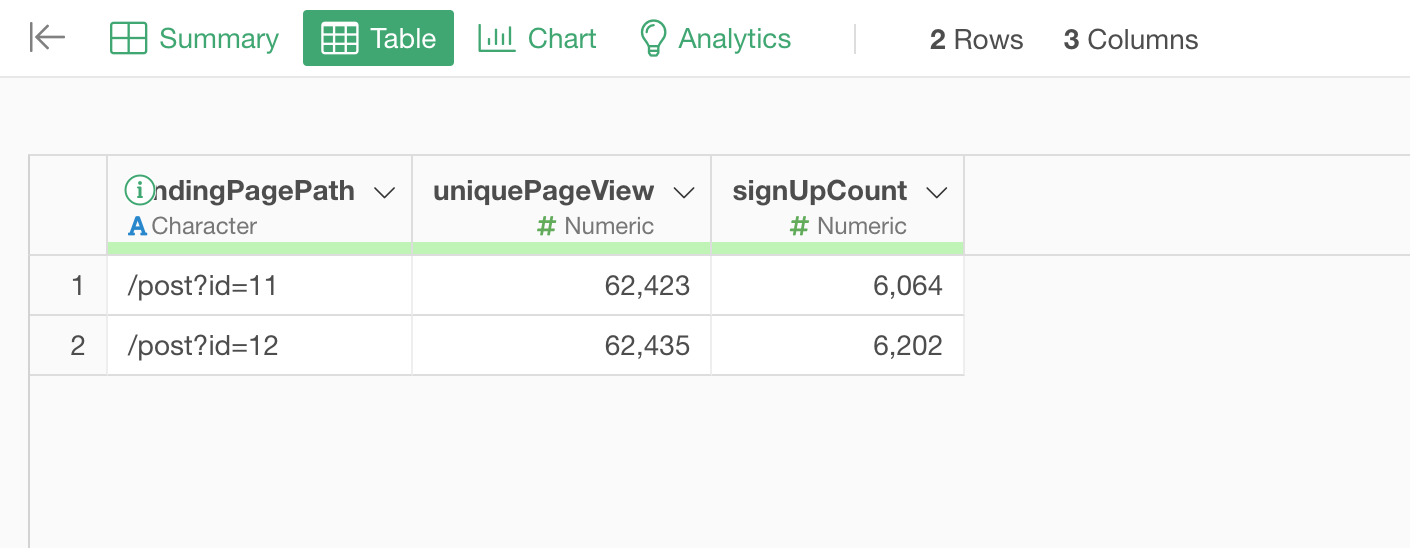
Now it's time to calculate the conversion rate!
Calculate Conversion Rate
Select 'Create Calculation' -> 'Standard' from the column header menu of 'singUpCount' column.
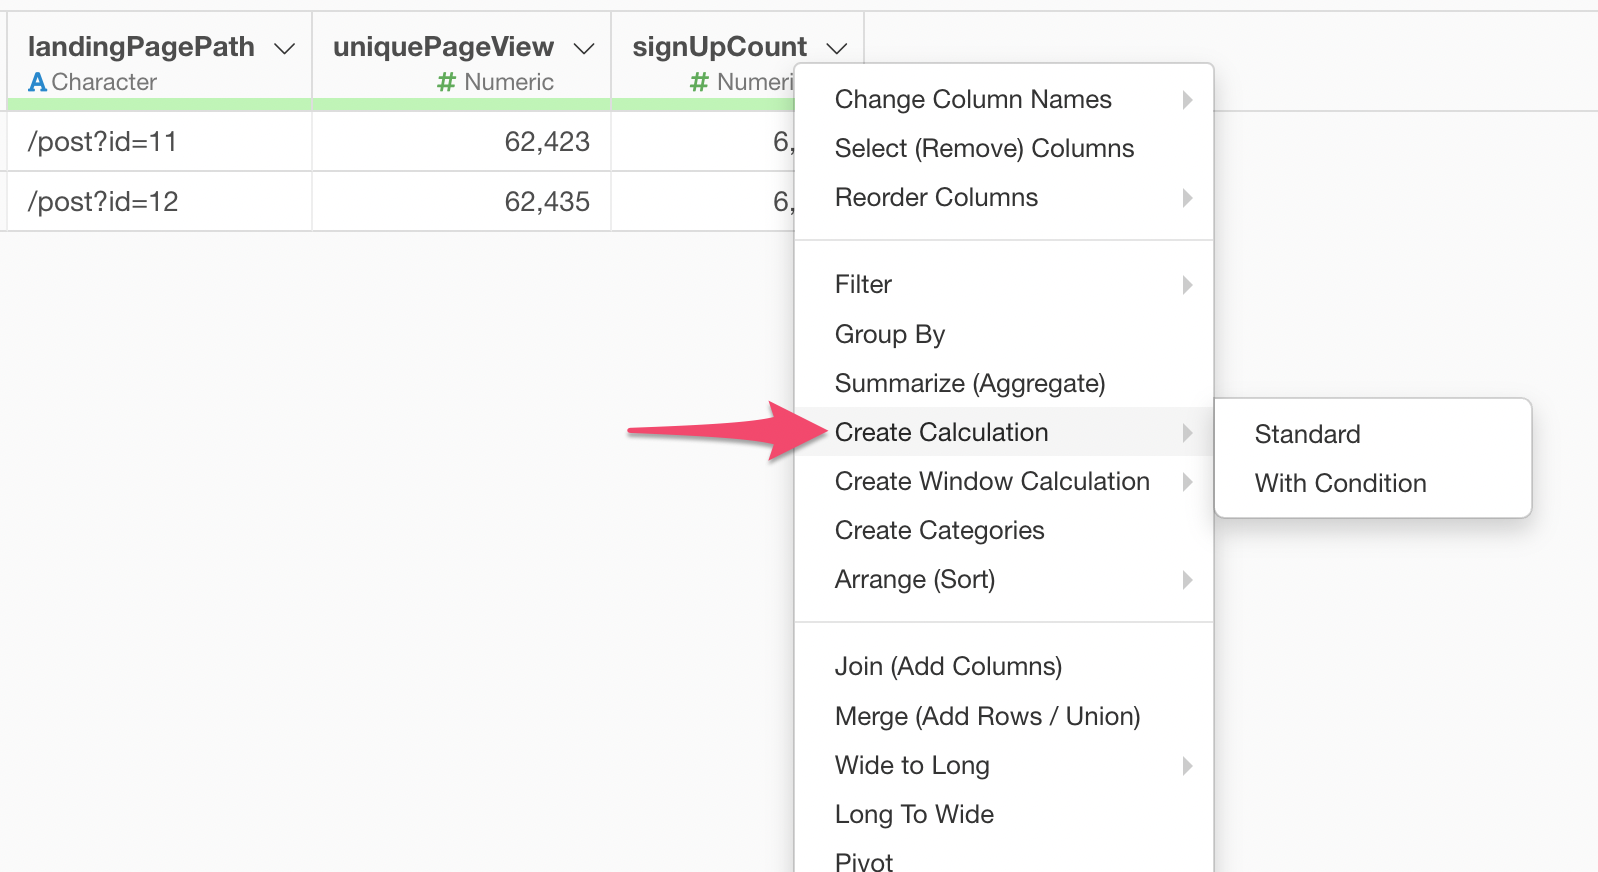
And create a calculation like below to calculate the conversion rate.
singUpCount / uniquePageView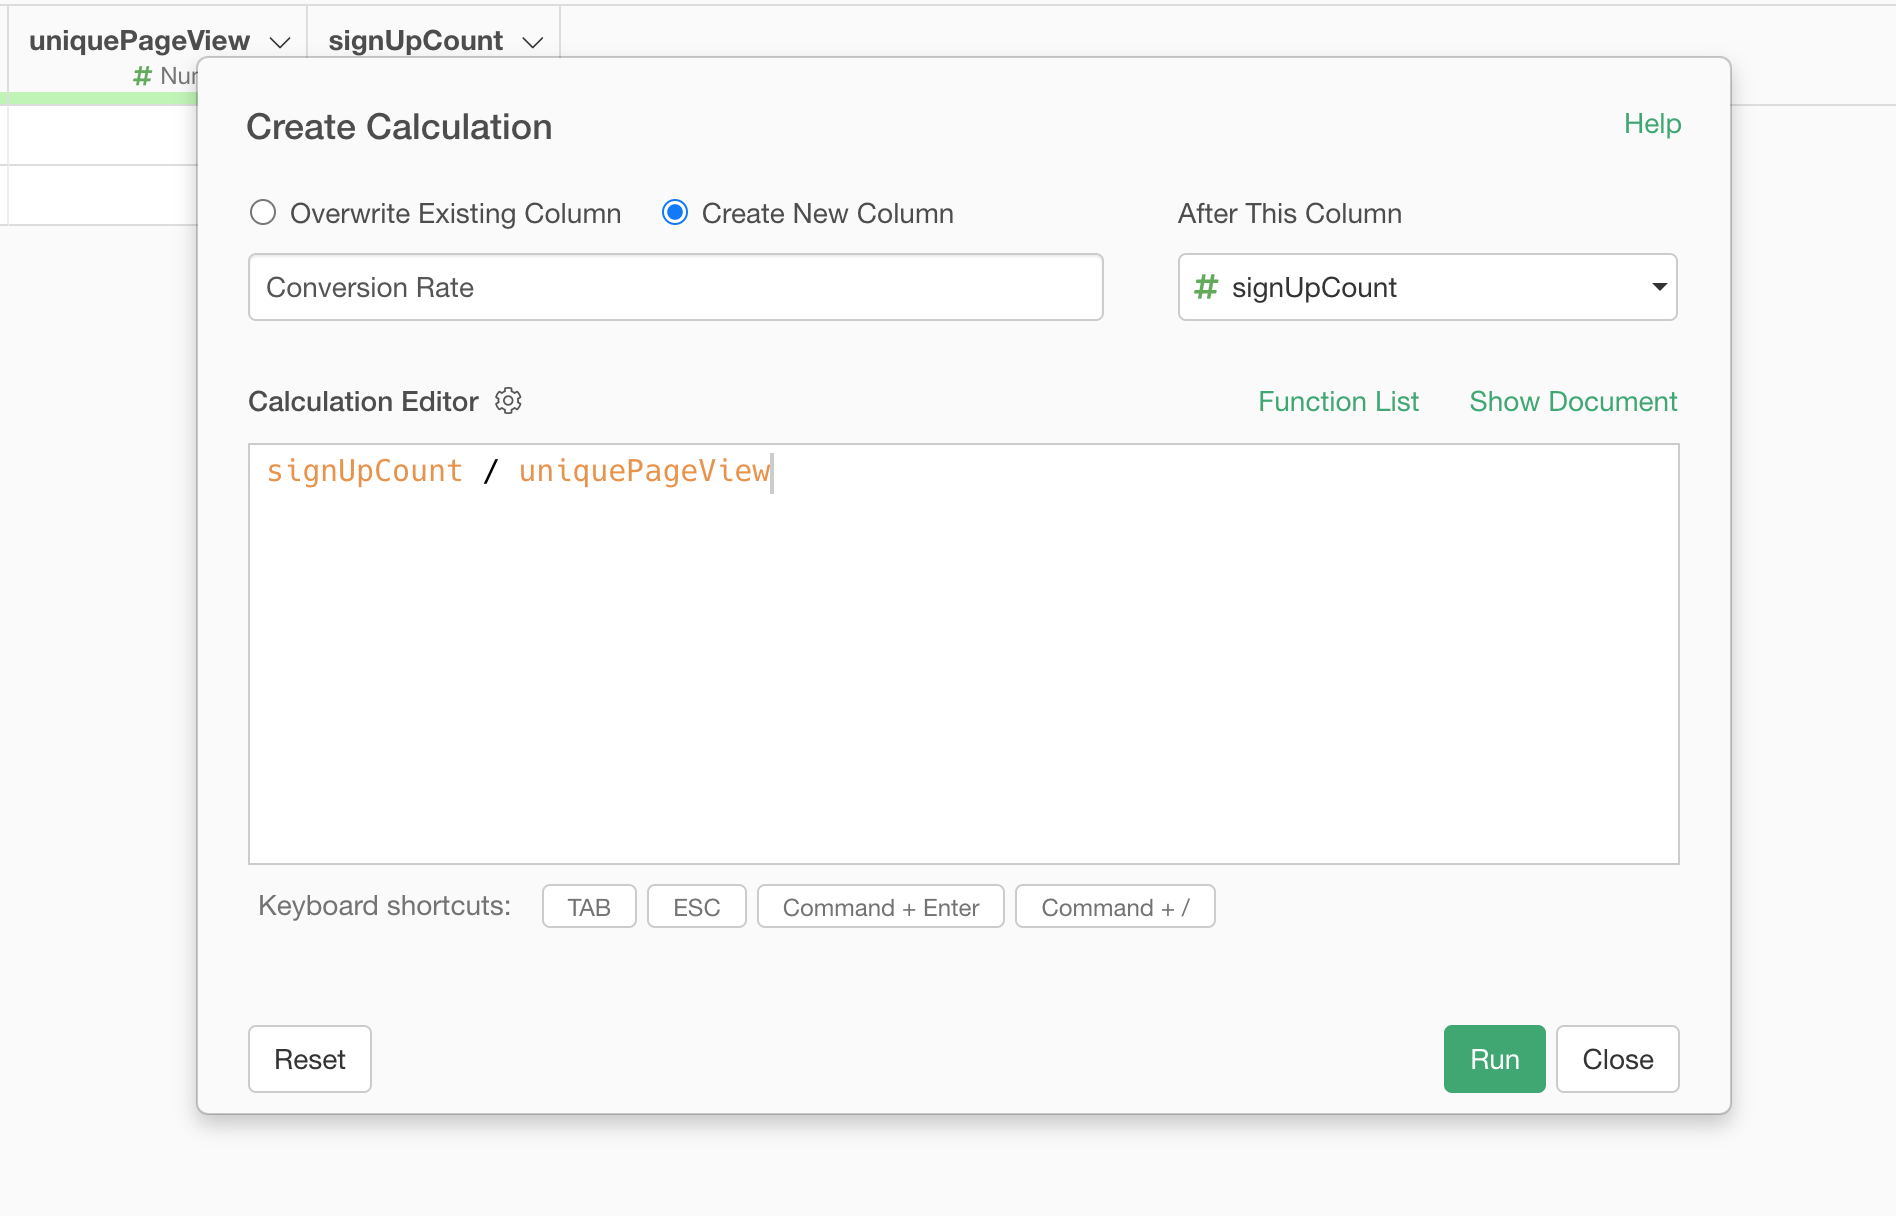
Once you click on the Run button, you'll have the conversion rate column.
Now the data is ready, we can run the Chi-Square Test and the Bayesian Test for this data!
Chi-Squared Test
To perform Chi-Square for AB Test data, go to Analytics view and select Chi-Square Test from the Type.
Assign 'landingPagePath' column to the Group Column, 'Conversion Rate' column to the Conversion Rate, and 'uniquePageView' column to the Sample Size, then click the Run button!
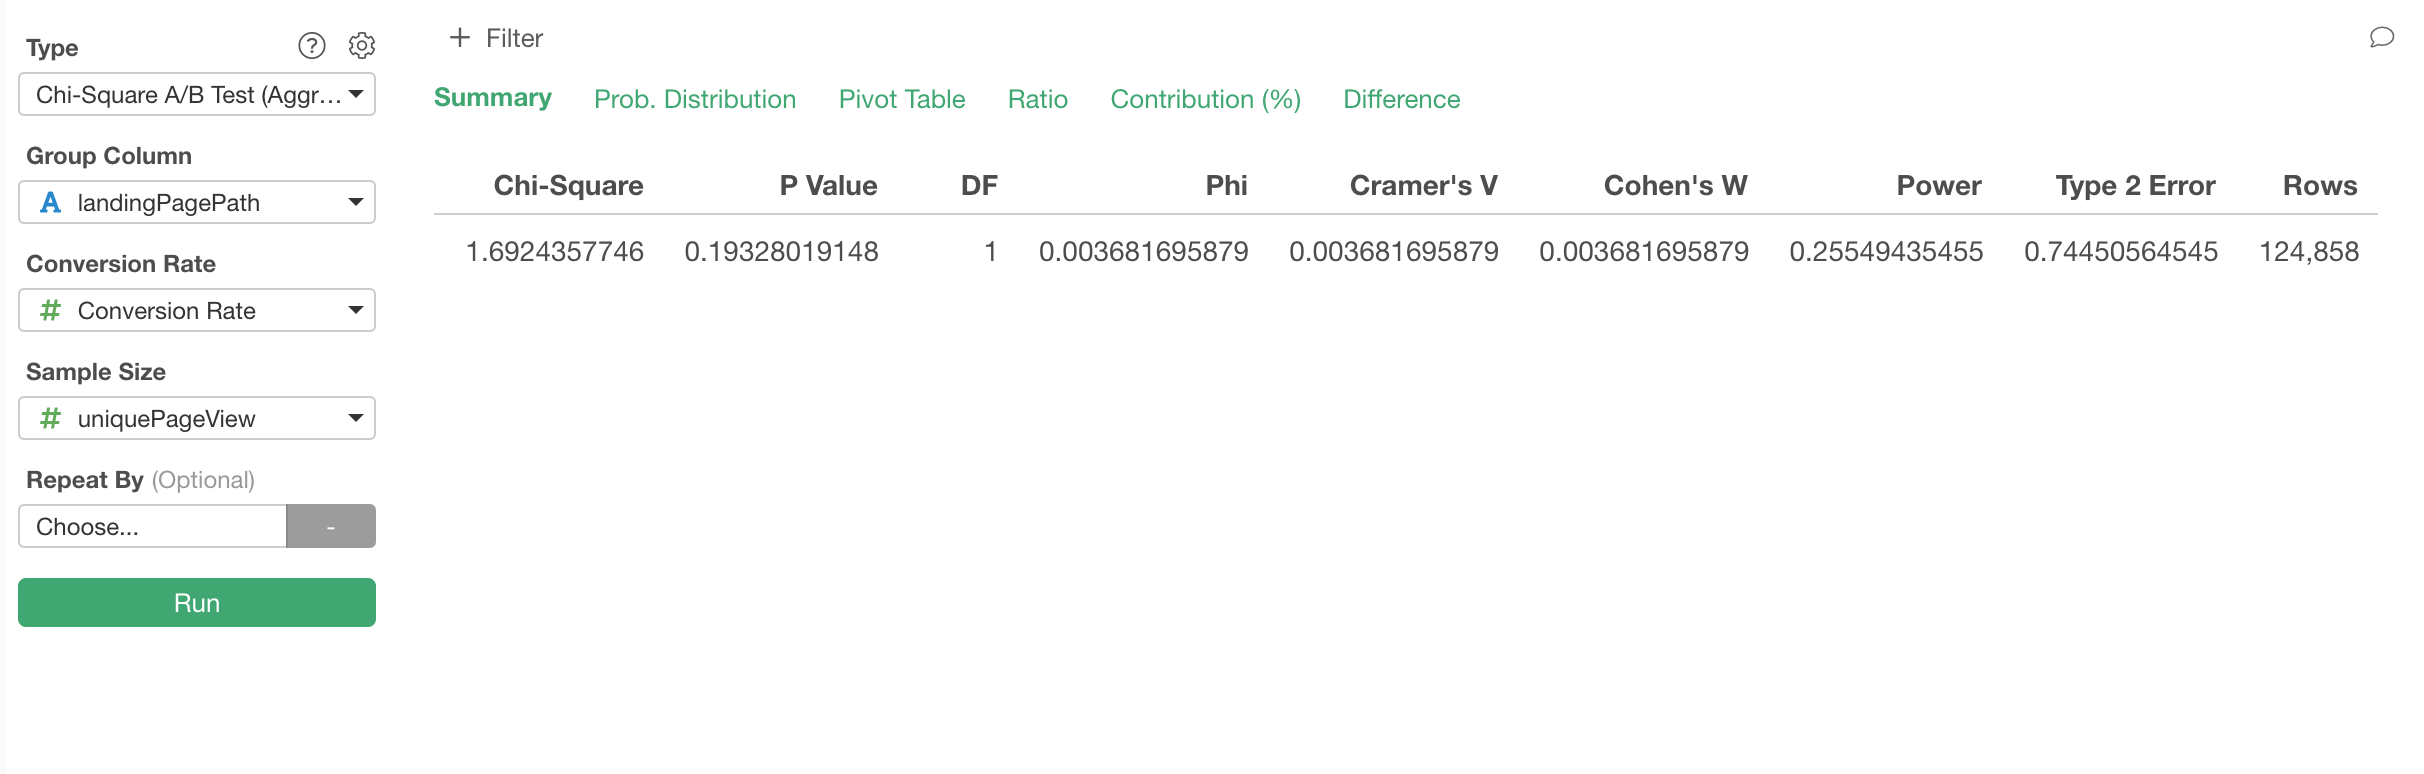
The P-Value is 0.19 (19%), which means that the difference in the conversion rates between the two pages are not significant if we take 0.05 (5%) as a significant threshold value.
So whatever you did with one of the pages didn't contribute much in terms of improving the conversion rate.
But, there is one problem.
Take a look at the 'Type 2 Error' showing 0.74 (74%), which means that you could be wrong at 74% chance if you decided that there was no difference between the two pages.
What???
Yes, that's what it is saying. The reason is because you don't have enough data to conclude that there is no significant difference between the two.
Now what should we do?
Not doing anything? Or, we should keep the testing until we have enough data?
This is one of the challenges we face with the frequentist type of statistical test including Chi-Square Test. But this is not the only challenge. Here is a list of the challenges for using Chi-Square Test.
- We need to know how much of the data we need to collect for the test before starting the test.
- We can’t evaluate the result in real-time as we go, instead we need to wait to make any decision until we collect a full of the planned data size.
- The test result is not intuitively understandable especially for those without a statistical background. (What is P-value again?)
- The test result can be read as black and white, either it is statistically significant or not. This makes it hard to figure out what to do especially when not statistically significant.
If you are concerned with these challenges, you might want to give the Bayesian approach a shot.
Bayesian A/B Test
Bayesian A/B Test employs Bayesian inference methods to give you ‘probability’ of how much A is better (or worse) than B.
I'll discuss the advantages and the background later, but for now, let's run the Bayesian A/B Test first.
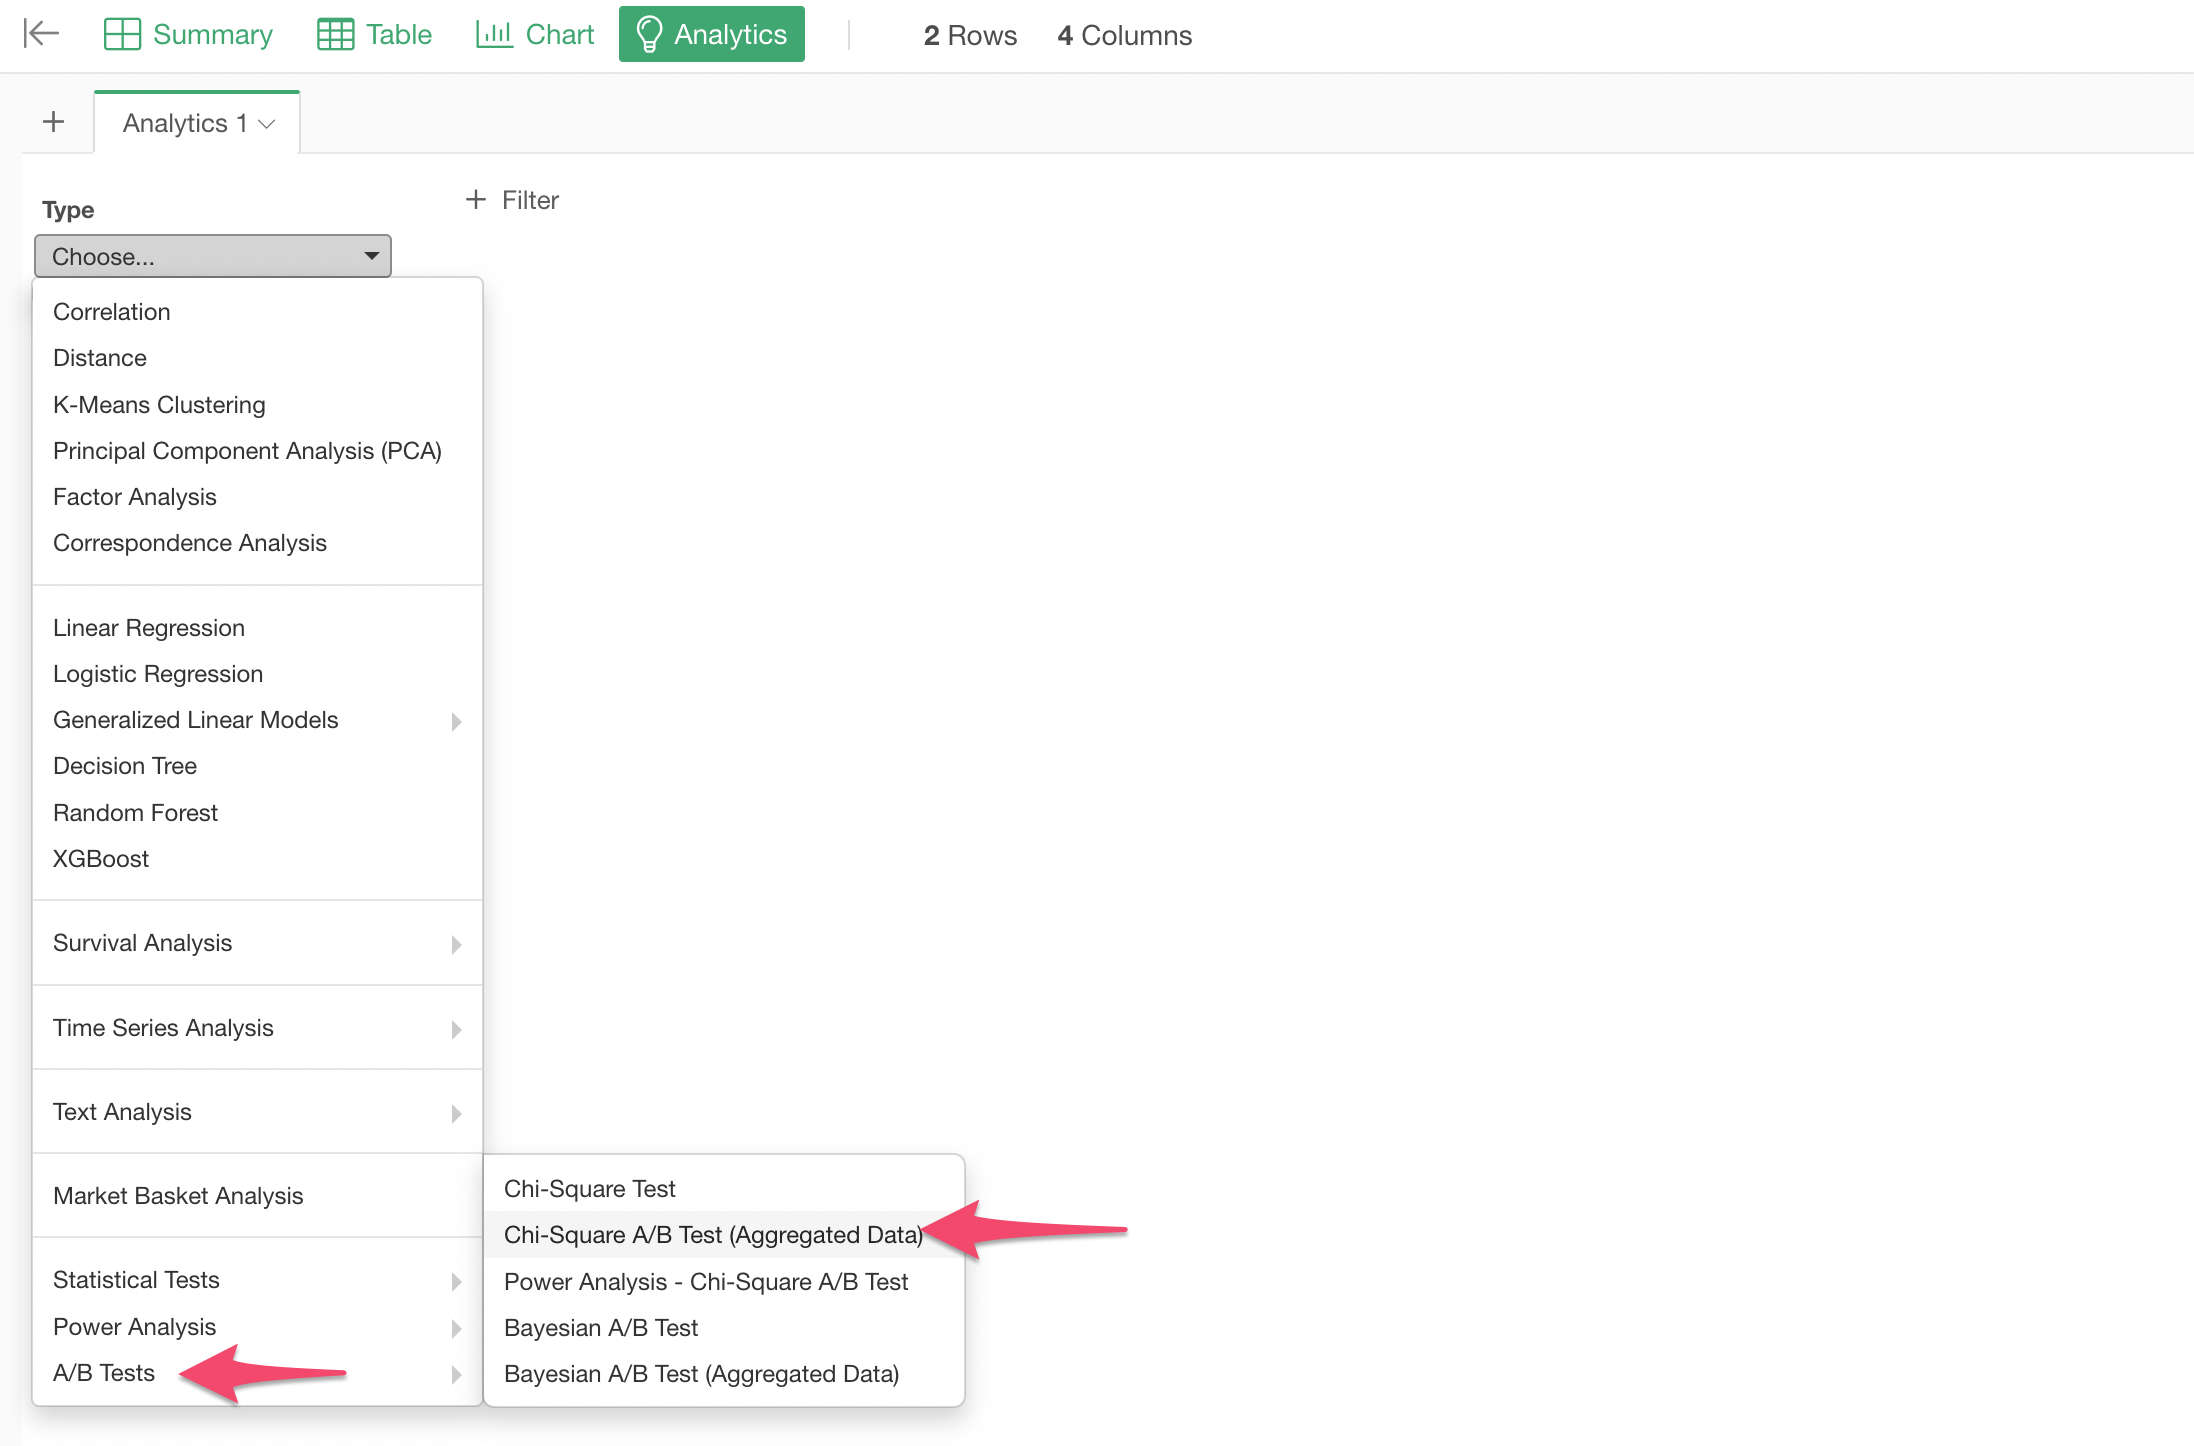
Select ‘Bayesian A/B Test (Aggregated Data)' under 'A/B Test' for the Analytics Type.
Assigning the columns is as same as we did for Chi-Square Test.
Assign 'landingPagePath' column to the Group Column, 'Conversion Rate' column to the Conversion Rate, and 'uniquePageView' column to the Sample Size, then click the Run button!
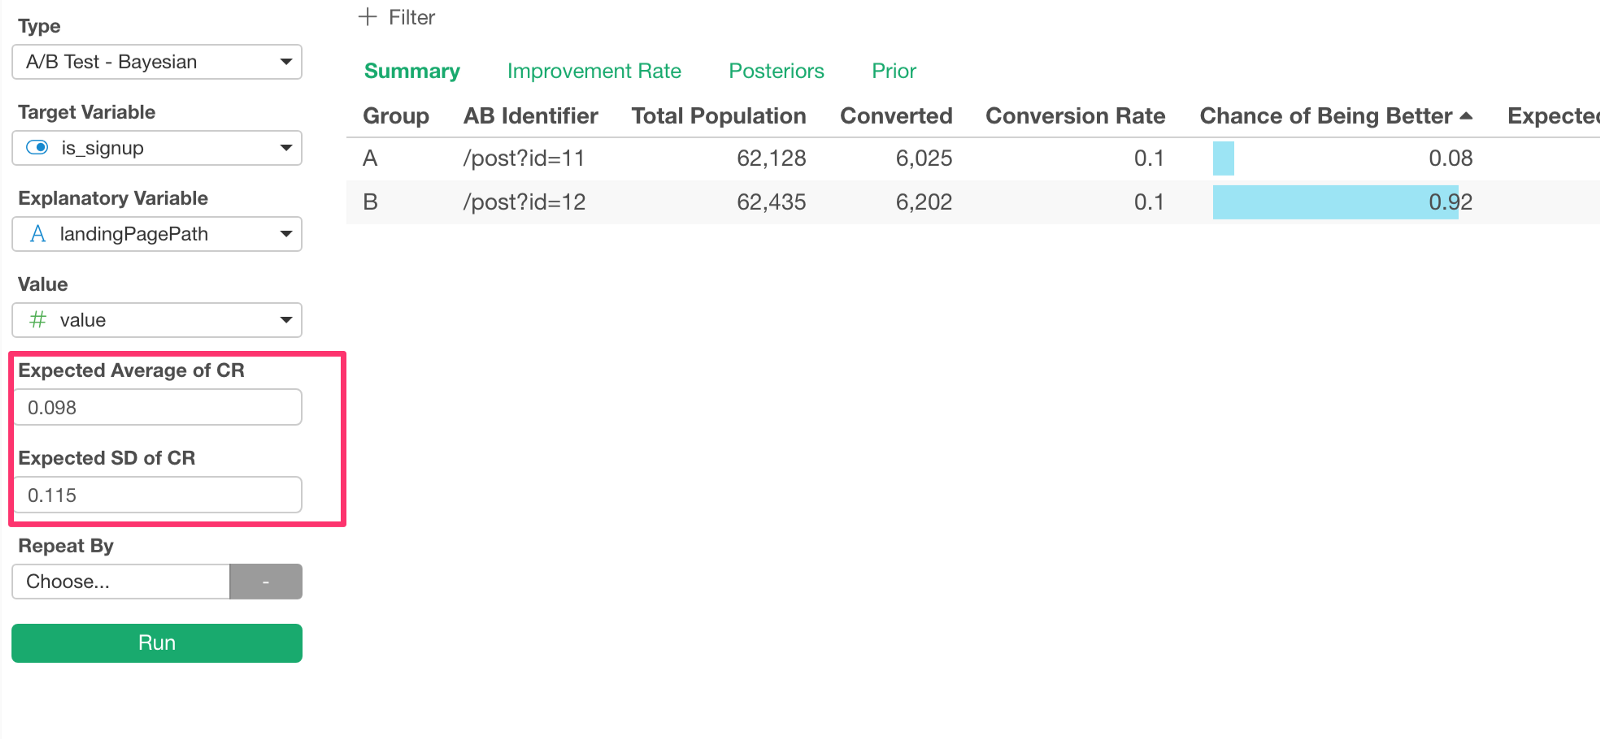
This will produce a summary information like below.
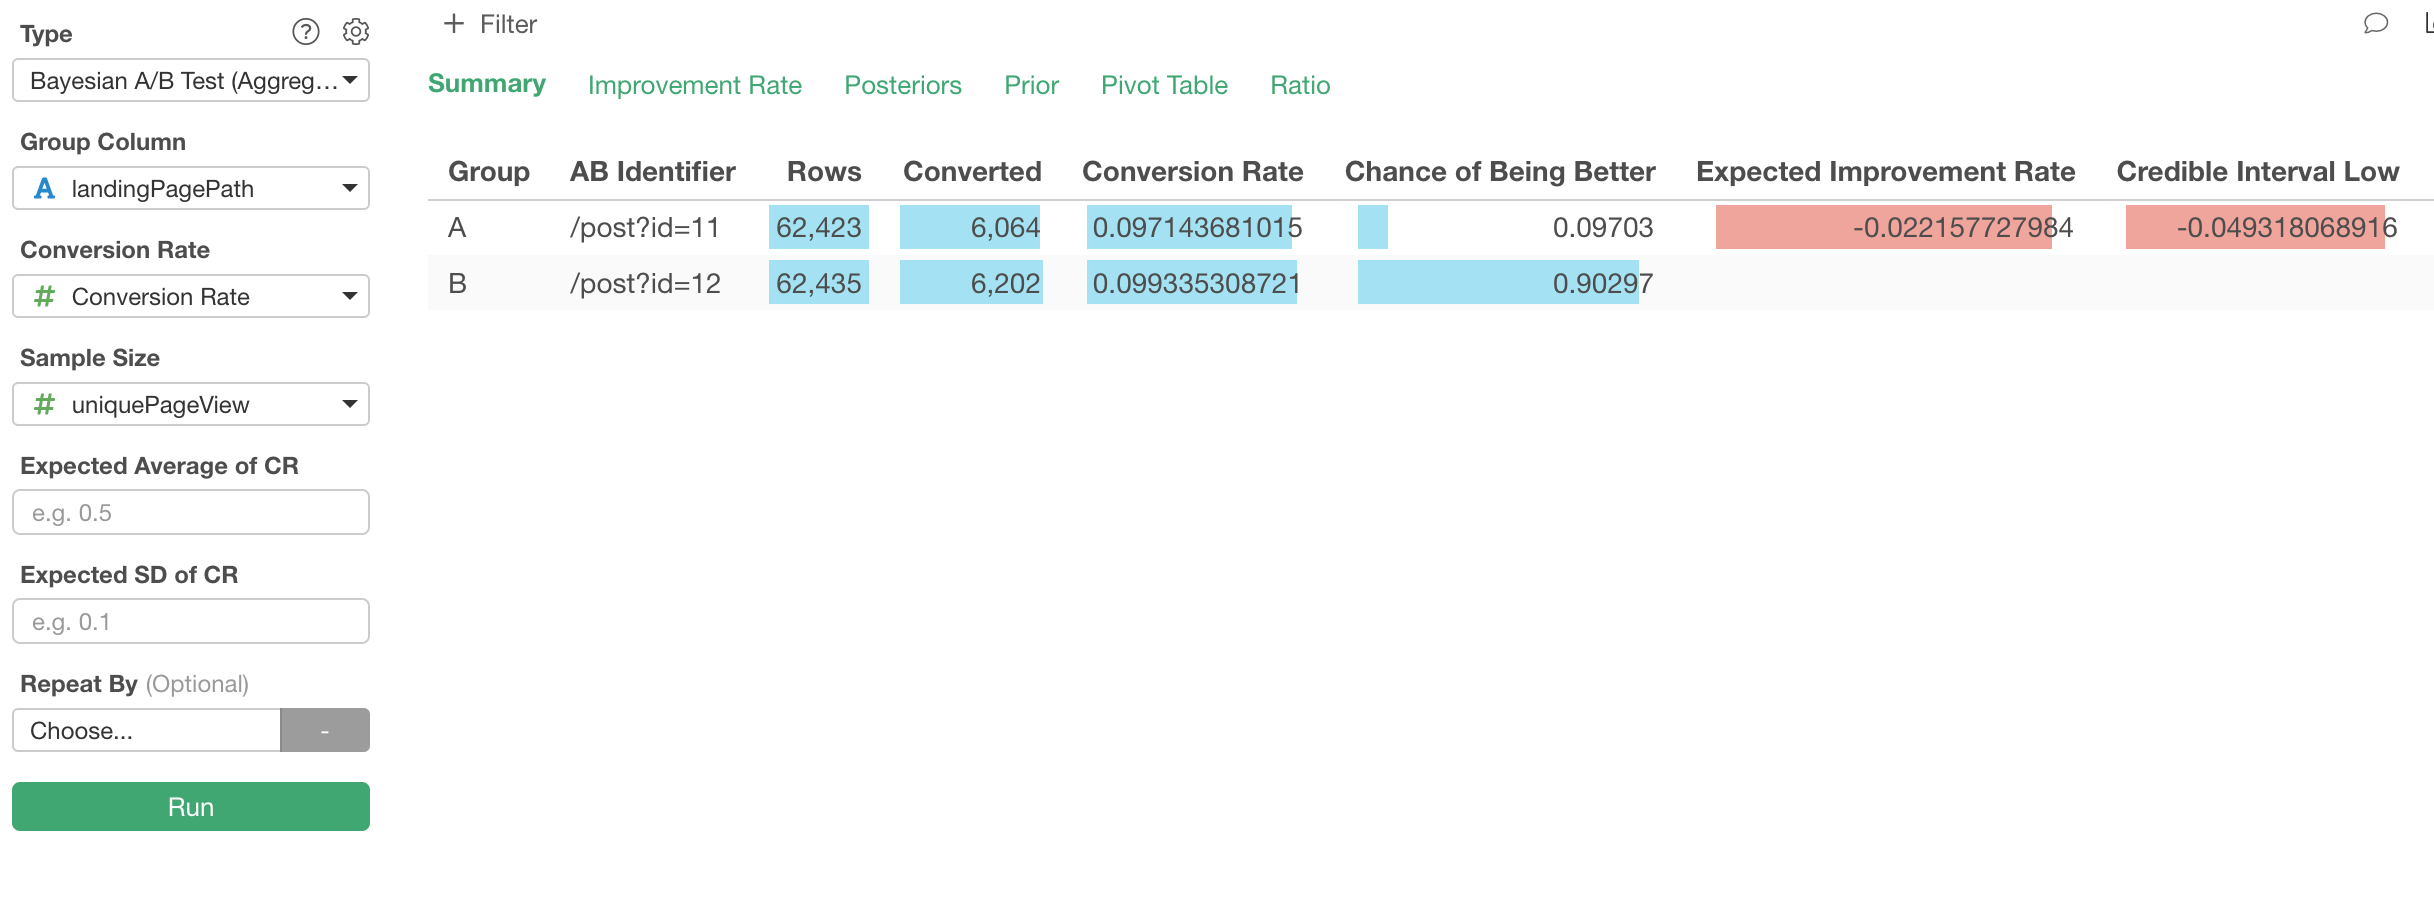
The most important part of this information is ‘Chance of Being Better’ column. In this case, we can read that as the probability of A is better than B is 9% (0.09) and the probability of B is better than A is 90% (0.90).
‘Expected Improvement Rate’ column shows how much A is better than B. In this case, the number is negative so we can interpret it as the conversion would be about 2% worse if we go with page A. This means, B is would perform 2% better.
You can go to ‘Improvement Rate’ tab where you can see the improvement rate’s probability distribution. The X-axis represents how much A is better than B with a calculation like below.
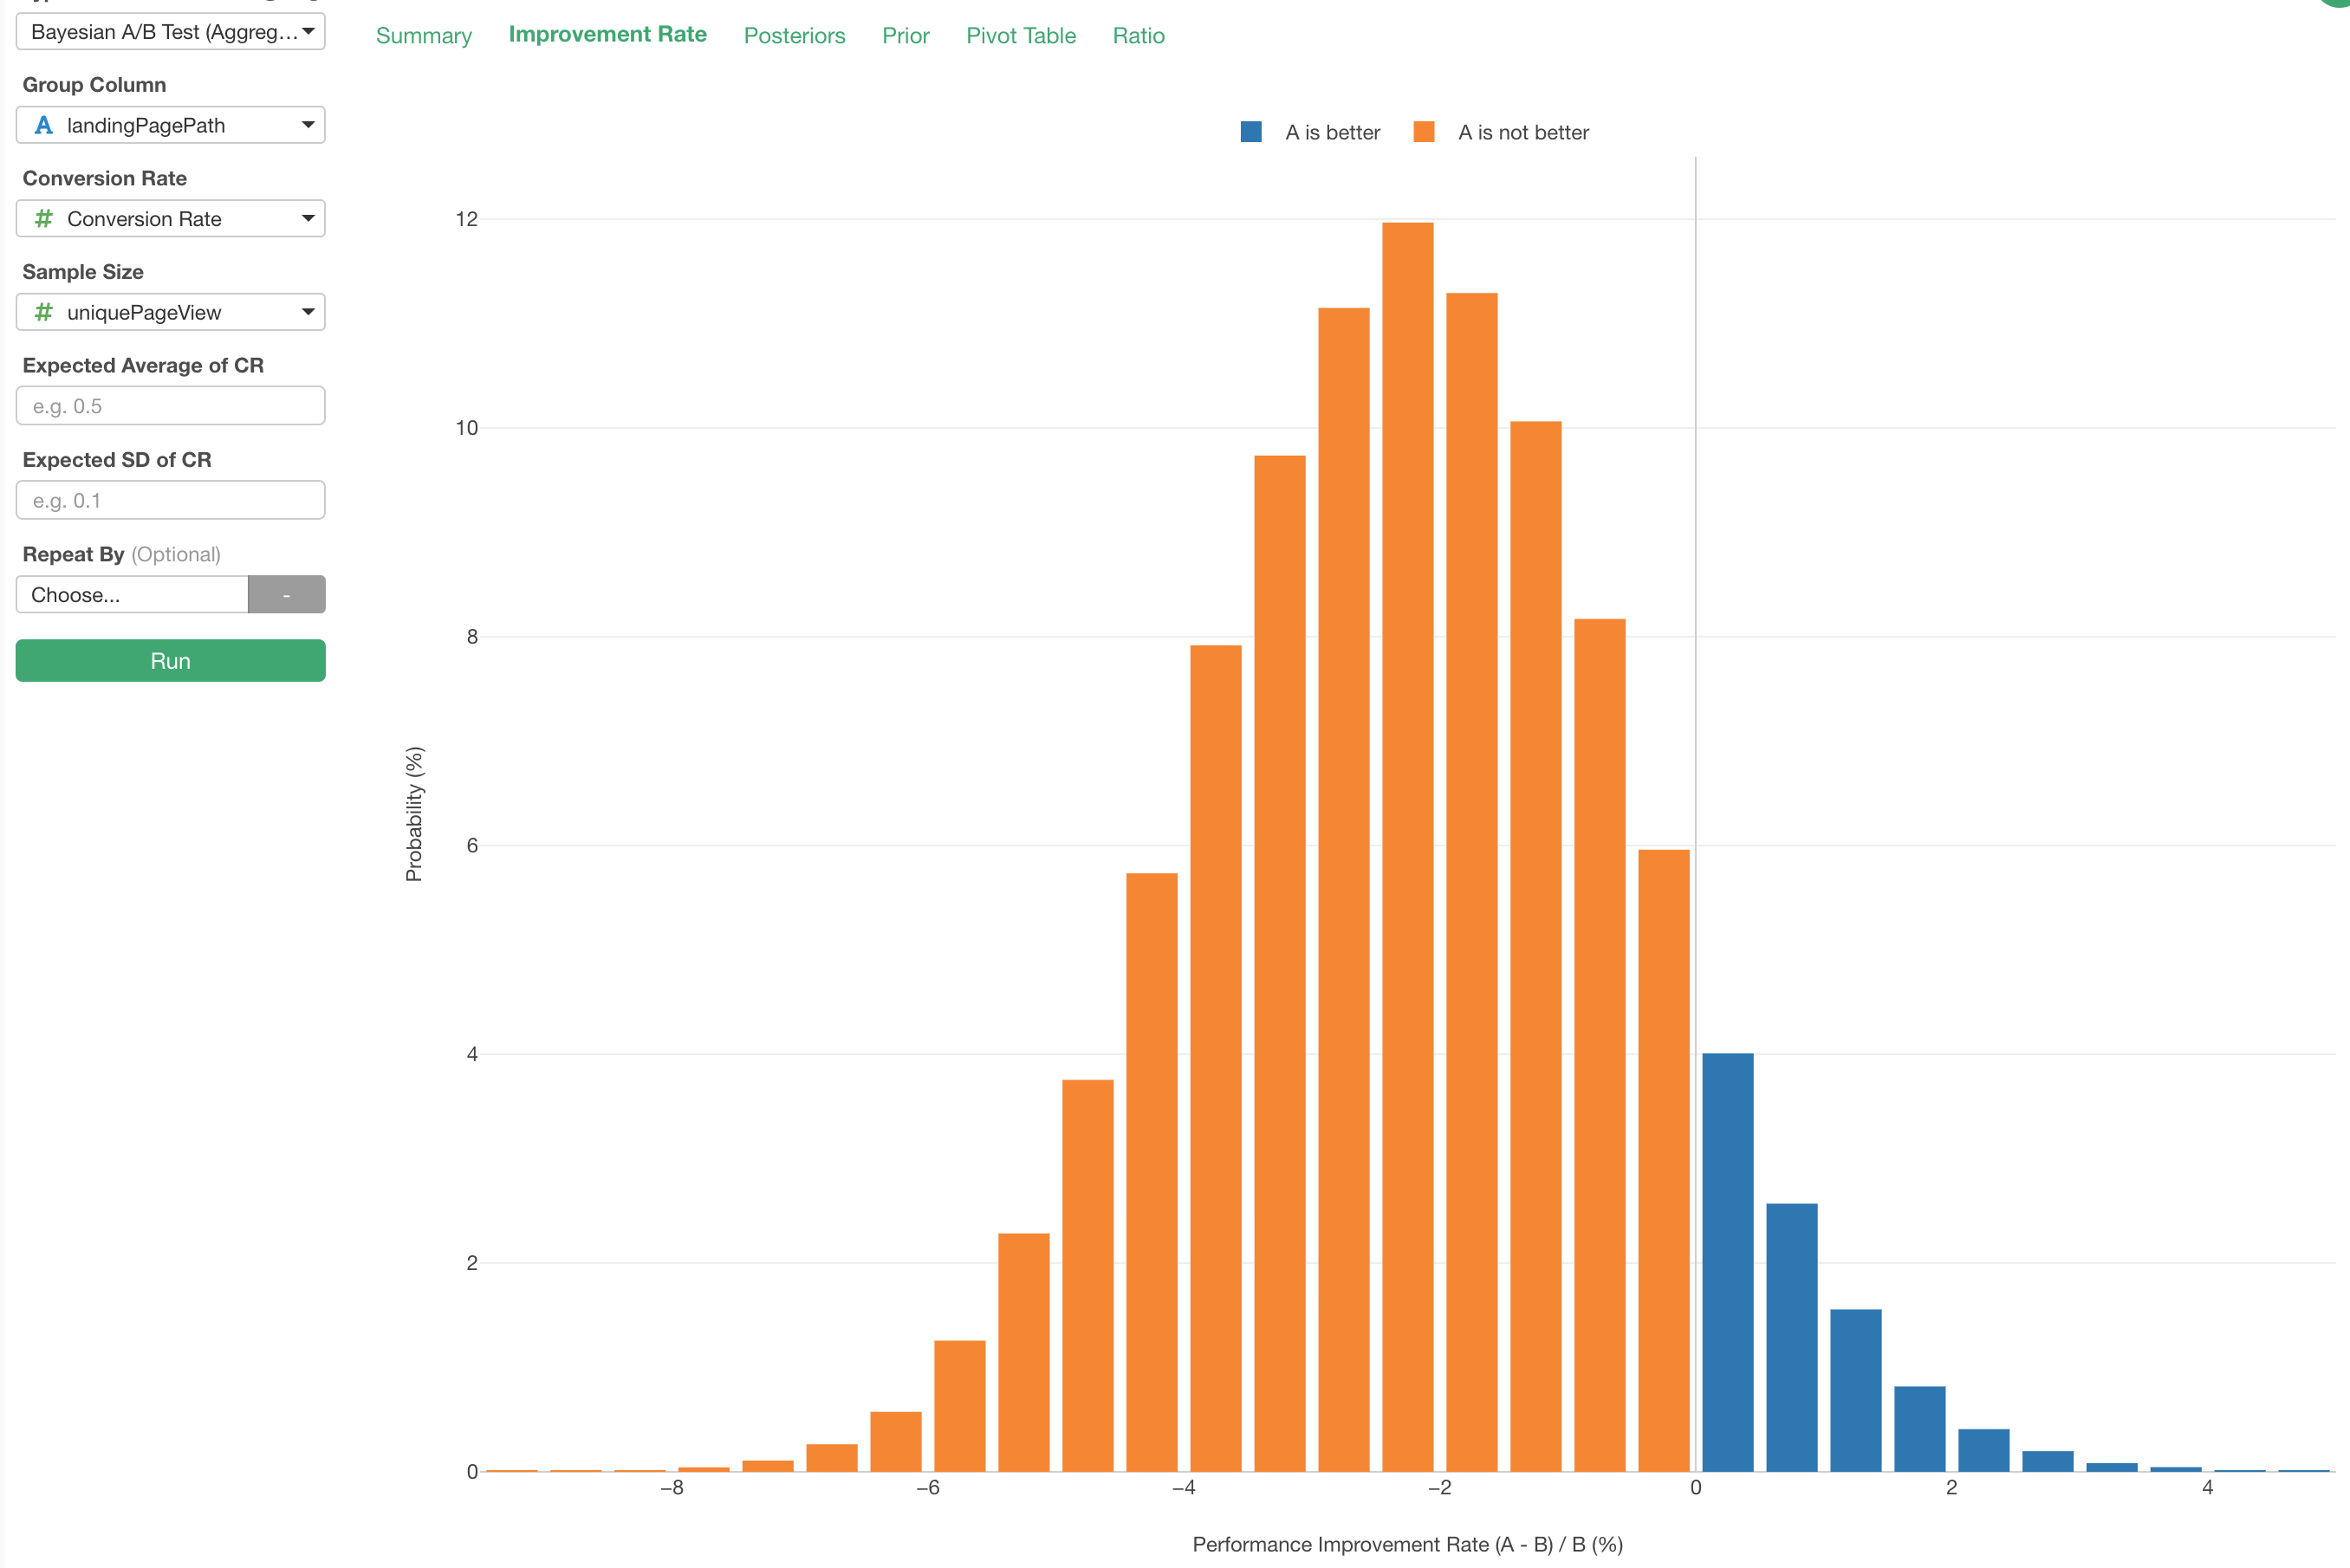
And you can read each bar as the probability of the performance improvement rate. For example, to interpret an orange bar that the pink arrow is pointing to below, we can say “A is 1.75% (X-axis) worse than B and the probability of that is 11.29%.”
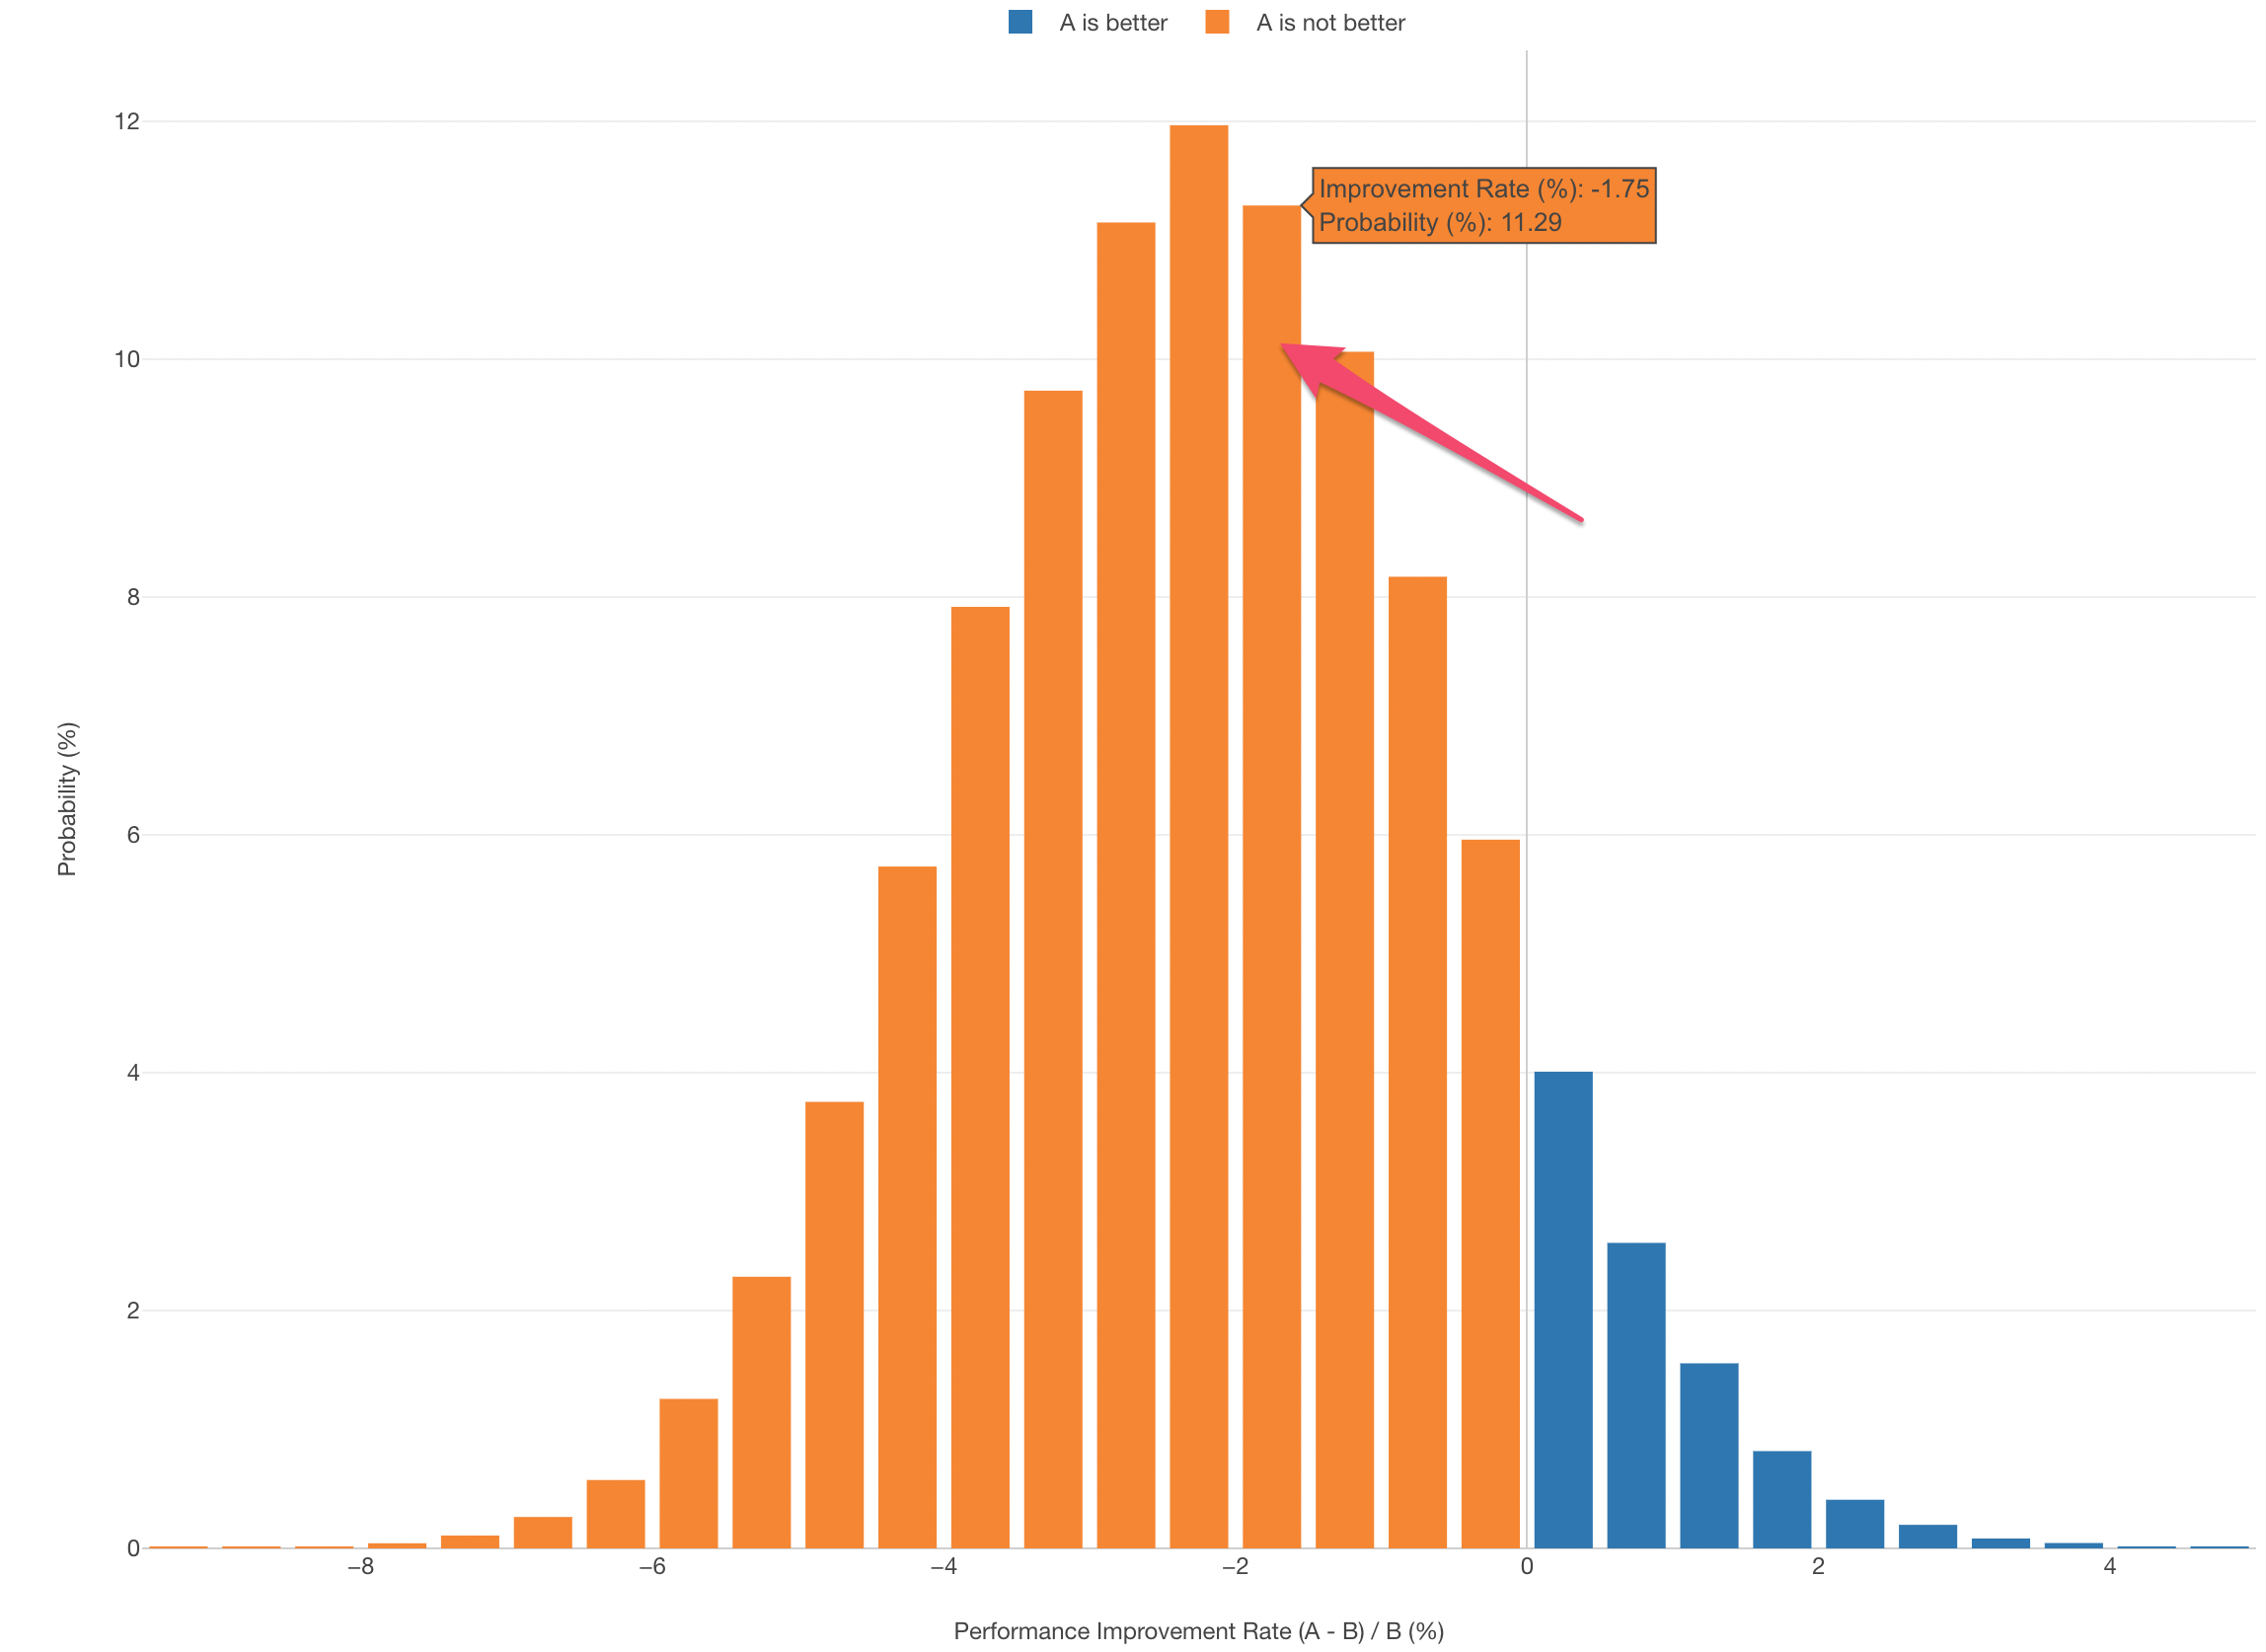
And the ratio of the entire orange area against all (and the ratio of the blue against all) is the number presented under 'Chance of Being Better' column in the summary view above.
Bayesian A/B Test Advantages and Background
Advantages
The immediate advantage of the Bayesian A/B Test is that we can understand the result more intuitively than the frequentist methods like Chi-Square Test. This means that it’s easier to communicate with business stakeholders.
Another advantage is that you don’t have to worry too much about the sample size when you evaluate the result. You can start evaluating the result from the first day (or maybe even the first hour) by reading the probability of which one between A and B is better than the other.
Of course, it would be better to have enough data size, but it’s much better to be able to say, for example, “A is better than B with 60% probability” than “We don’t have enough data yet so we can't tell you anything.”
Why has it not been always Bayesian?
So the Bayesian approach sounds great for businesses. But this approach is still not so popular compared to the other approaches including Chi-Square Test.
One big reason is that the Bayesian approach takes a lot of calculations by simulating many variations. This was hard in the old days with low spec computers, but with today’s modern PC with moderate computation power, this is no longer a problem.
Can we add the Prior?
There is one thing you want to know about Bayesian, and that is Prior and Posterior. The prior is basically the knowledge you have about the data before. For example, most likely you would know what would be your web site’s typical conversion rate like before you even start the testing. You might say something like between 15 to 20%.
The posterior is the updated knowledge after the real data start coming in. So it’s like the below.
Posterior = Data + PriorCan we add Prior to Bayesian A/B Test?
Yes!
The above example was done without setting any prior information explicitly. If you don’t give the prior information, it assumes no prior knowledge on the distribution, and use the uniform distribution as the prior. And this would be ok when you have enough data size. But that might not be the case if you are still in the first few days where the result does not necessarily represent your general trend.
To give the Prior, you can provide the average and the standard deviation of the past conversion rates so that Exploratory will calculate the prior internally for you.
There are the Frequentist way and the Bayesian way to evaluate the A/B Test result. Which one to pick depends on your needs and it’s not like one is better than the other.
But, if you want to monitor and evaluate the result in real time and need to communicate the result with those without a statistical background better, you should give Bayesian A/B Test method a shot!