An Introduction to Exploratory Notes
In Exploratory, you can summarize insights gained from created charts and analytics in the form of a “Note.” This note introduces the usage and features of the Note function.
Creating a New Note
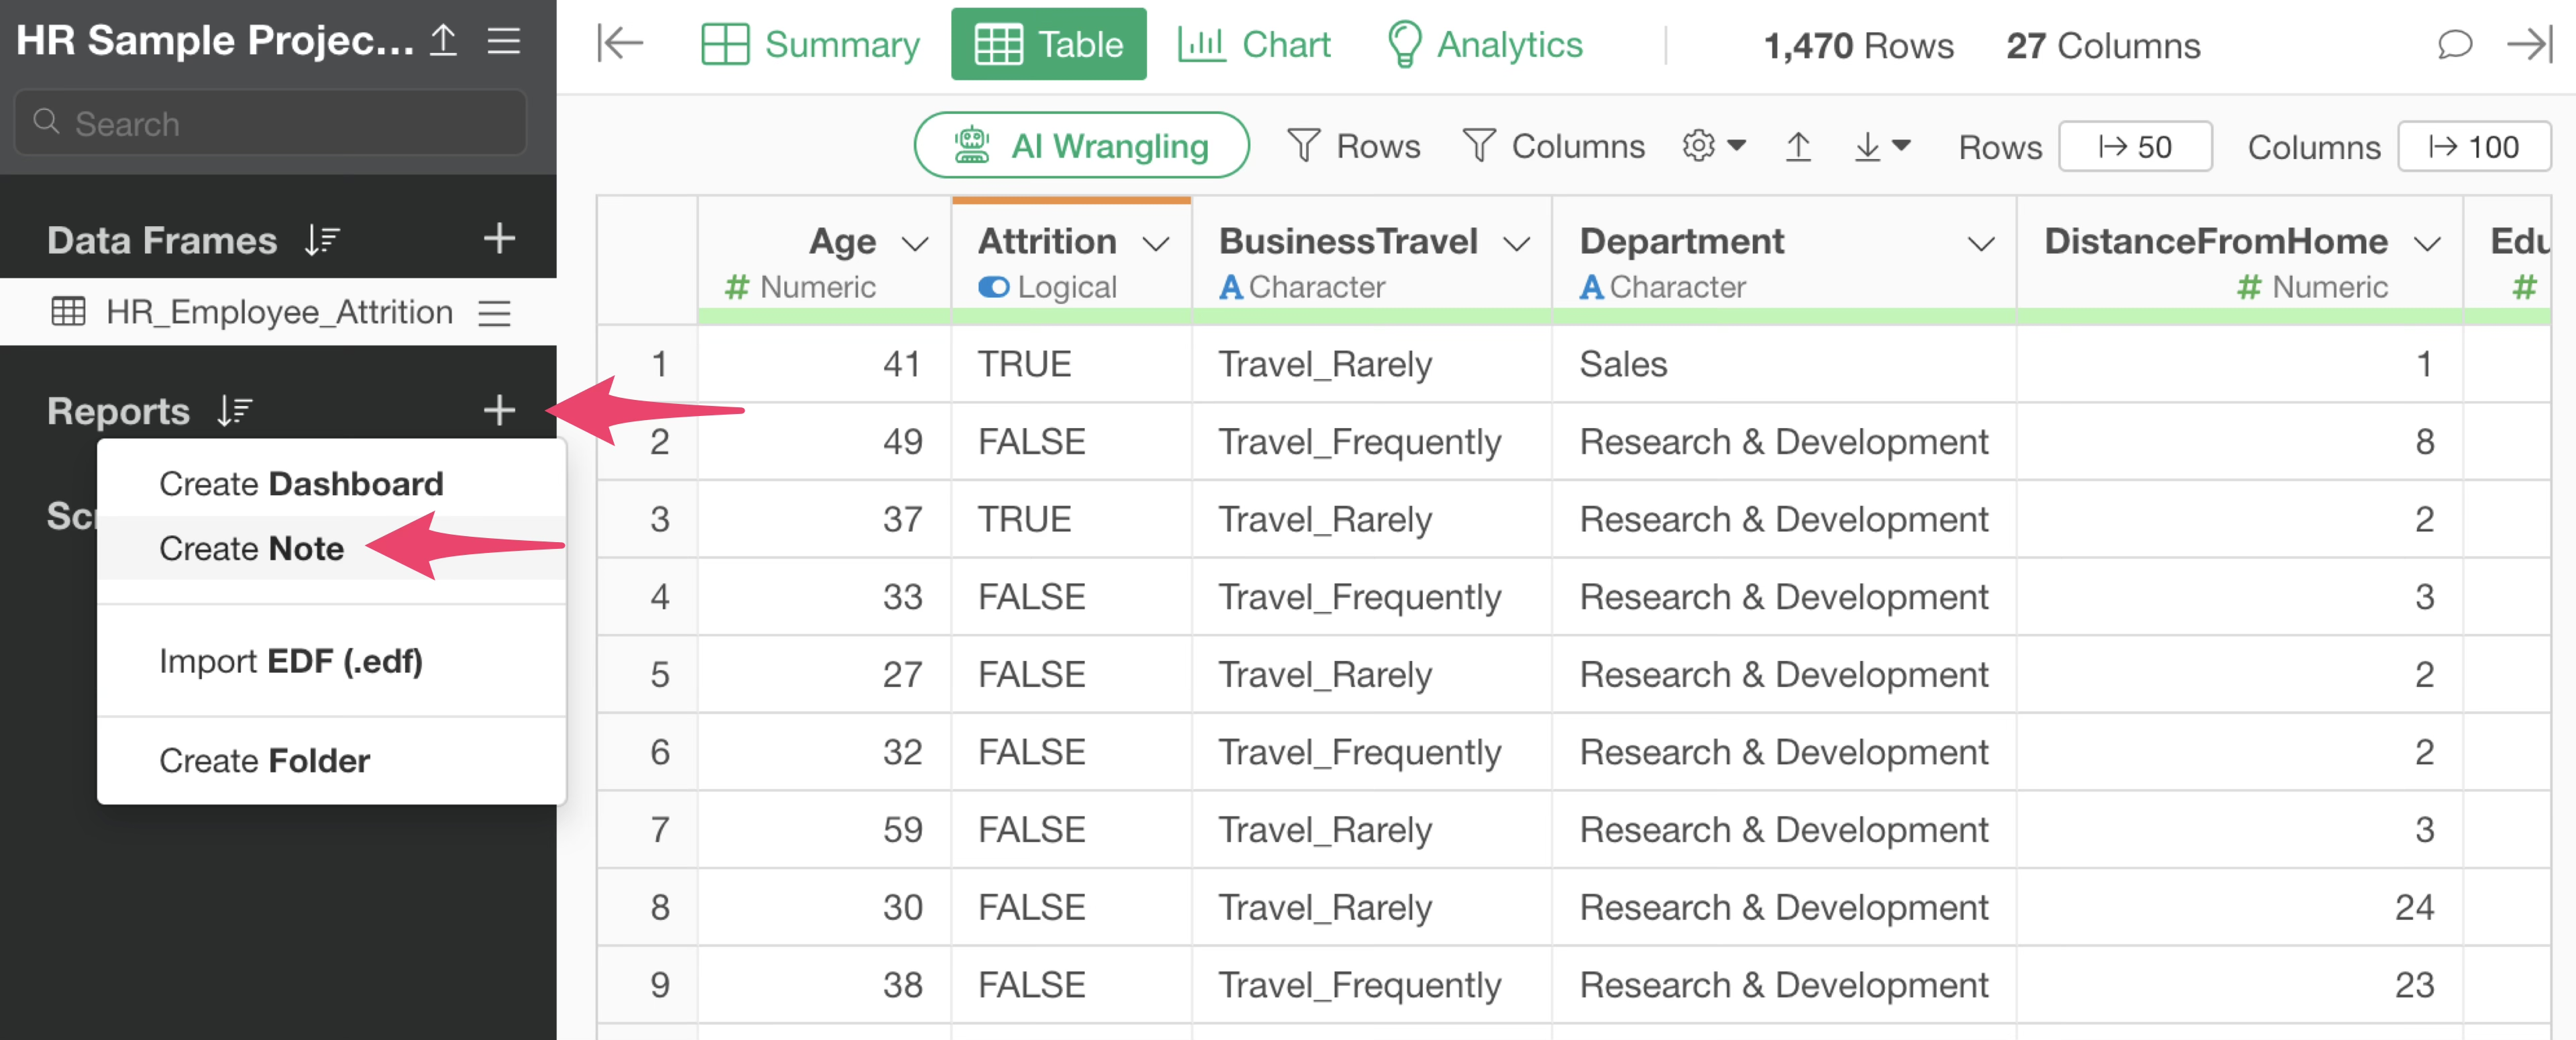
To create a note, select “Note” from the plus button in the Report section.
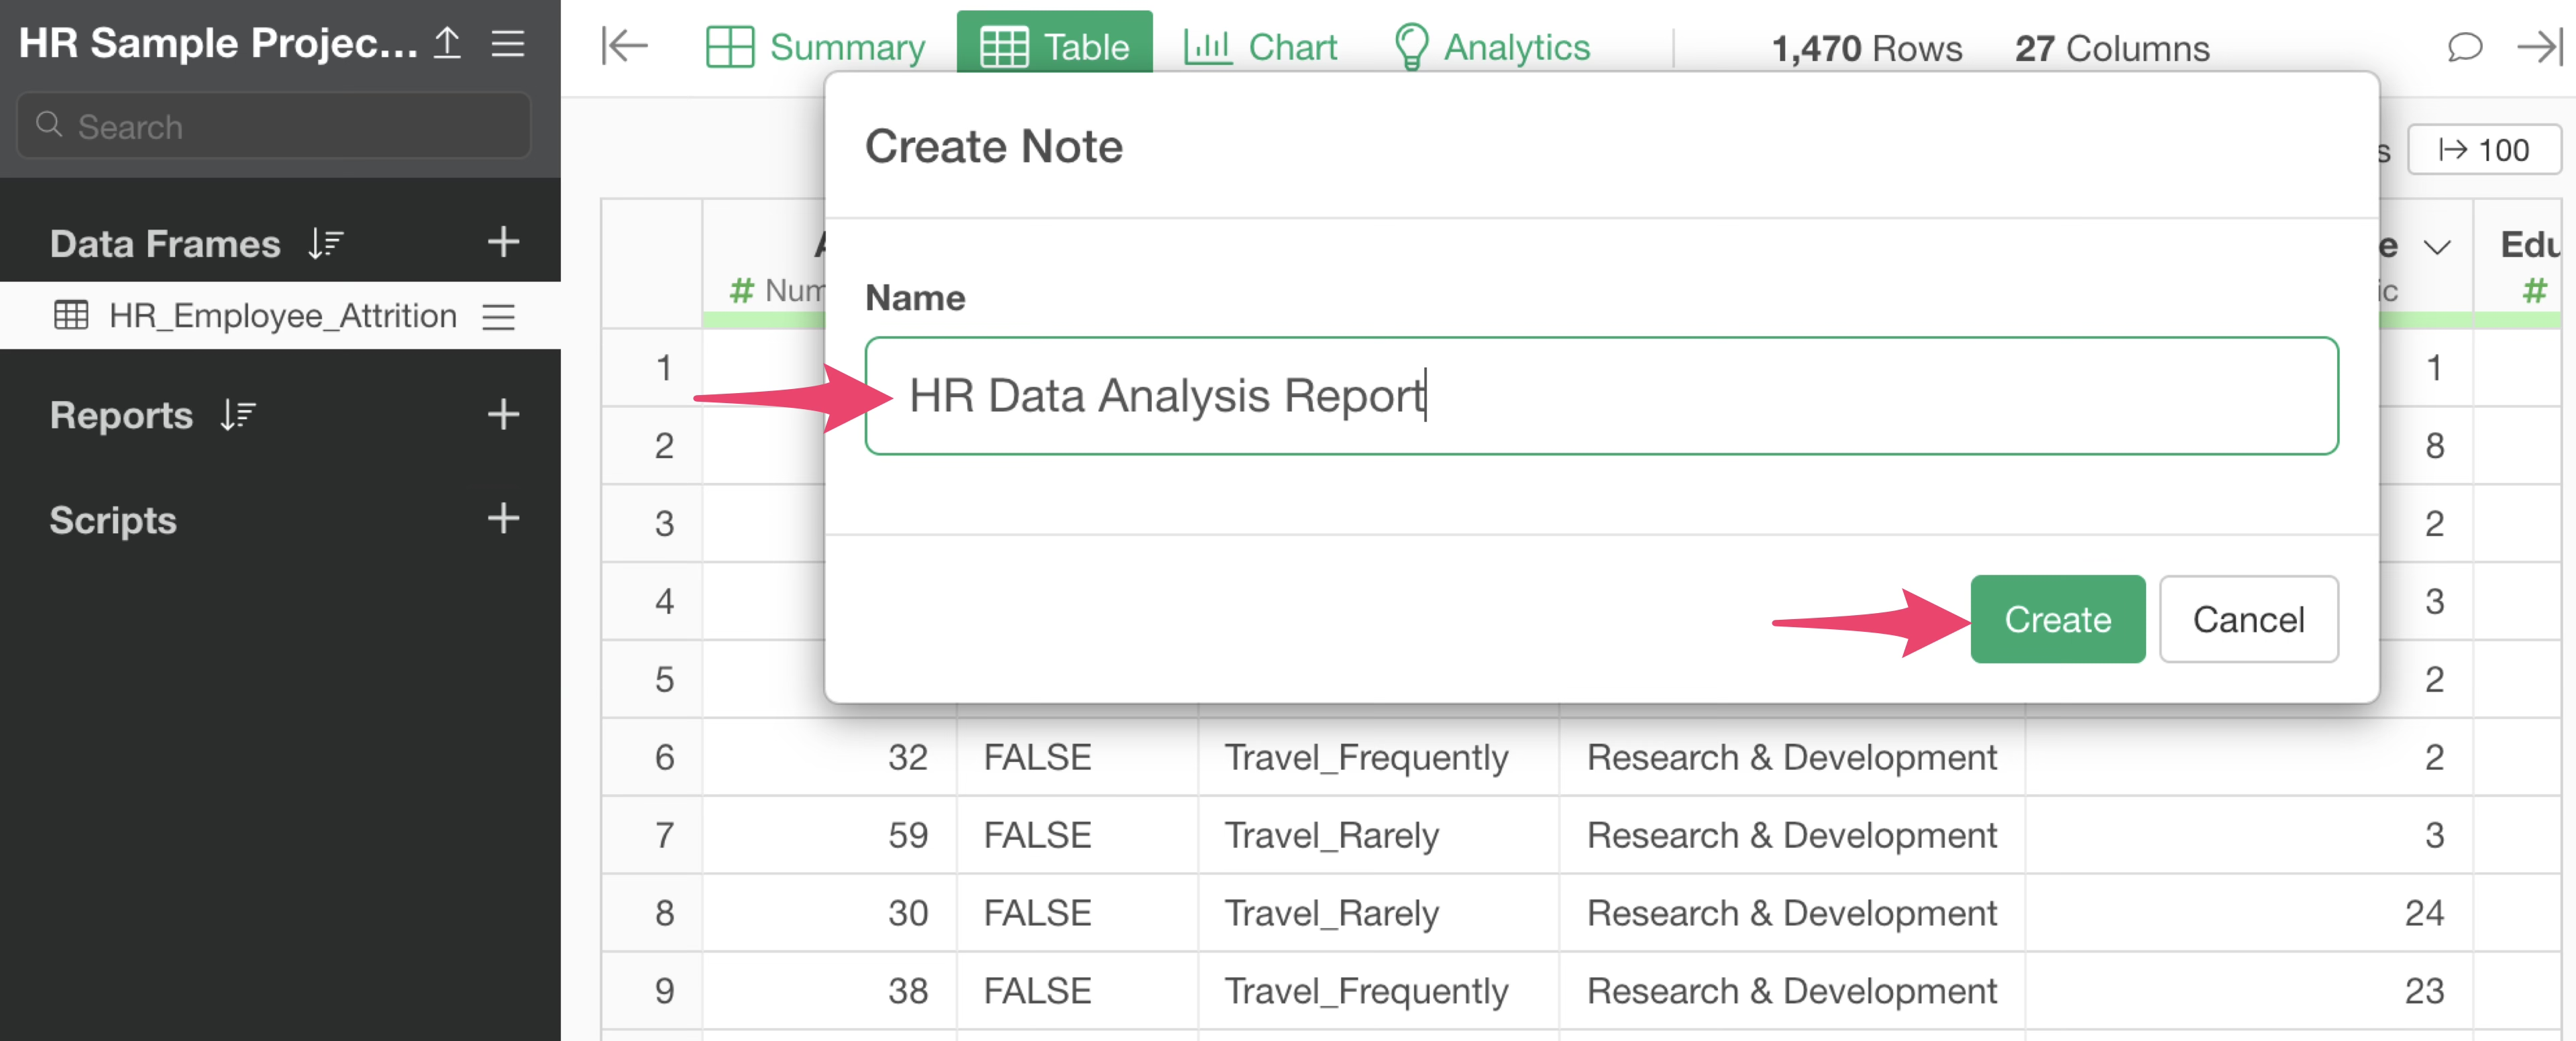
Set an arbitrary name for the note and click the “Create” button.
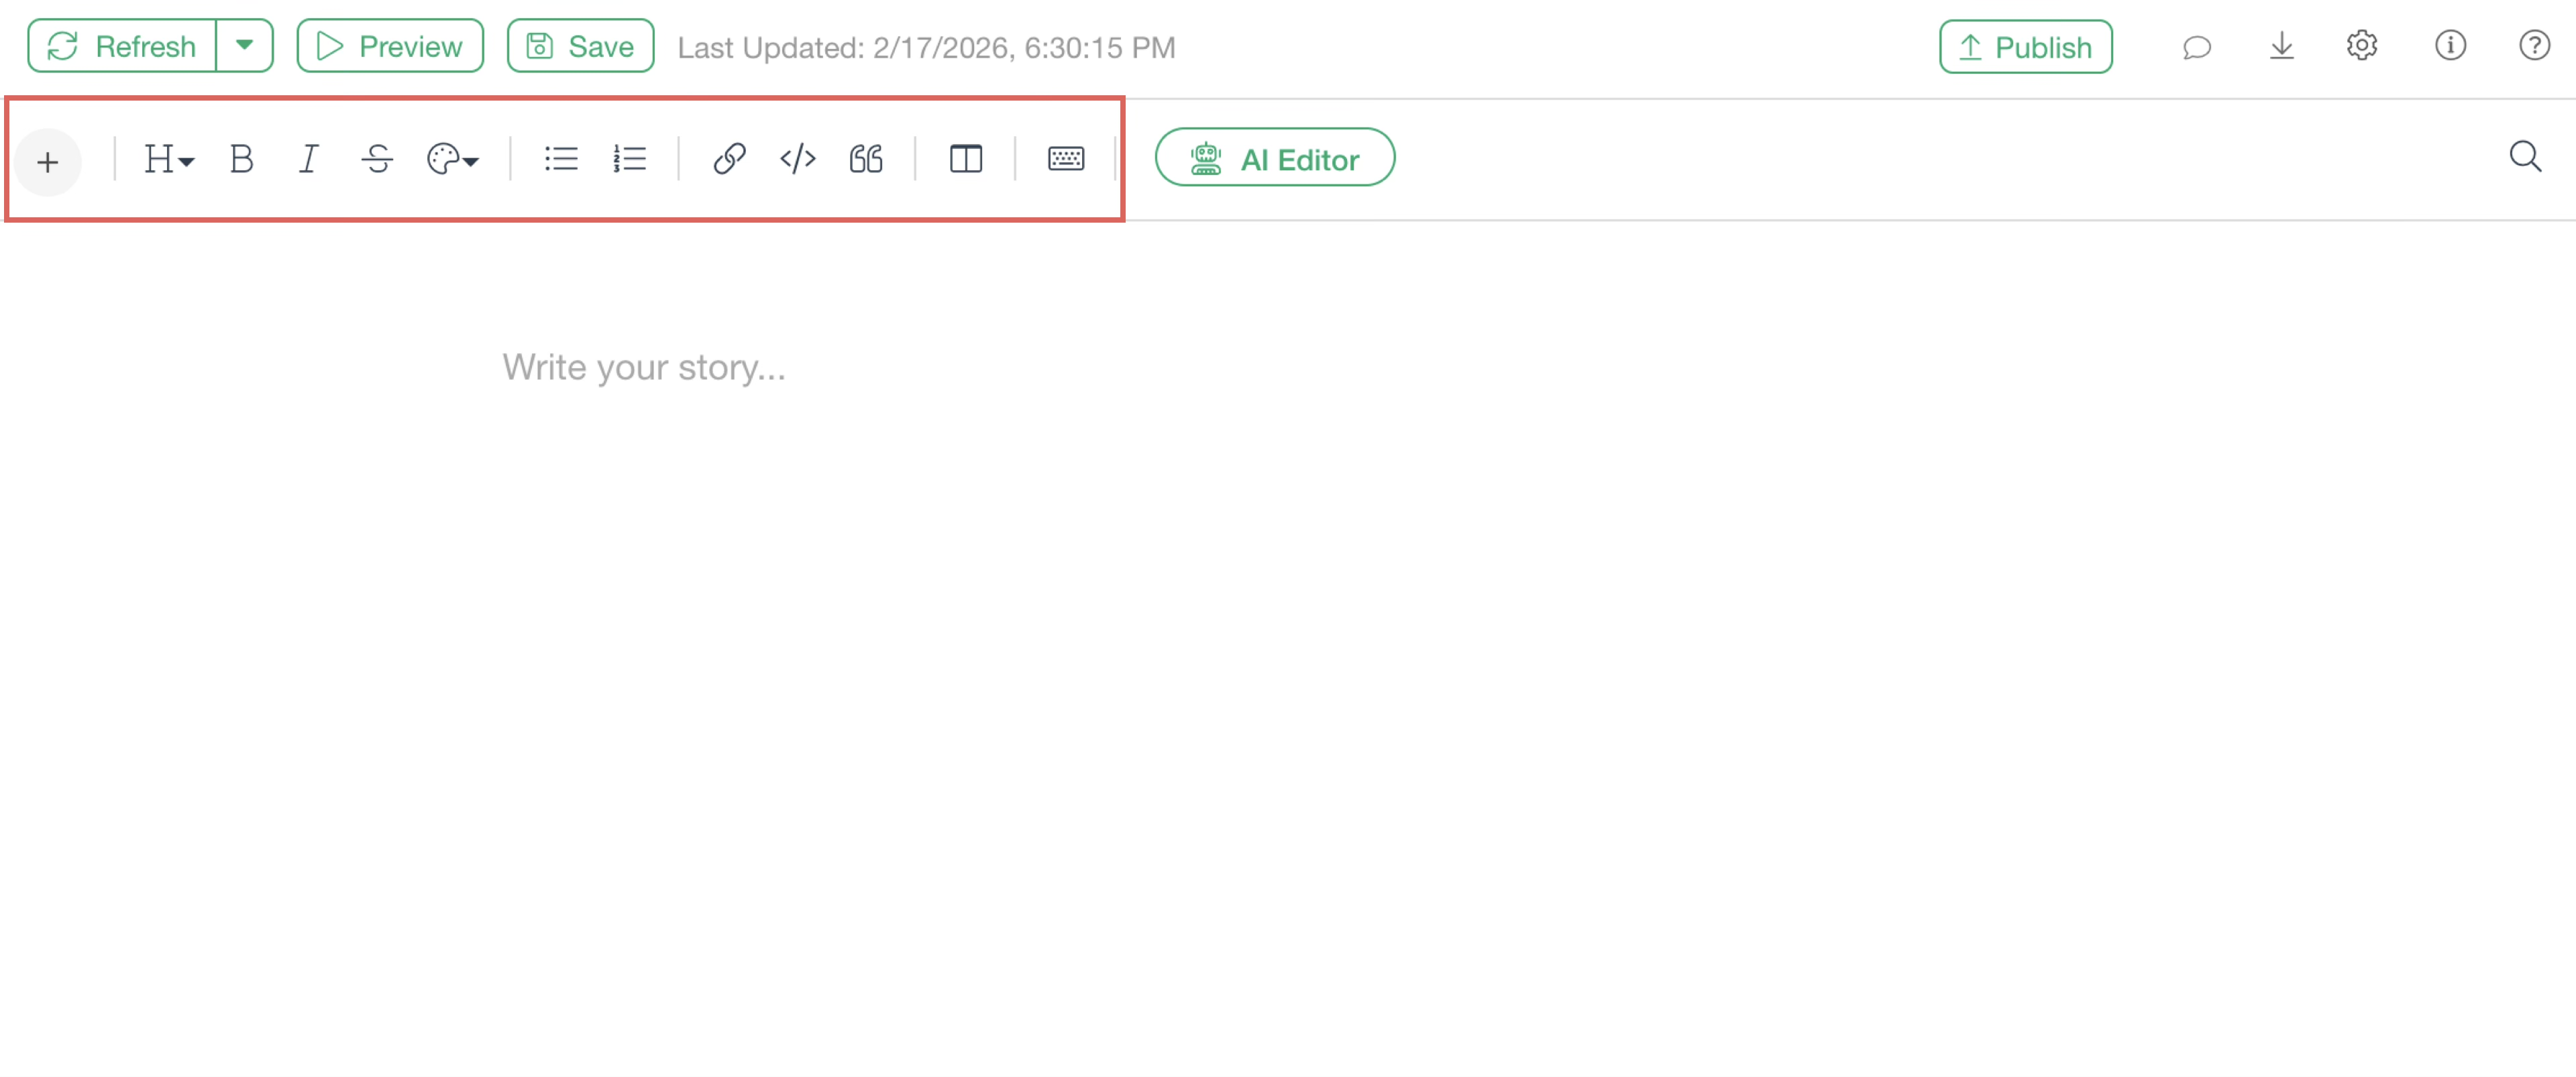
The note editing window will then open.
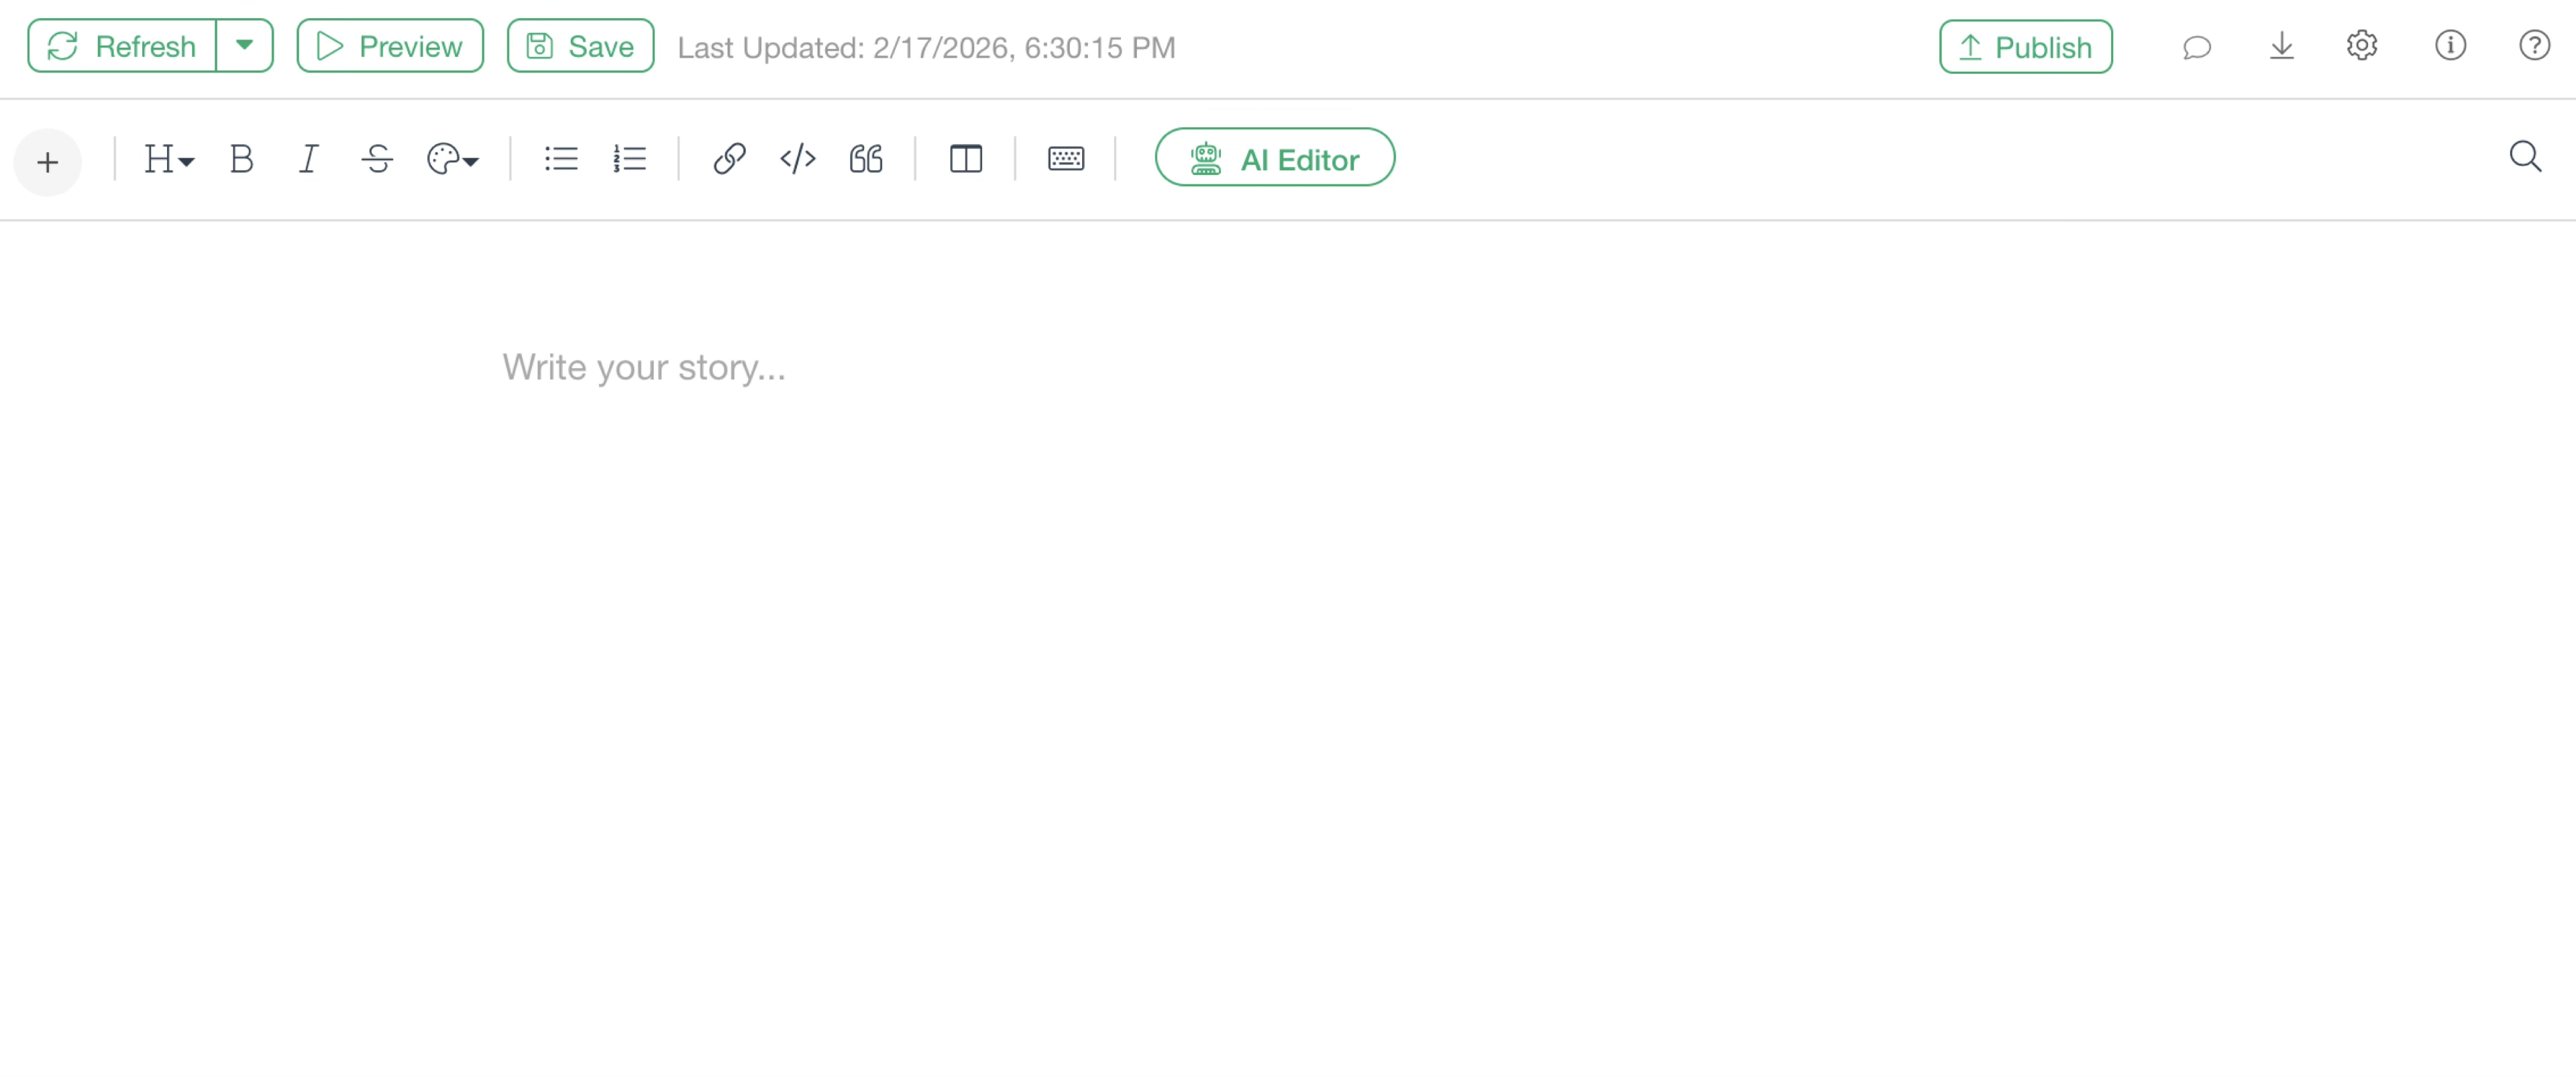
In a note, you can add charts, describe insights gained from them as text, and intuitively apply formatting using the toolbar.
Text Formatting
Headings
Entered text can be set as “Headings.”
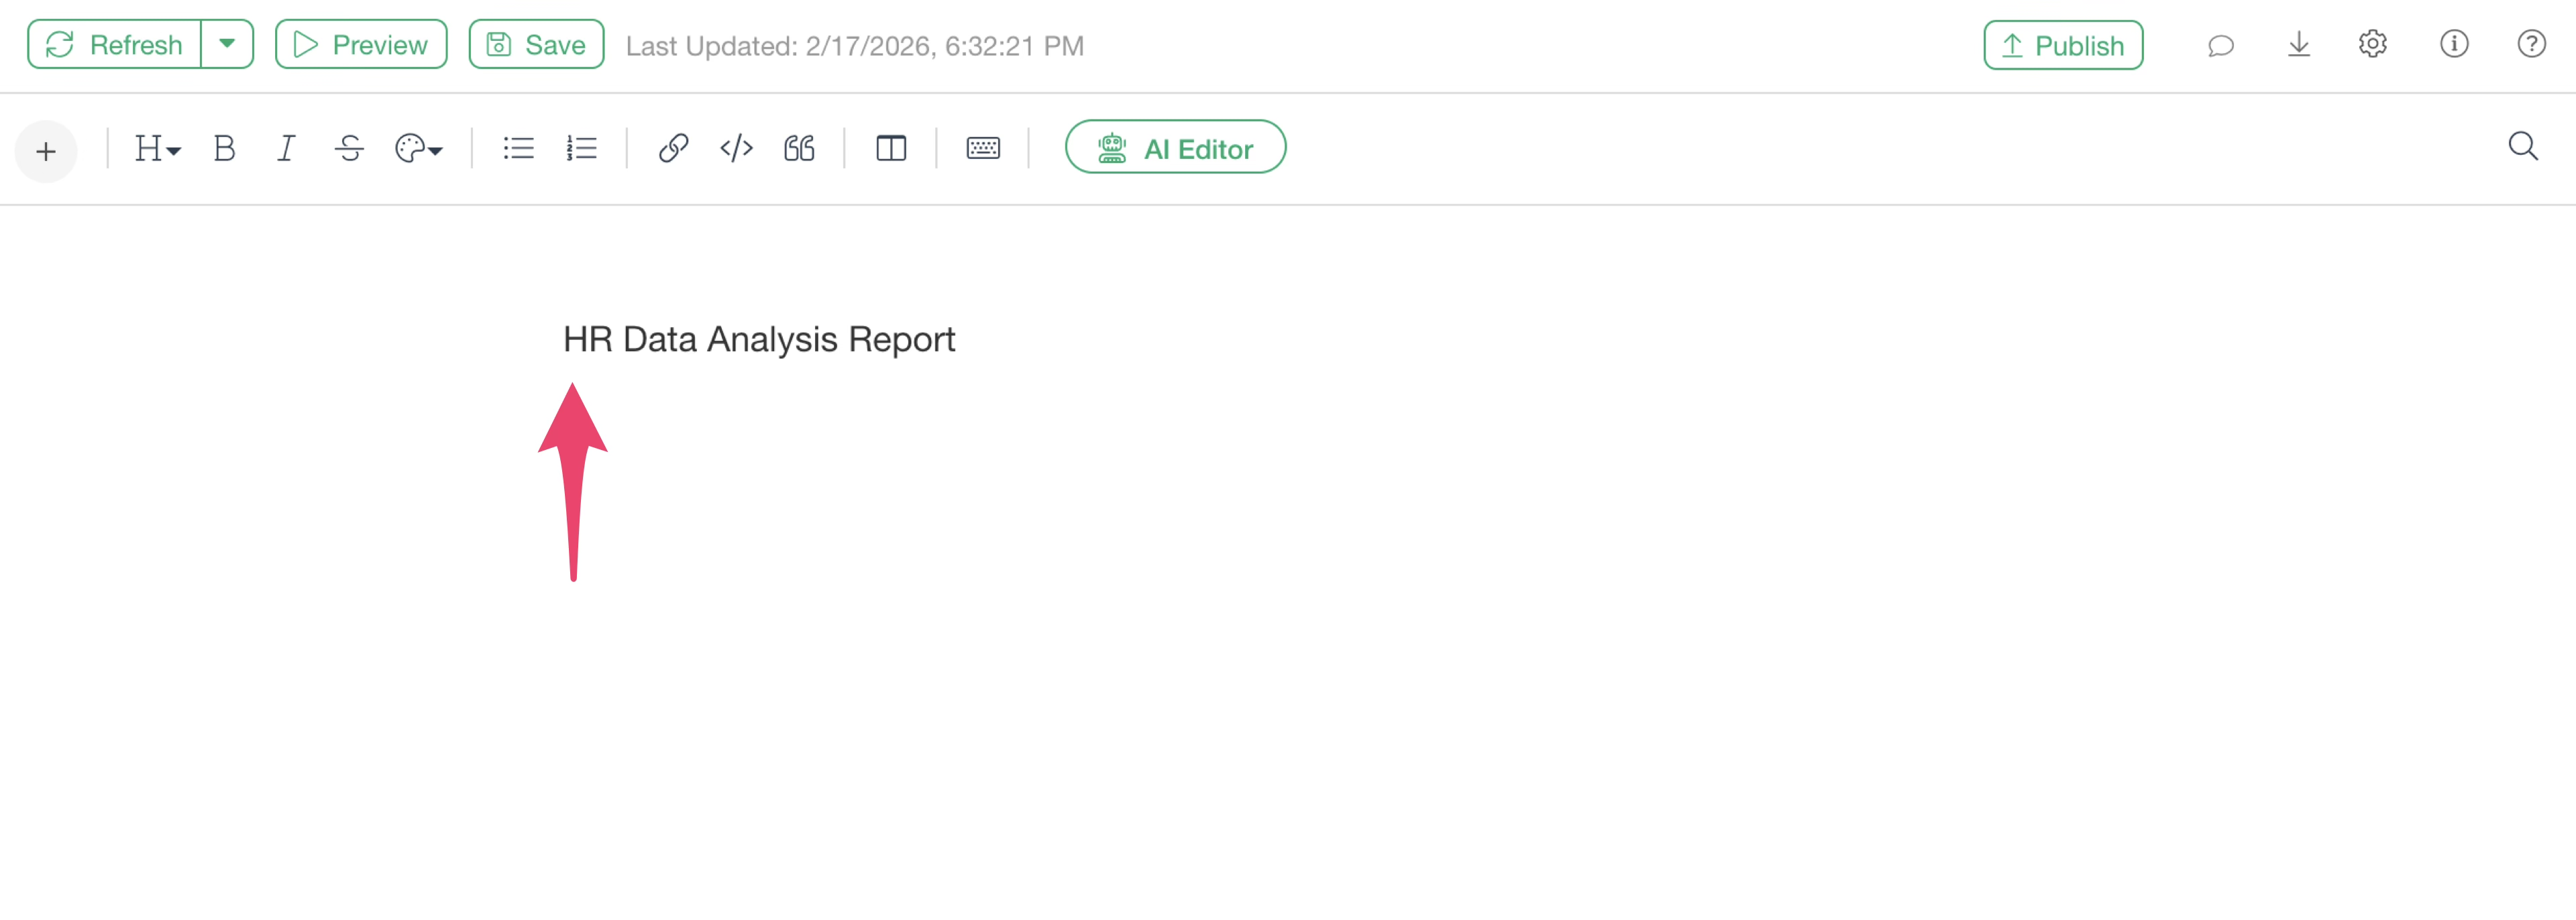
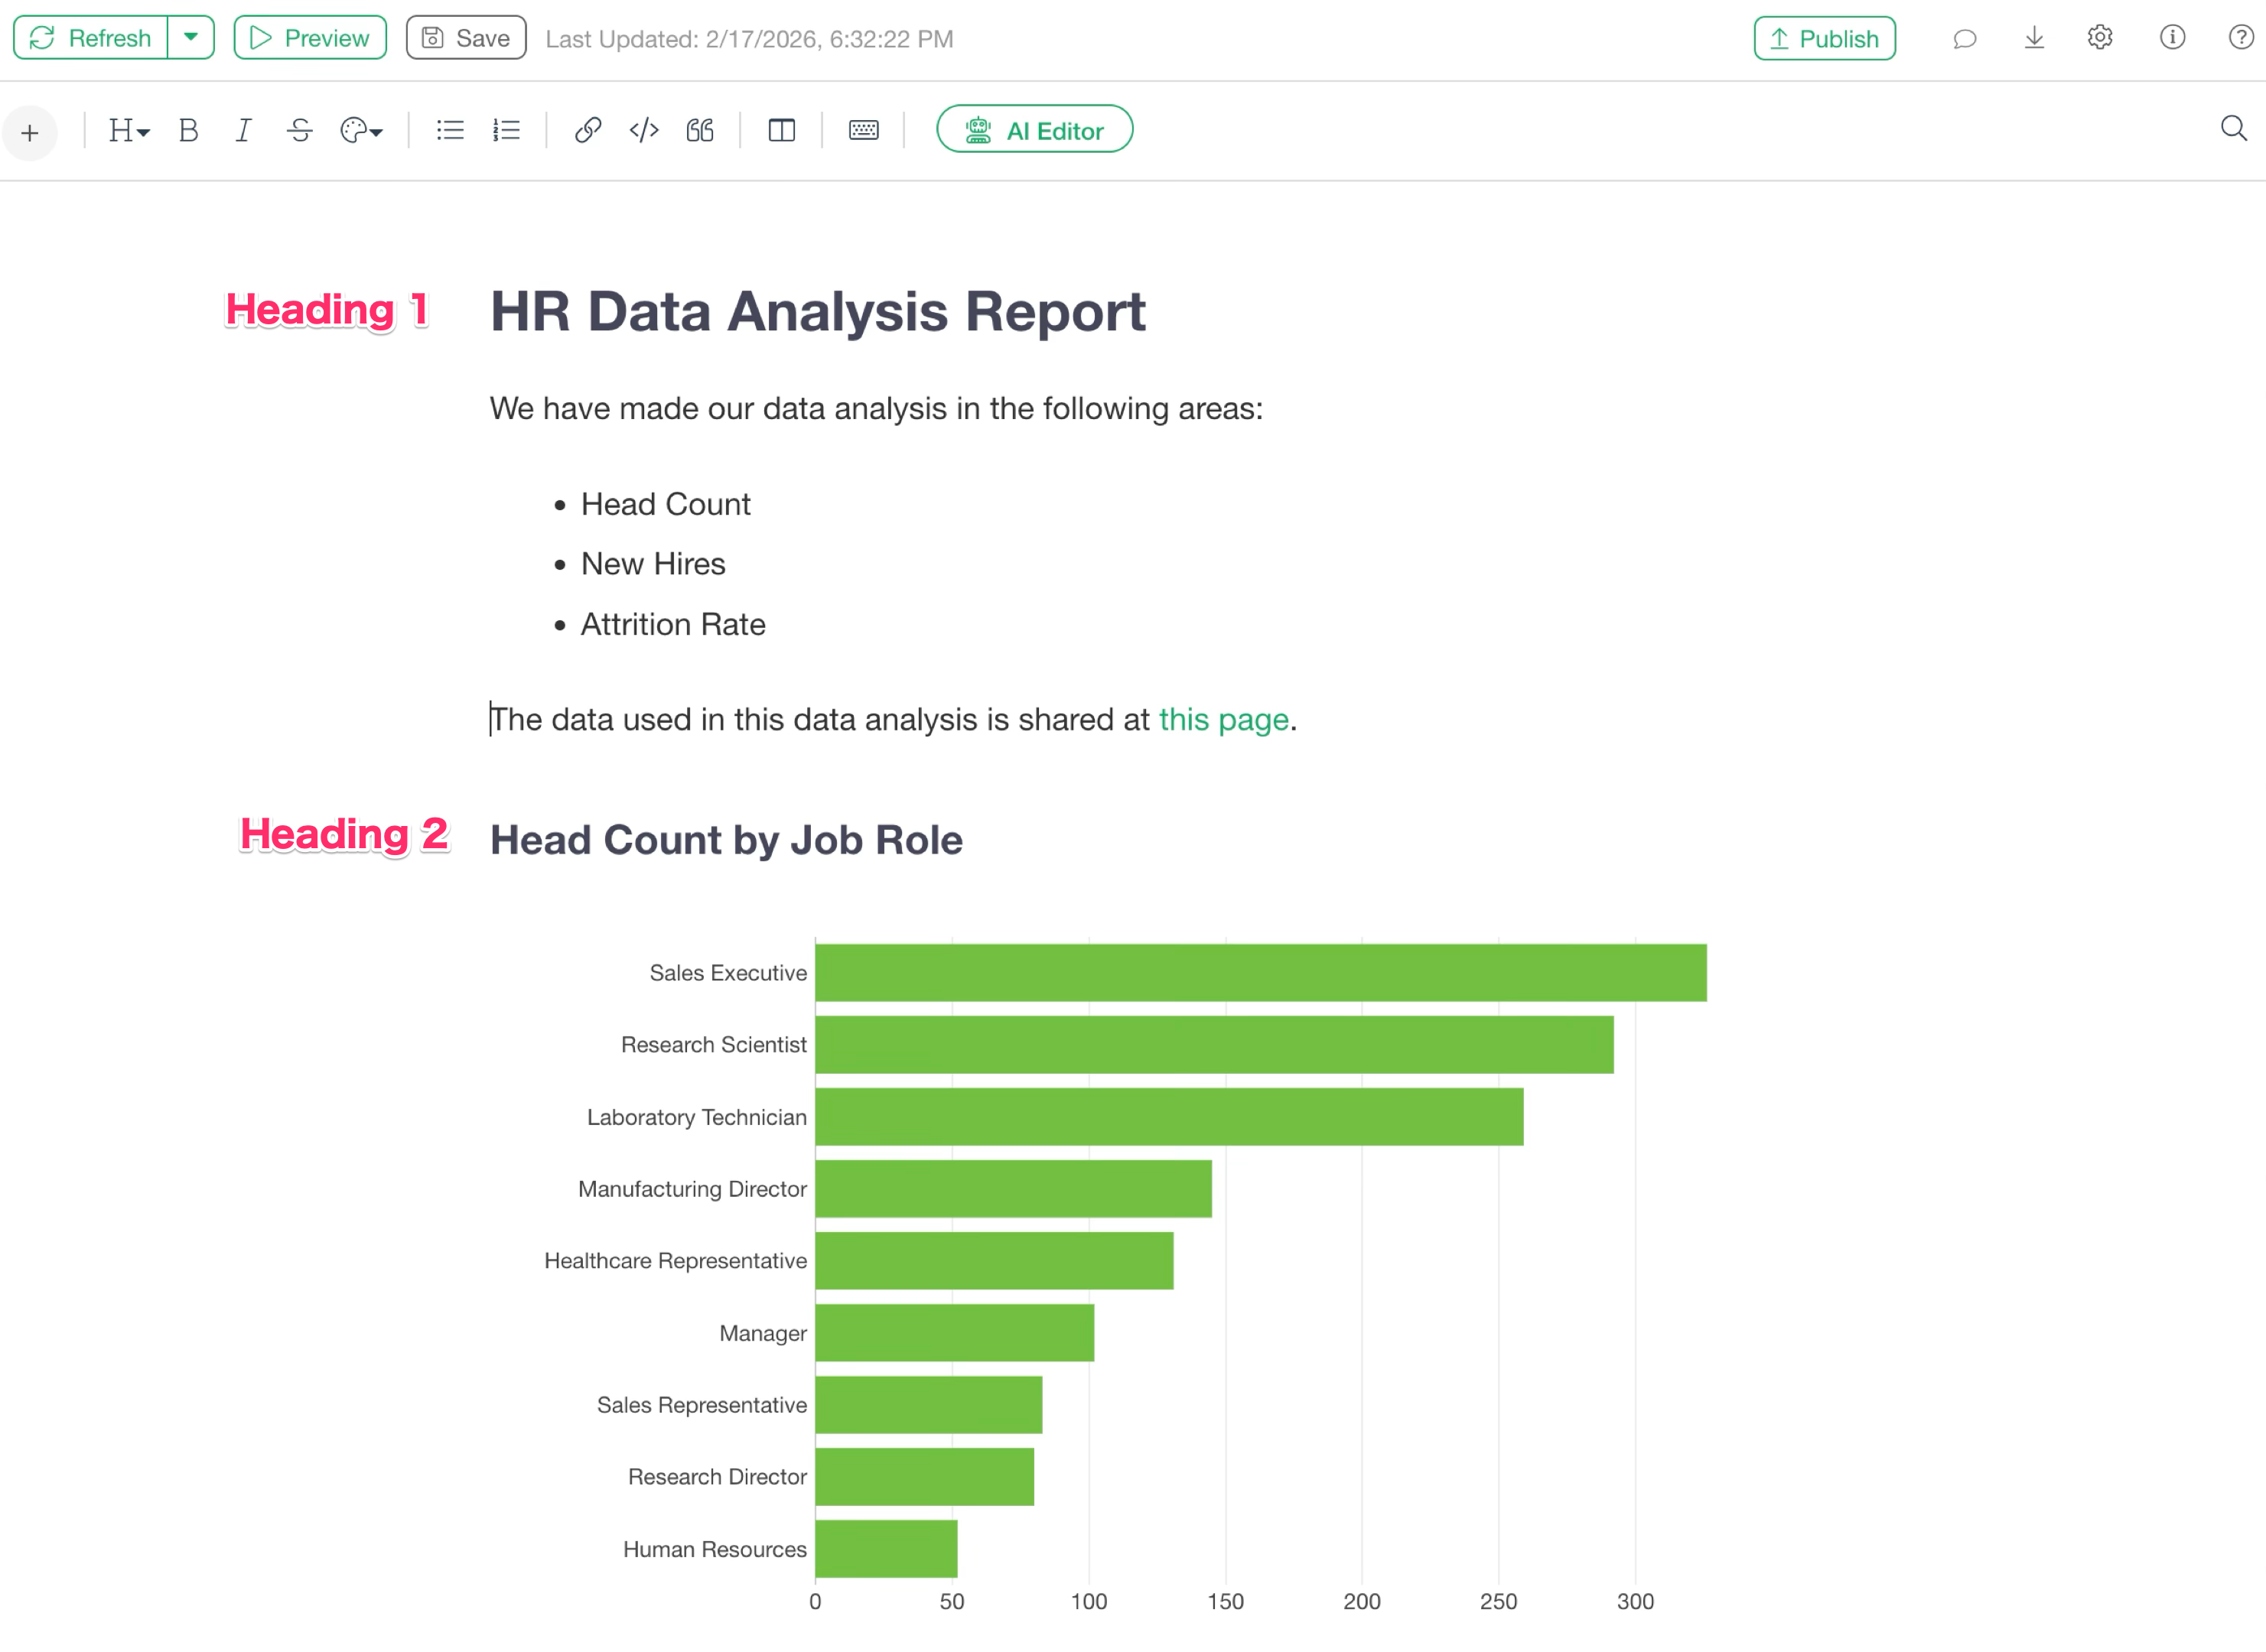
With the text you want to set as a heading selected, choose “Heading 1” from the “H” button on the toolbar.
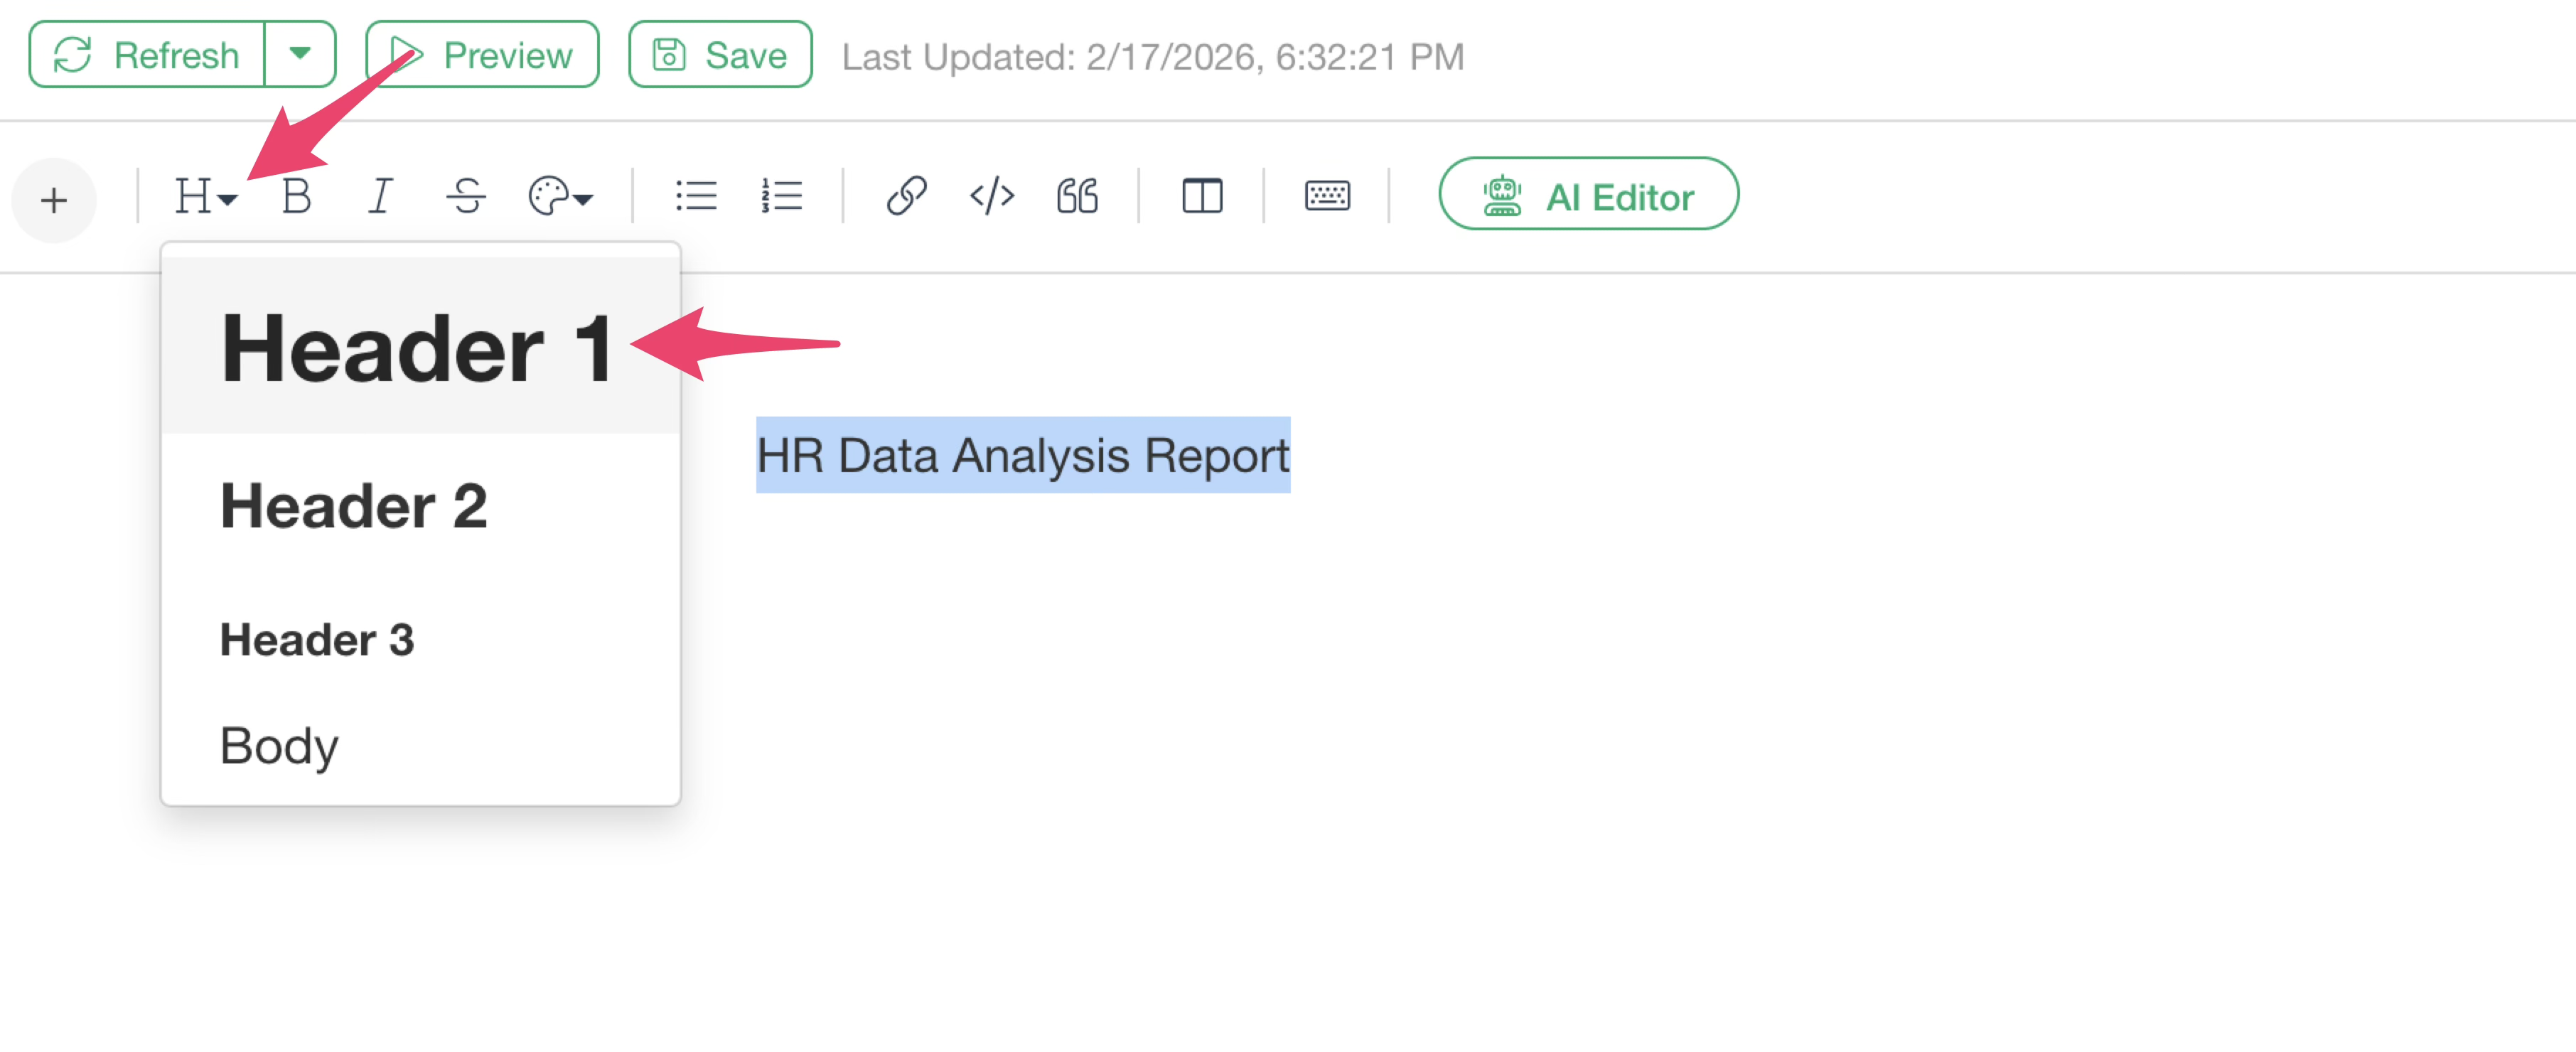
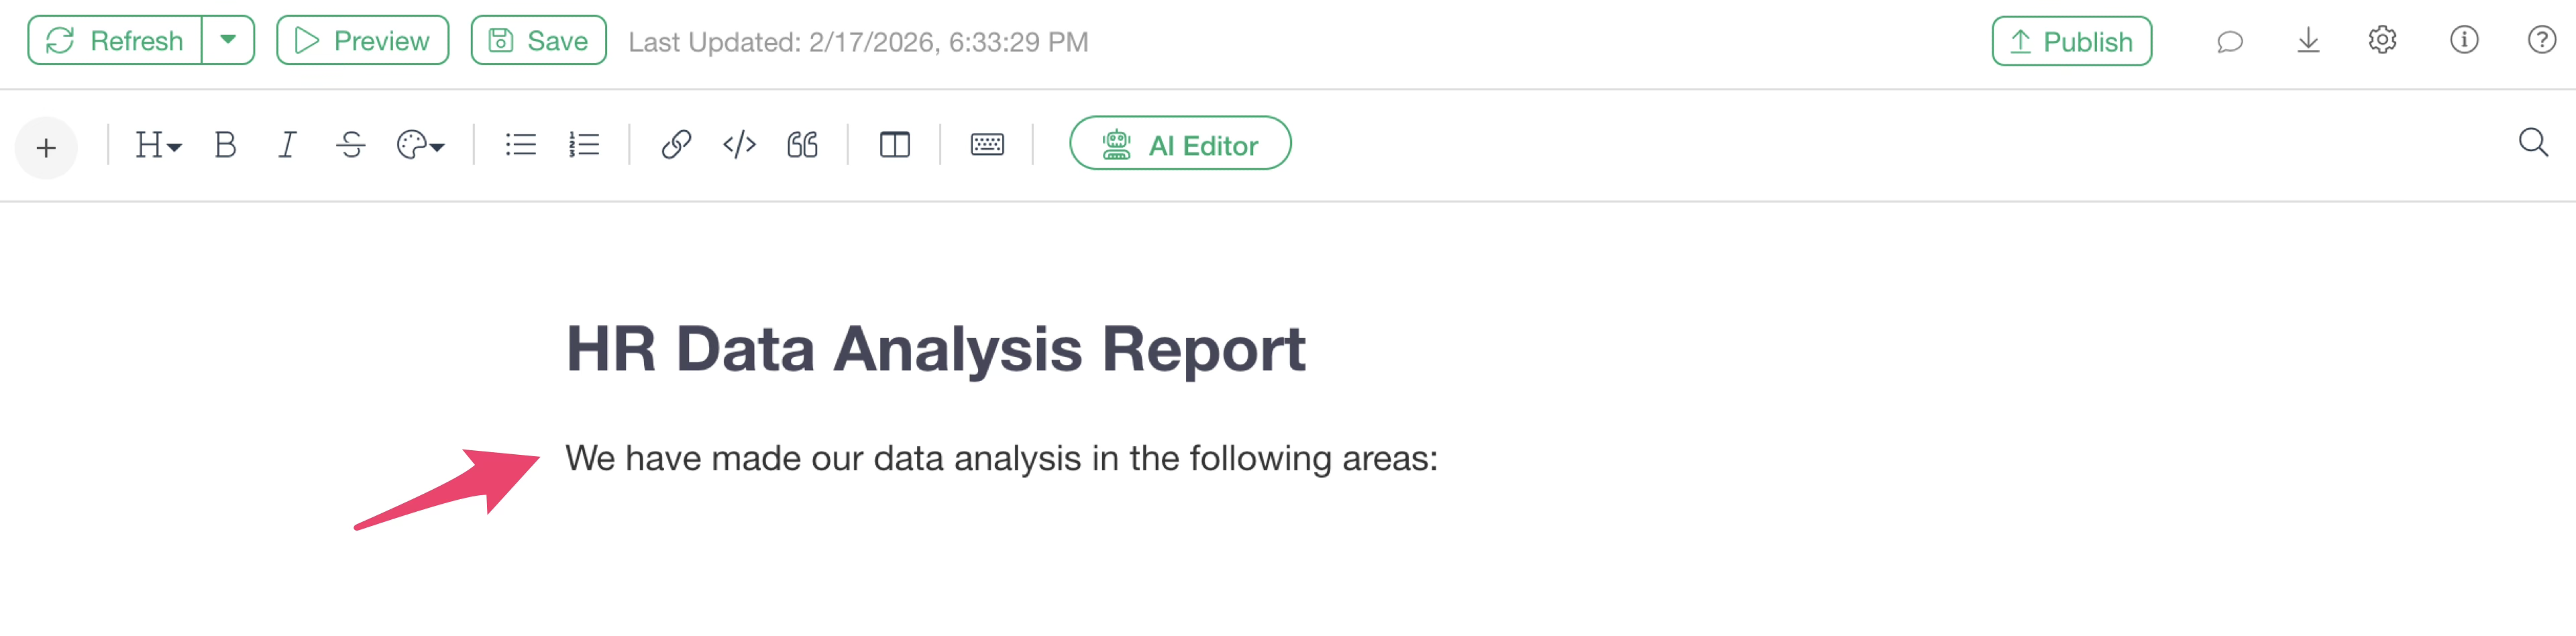
This allows you to enlarge the text you want to use as a title.
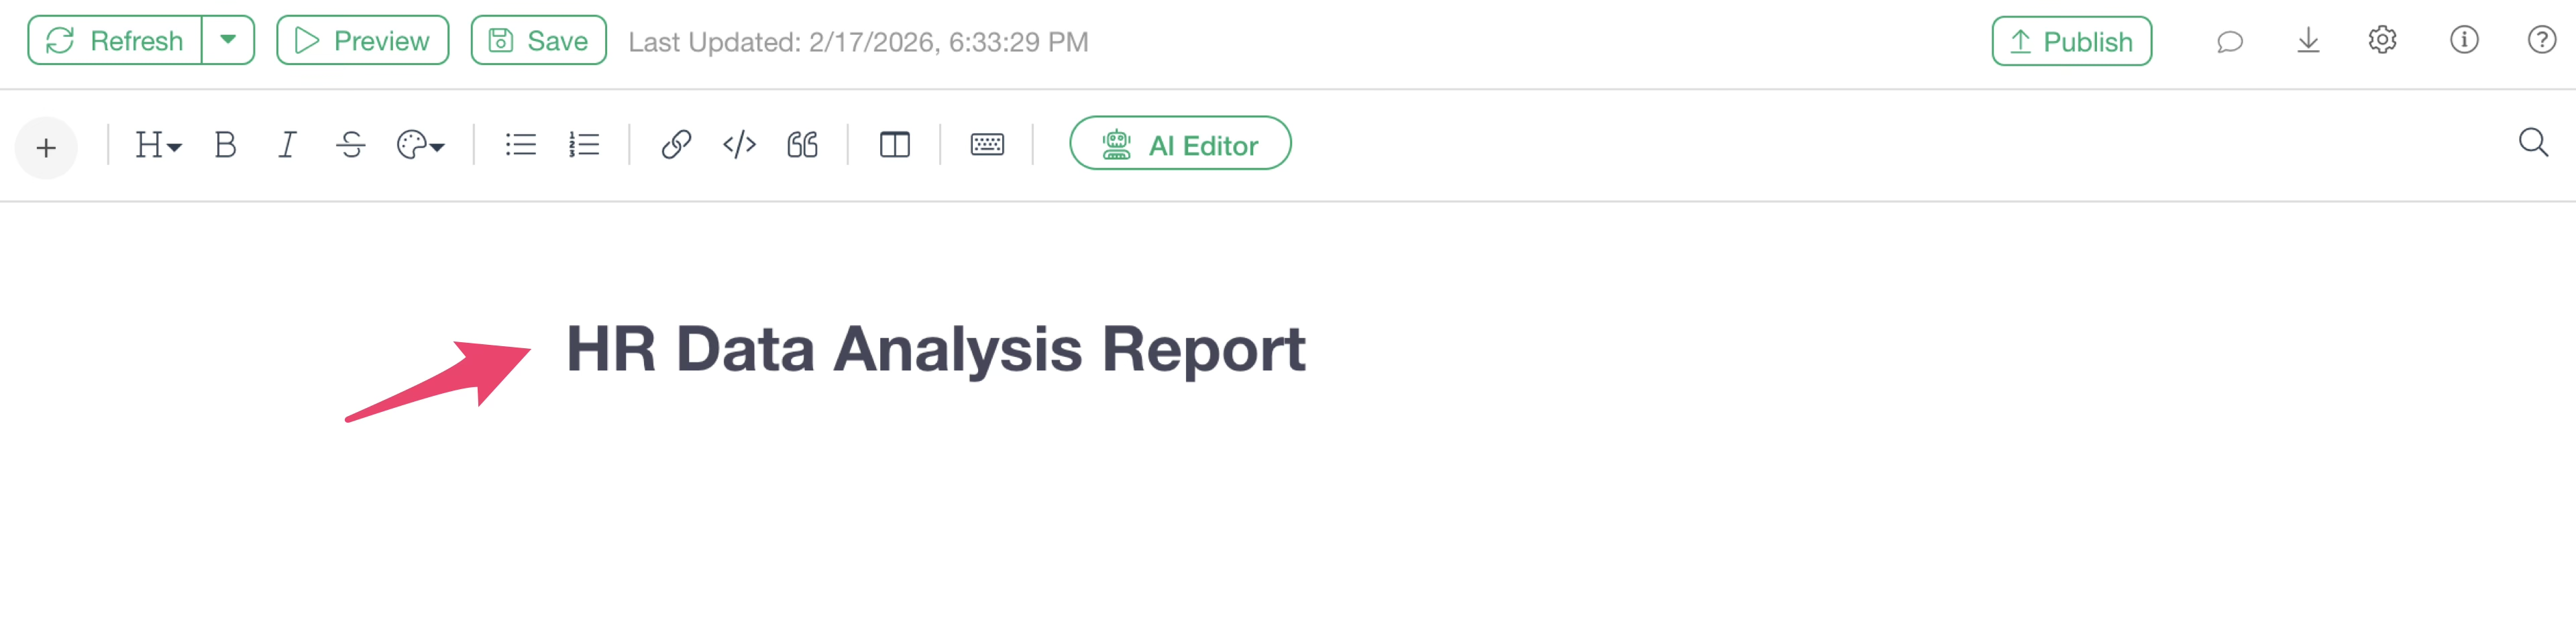
Below the title, you can enter text as the body to build the descriptive content of the note.
Note that as the heading number increases (Heading 1, Heading 2, etc.), the text size becomes smaller.
By the way, these headings are designed to be displayed as a table of contents in the final output.
Bullet Points
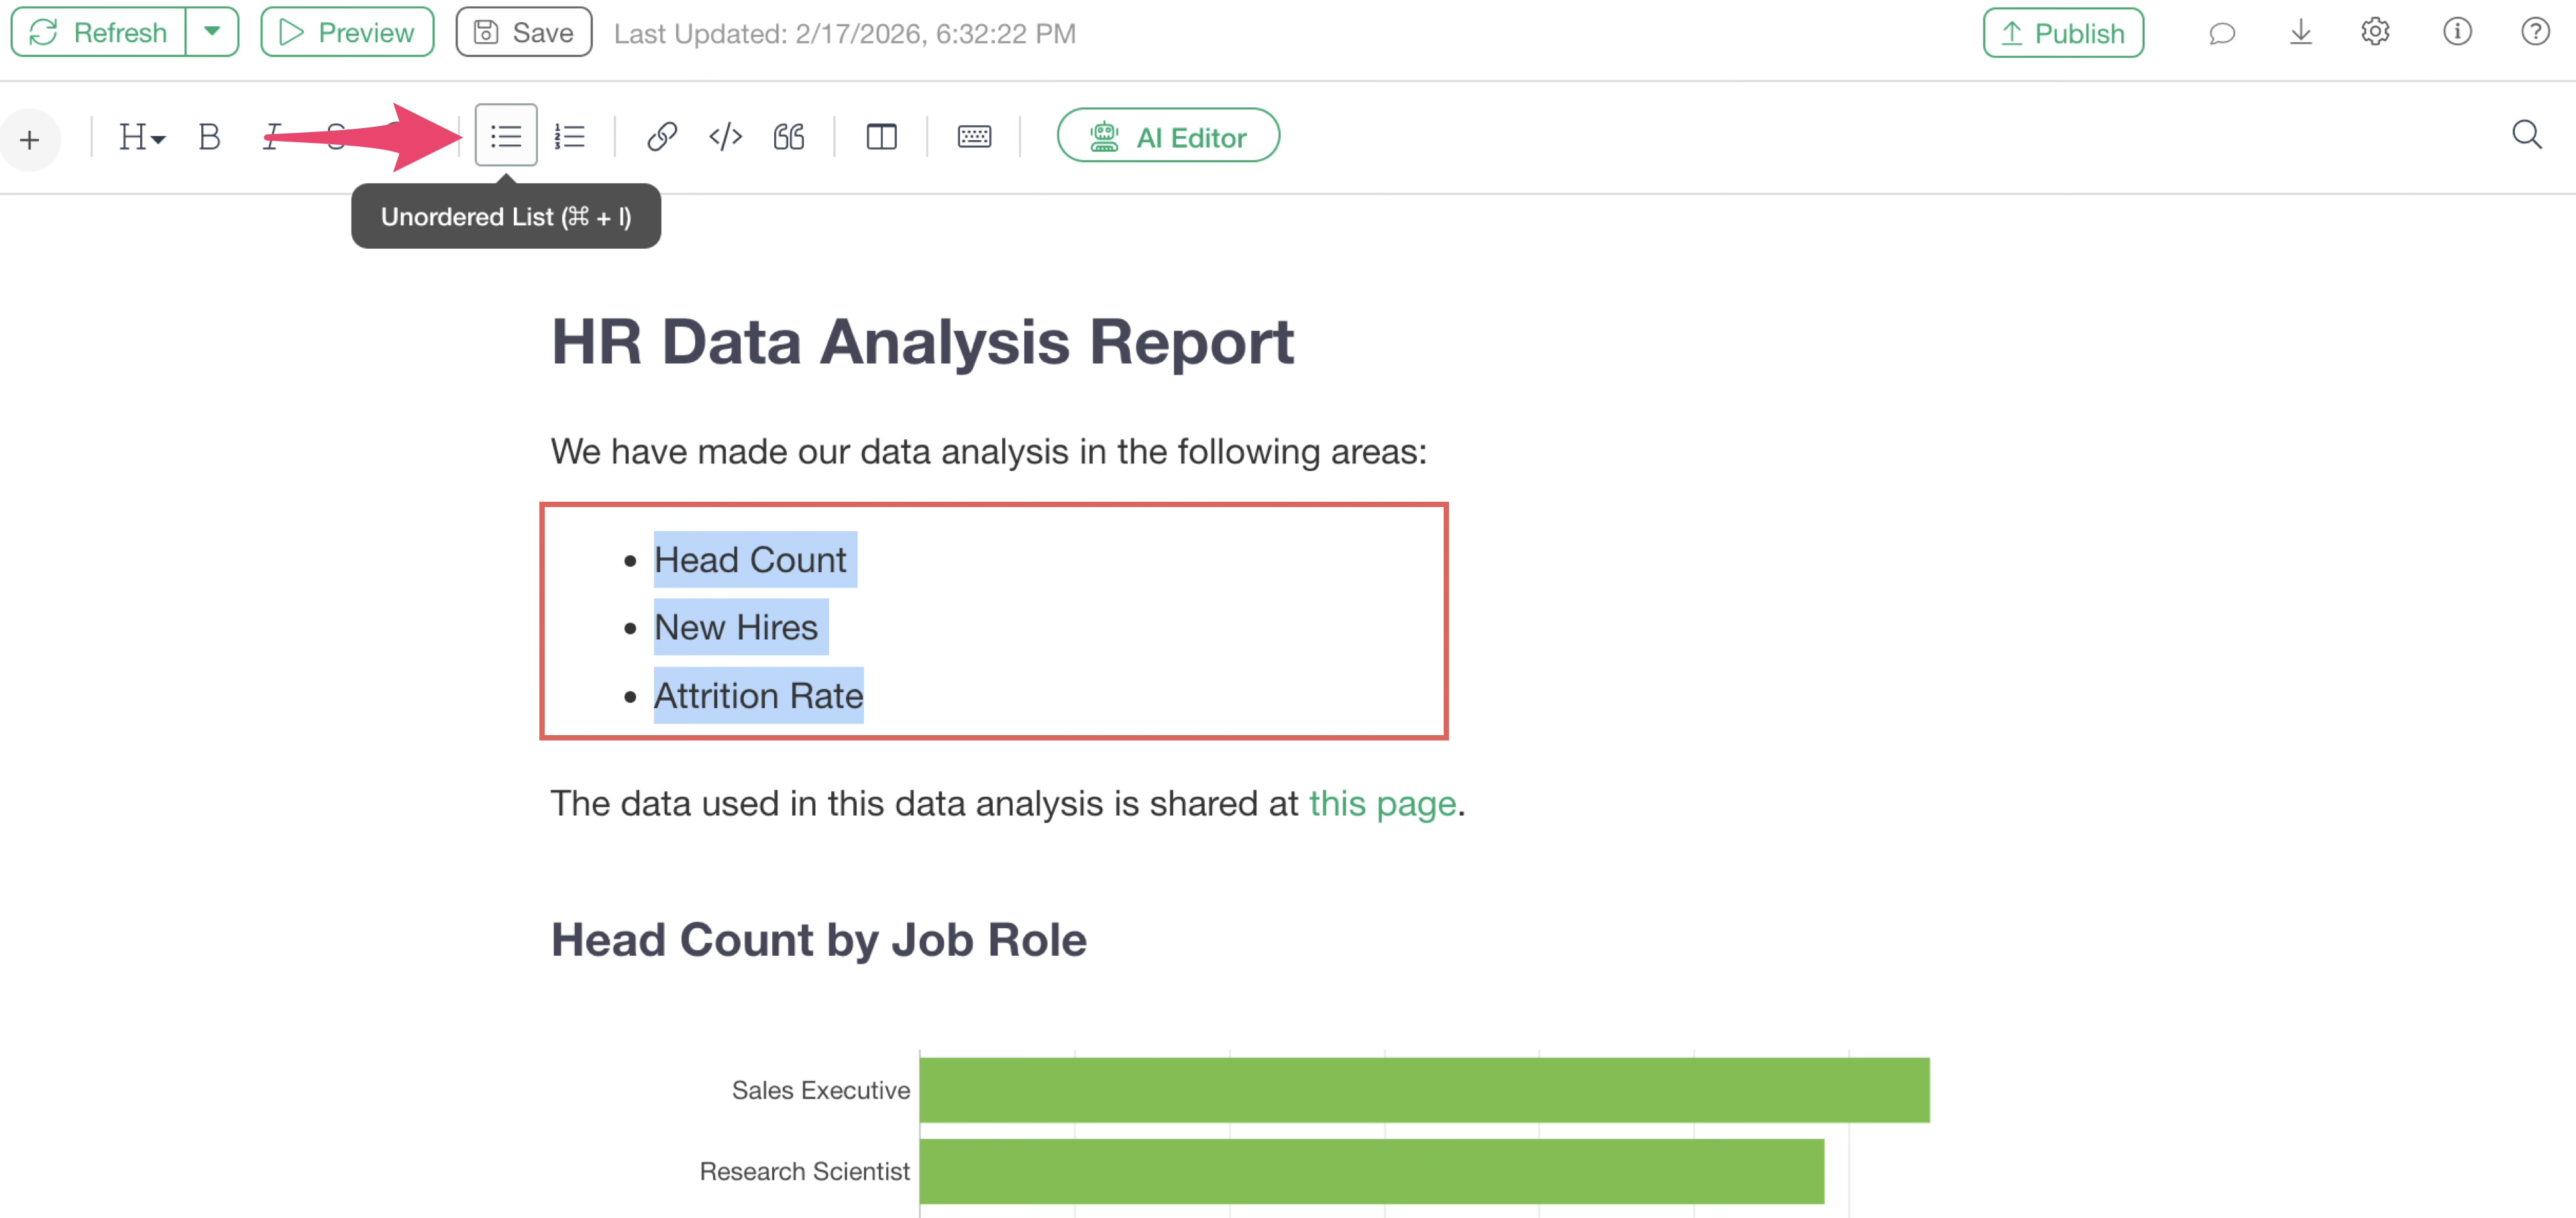
Bullet points can be set by selecting text divided into several paragraphs and clicking the “Bullet List” button on the toolbar.
Color
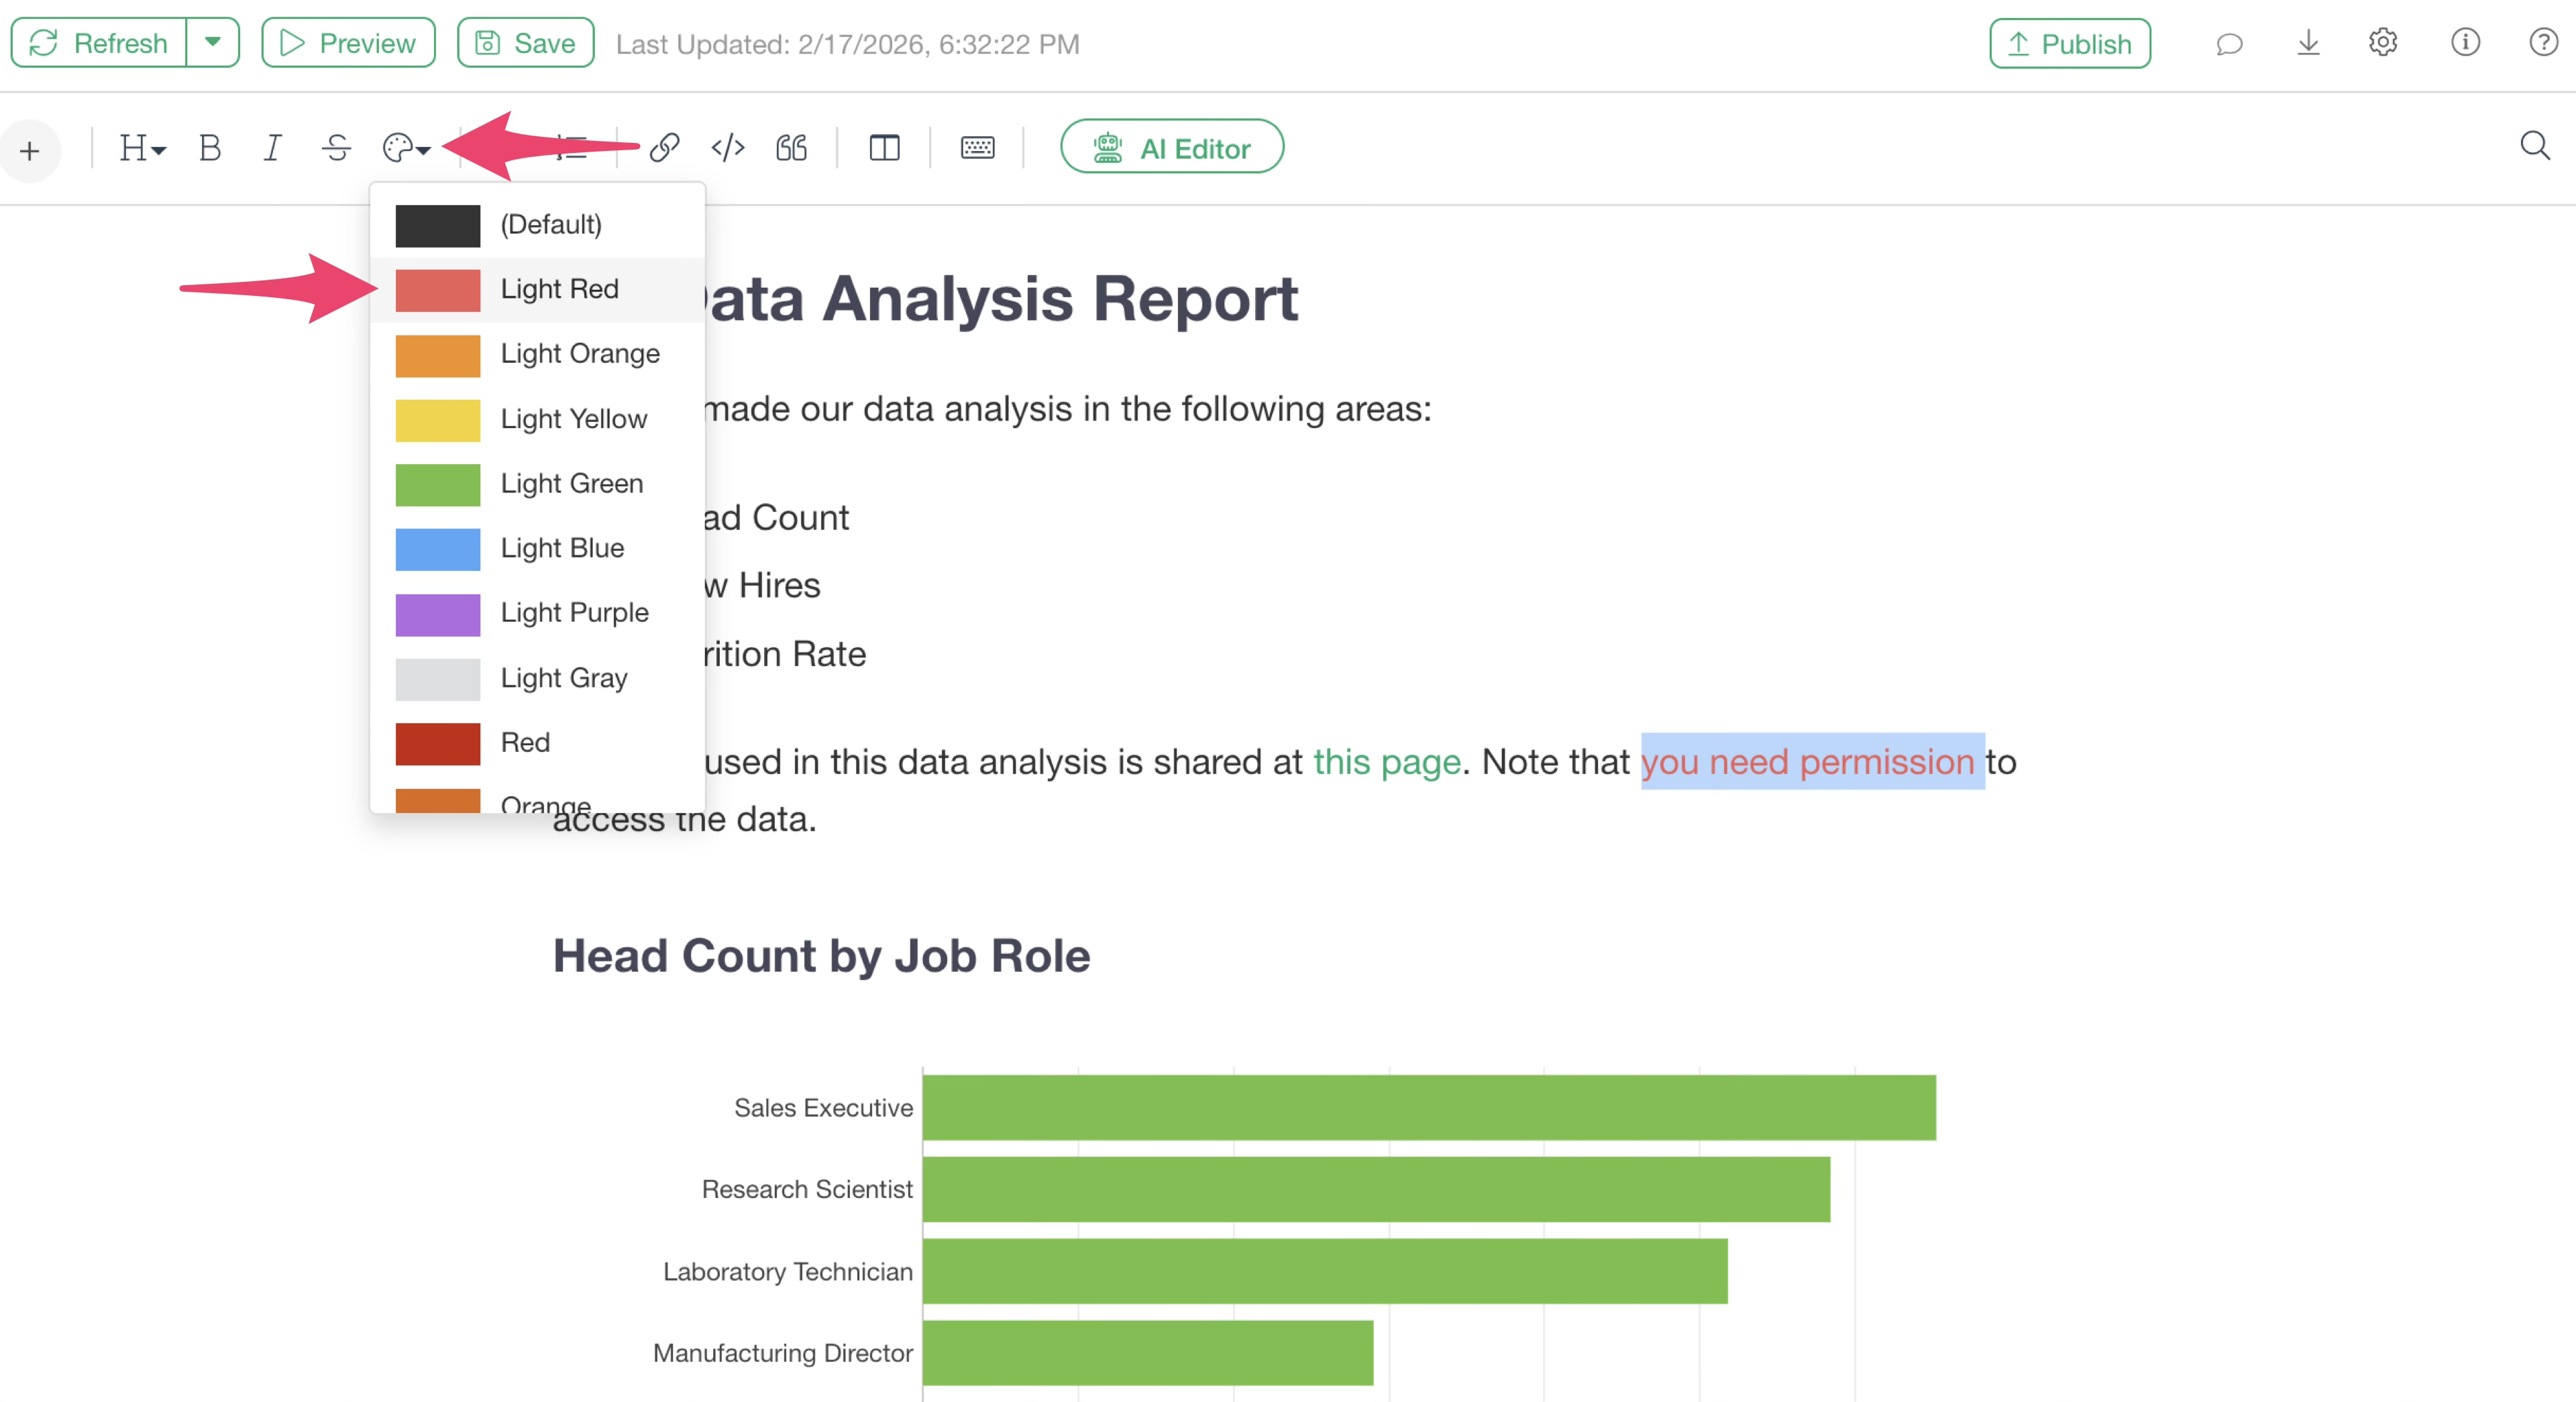
By selecting any text and clicking the text color icon, you can change the color of the selected text.
Adding Charts/Analytics
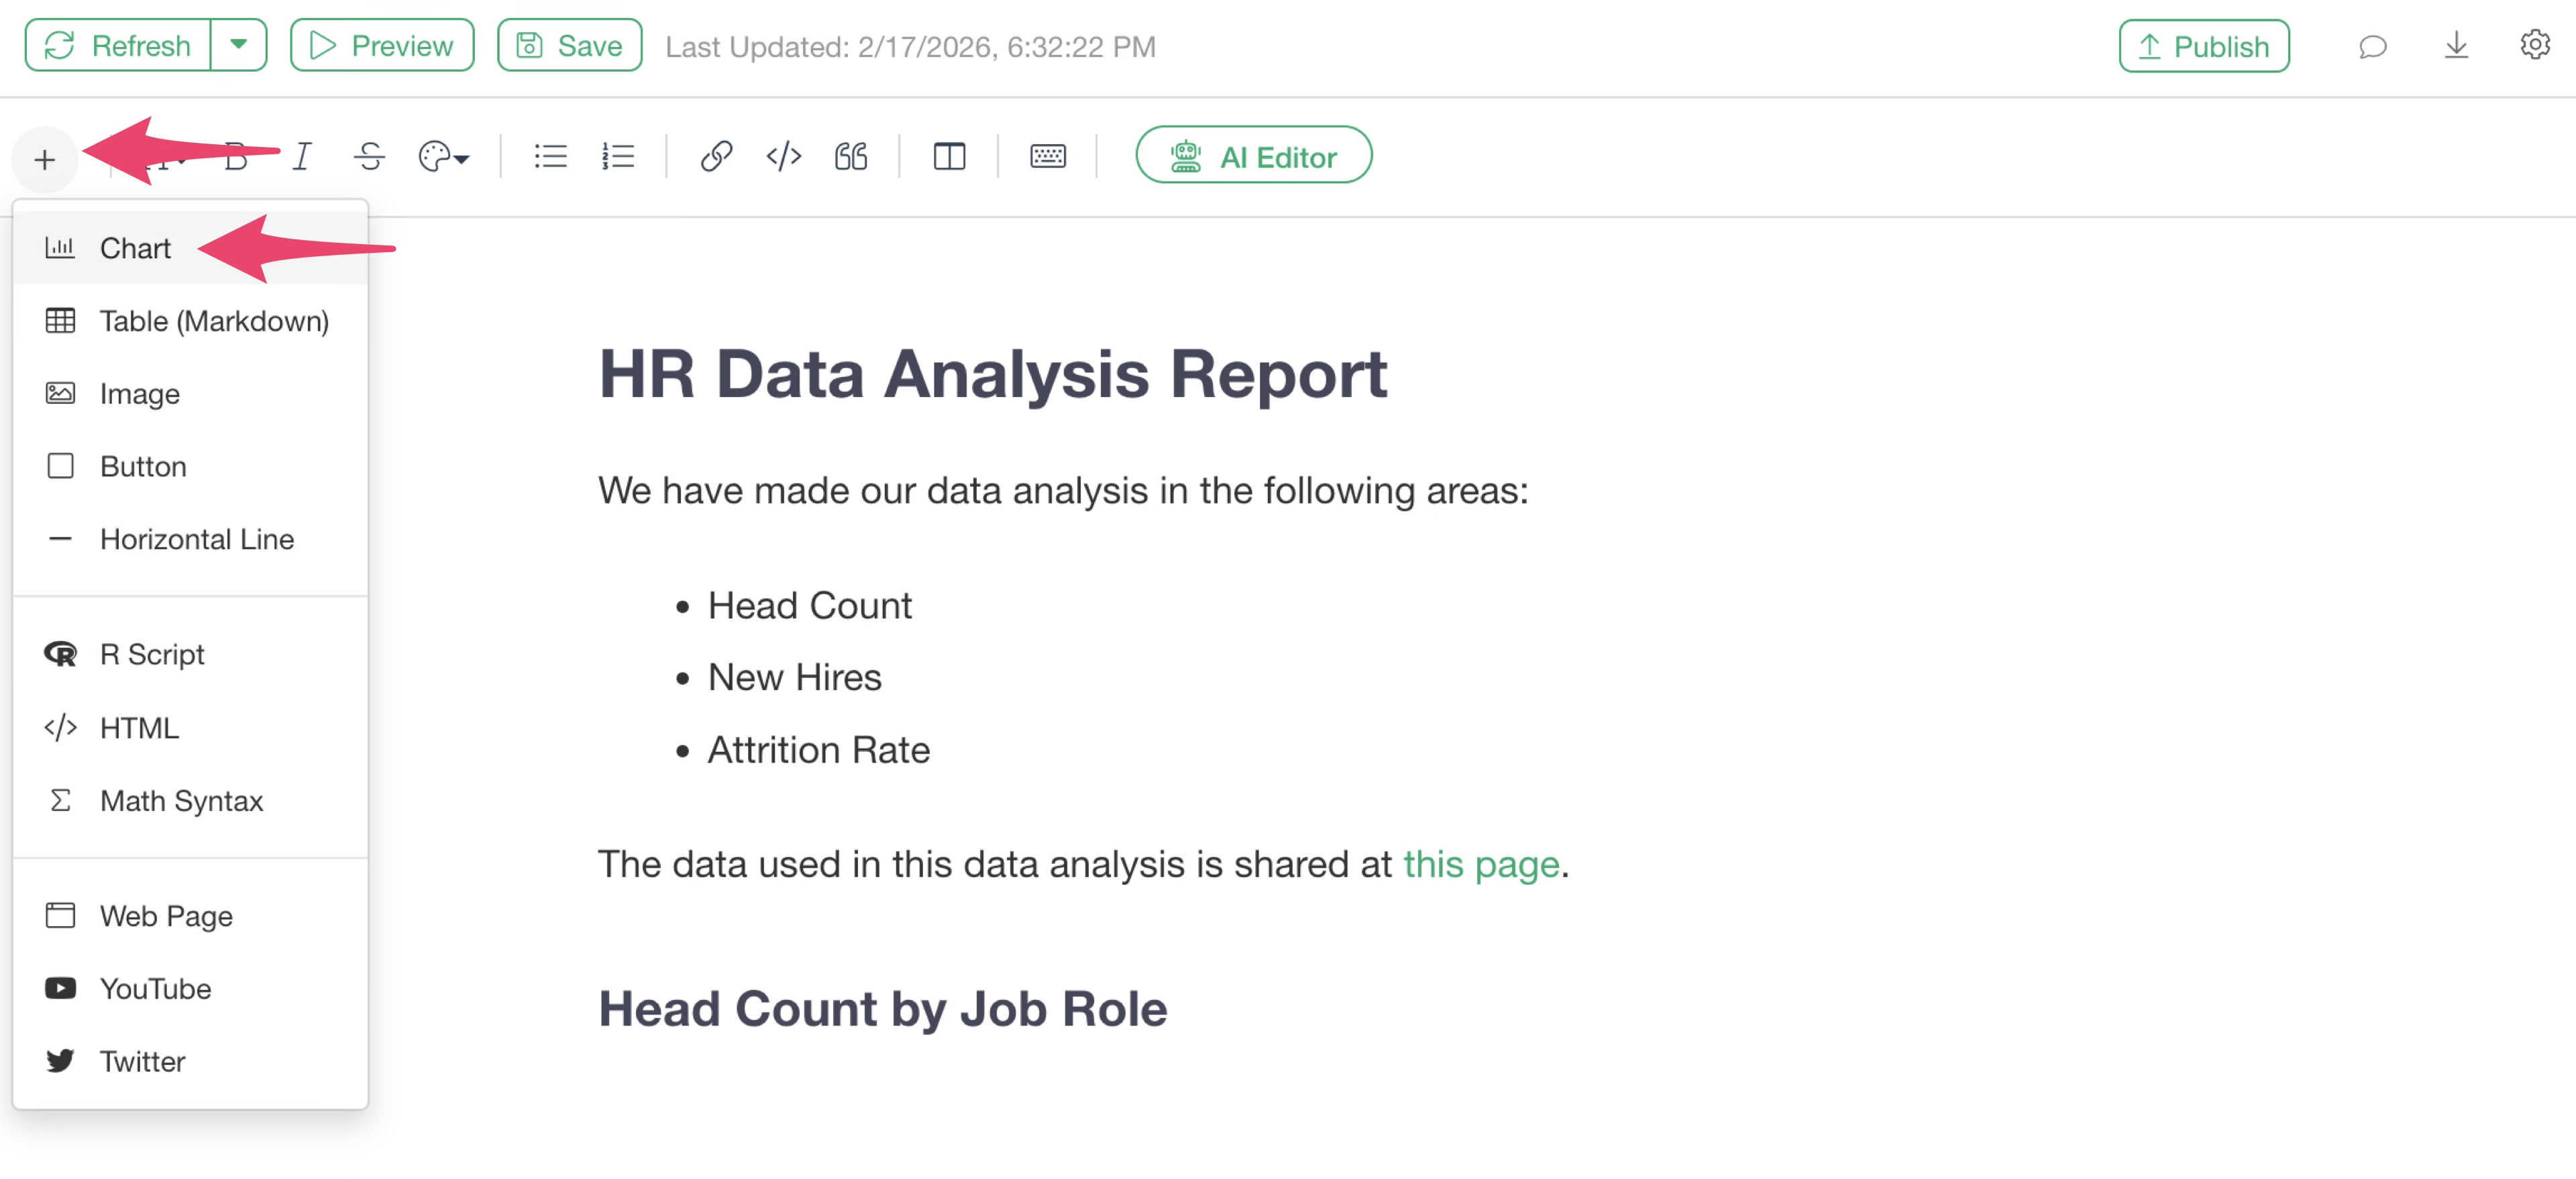
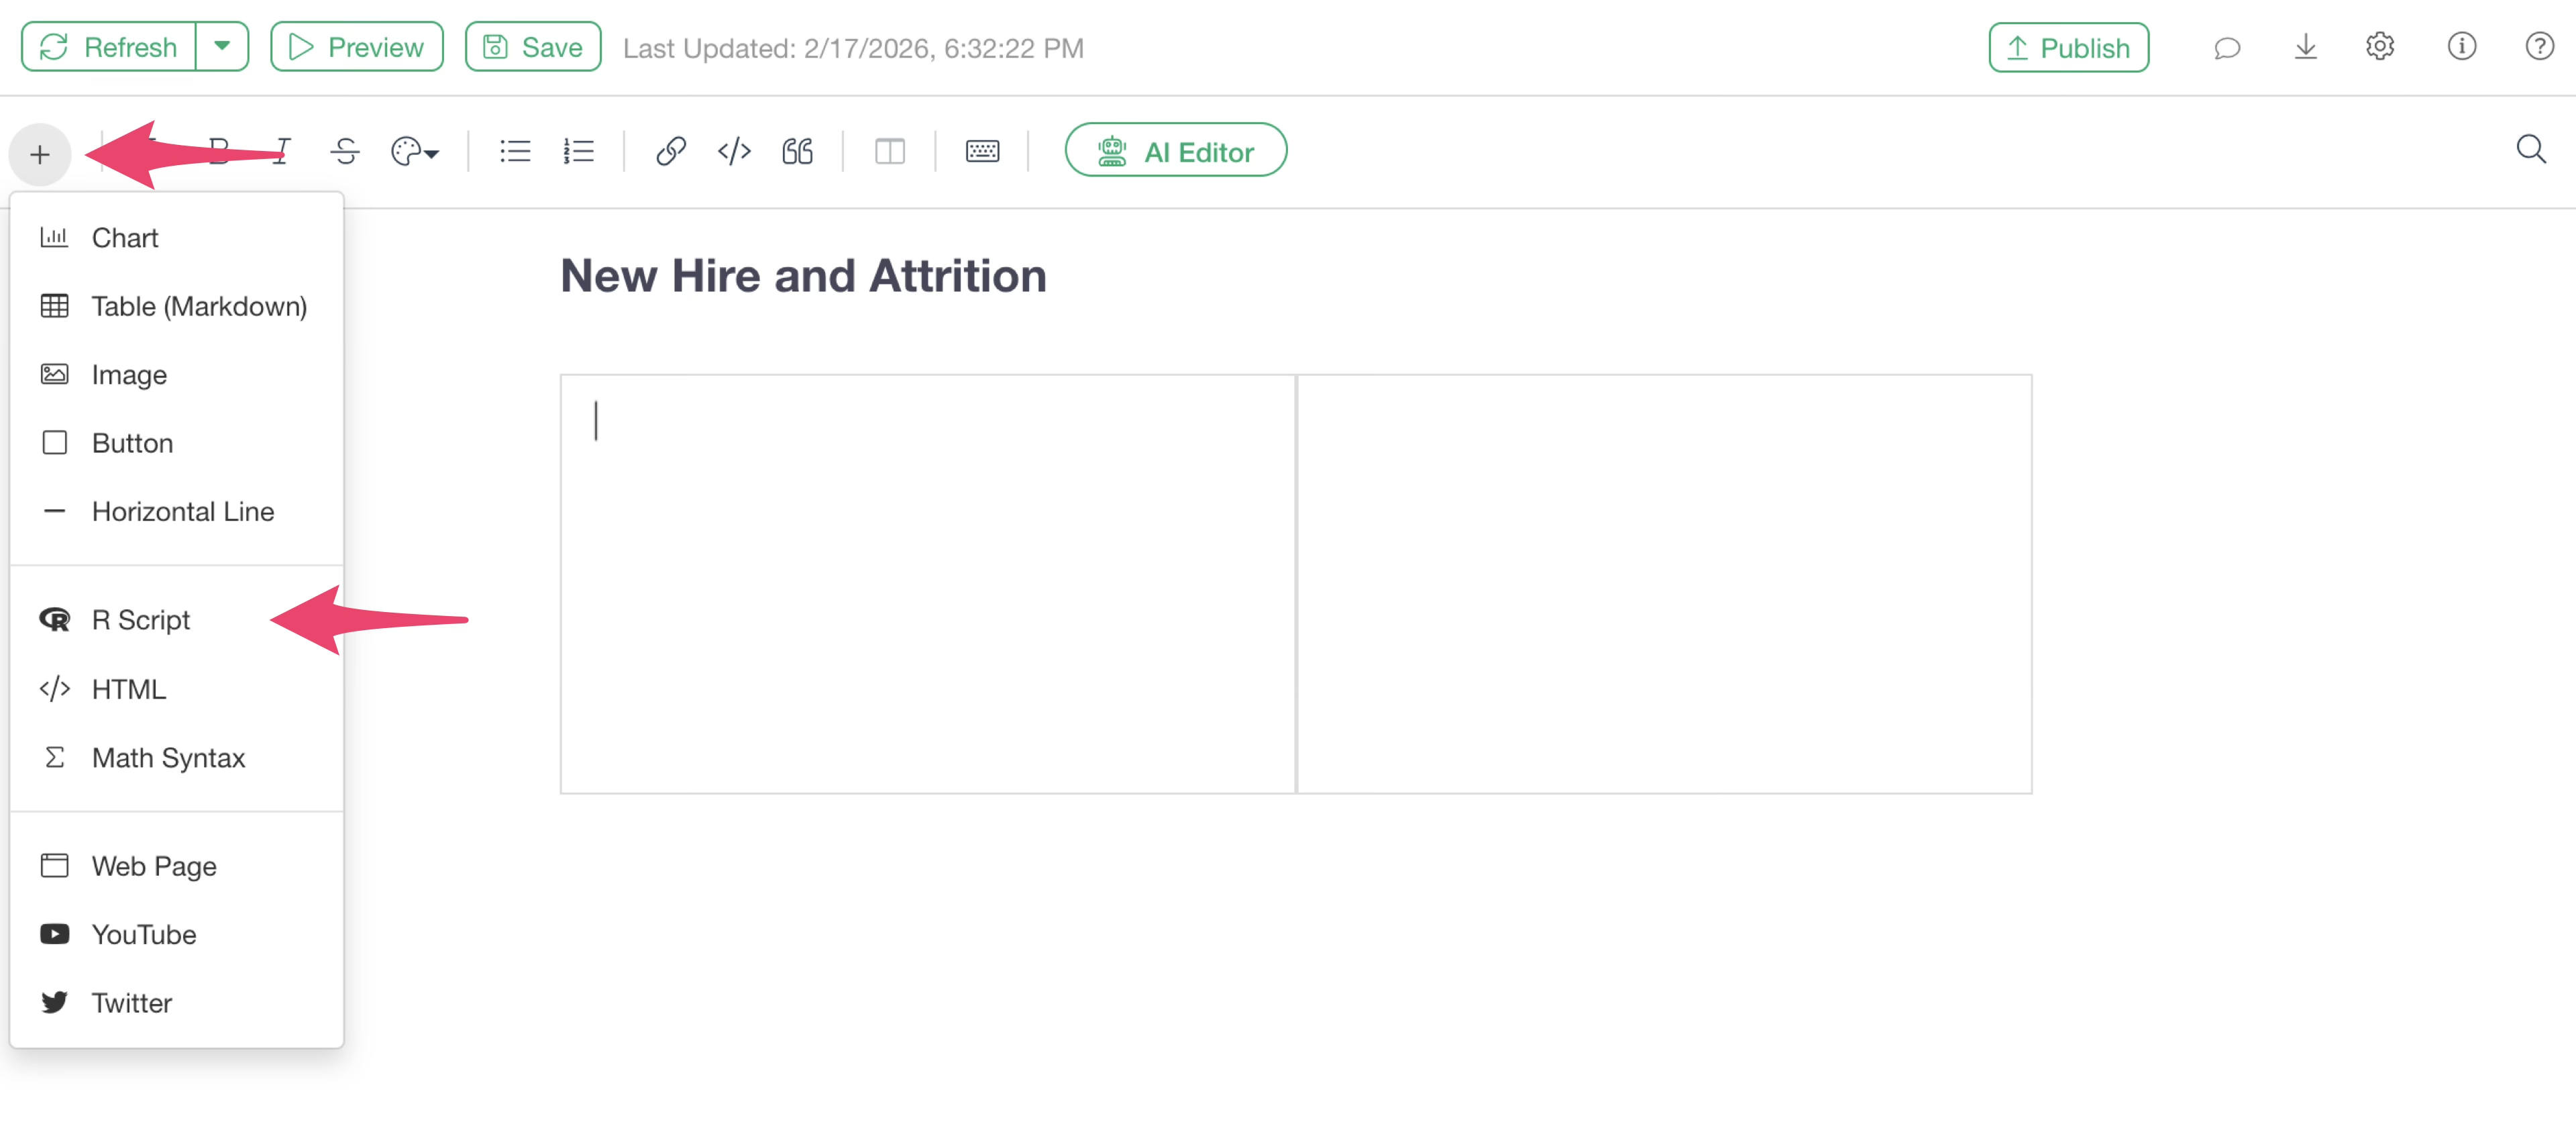
To add a chart to a note, select the “Plus Button” and then select “Chart.”
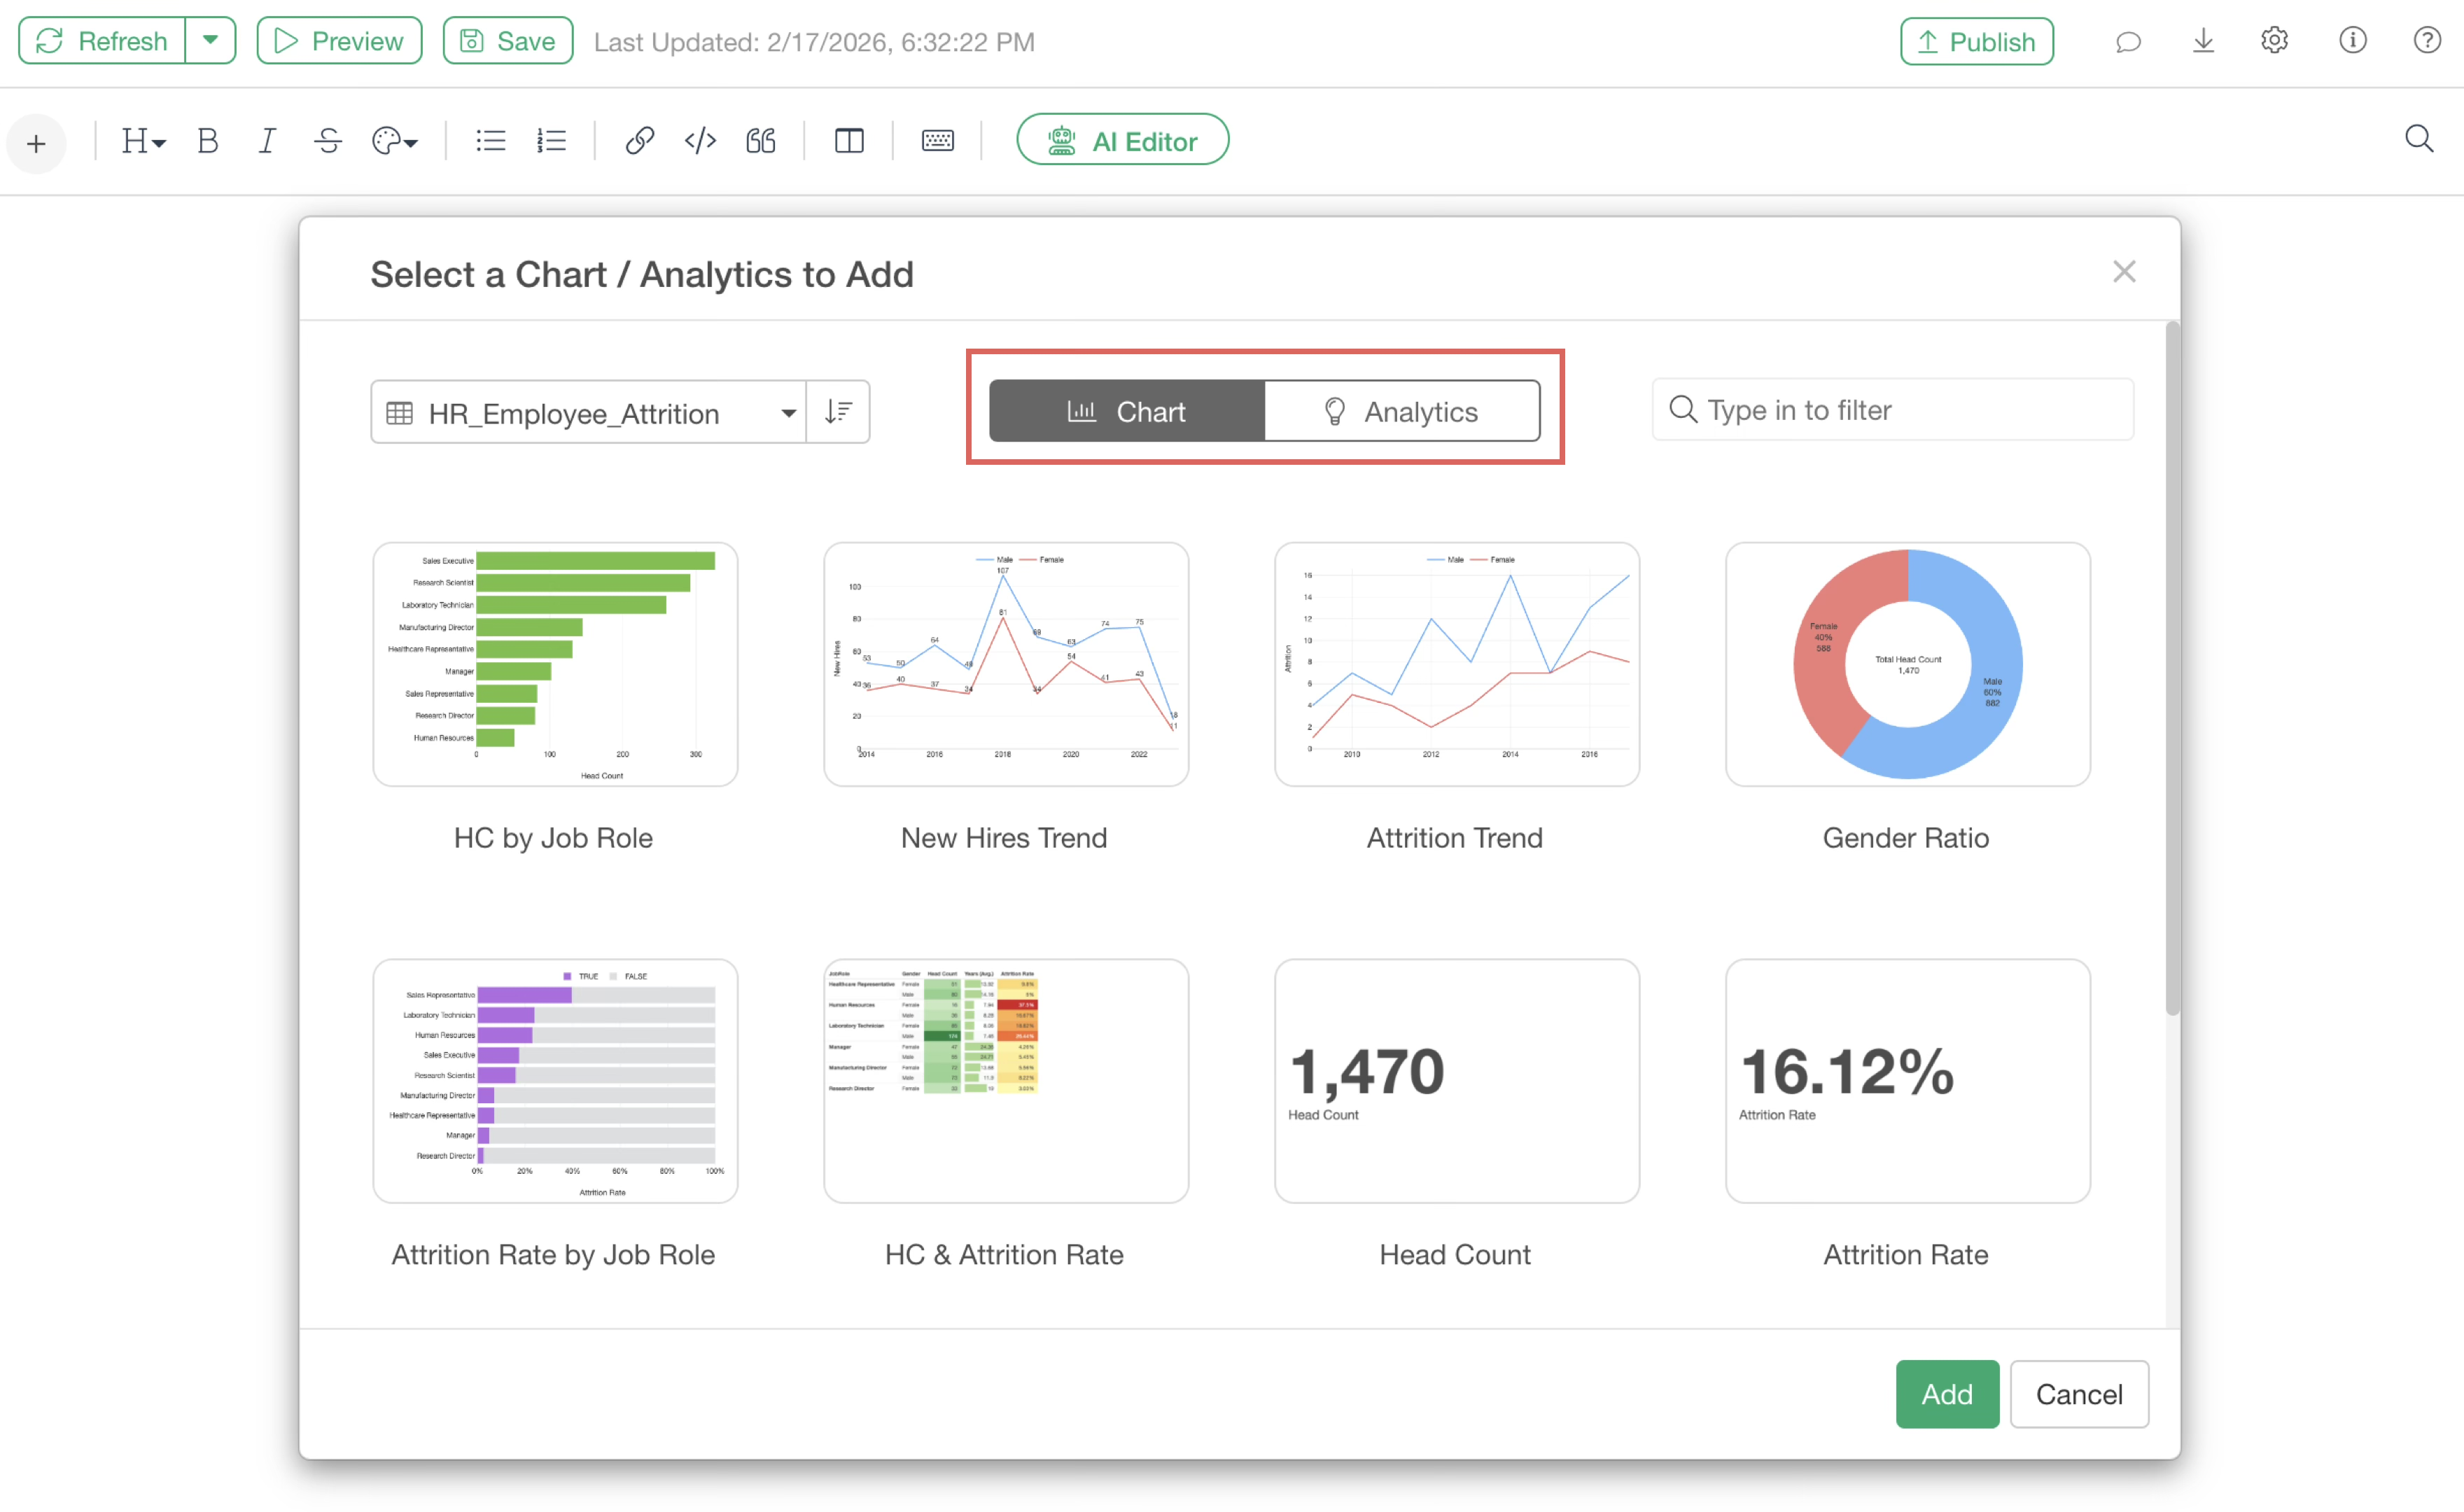
A chart selection dialog will appear. Charts created in the Chart view are displayed under the “Chart” tab, and those created in the Analytics view are displayed under the “Analytics” tab.
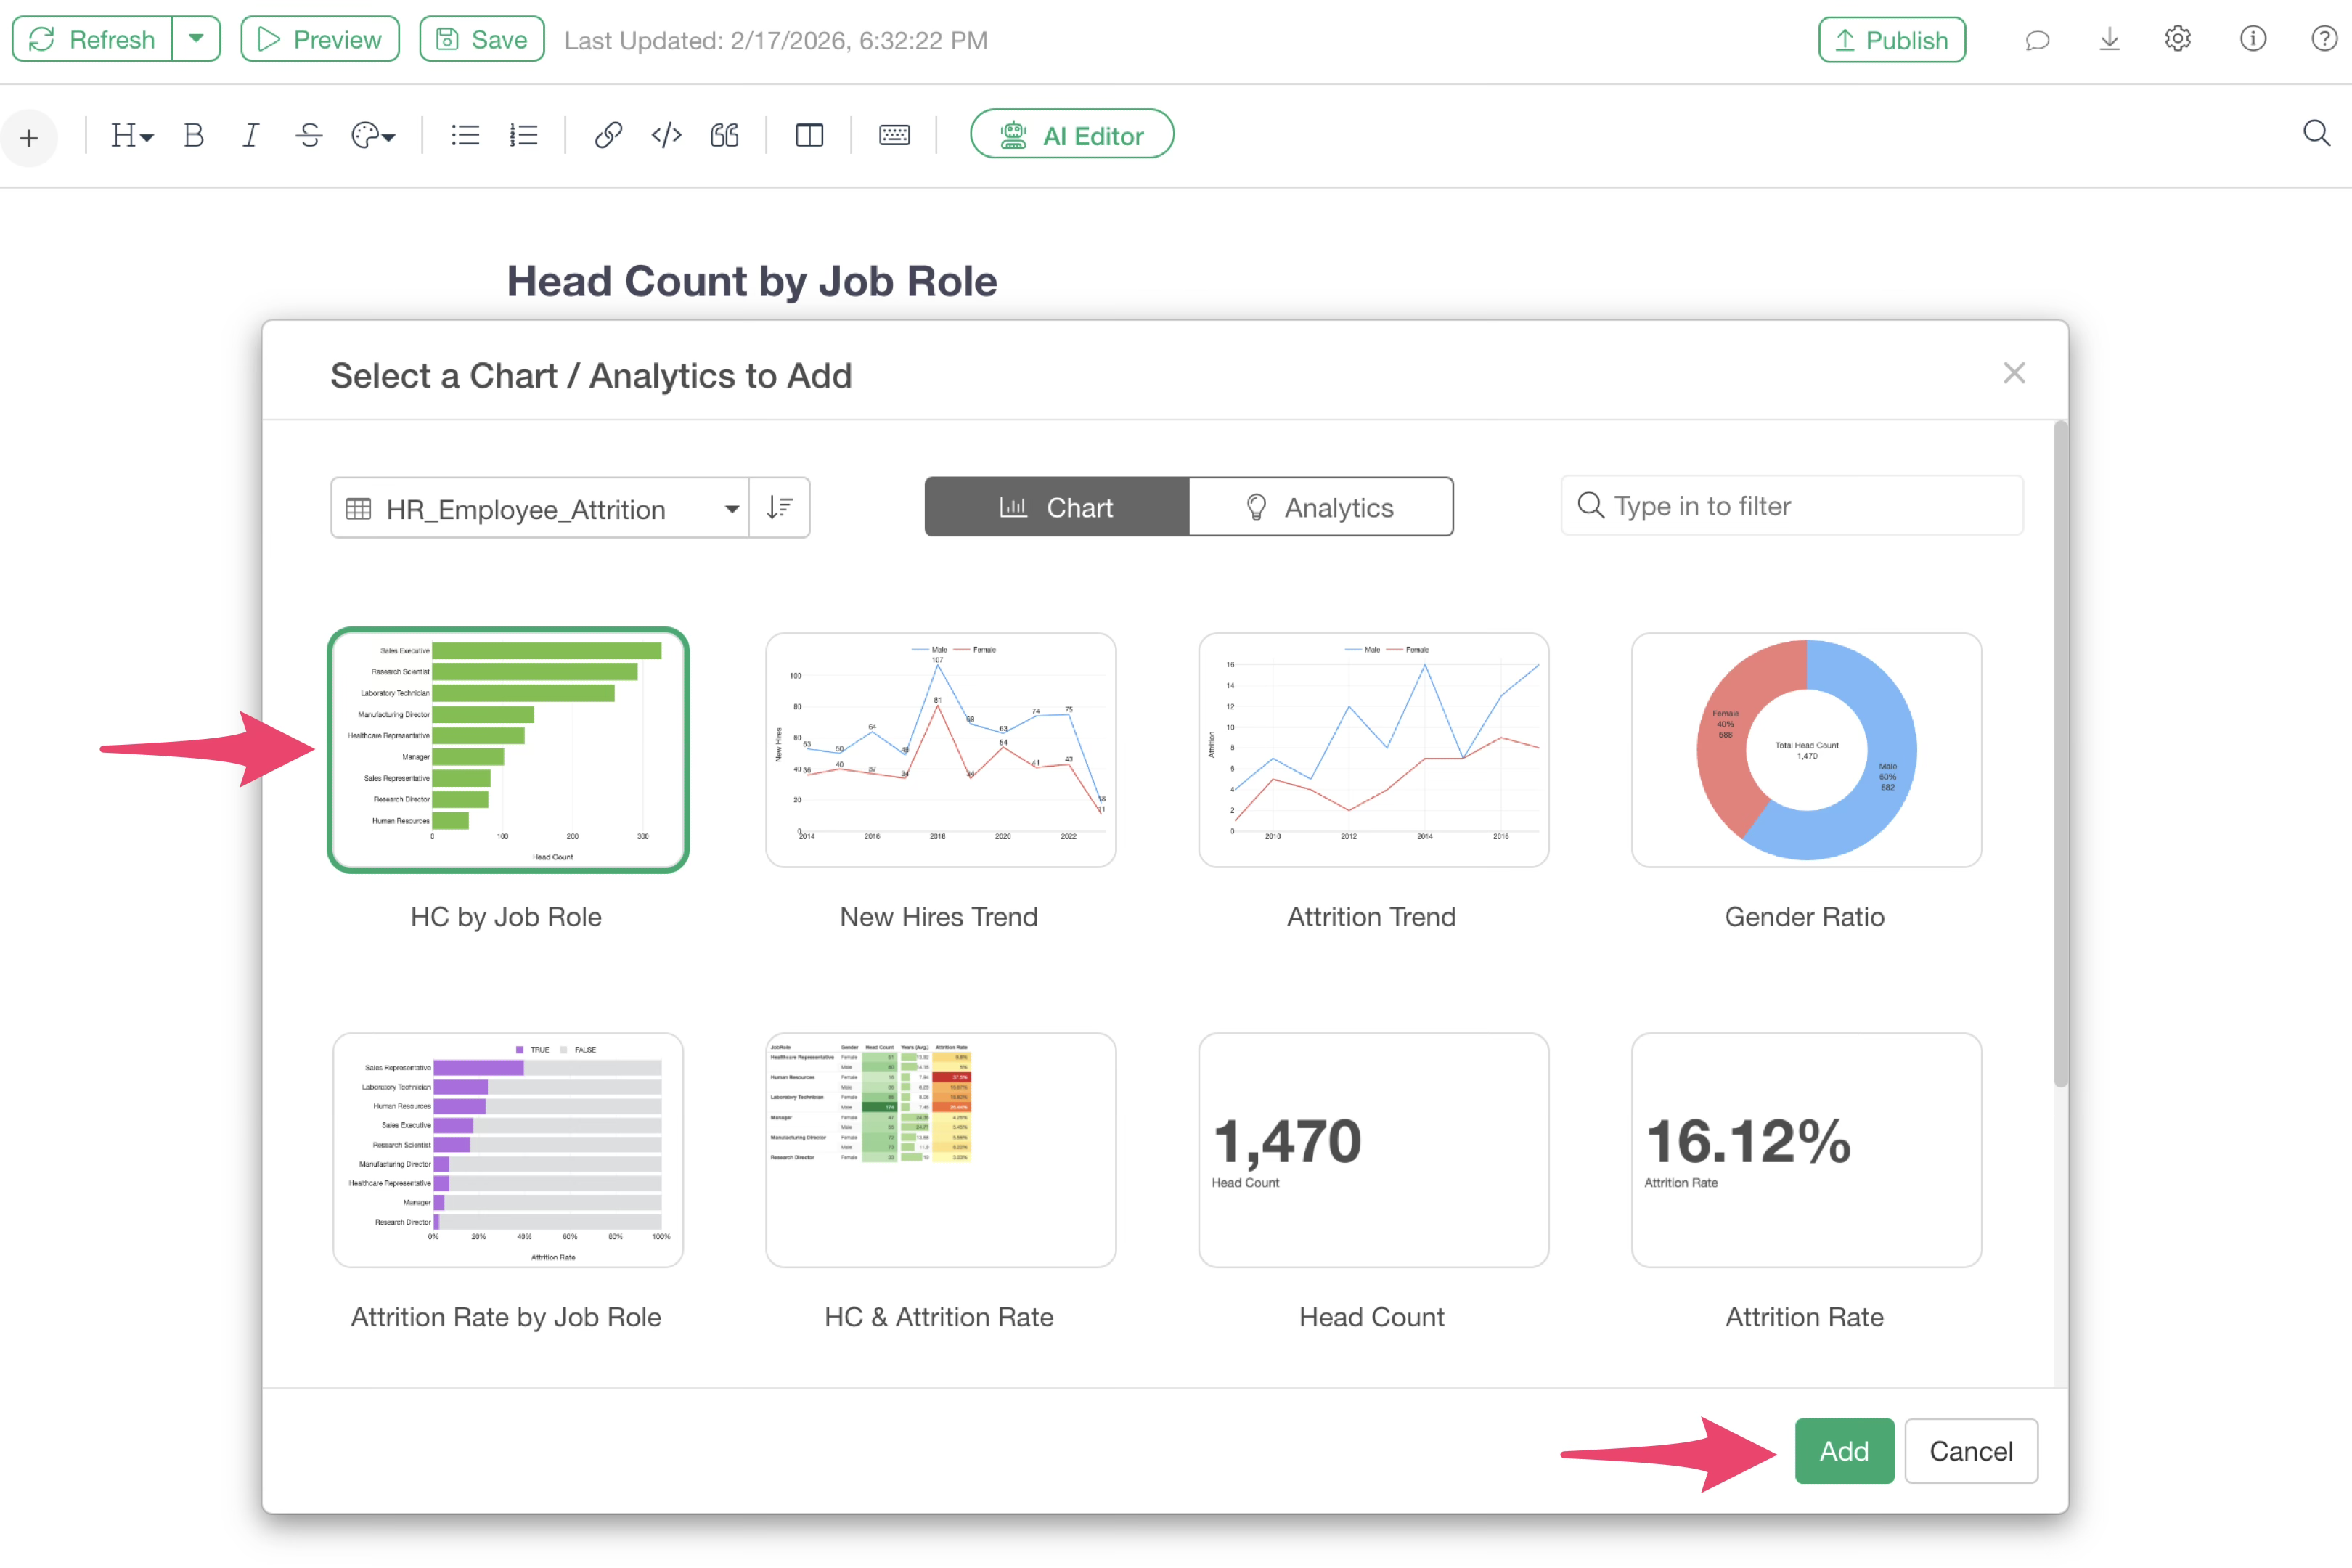
Select the chart you want to add to the note and click the “Add” button.
The chart will then be added to the note.
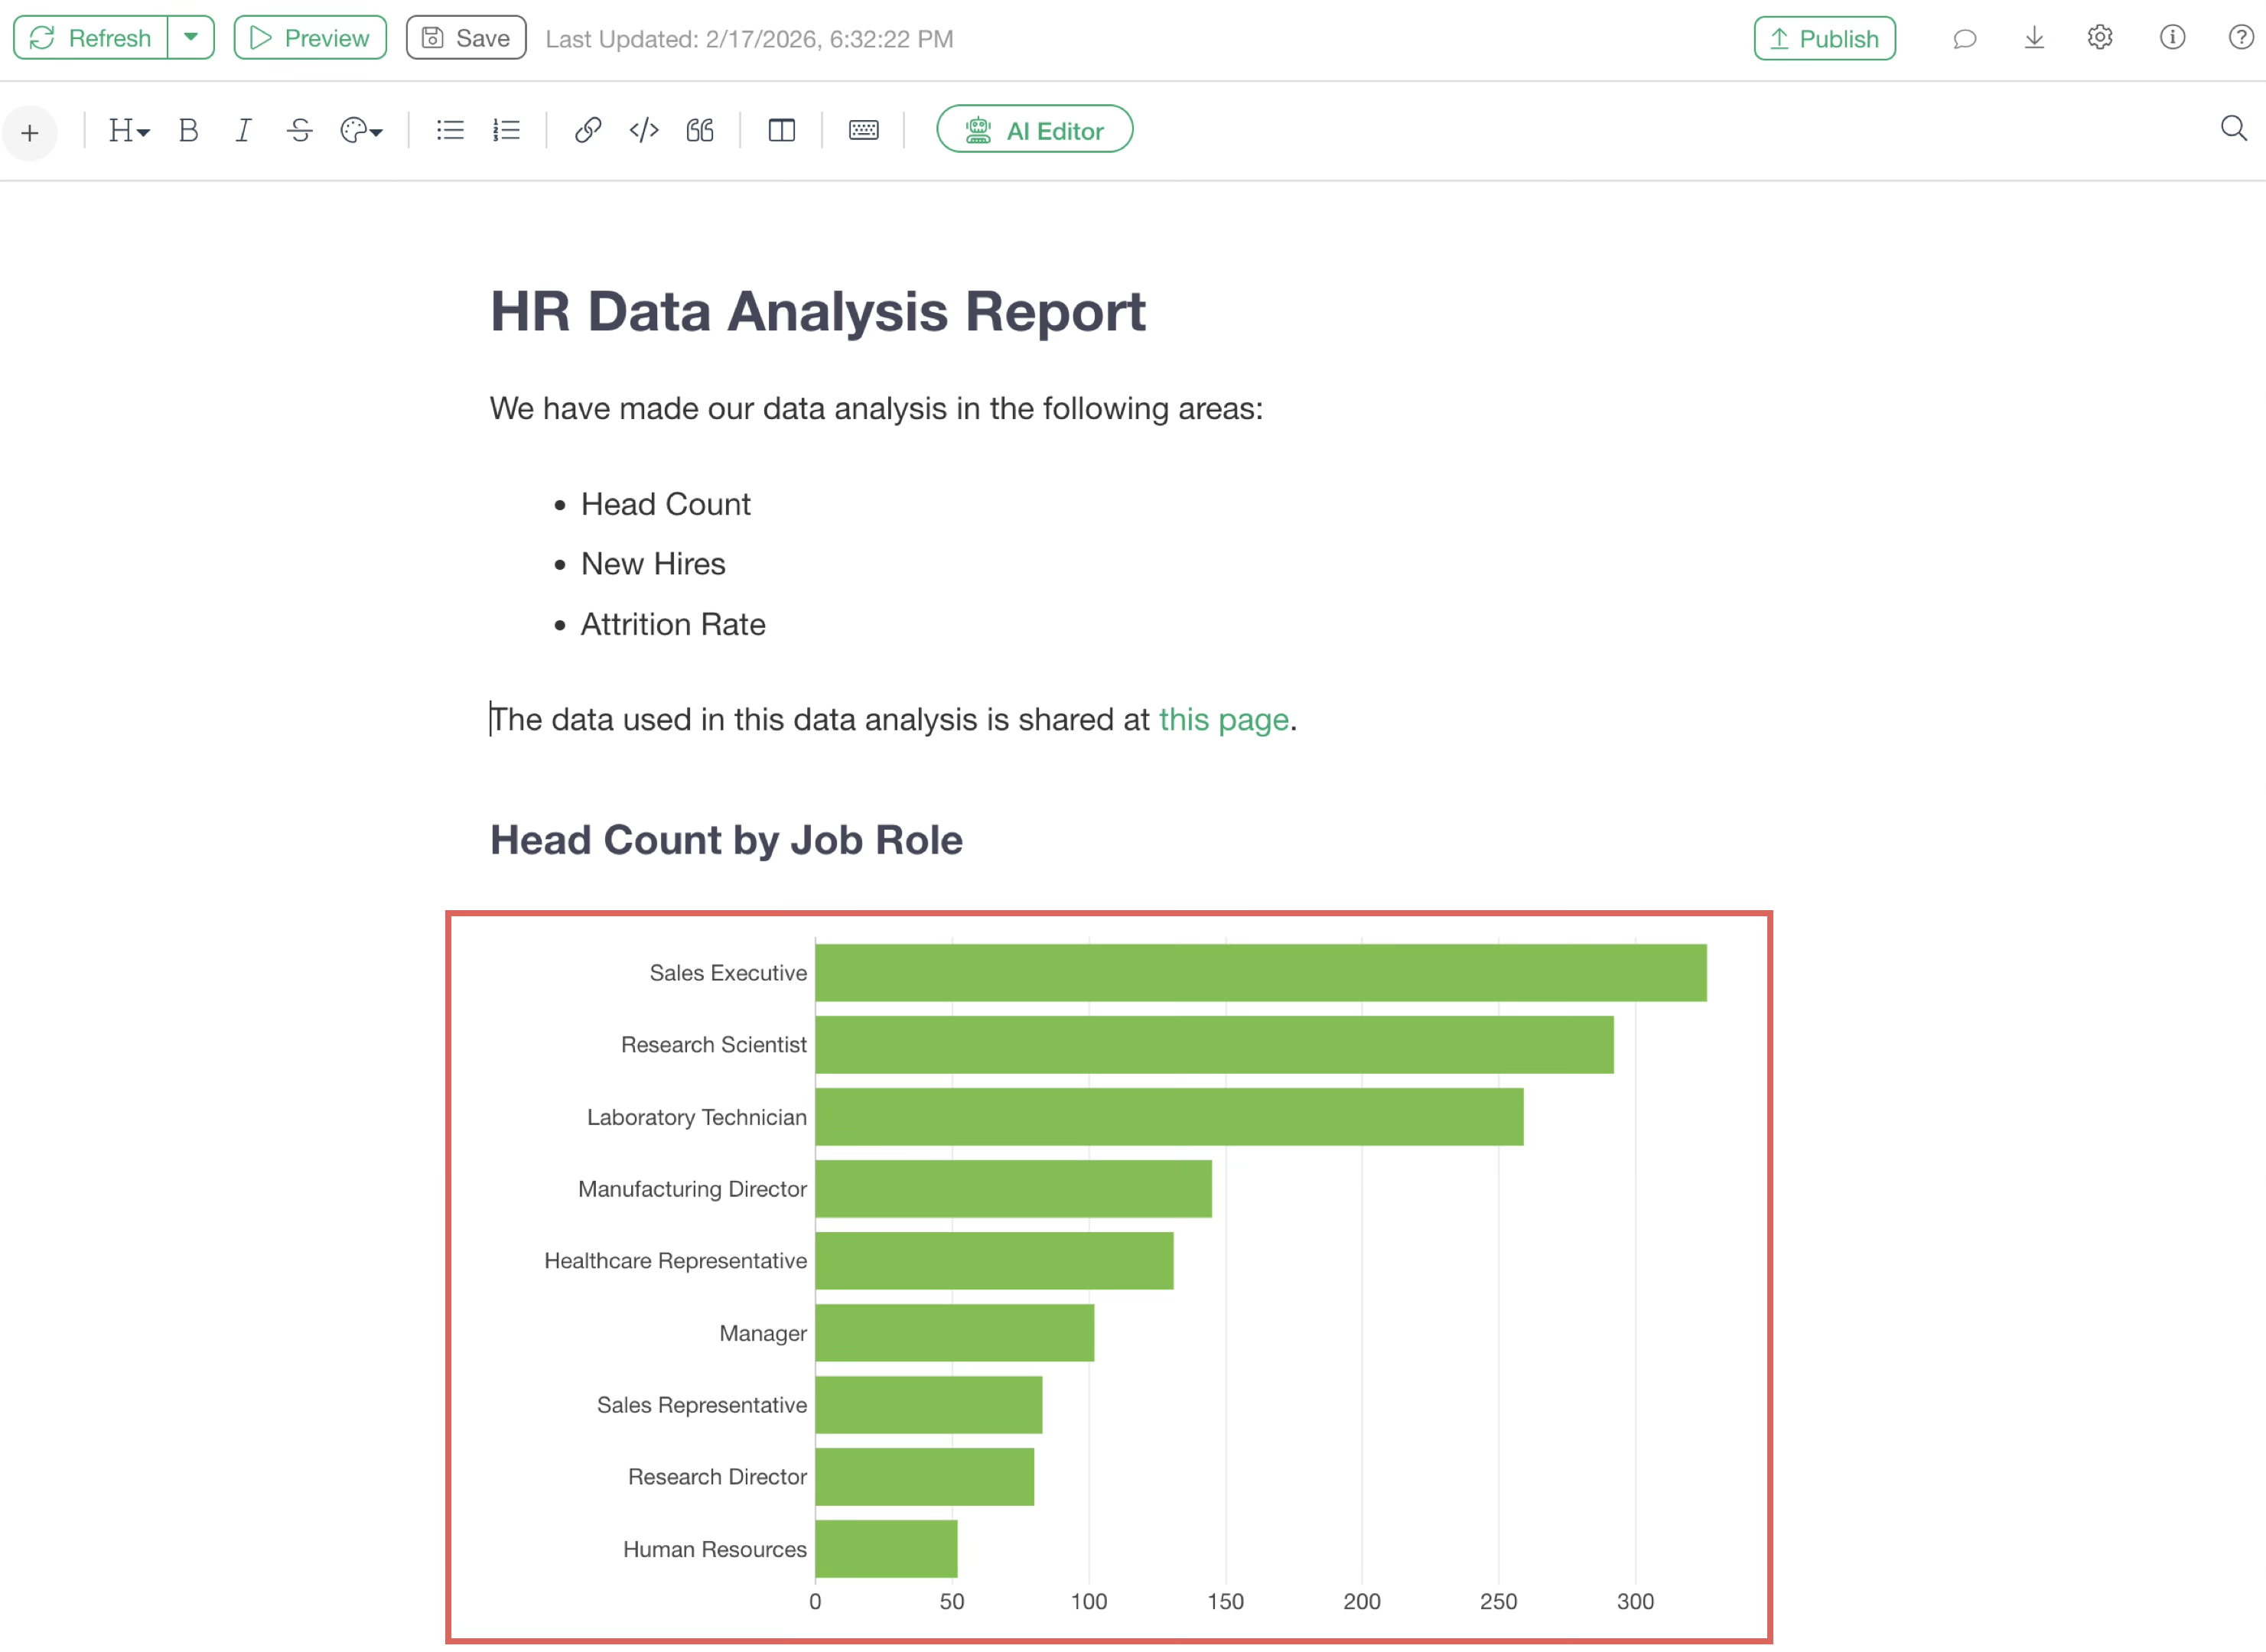
If there are comments on the chart, you can check the content by hovering your mouse over the comment button within the chart.
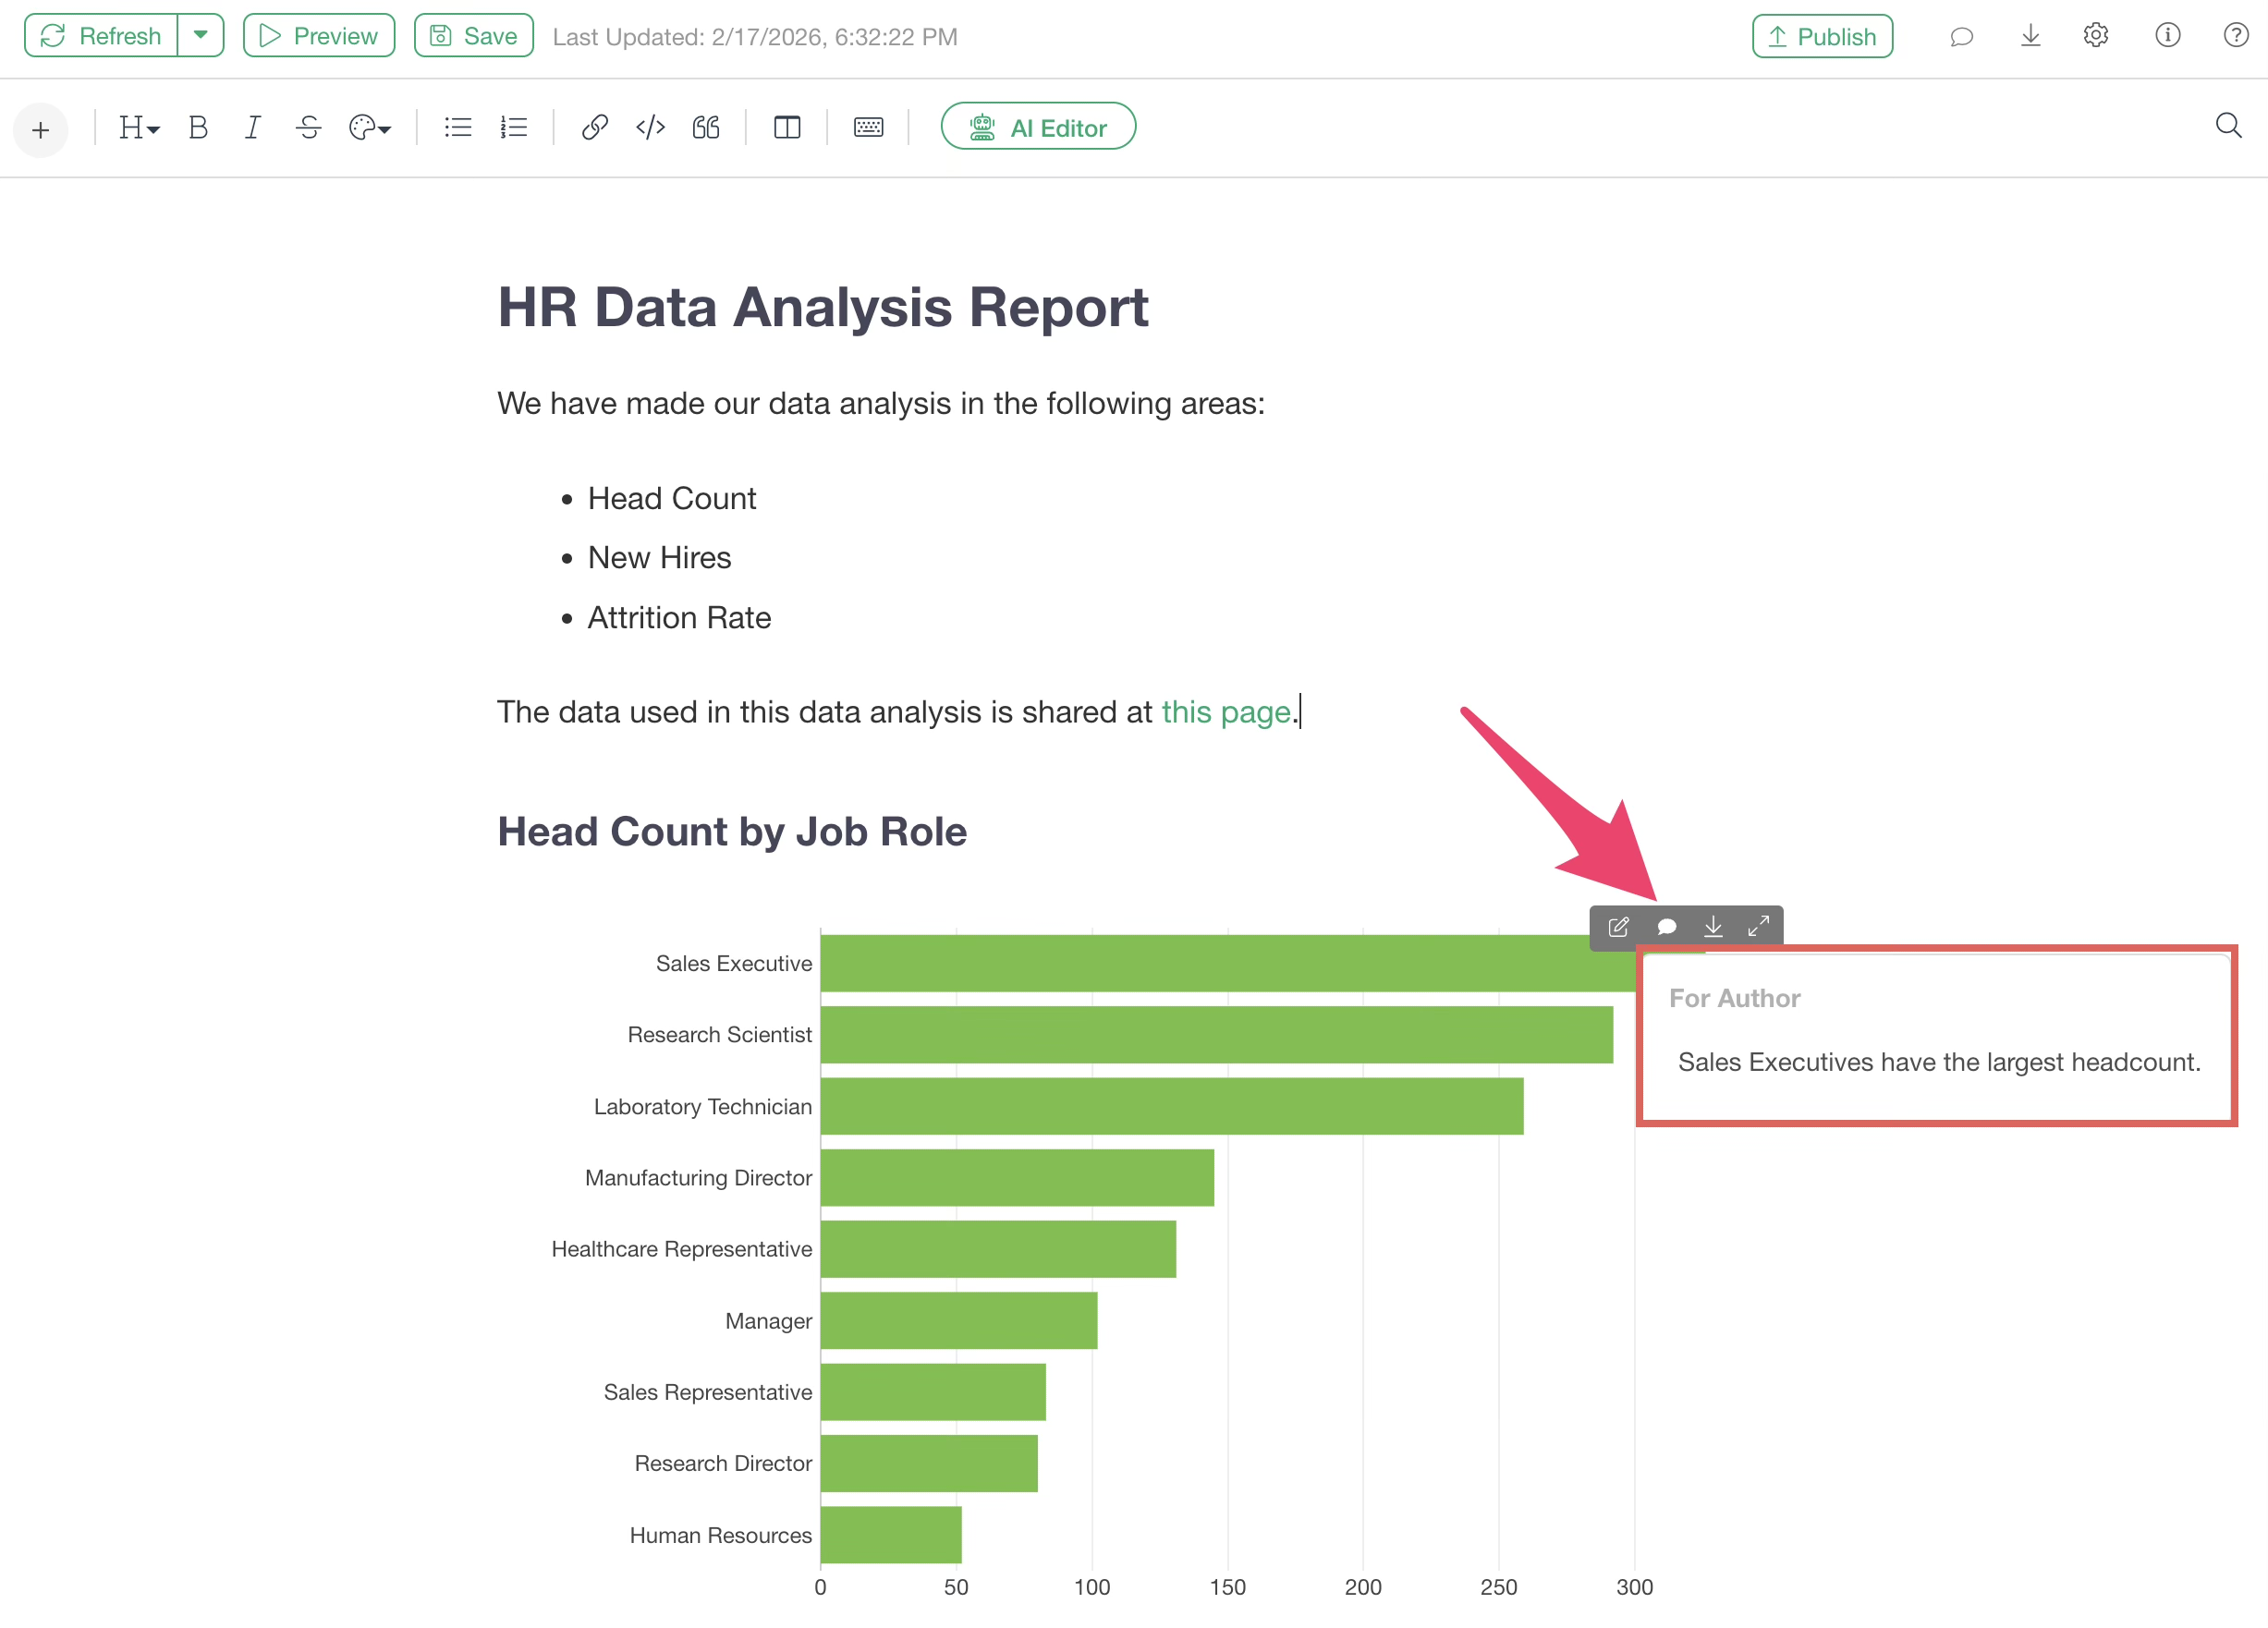
Chart Settings
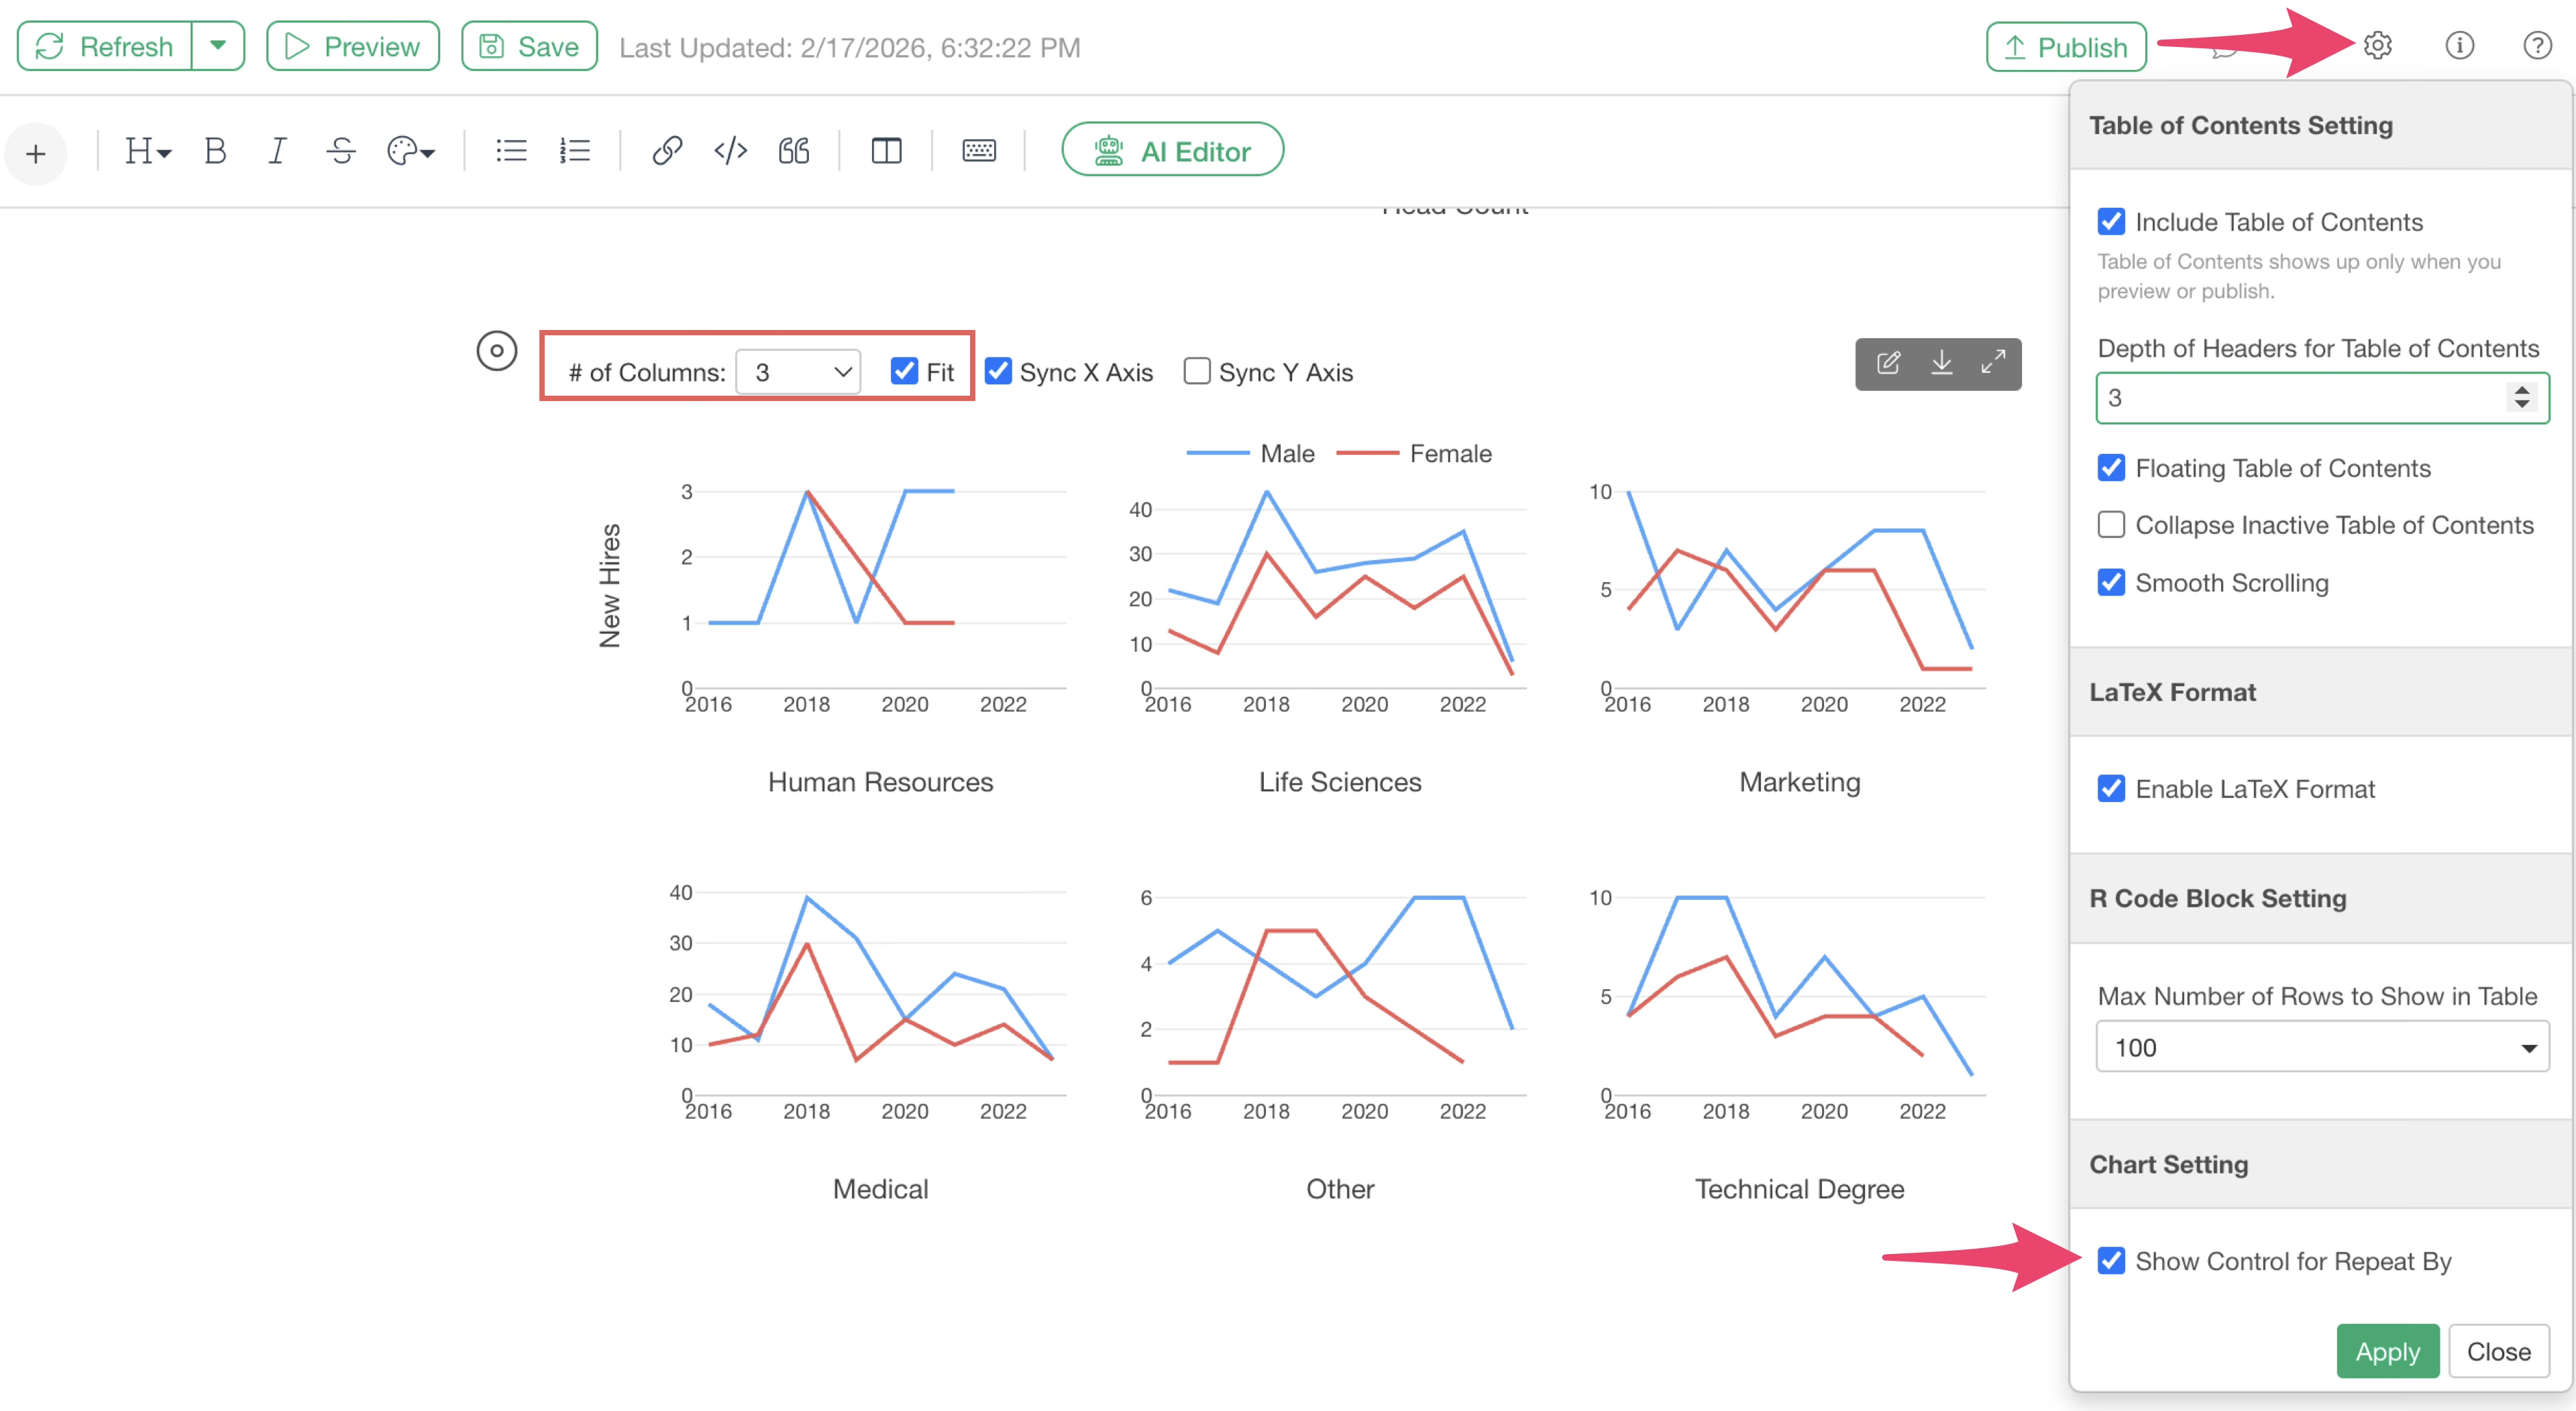
Display Controls for Repeat
From the “Show Controls for Repeat” menu in the note settings, you can configure whether to display the “# of Columns” and “Fit” settings for charts using the “Repeat” feature on the note. This is enabled by default.
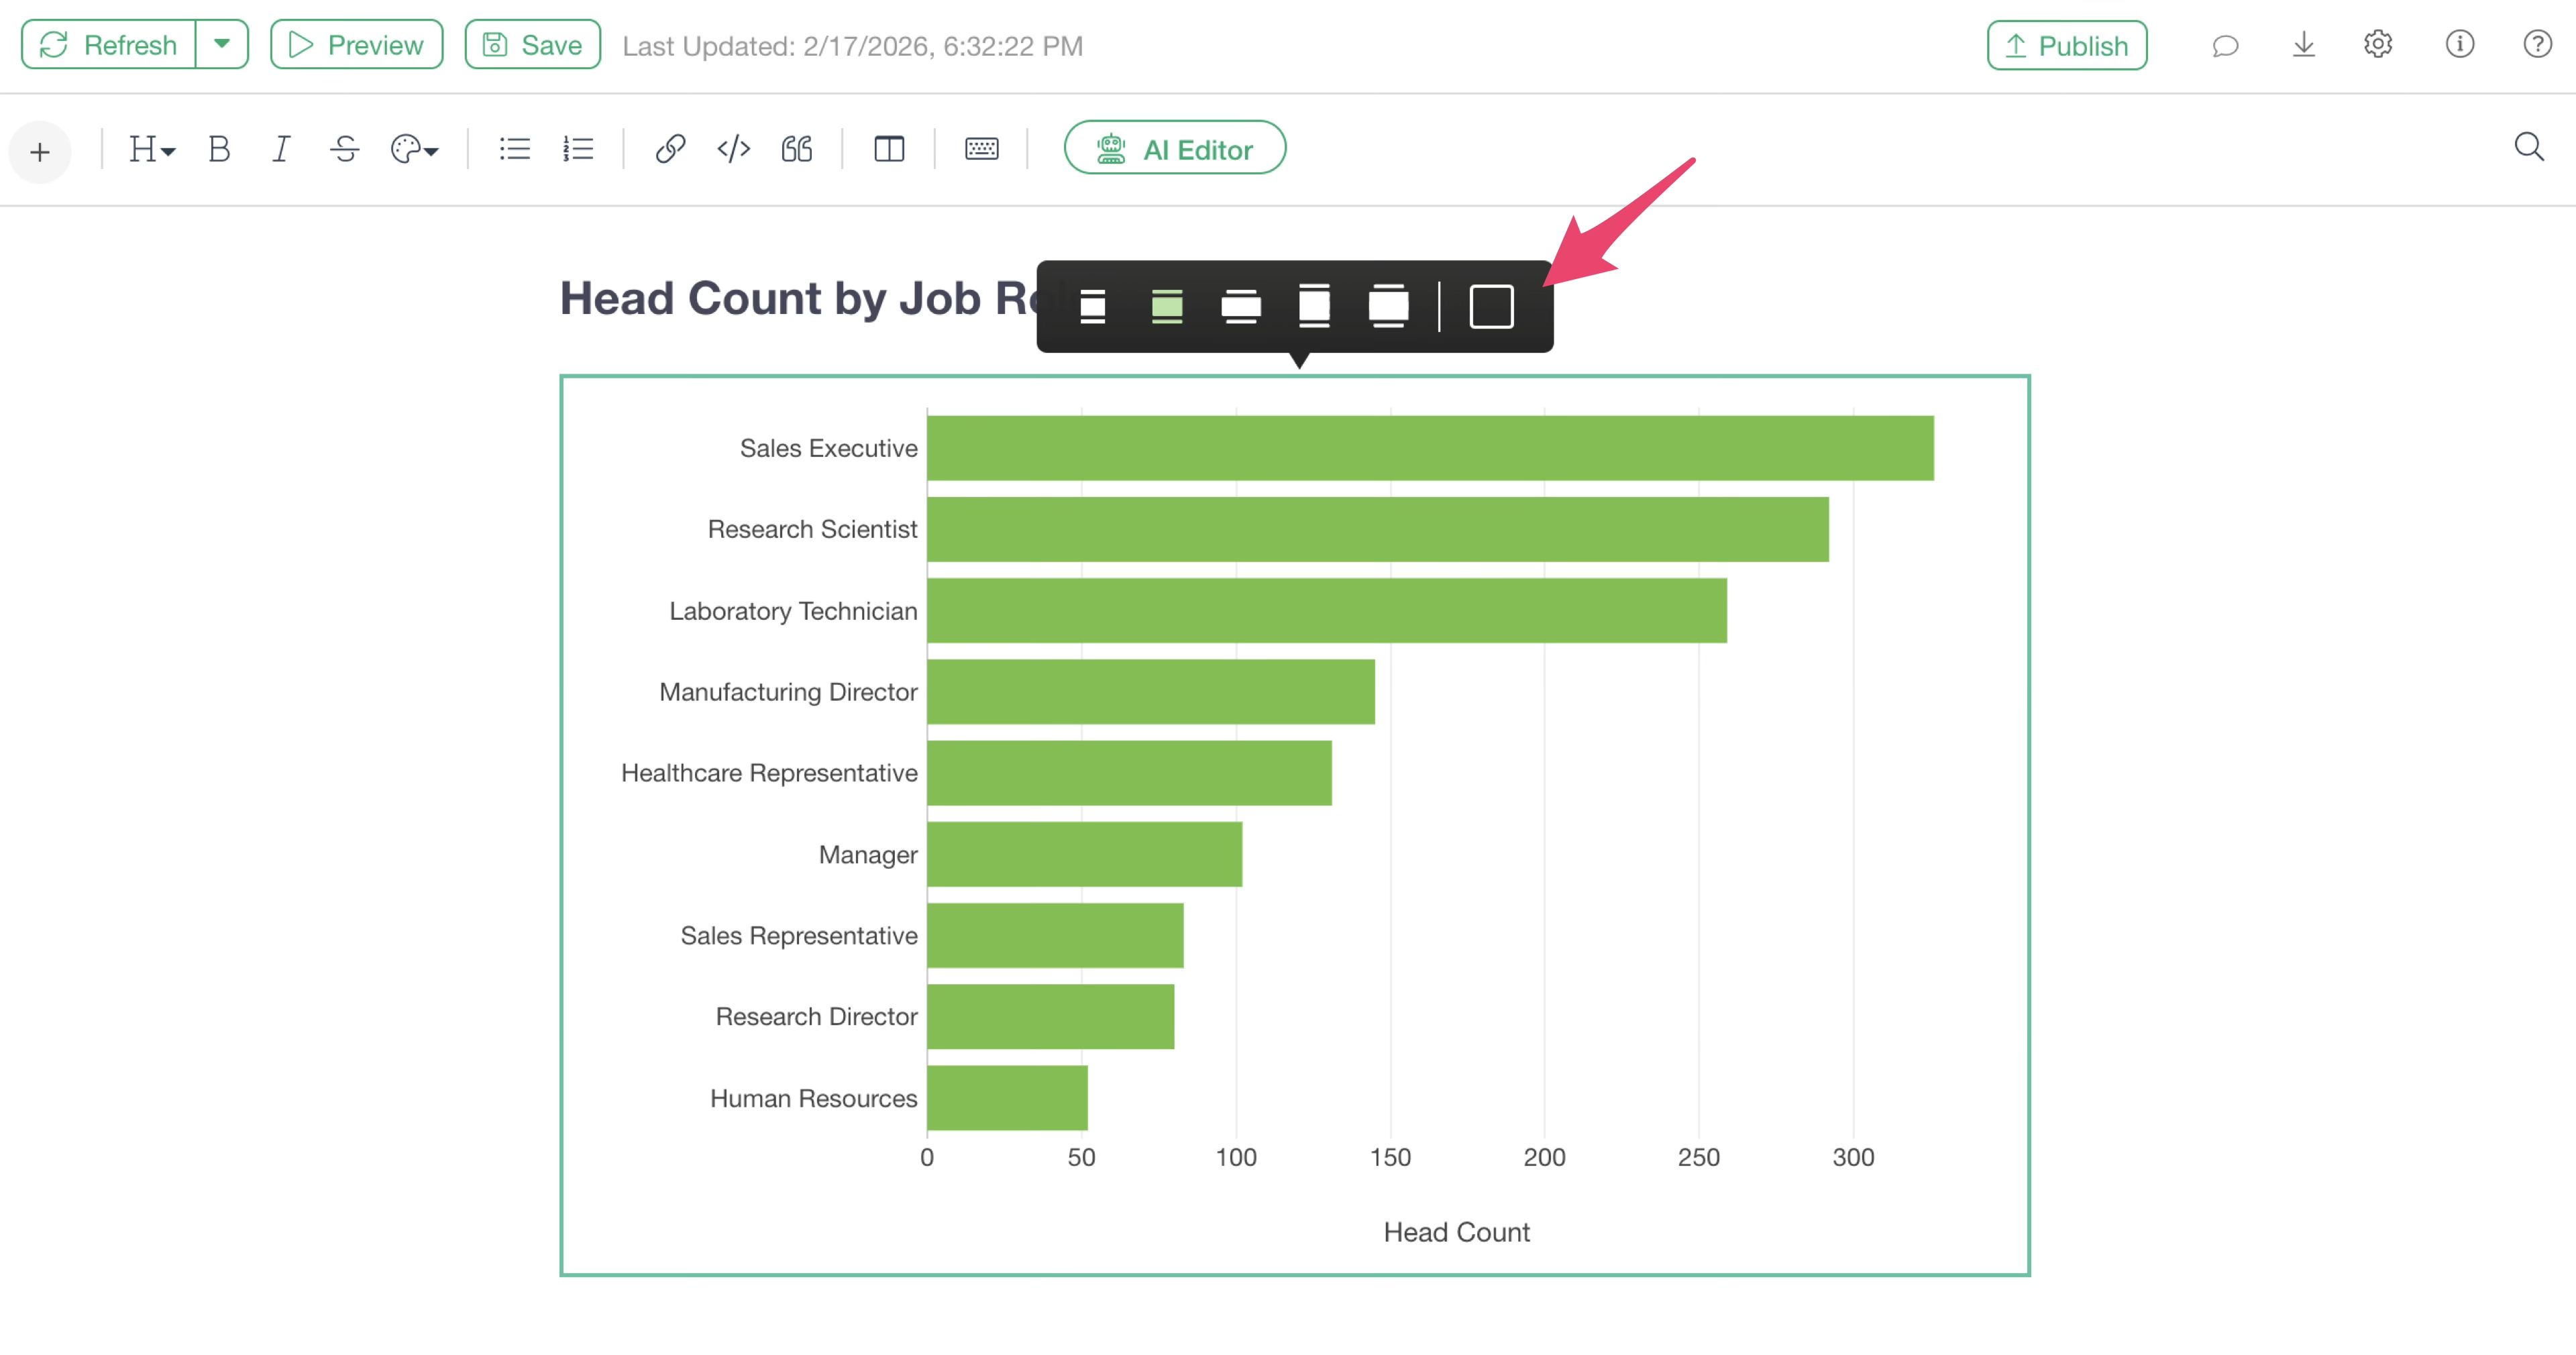
Changing Chart Size and Adding Borders
The rendering size of an added chart can be changed using the icons that appear at the top of the chart when you click on it.
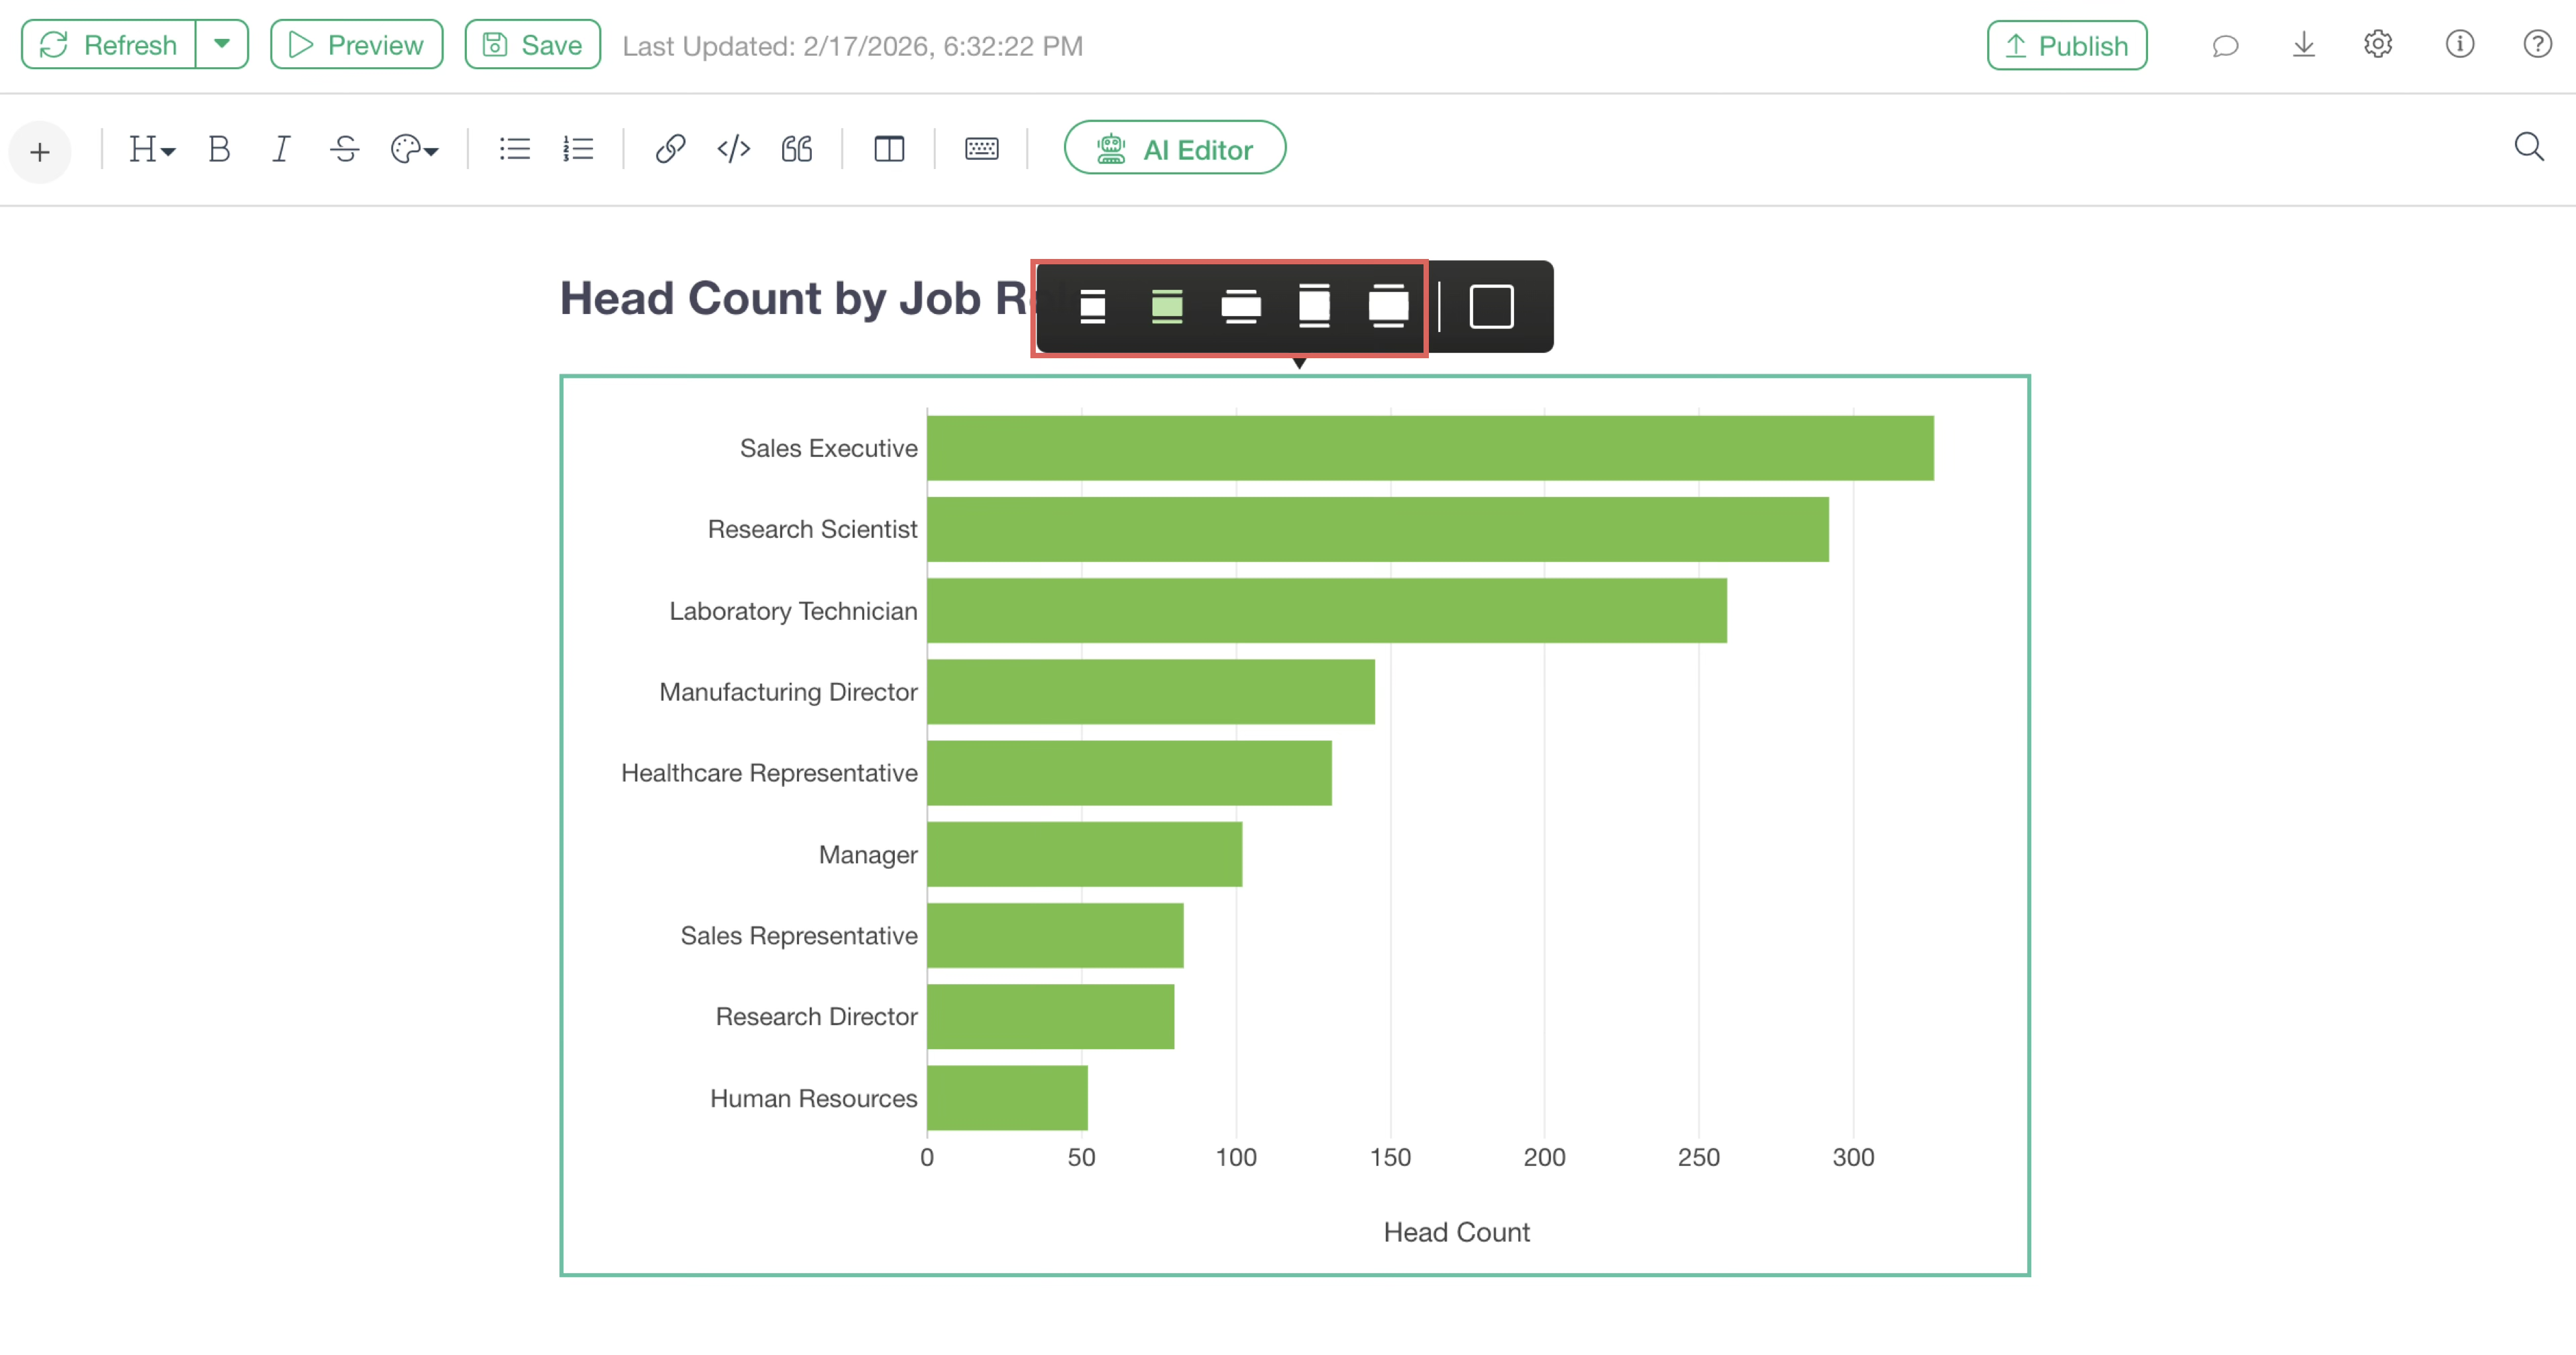
Please refer here for details on each chart size option.
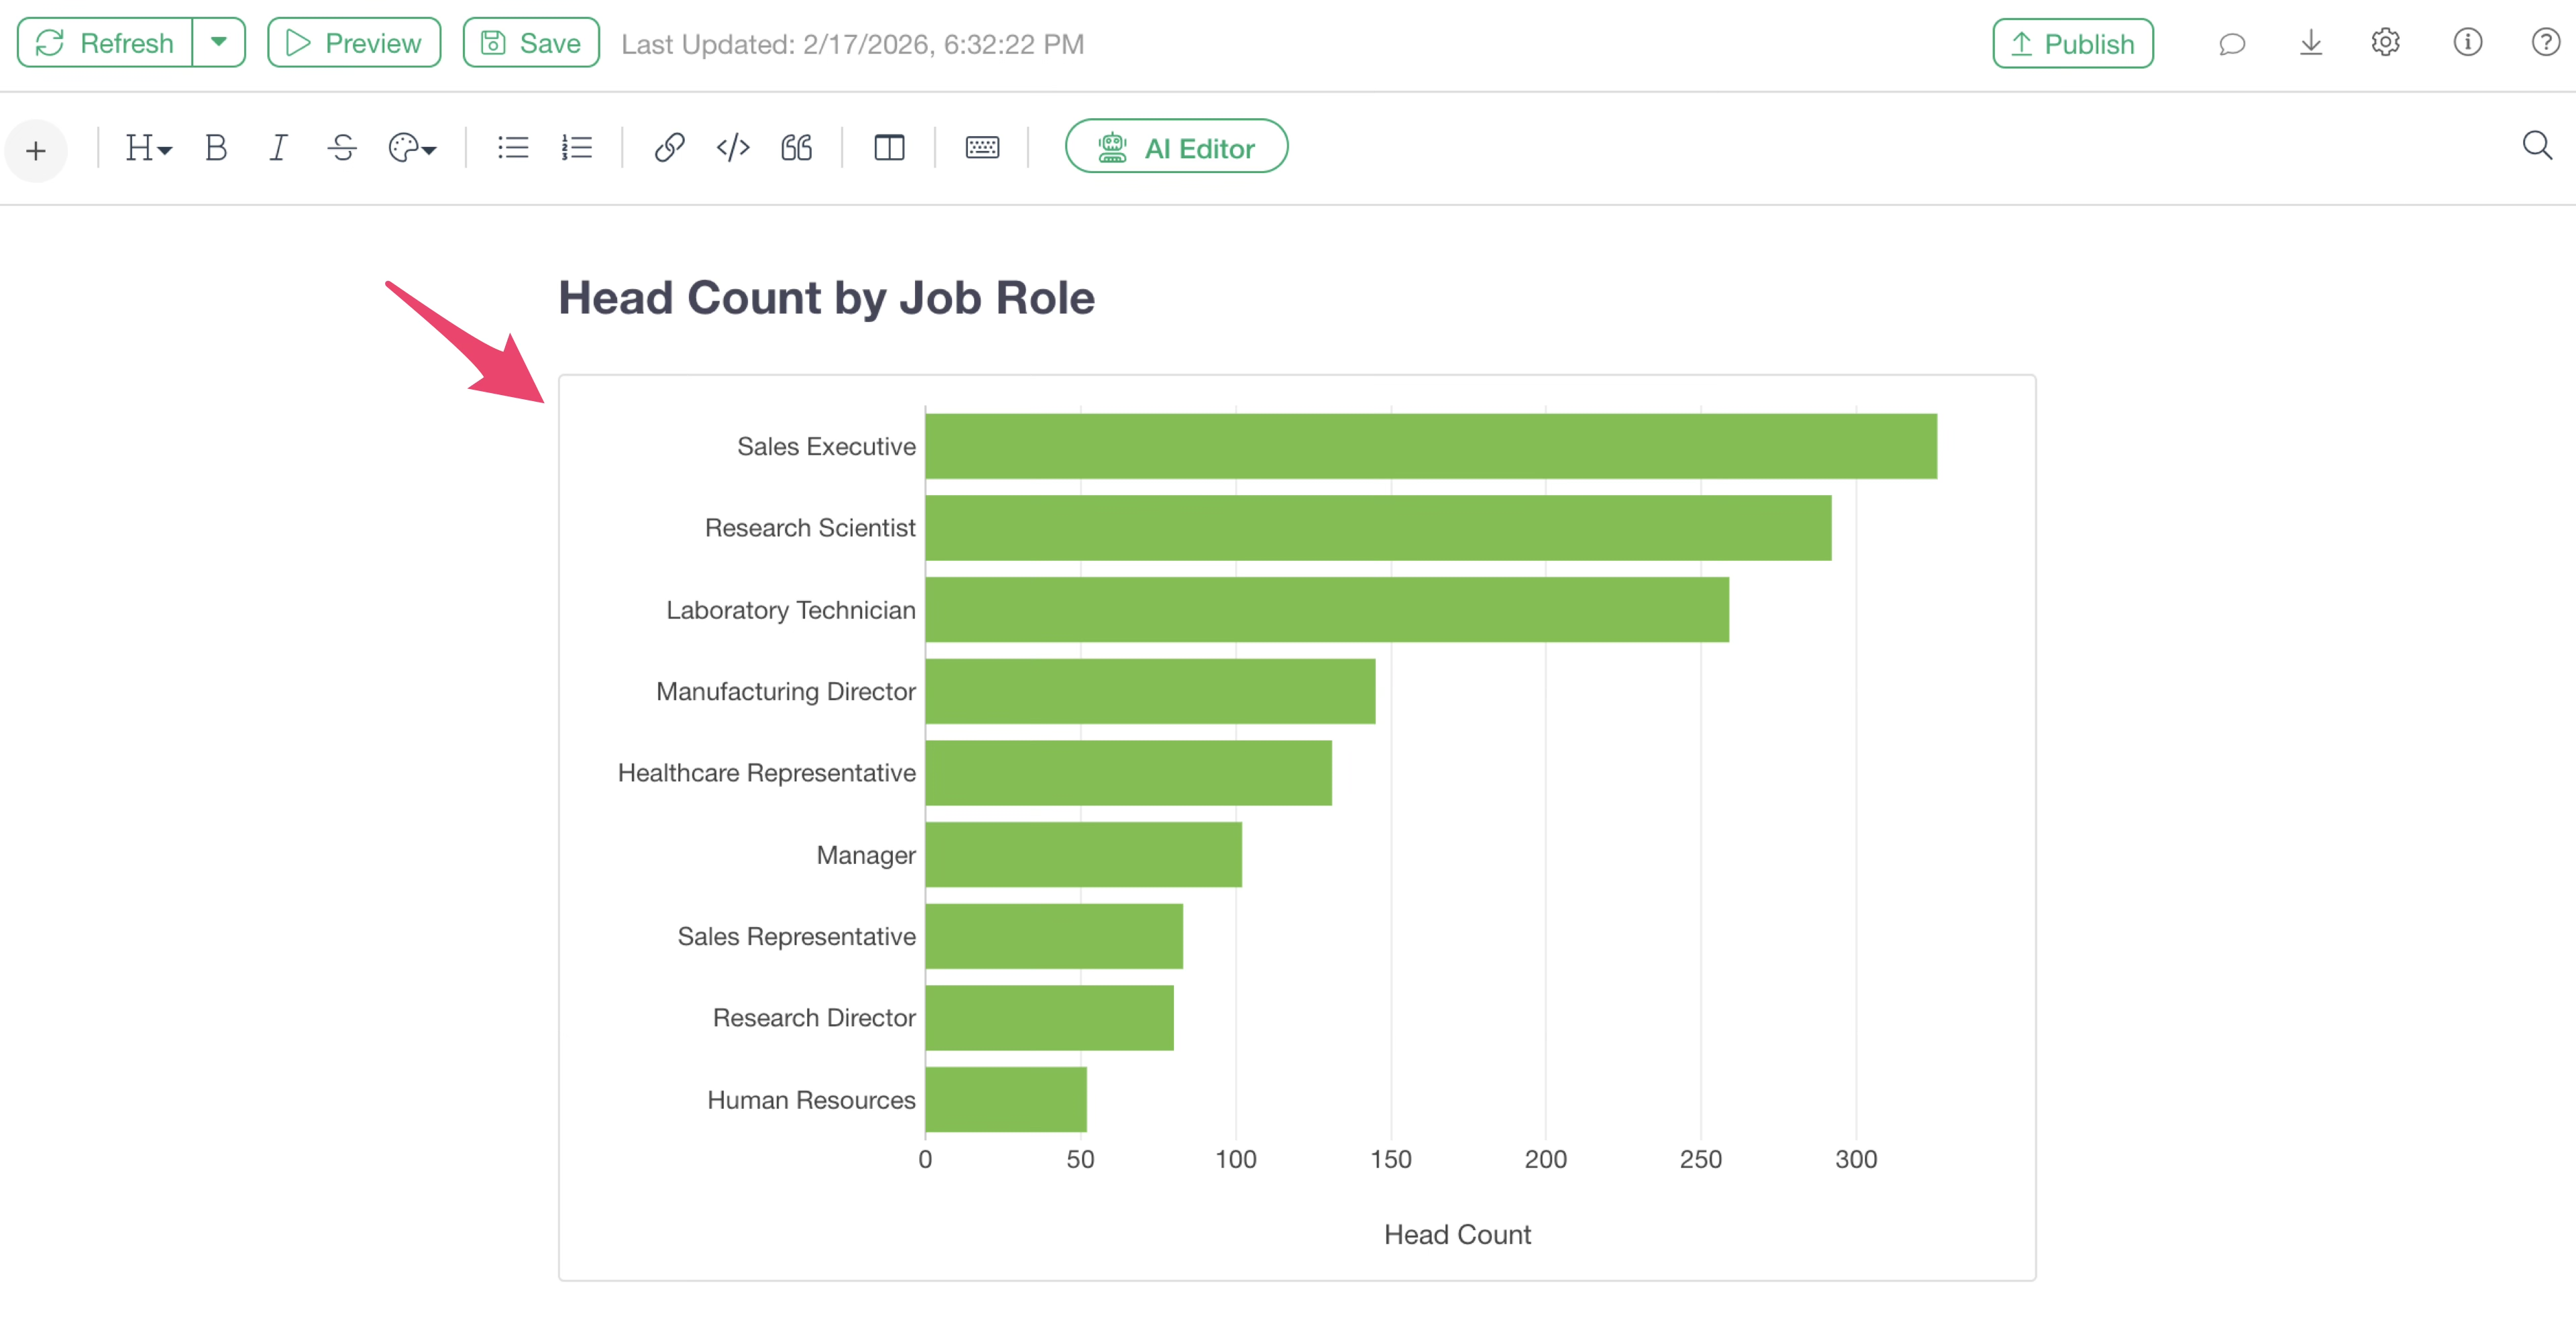
To add a border to a chart, click the border icon.
Now the border is added.
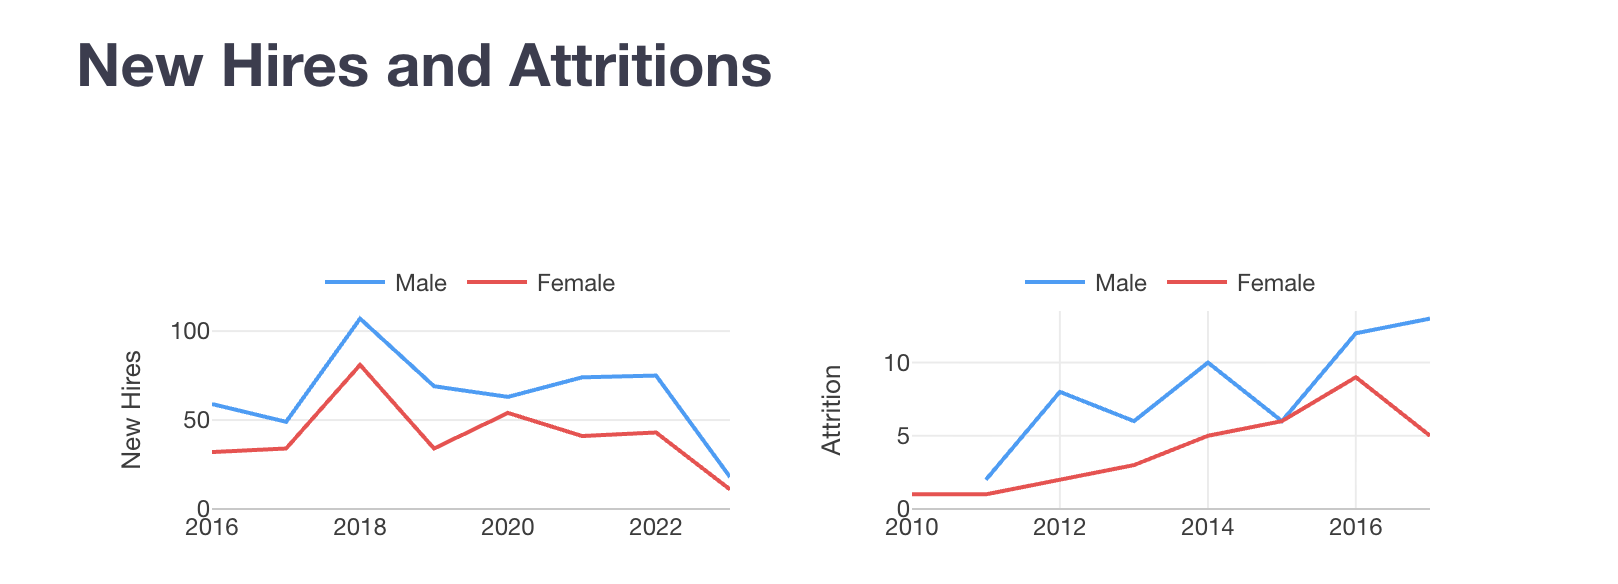
2 Columns Layout
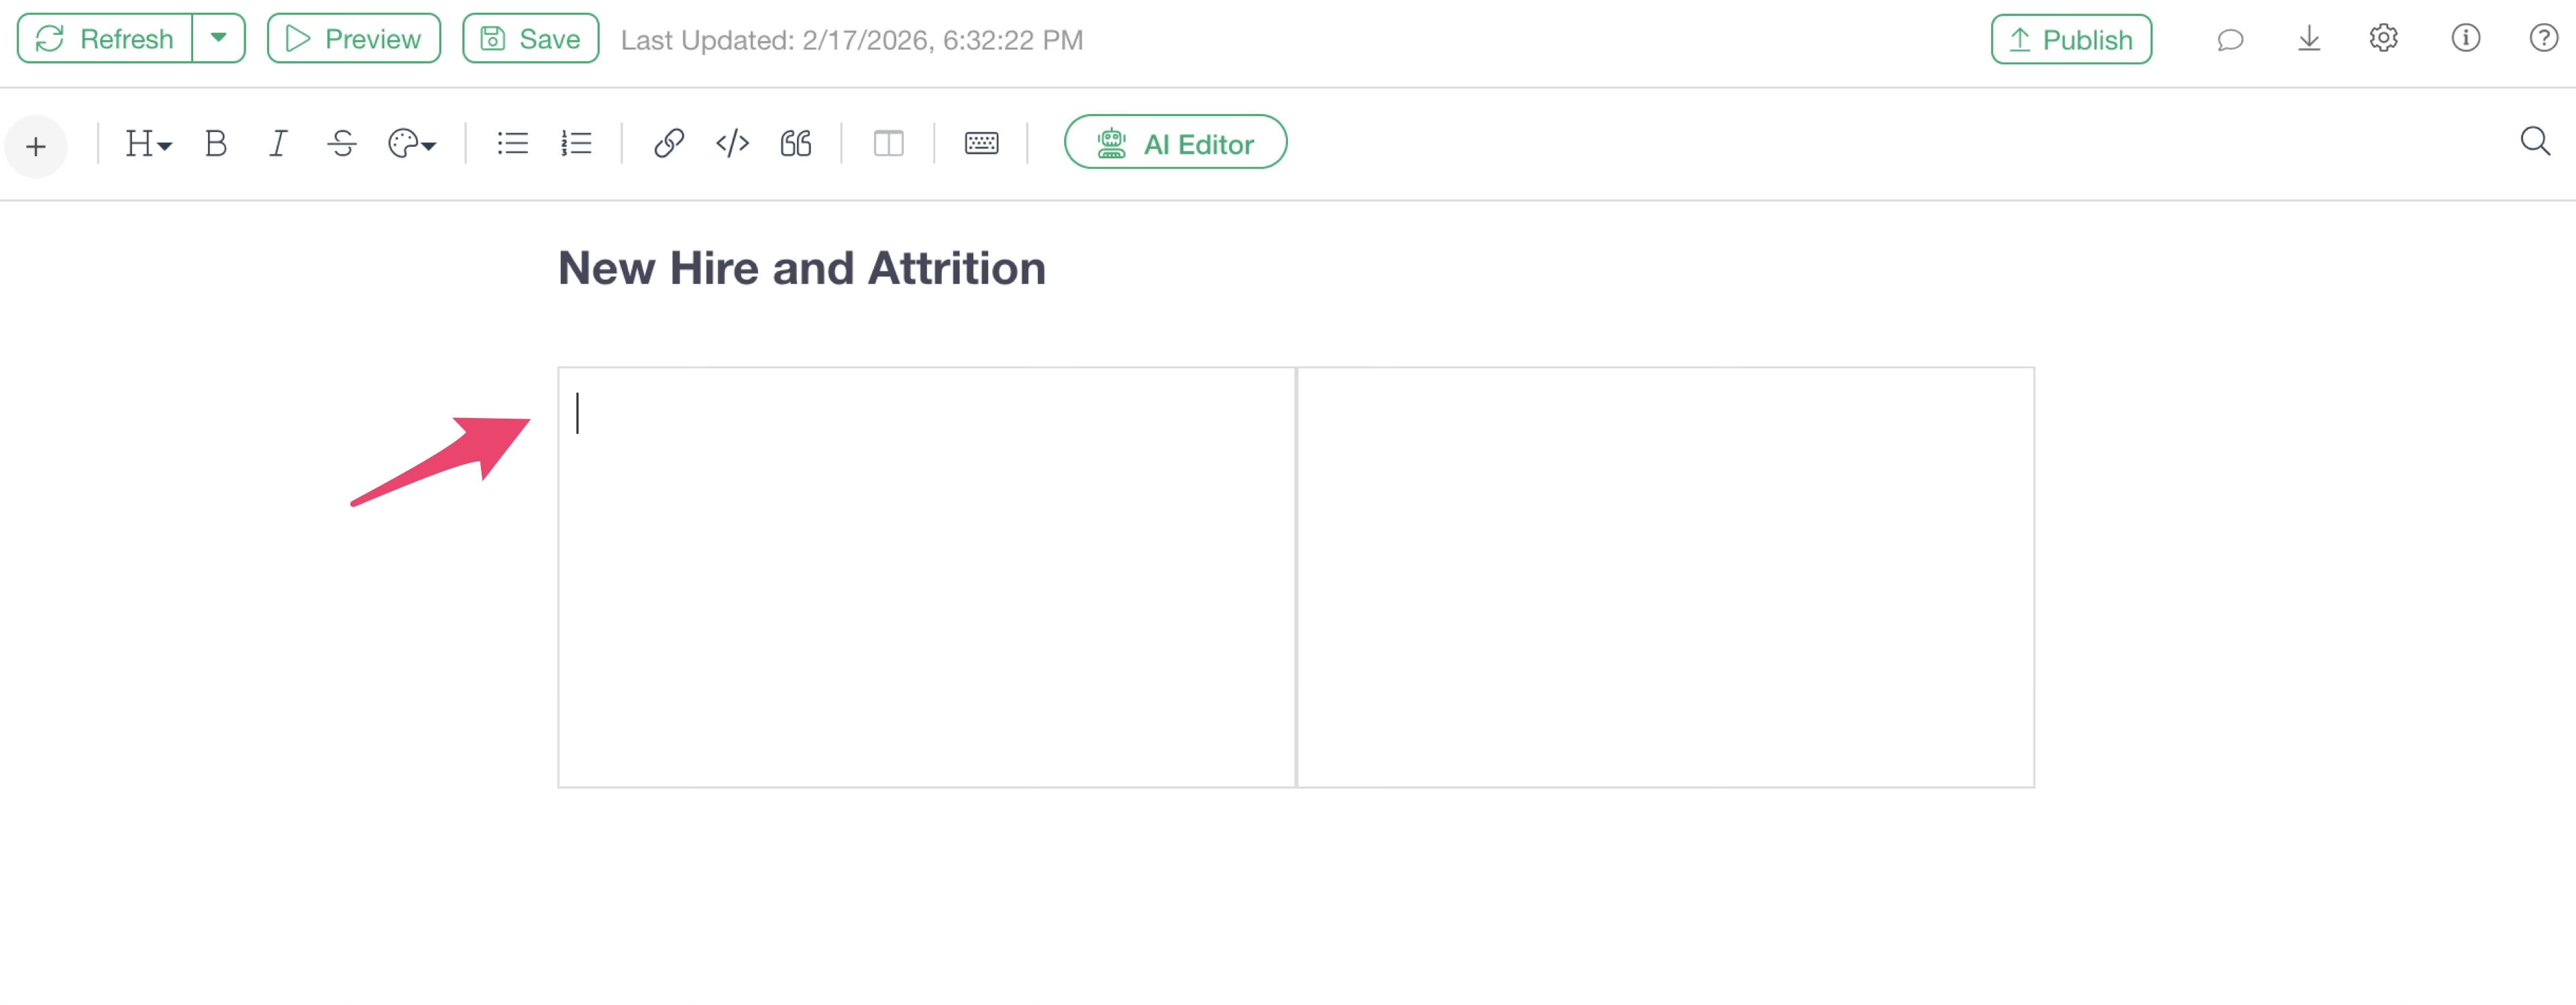
In notes, you can also set a two-column layout to place two charts side-by-side as shown below.
To use the two-column layout, select “Two Column Layout” from the tool menu.
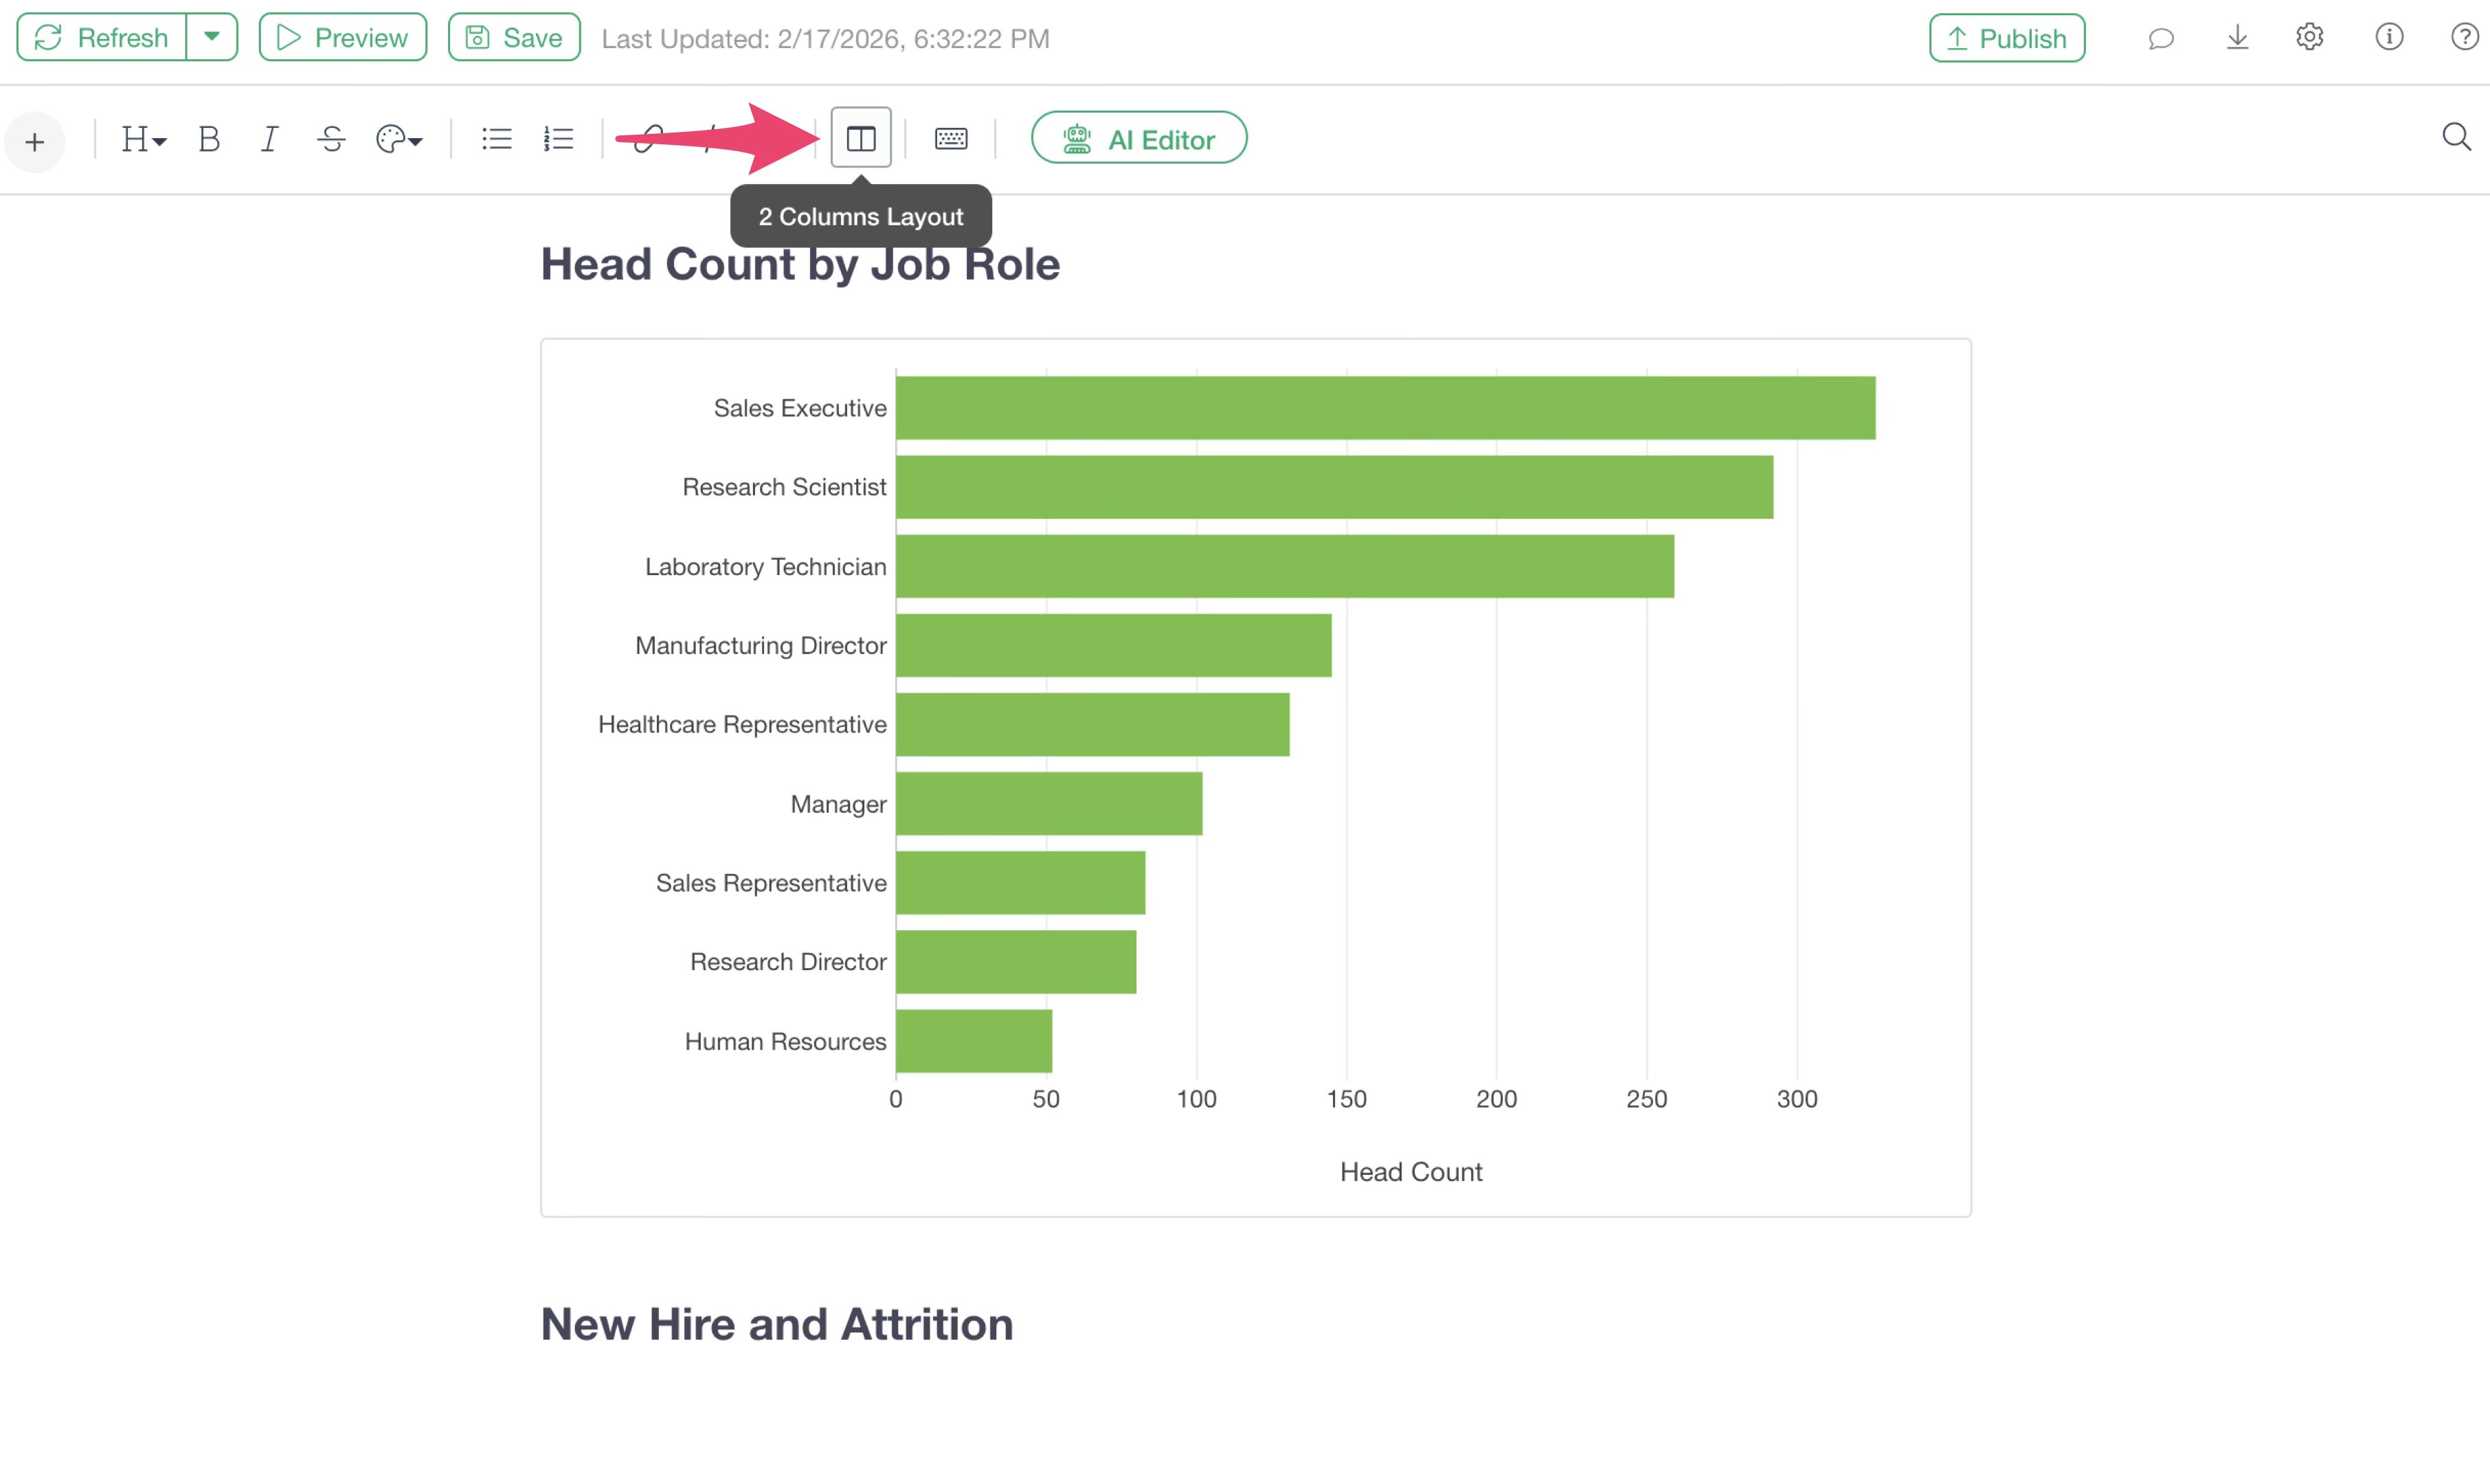 An
insertion frame for the two-column layout will then be displayed.
An
insertion frame for the two-column layout will then be displayed.
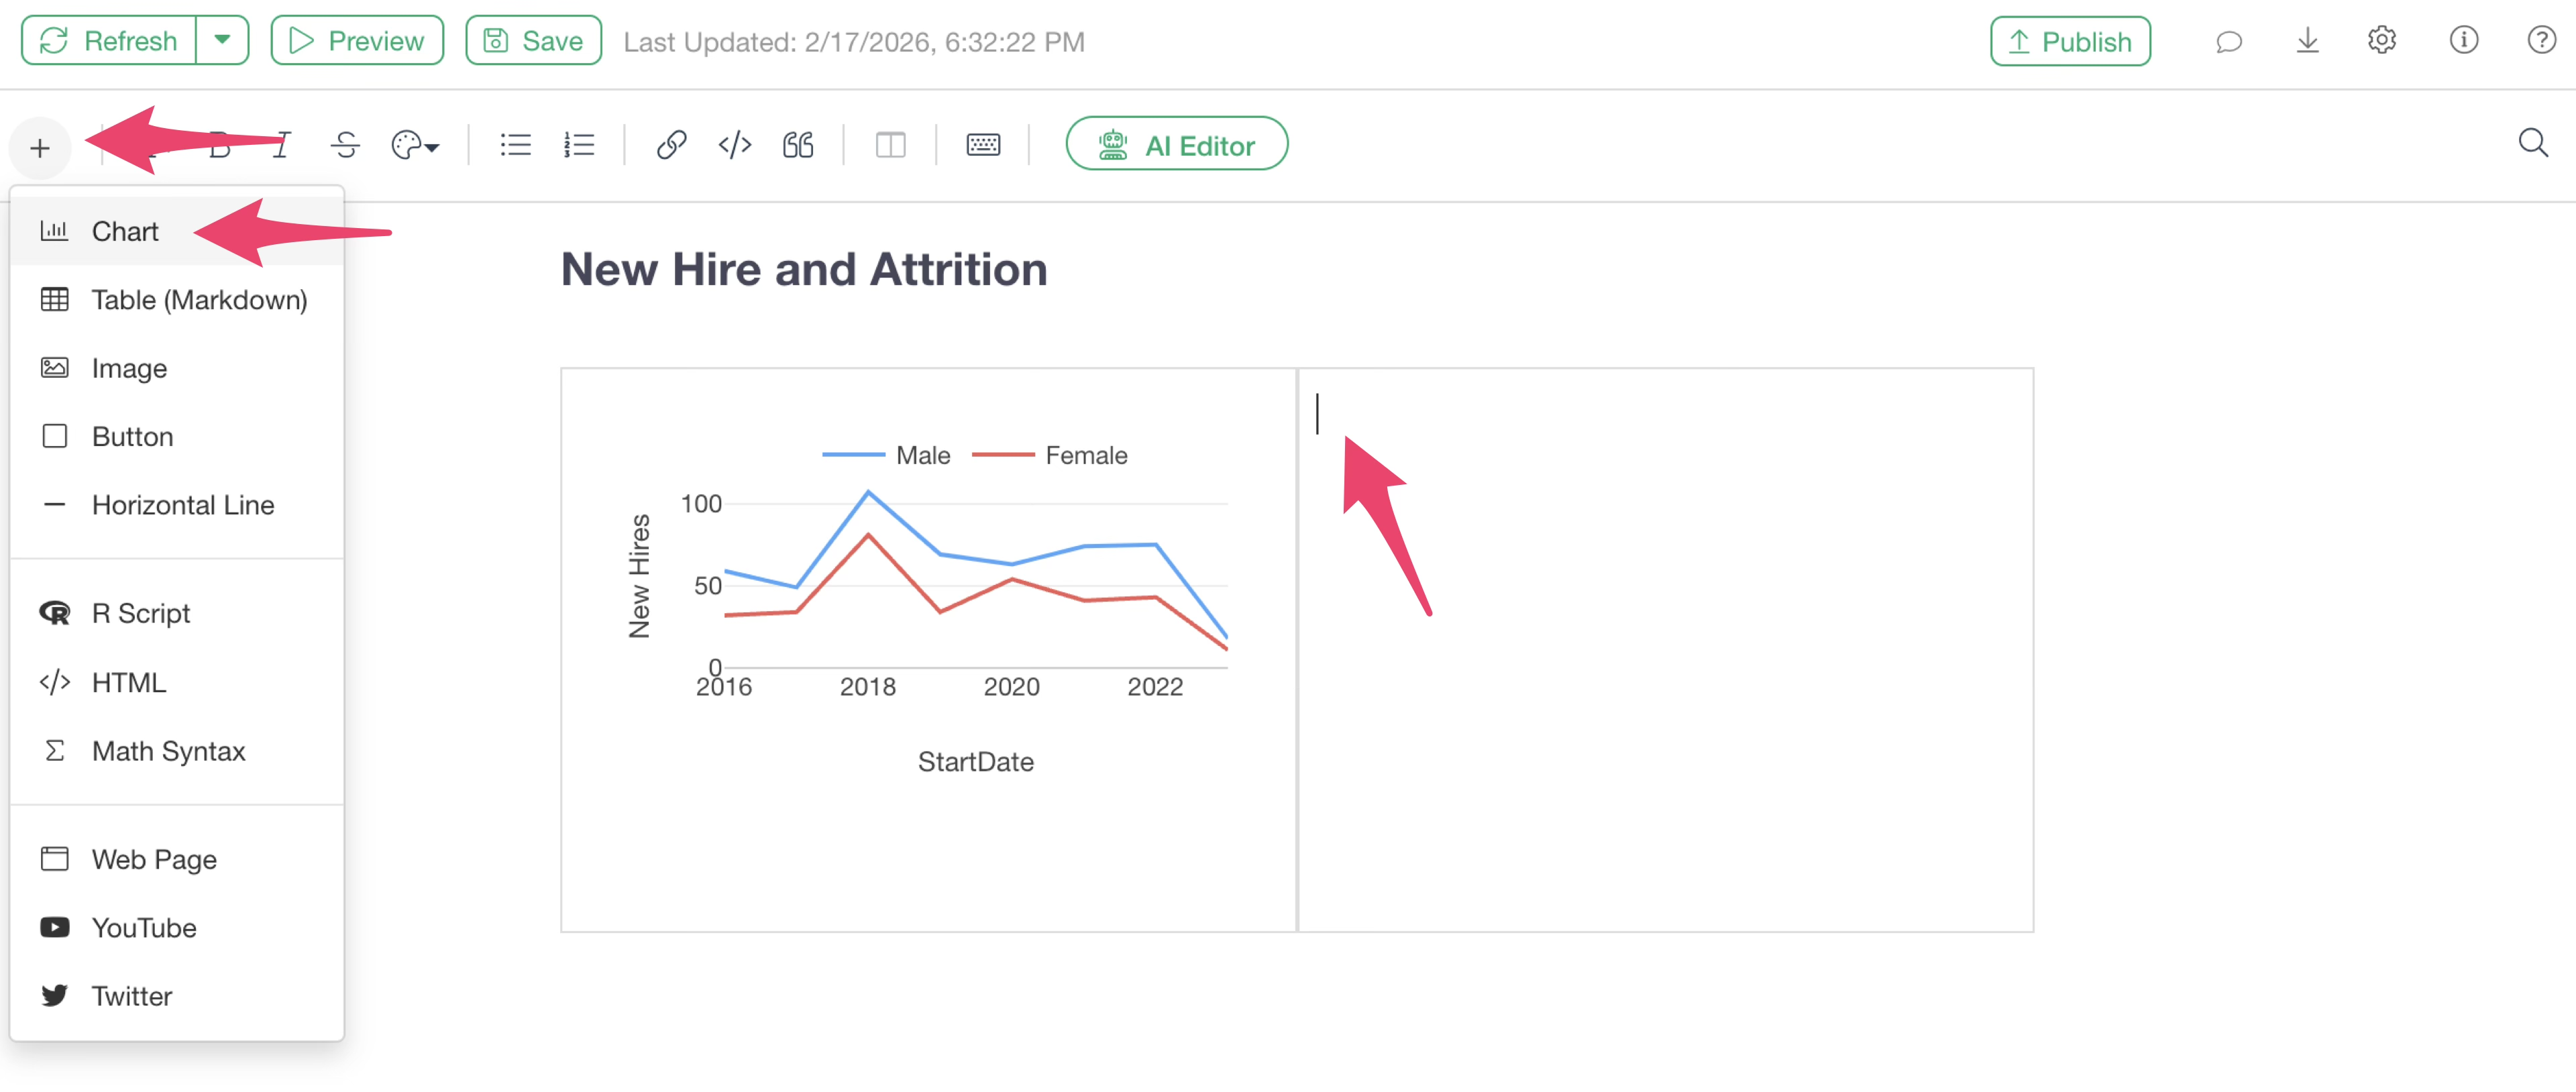
 When
inserting charts into a note using the two-column layout, click inside
the layout frame to move the caret inside before adding the chart.
When
inserting charts into a note using the two-column layout, click inside
the layout frame to move the caret inside before adding the chart.
To insert a chart into the right frame, click inside the right frame to move the caret there before adding the chart.
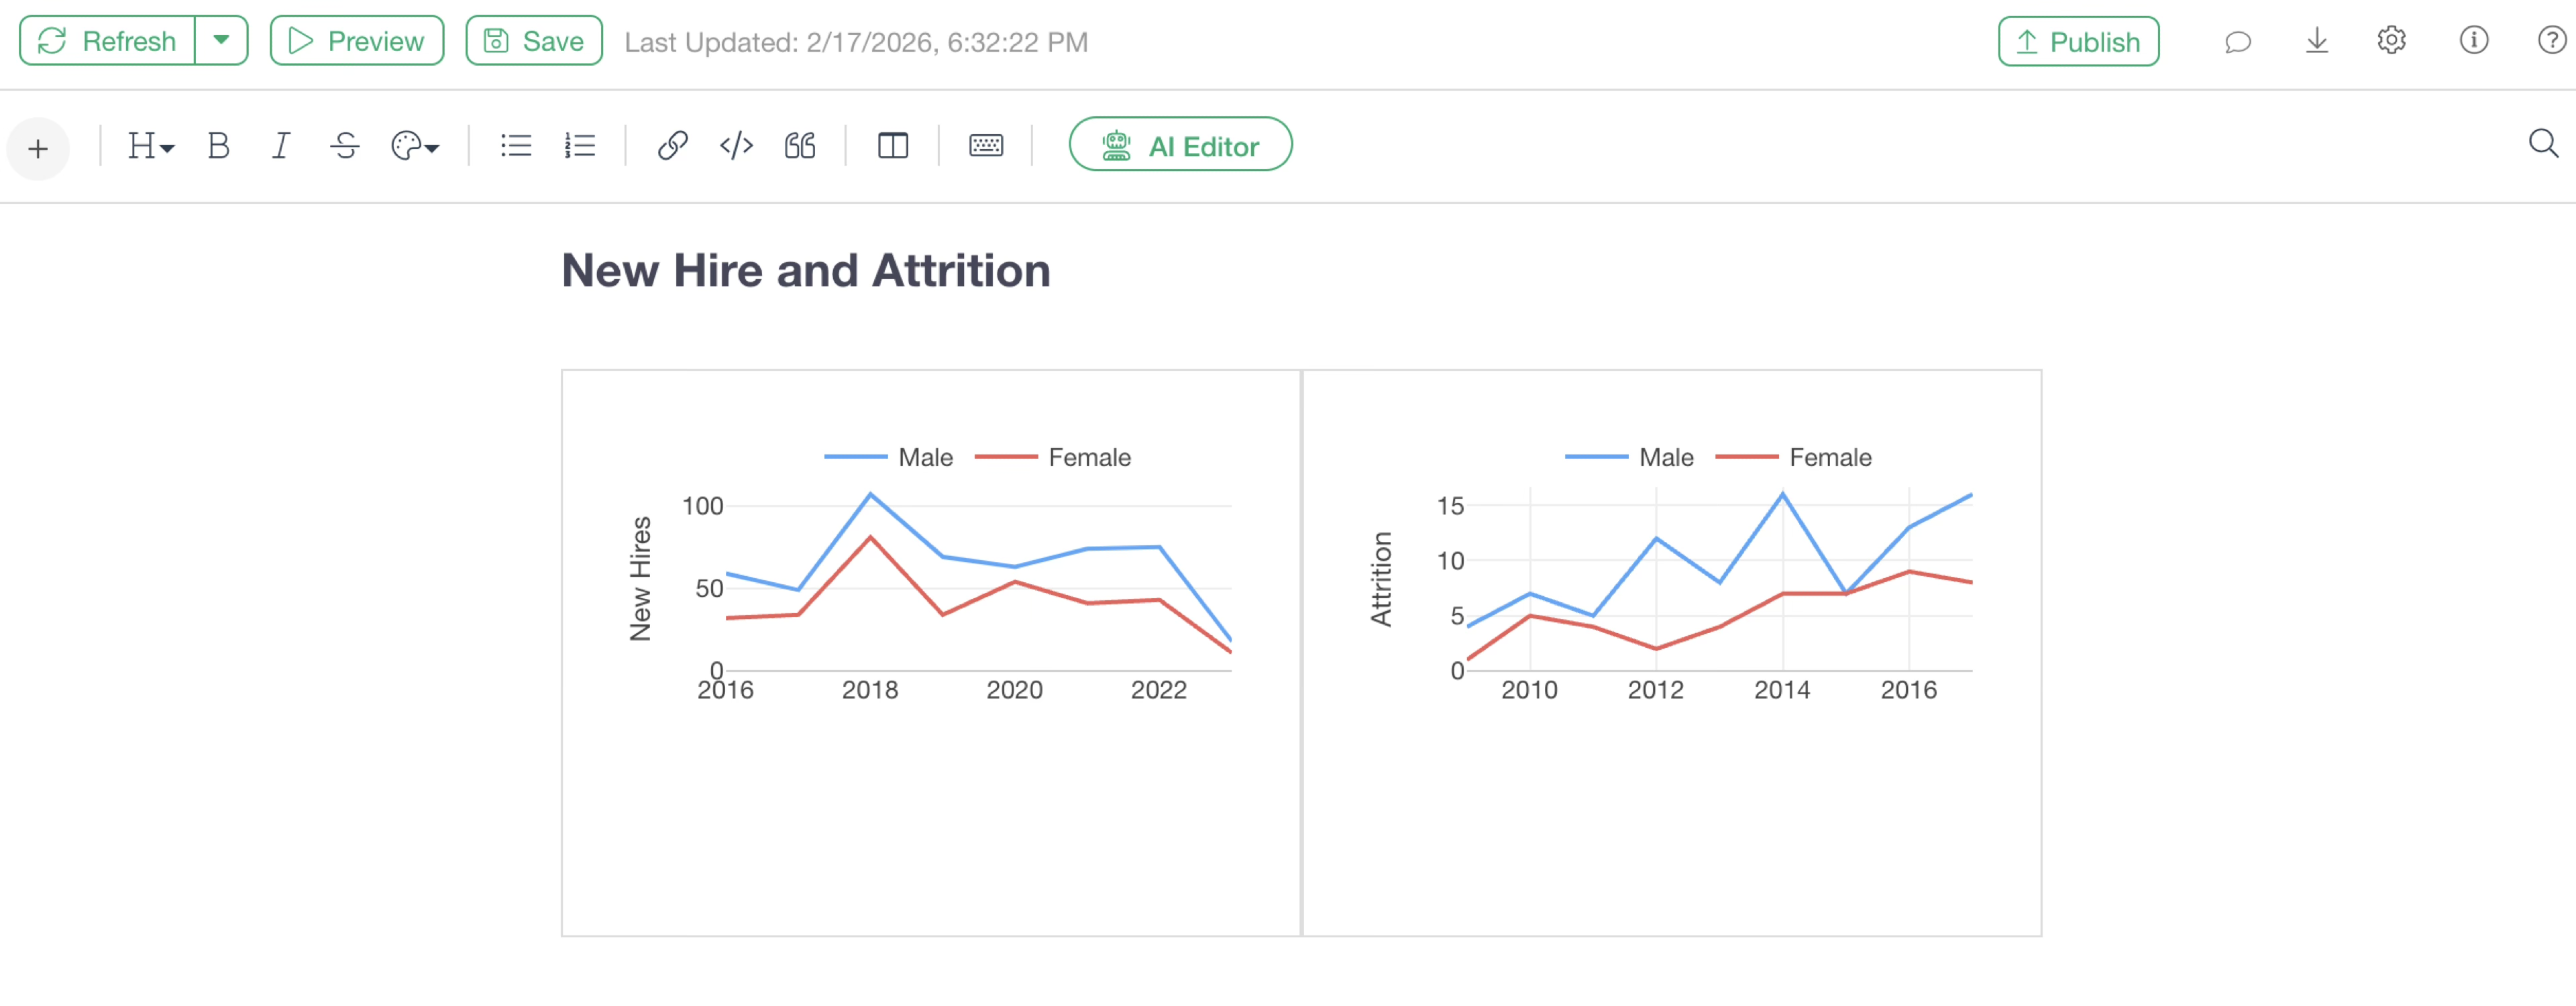
By adding charts to each frame, you can arrange them in two columns.
Adding Links
You can add URL links to text in a note or set links that jump to specific headings.
URL
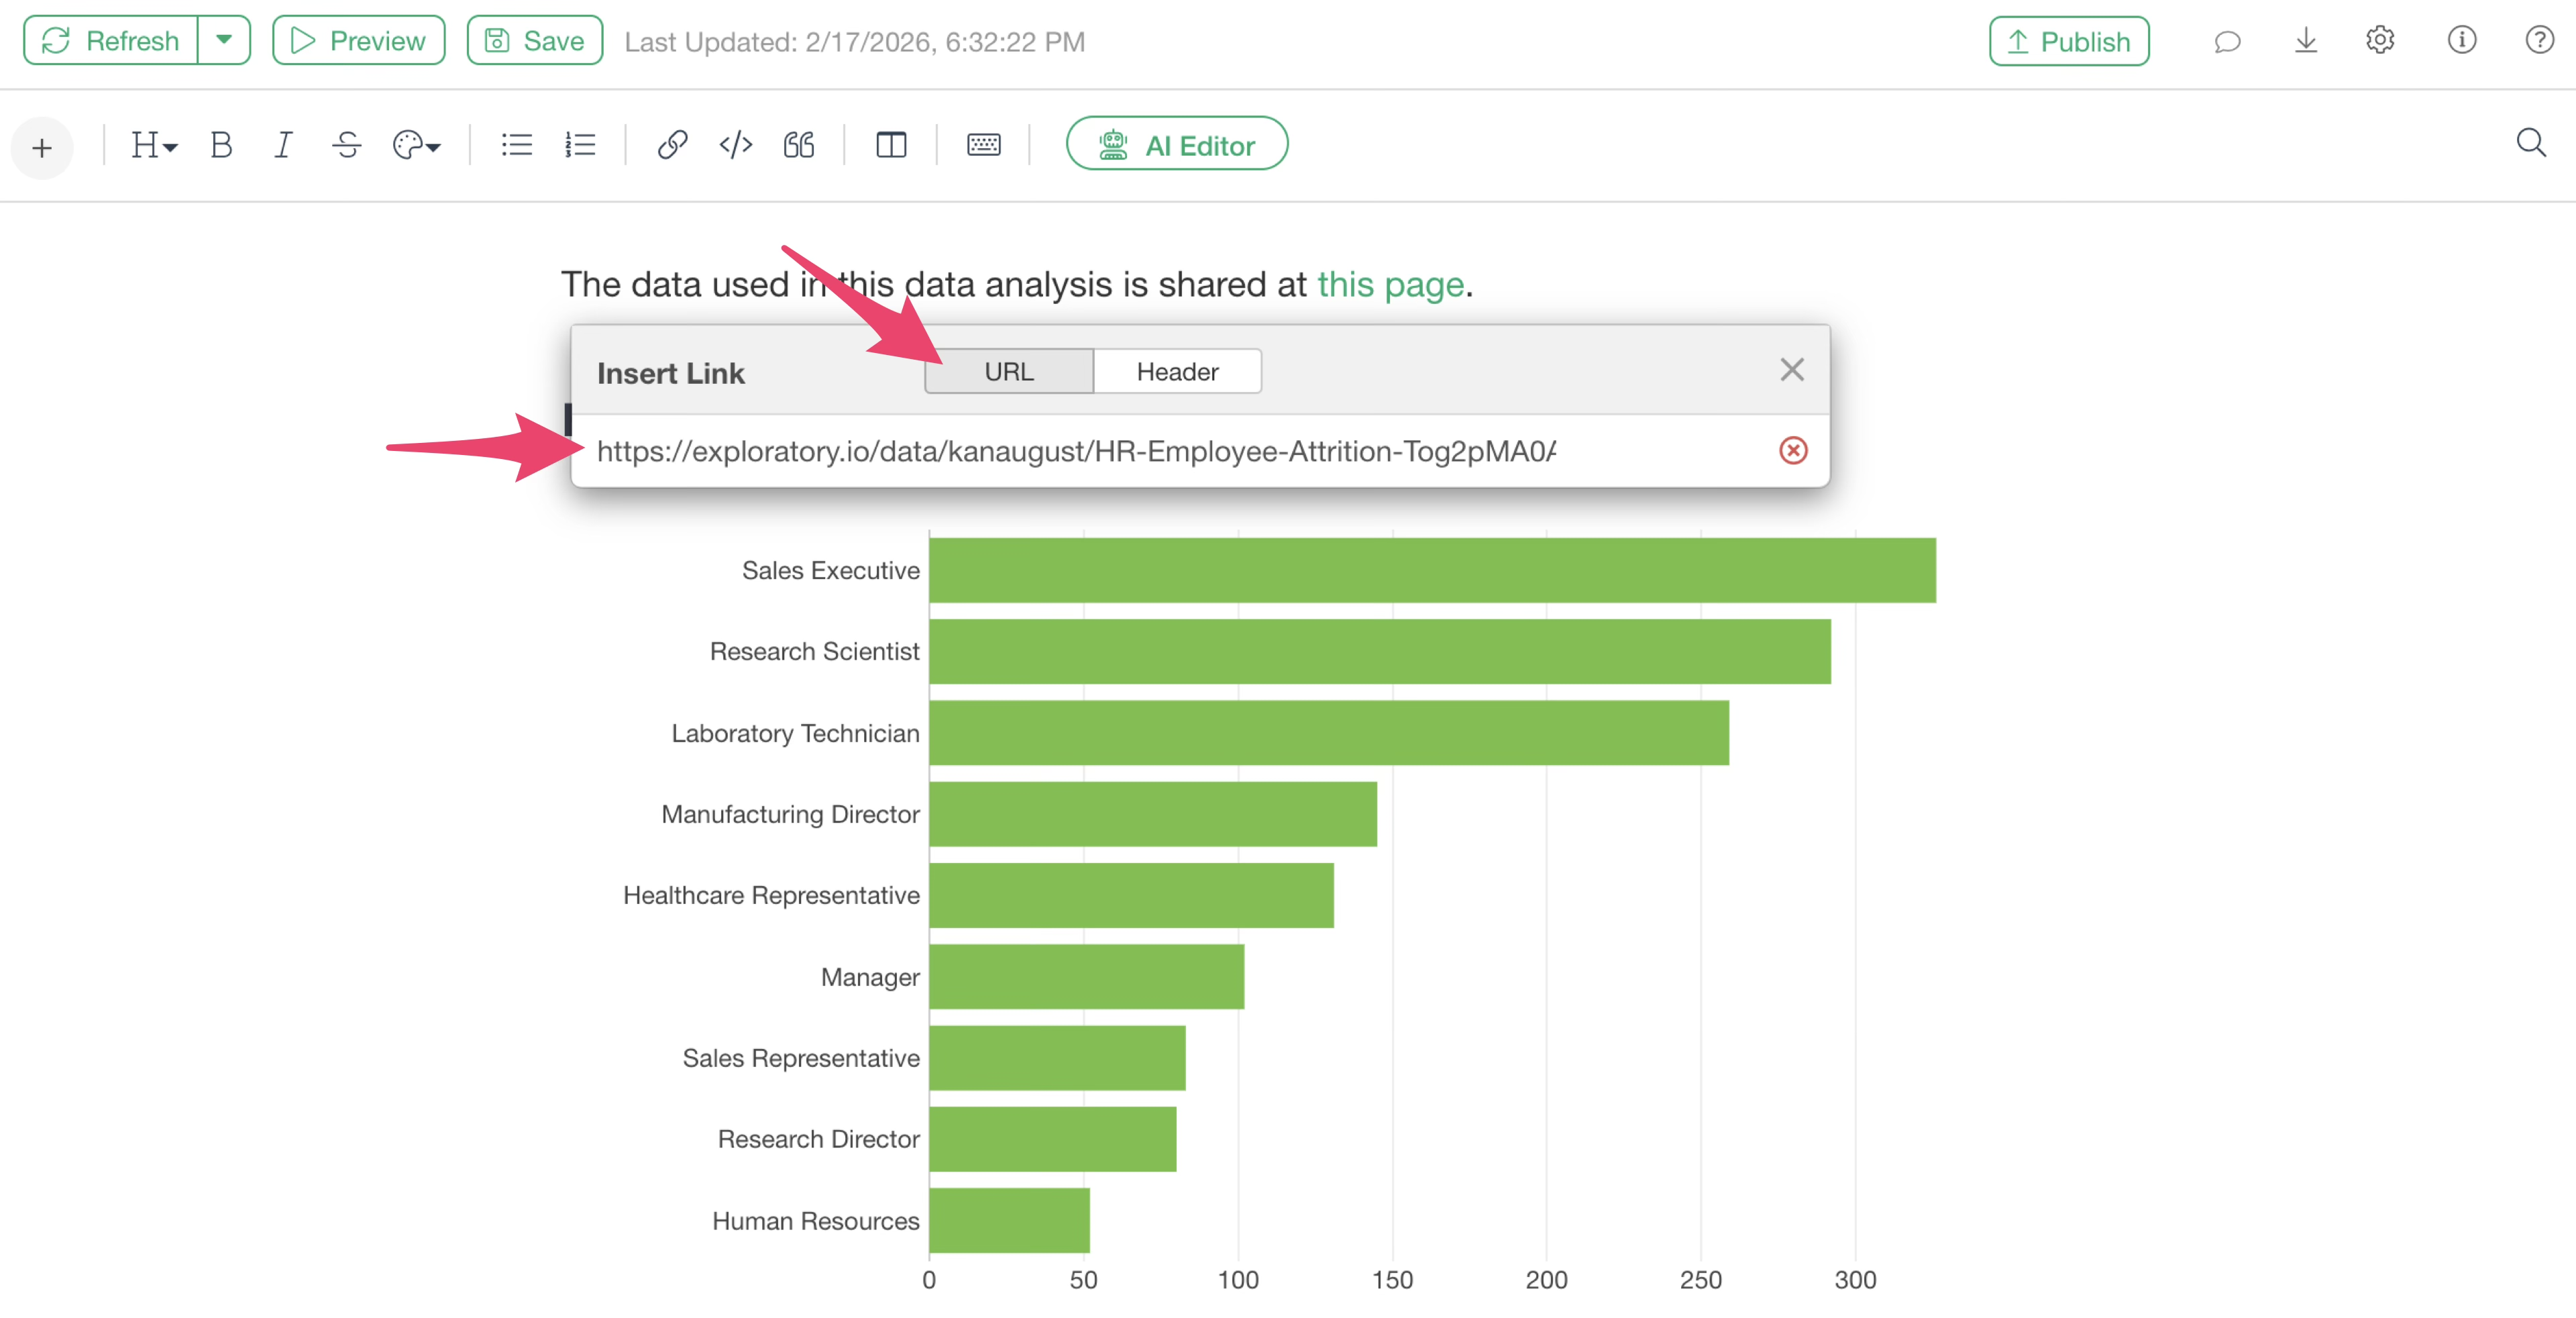
To add a URL link to a string of text, select the text and click the “Link” button on the toolbar.
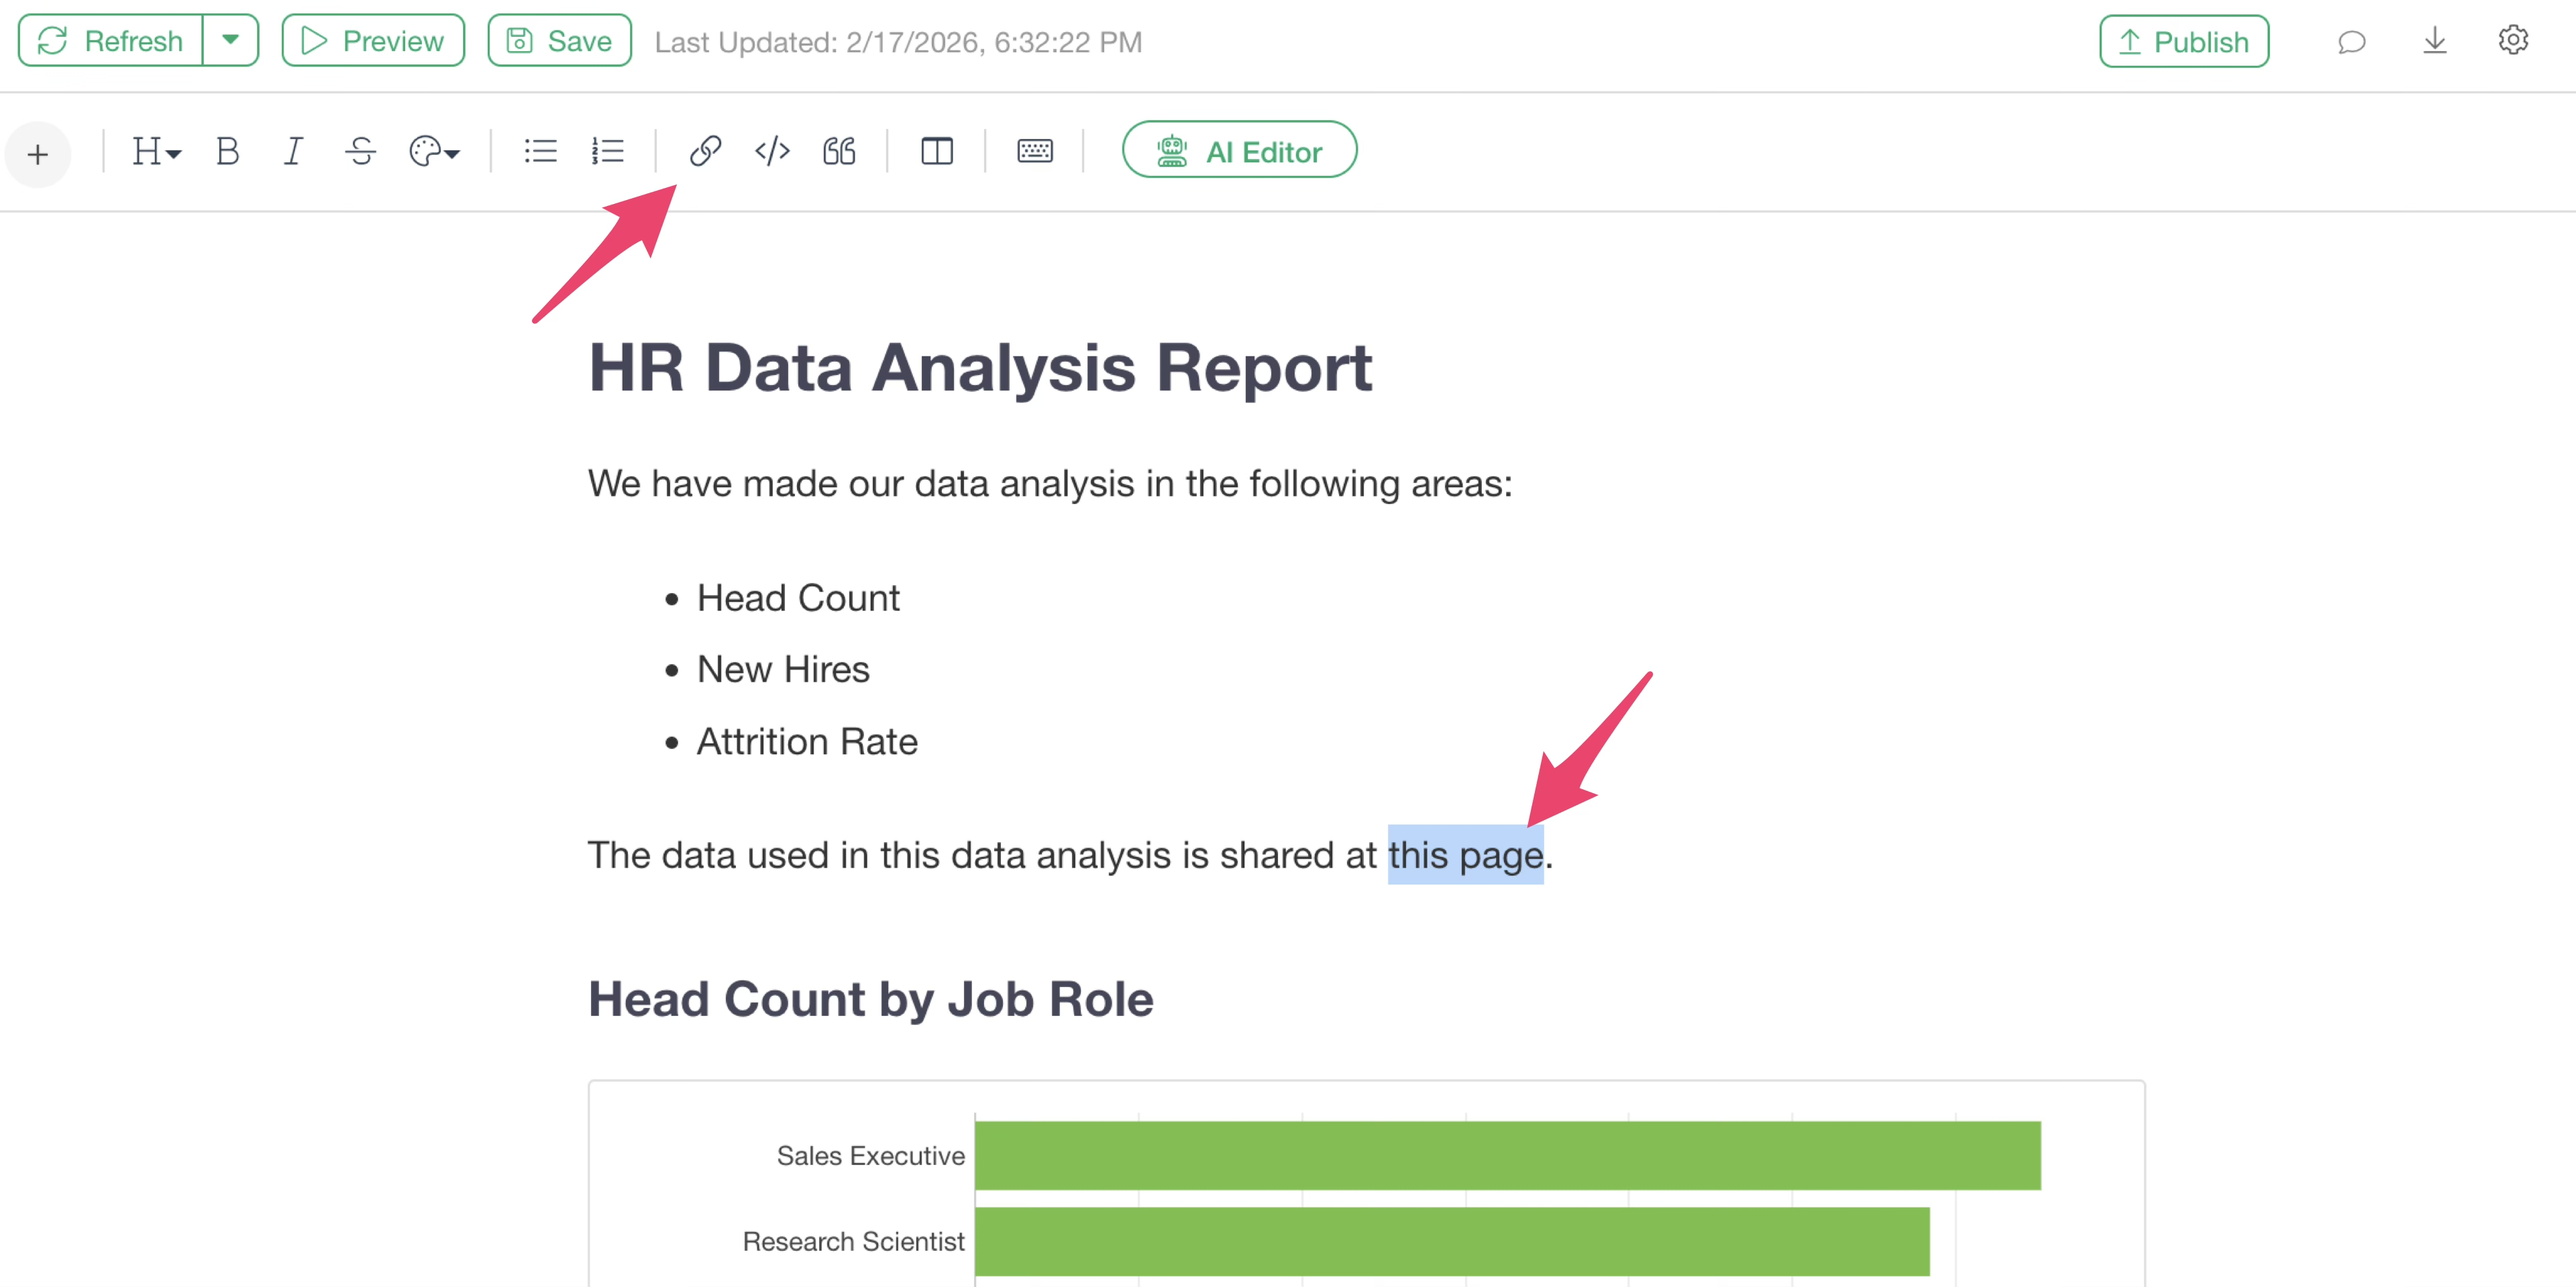
A link insertion dialog will appear; select the URL tab, paste the URL, and press the Enter key.
Headings
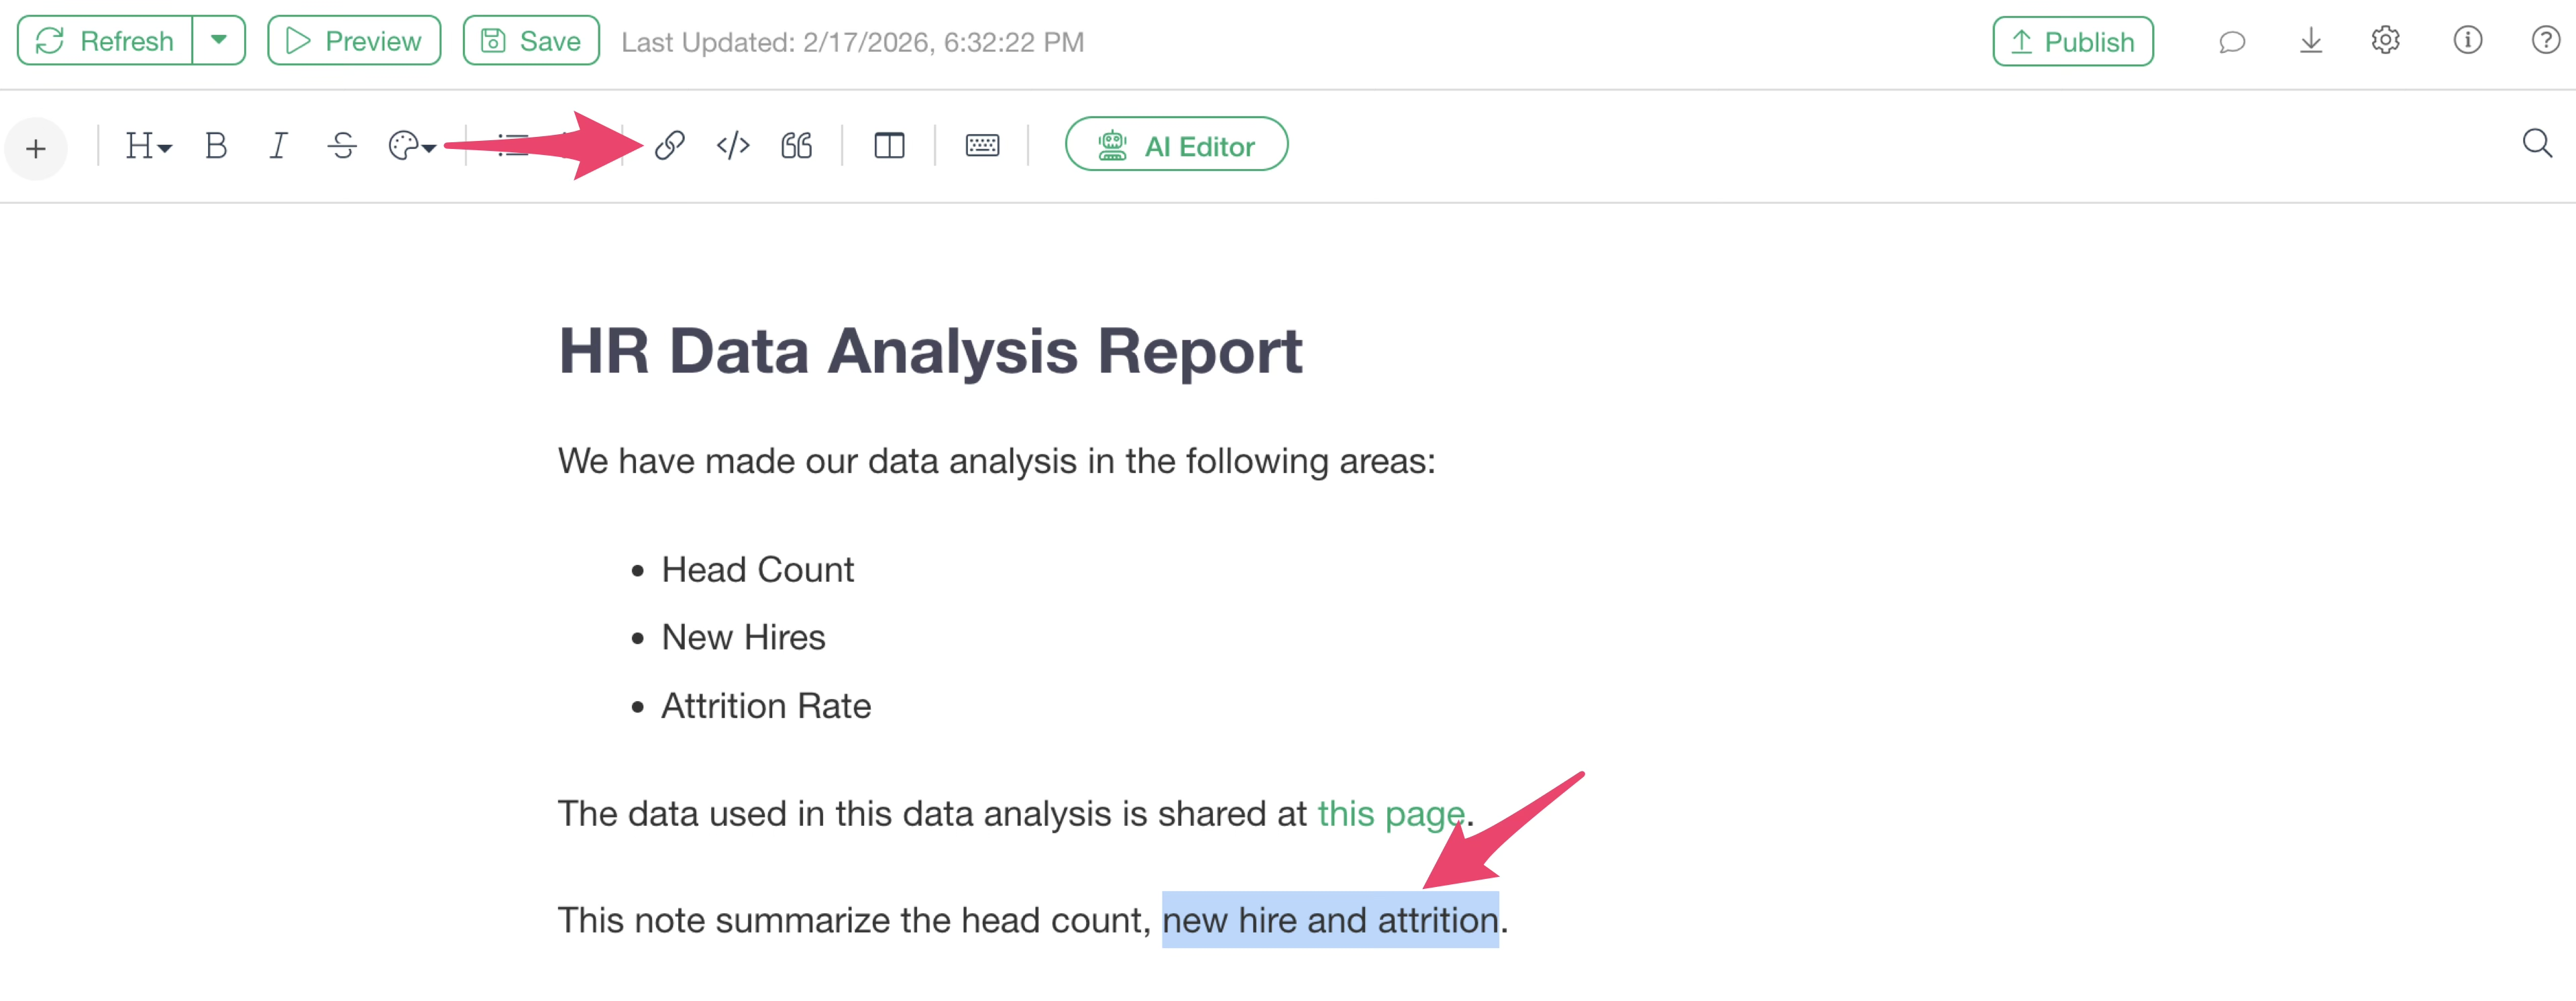
To add a link that jumps to a specific heading, select the text and click the “Link” button on the toolbar.
Clicking the “Header” tab will display a list of available headings; click on the desired heading.
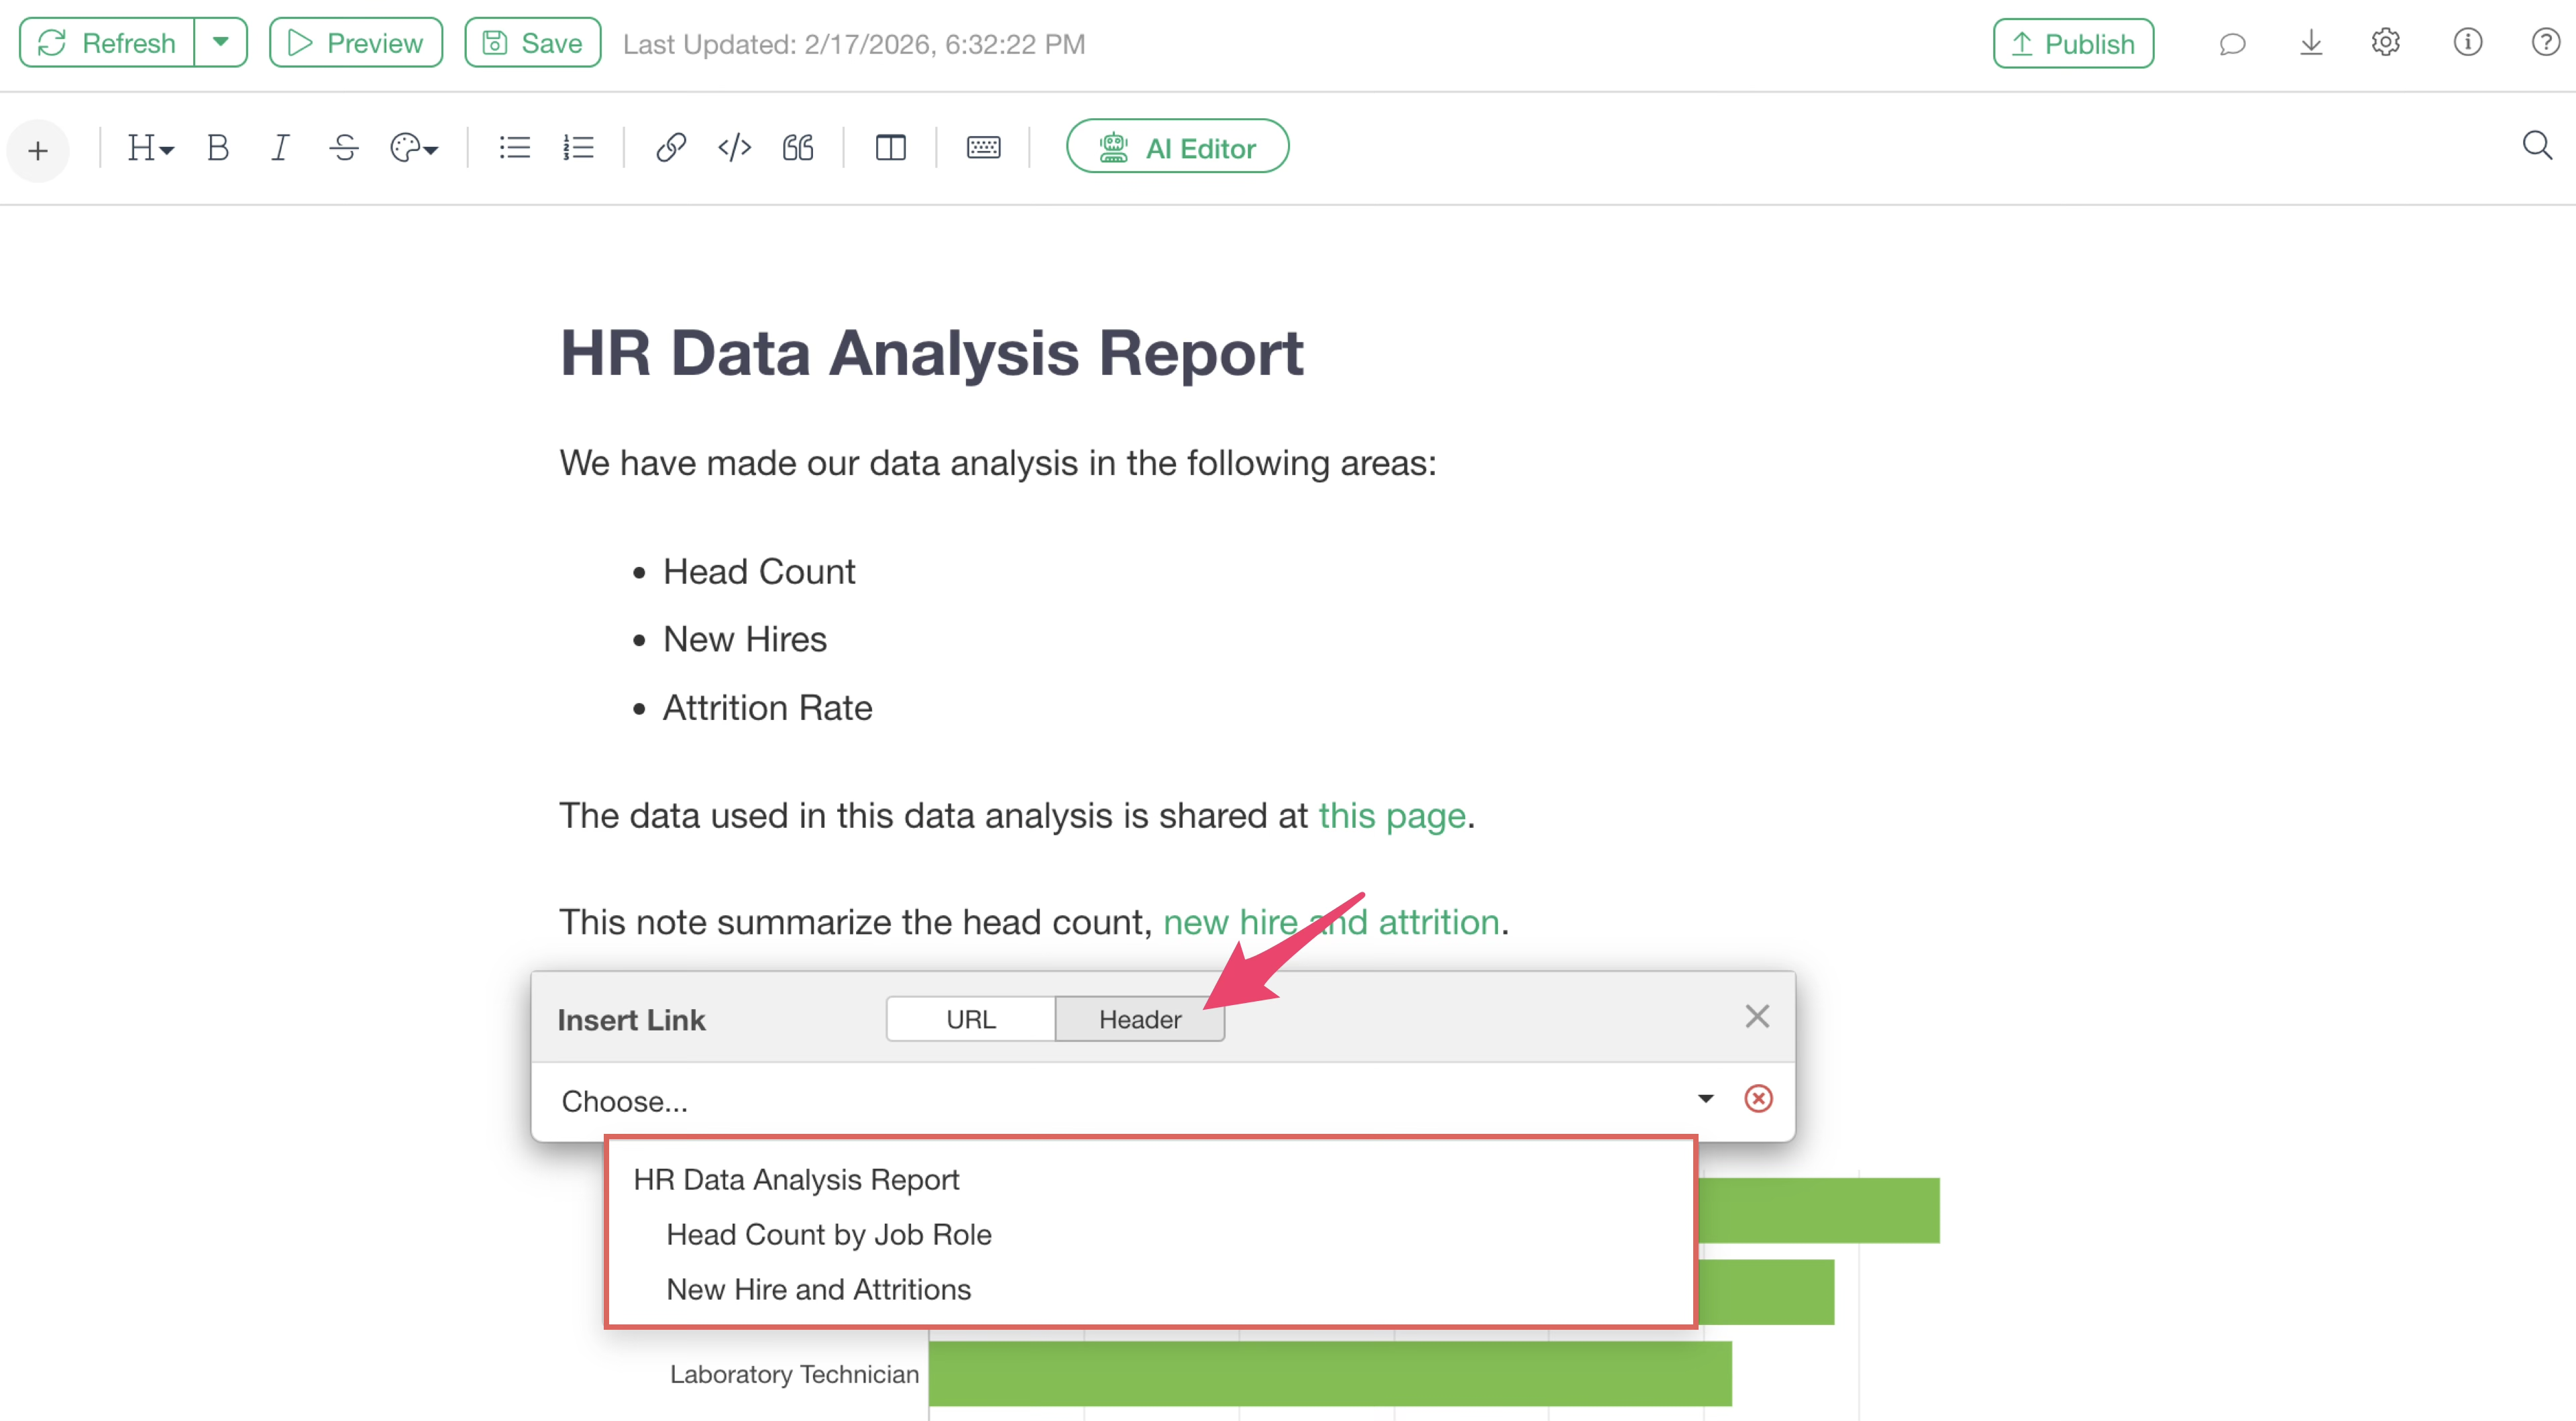
Then, from the preview or the note on the server introduced in the section “Check the Note Creation Results” (which is also a heading link), you will be able to jump to the specified heading when clicking the corresponding link.
Adding Images
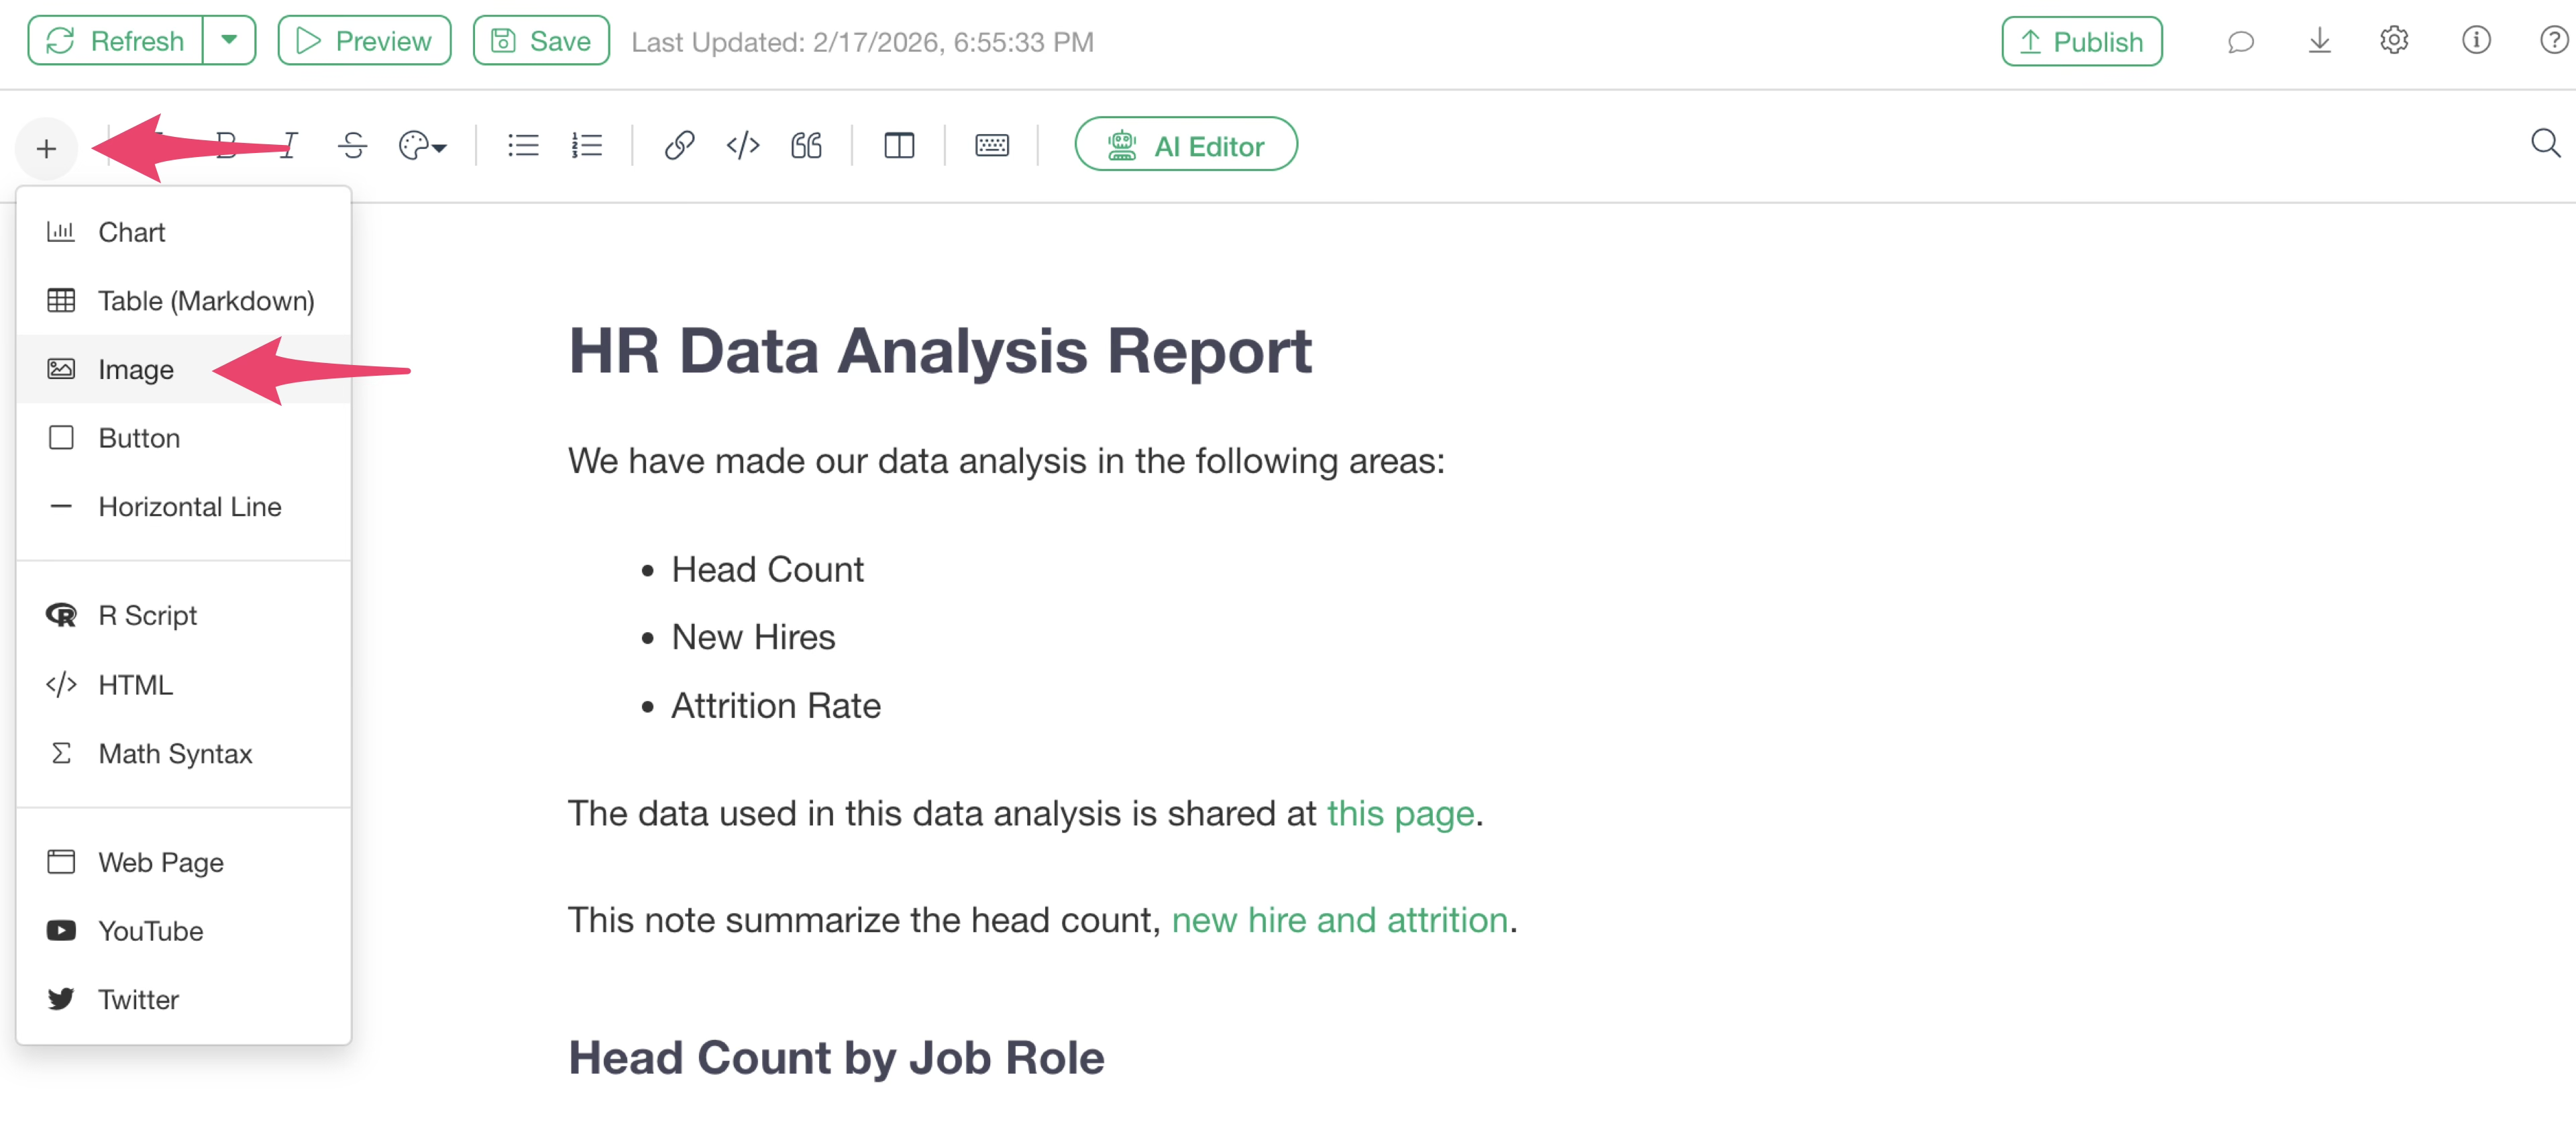
To add an image to a note, select “Image” from the plus button.
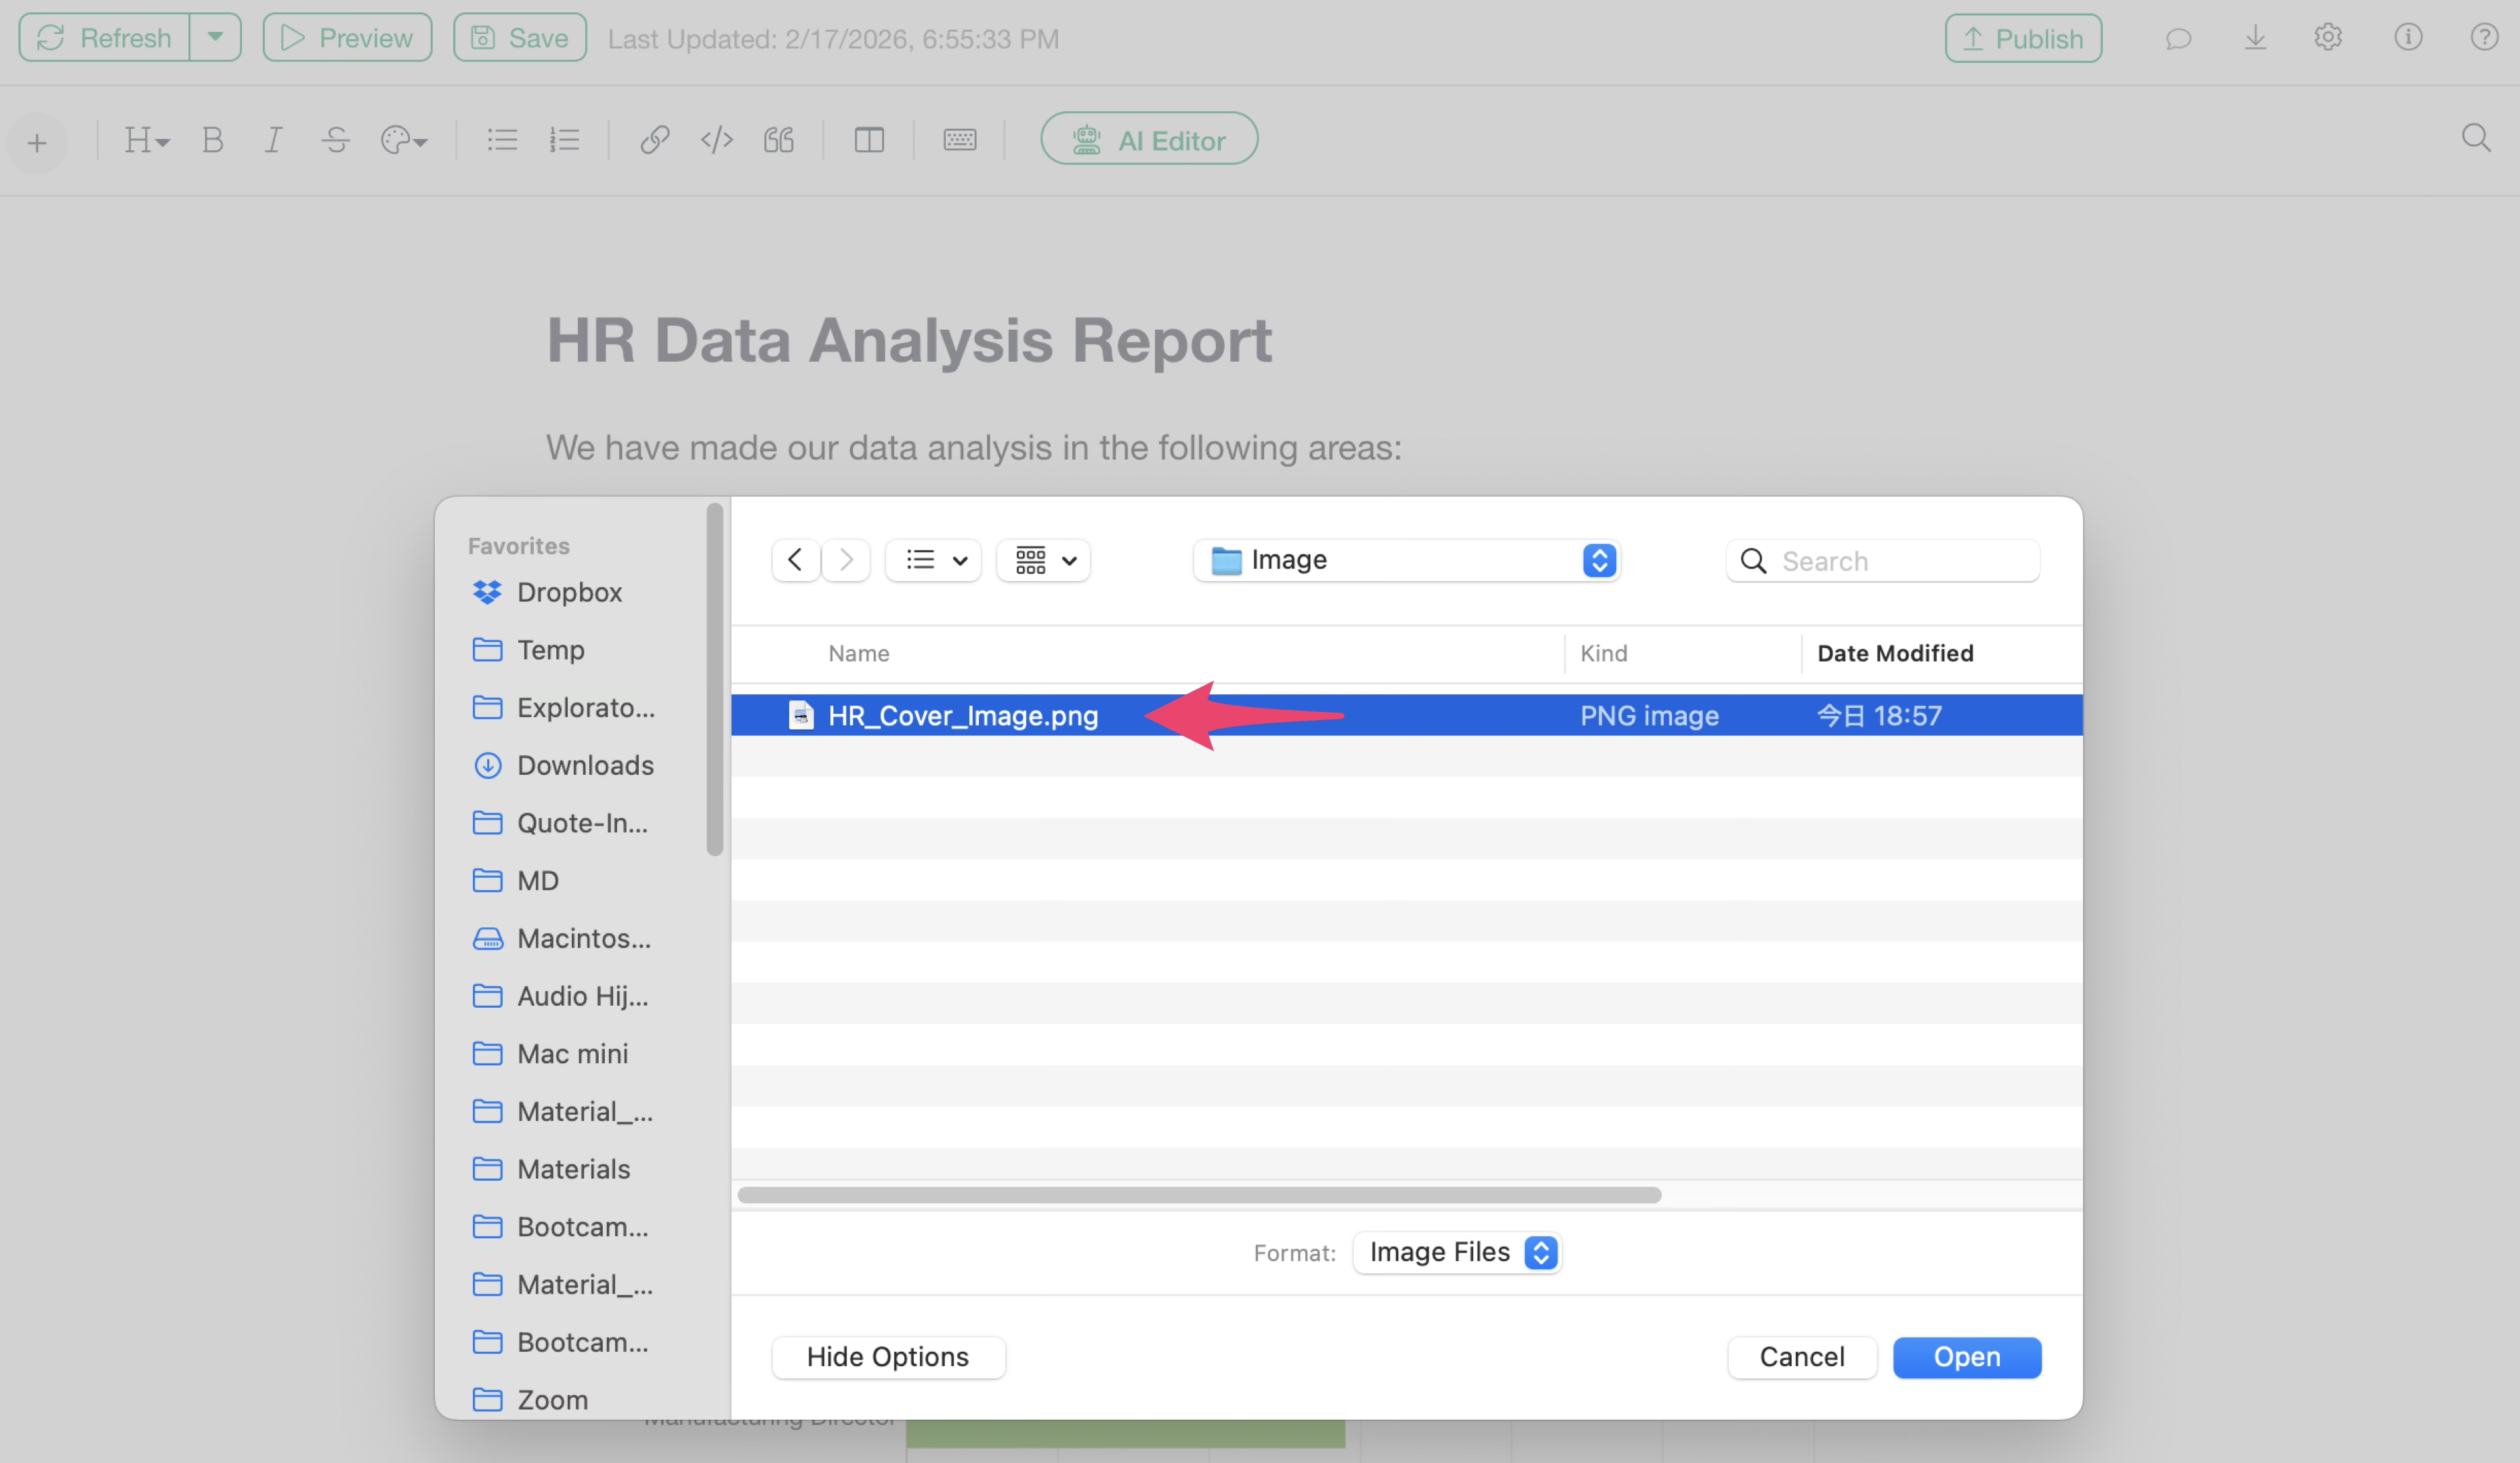
A file picker dialog will appear; select the specific image.
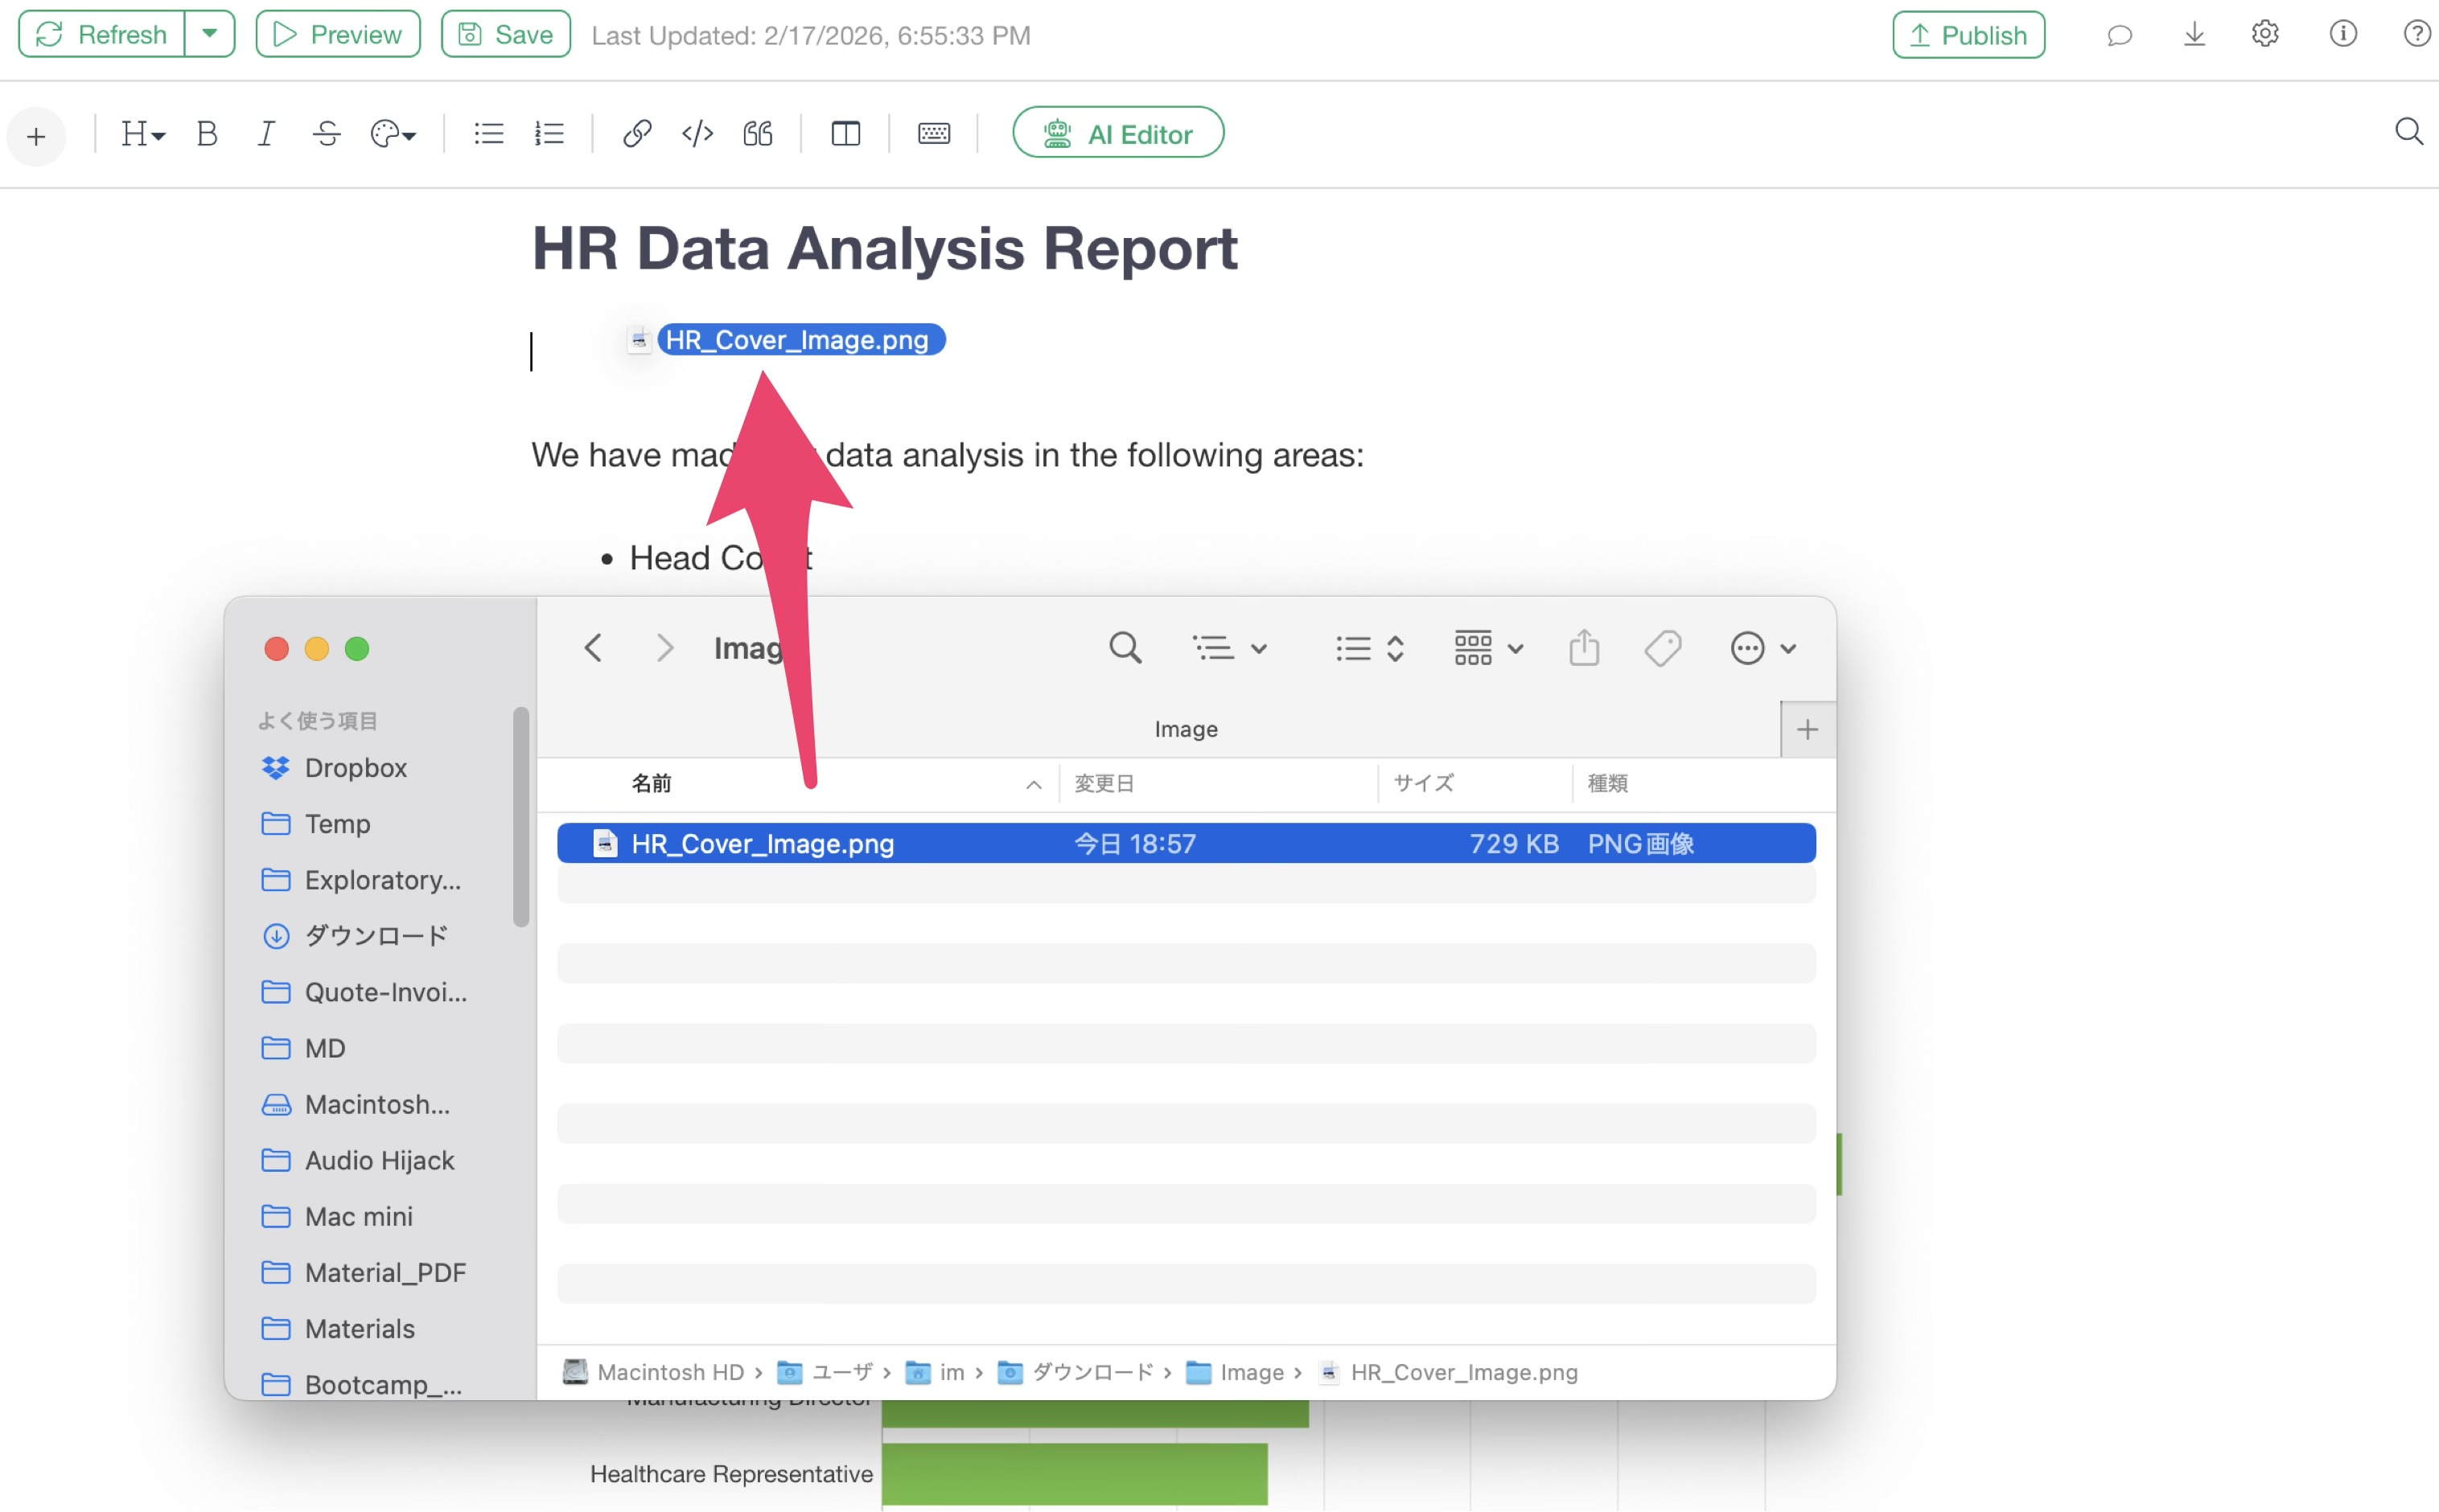
This allows you to embed the image within the note.

You can also embed images in the note by dragging and dropping image files.
Adding Tables
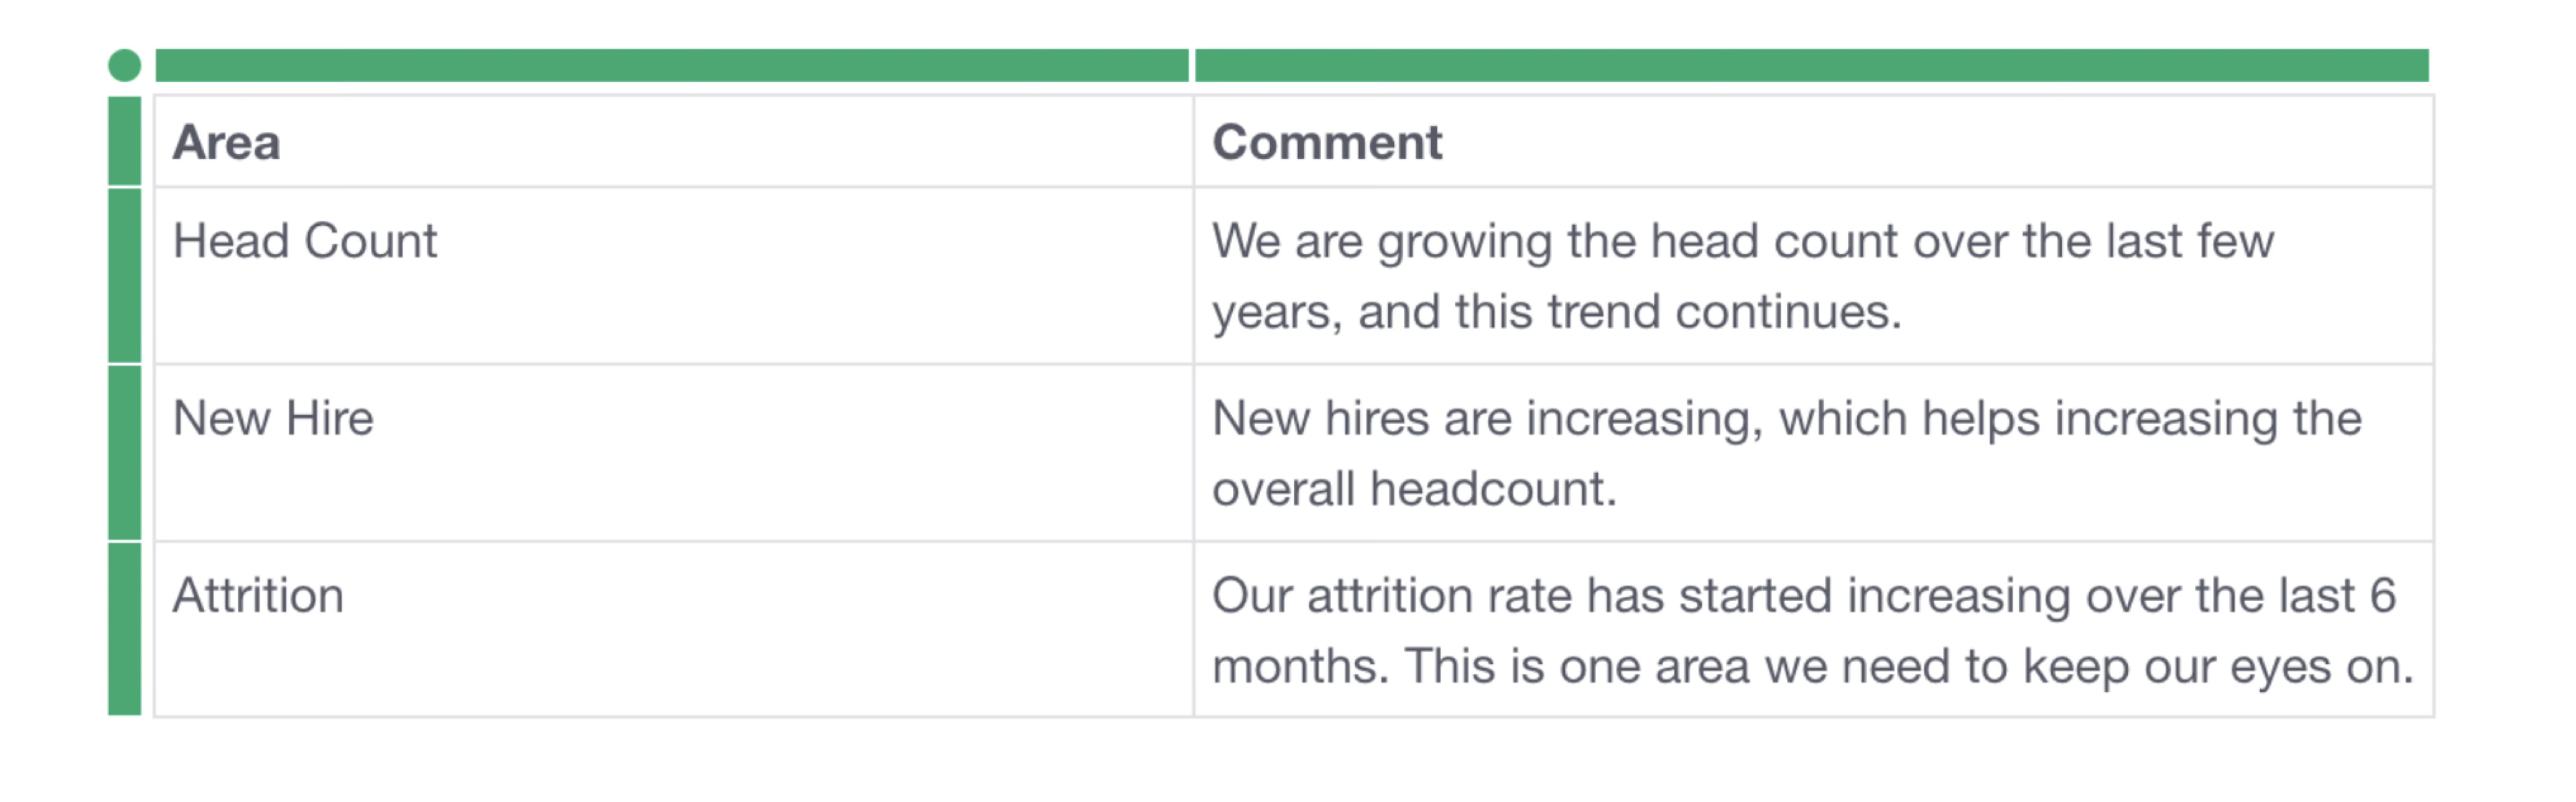
In notes, you can add tables and manually create tables like the one shown below.
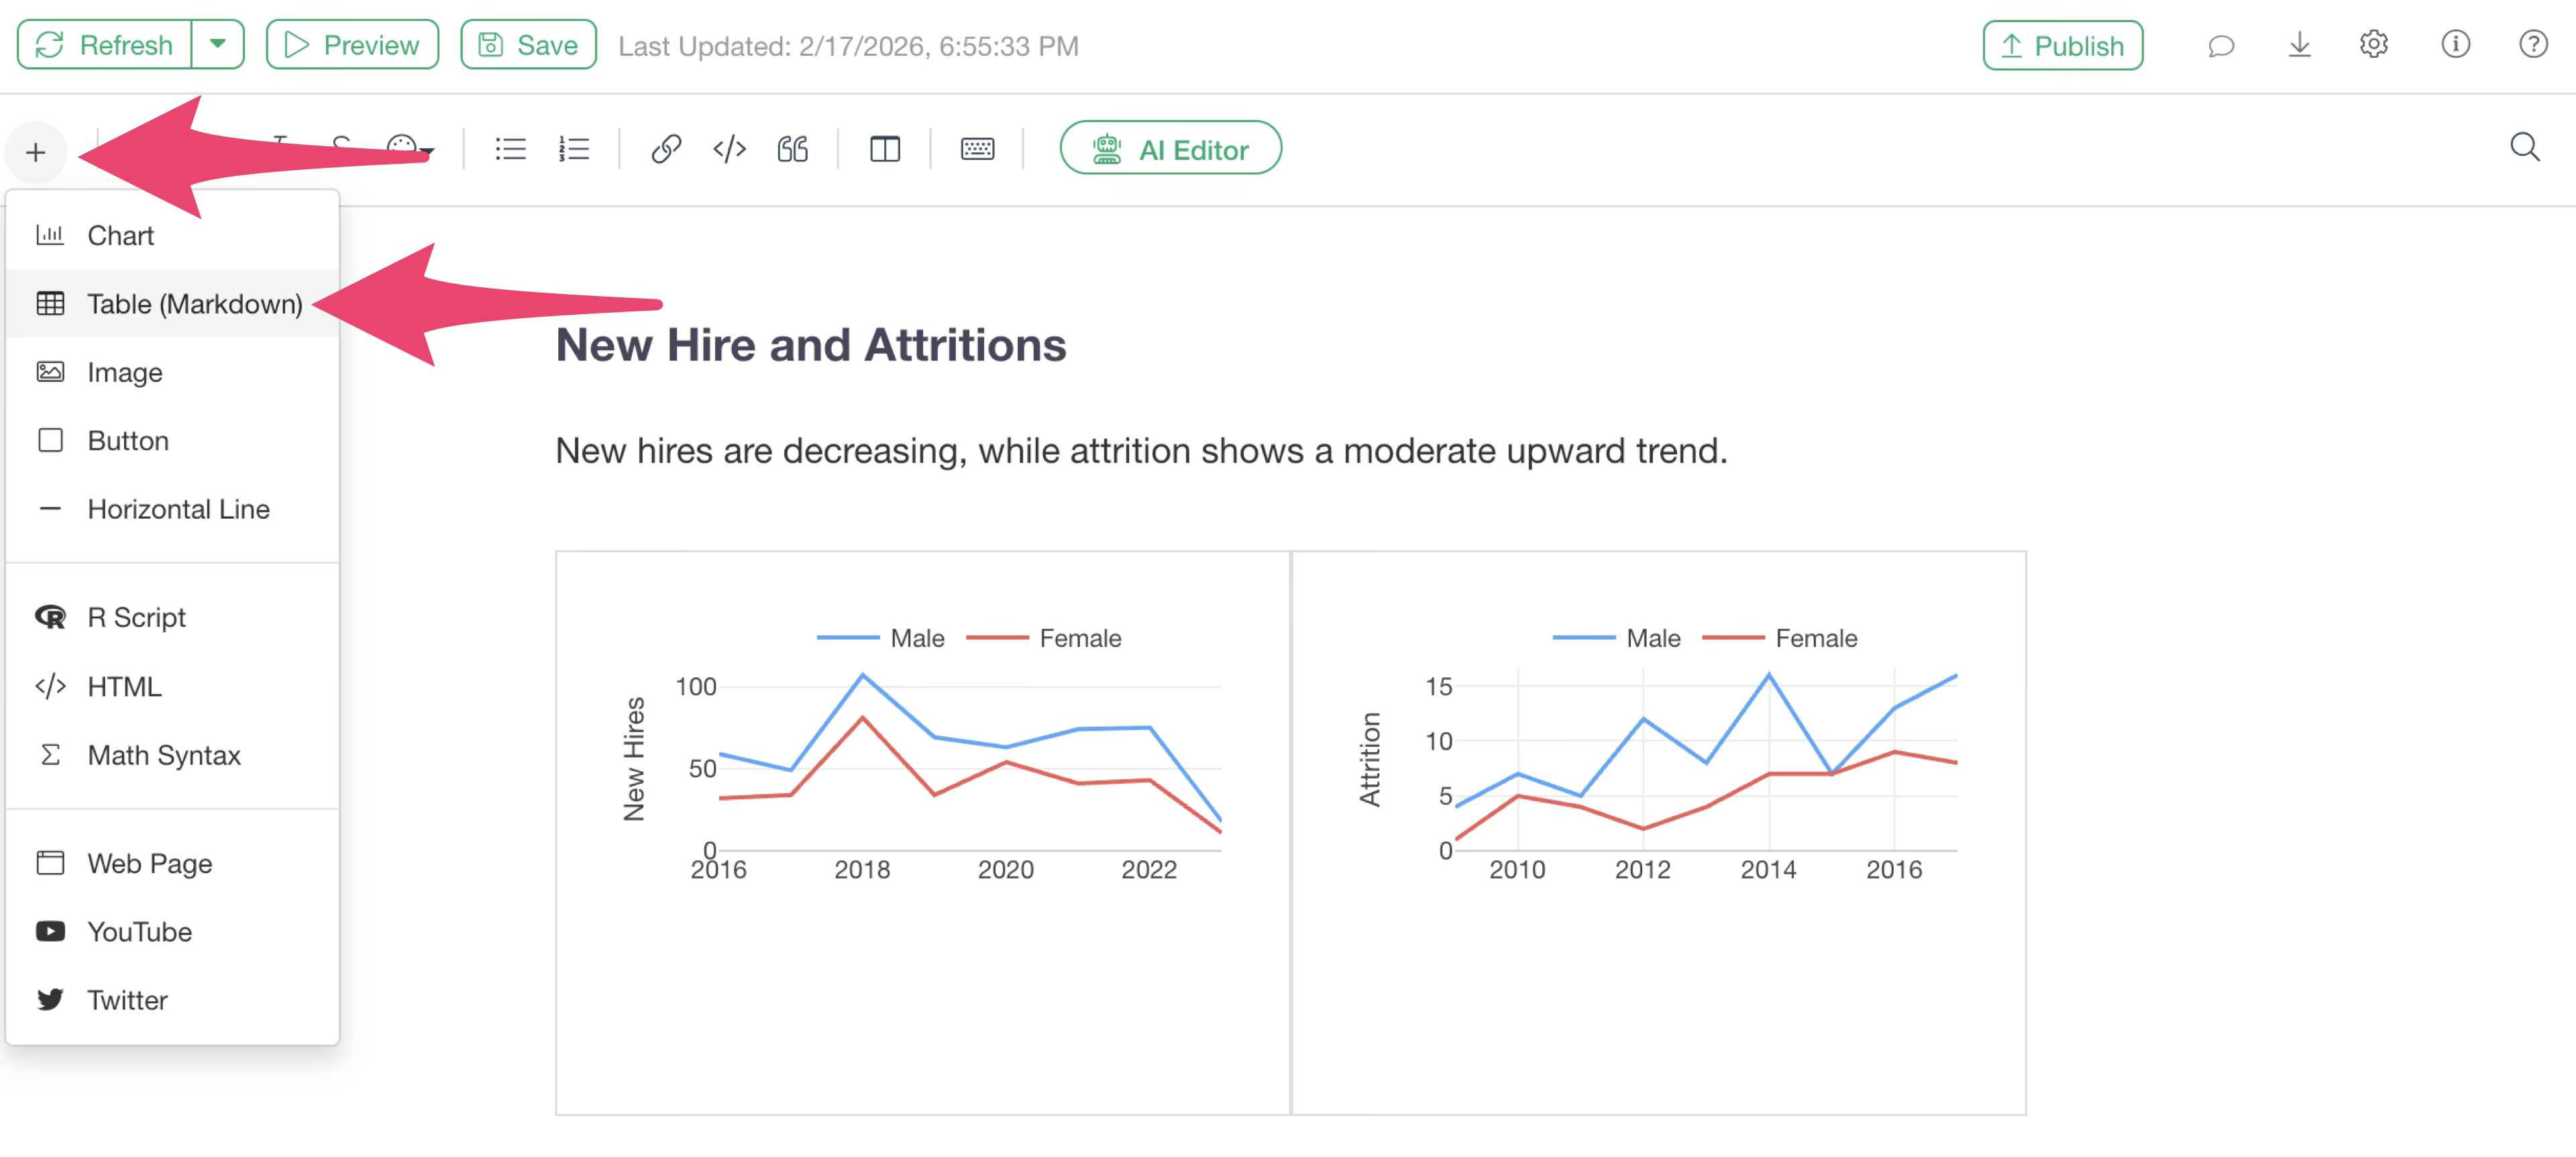
To add a table, select “Table (Markdown)” from the plus button.
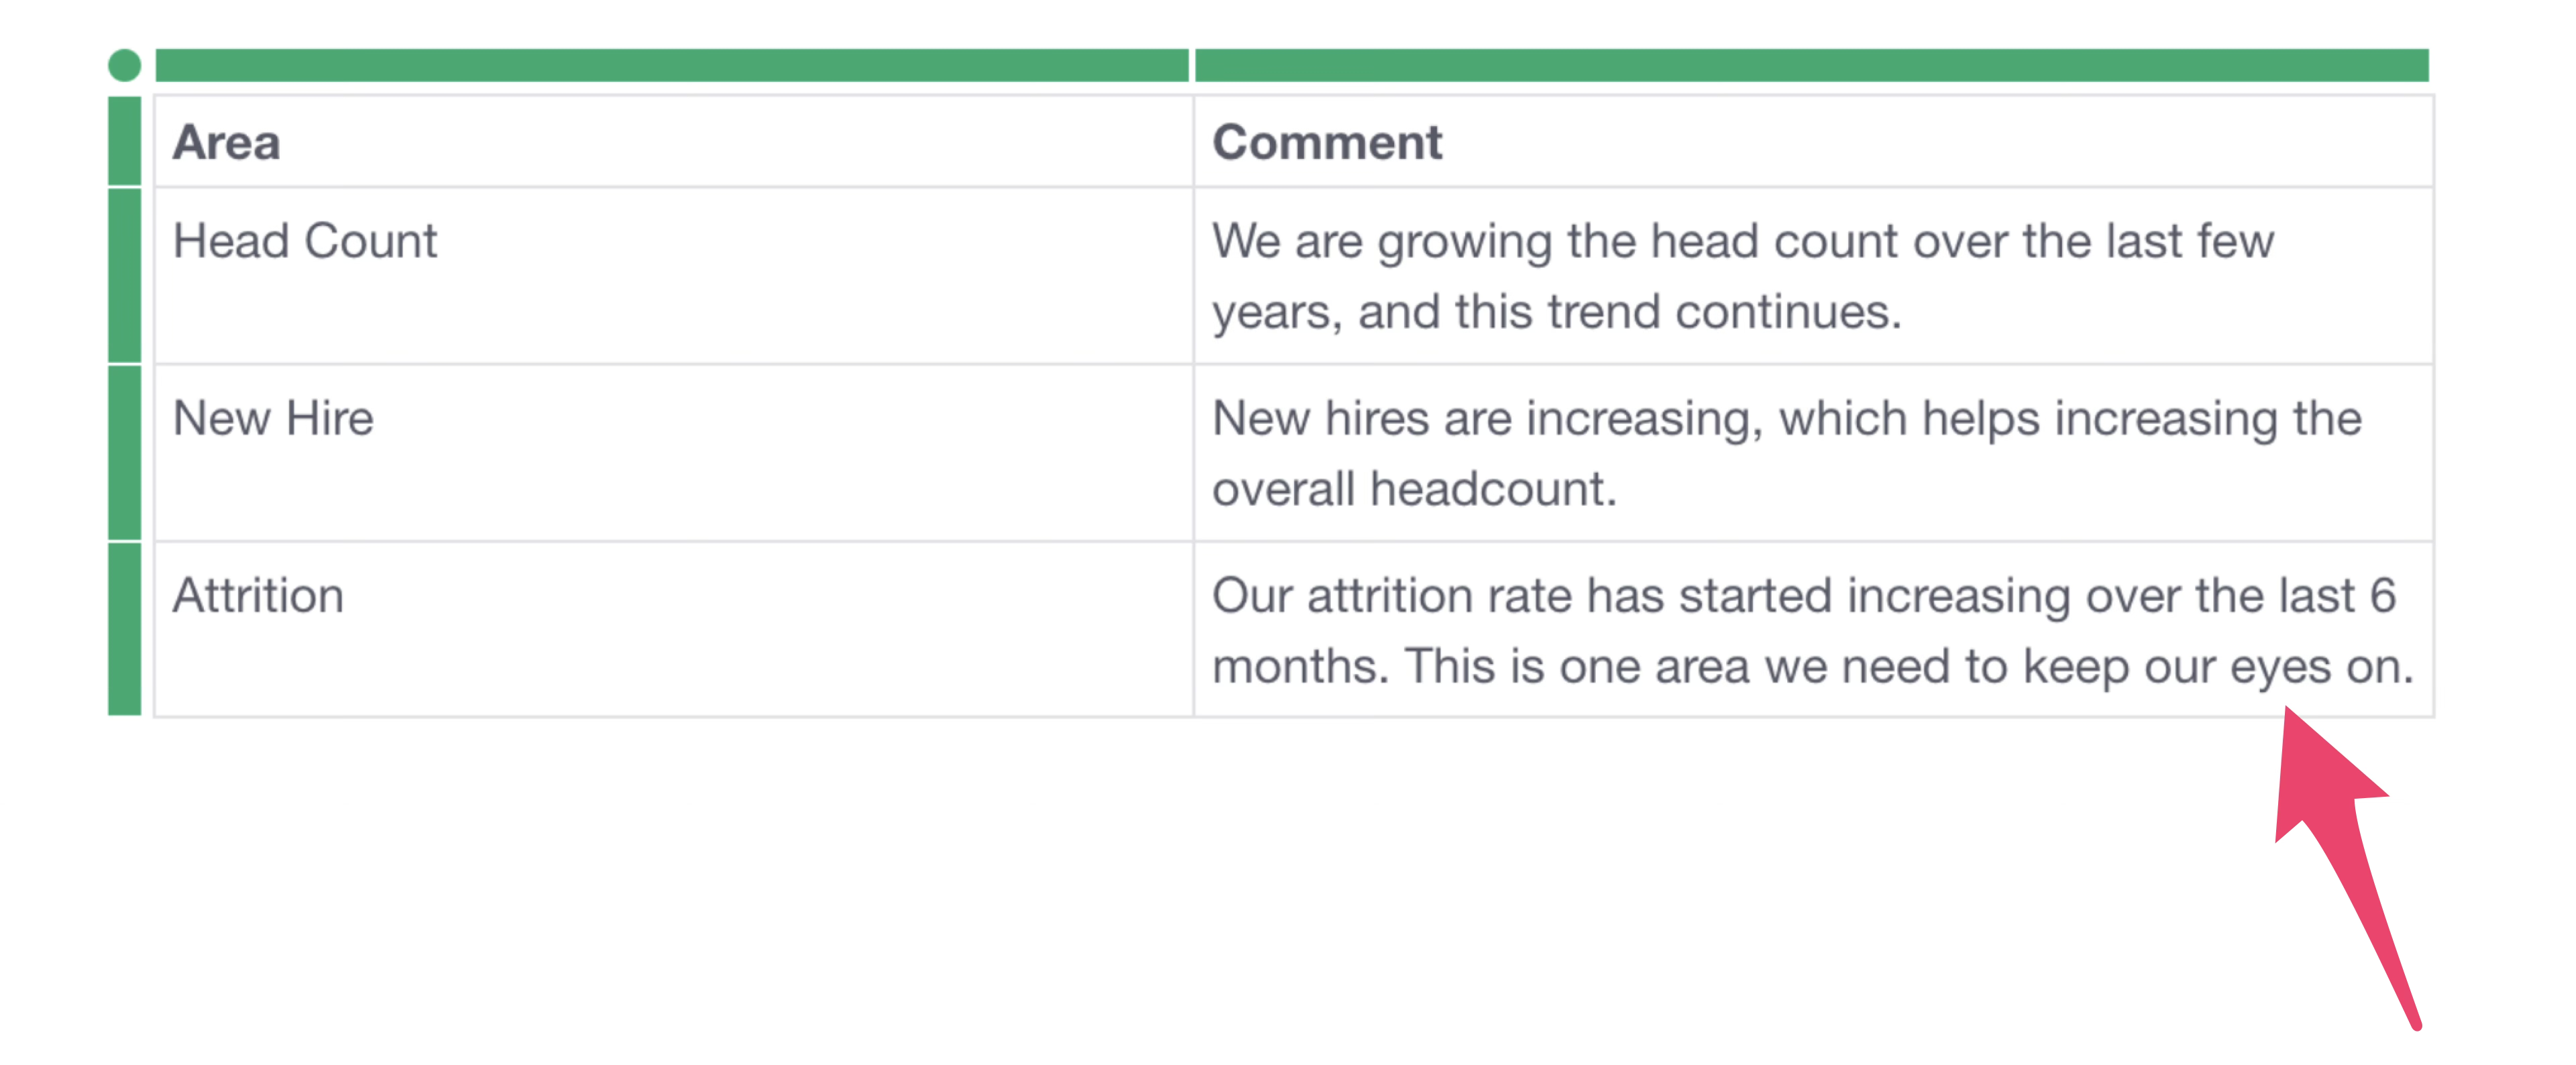
A table will be added, and you can freely enter text into each cell.
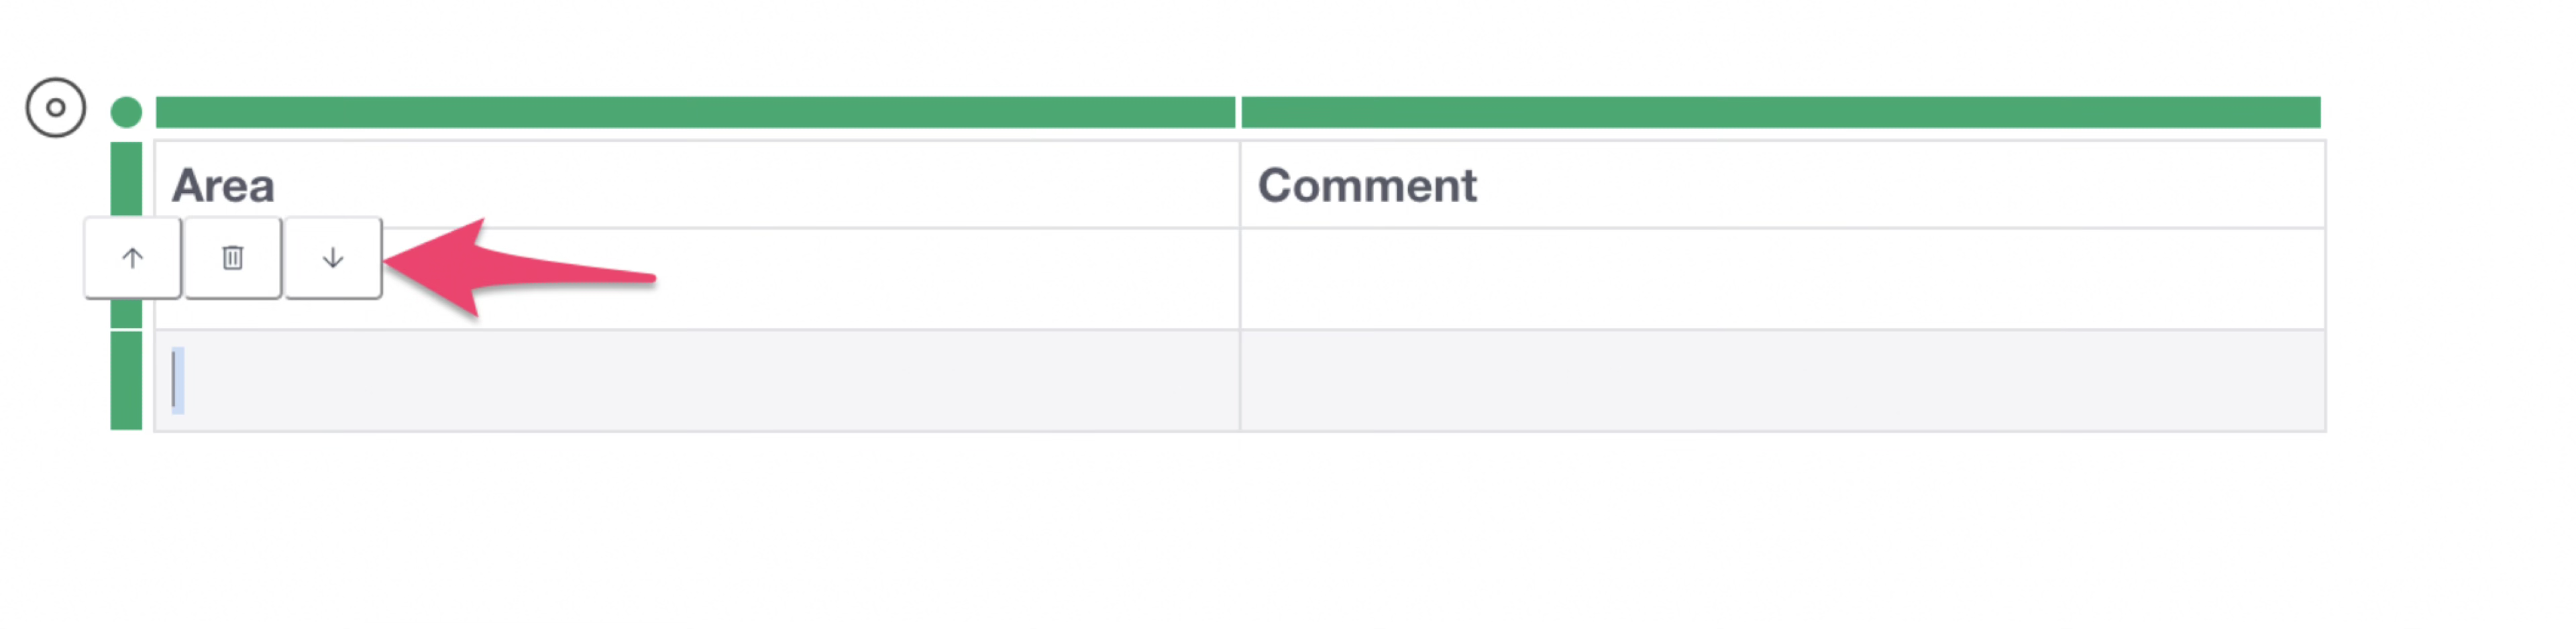
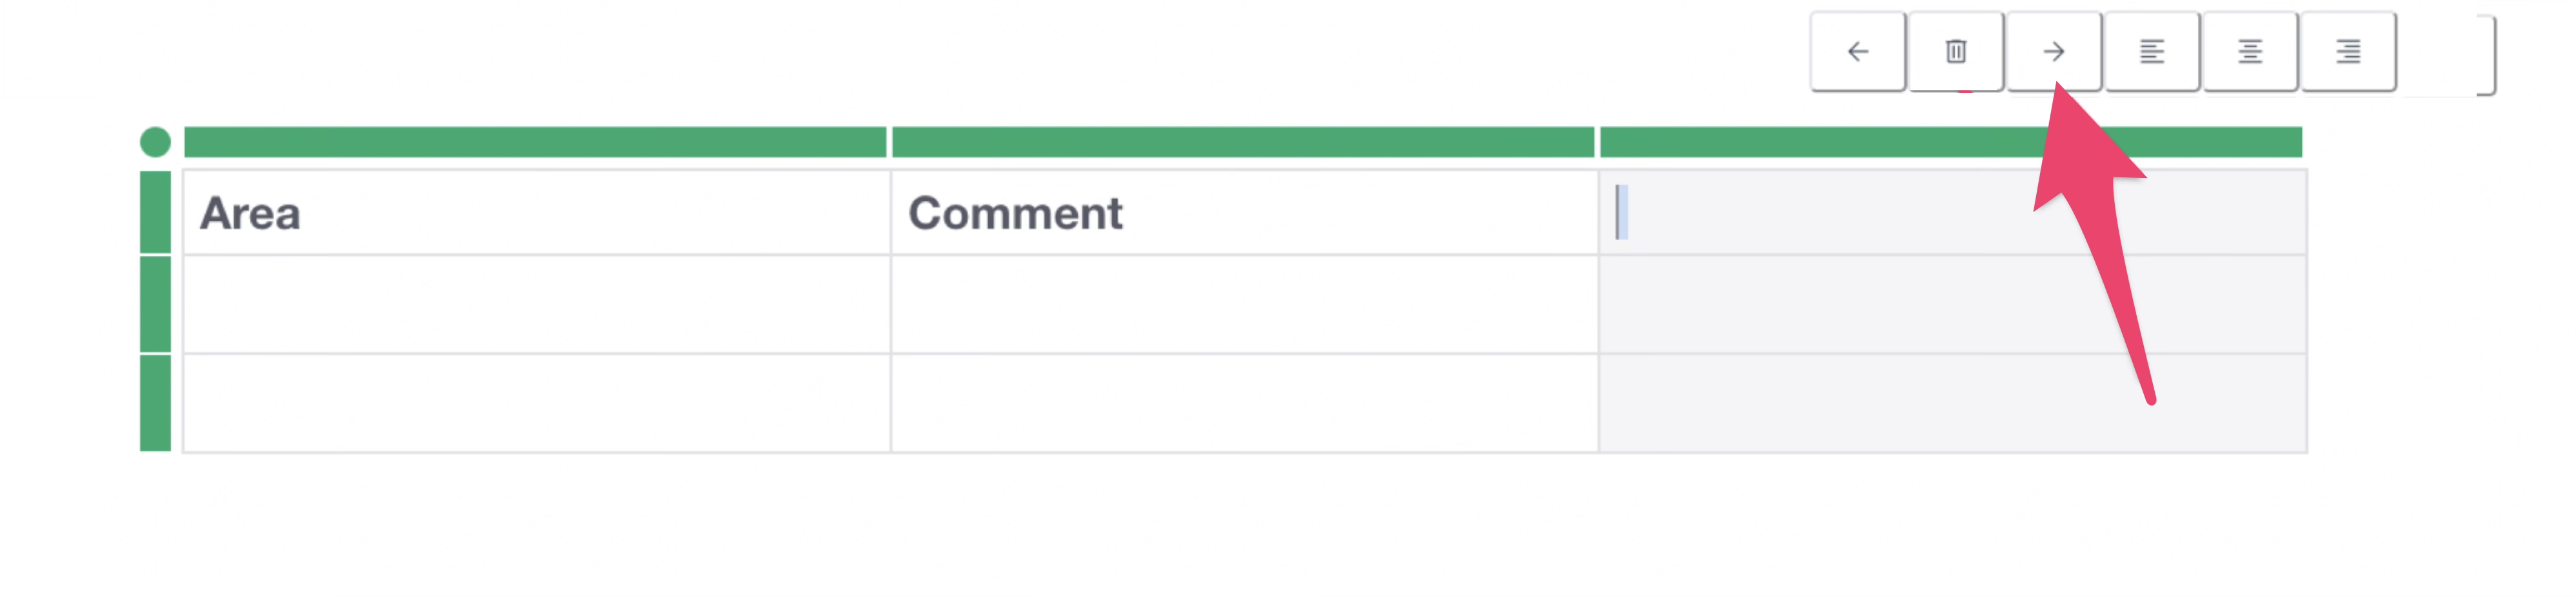
To add a row, click the green bar of a row and select the up arrow (↑) to add above or the down arrow (↓) to add below.
 To add a column, click the column bar and press the left arrow (←) or
right arrow (→).
To add a column, click the column bar and press the left arrow (←) or
right arrow (→).
Adding Other Content
The following content can also be added to notes:
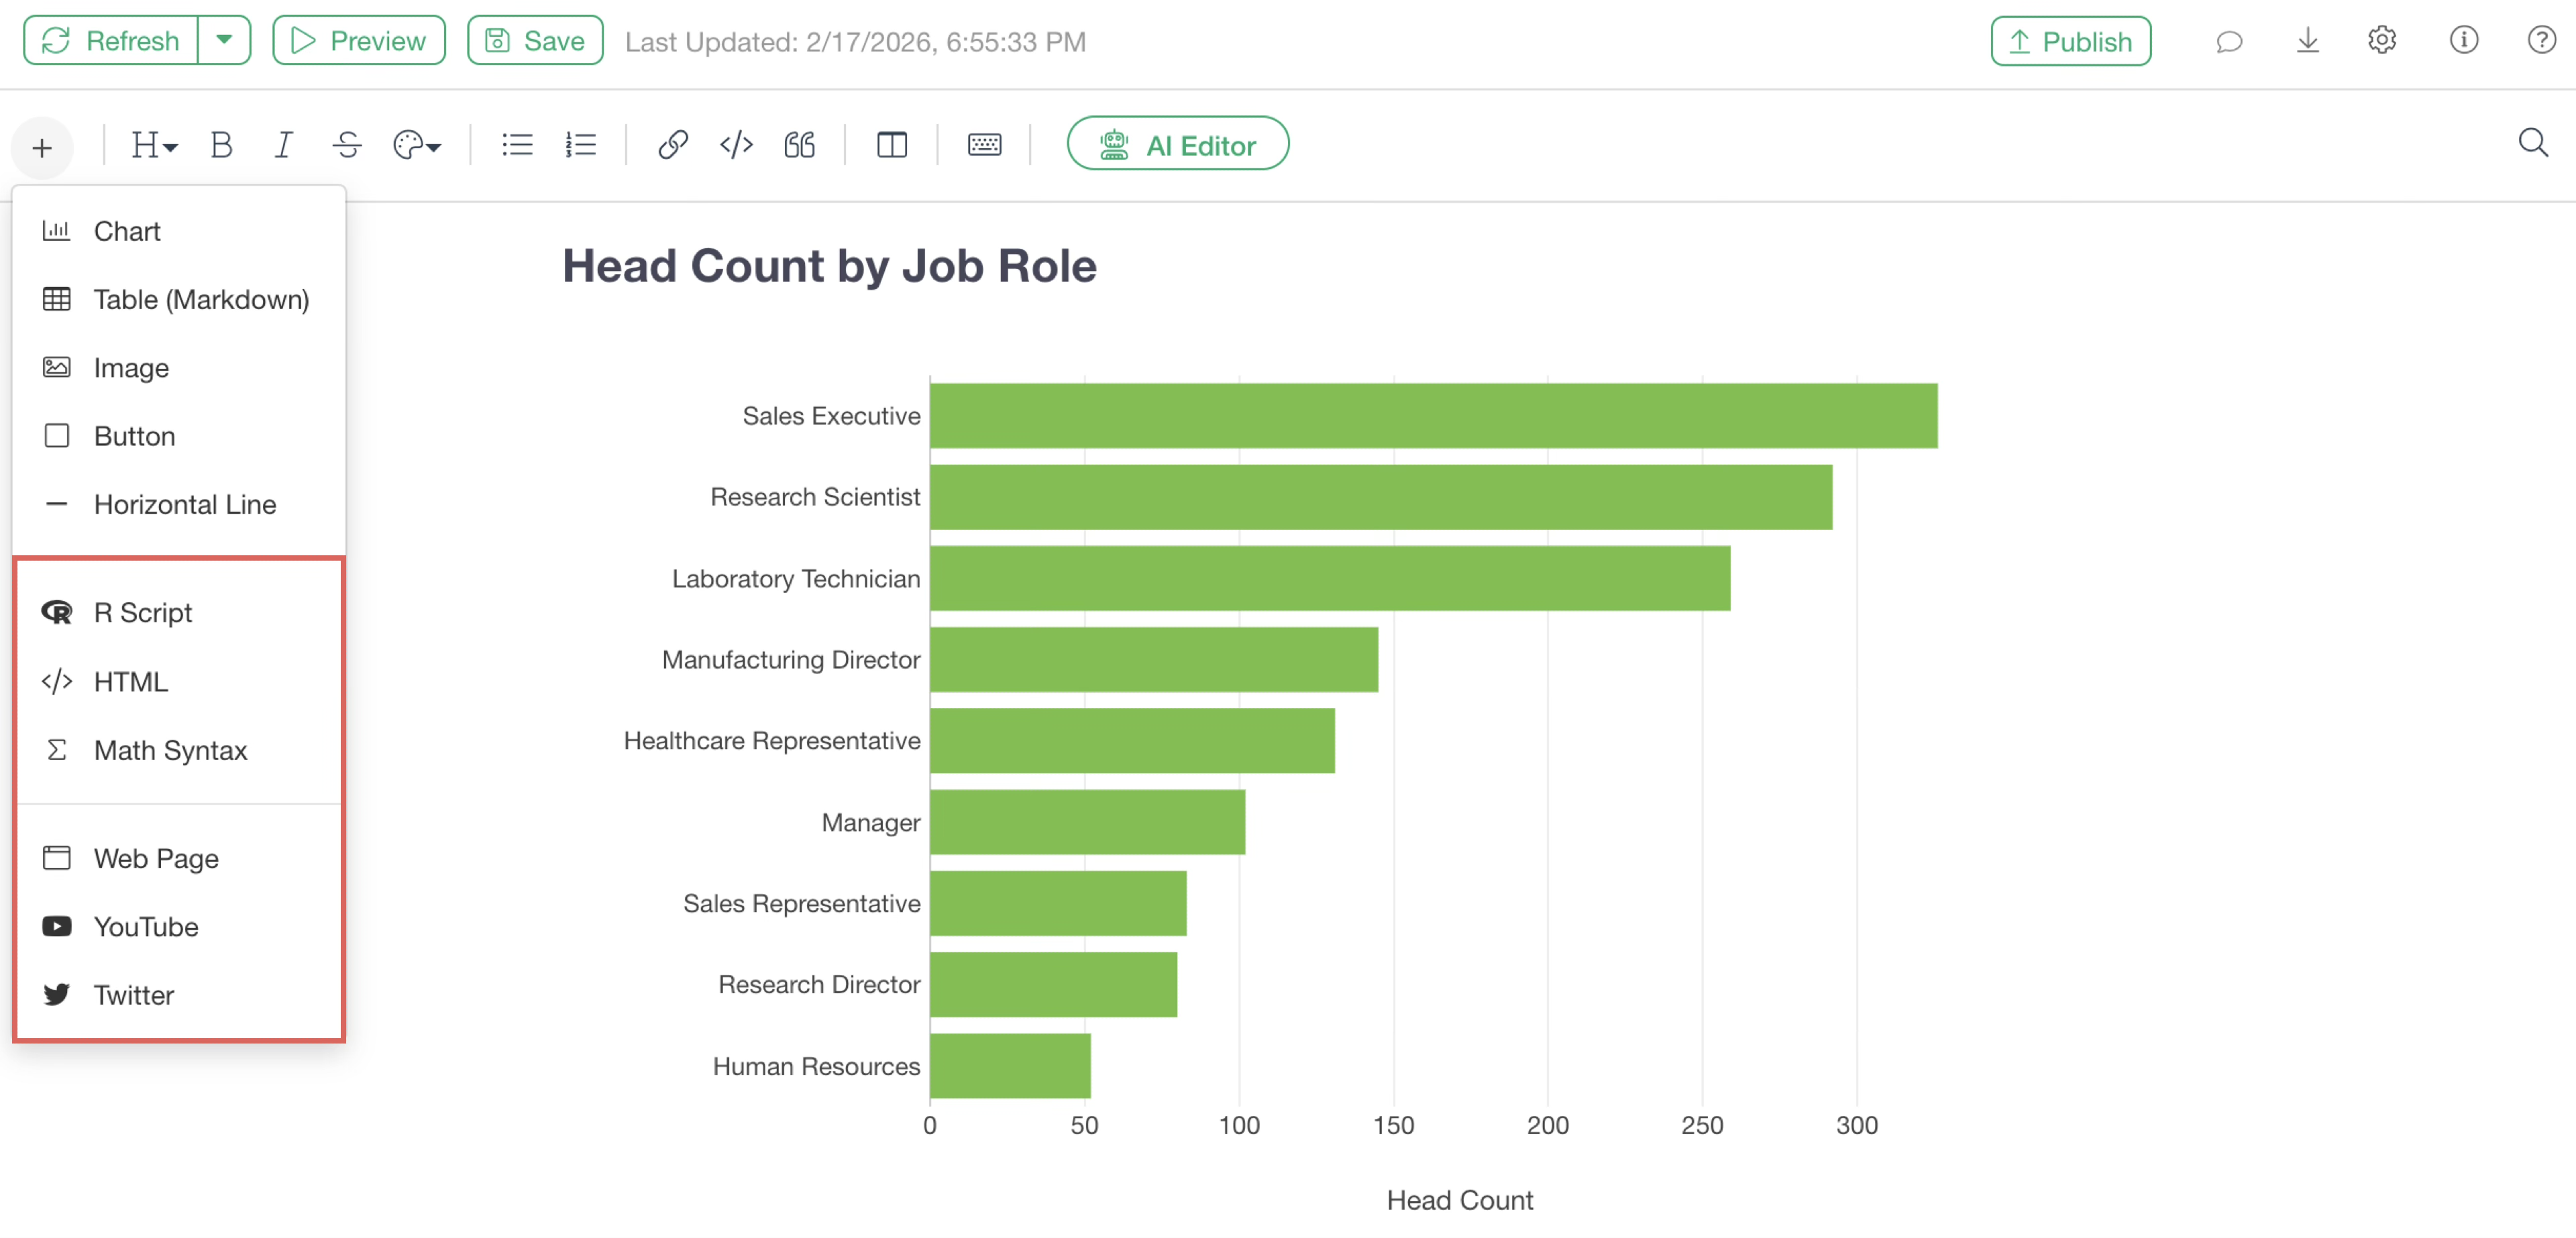
- R Script
- HTML
- Math Syntax
- Web Pages
- YouTube
For details, please refer to this page.
Displaying Detailed Data
To see the details of the data in a summary chart within a note, click on a specific group in the chart.
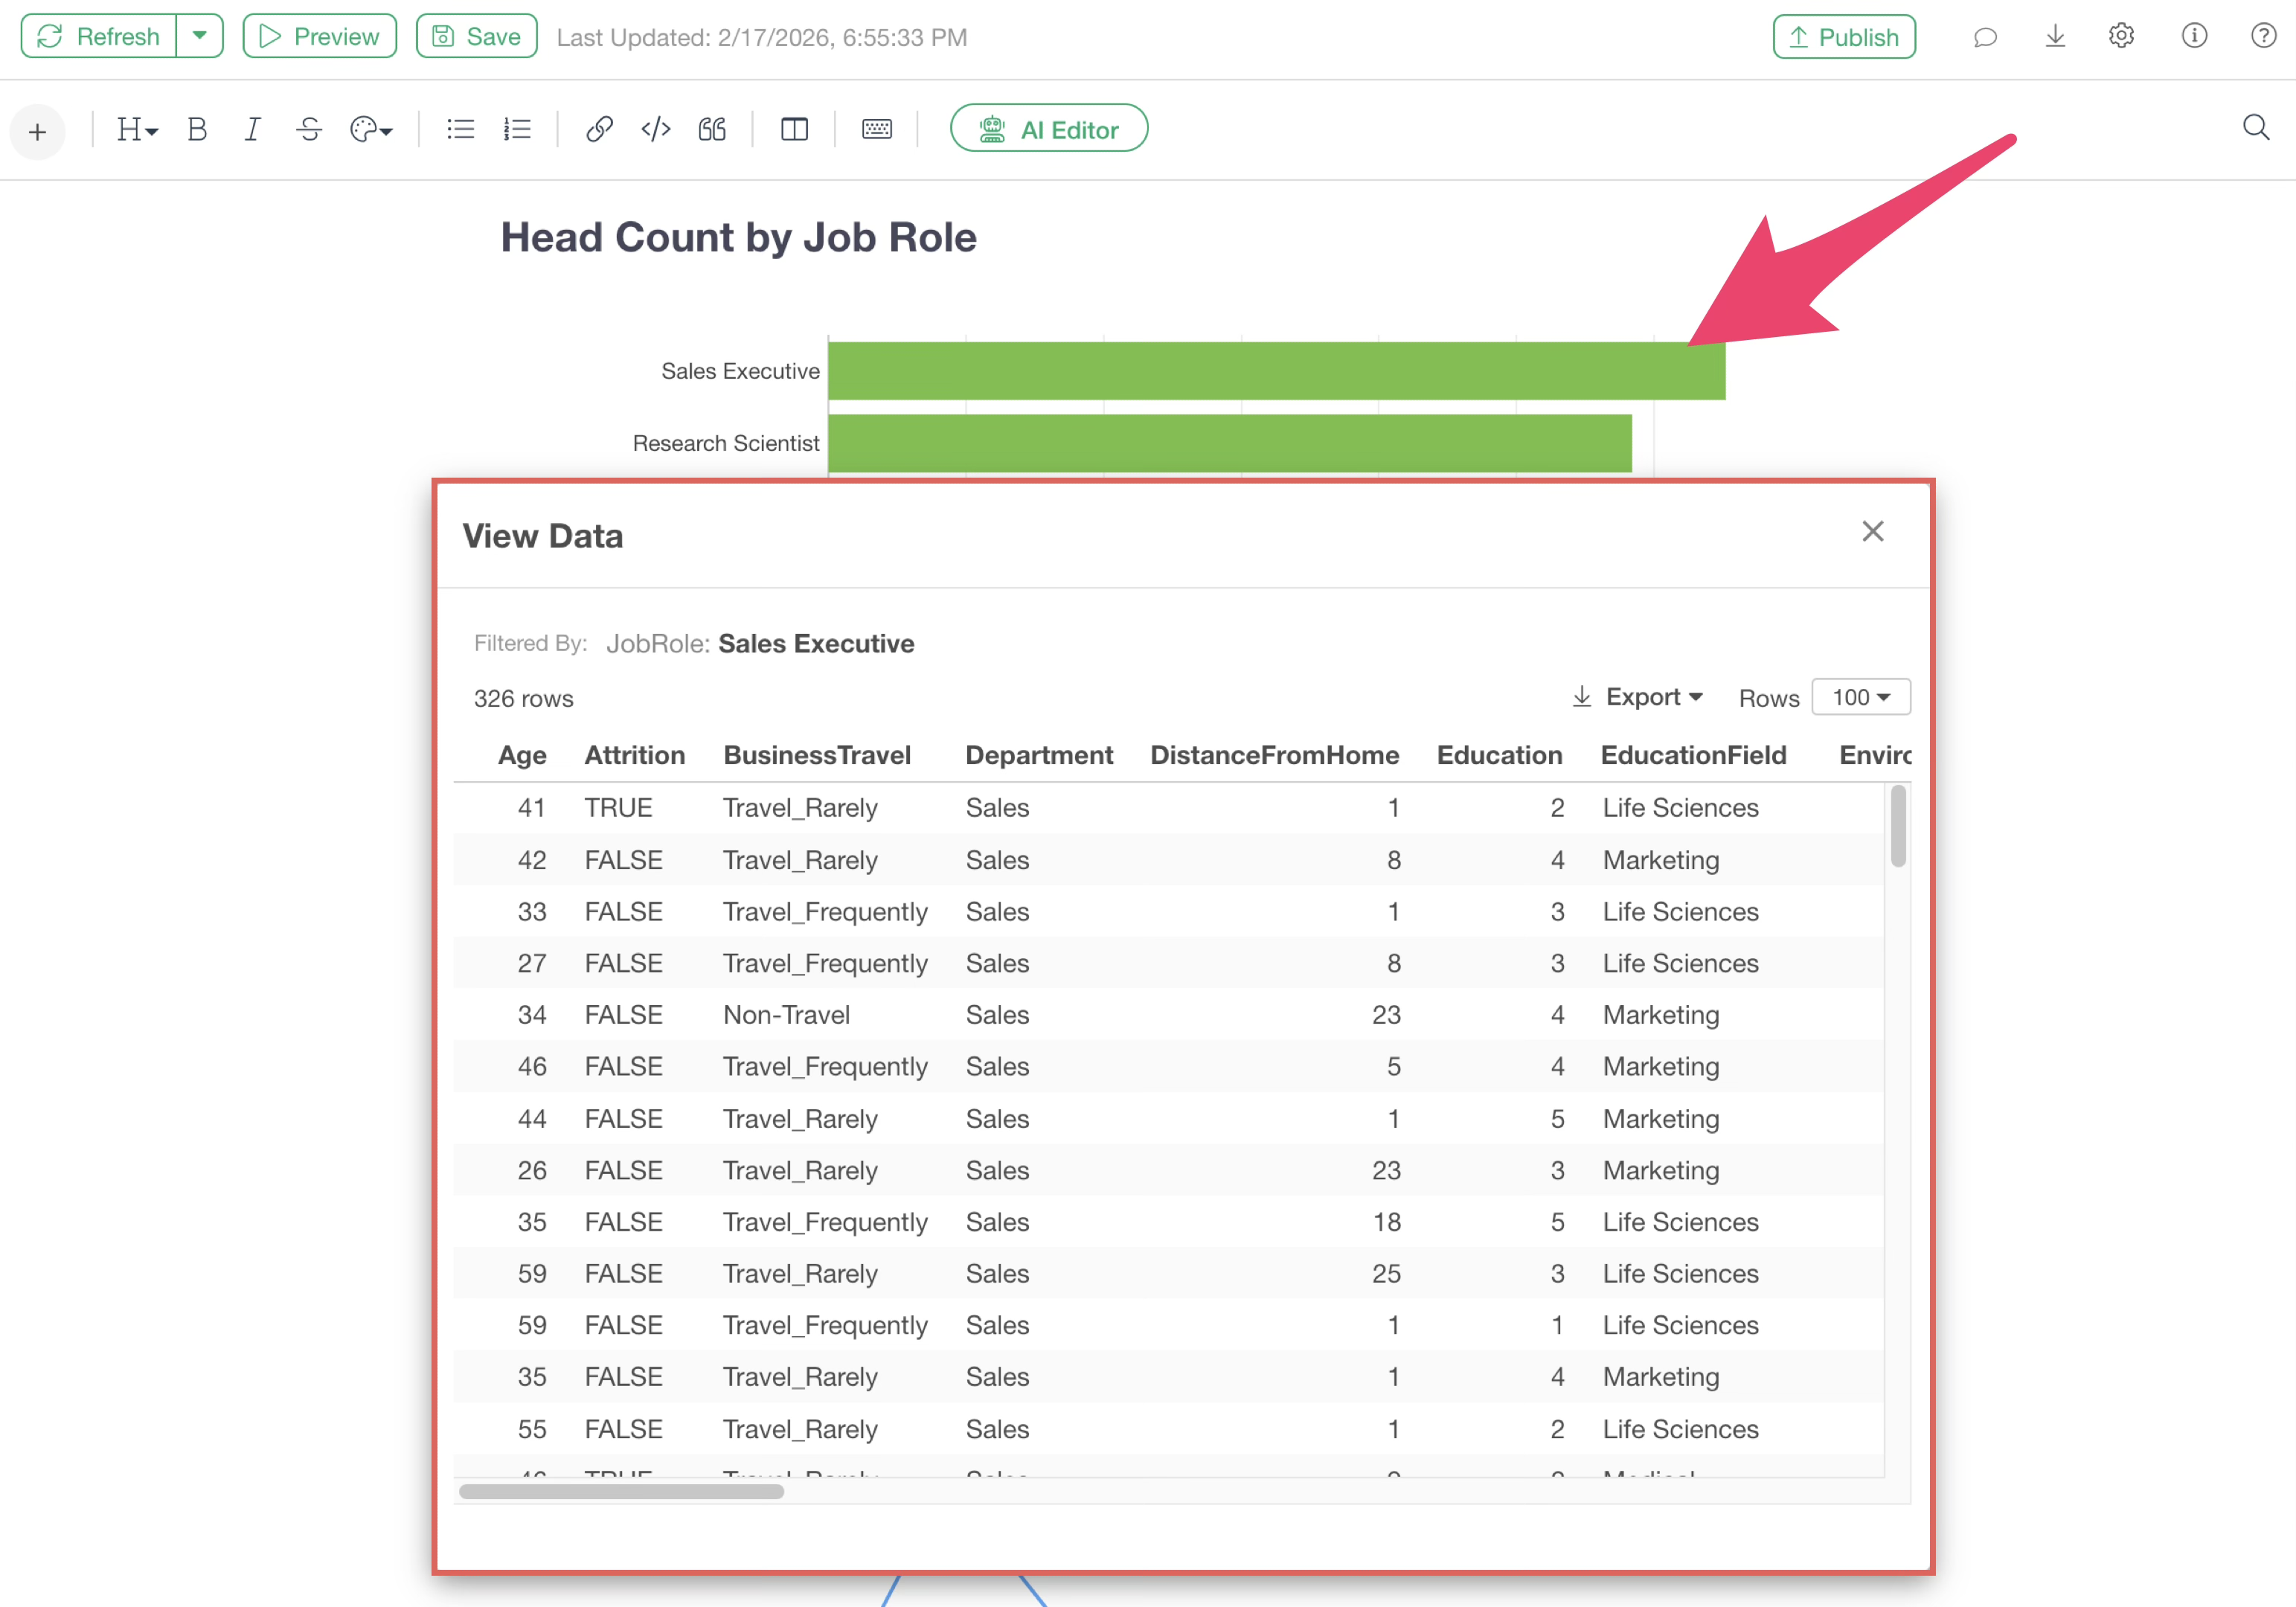
Detailed data will then be displayed, and it is also possible to export that information as data.
Data Filtering
By using parameters, you can freely filter the content of the note.
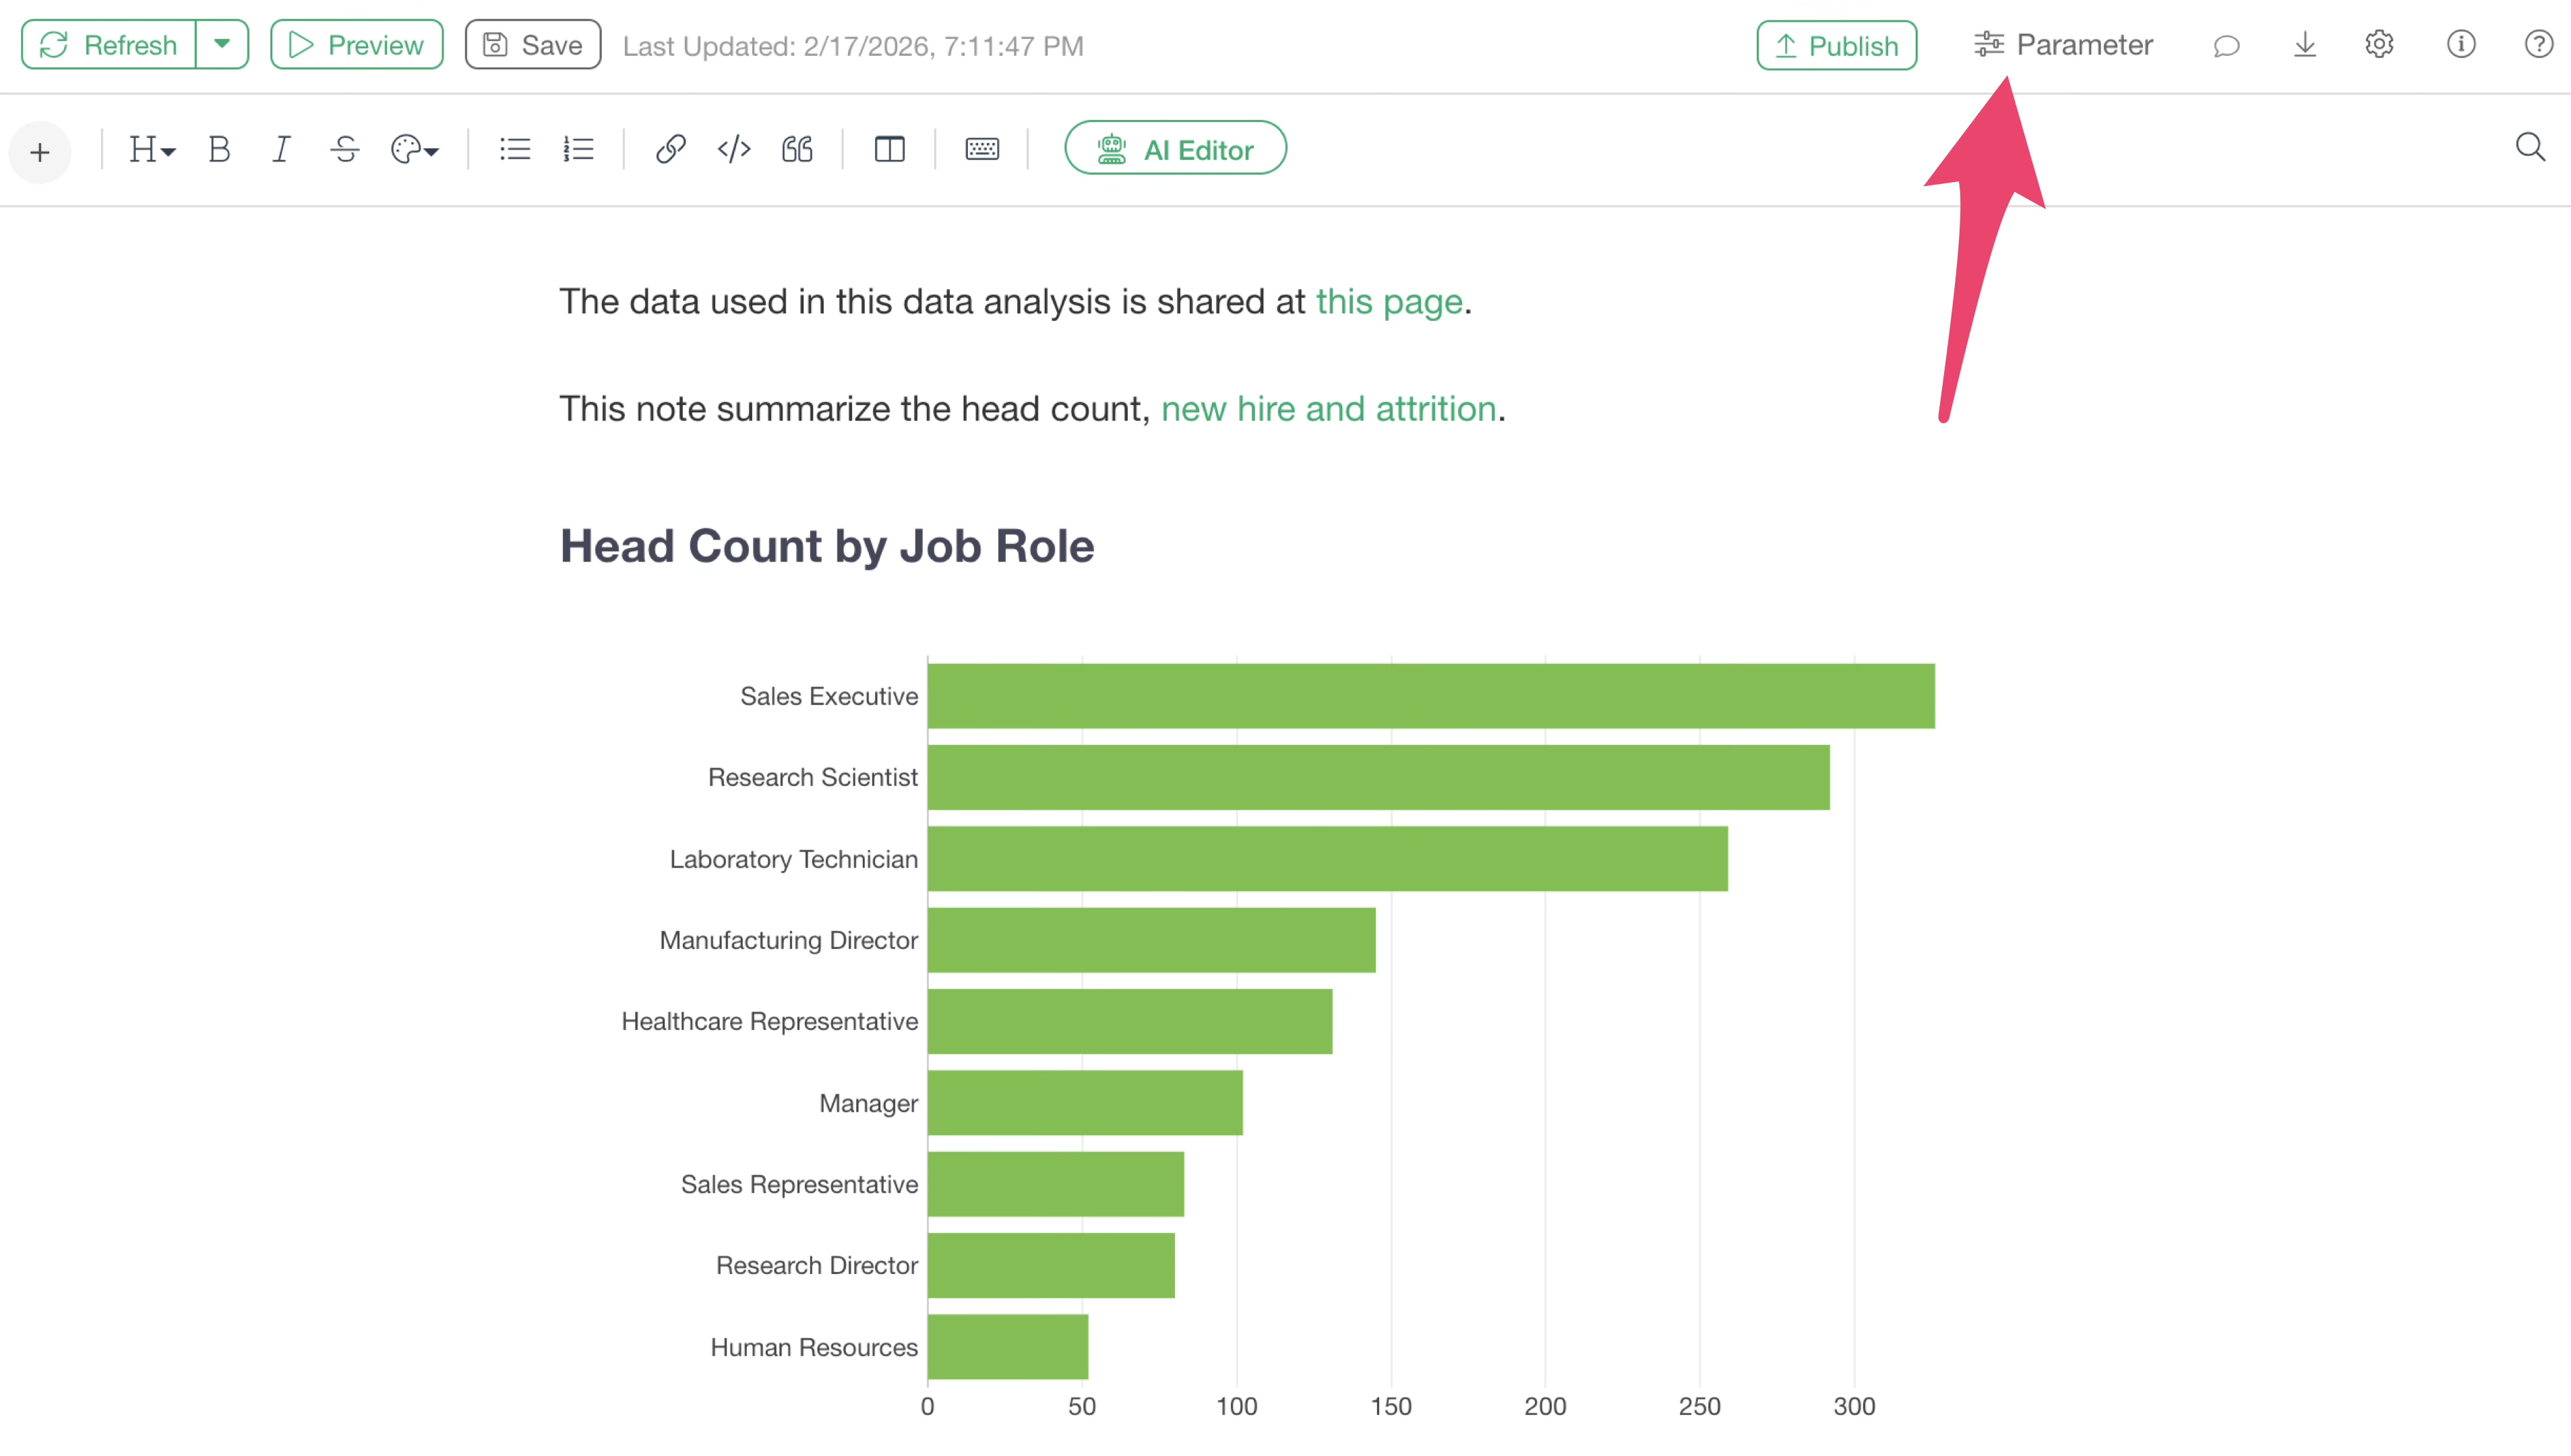
Clicking the parameter button displays the parameter pane. By specifying arbitrary values and running the parameters, you can filter the note content or dynamically change calculation results.
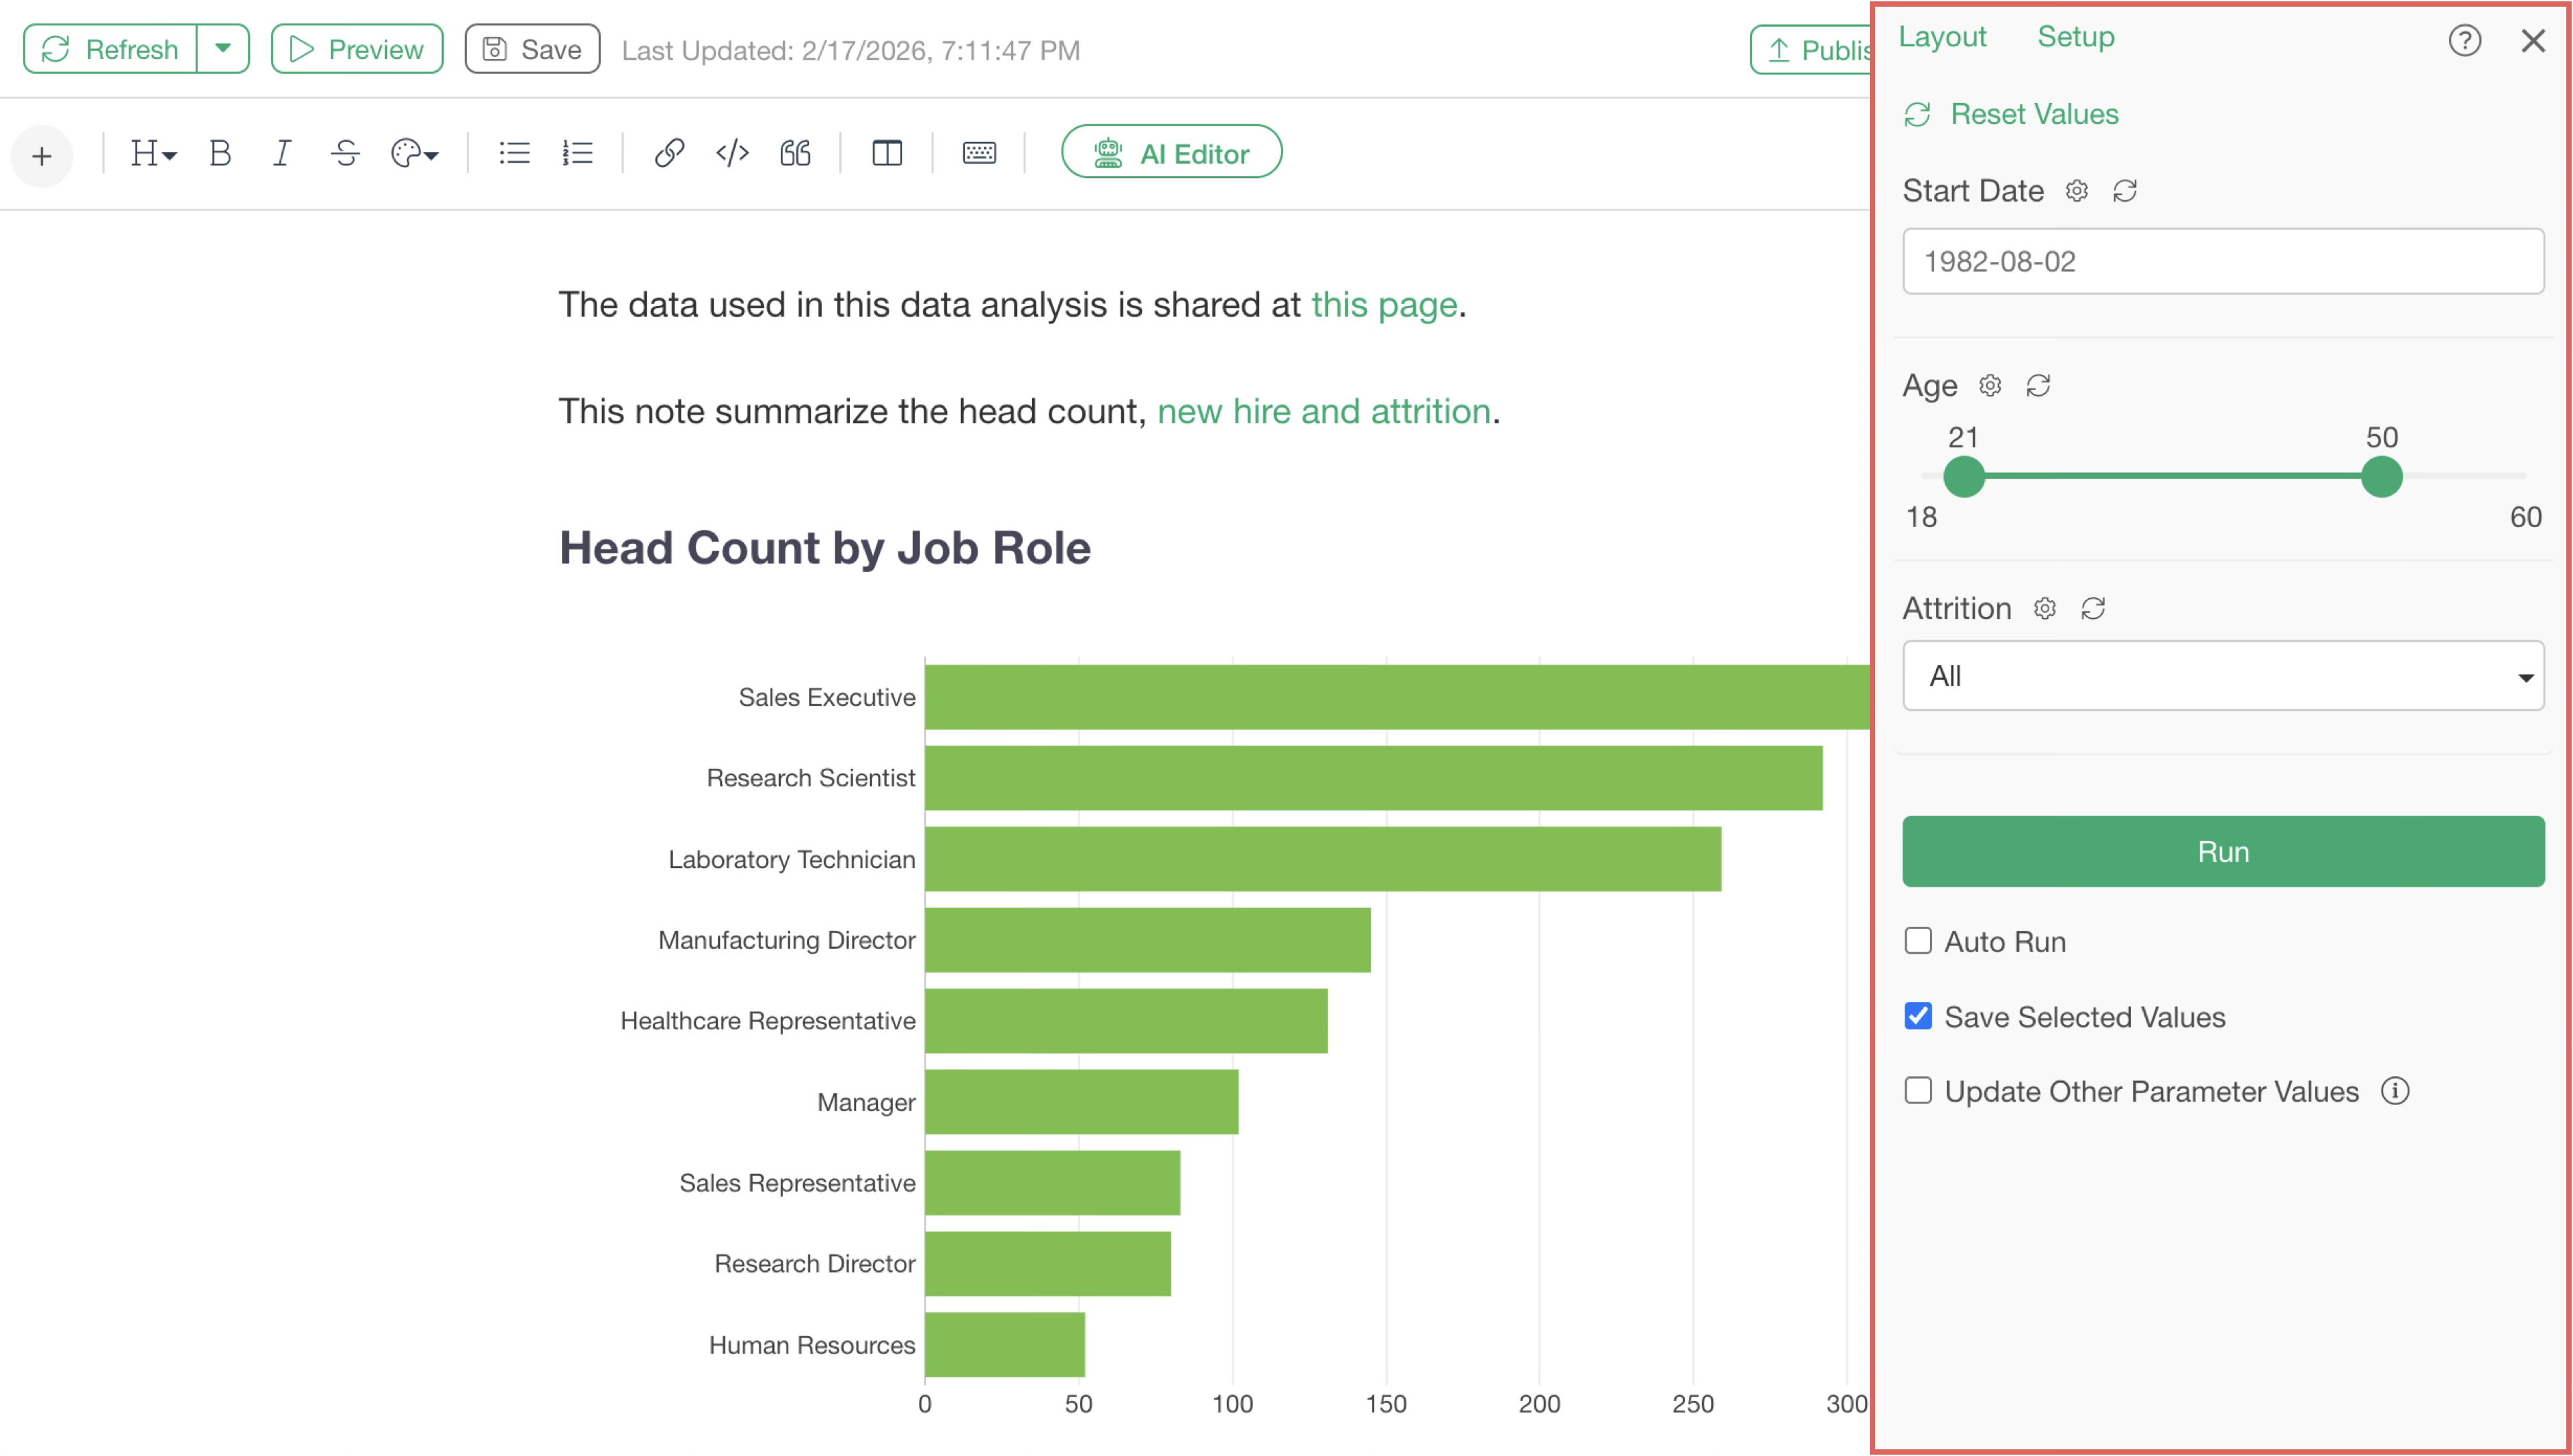
For more details on parameters, please check this note.
Constraints
Please note that Interactive Filters available in Dashboards are not supported in Notes.
Using AI to Edit Notes or Automate Analysis Report Creation
In Exploratory Notes, you can use the “AI Note Editor” feature to have AI summarize text or create analysis reports.
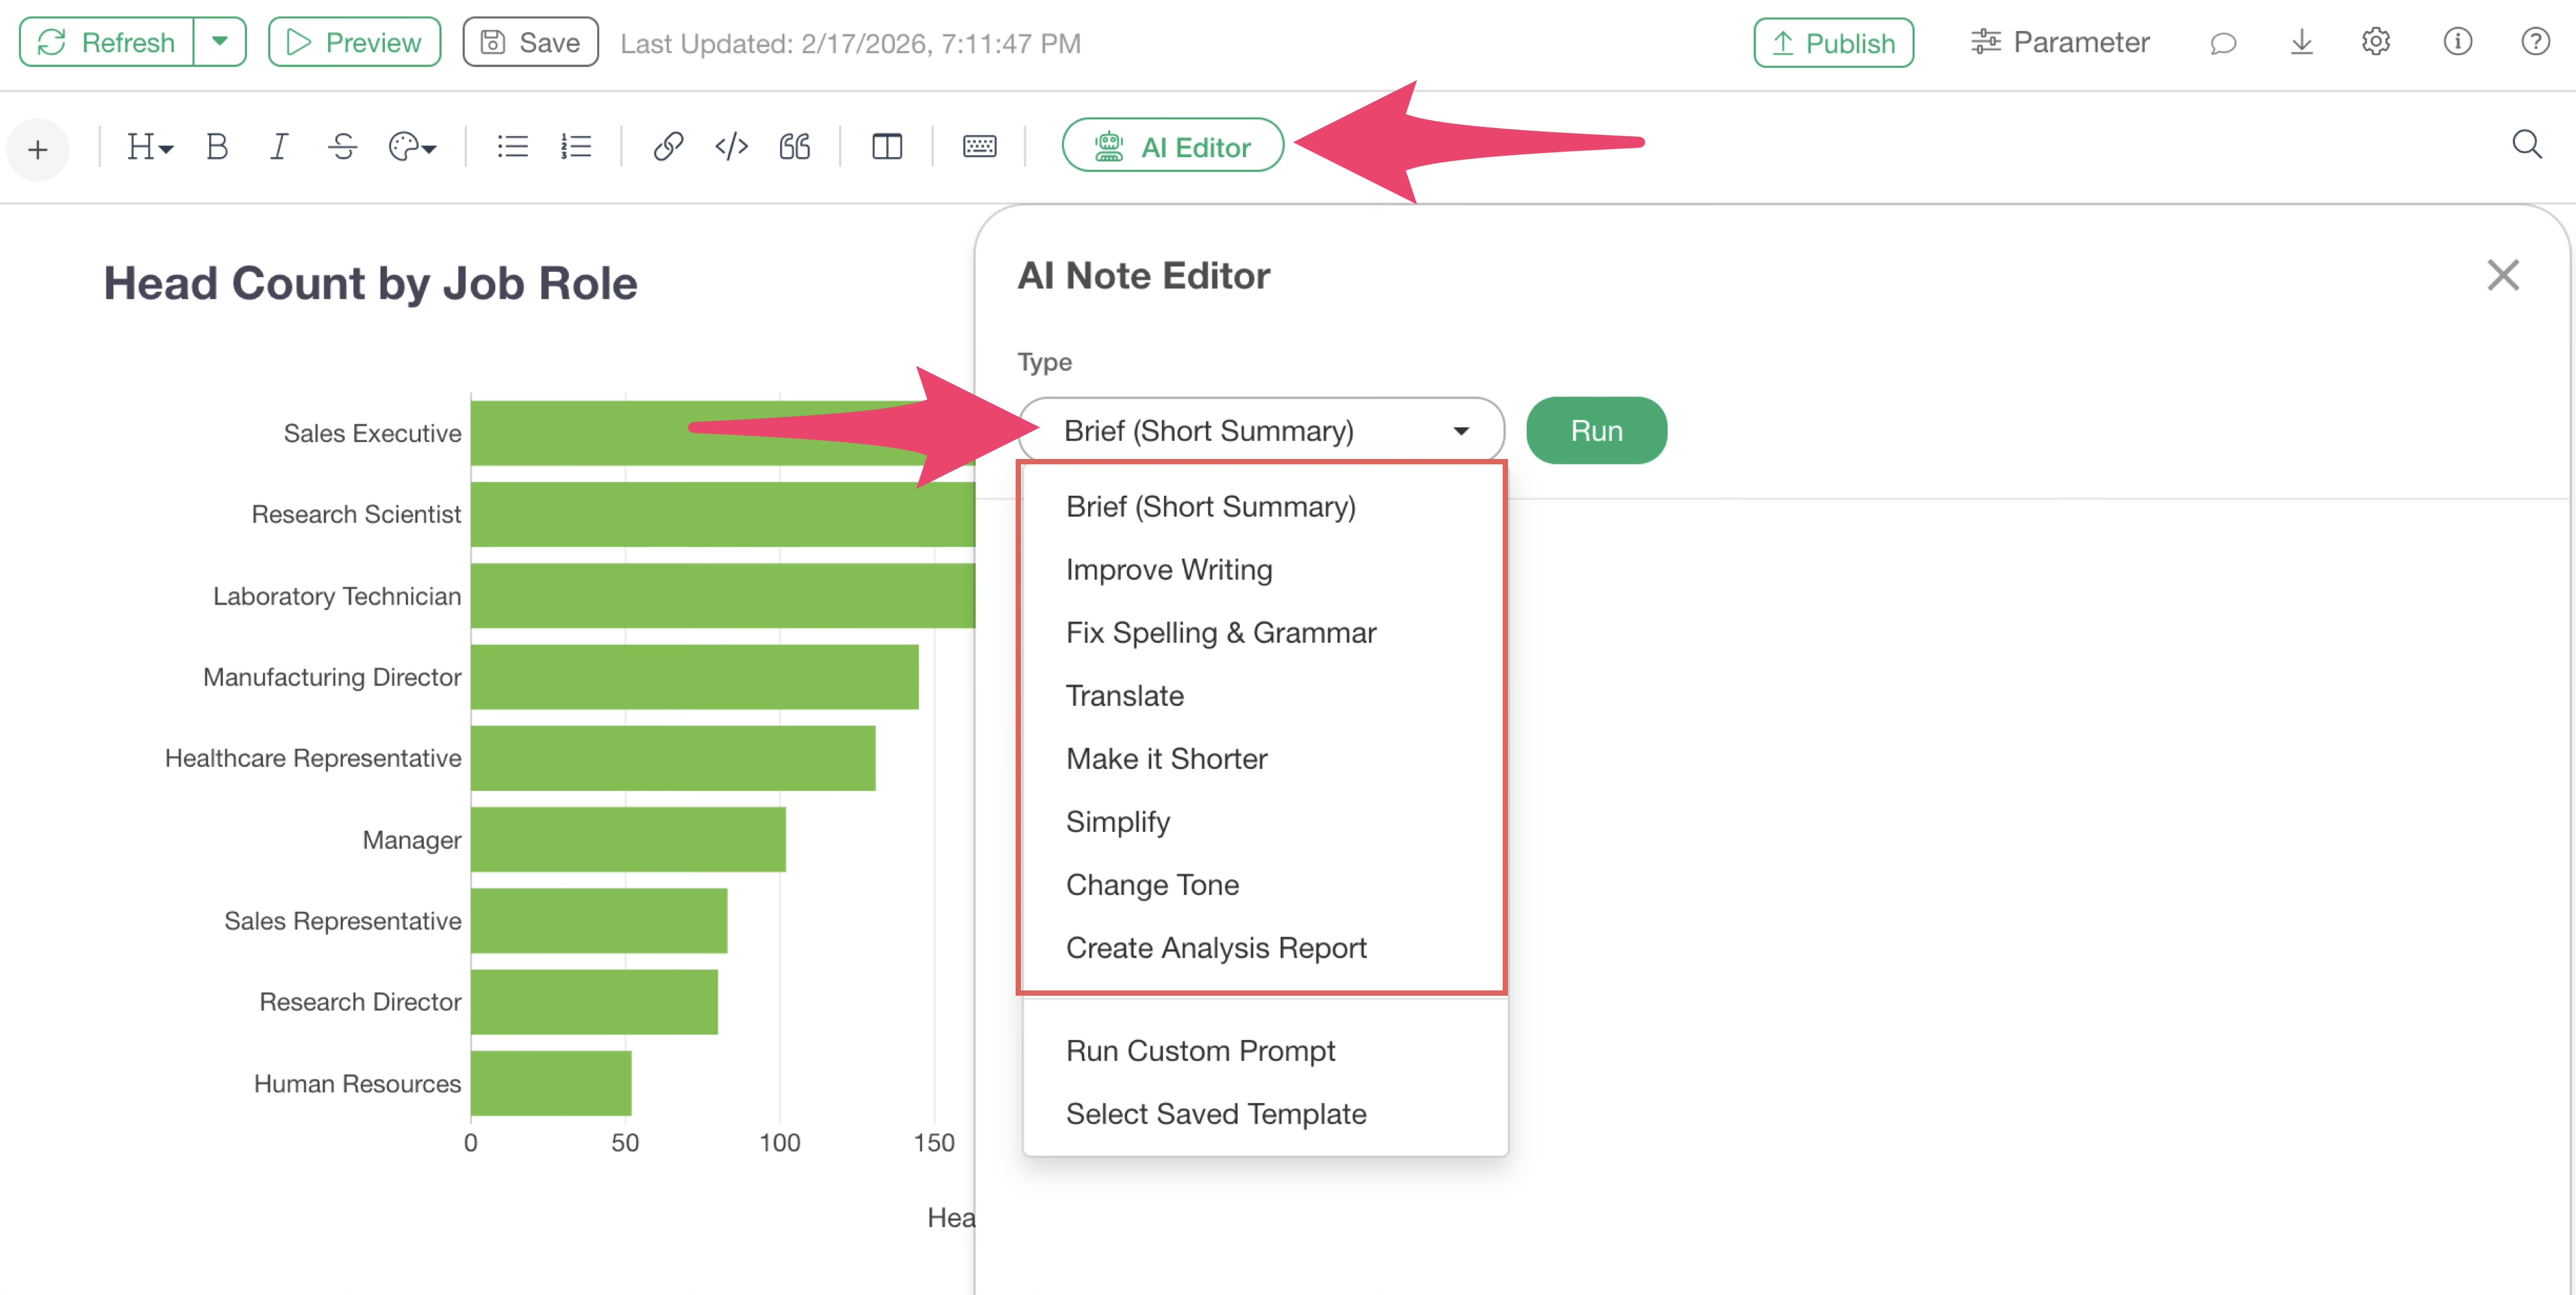
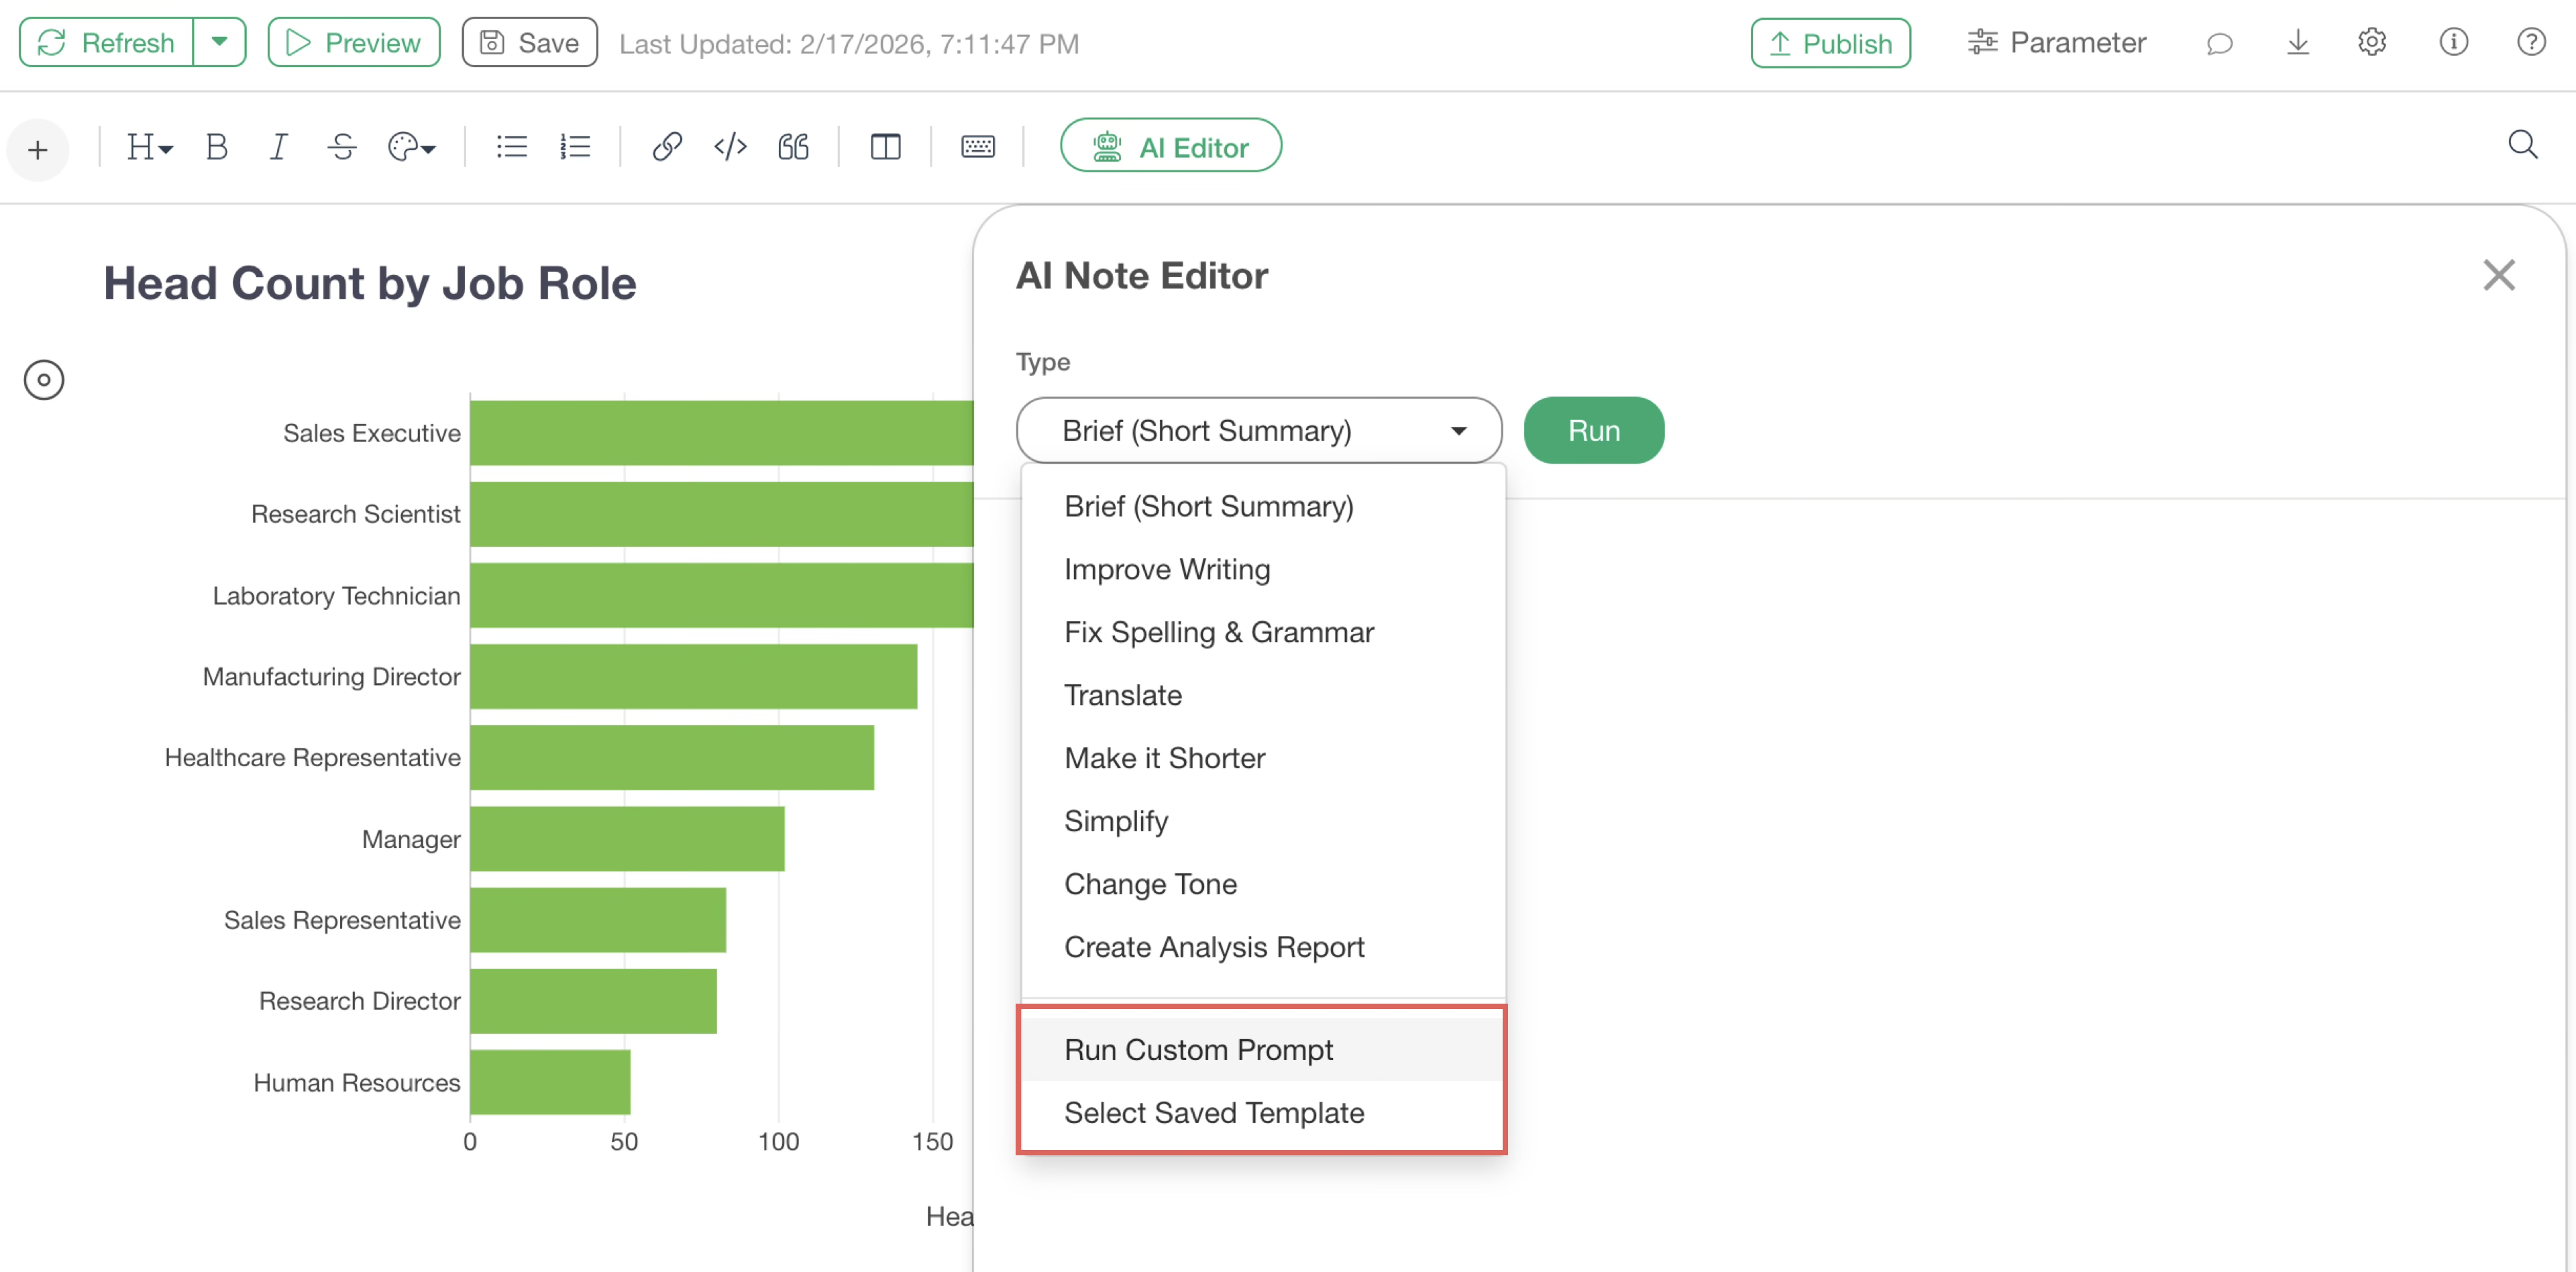
Furthermore, you can execute your own customized prompts or save them as templates.
For details on the “AI Note Editor,” please refer to the following links:
Check the Note Creation Results
To check the final result of the note, including the display of the table of contents, click the “Preview” button.

Clicking the preview button opens your default browser, allowing you to preview the results of the note you created.

Editing and Updating Charts/Analytics
Editing
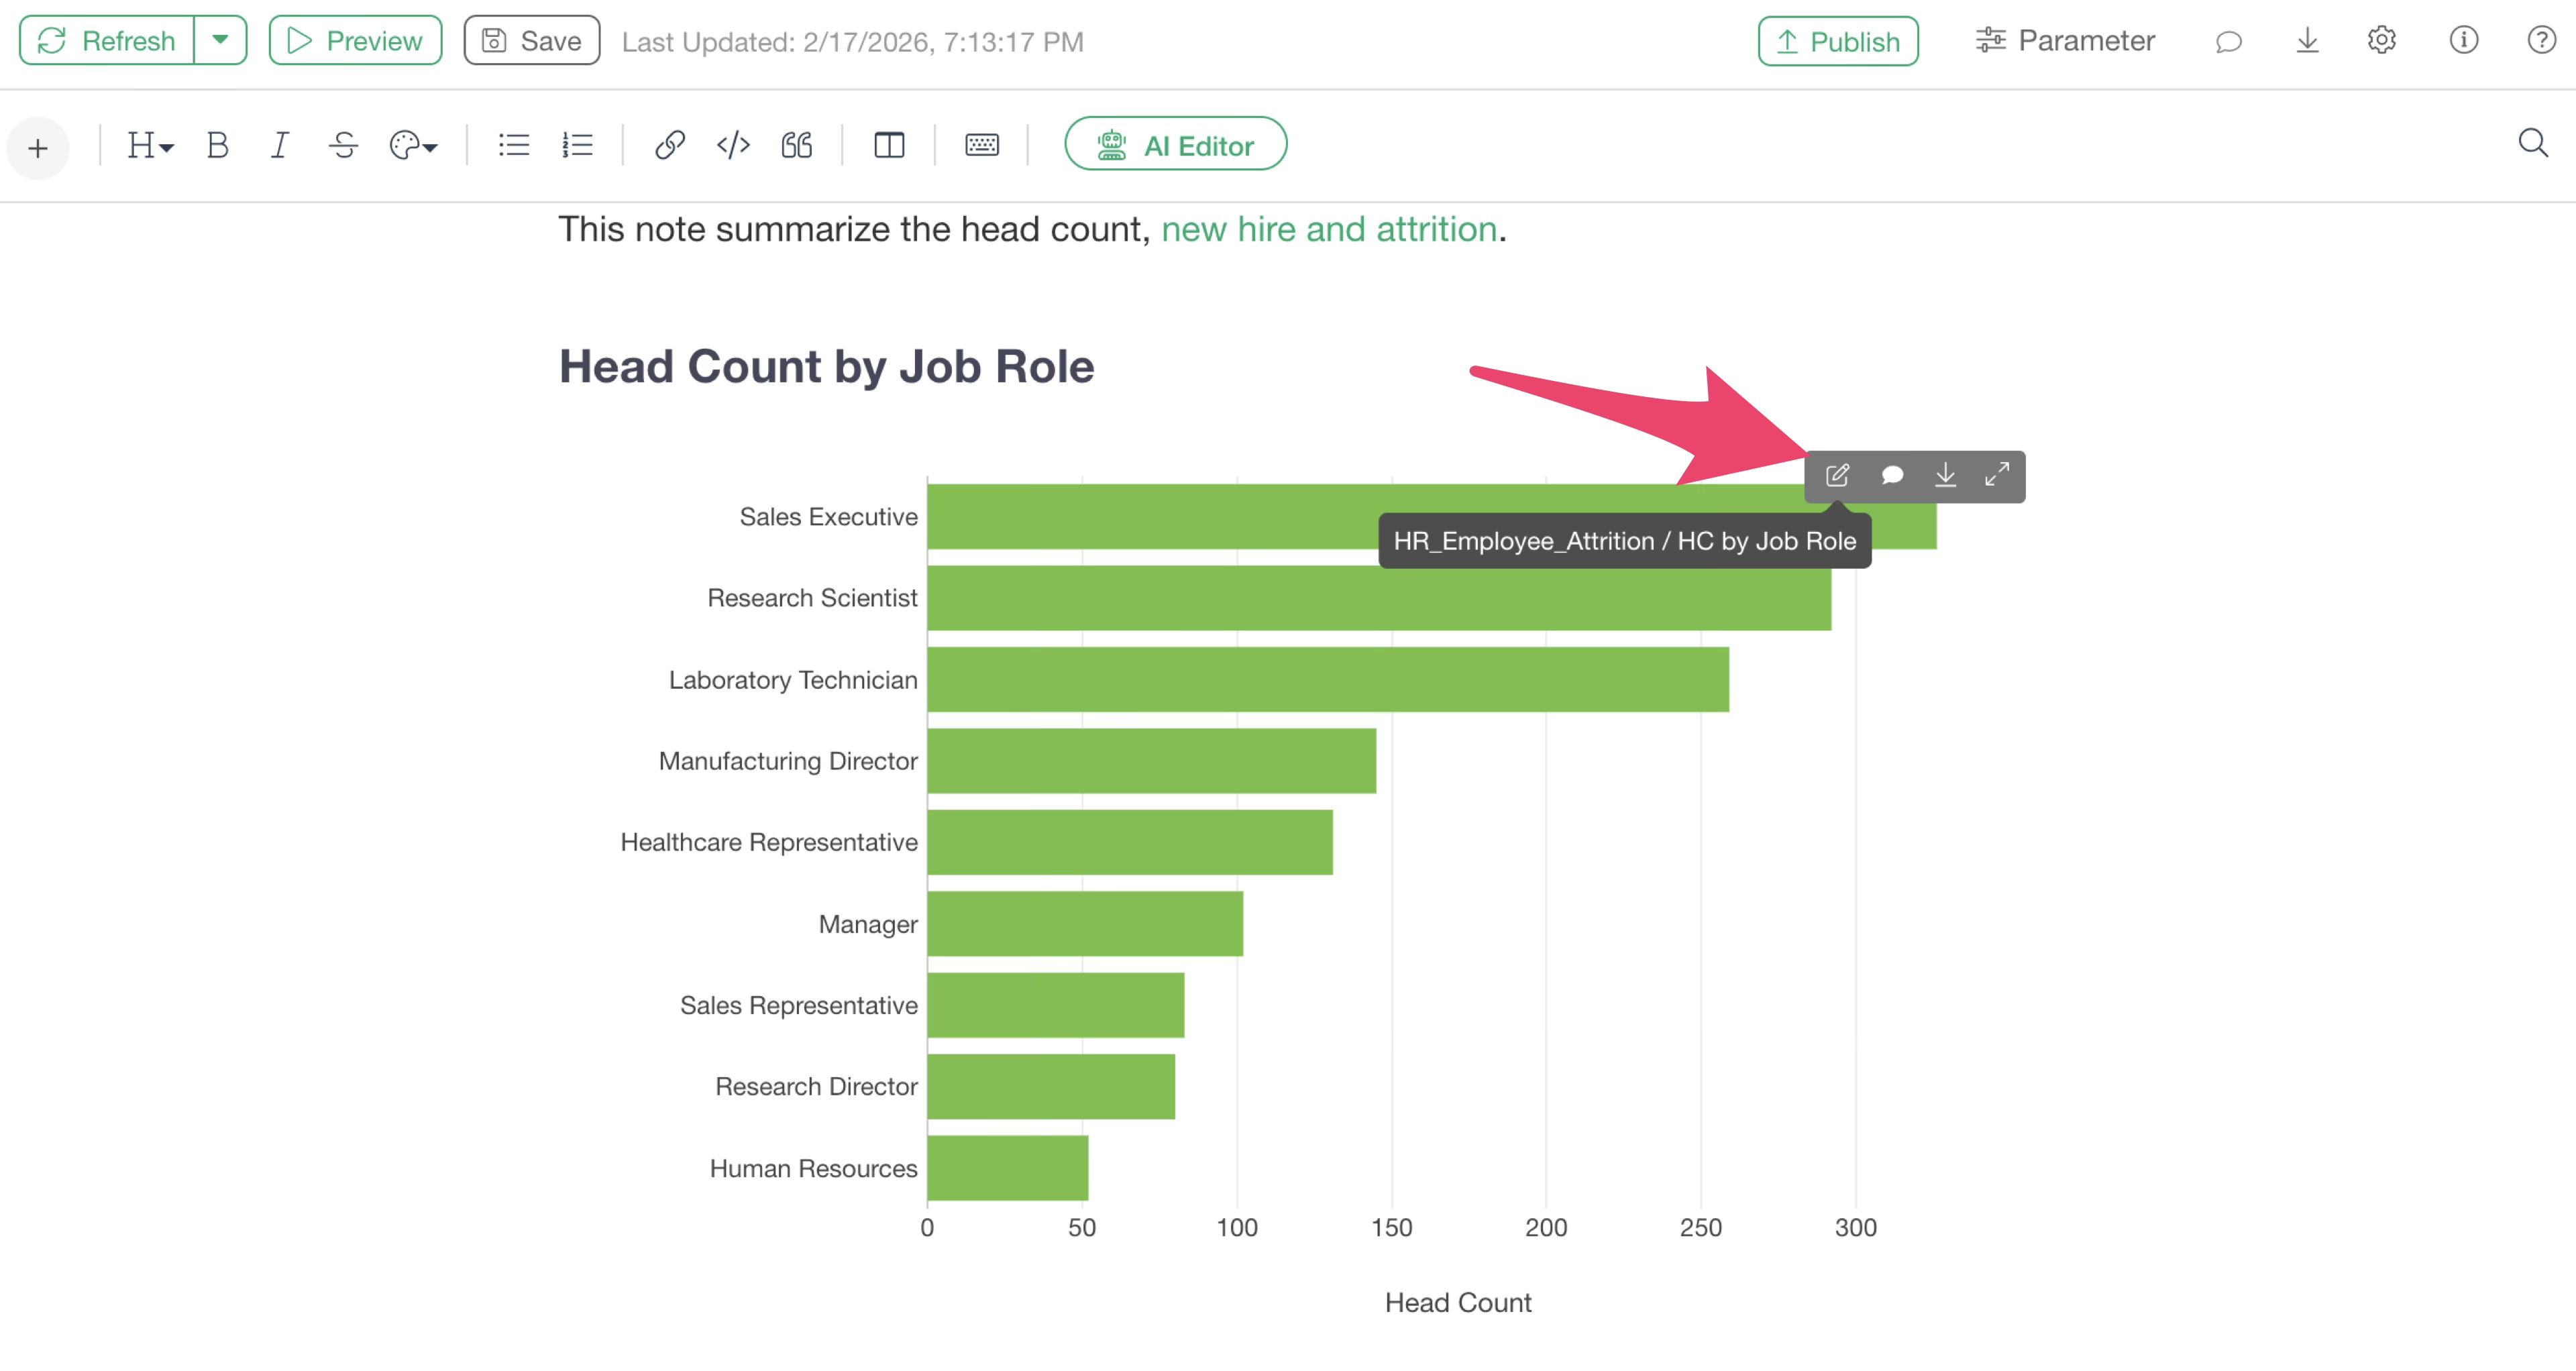
To edit a chart or analytics within a note, hover your mouse cursor over the chart in the note. A toolbar will appear, and by clicking the edit icon, you can directly open the corresponding chart tab to edit the chart or analytics immediately.
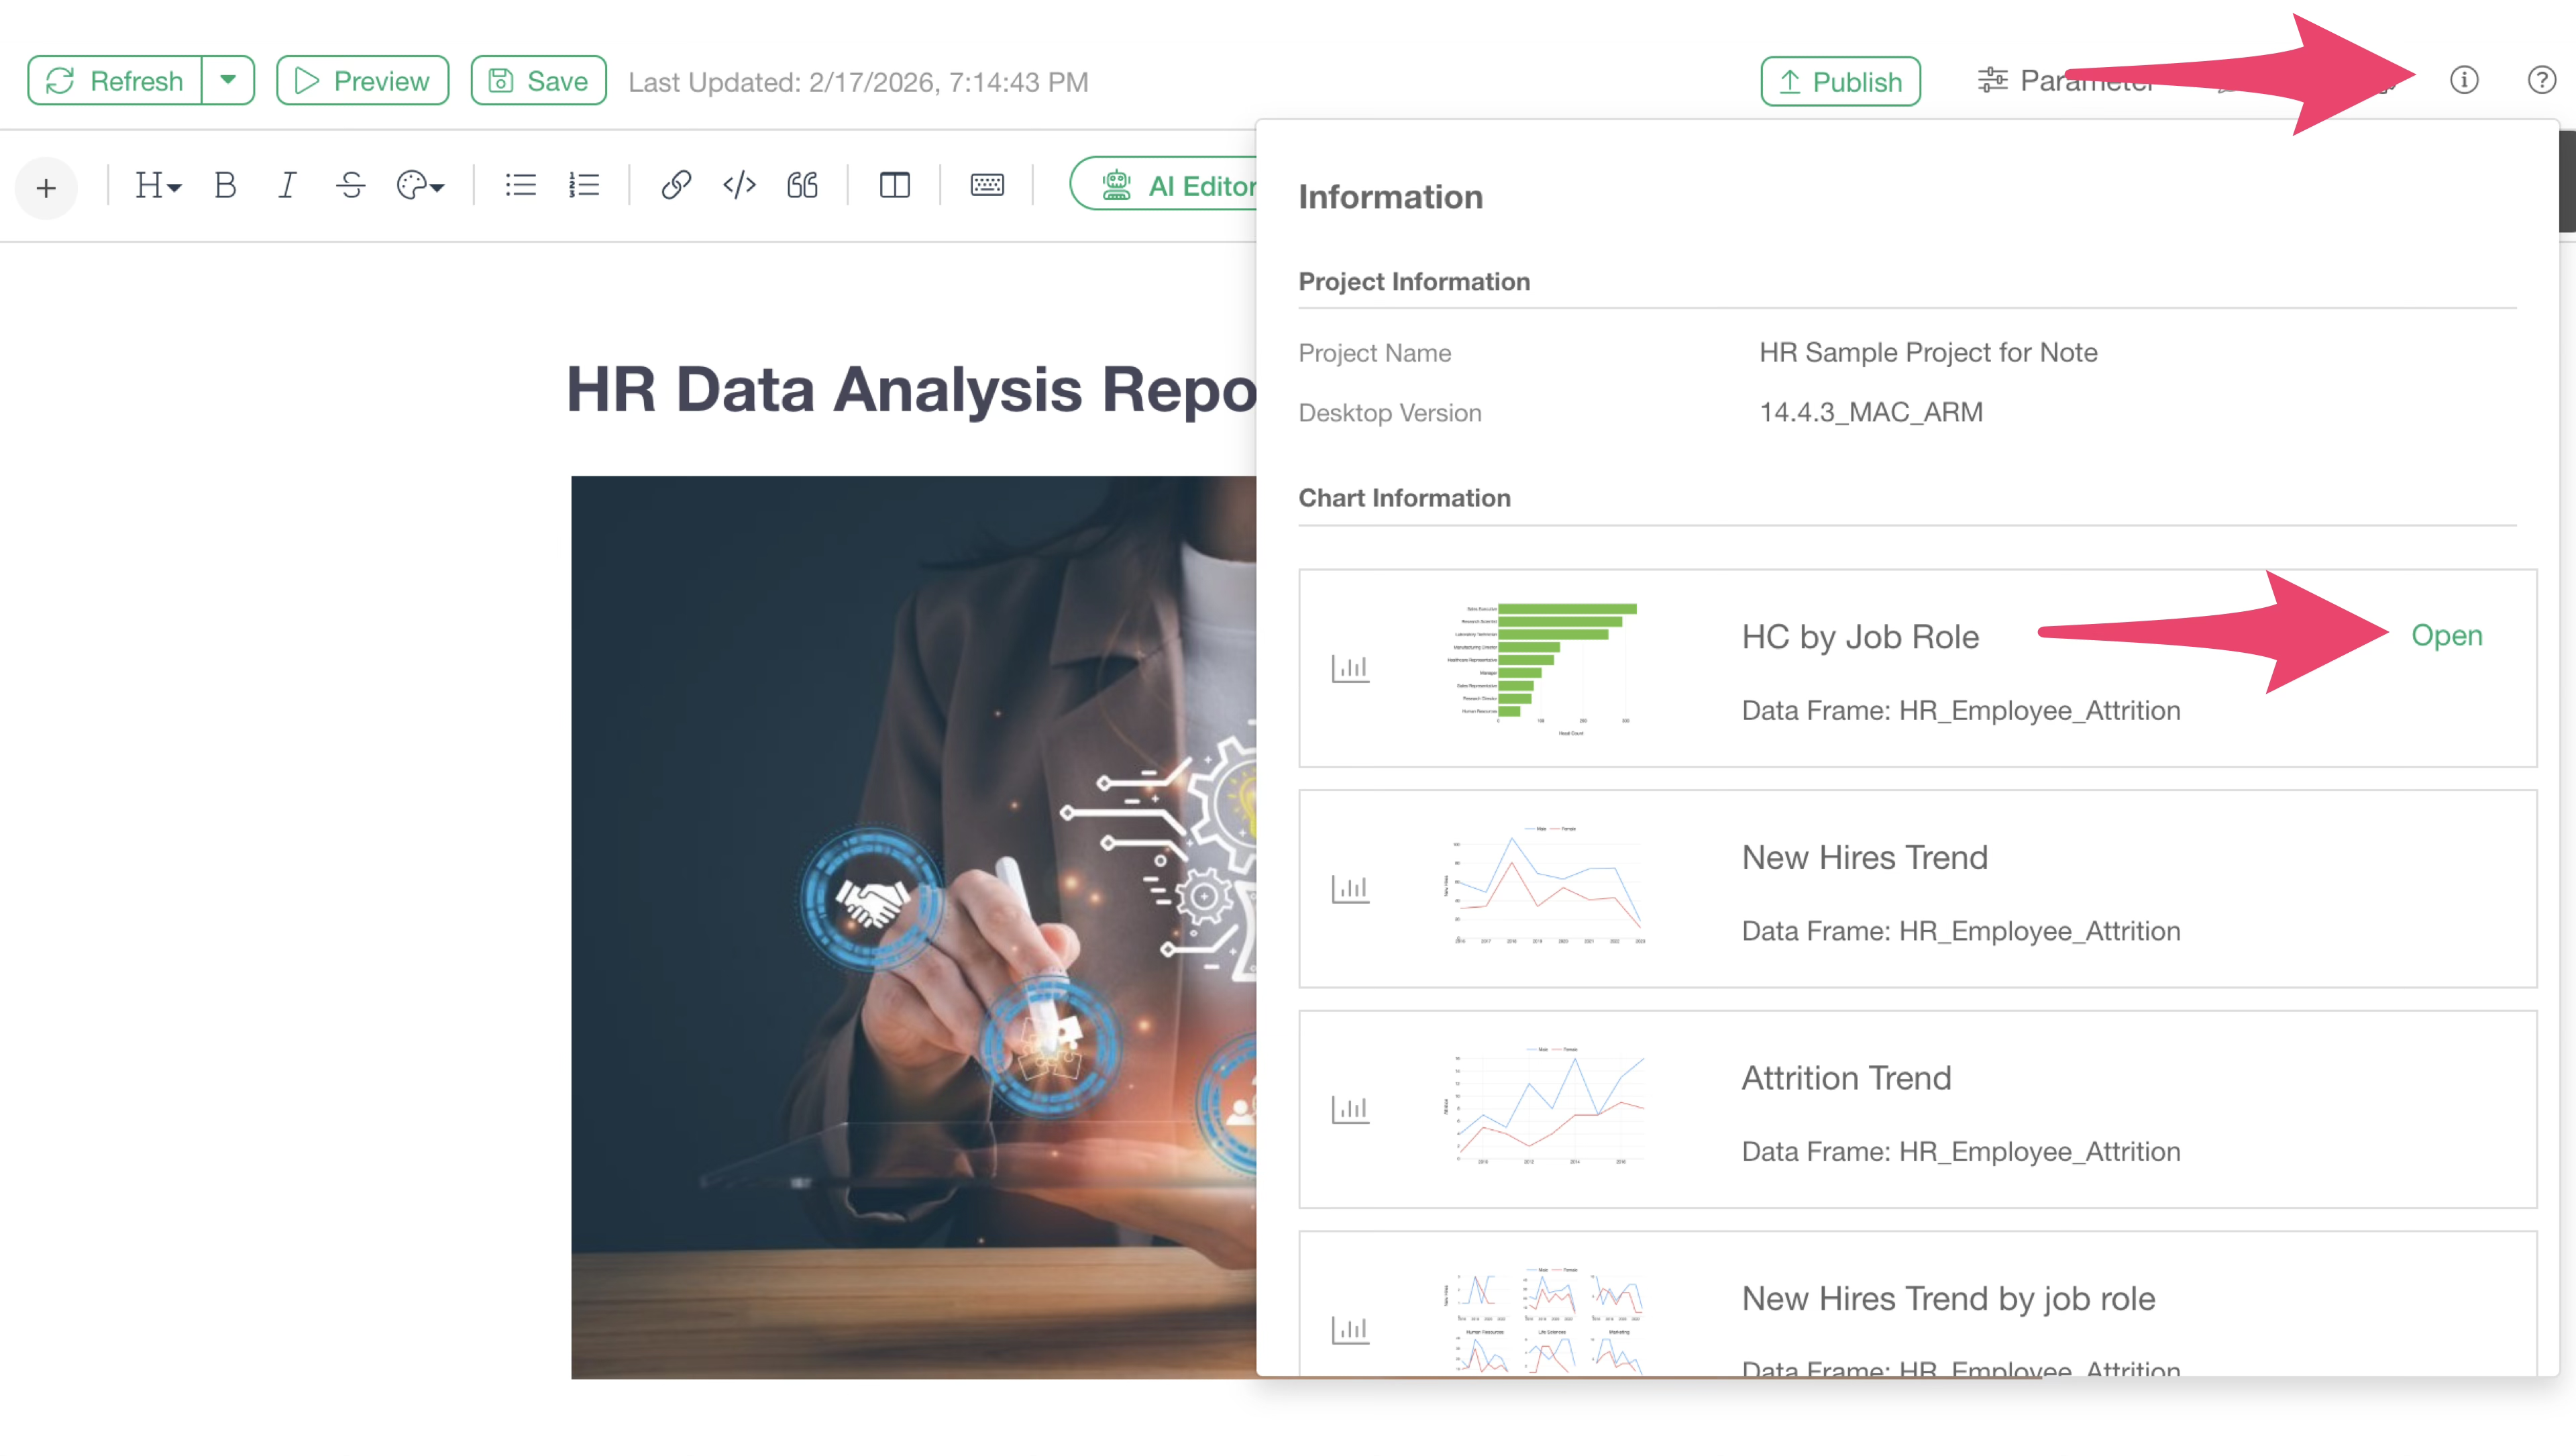
Additionally, clicking the info icon in the note displays all charts included in that note and the data frames associated with them. Hovering over each chart block reveals an “Open” button to open the chart directly.
Updating
Suppose you update the settings of a chart inserted in a note while editing the note.
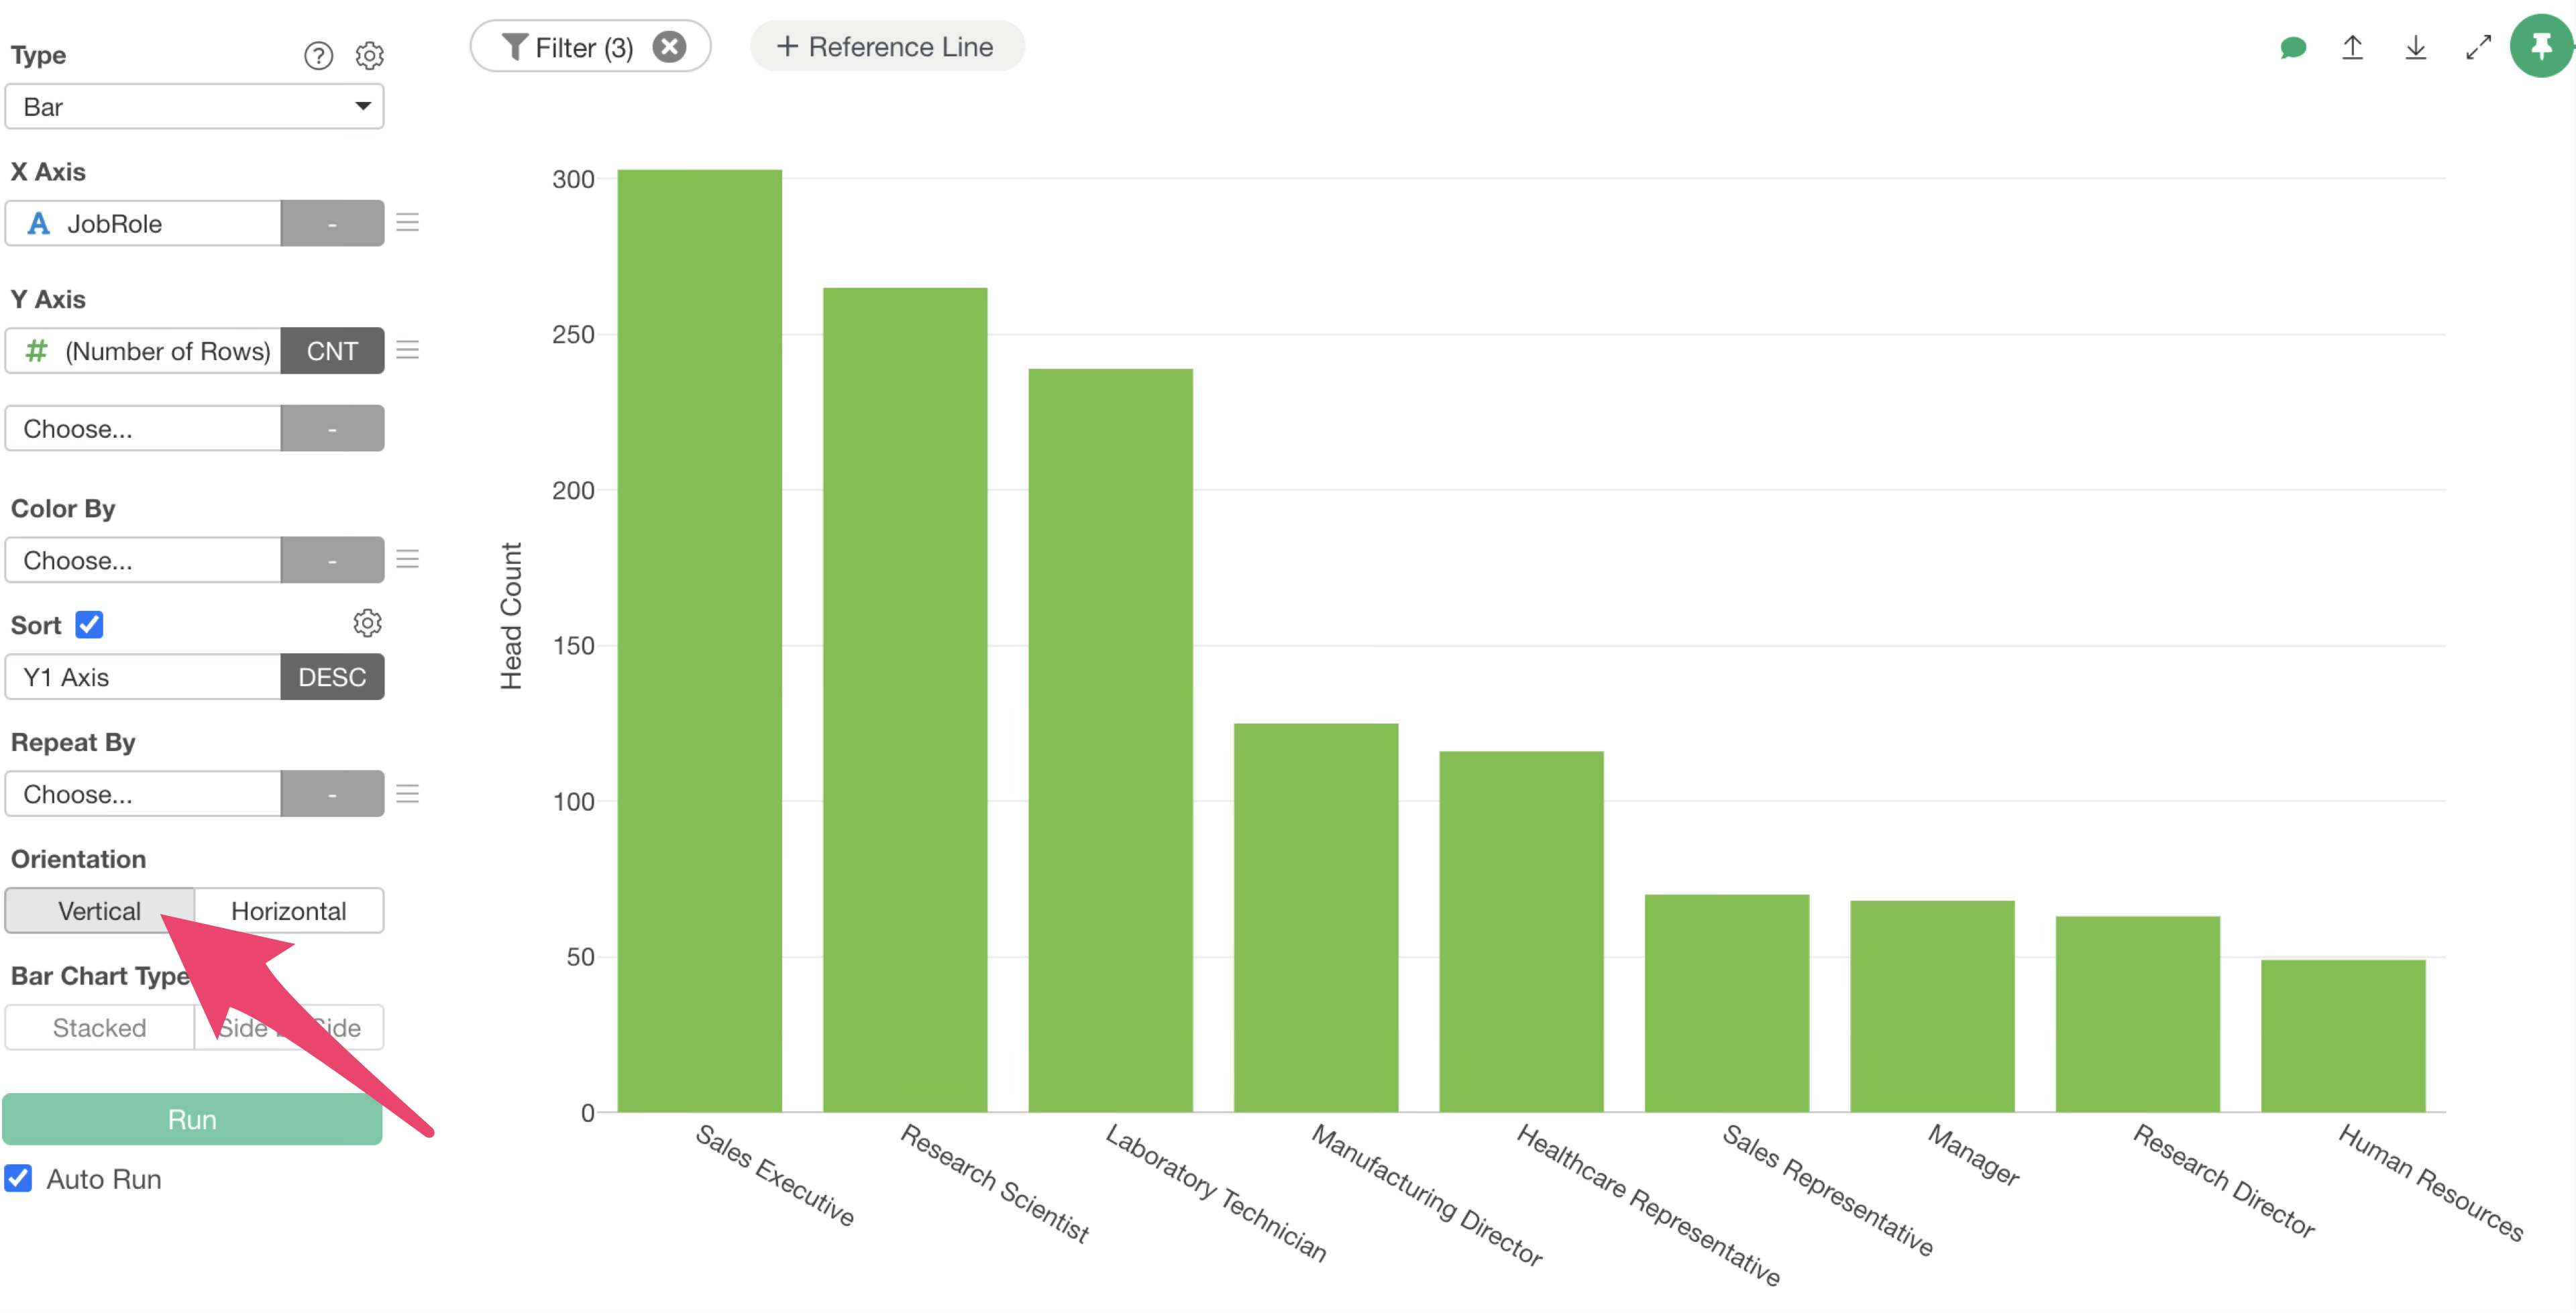
At this stage, the changes to the chart are not yet reflected in the note.
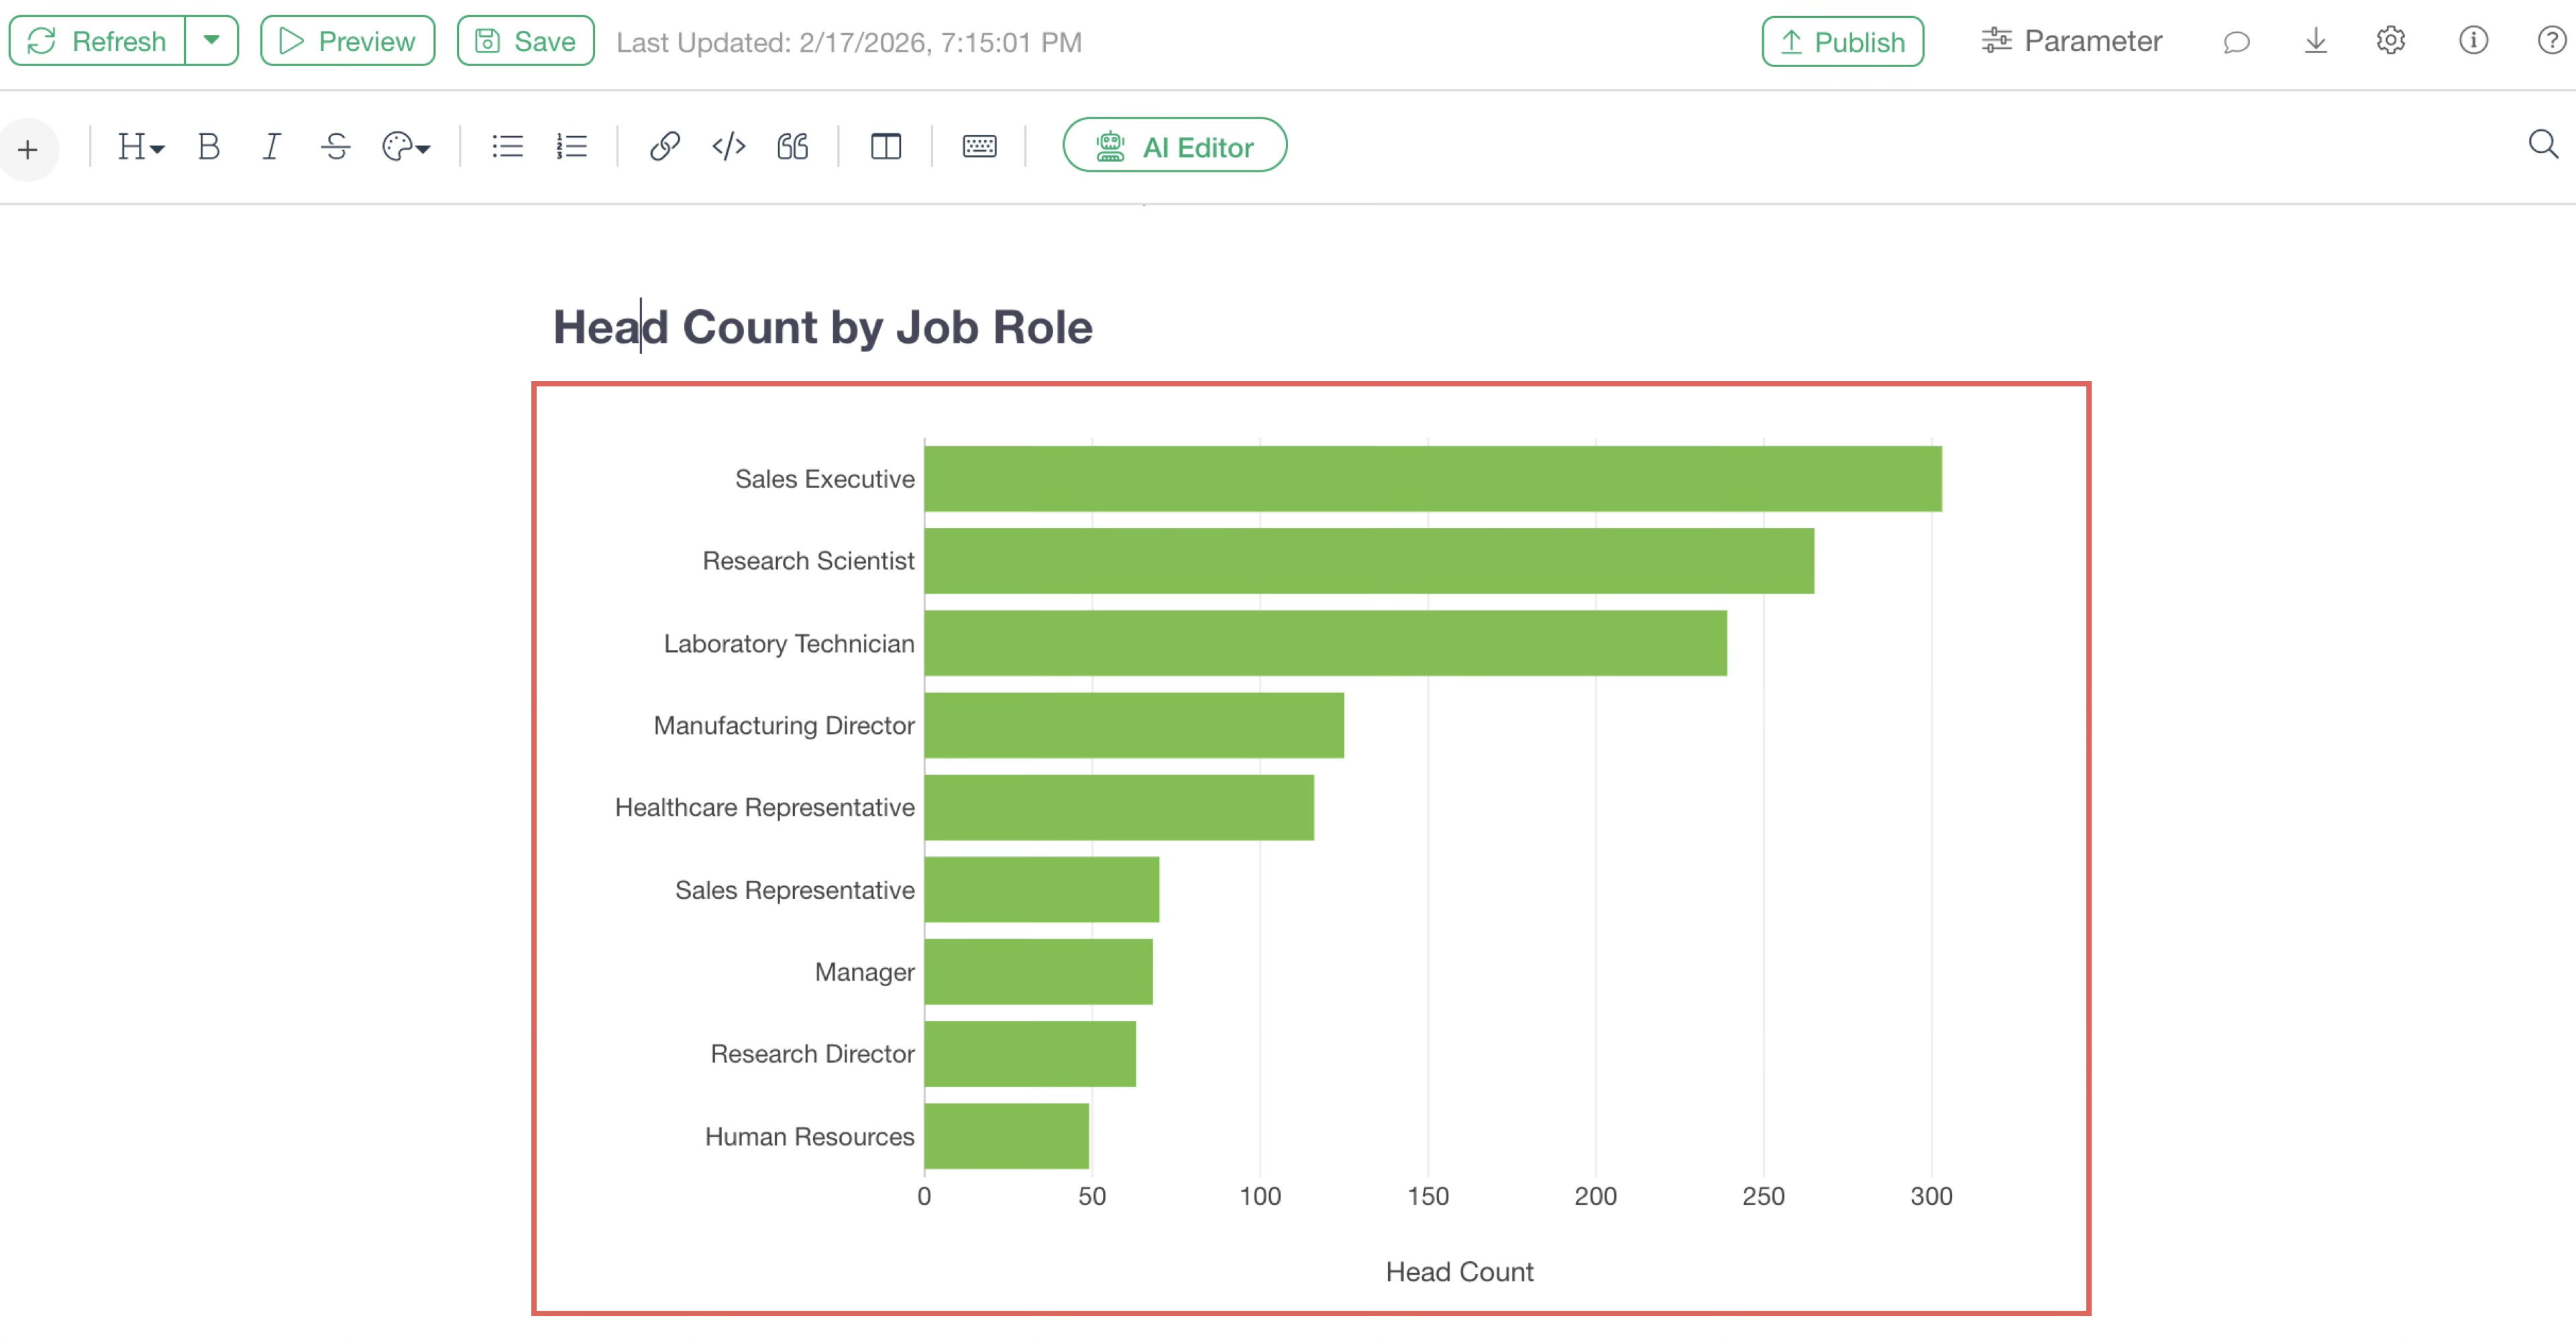
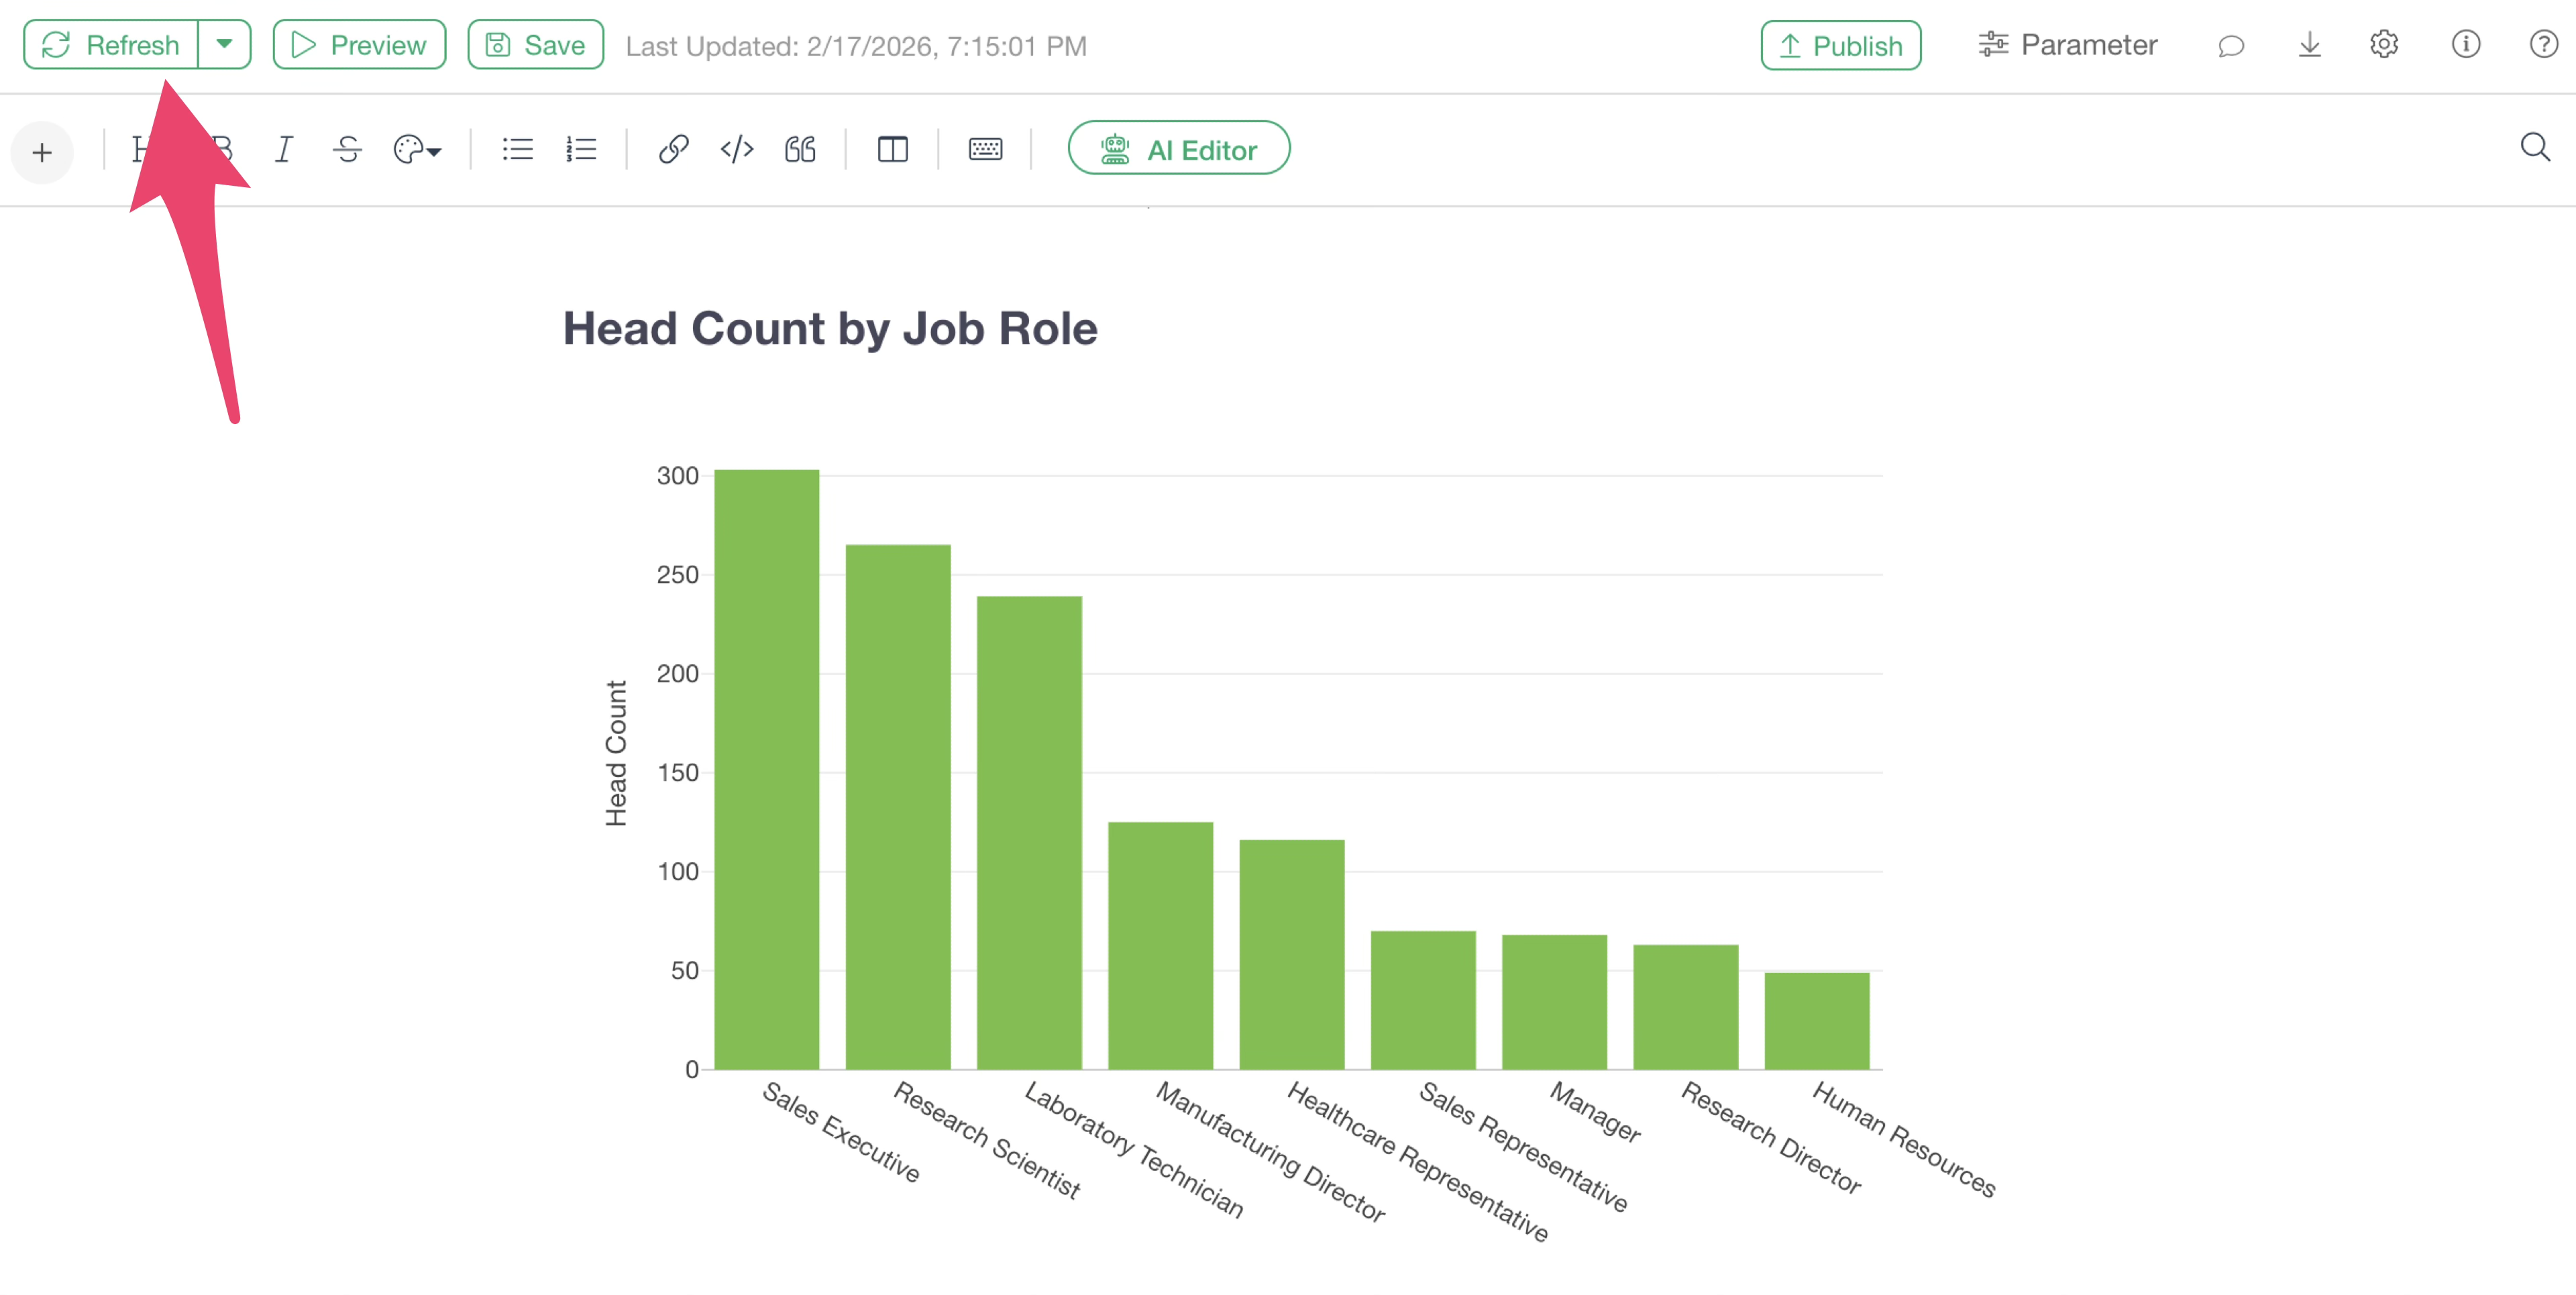
This is because the content visible in the note is the result at the time the chart was added. Therefore, when you modify a chart, click the “Refresh” button at the top left of the note.
Re-importing Data and Updating
To update charts after re-fetching data from the data source, select “Refresh (Re-import Data)” from the refresh menu.
The data will then be re-imported, allowing you to update the charts and analytics included in the note.
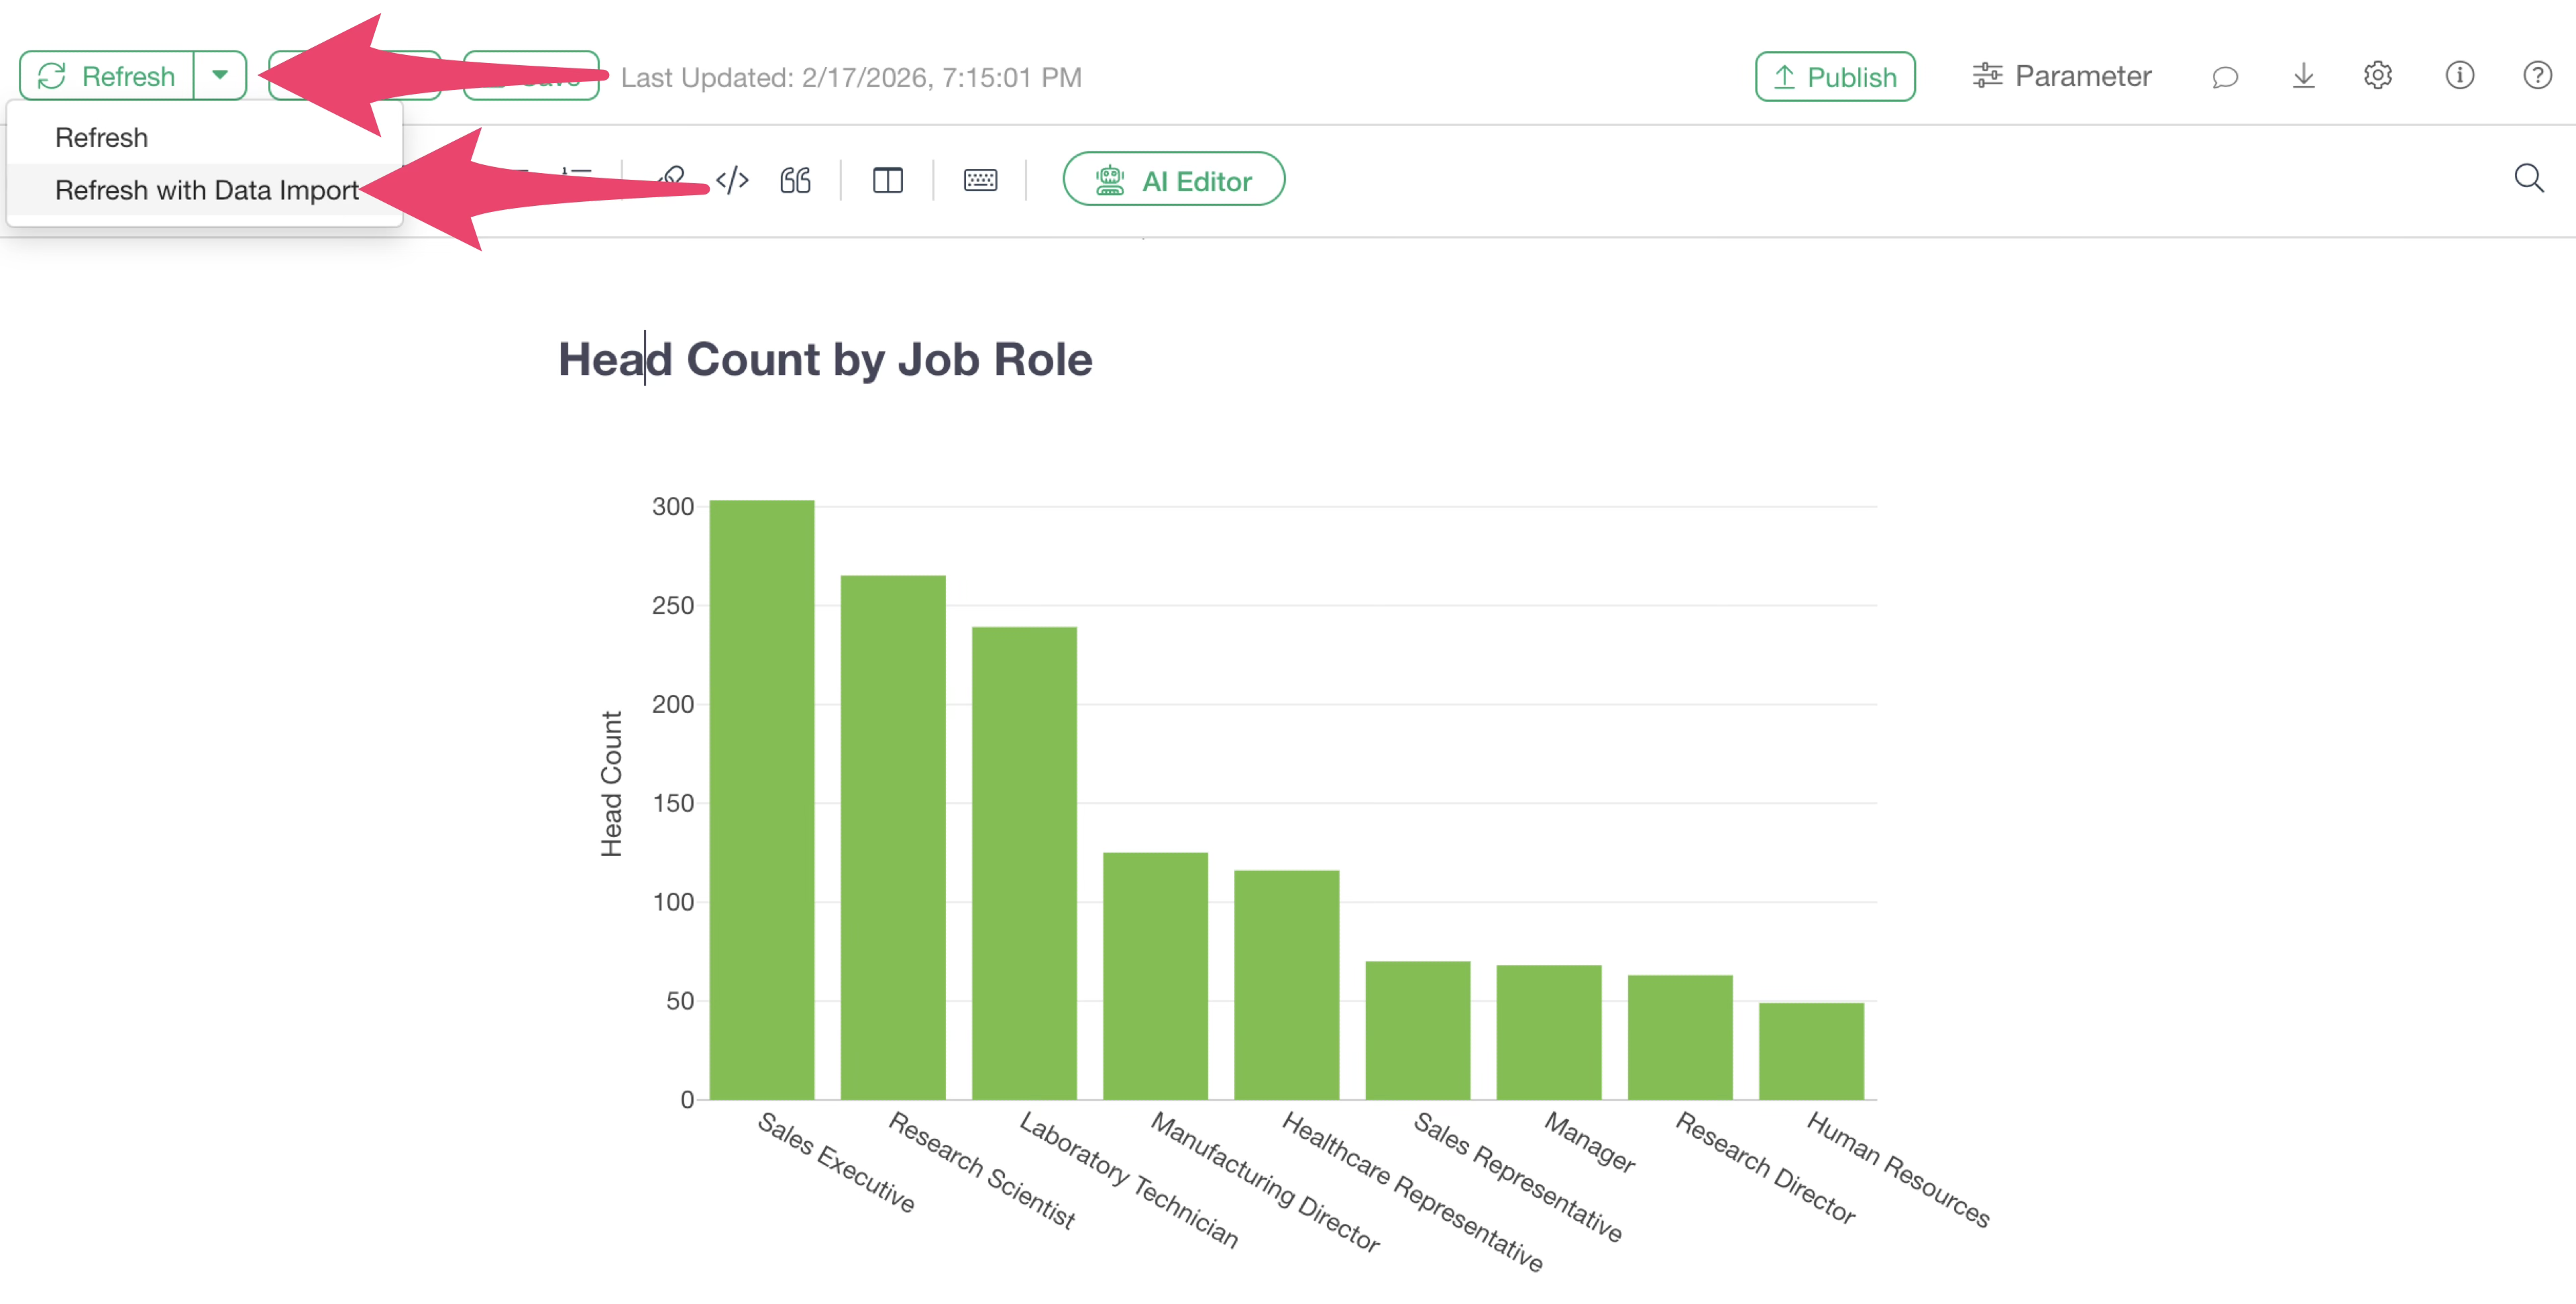
Table of Contents Settings
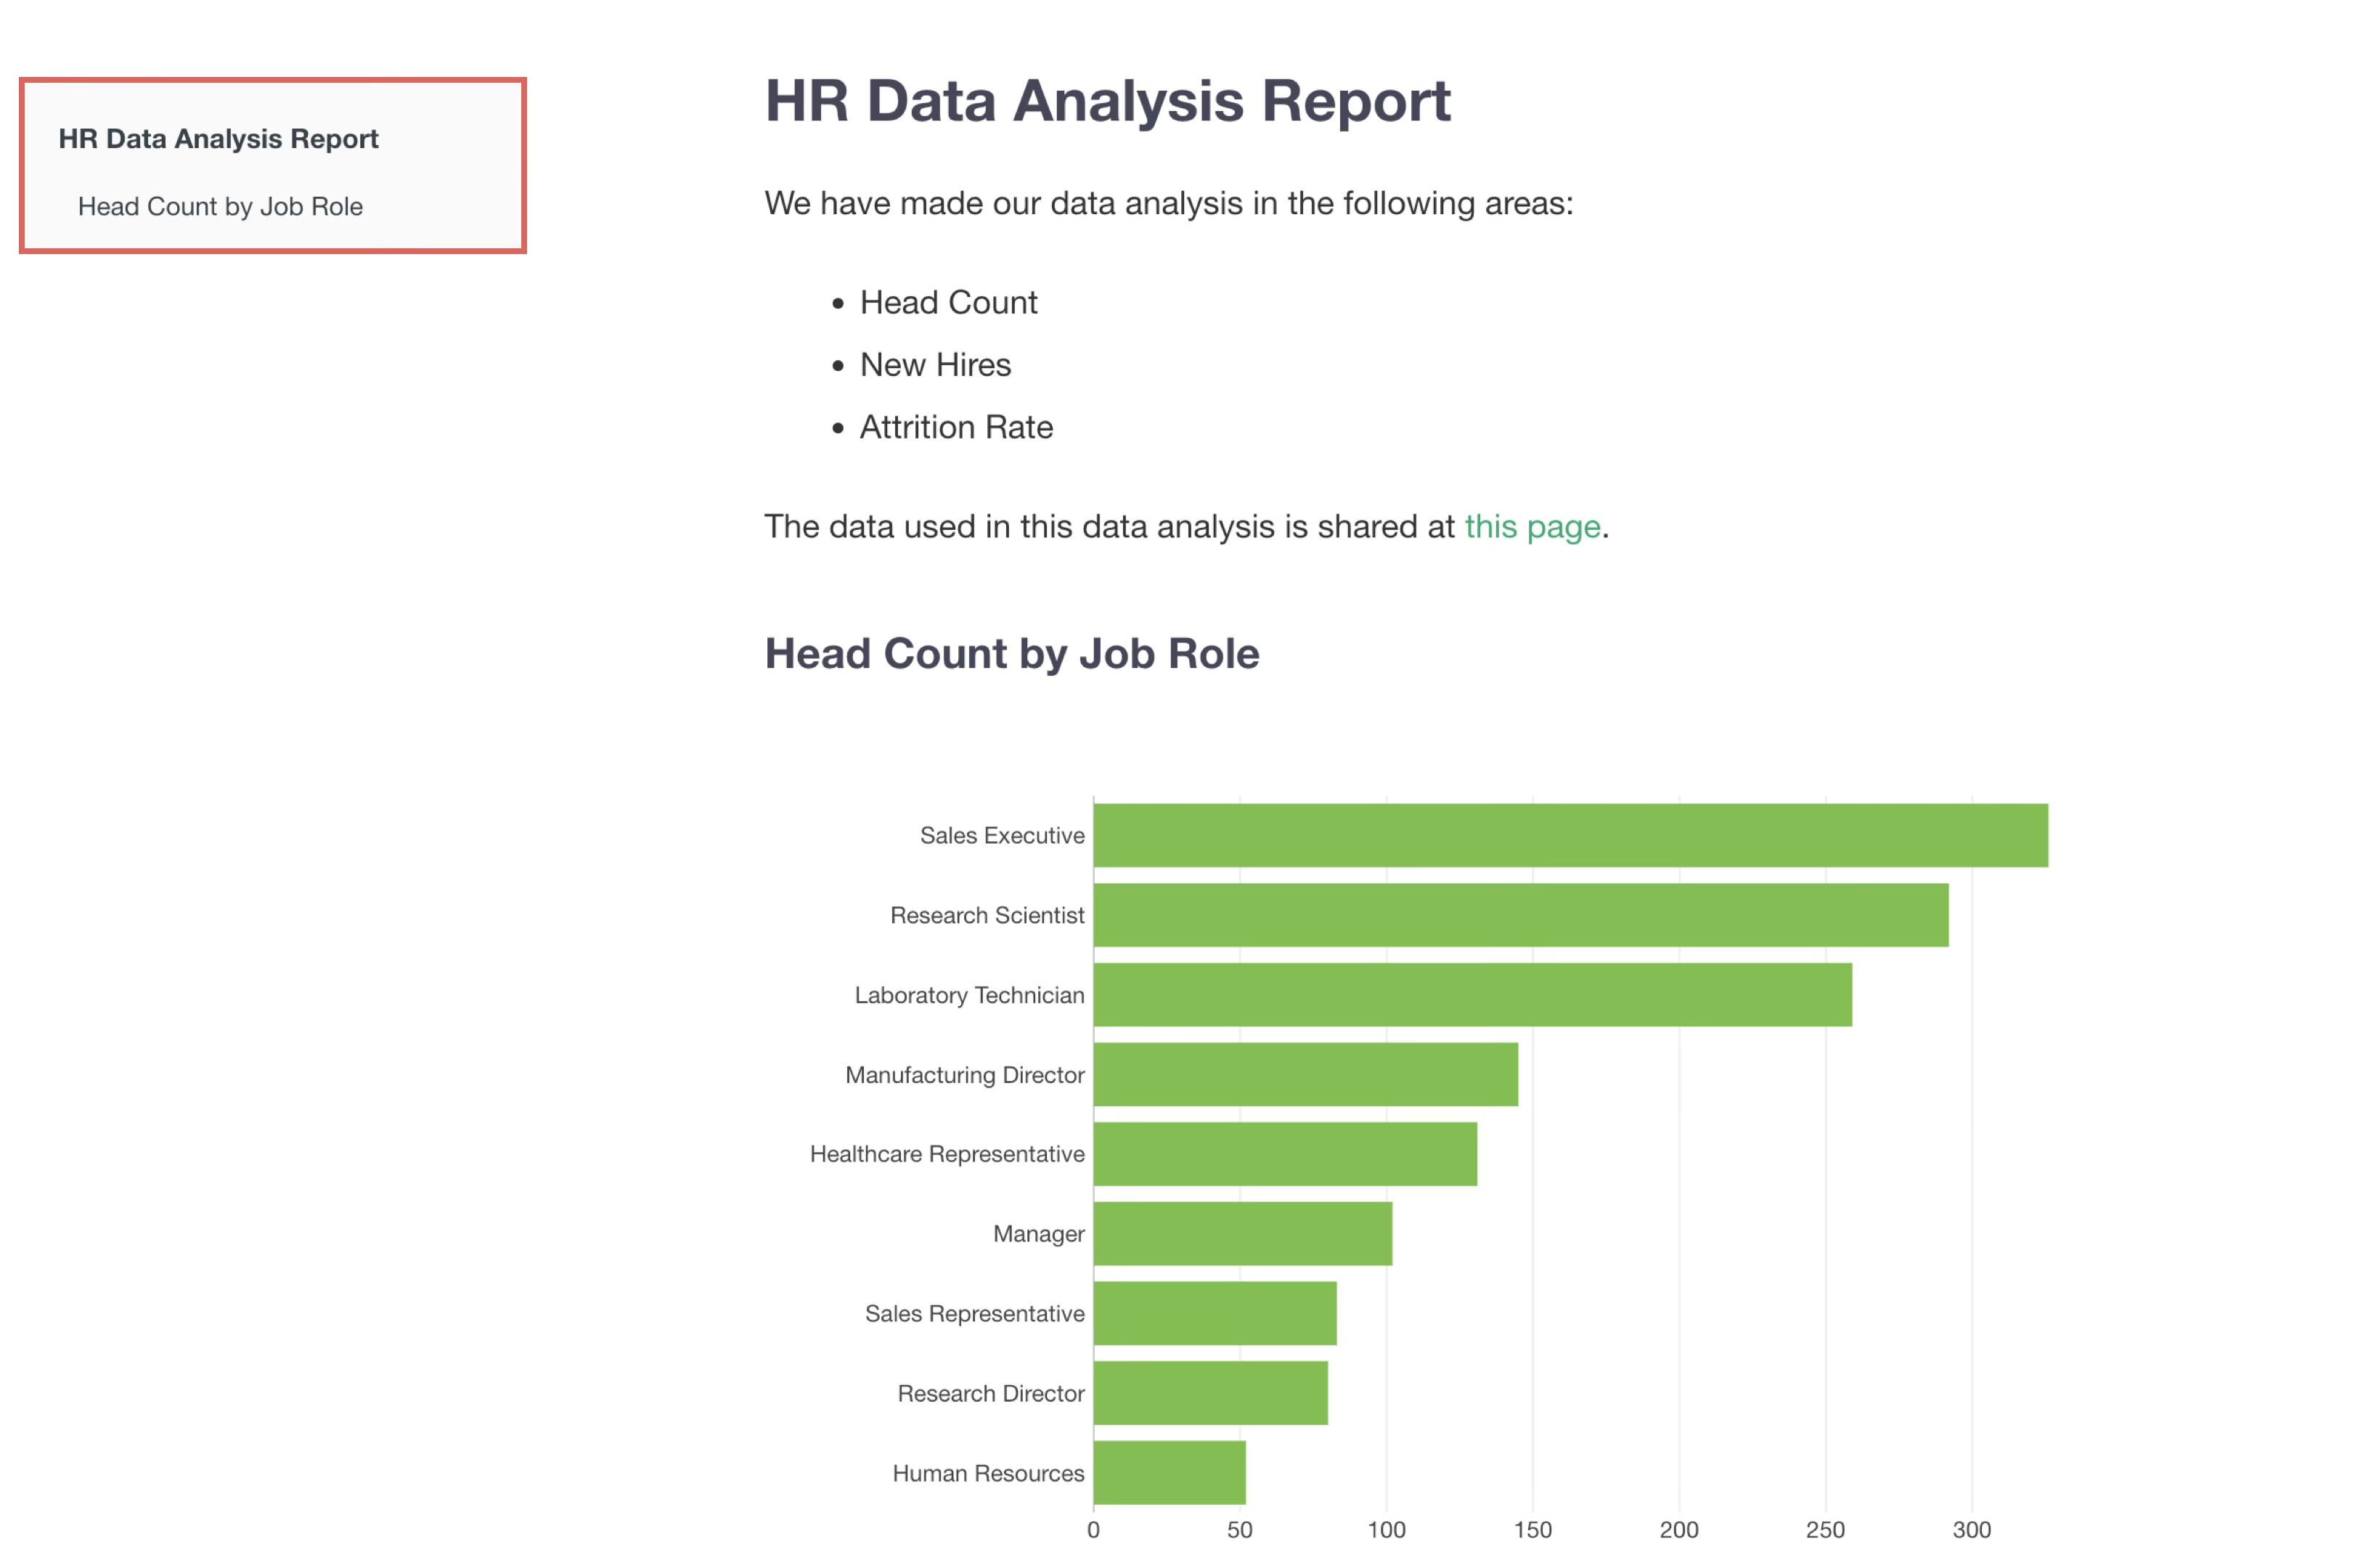
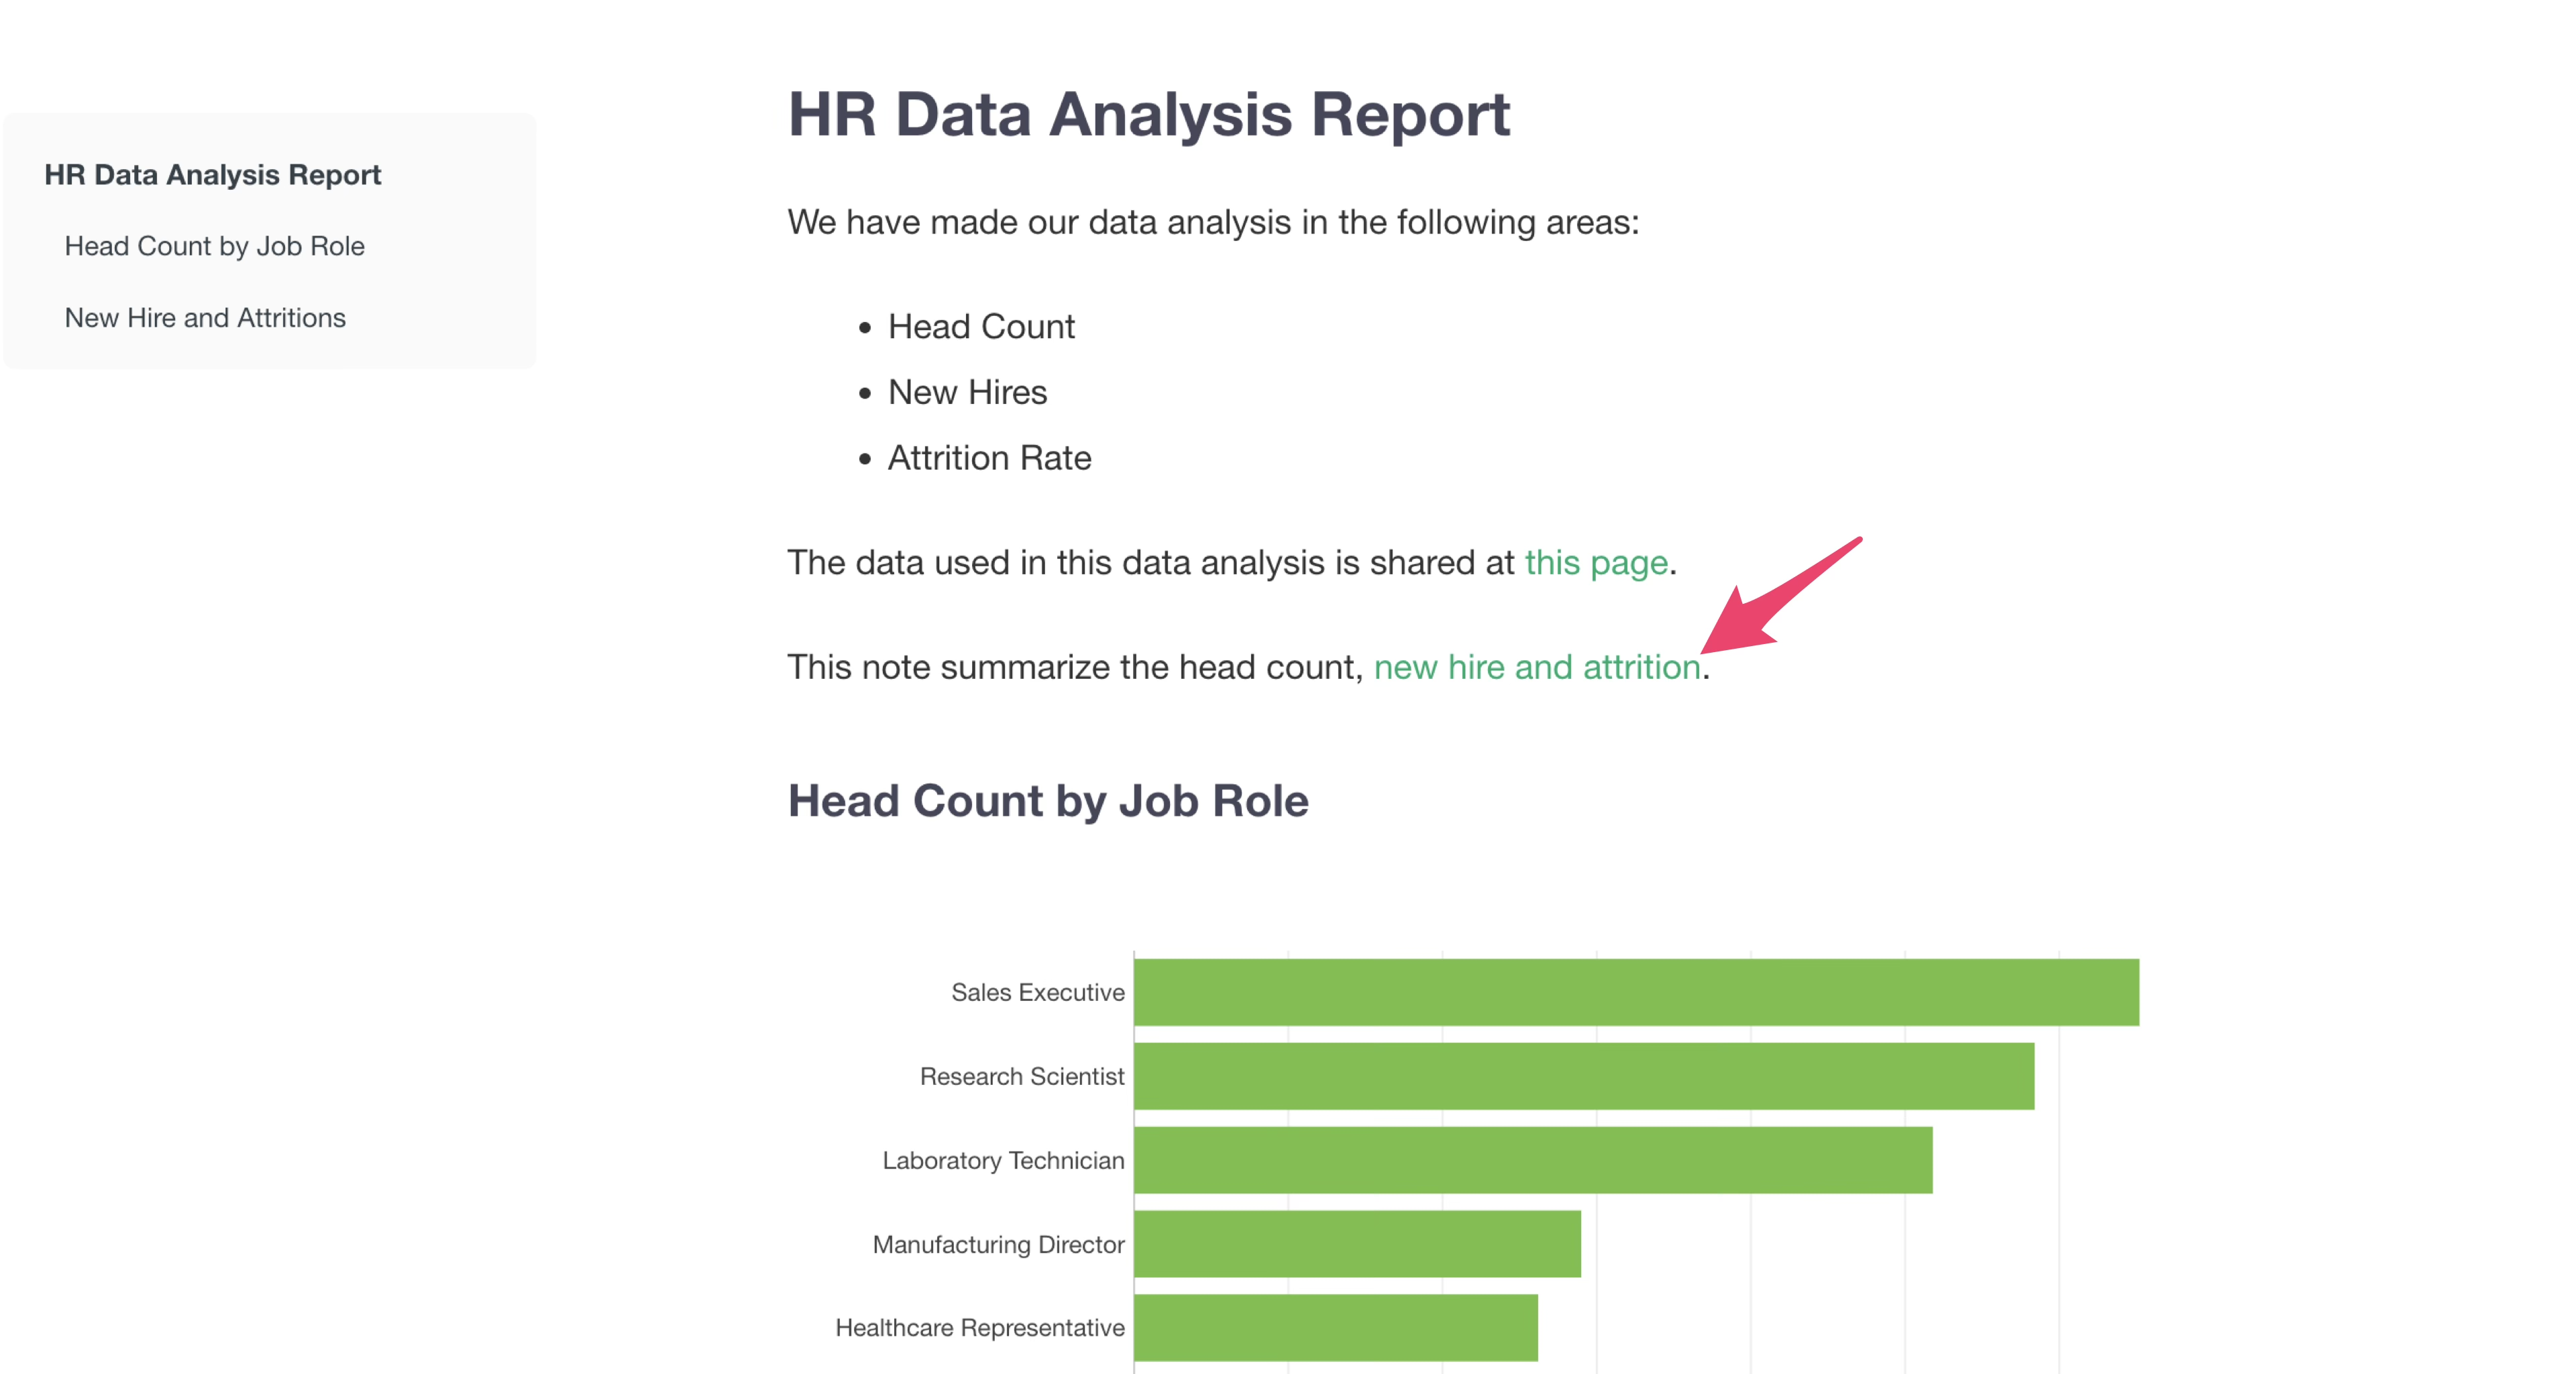
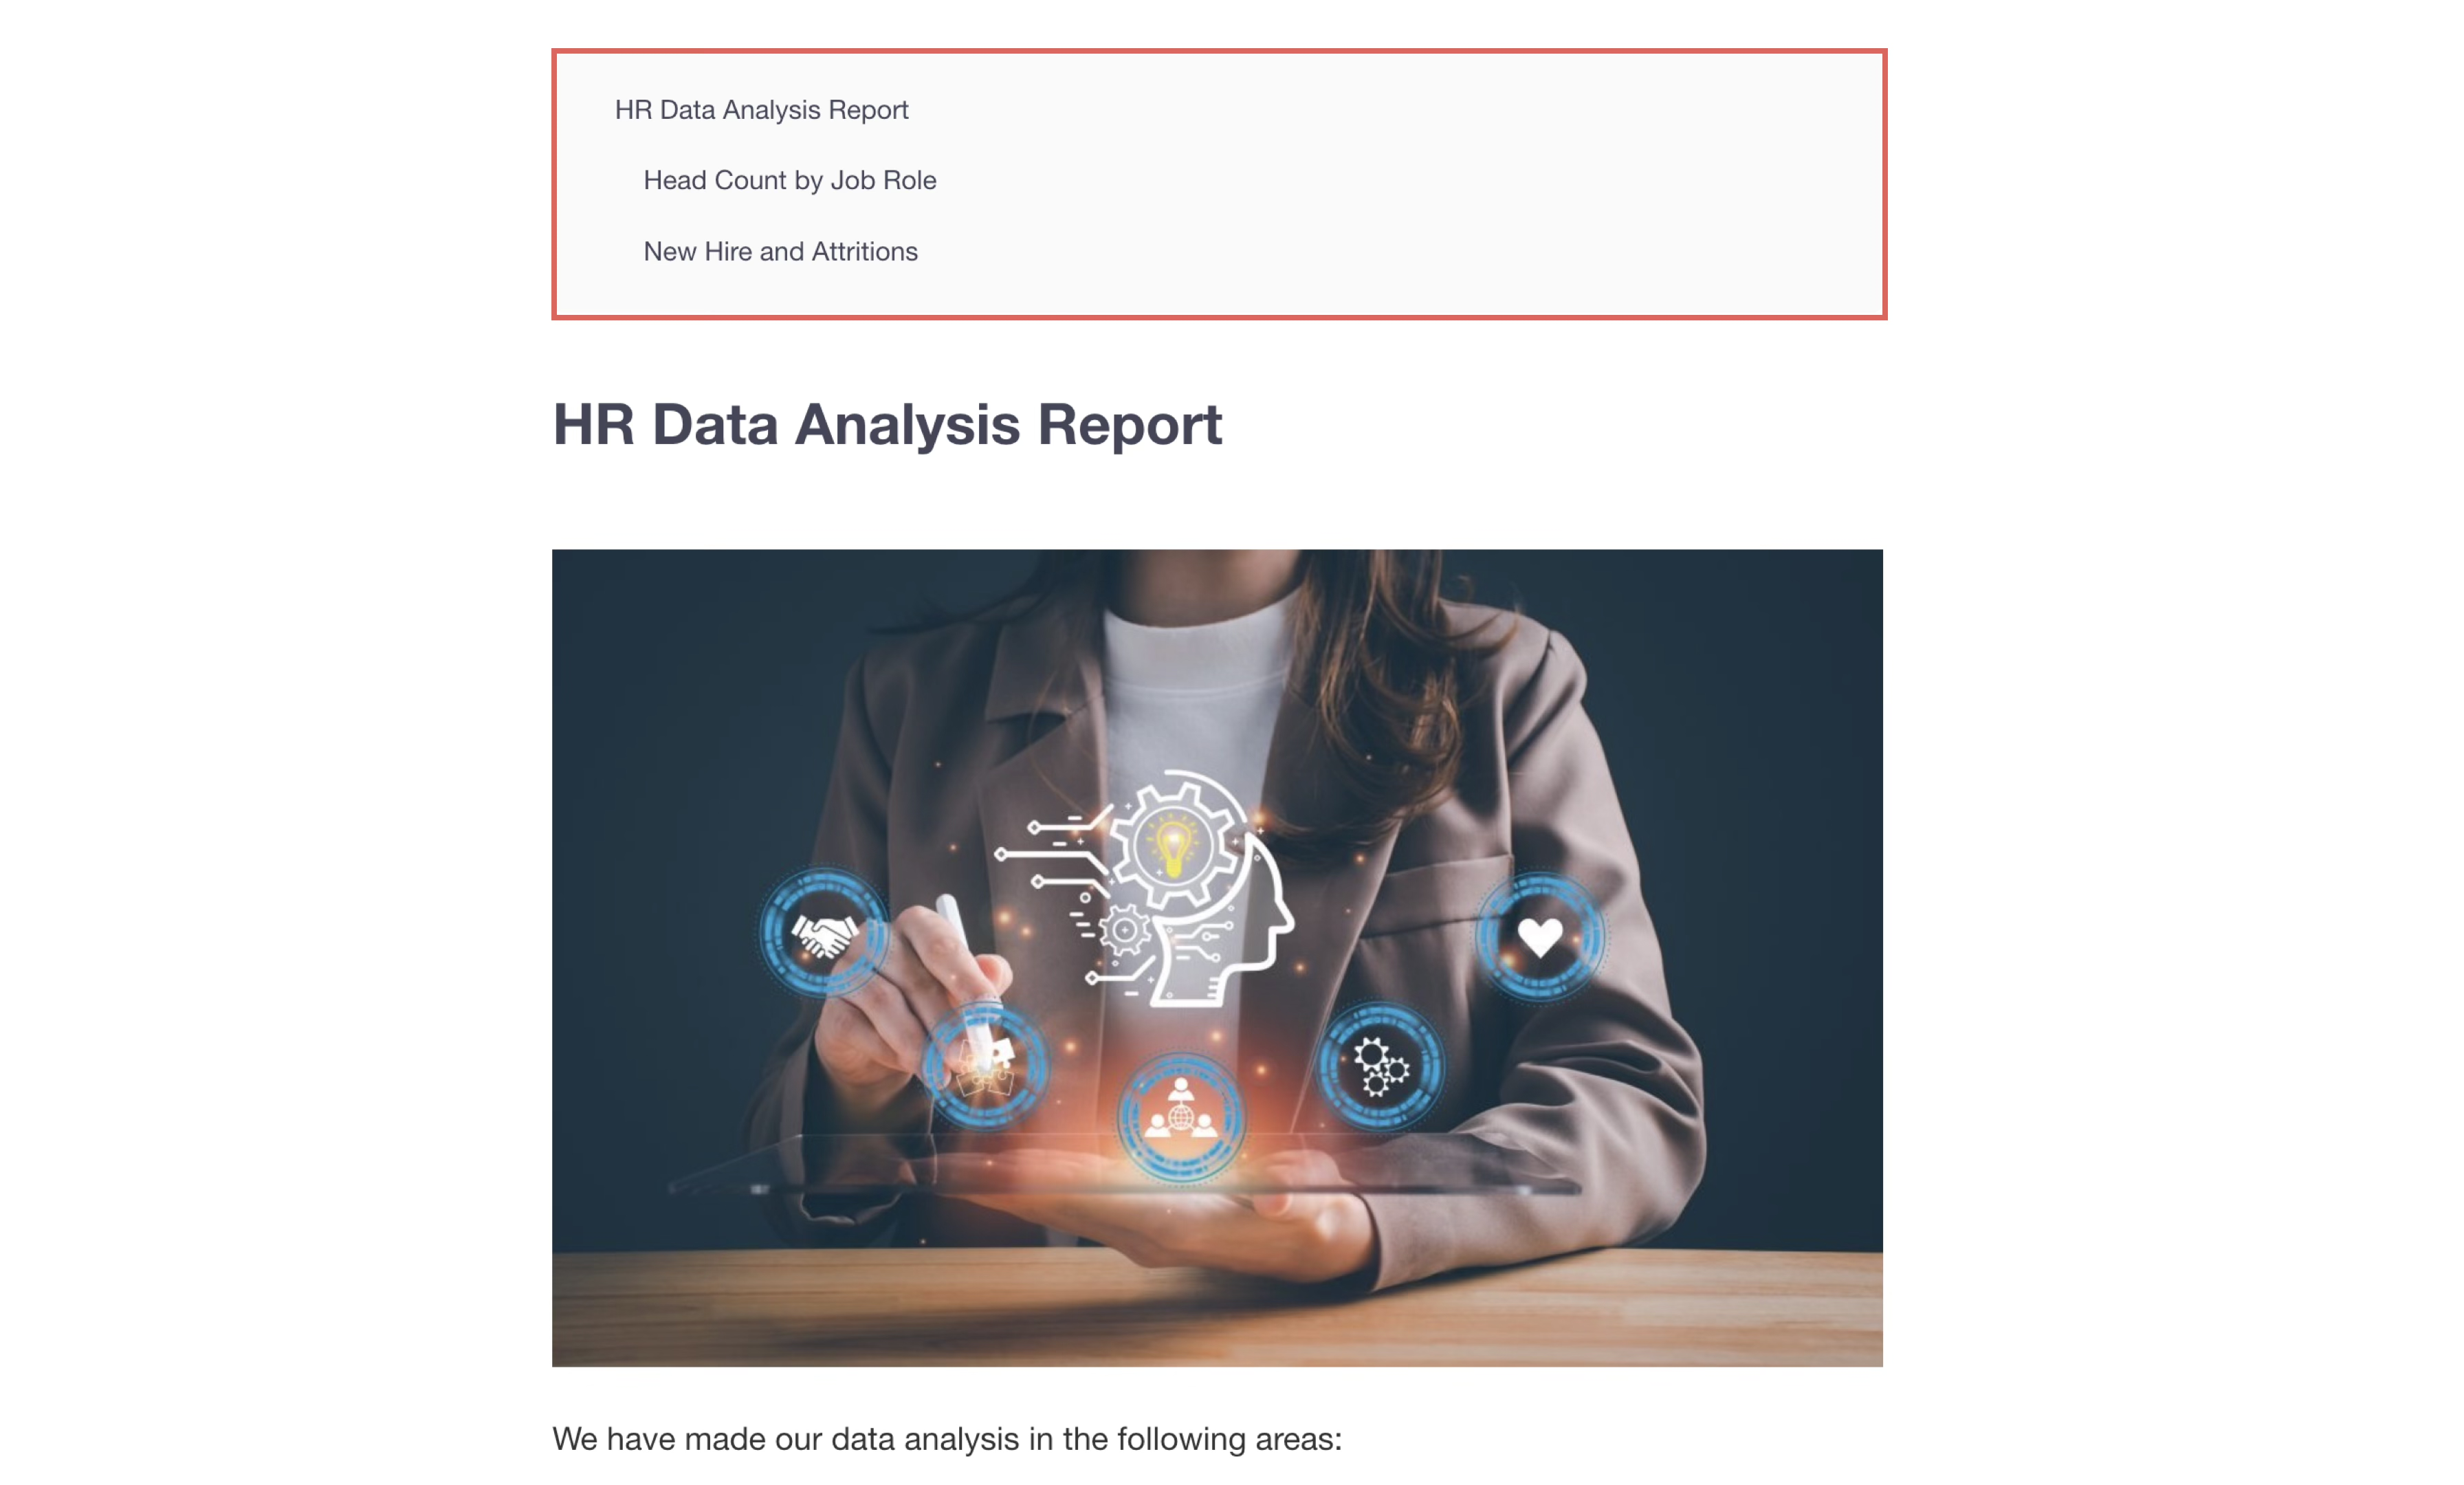
When you preview a note or publish it to the server, a table of contents is displayed on the left side of the note according to the headings you set.
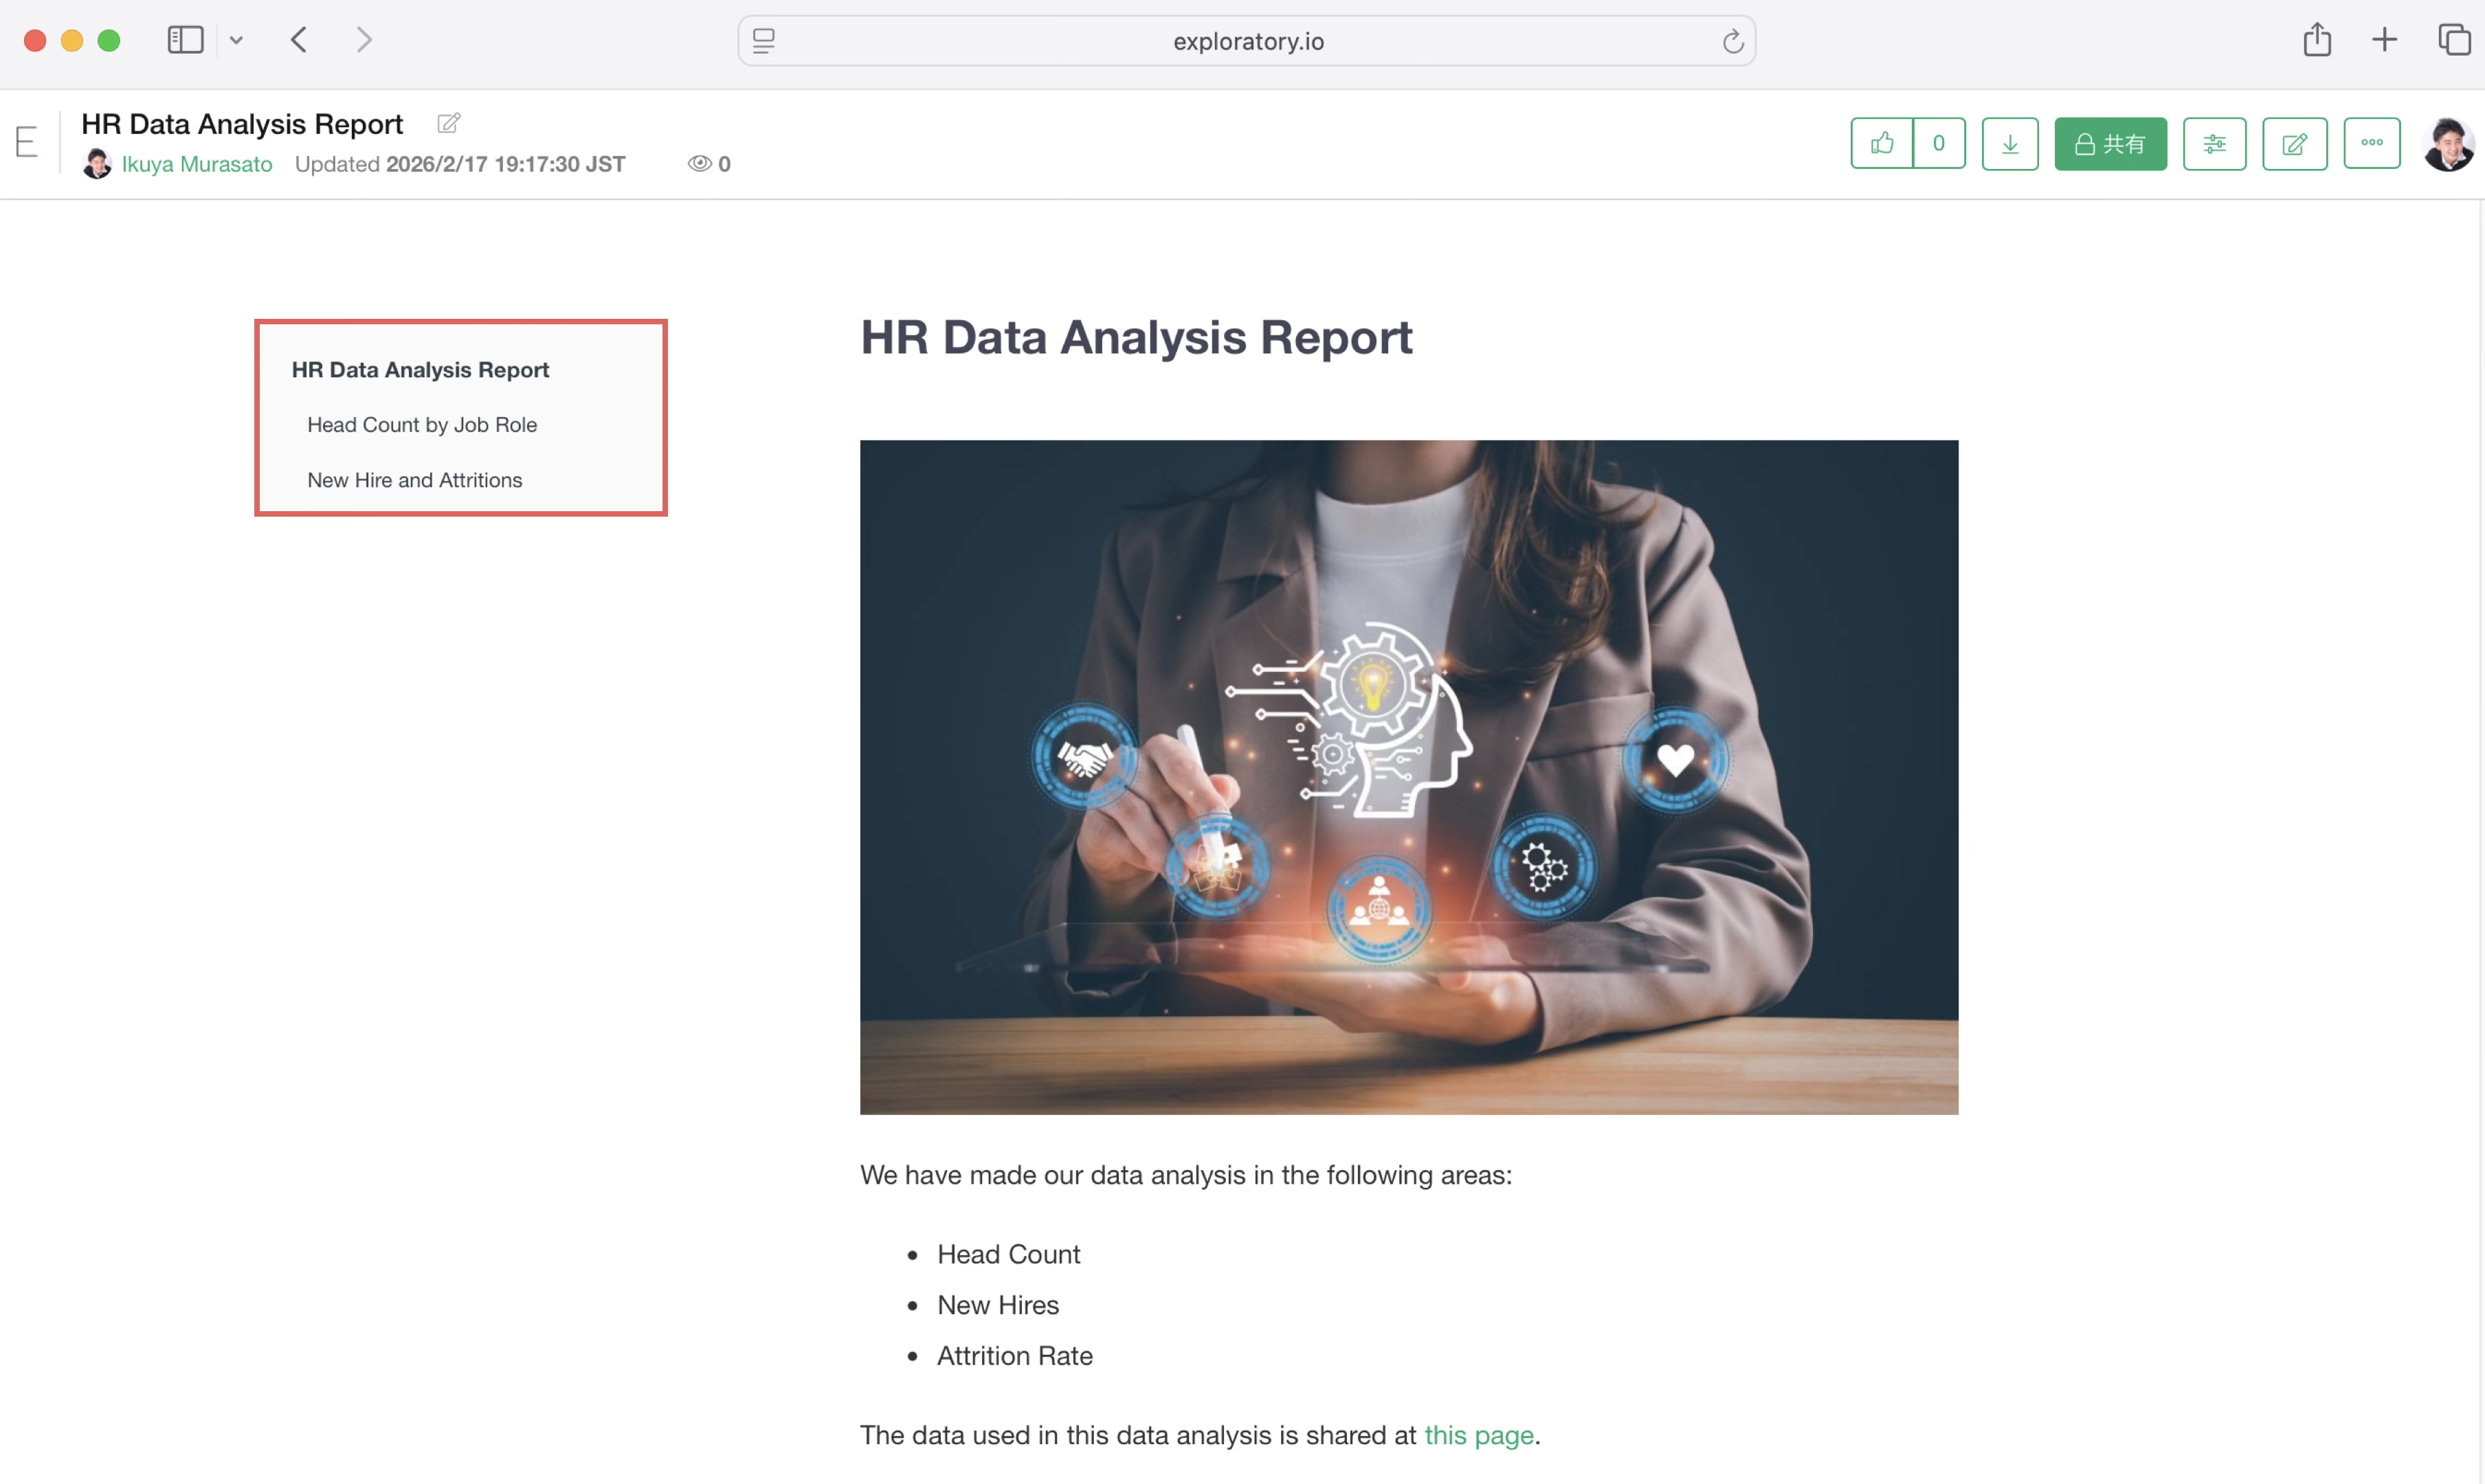
Also, the heading name is highlighted according to the heading you are currently viewing (the position of the scroll bar).
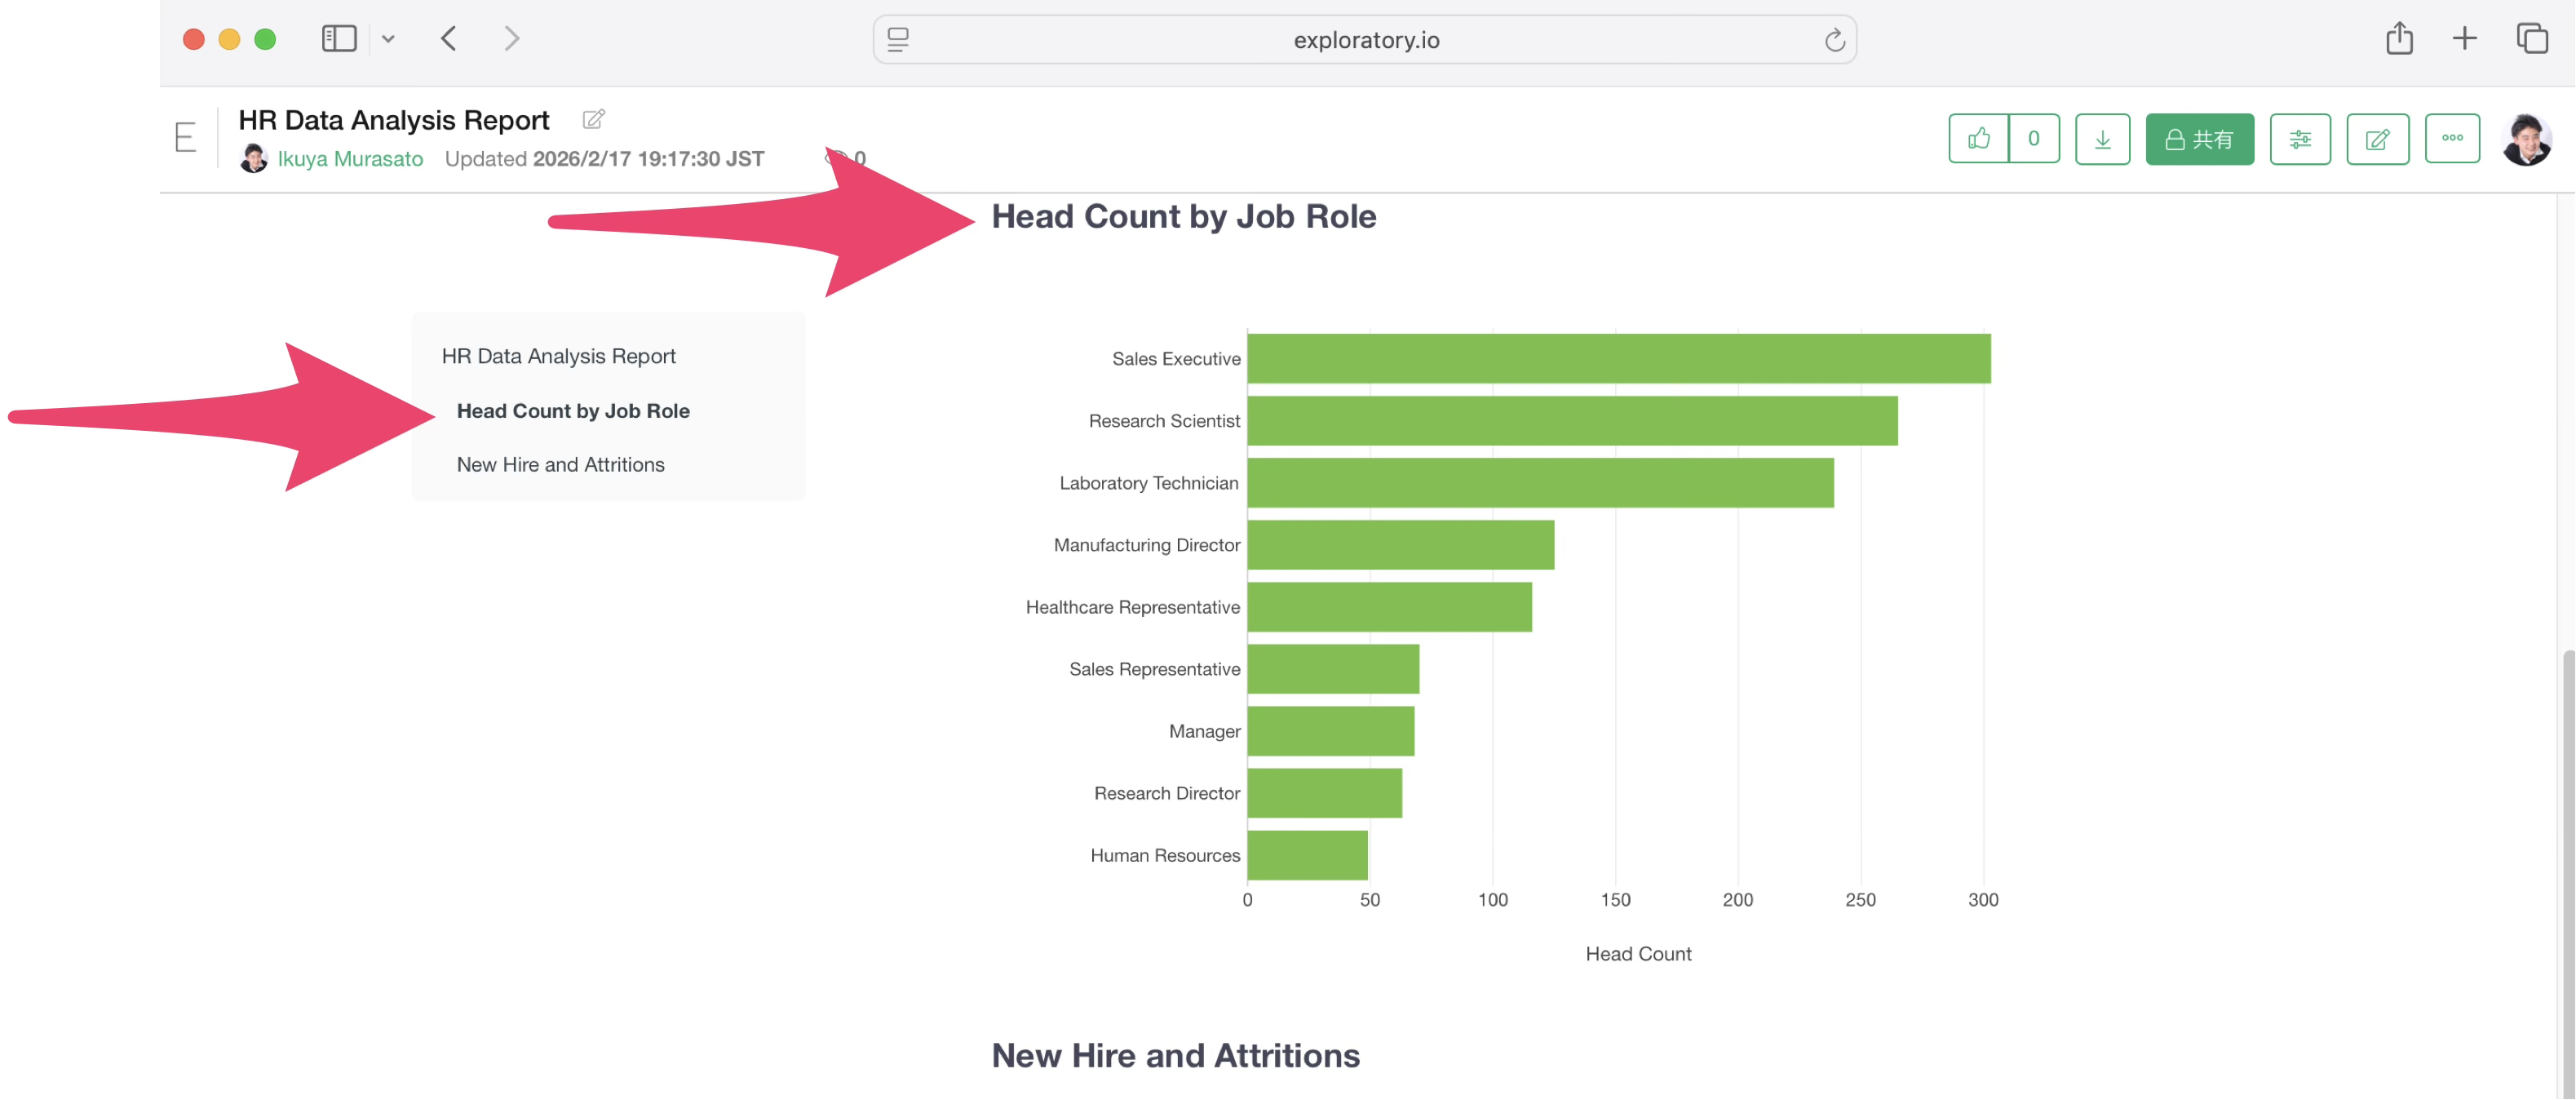
For example, in the image above, since the user is viewing the section for the heading “Head Count by Job Role,” that heading is highlighted in the table of contents.
Furthermore, clicking on the text of a heading will jump to the corresponding section.
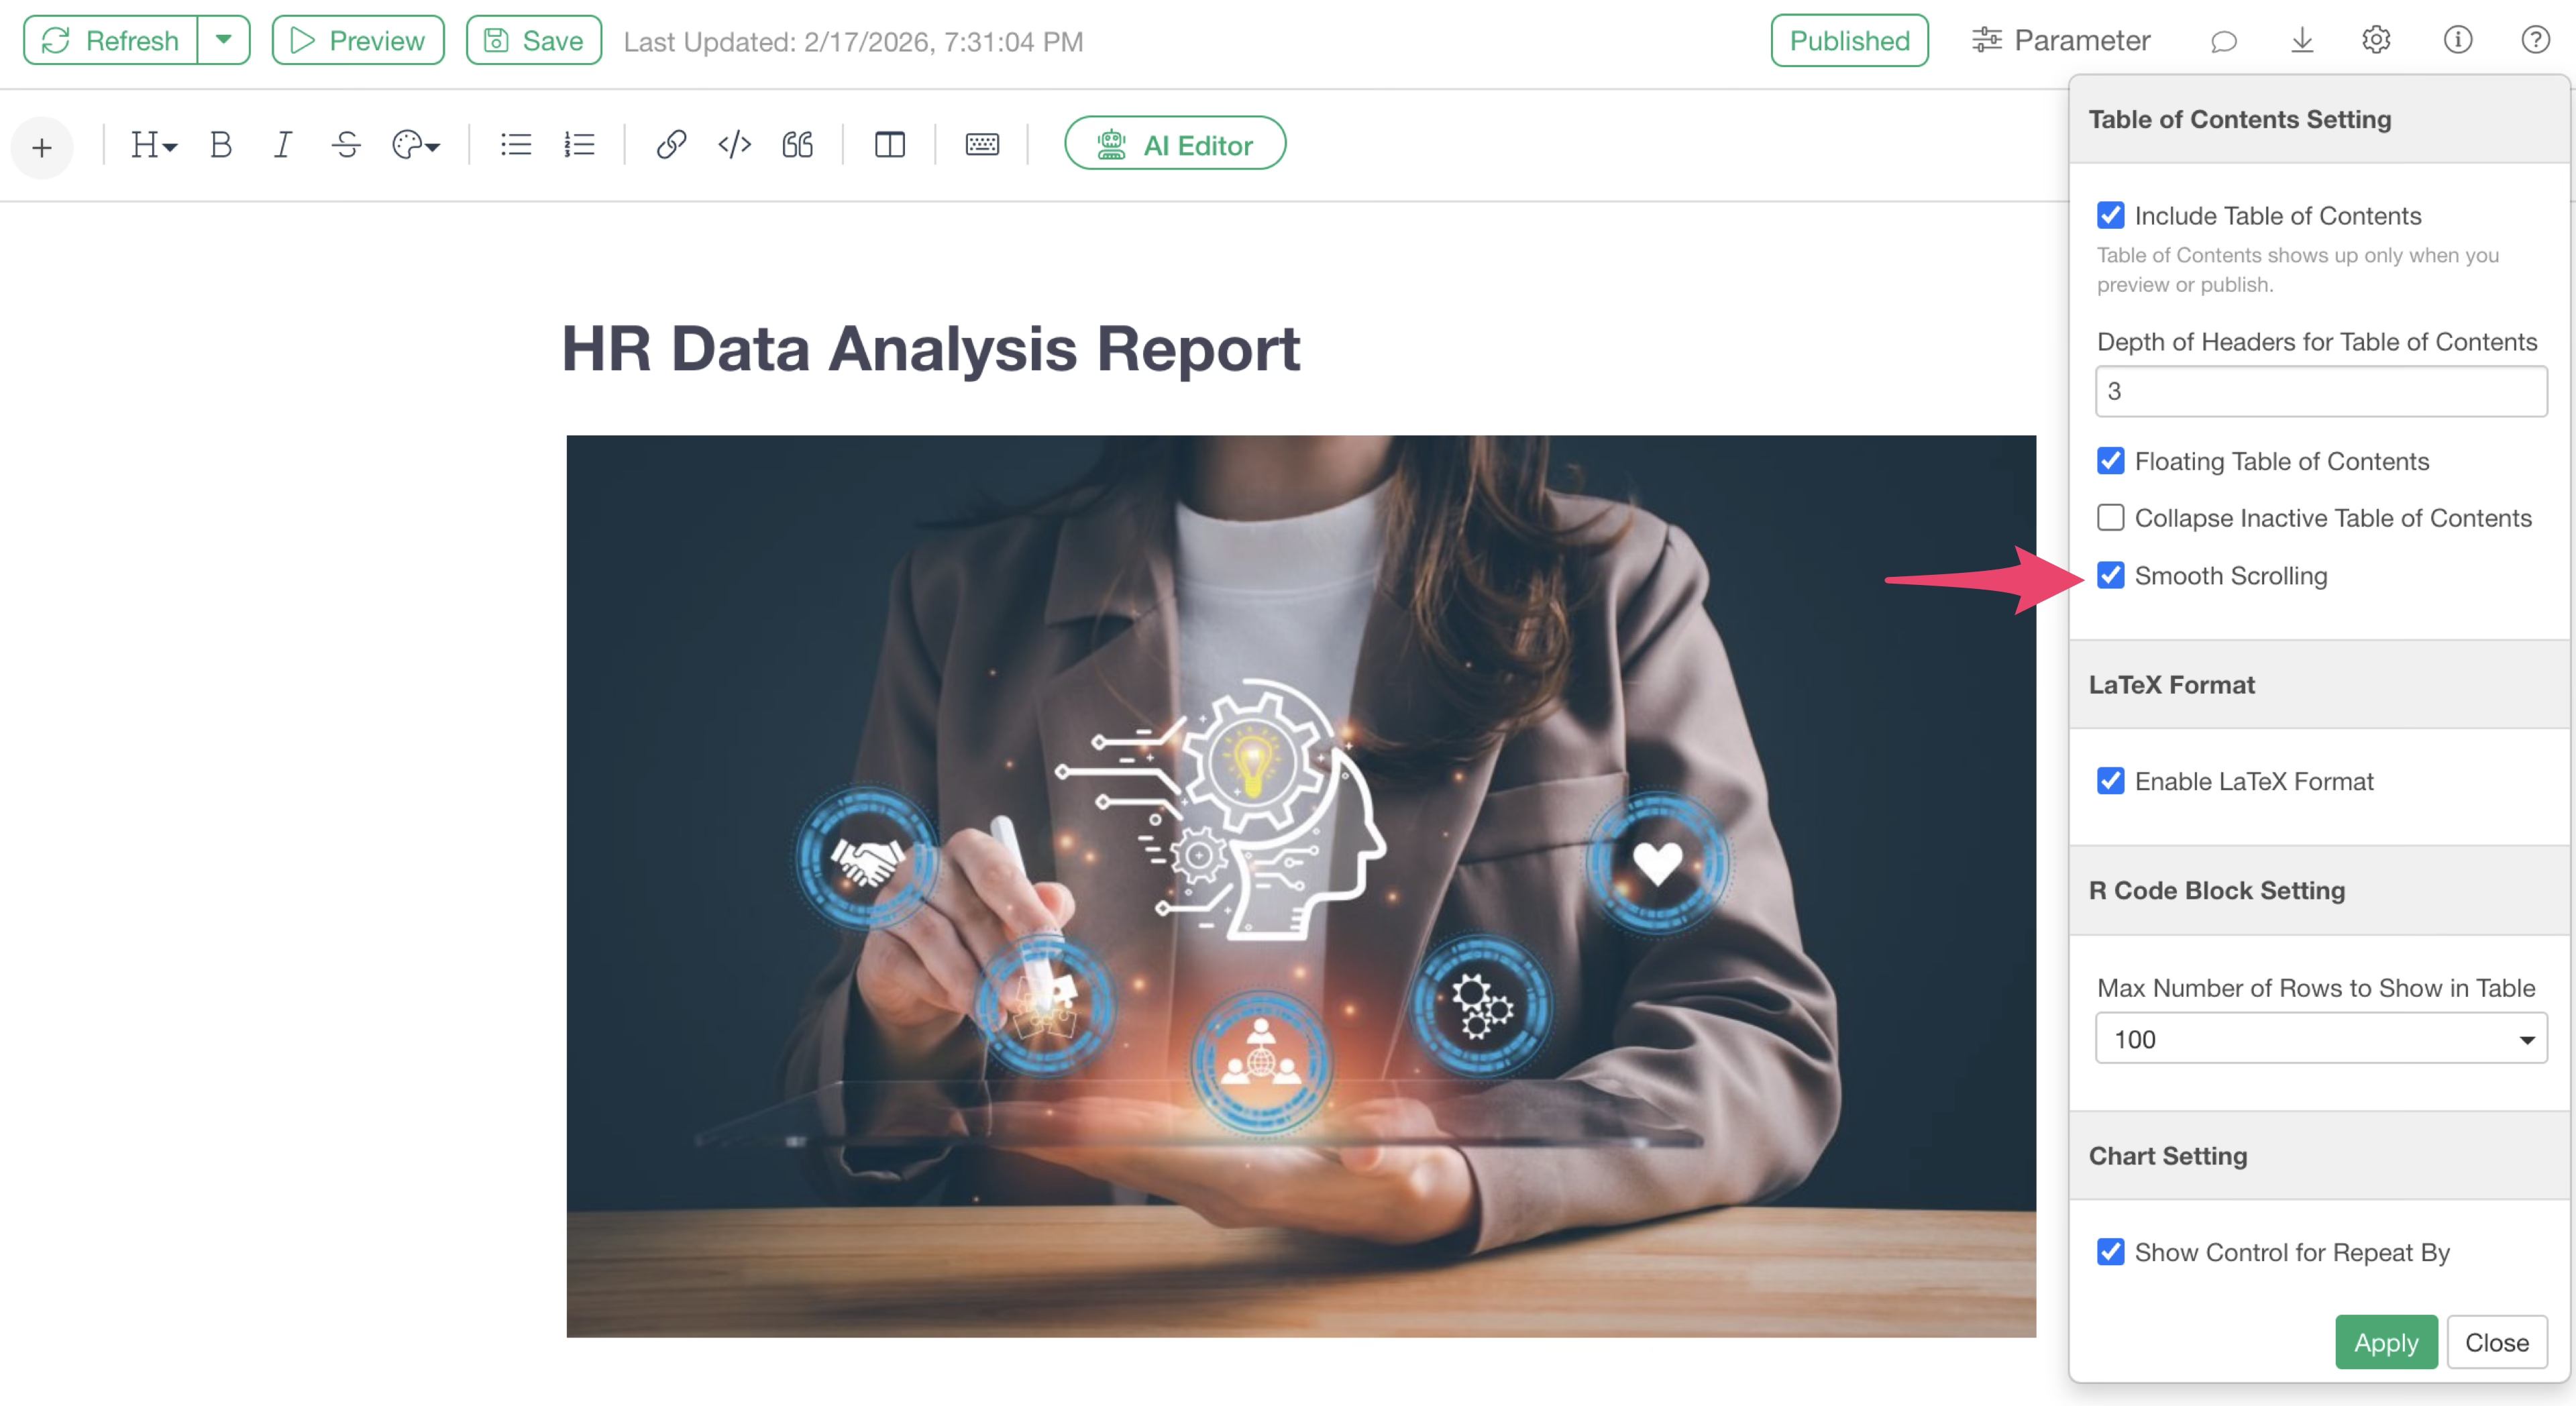
You can change the settings for this table of contents from the note editor menu.
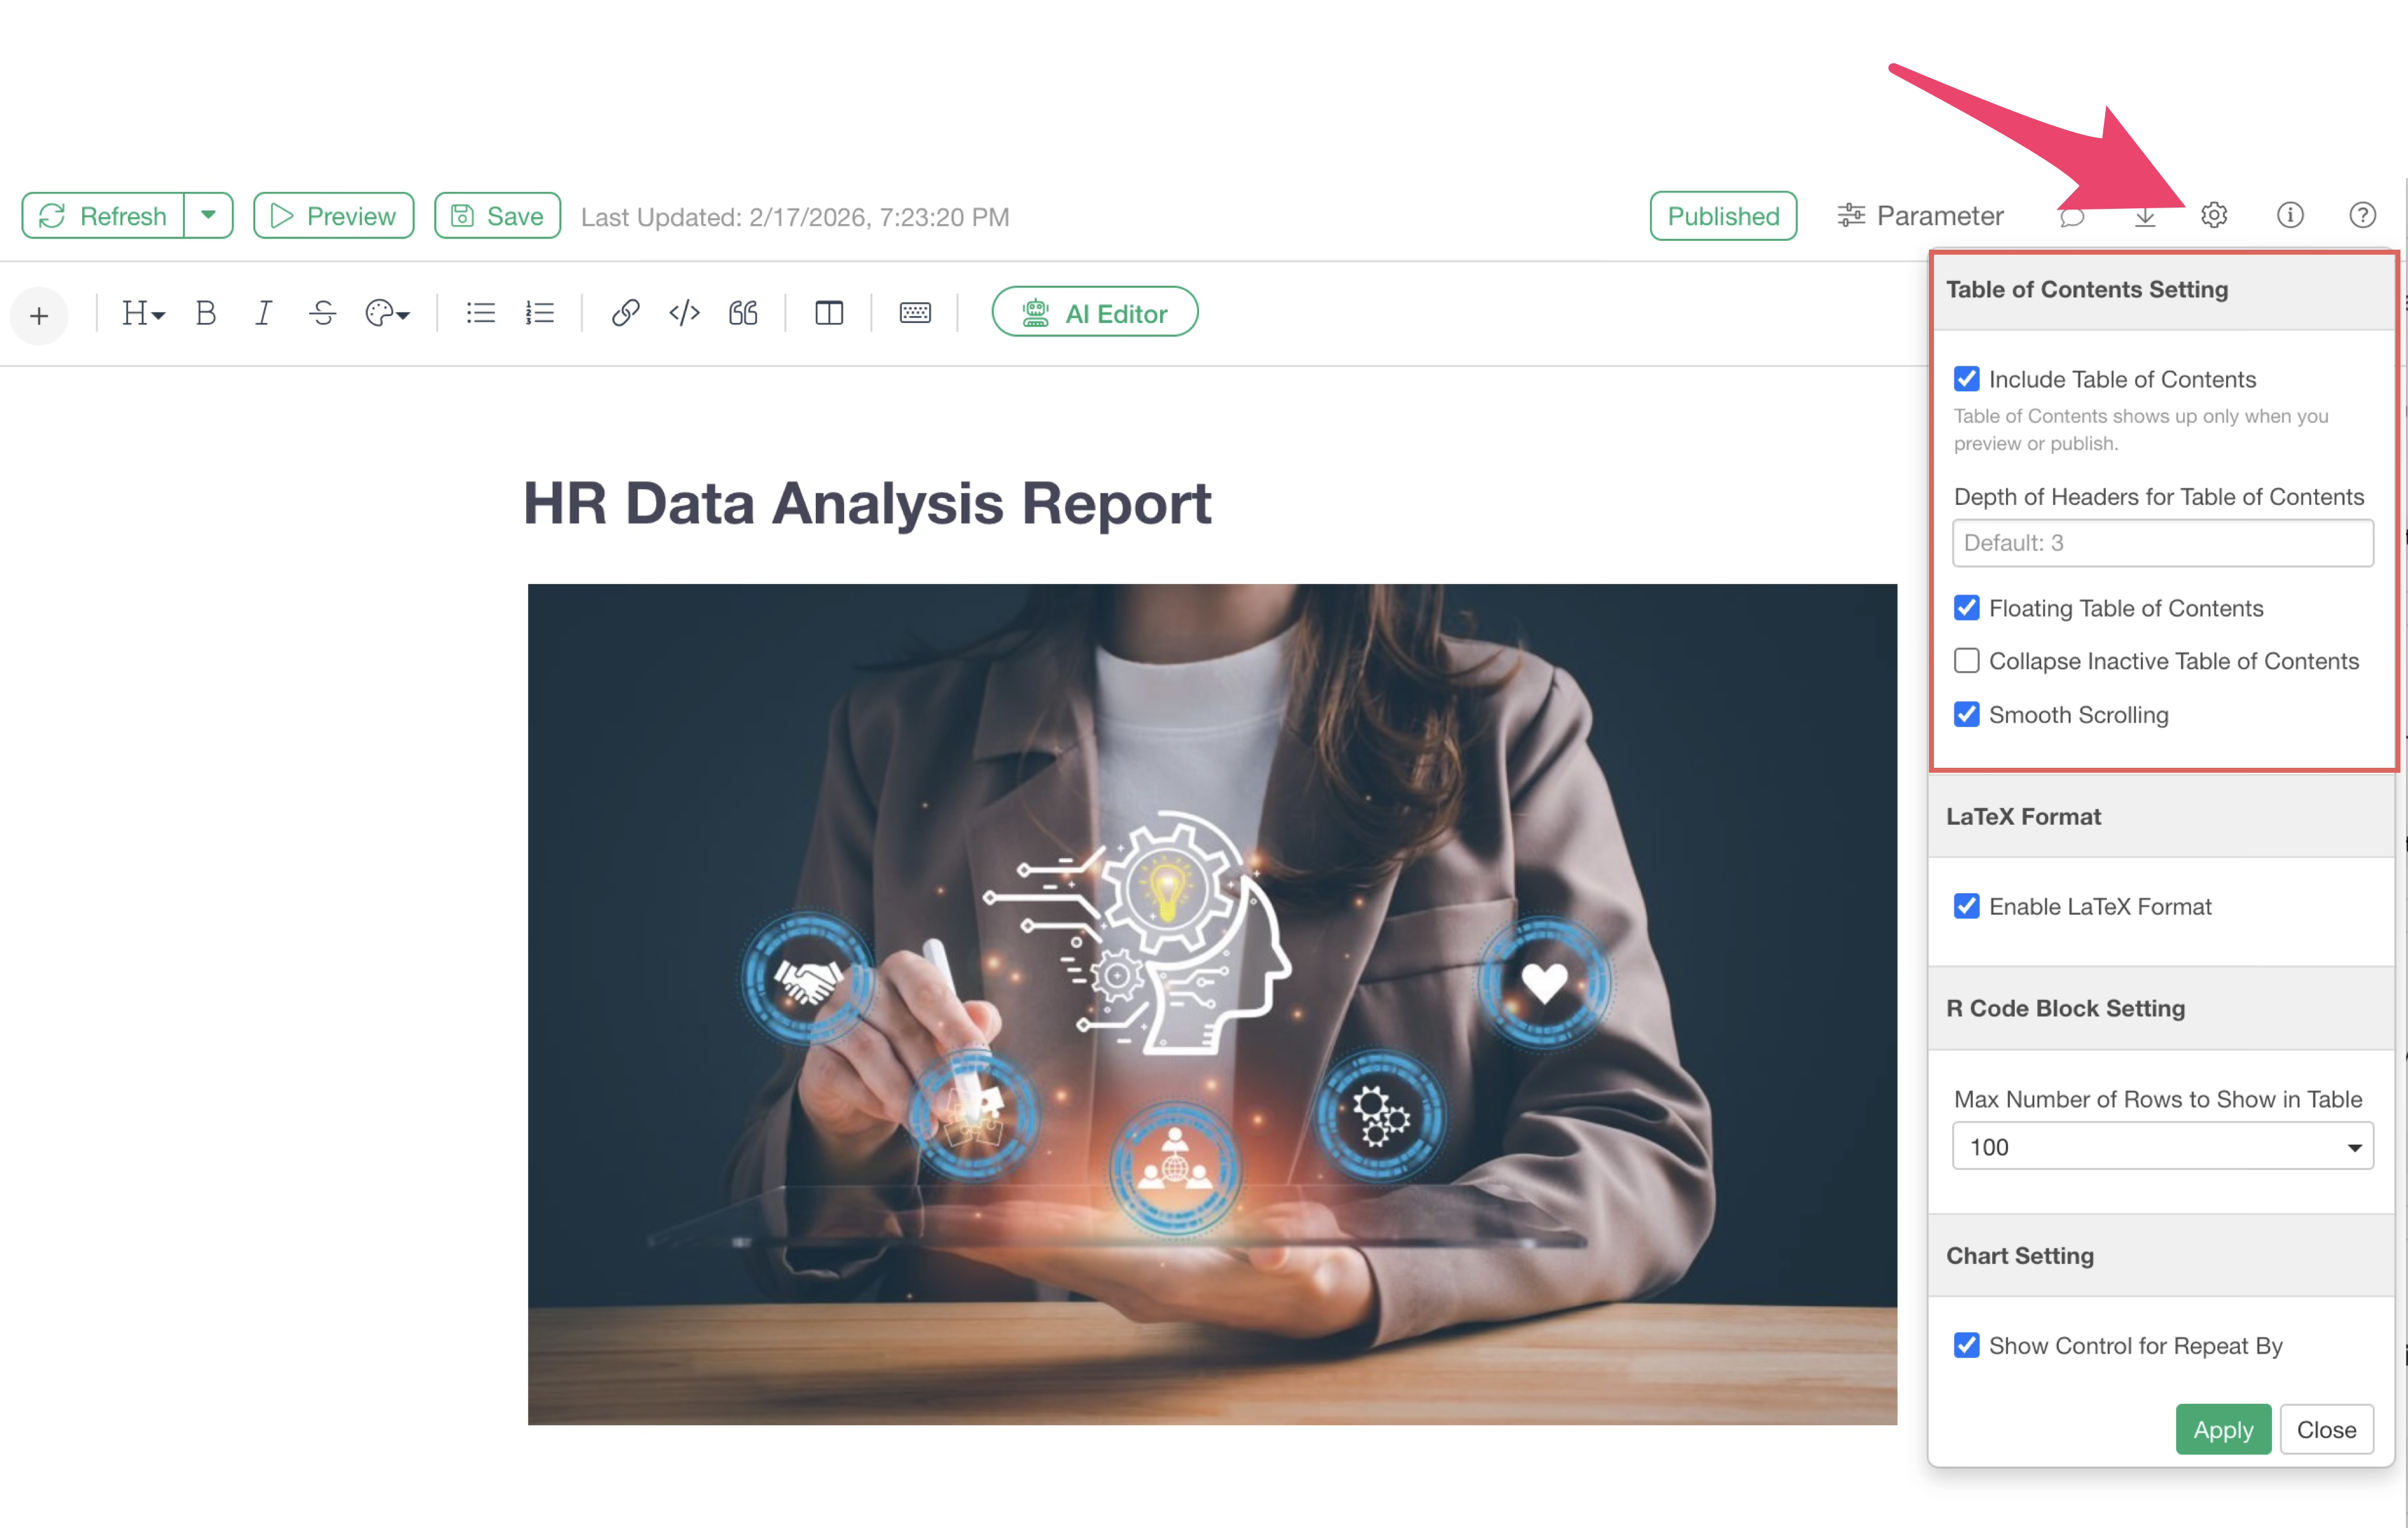
Below is a brief introduction to each menu item.
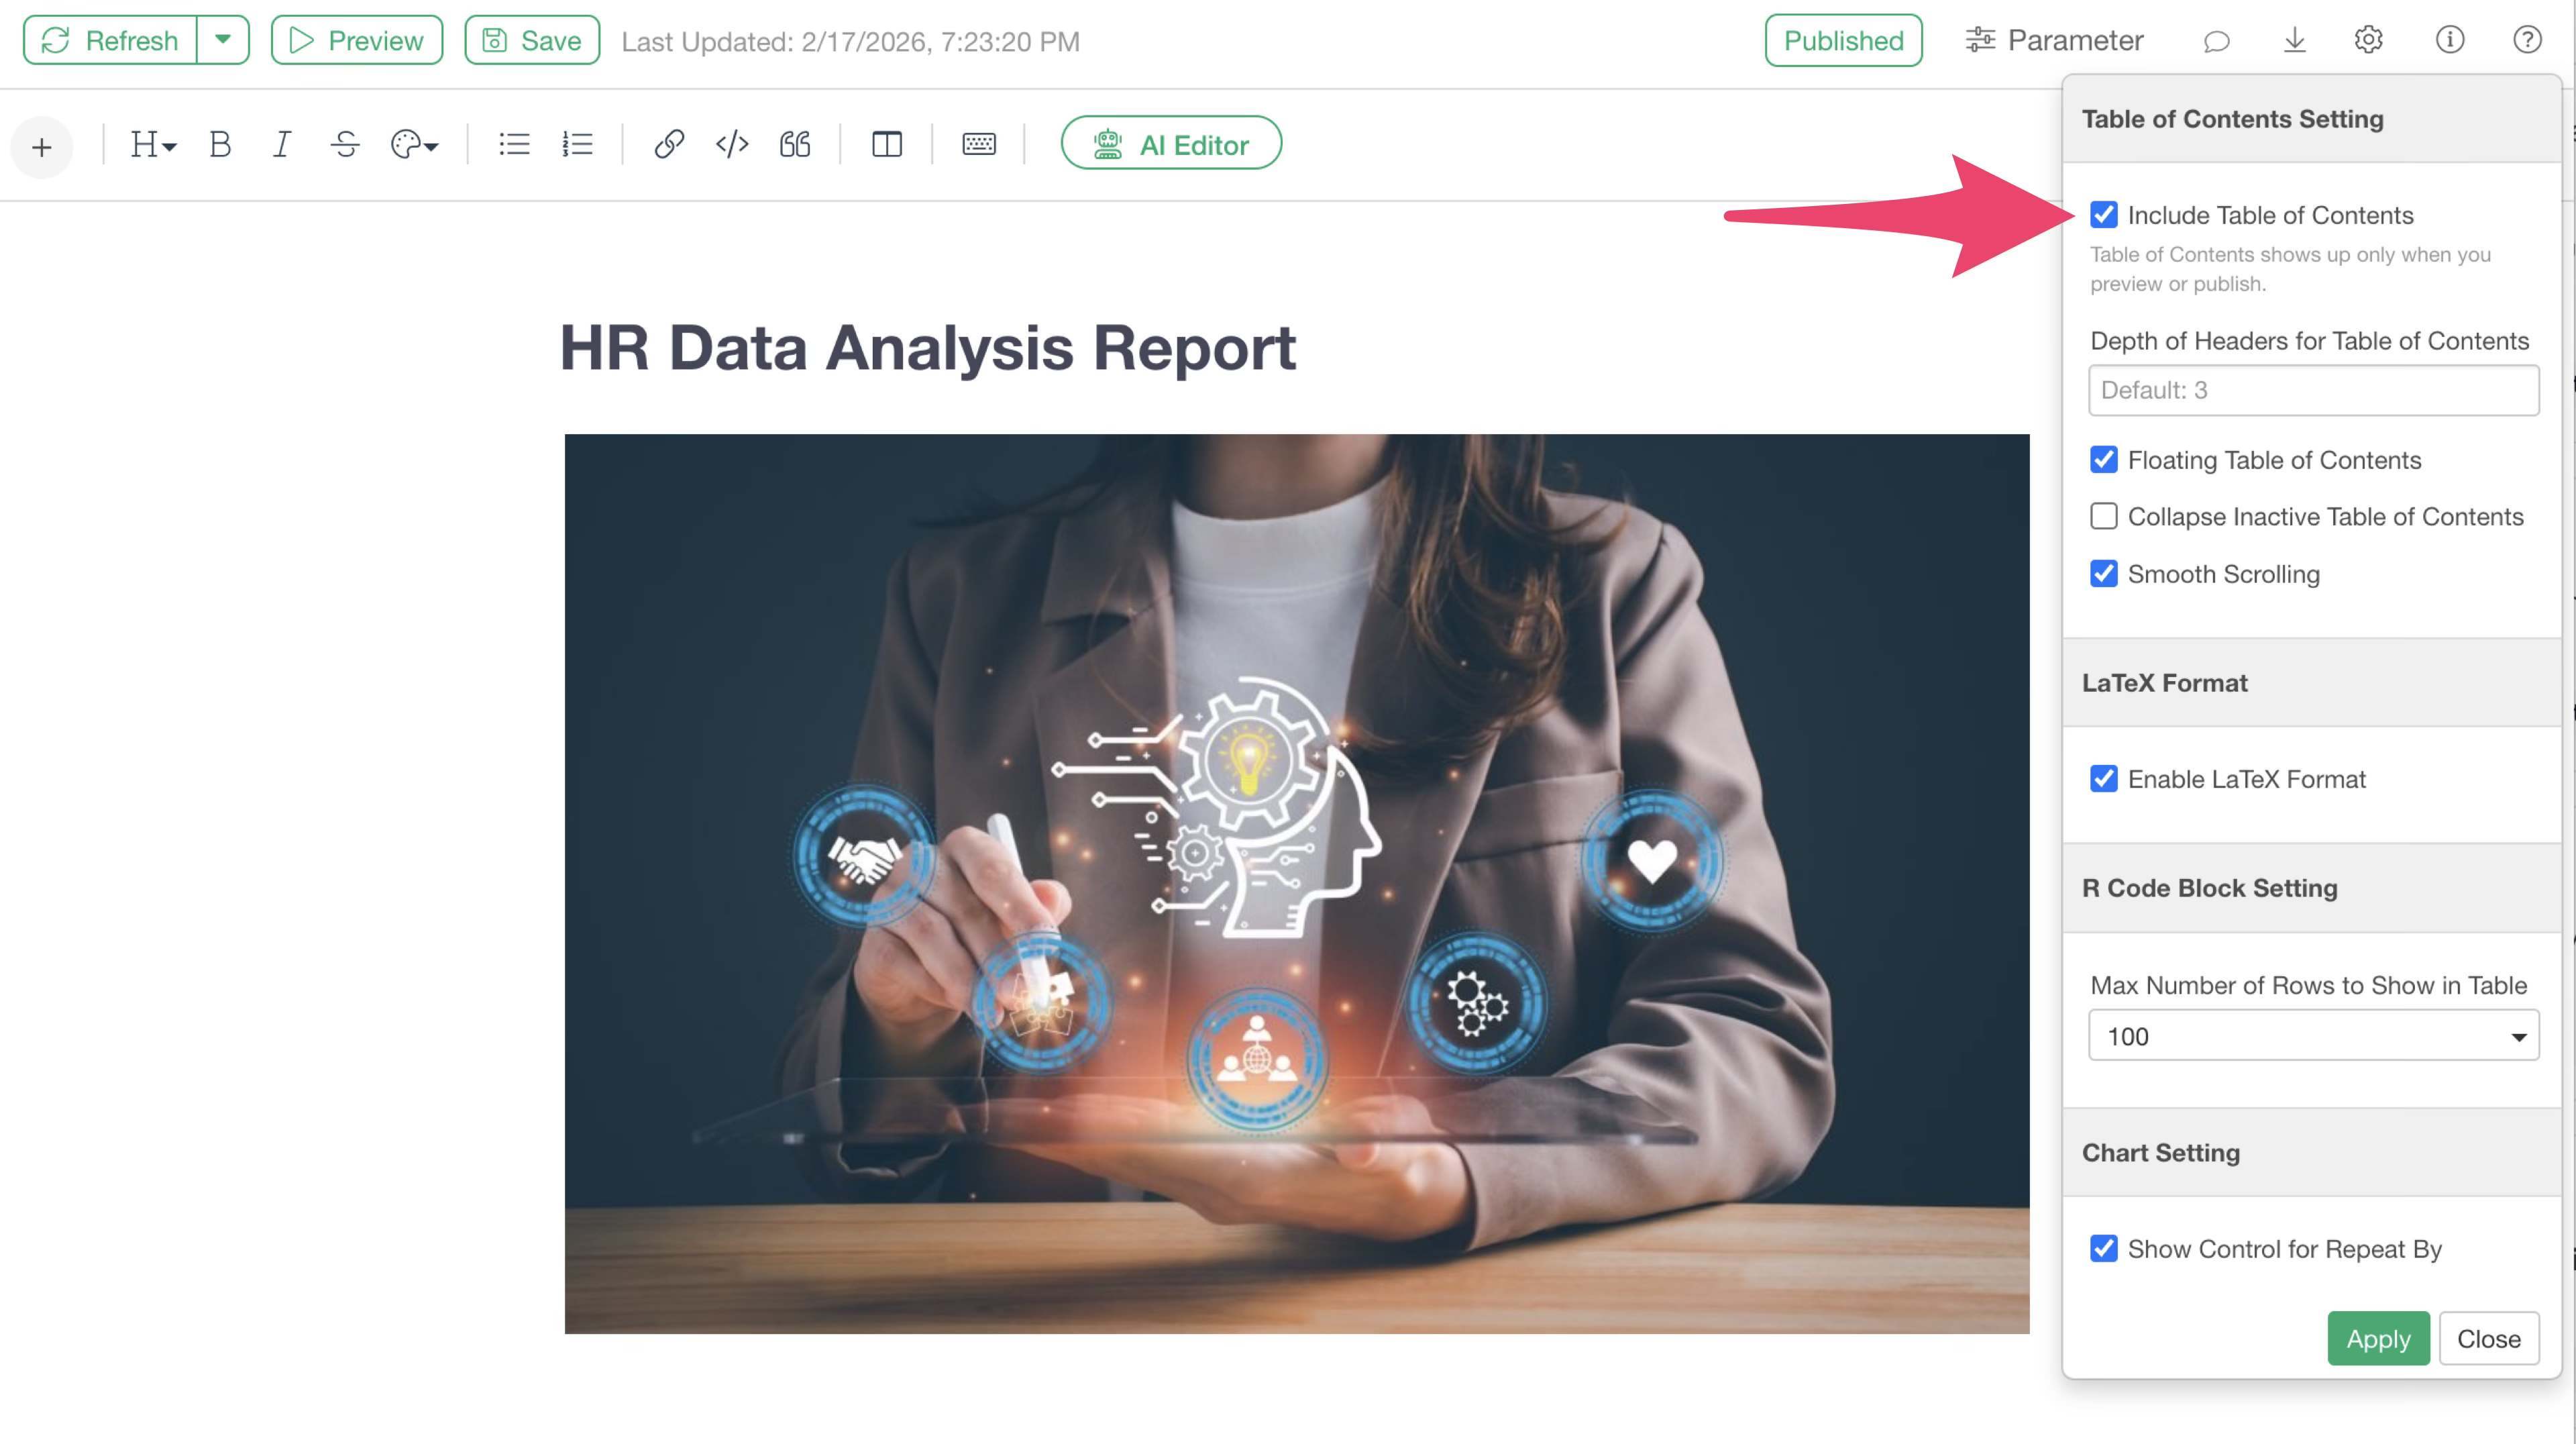
Include Table of Contents
You can specify whether to display the table of contents on the preview screen or in published notes. This is enabled by default.
Depth of Headers for Table of Contents
Specifies the depth of the table of contents to be displayed. The default setting is “3.”
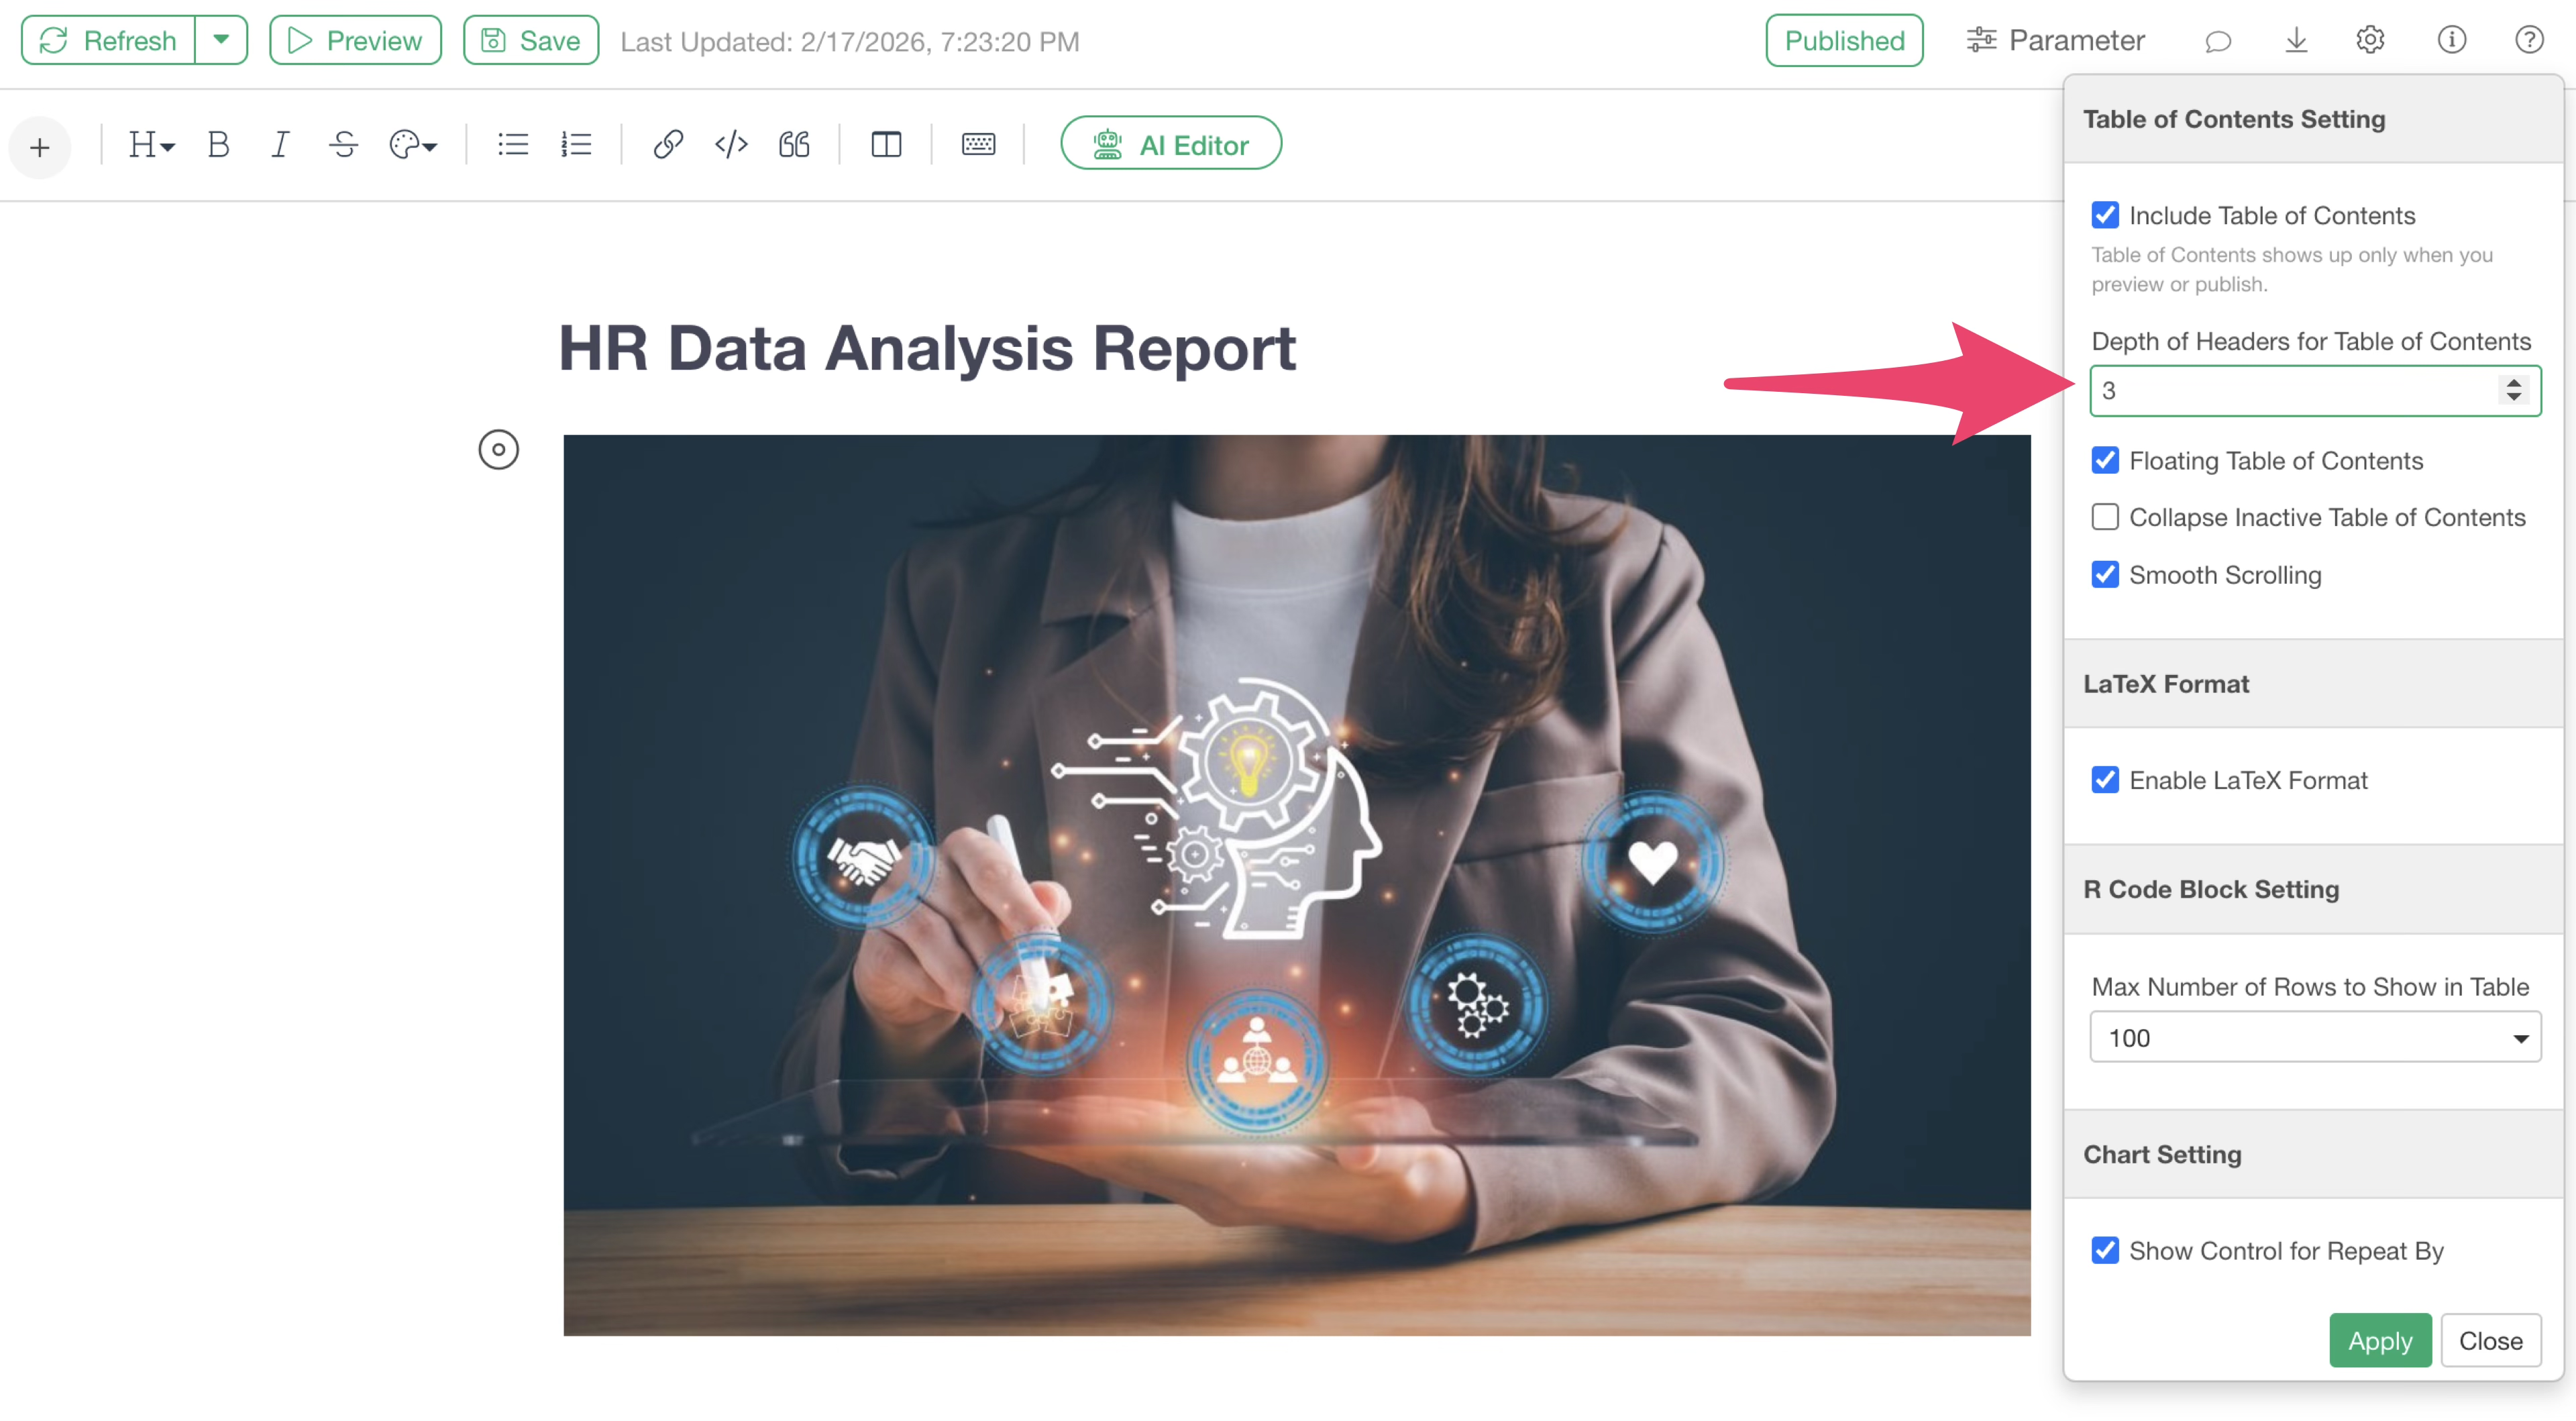
If set to “1,” only headings set as “Heading 1” will be displayed in the table of contents, and deeper levels like “Heading 2” and beyond will not be shown.
Floating Table of Contents
You can specify whether to always display the table of contents. This is enabled by default.

When this setting is enabled, you can always see the table of contents even when scrolling through the note. Conversely, if this setting is disabled, the table of contents will only be displayed at the very top of the note.
Collapse Inactive Table of Contents
This option displays table of contents information deeper than “Heading 1” only when you are reading the corresponding heading. This is disabled by default.
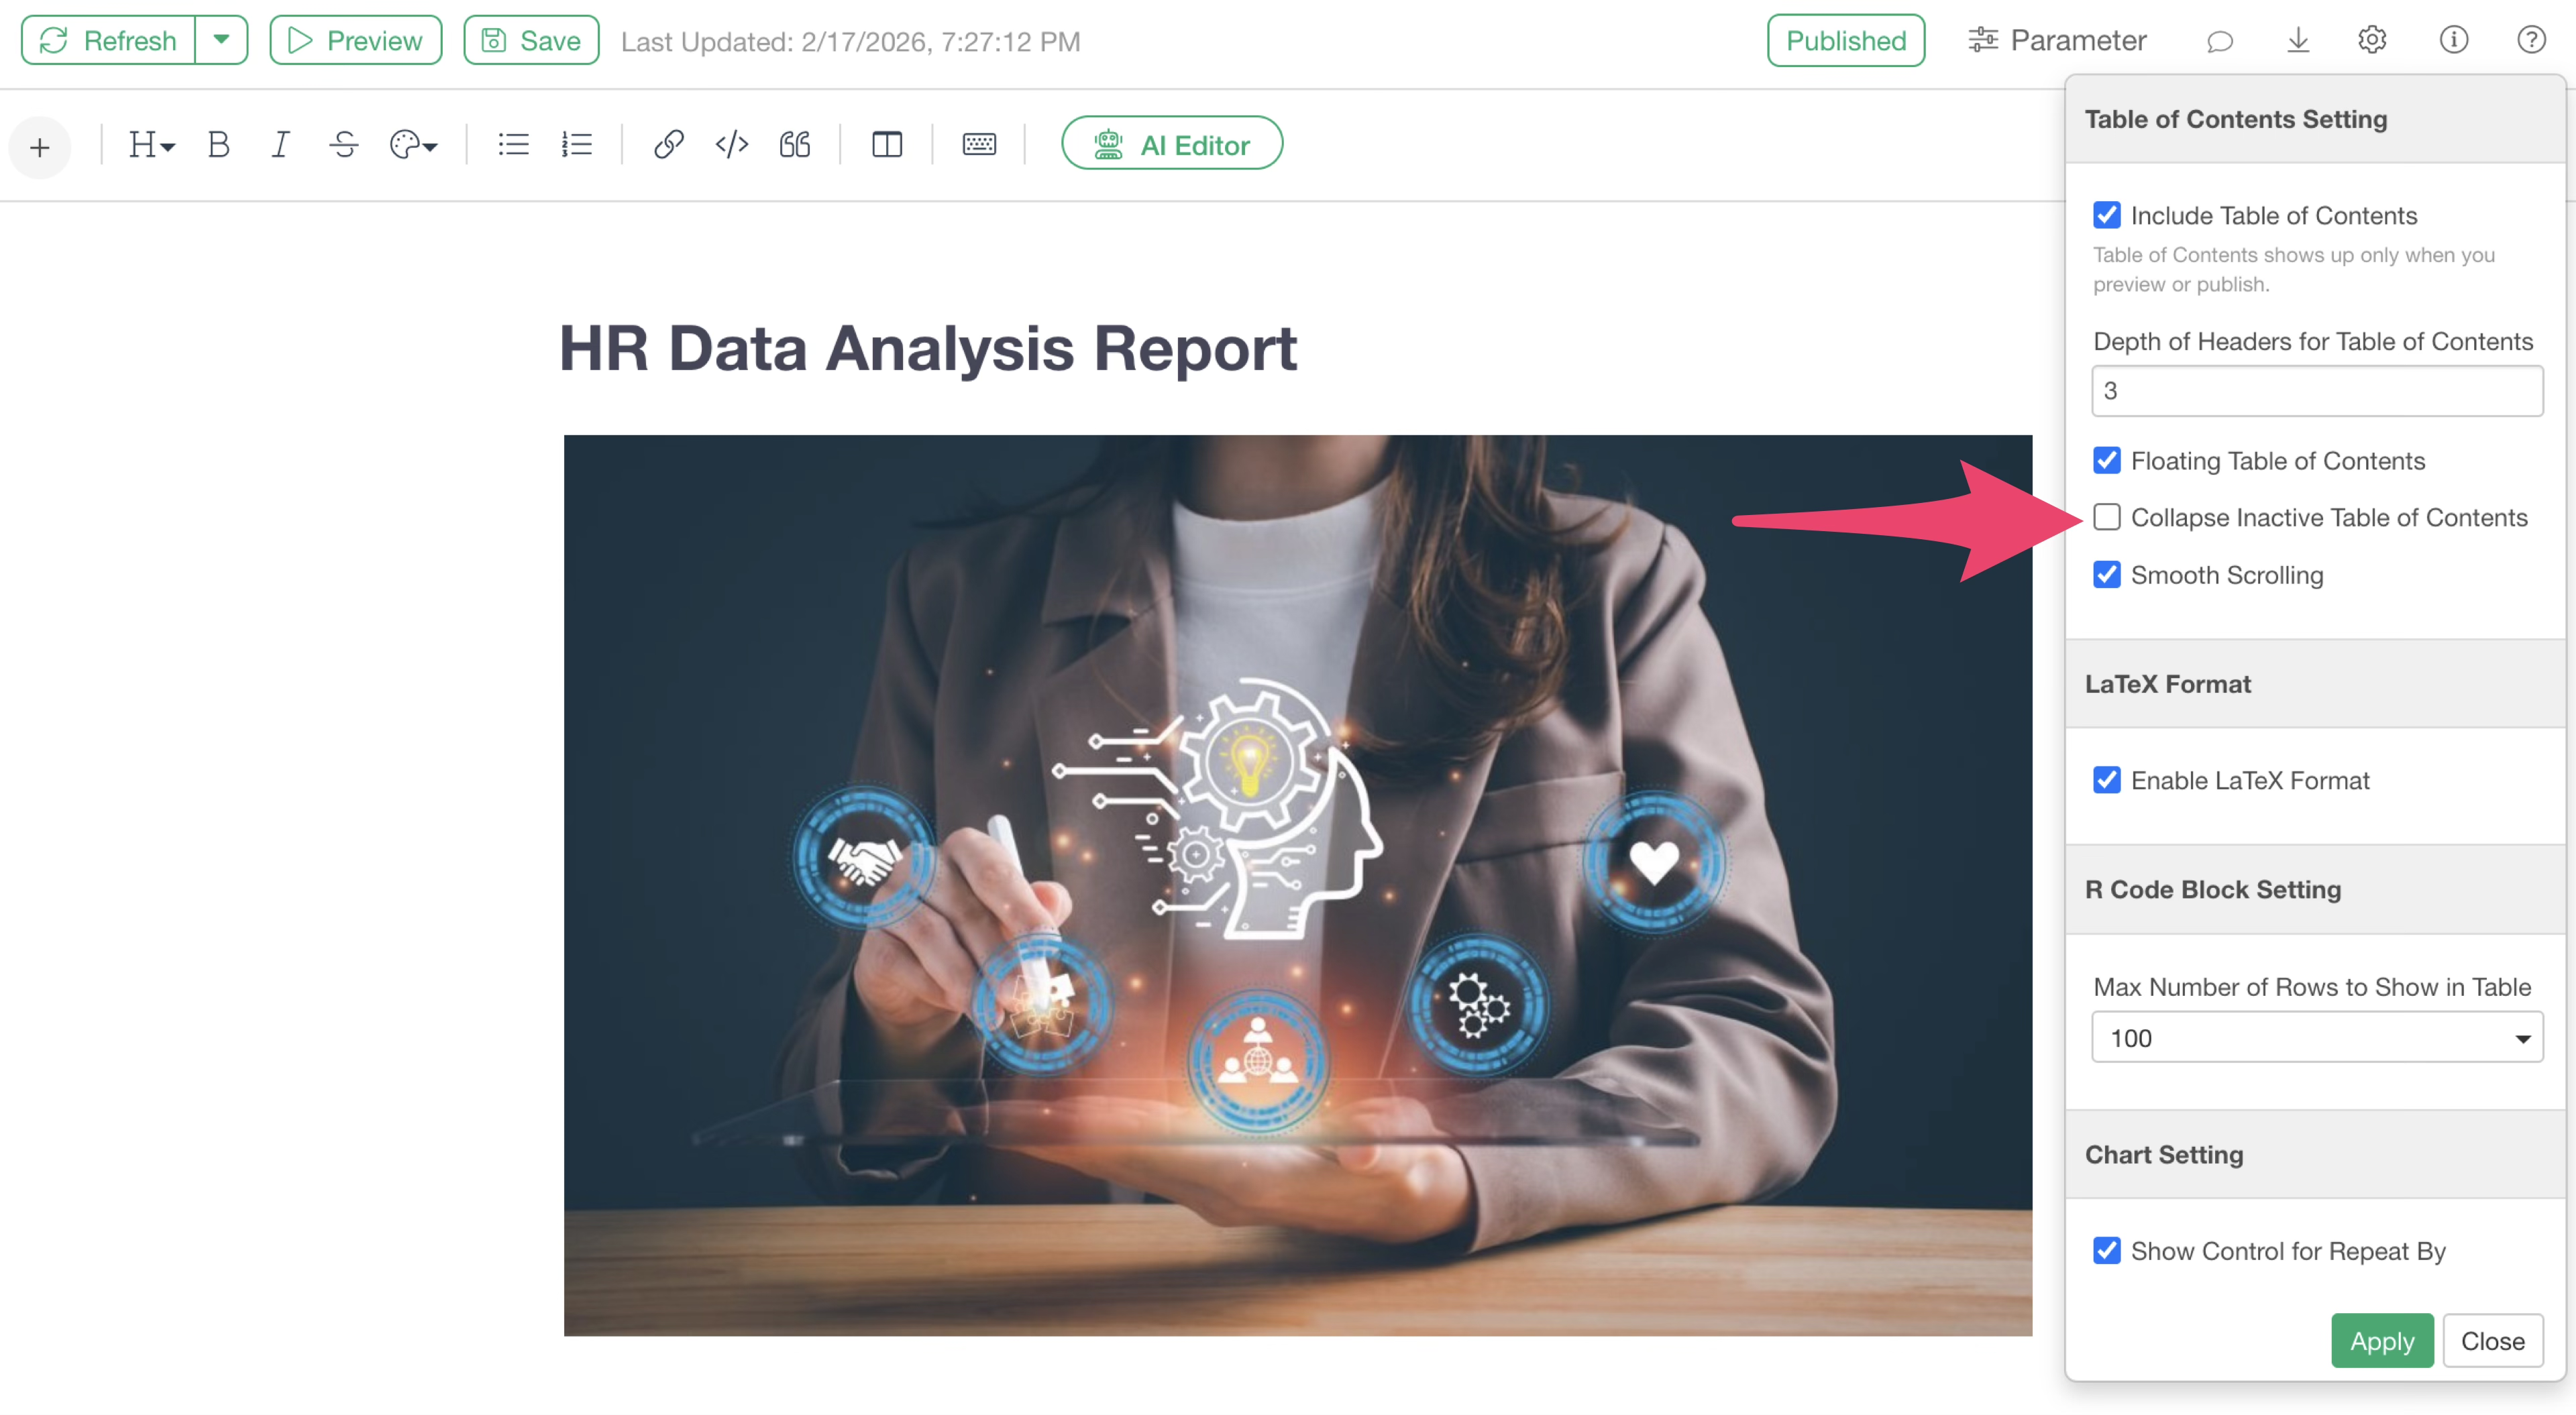
For example, in the table of contents below, it appears as if only “Heading 1” is set.
However, when you actually move to the “New Hires” section, the “Heading 2” information is displayed.
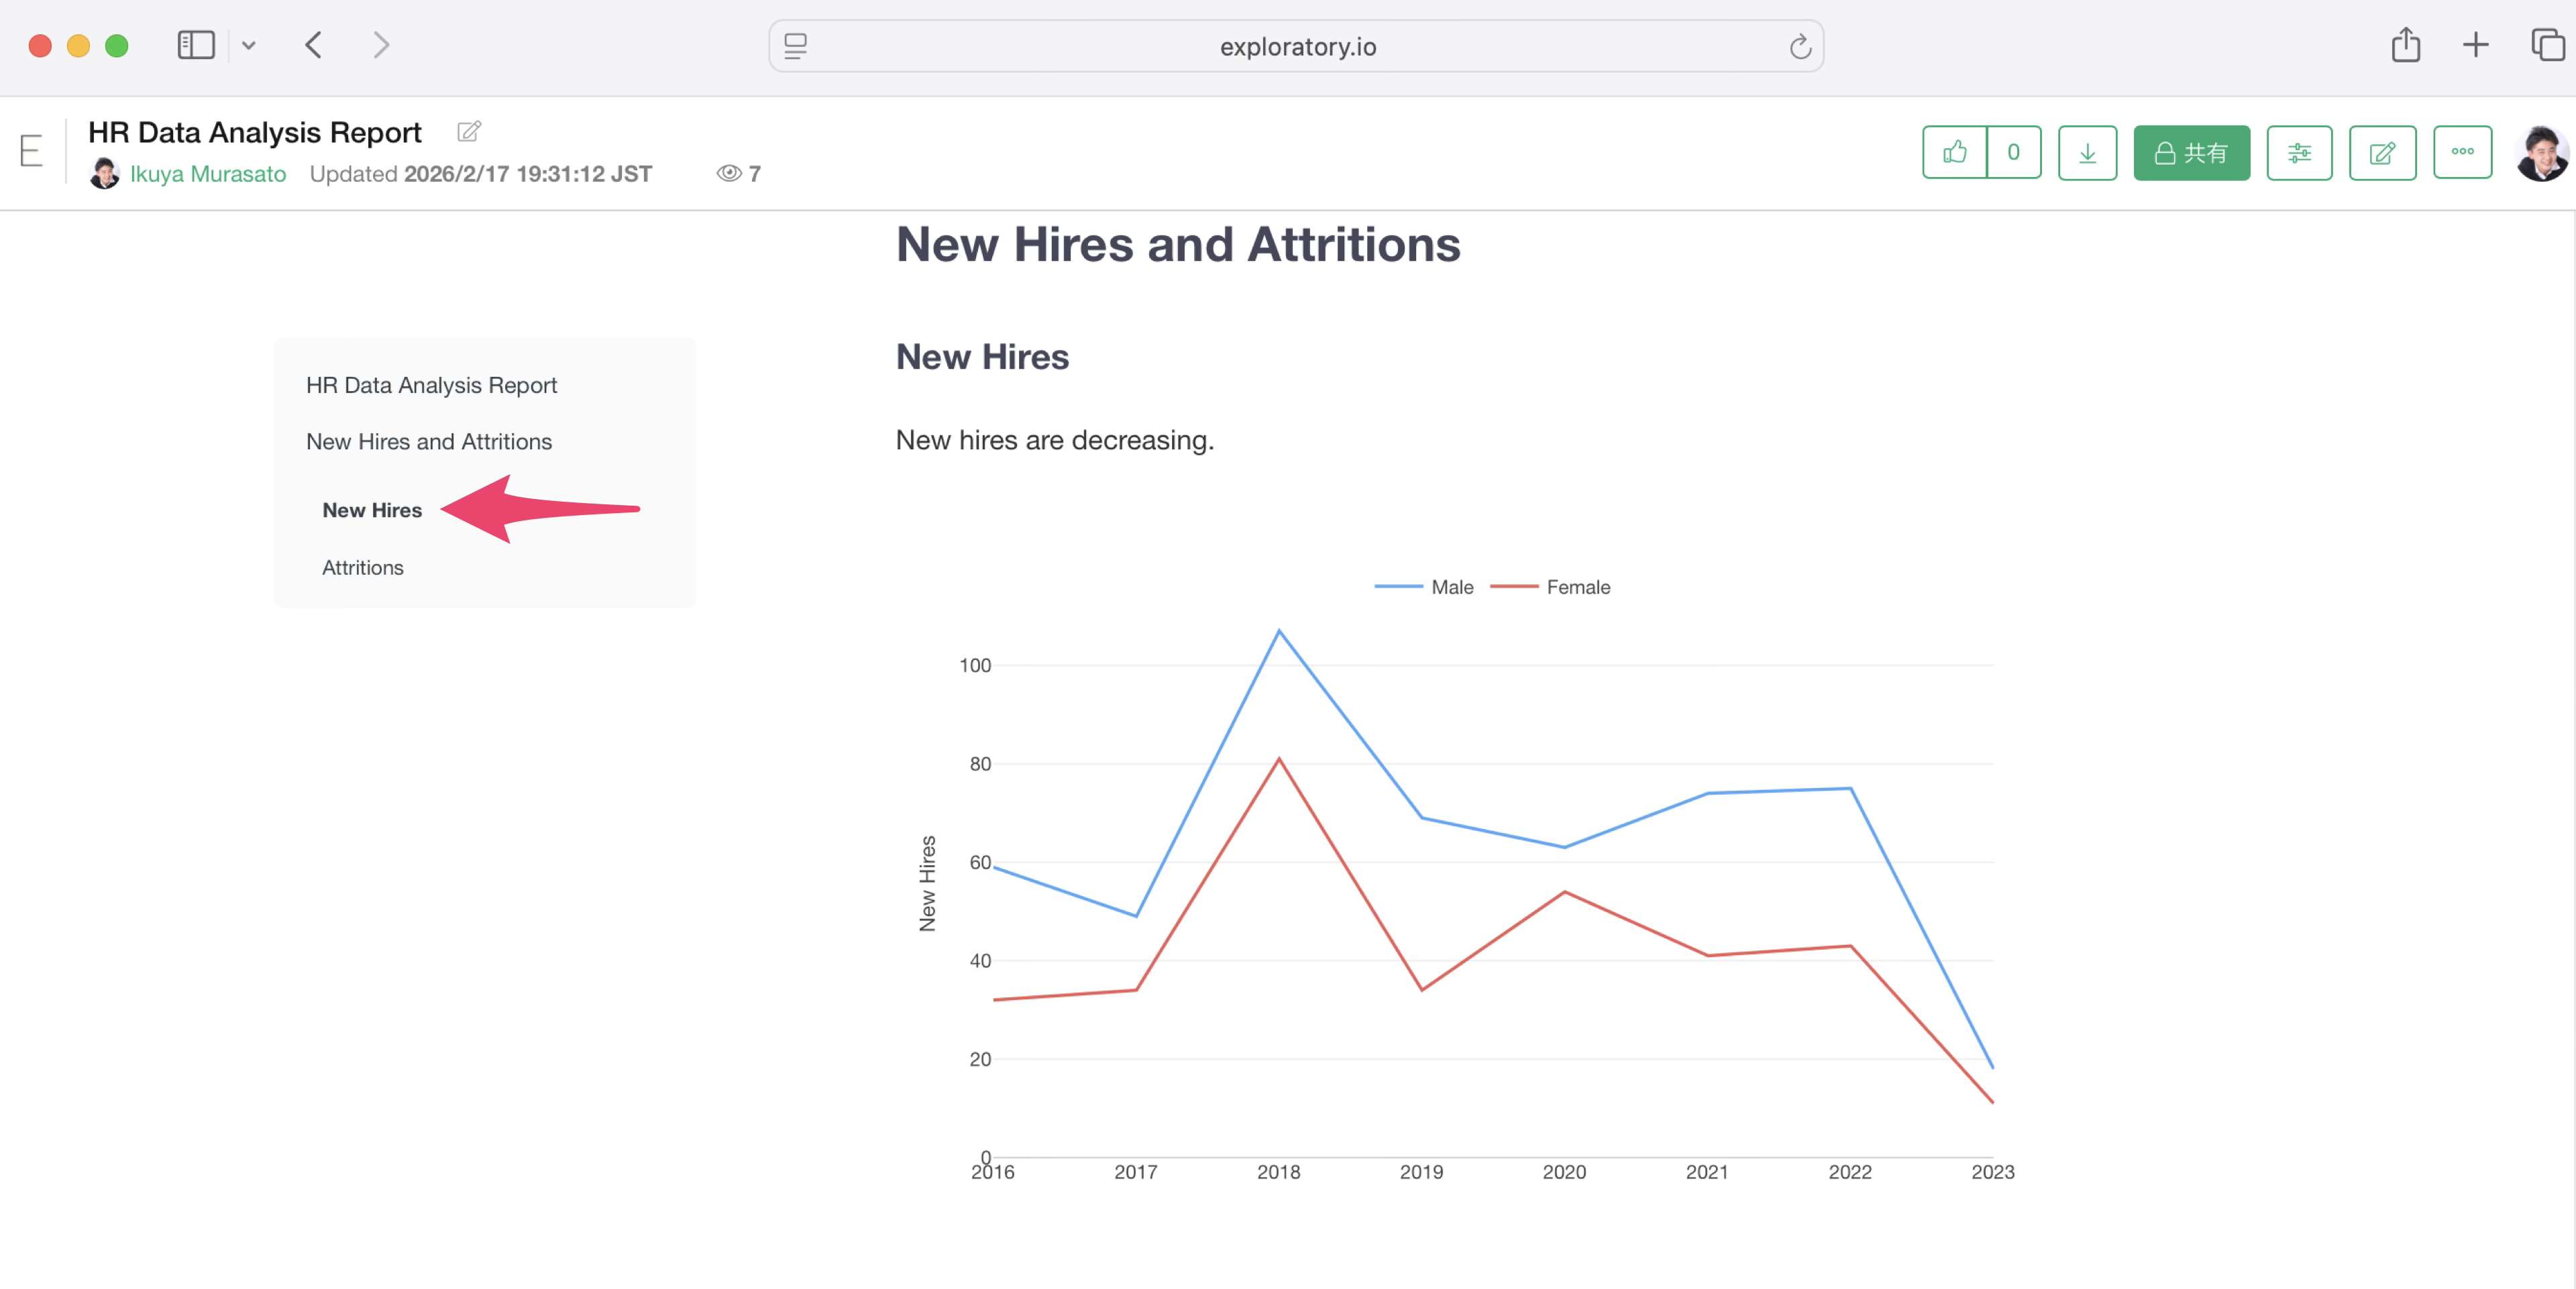
In this way, if “Collapse Inactive Table of Contents” is checked, inactive items are collapsed and only the active one is shown.
Smooth Scrolling
This sets how the page moves when you click on a heading in the table of contents. This is enabled by default.
When this setting is enabled, clicking a heading in the table of contents will smoothly scroll to the corresponding section.
Conversely, if this setting is disabled, clicking a heading will instantly jump to the corresponding section.
Saving
The content of the note is automatically saved when you close it, but if you want to ensure the note you are editing is saved, you can click the “Save” button at the top of the note.

Sharing (Publishing/Exporting)
Created notes can be published to the Exploratory server and shared with others so they can be viewed from anywhere at any time via a browser. It is also possible to export notes in various file formats.
Publishing
To share a note so it can be viewed via a browser, click the “Publish” button to publish the note to the server.

For details on publishing and sharing content, please refer to the following links:
Exporting in File Formats
Notes can not only be shared by publishing to the server but also exported as files for others to view.

HTML

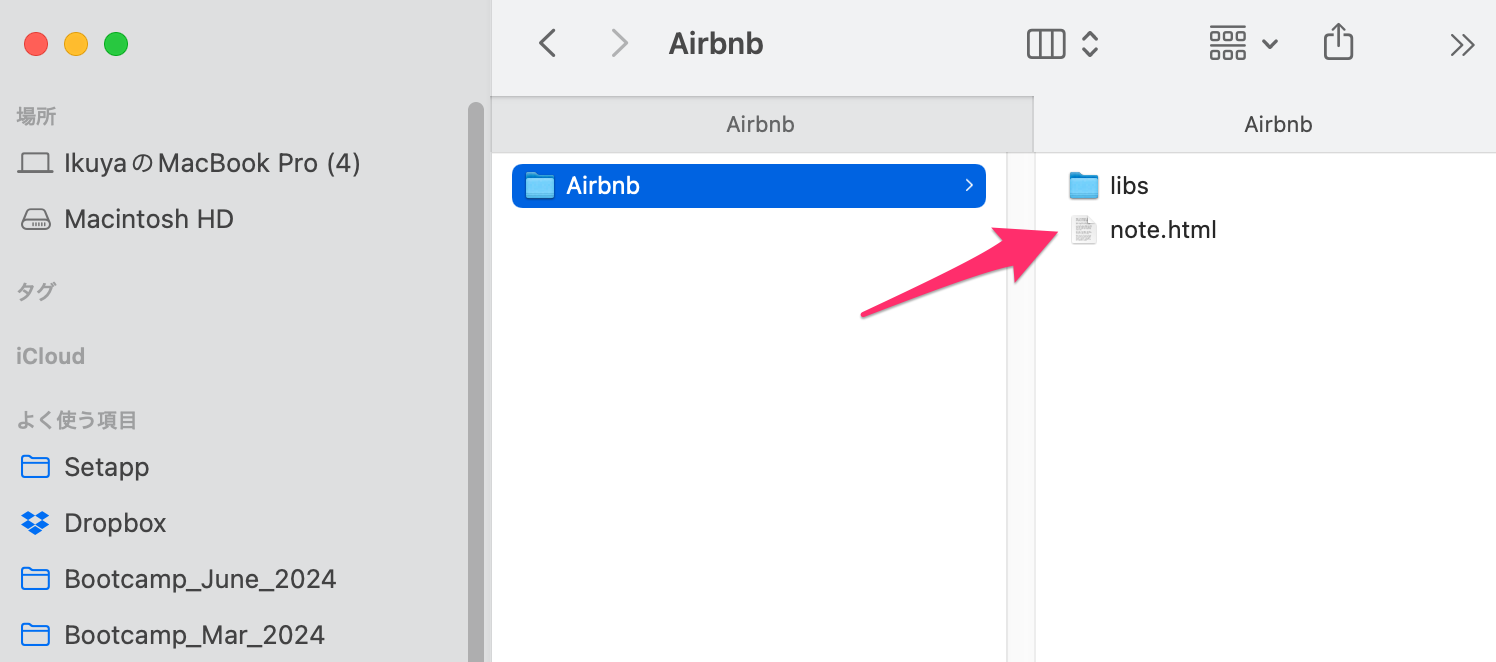
“Export as HTML” generates a compressed (zip) file containing all elements necessary for the note.
The zip file includes the HTML file and the JavaScript required to display the charts. By clicking the HTML file generated after extraction, you can check the note content locally. Zooming in/out is also possible.

Selecting “Export as PDF” allows you to export the note in PDF format.
Word Document

Selecting “Export as Word Document” allows you to export the note in Word (docx) format. Note that all charts are generated as images within the Word document.
Markdown

Selecting “Export as Markdown” allows you to export the note in Markdown (md) format. Please note that charts are not exported as images; instead, only the path information for the internally used charts or analytics is described.
Downloading EDF and Chart Data/Images on the Server
Content published to the Exploratory server can be exported by authorized users as EDF files (Exploratory Data Format) to reproduce the dashboard in Exploratory Desktop, or as images of each chart and data.
EDF File
EDF files can be downloaded from the top of each content screen.
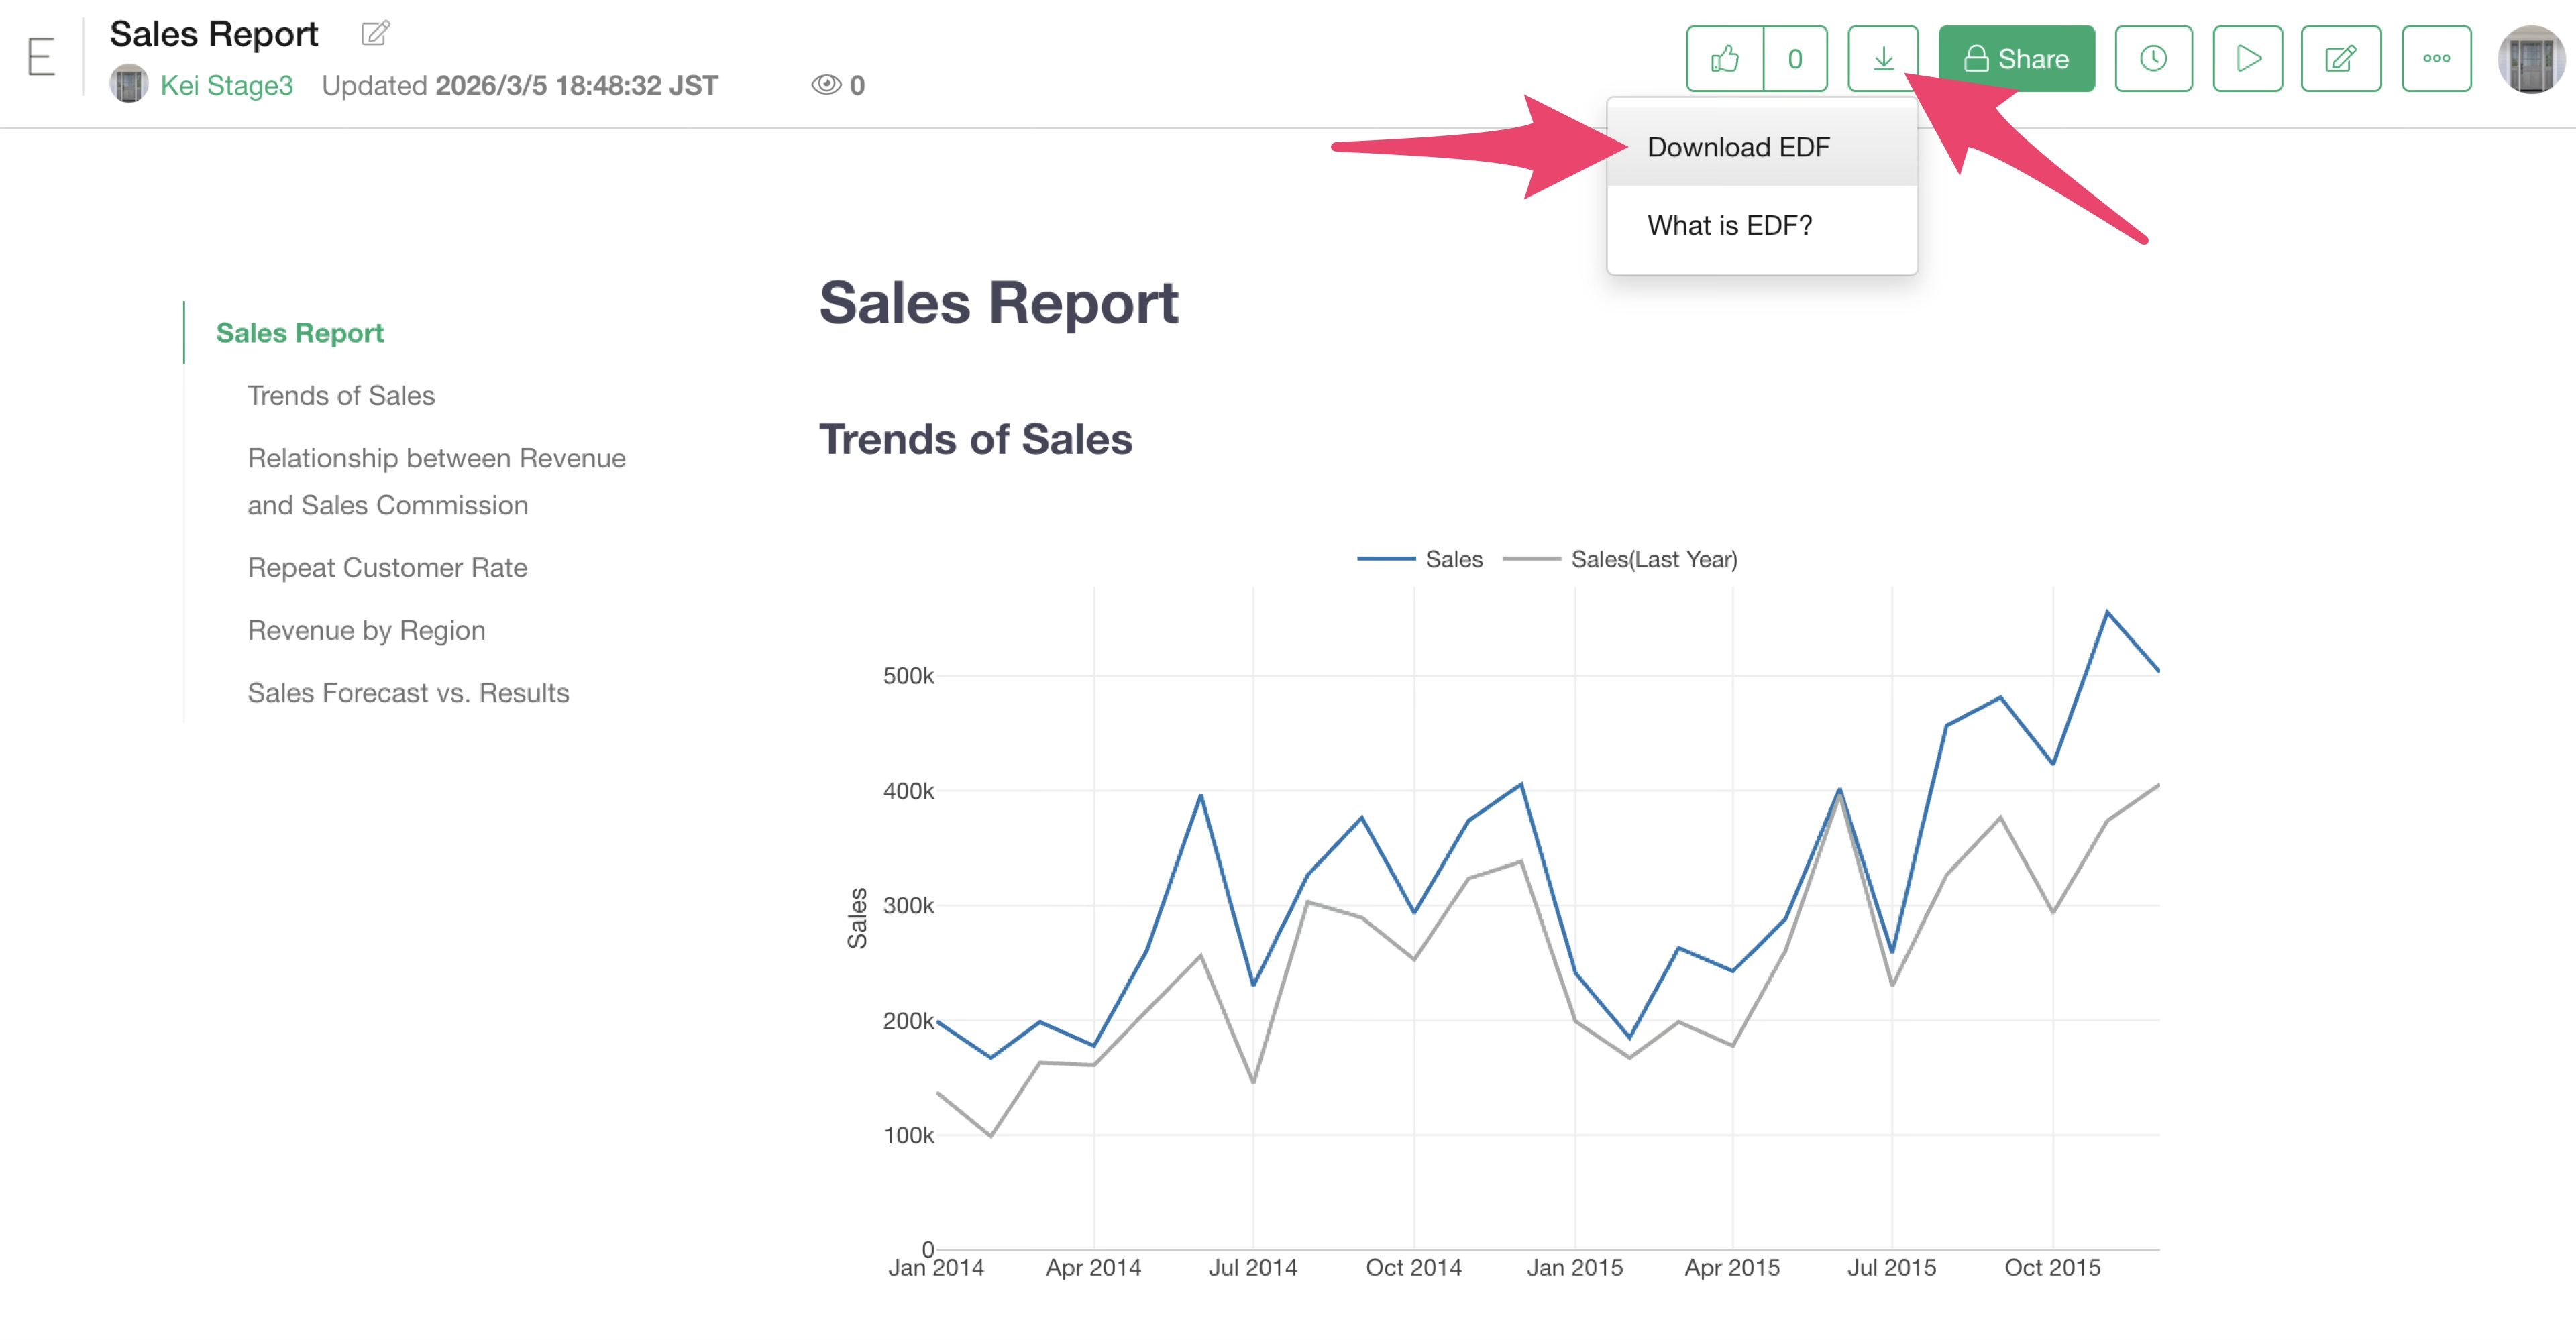
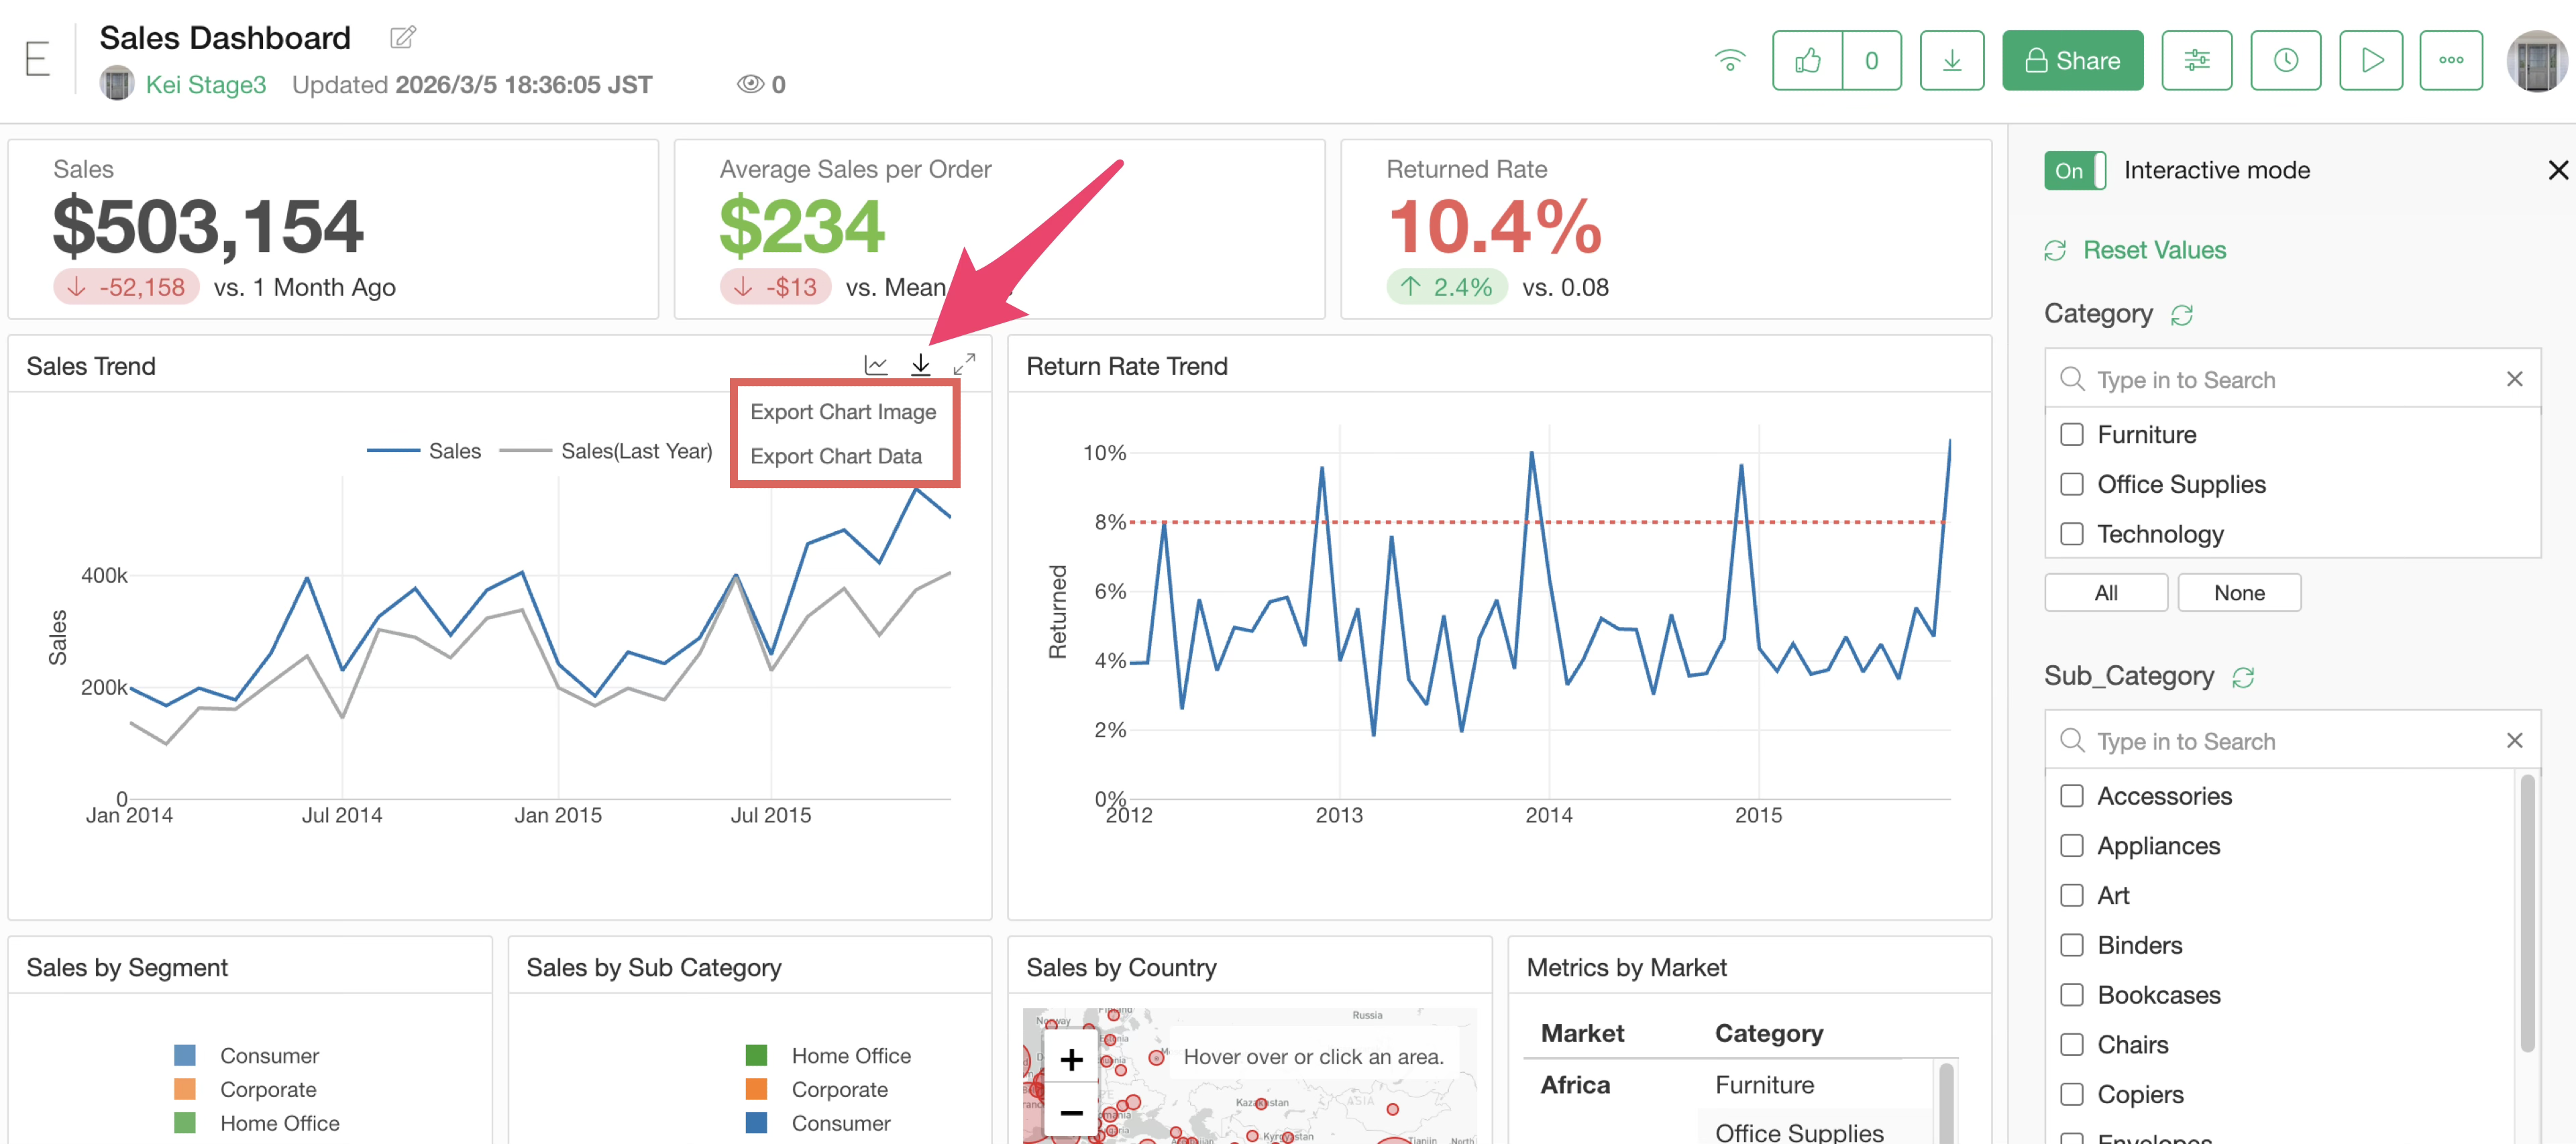
Chart Data / Chart Image
Chart data and chart images can be downloaded from the export button of each chart.
Download permissions for each file can be specified as one of the following:
- Author only
- Viewers and Author
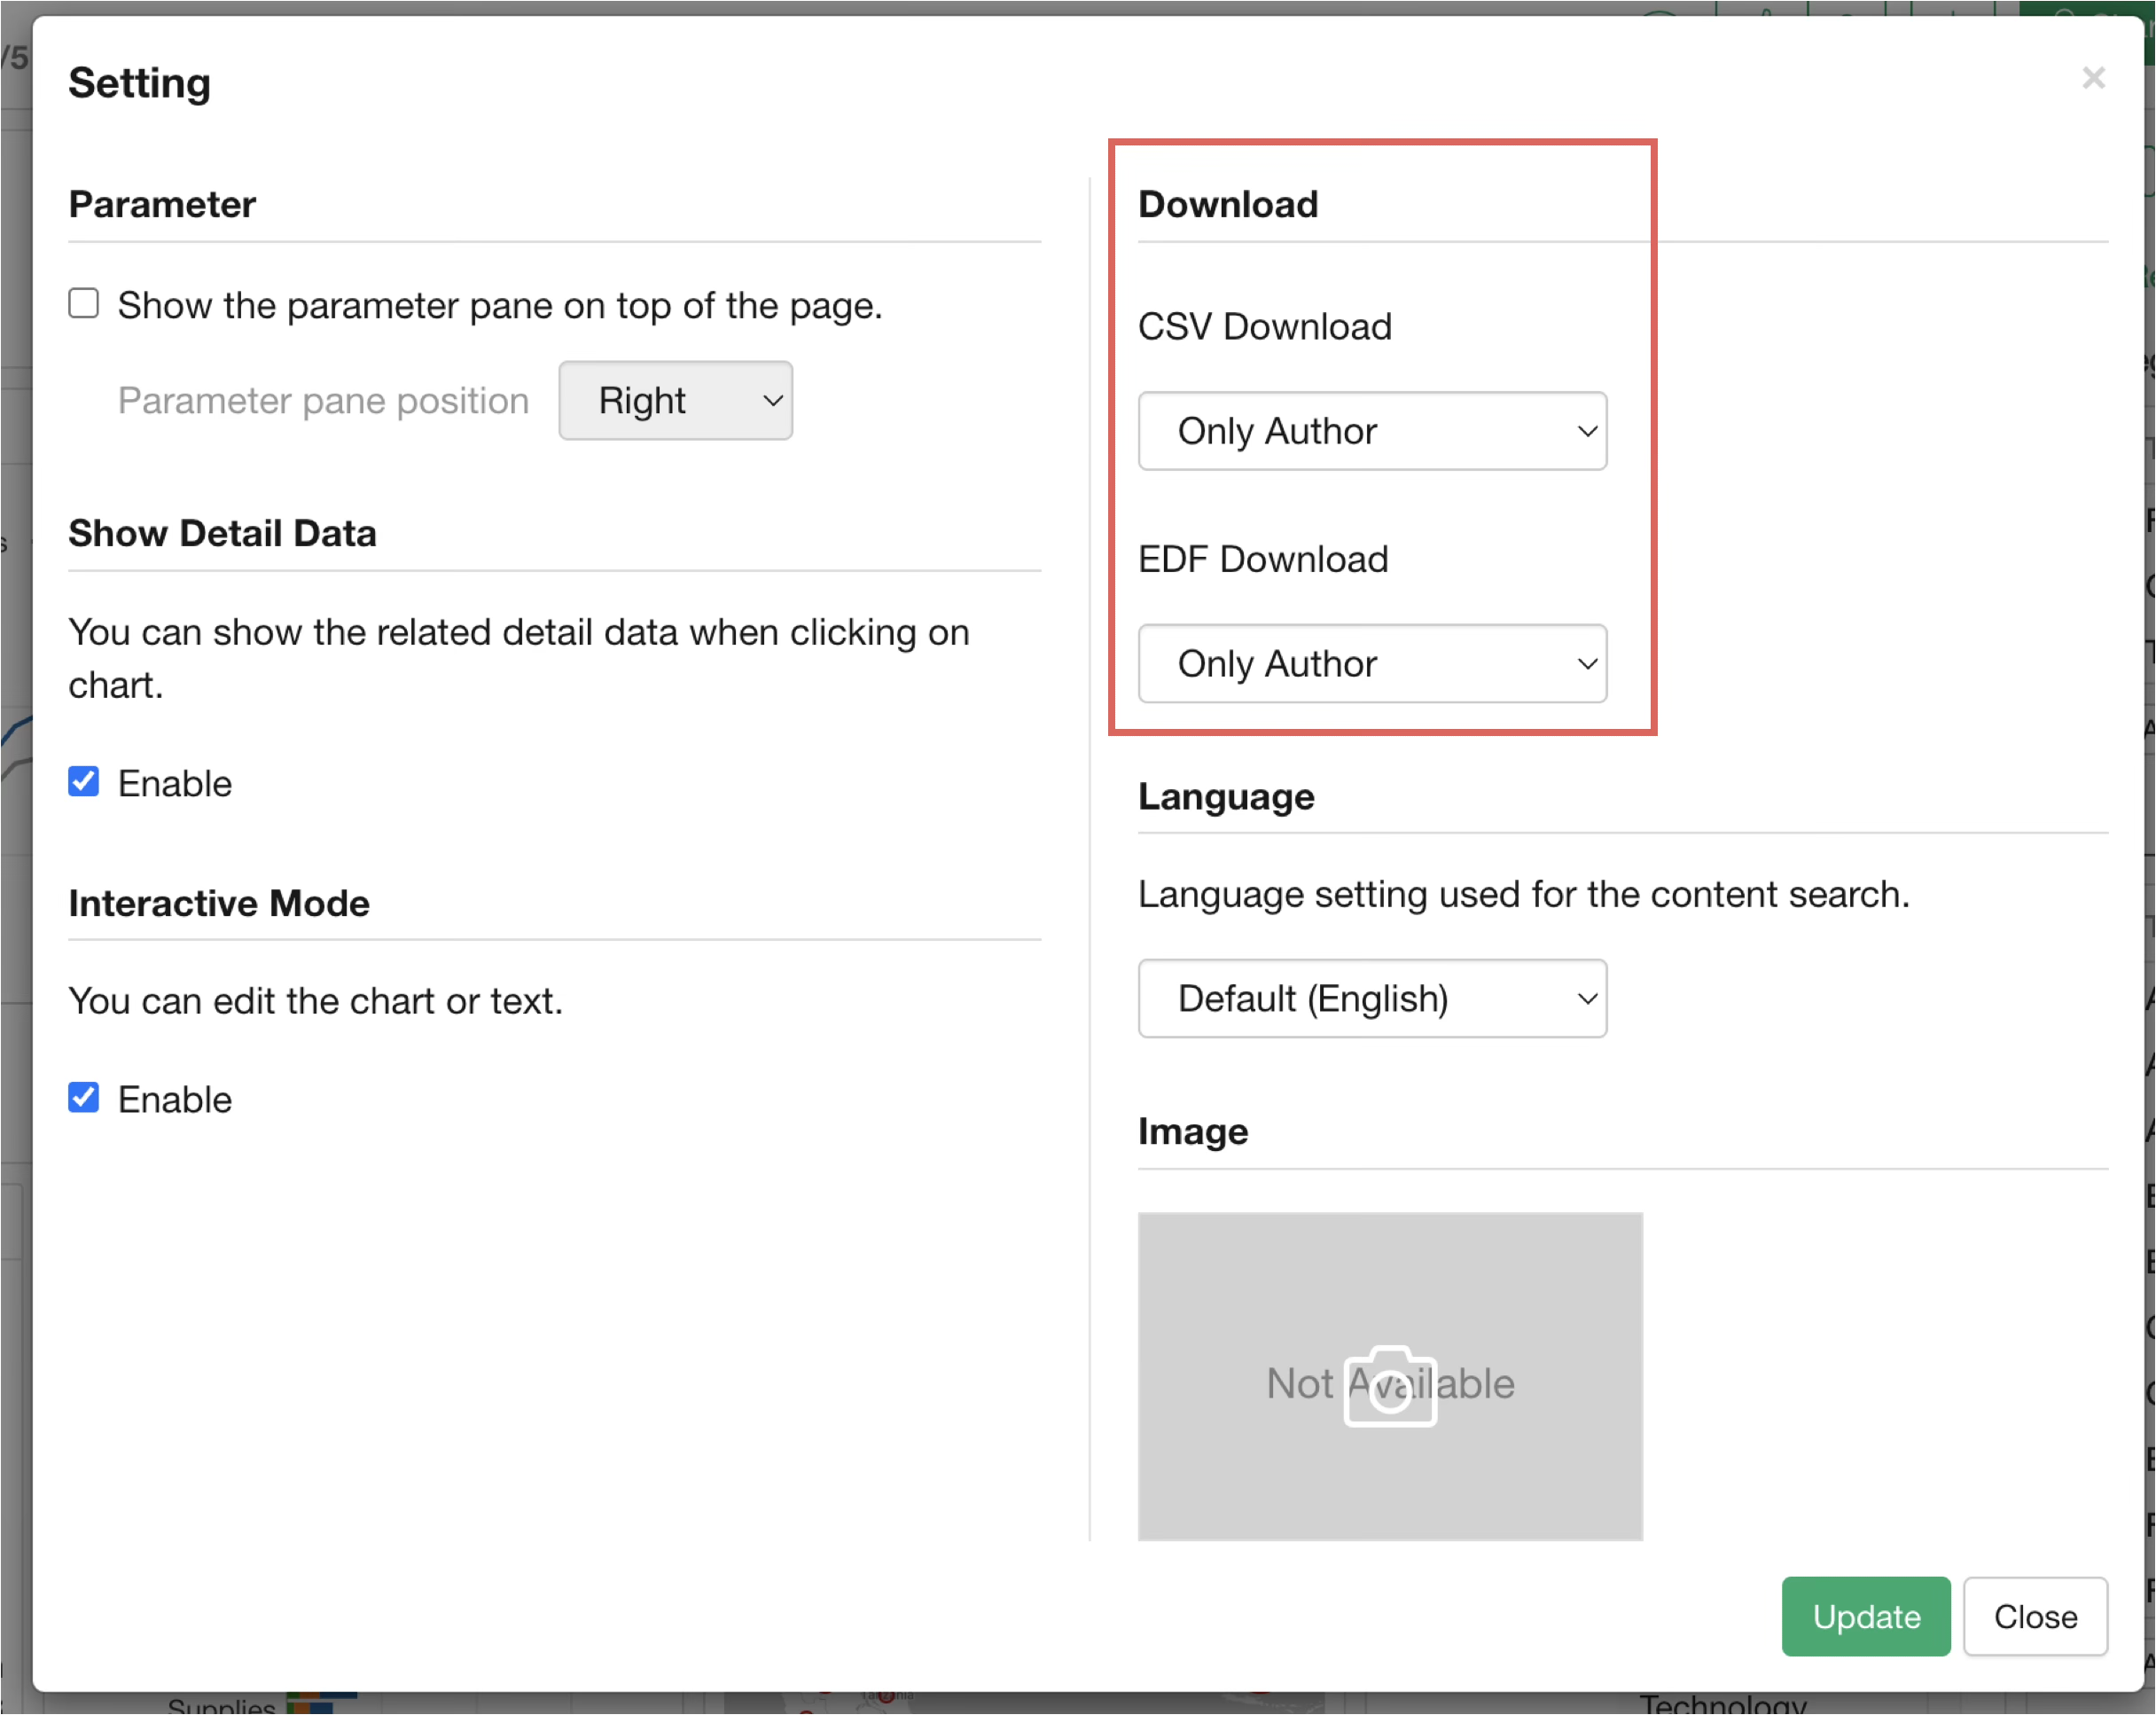
For details on how to set download permissions, please refer to the following link:
- How to restrict downloading of CSV and EDF files for content published to Exploratory Server - Link
Reproducibility
Selecting “Export as EDF” from the export menu generates an EDF (Exploratory Data Format) file to reproduce the corresponding note from Exploratory Desktop.

By importing the EDF into Exploratory Desktop, you can reproduce the note in its entirety, including all data required to reproduce it, data wrangling steps, and charts.
For details, please check here.
Automated Updates Using Schedules
When using remote files, databases, cloud applications, or data catalogs as data sources for charts in a note, a schedule icon is displayed on the server, allowing you to set a schedule for updating the note.

Restoration (Undo)
If you want to revert an already edited note to a previous version, click “Change History” in the project menu.
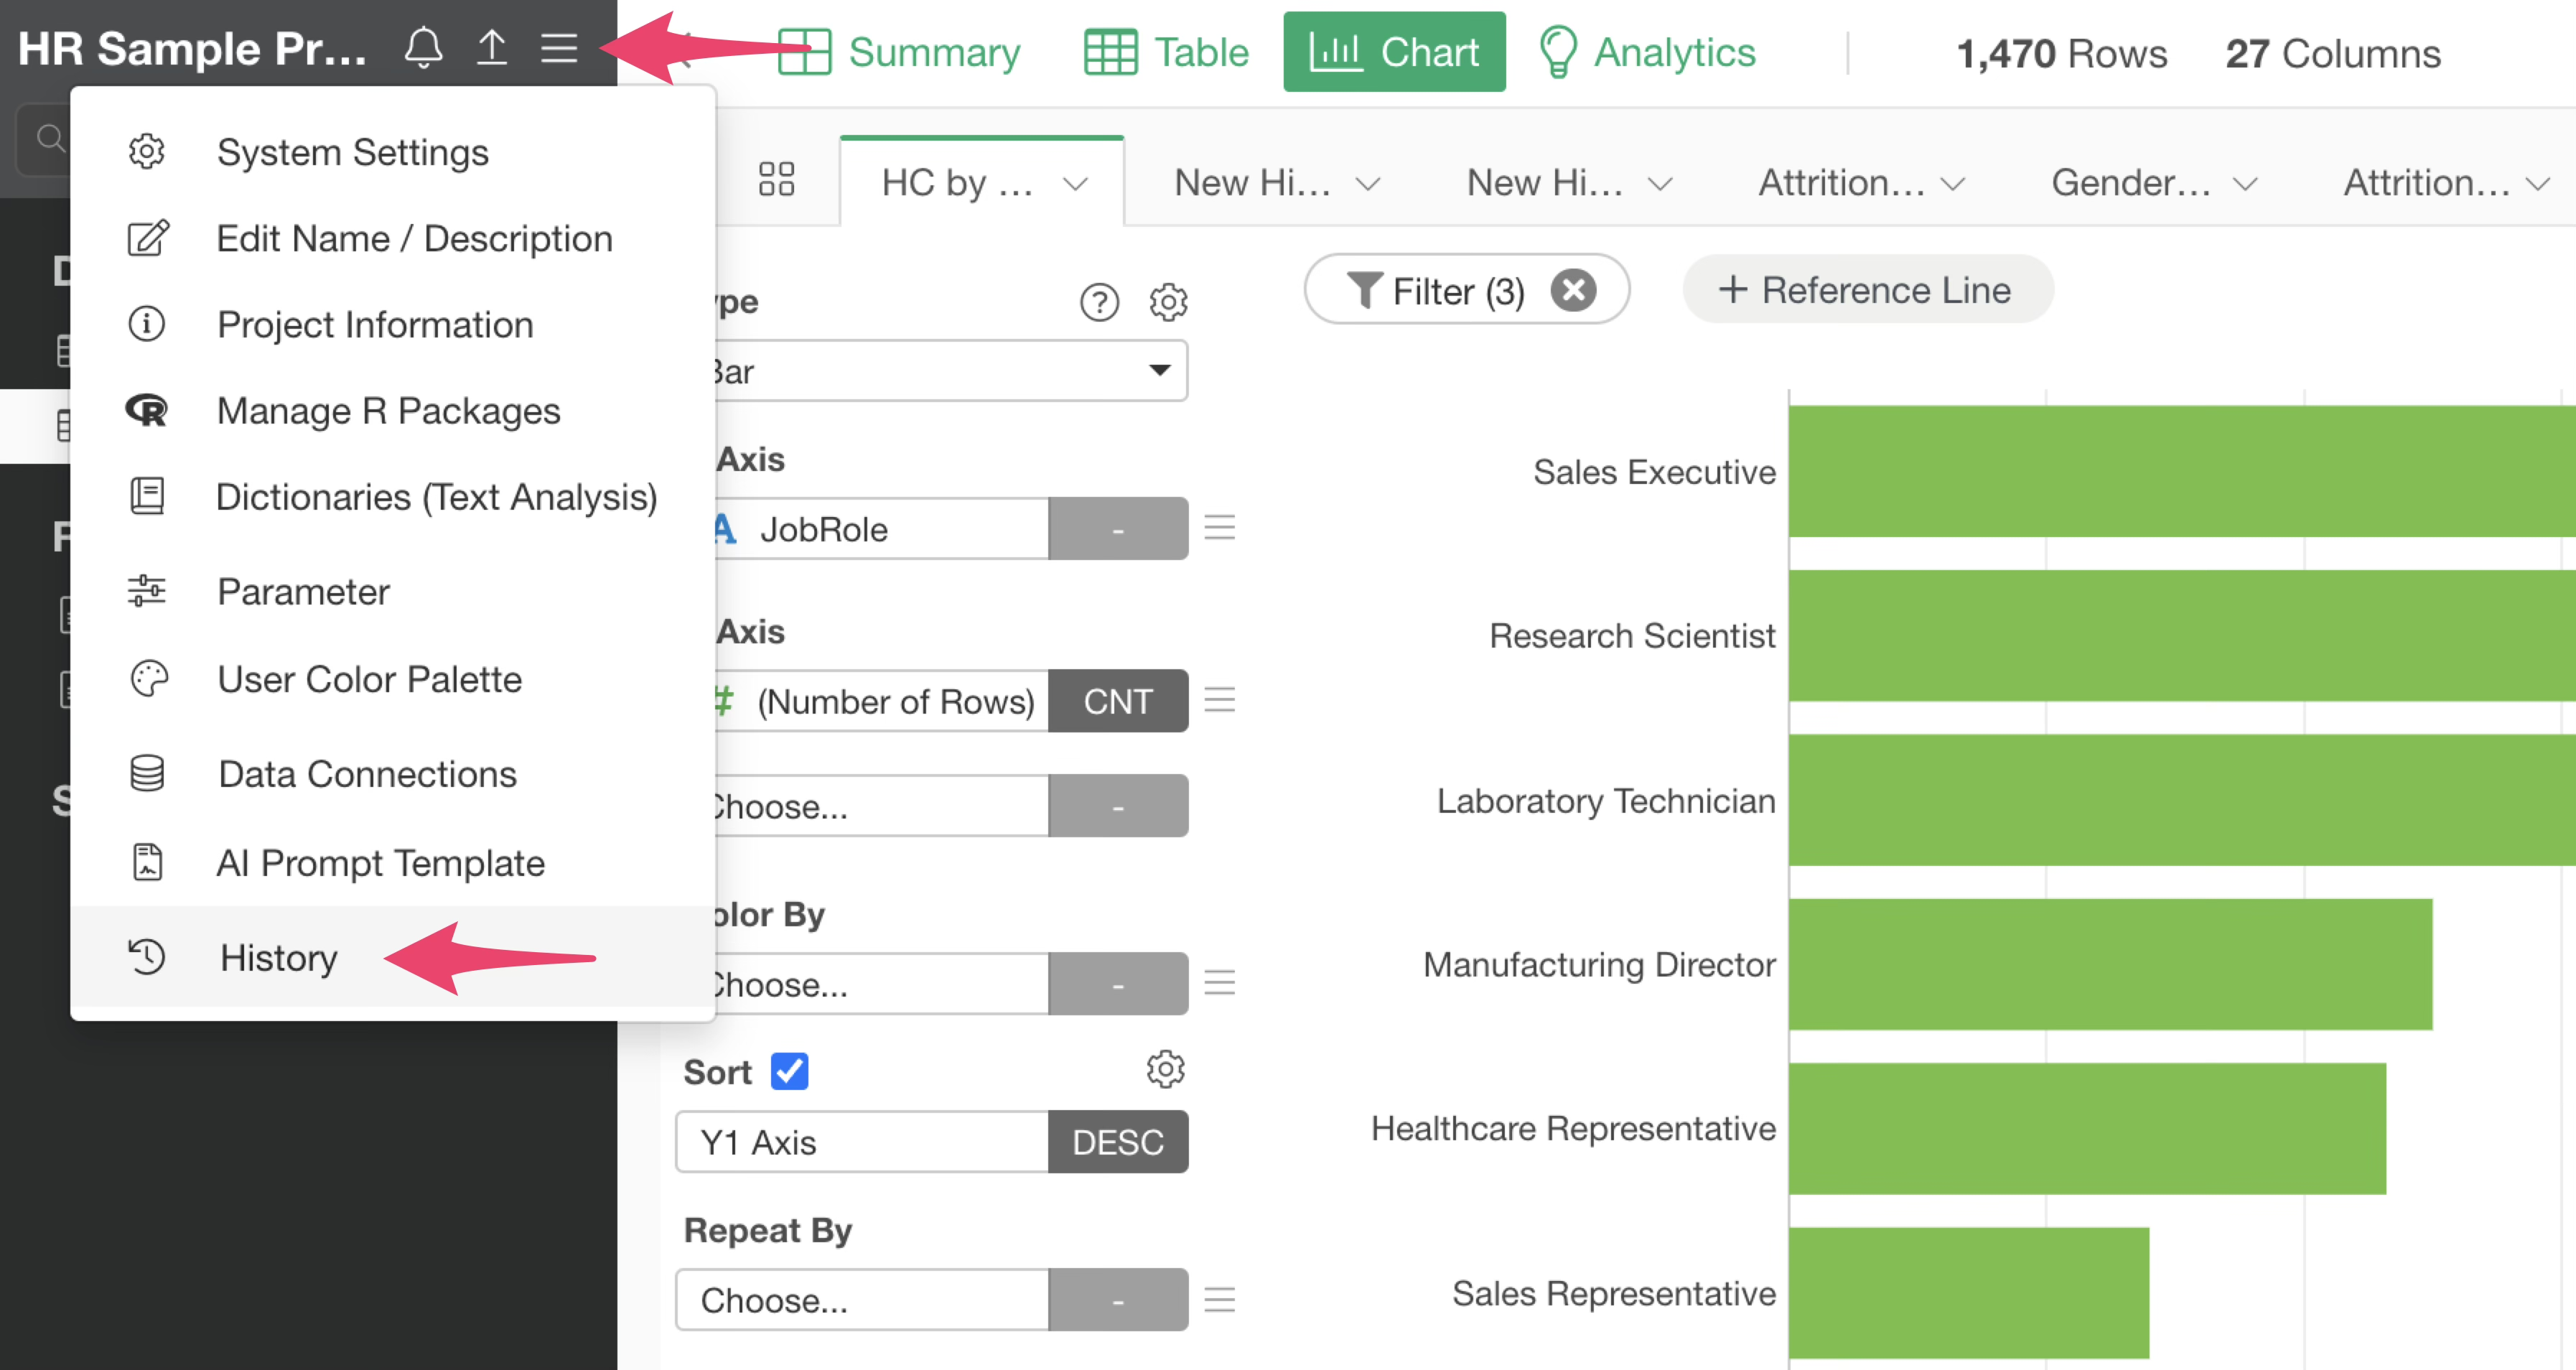
You can then check all change histories in the current project and restore the note to any point in time.
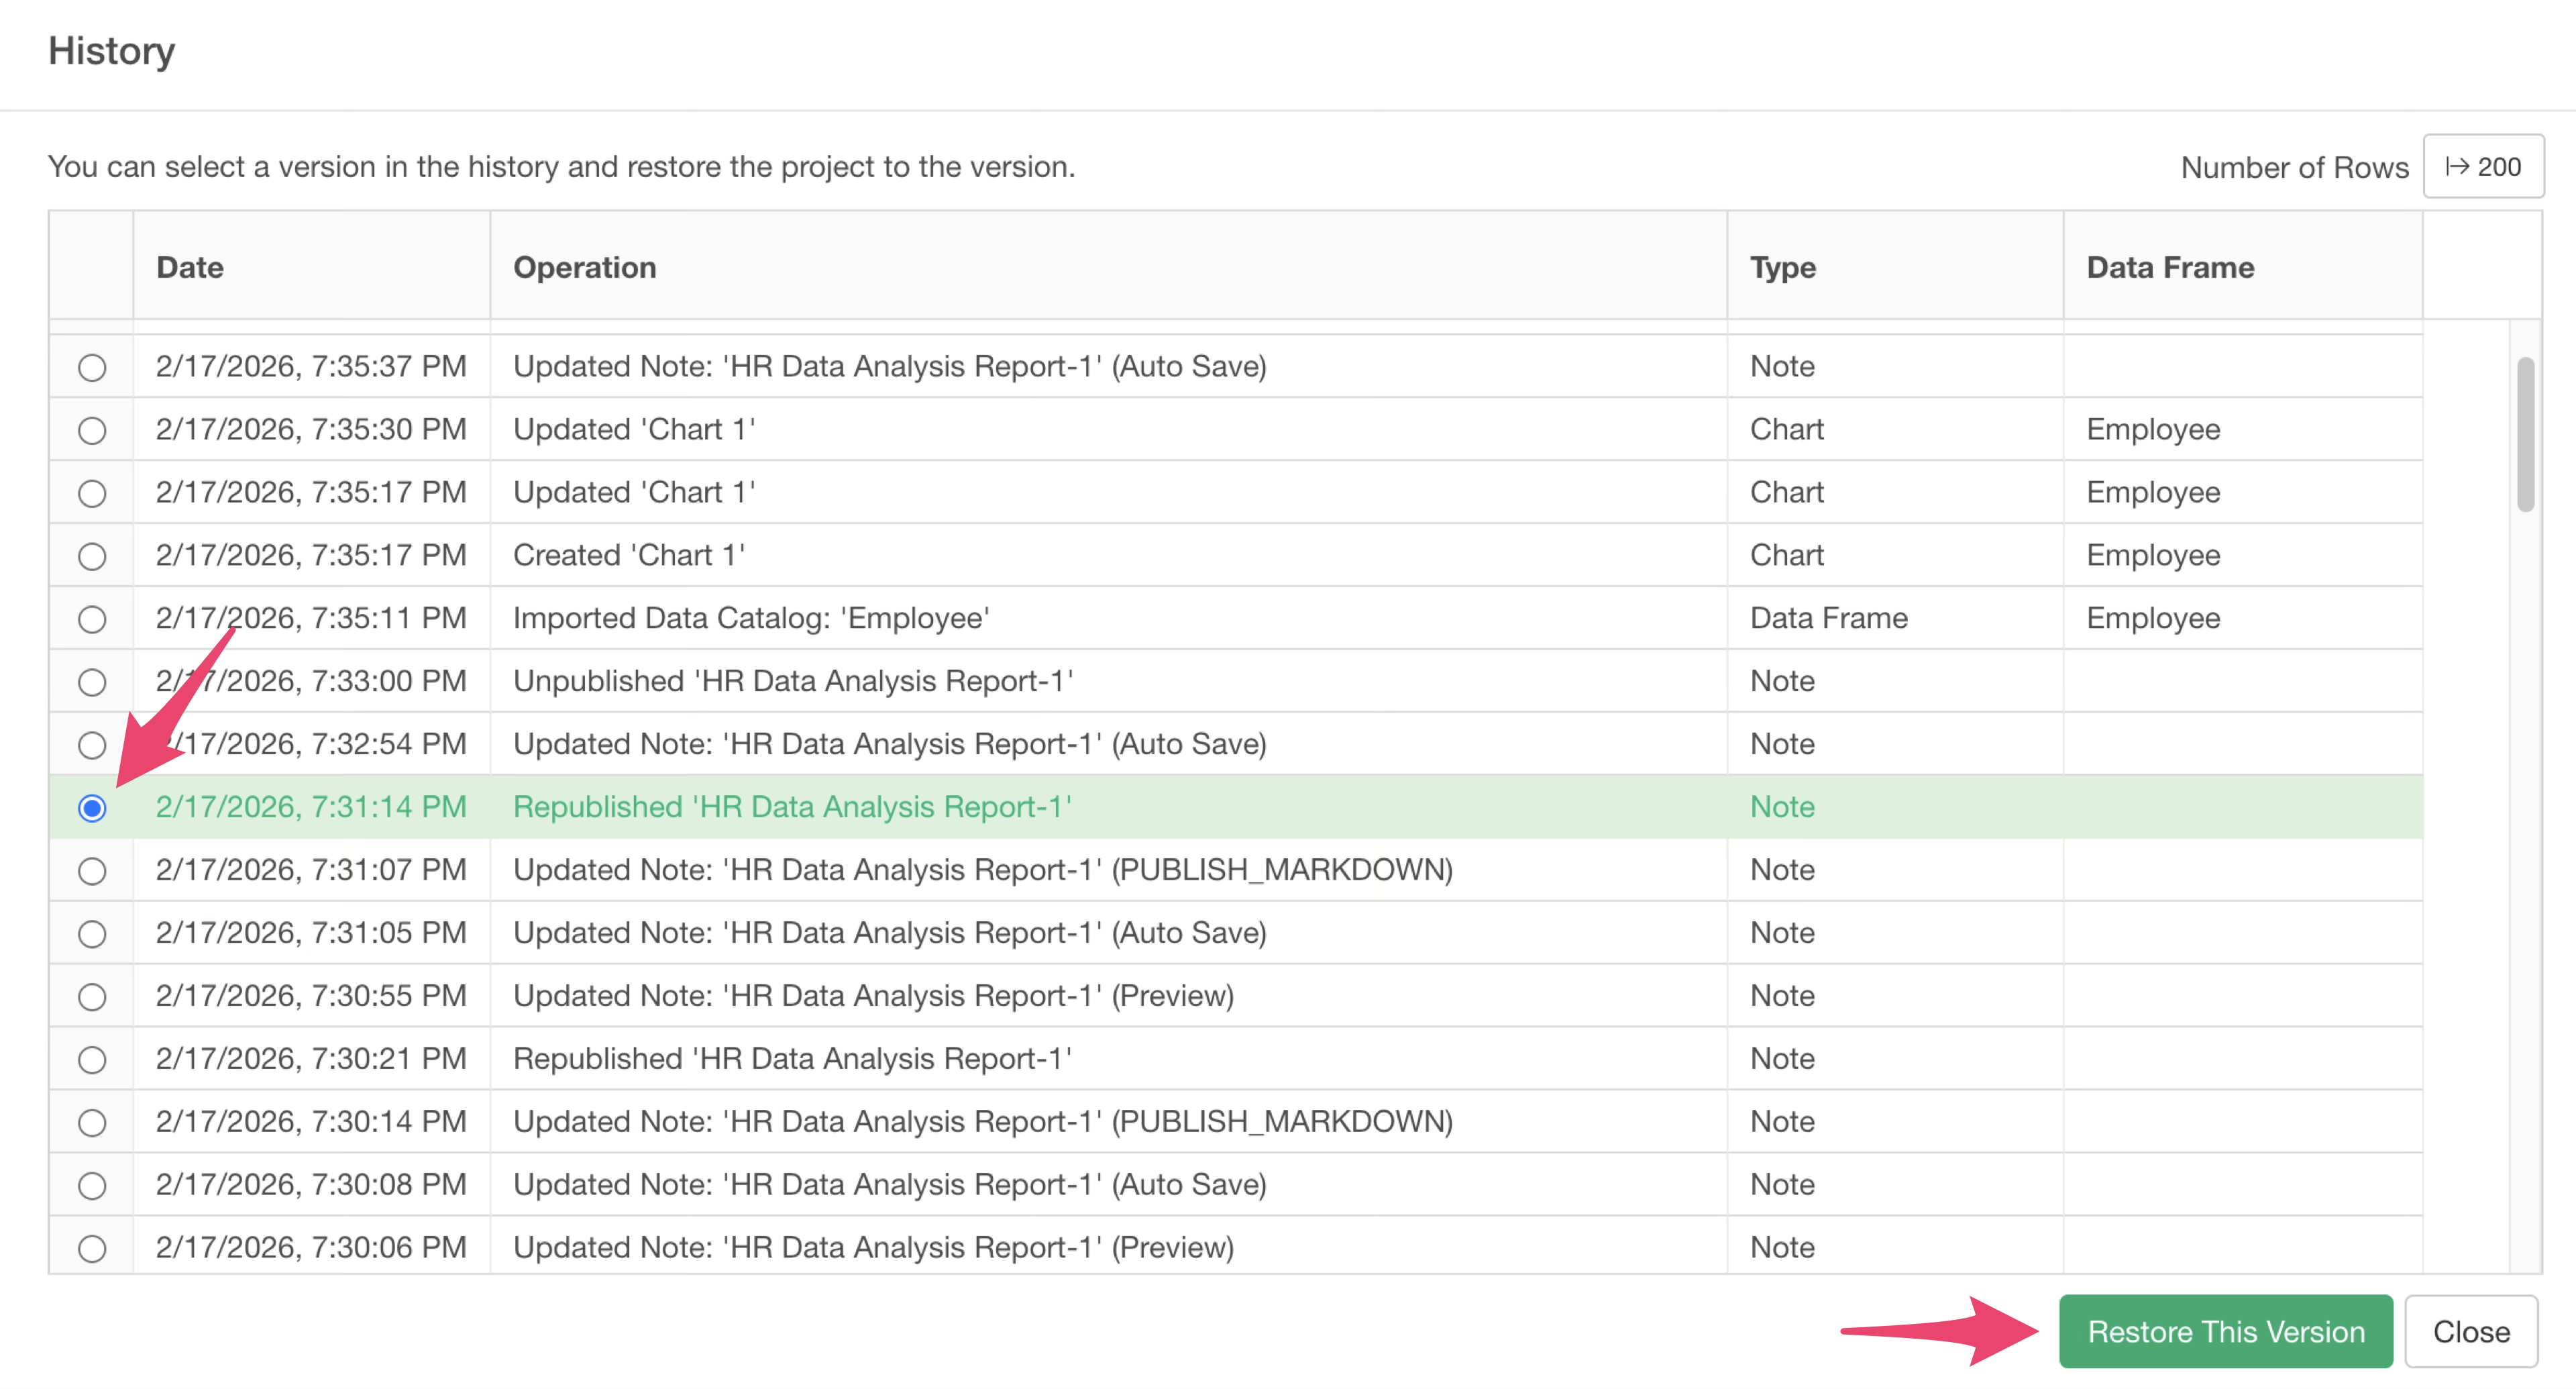
Note that when you restore, the project itself is restored to the state at that point, so all processes performed after the restoration point will be invalidated.