AI Prompt Best Practices
The “AI Prompt” feature, which allows you to process and format data using natural language, enables you to quickly and freely manipulate data for data wrangling tasks such as data formatting, calculations, aggregations, joins, and string manipulations, simply by entering your desired actions into the prompt.
This note explains effective prompt writing techniques and provides useful information to help you get the desired results when using the AI Prompt feature.
Basic Prompt Writing
All you need to do is type the desired process into the AI prompt dialog.
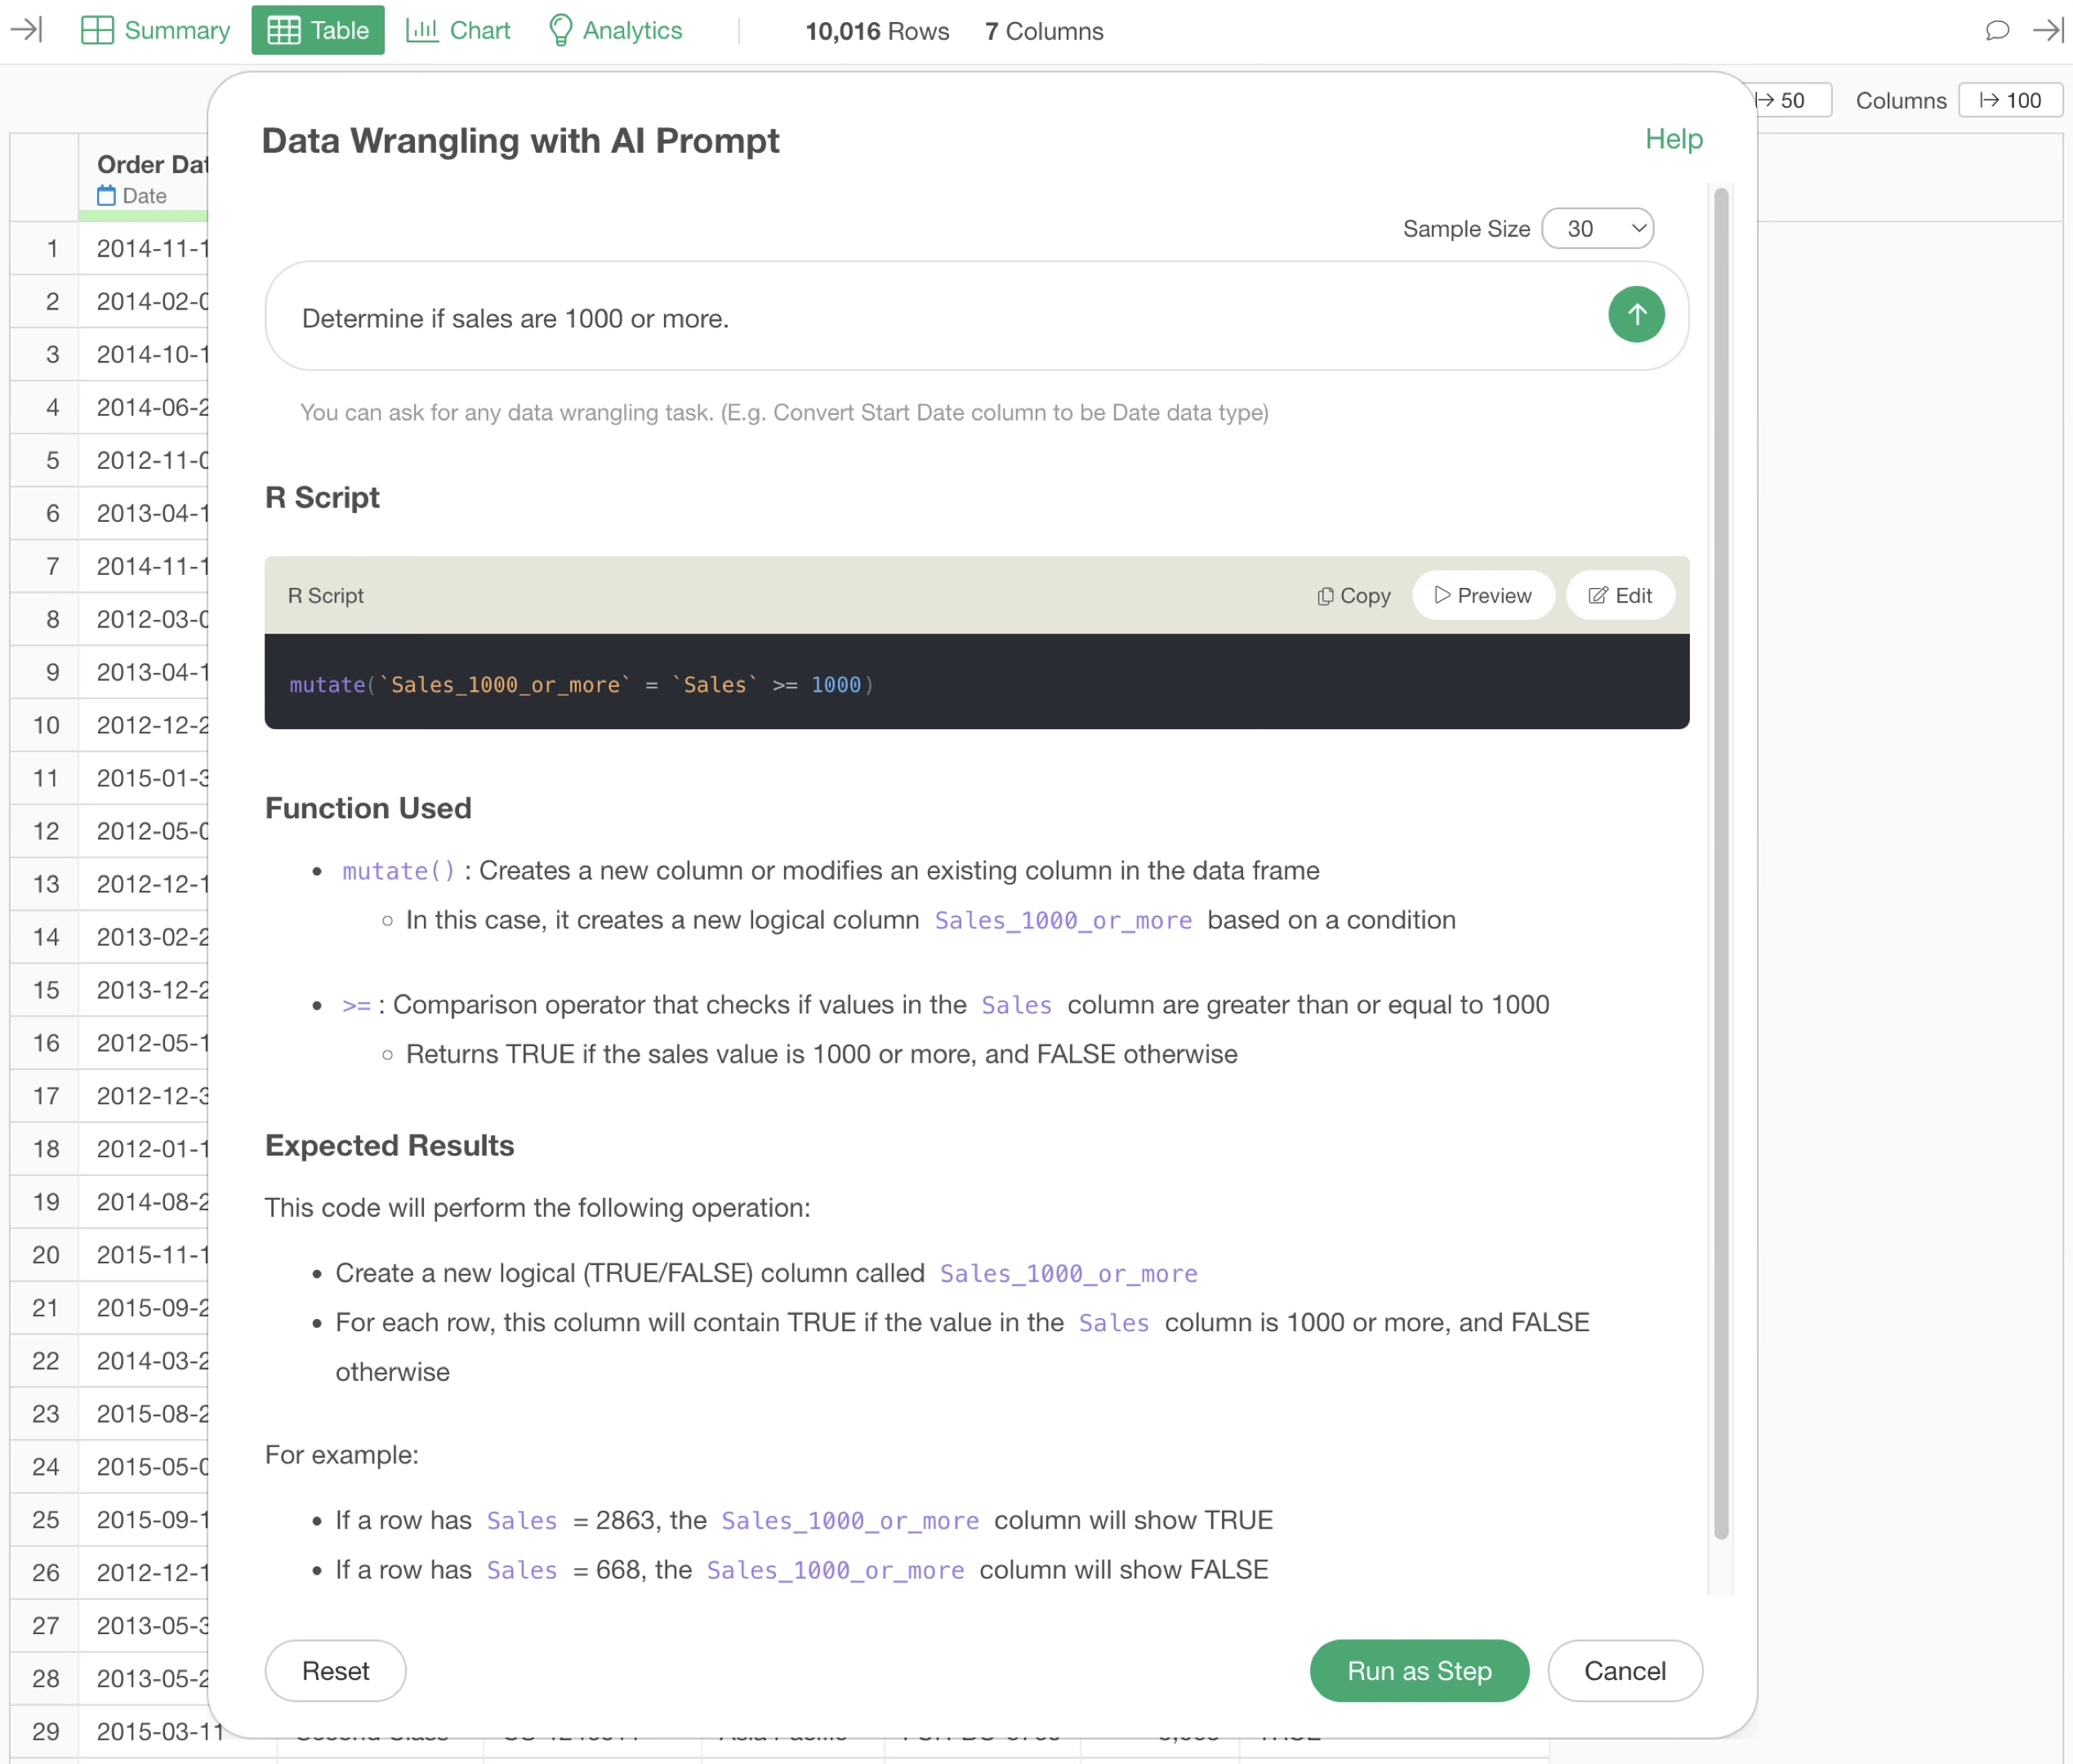
For example, suppose you are using e-commerce sales data where each row represents one order.
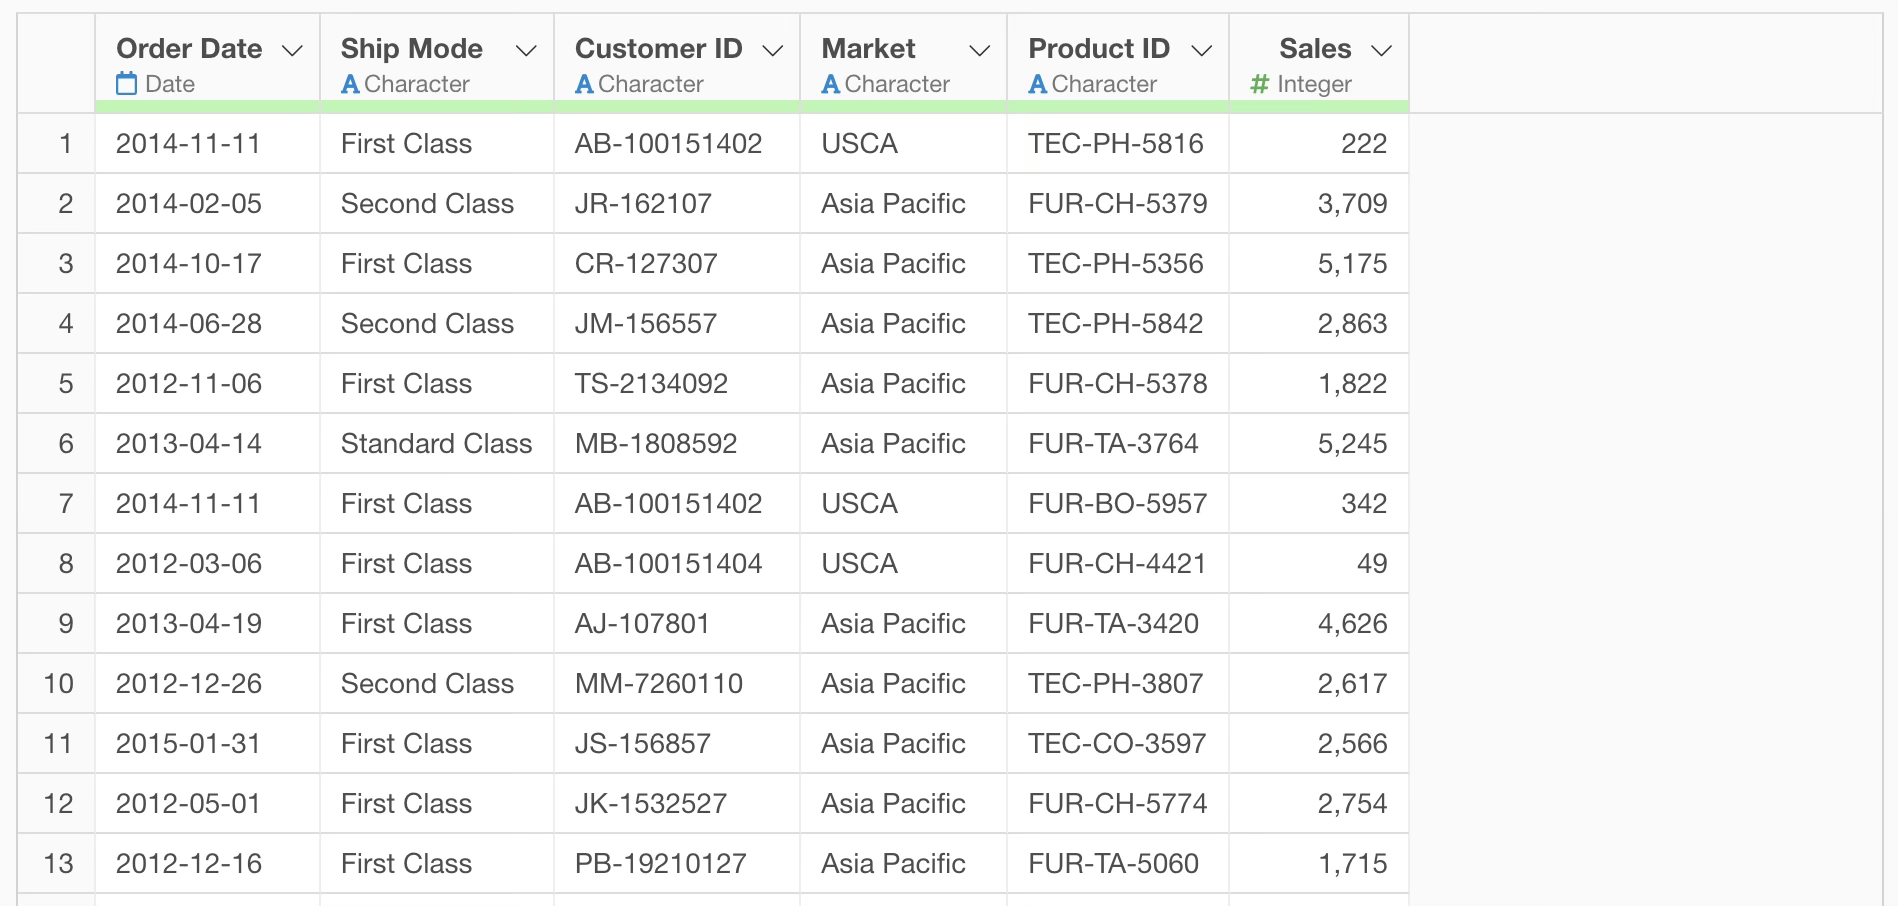
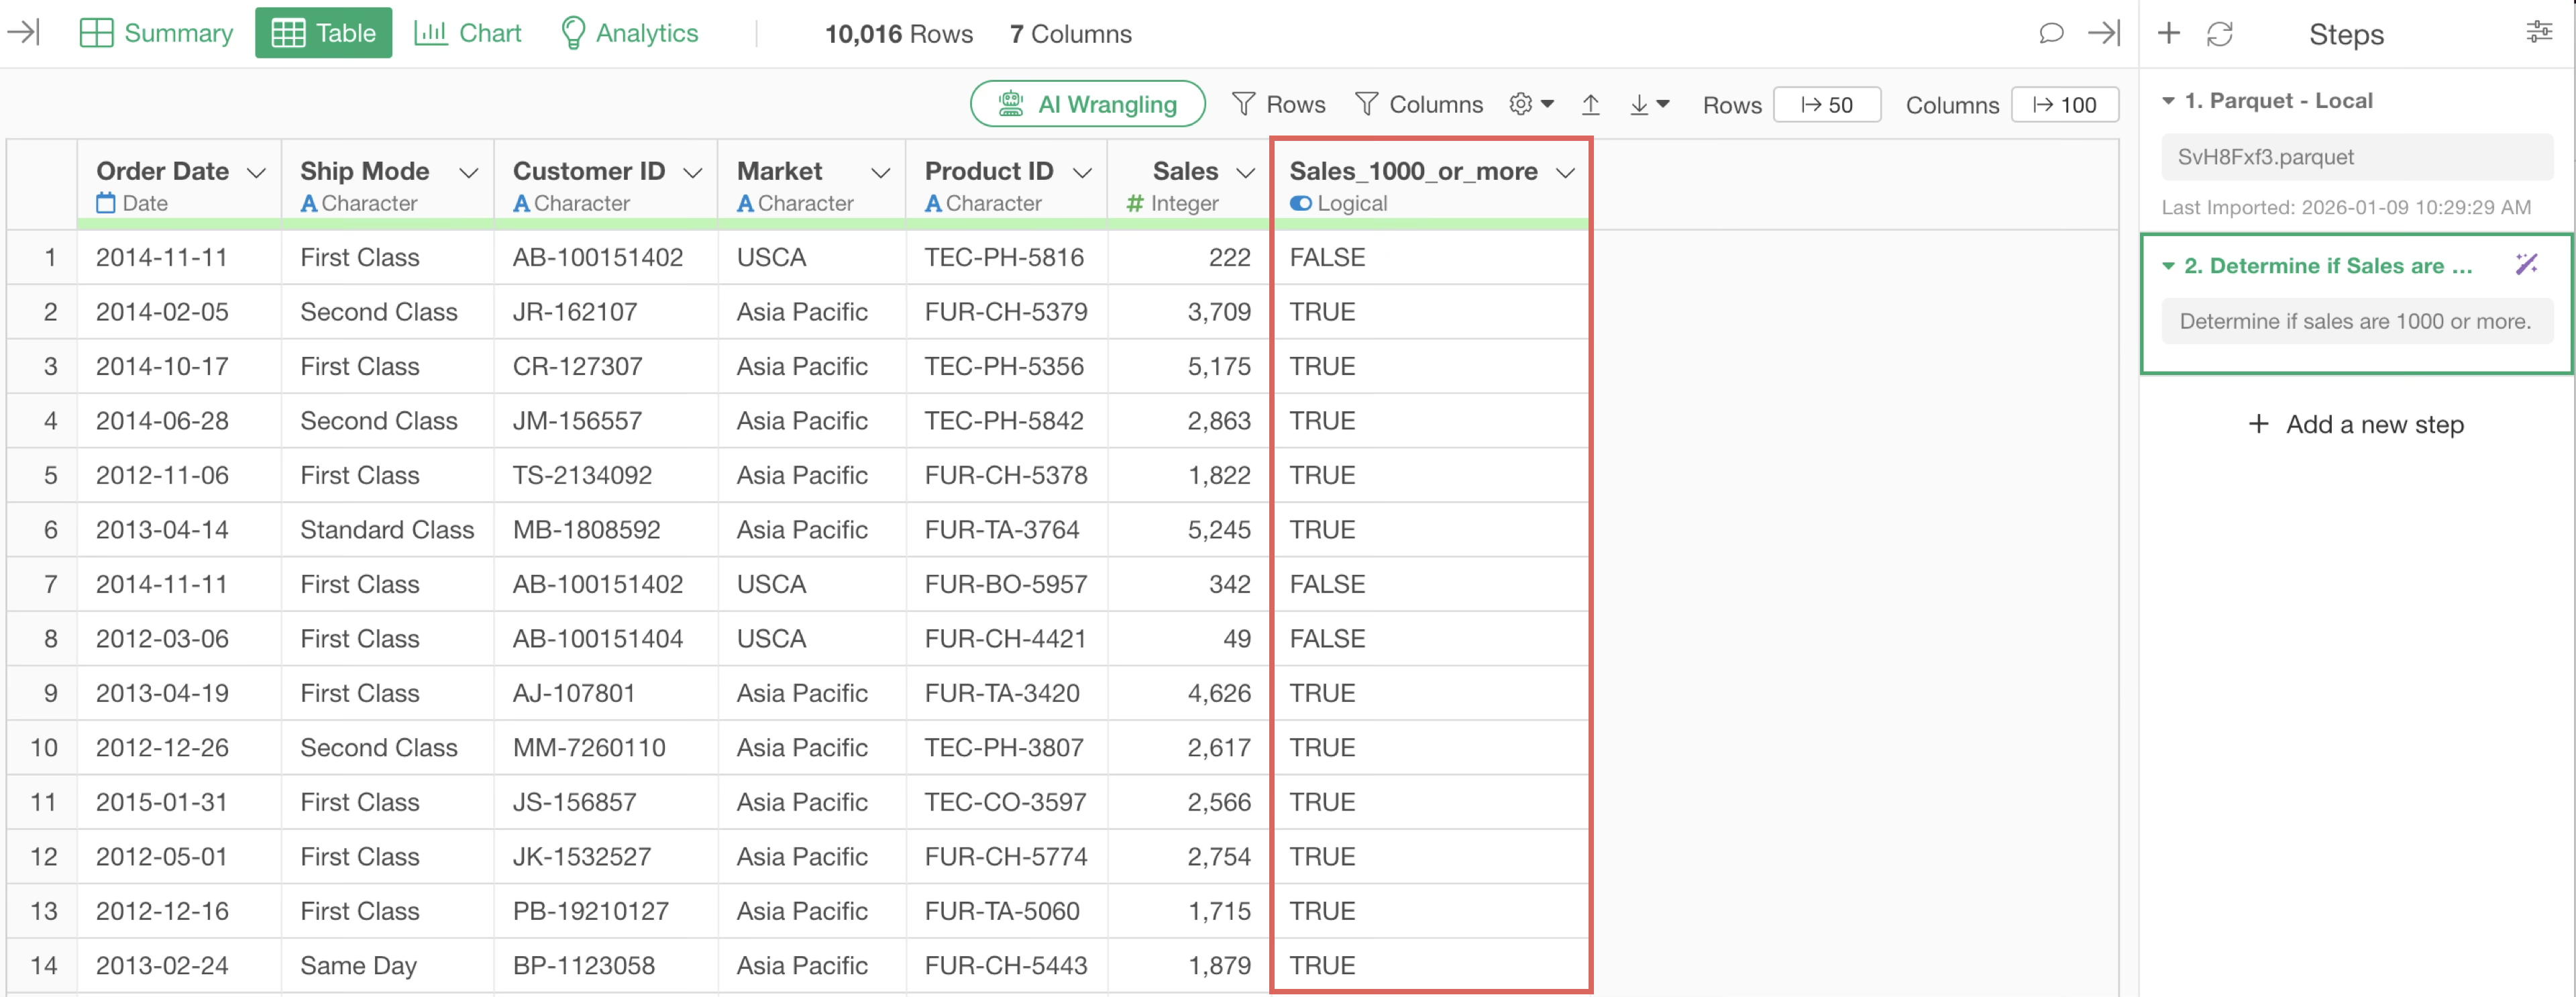
To create a column that determines whether sales are 1000 or more, you would enter “Determine if sales are 1000 or more” into the prompt.
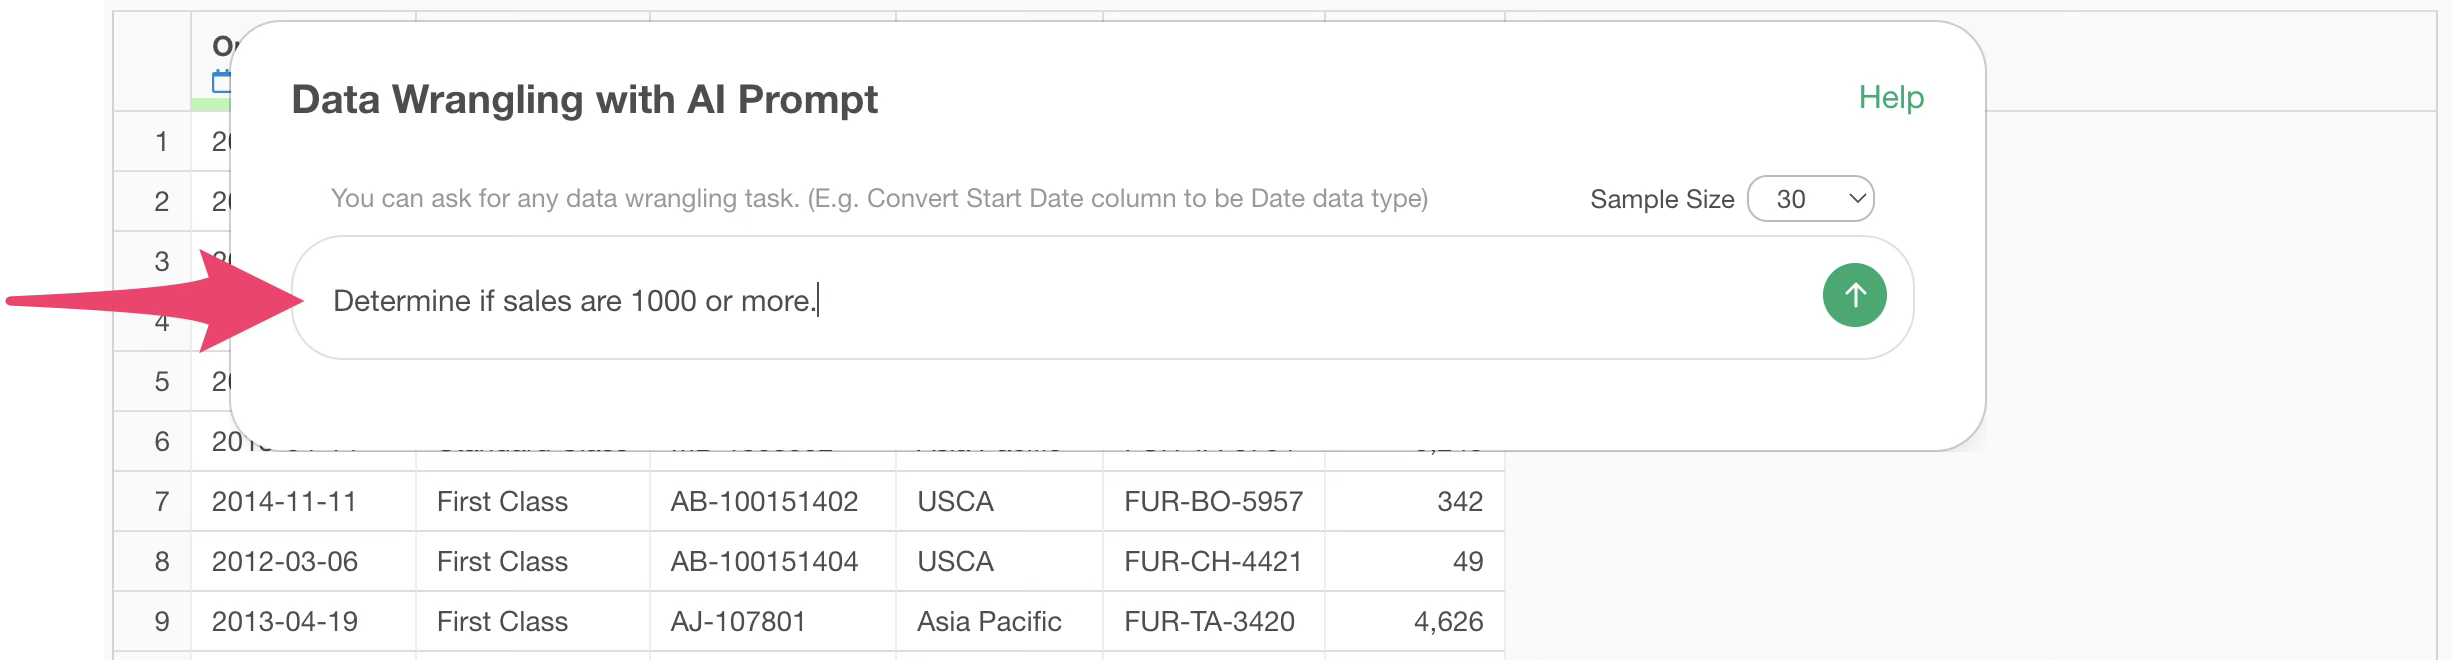
By executing the prompt, the R command result for determining whether sales are 1000 or more is returned. Therefore, click the “Run as Step” button.
This creates a column named “Sales 1000 or More”.
As shown in the example above, when using the prompt feature, keeping the following points in mind when writing prompts will help you get results that are more aligned with your desired processing:
- Express in a simple sentence.
- Use specific column names: Include the name of the column you want to process in the prompt.
Calculating and Aggregating by Group
Aggregation
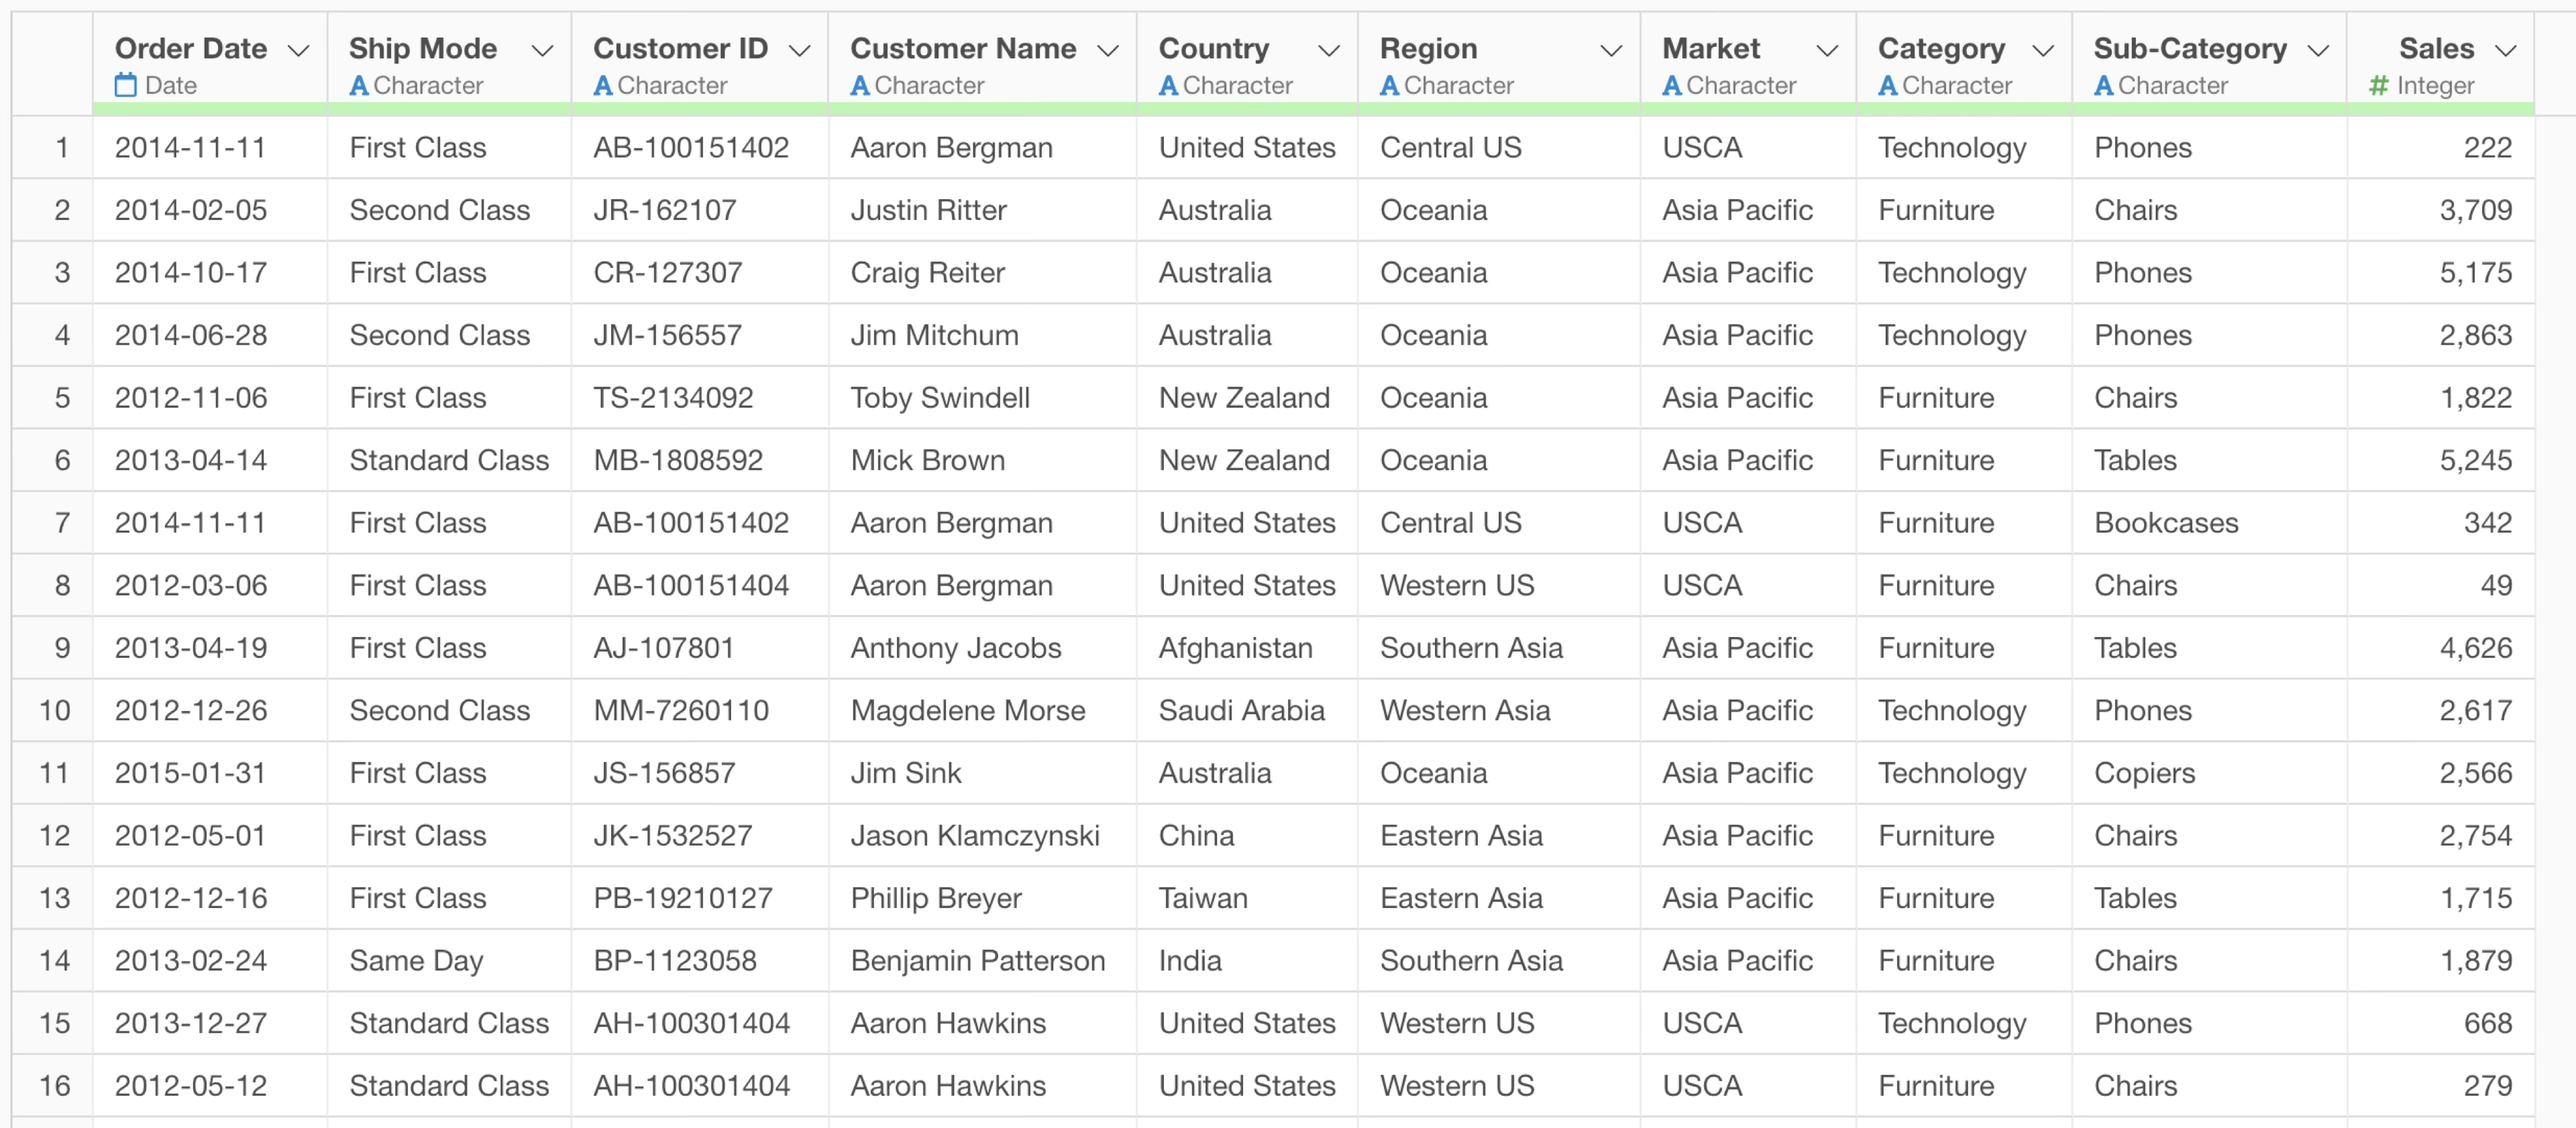
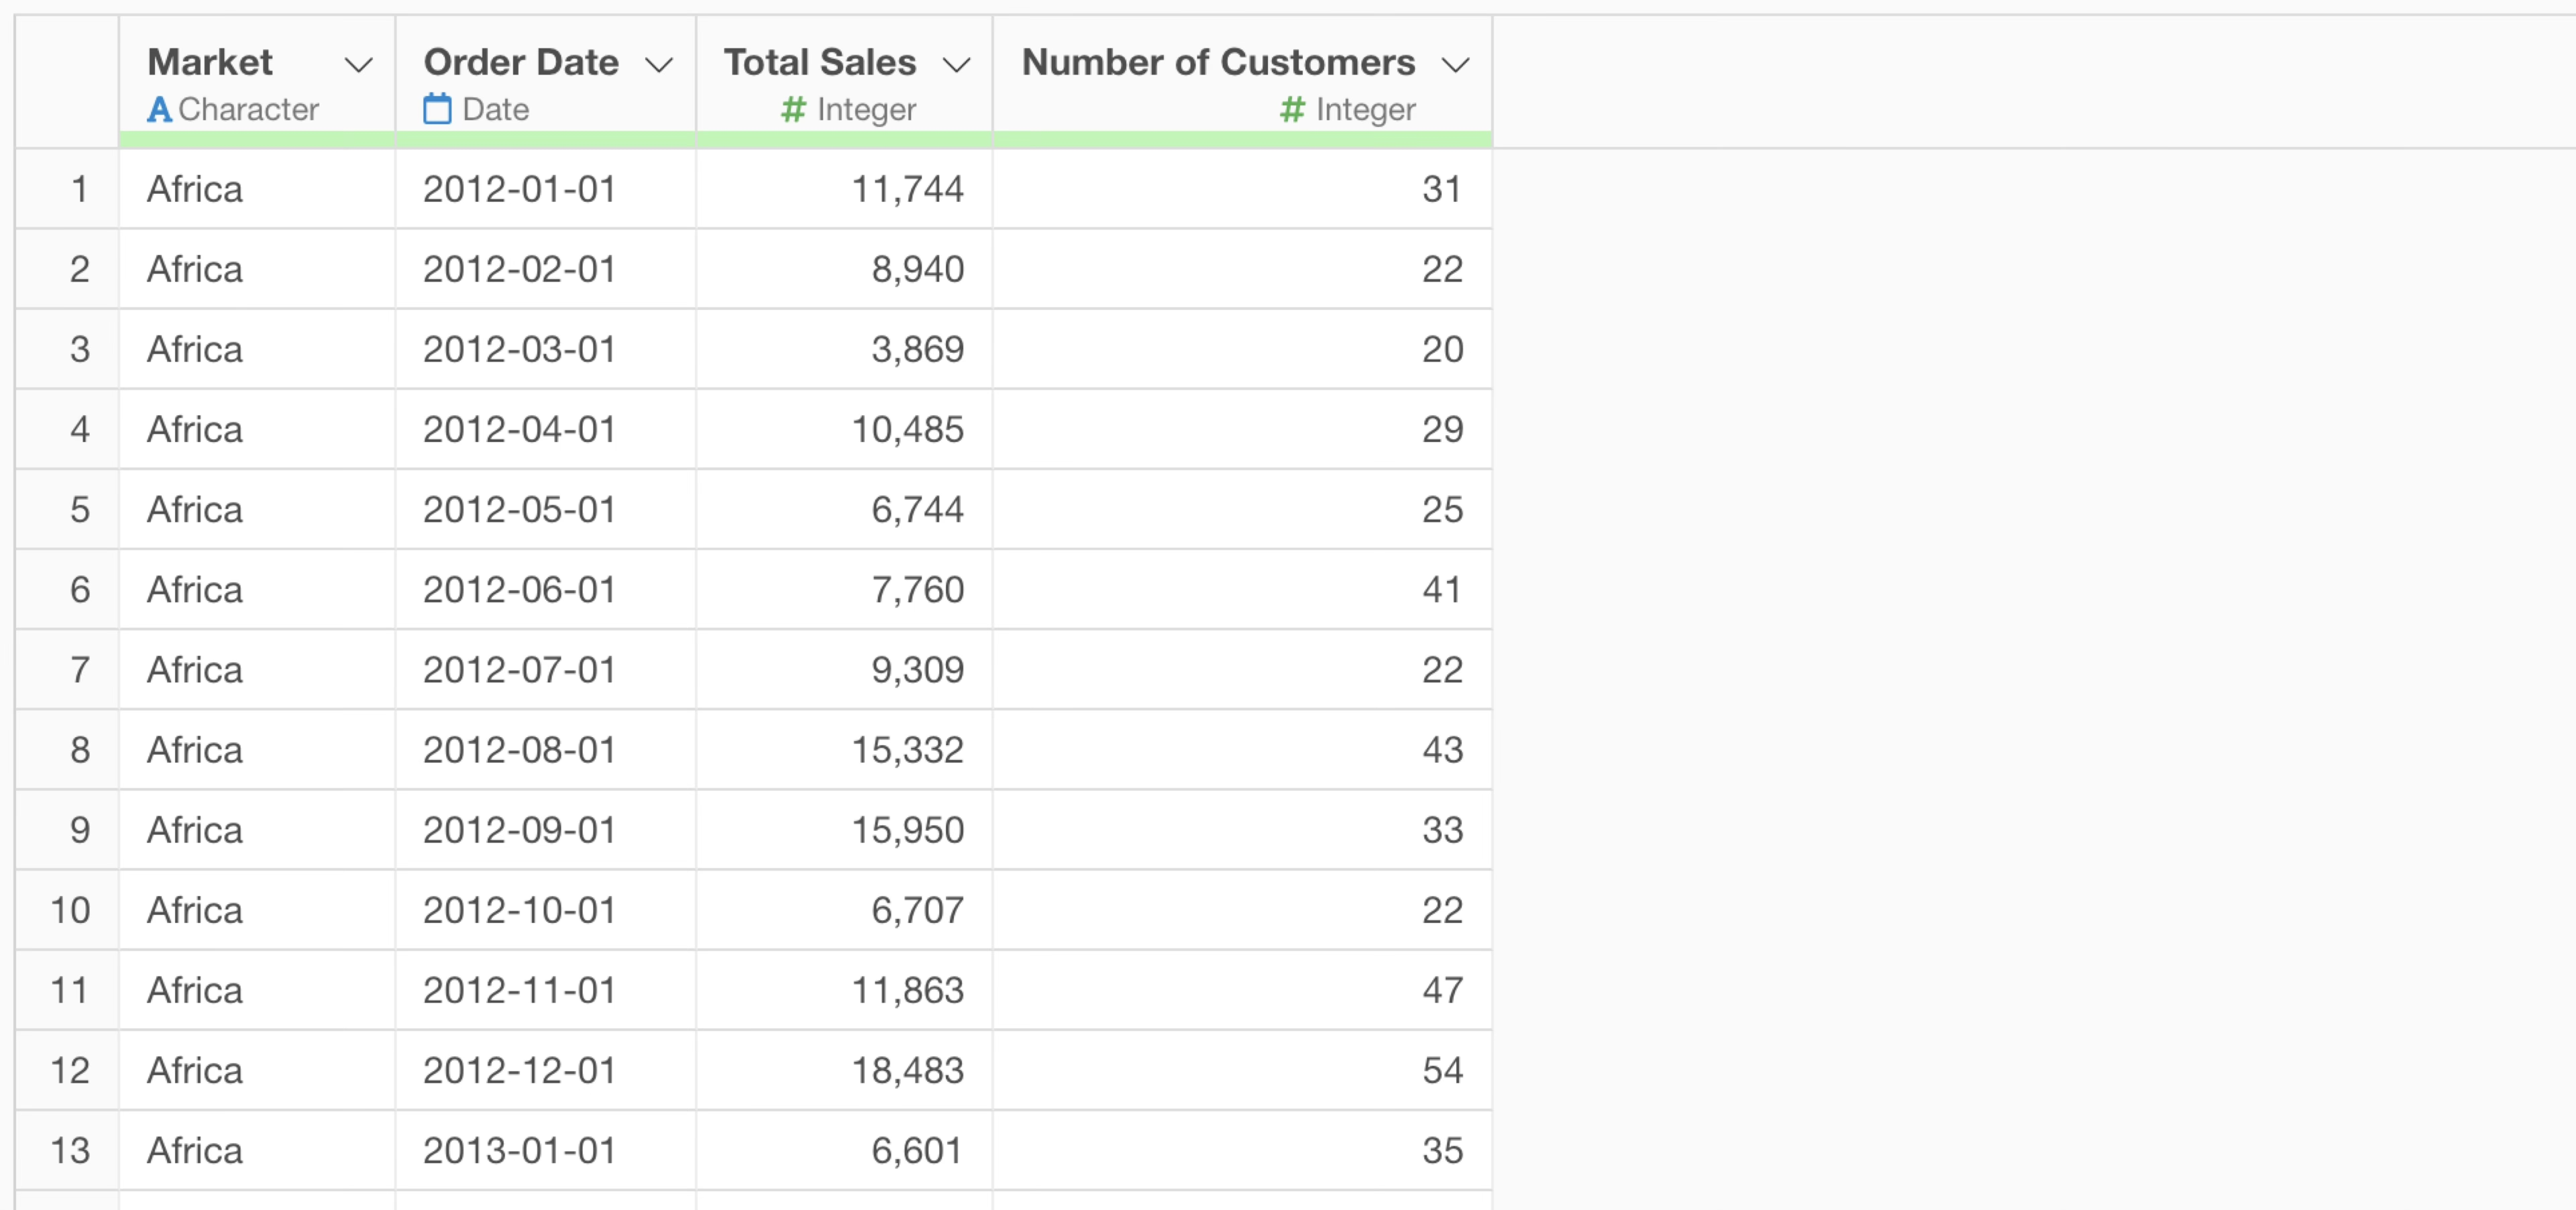
We will use sales data where each row represents one purchased item.
Suppose you instructed the prompt to aggregate the number of customers and total sales as follows:
Summarize the number of the customers and the Sales.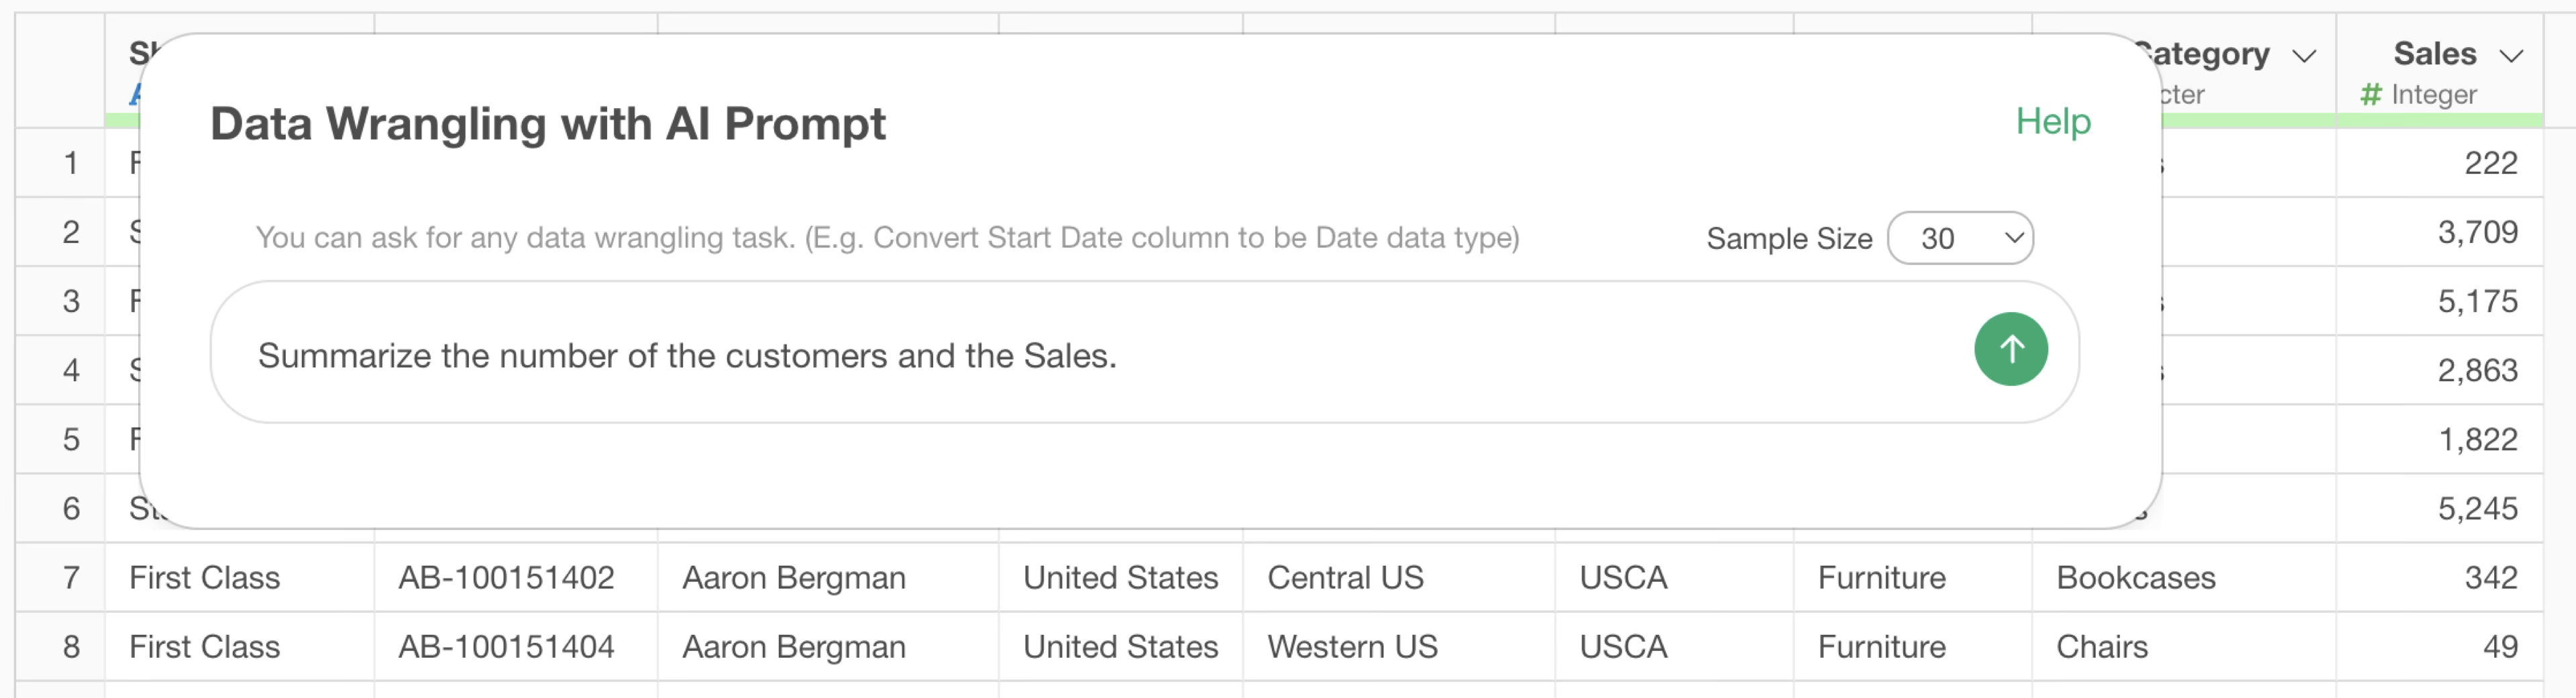
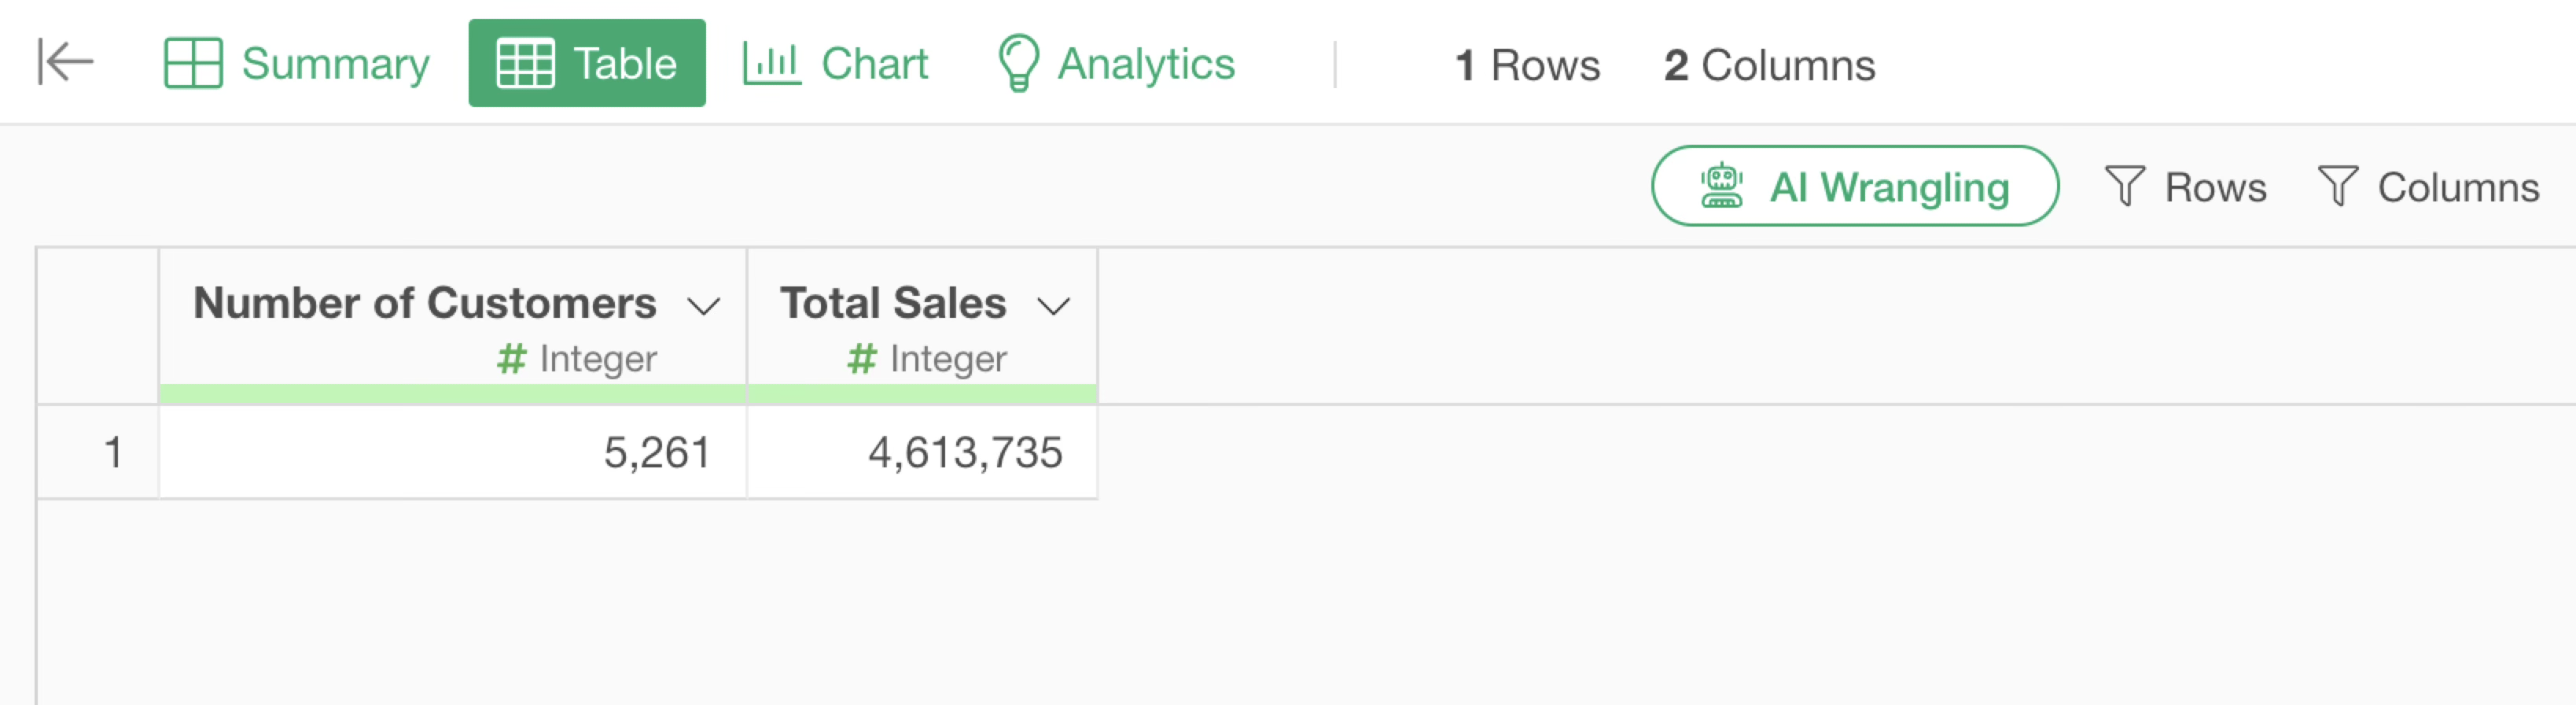
In this case, since no unit of execution is specified, the overall result may be returned.
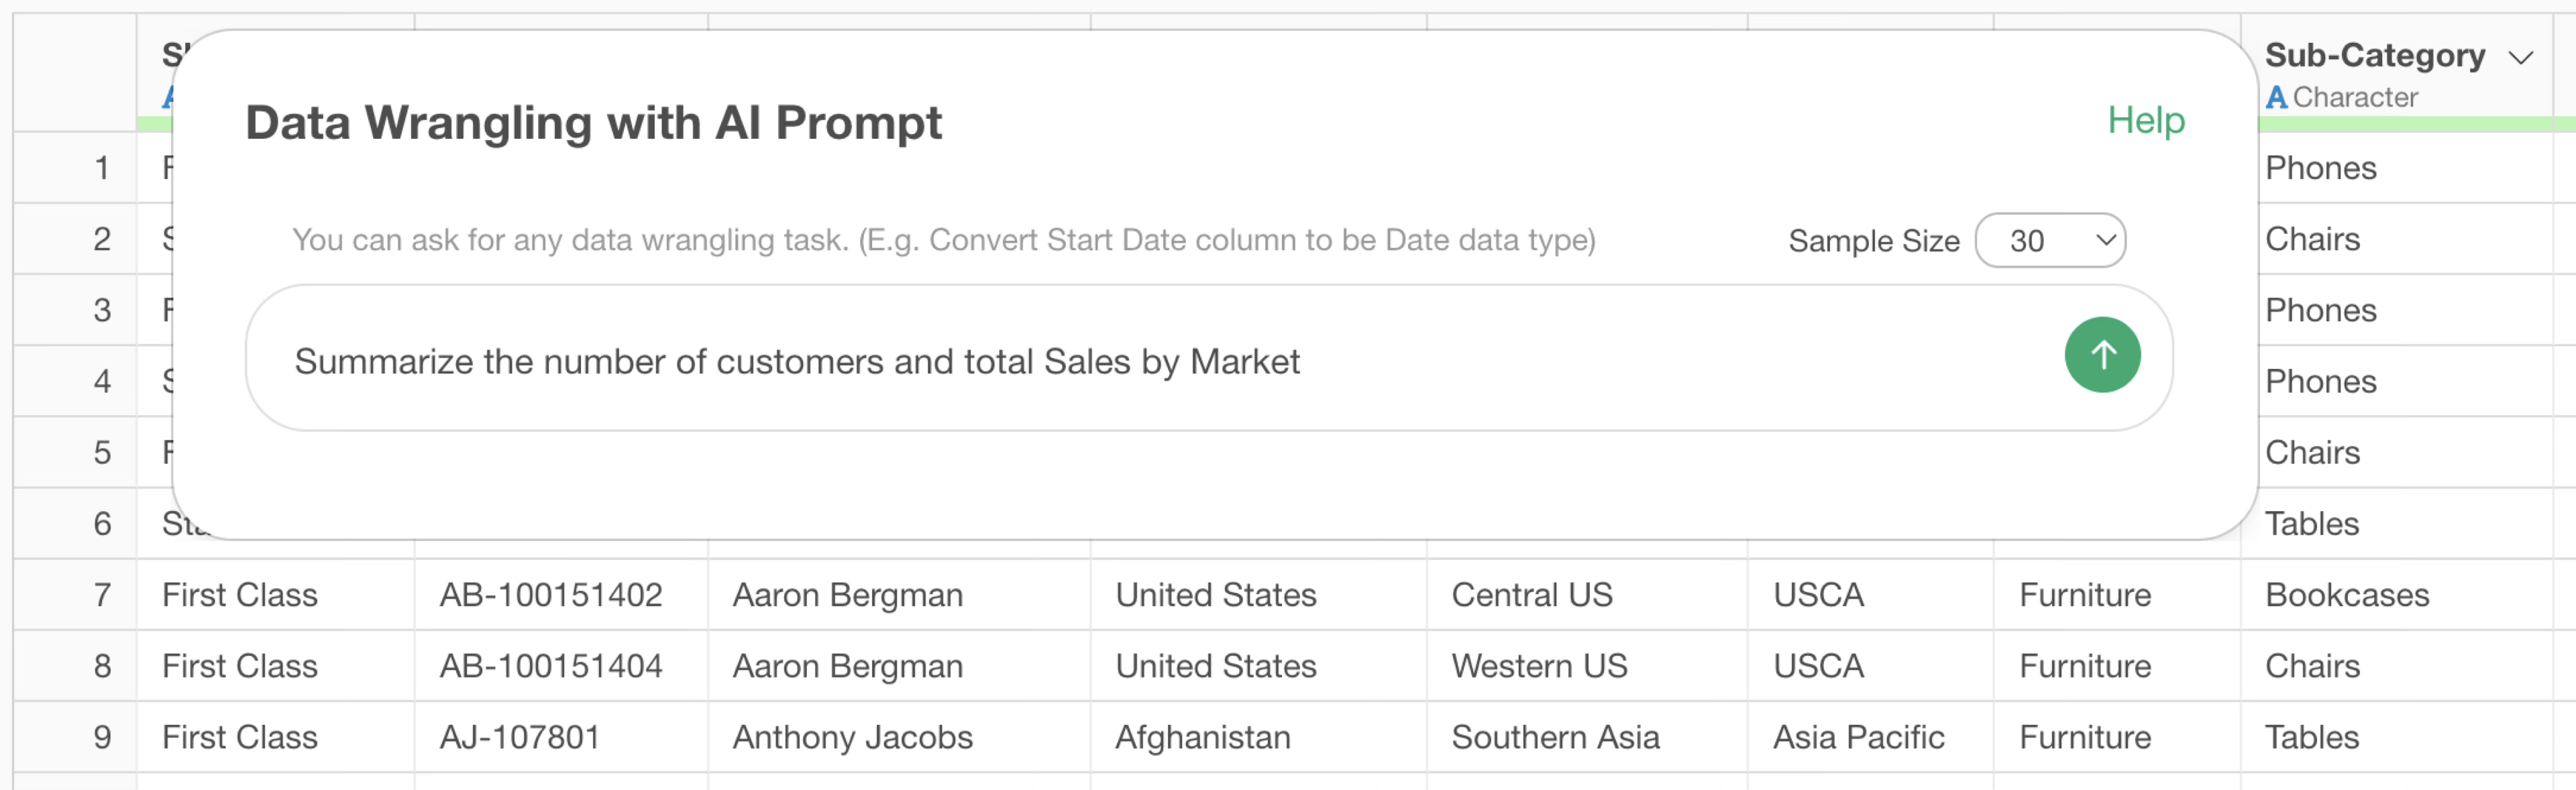
Since this data has a “Market” column with values such as Asia and Africa, we want to find the number of customers and total sales for each market.

When you want to group by for aggregation or calculation, add “for each group” to the beginning of the prompt. You can use either “by”.
Summarize the number of customers and total Sales by MarketSo change the former prompt to “Summarize the number of customers and total Sales by Market”
This shows that when aggregating, it uses the group_by
function for grouping and aggregates the number of customers and sales
for each market.
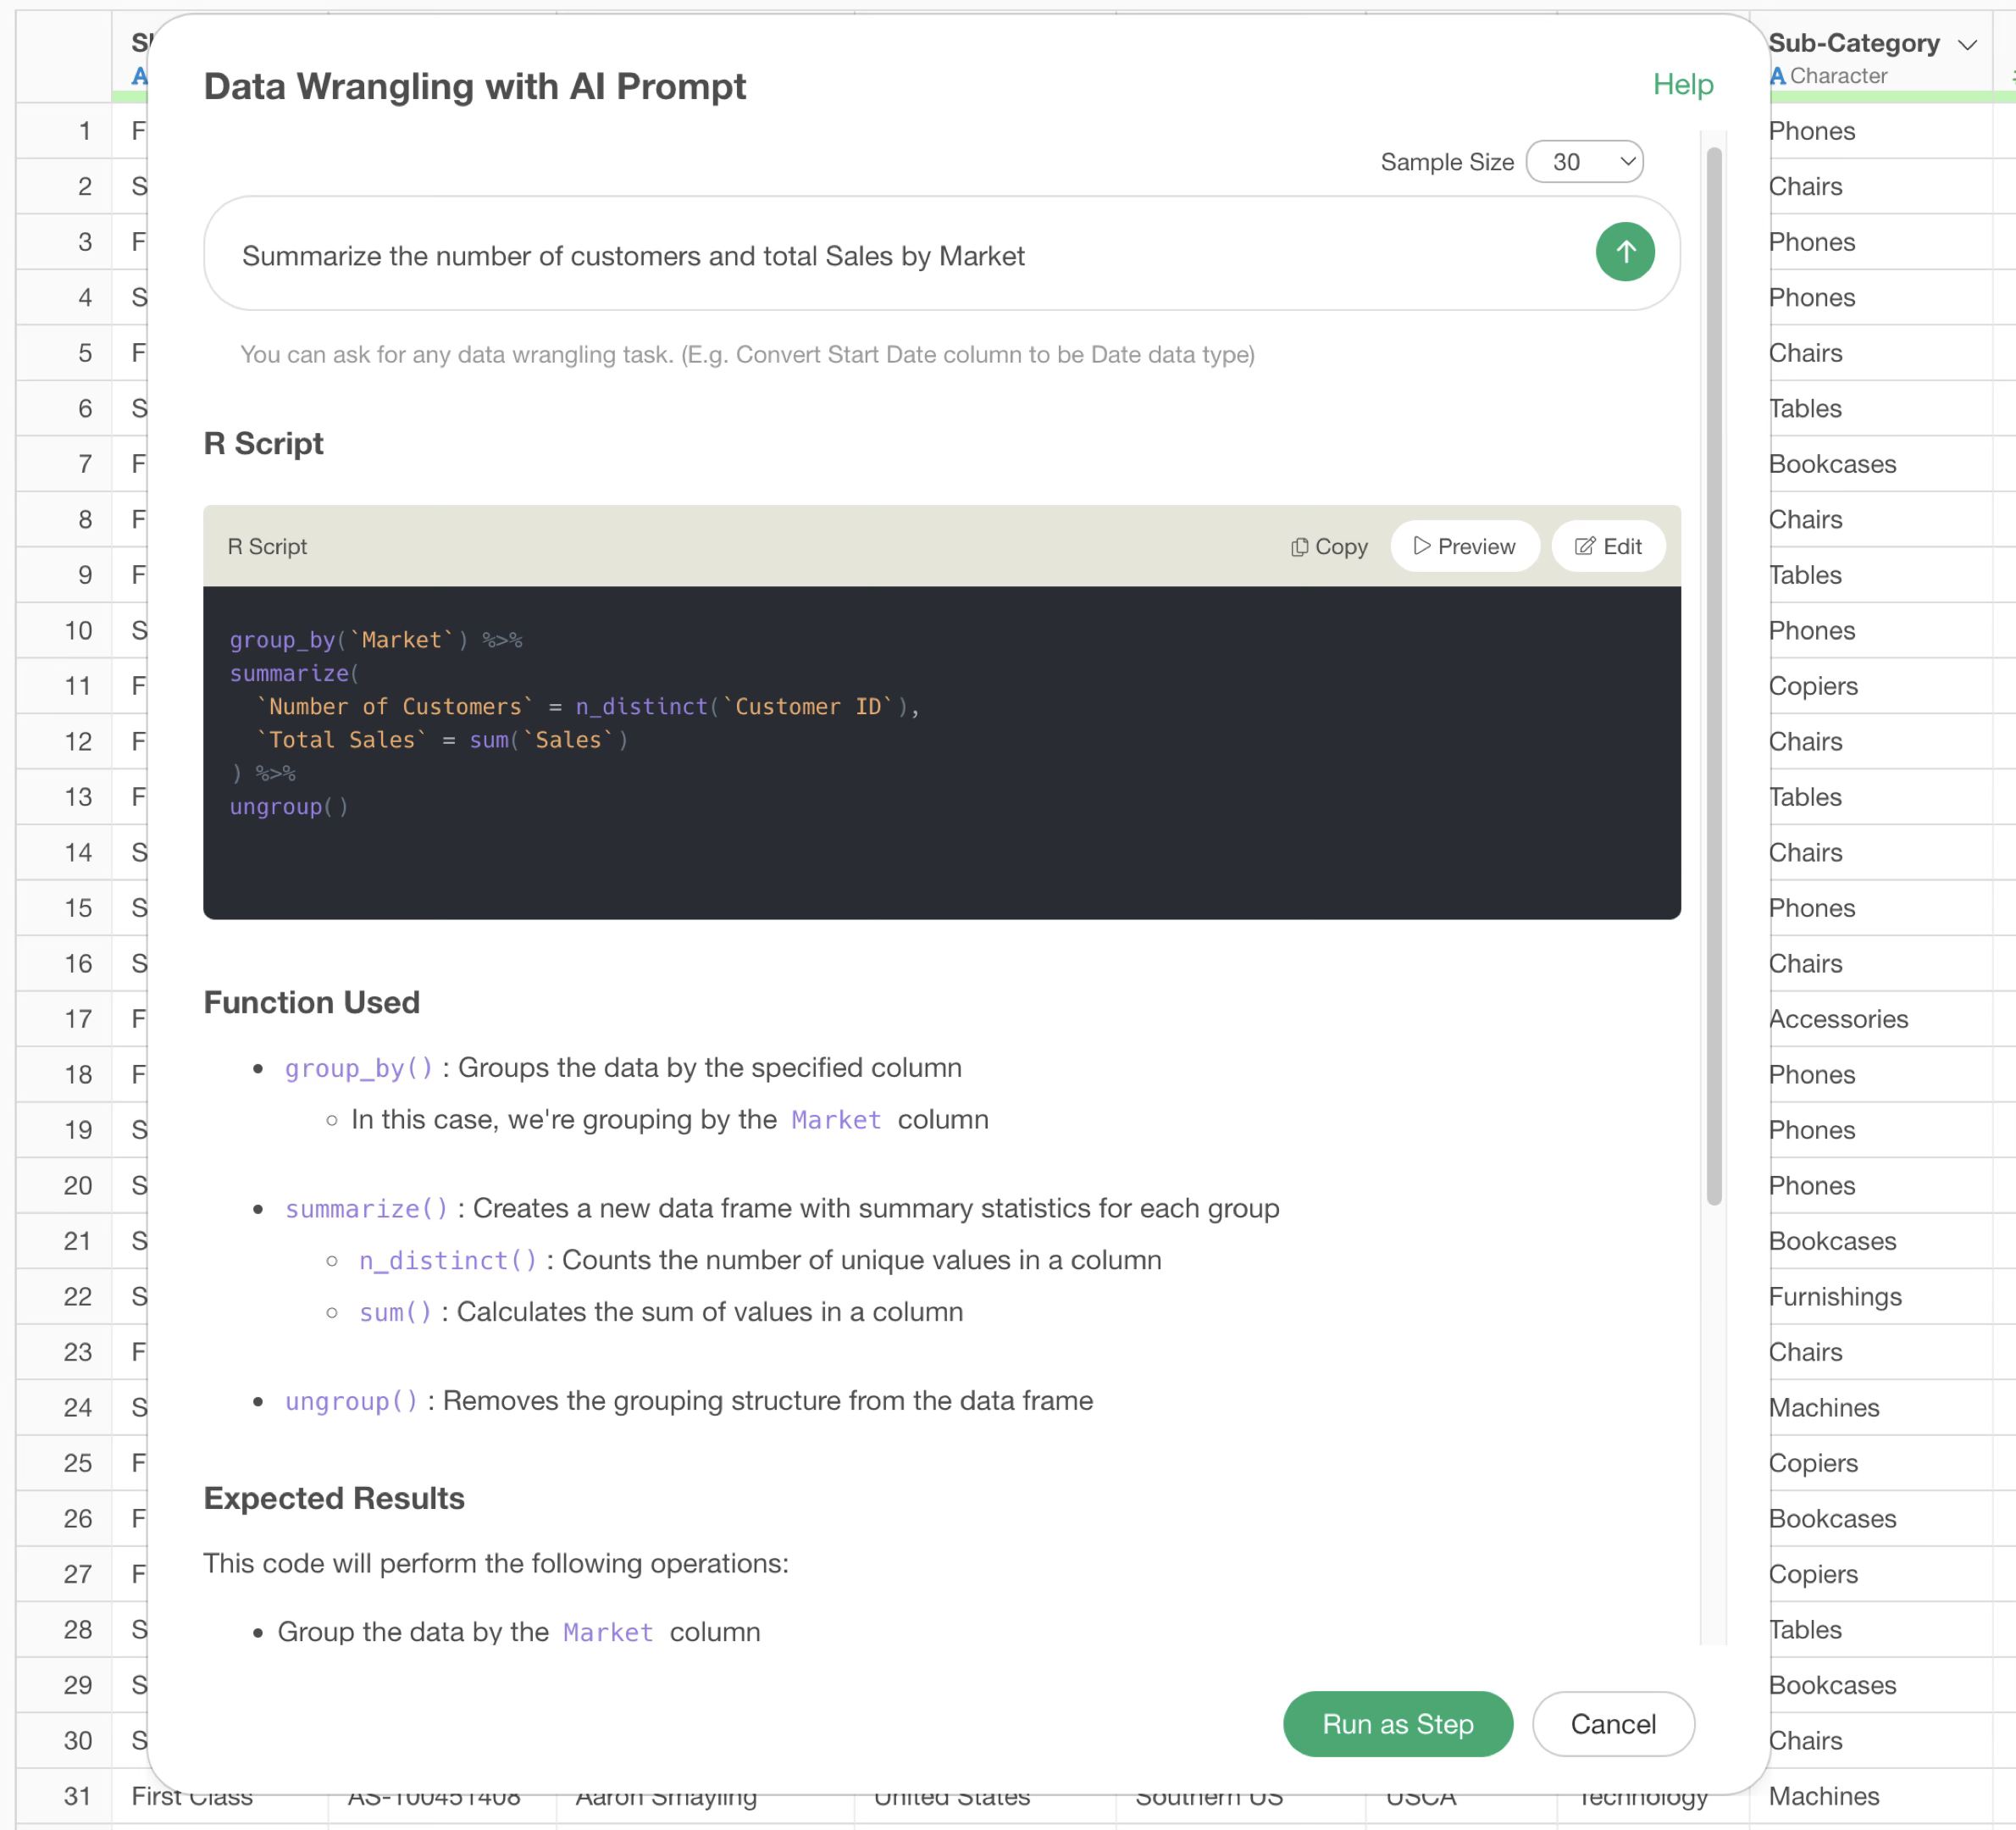
By executing it as a step, you can confirm that the number of customers and sales have been aggregated for each market.

You can specify multiple groups. For example, if you want to aggregate by “month” and “market”, you would specify the prompt as follows:
Summarize the number of customers and total sales by month and market.
Summarize the number of customers and total monthly sales by market.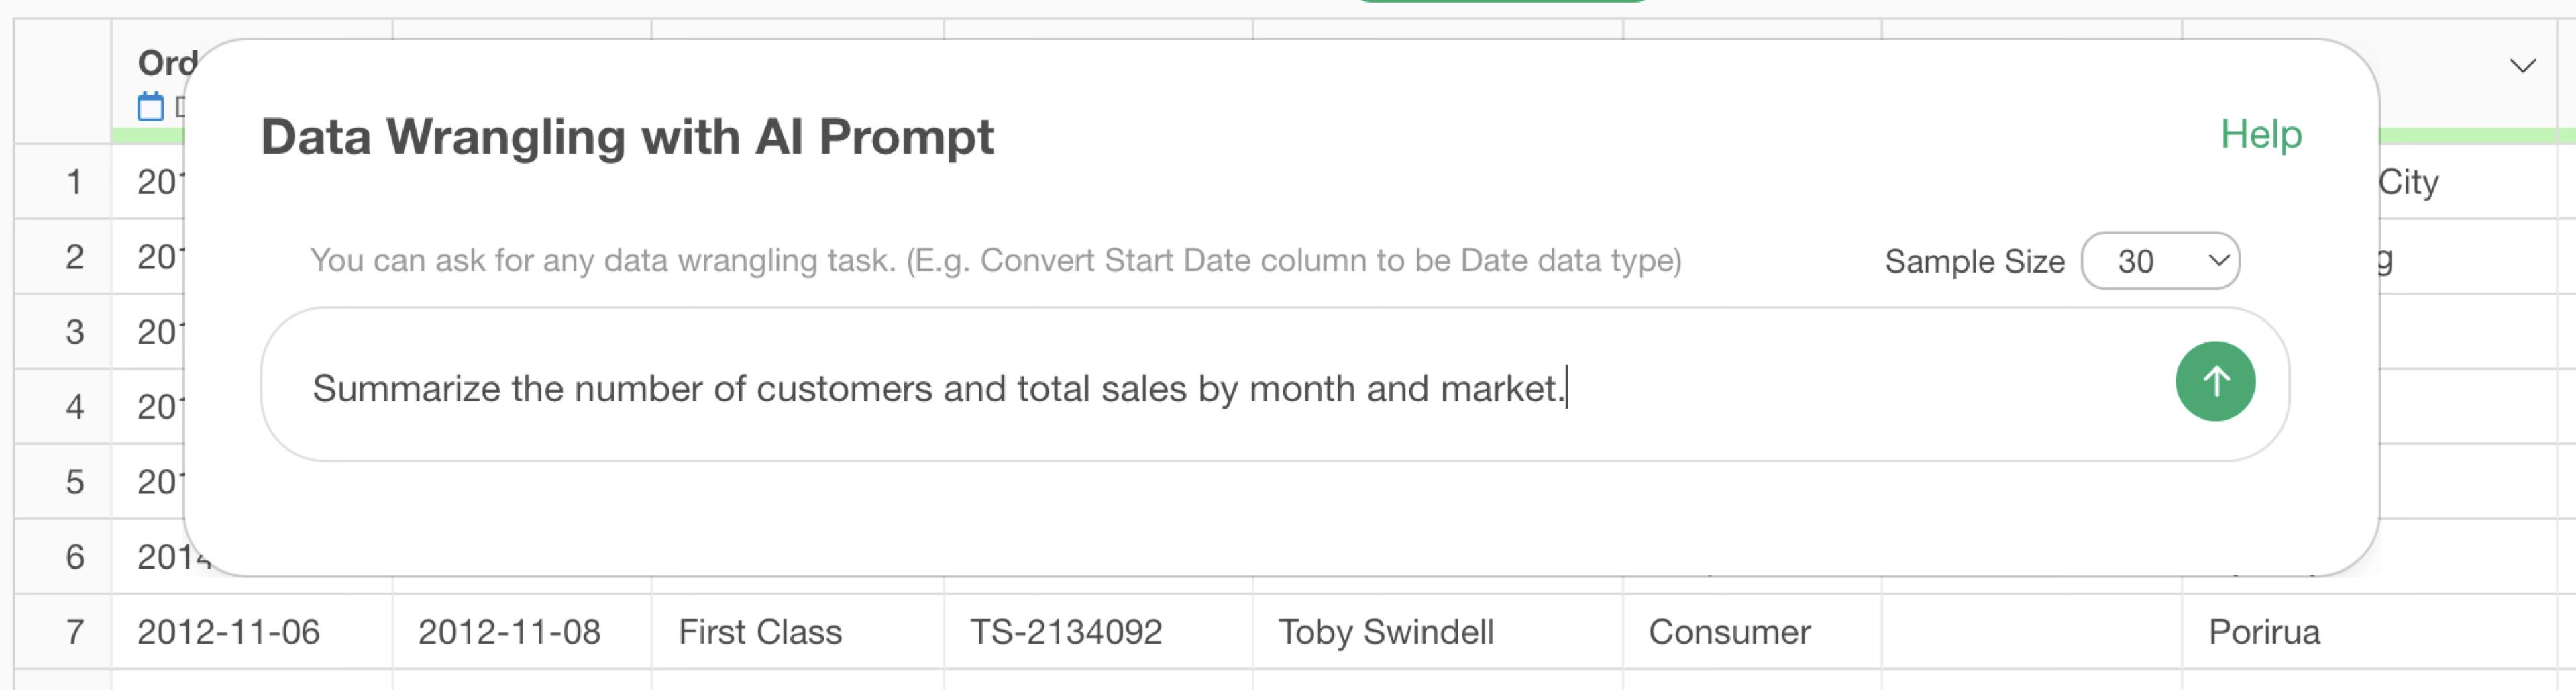
This changes the grouping to use the order date information, aggregating by month and market.
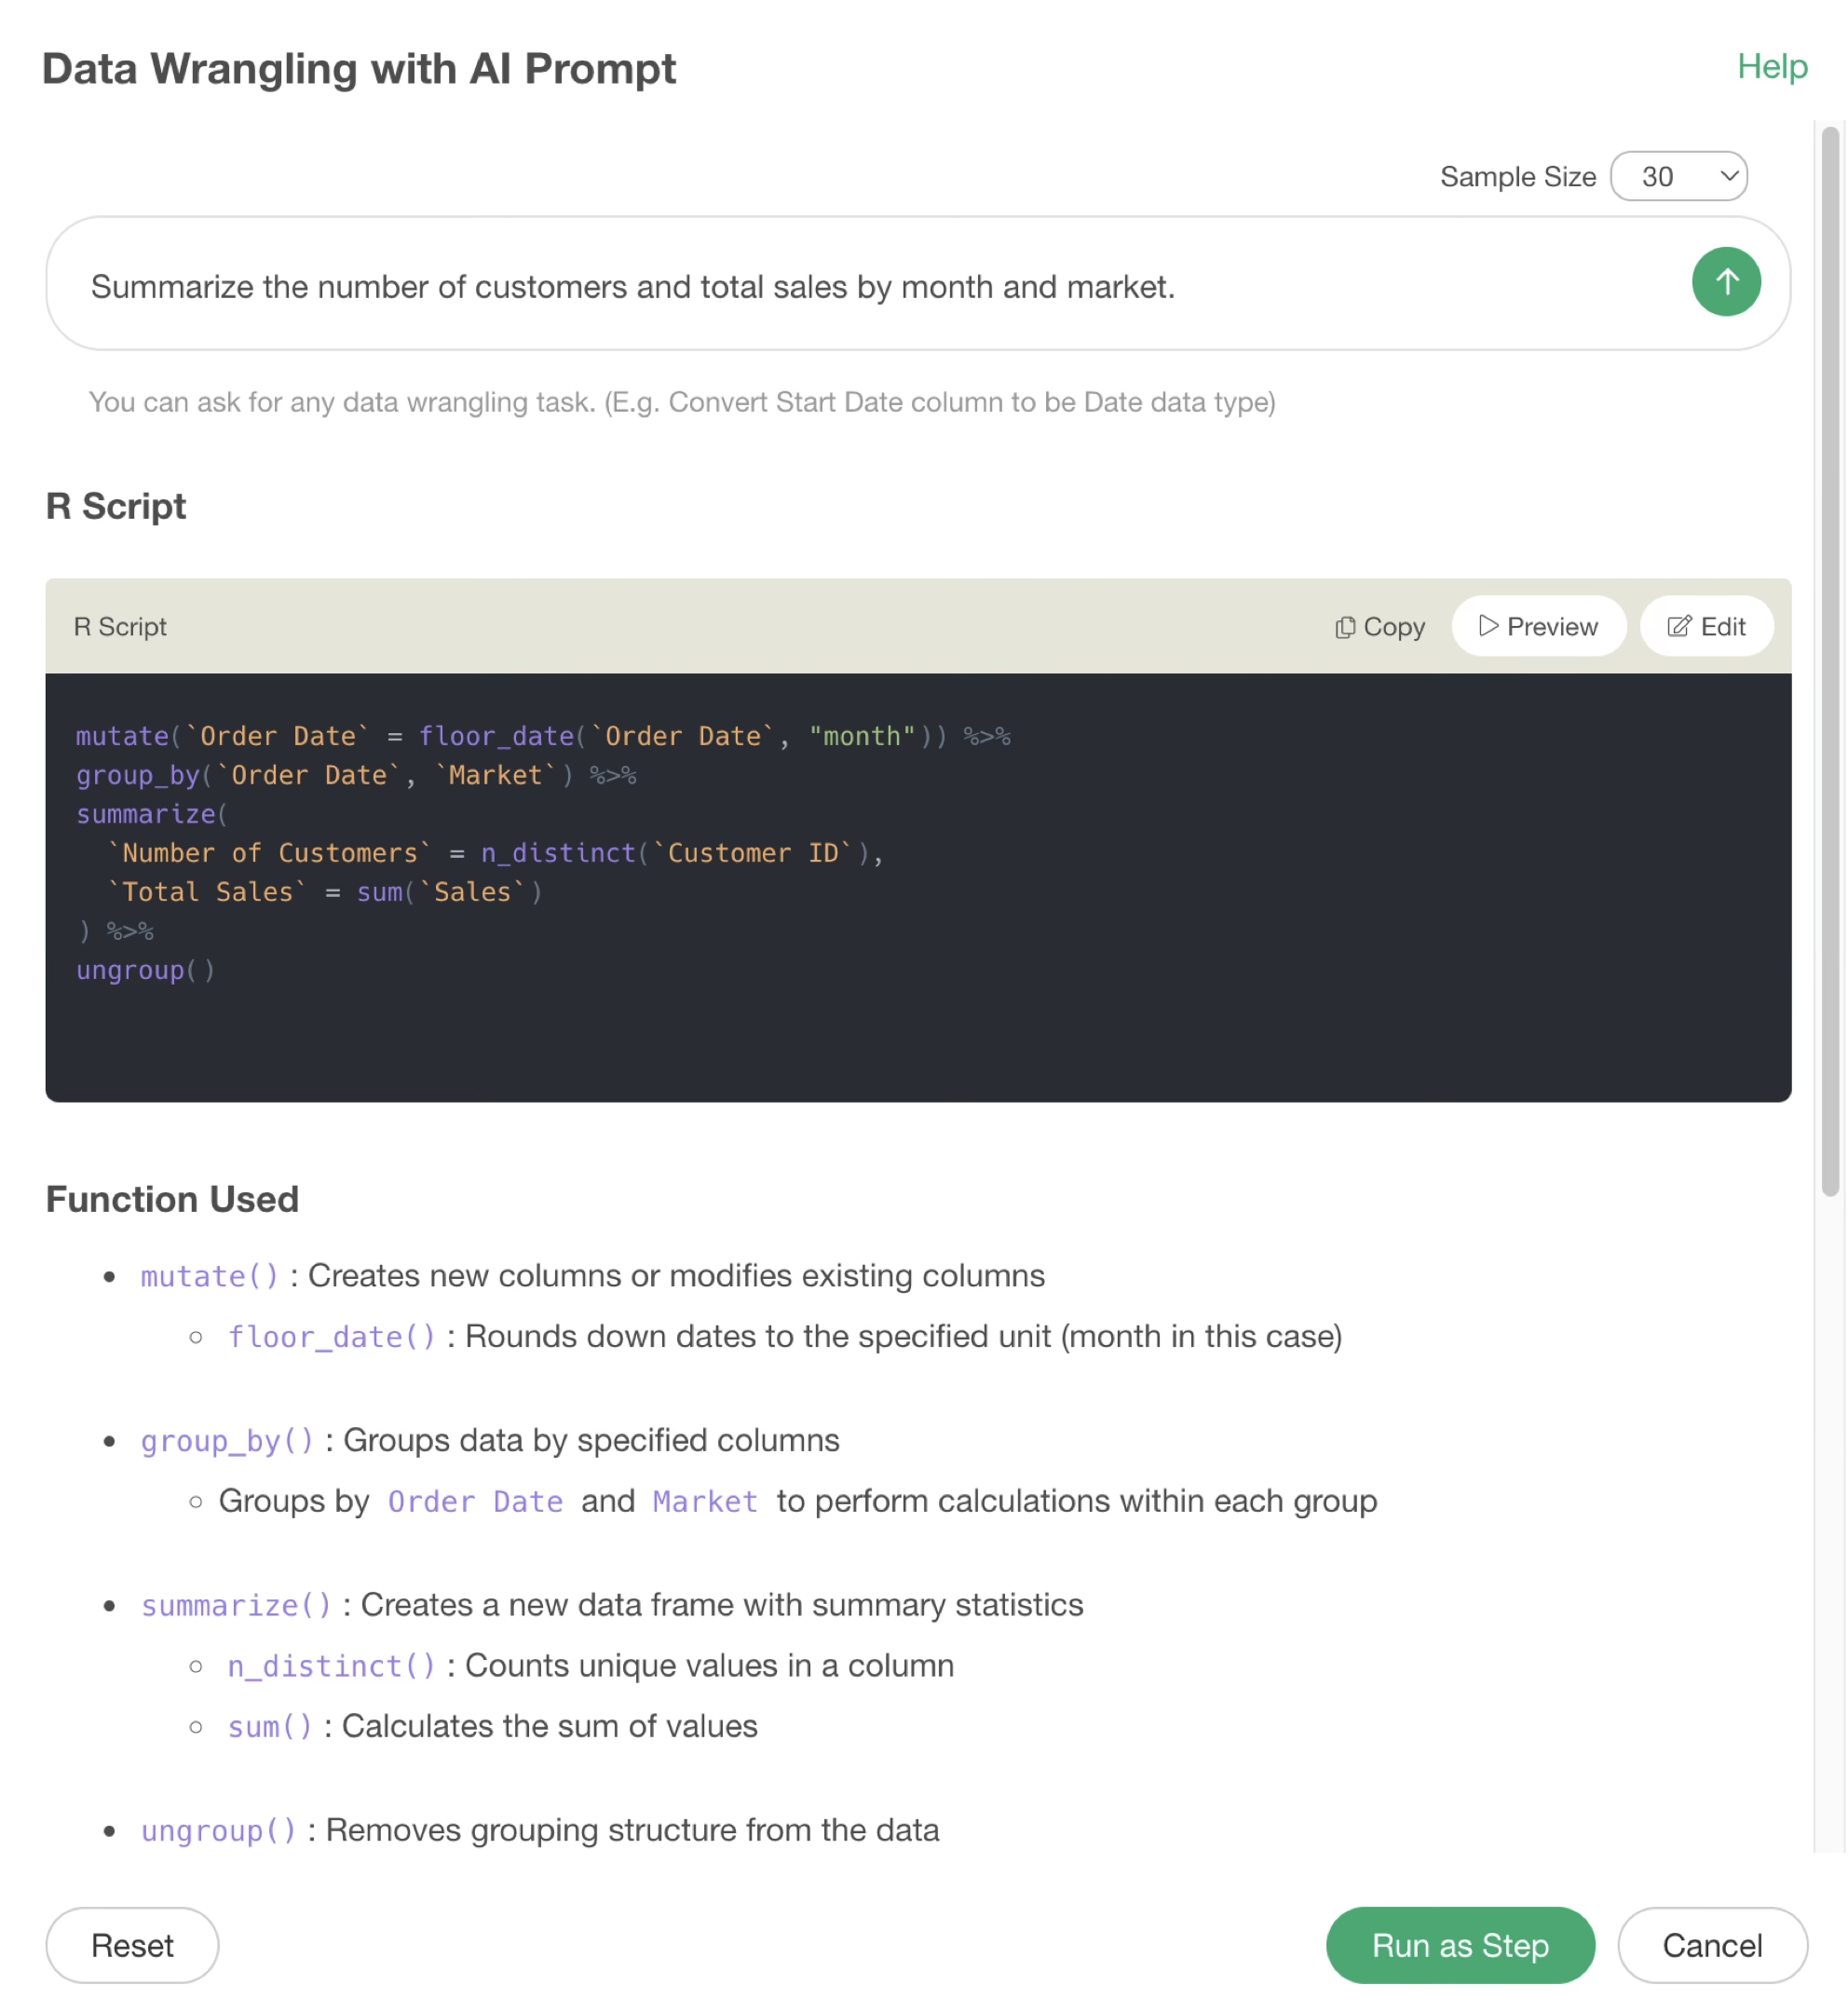
By executing it as a step, you can confirm that the number of customers and sales have been aggregated by month and by market.
Calculation
What we have introduced so far is data aggregation processing.
However, there are times when you want to add a column that calculates the number of employees (number of rows) for each department, rather than aggregating data where each row represents one employee, as shown below.
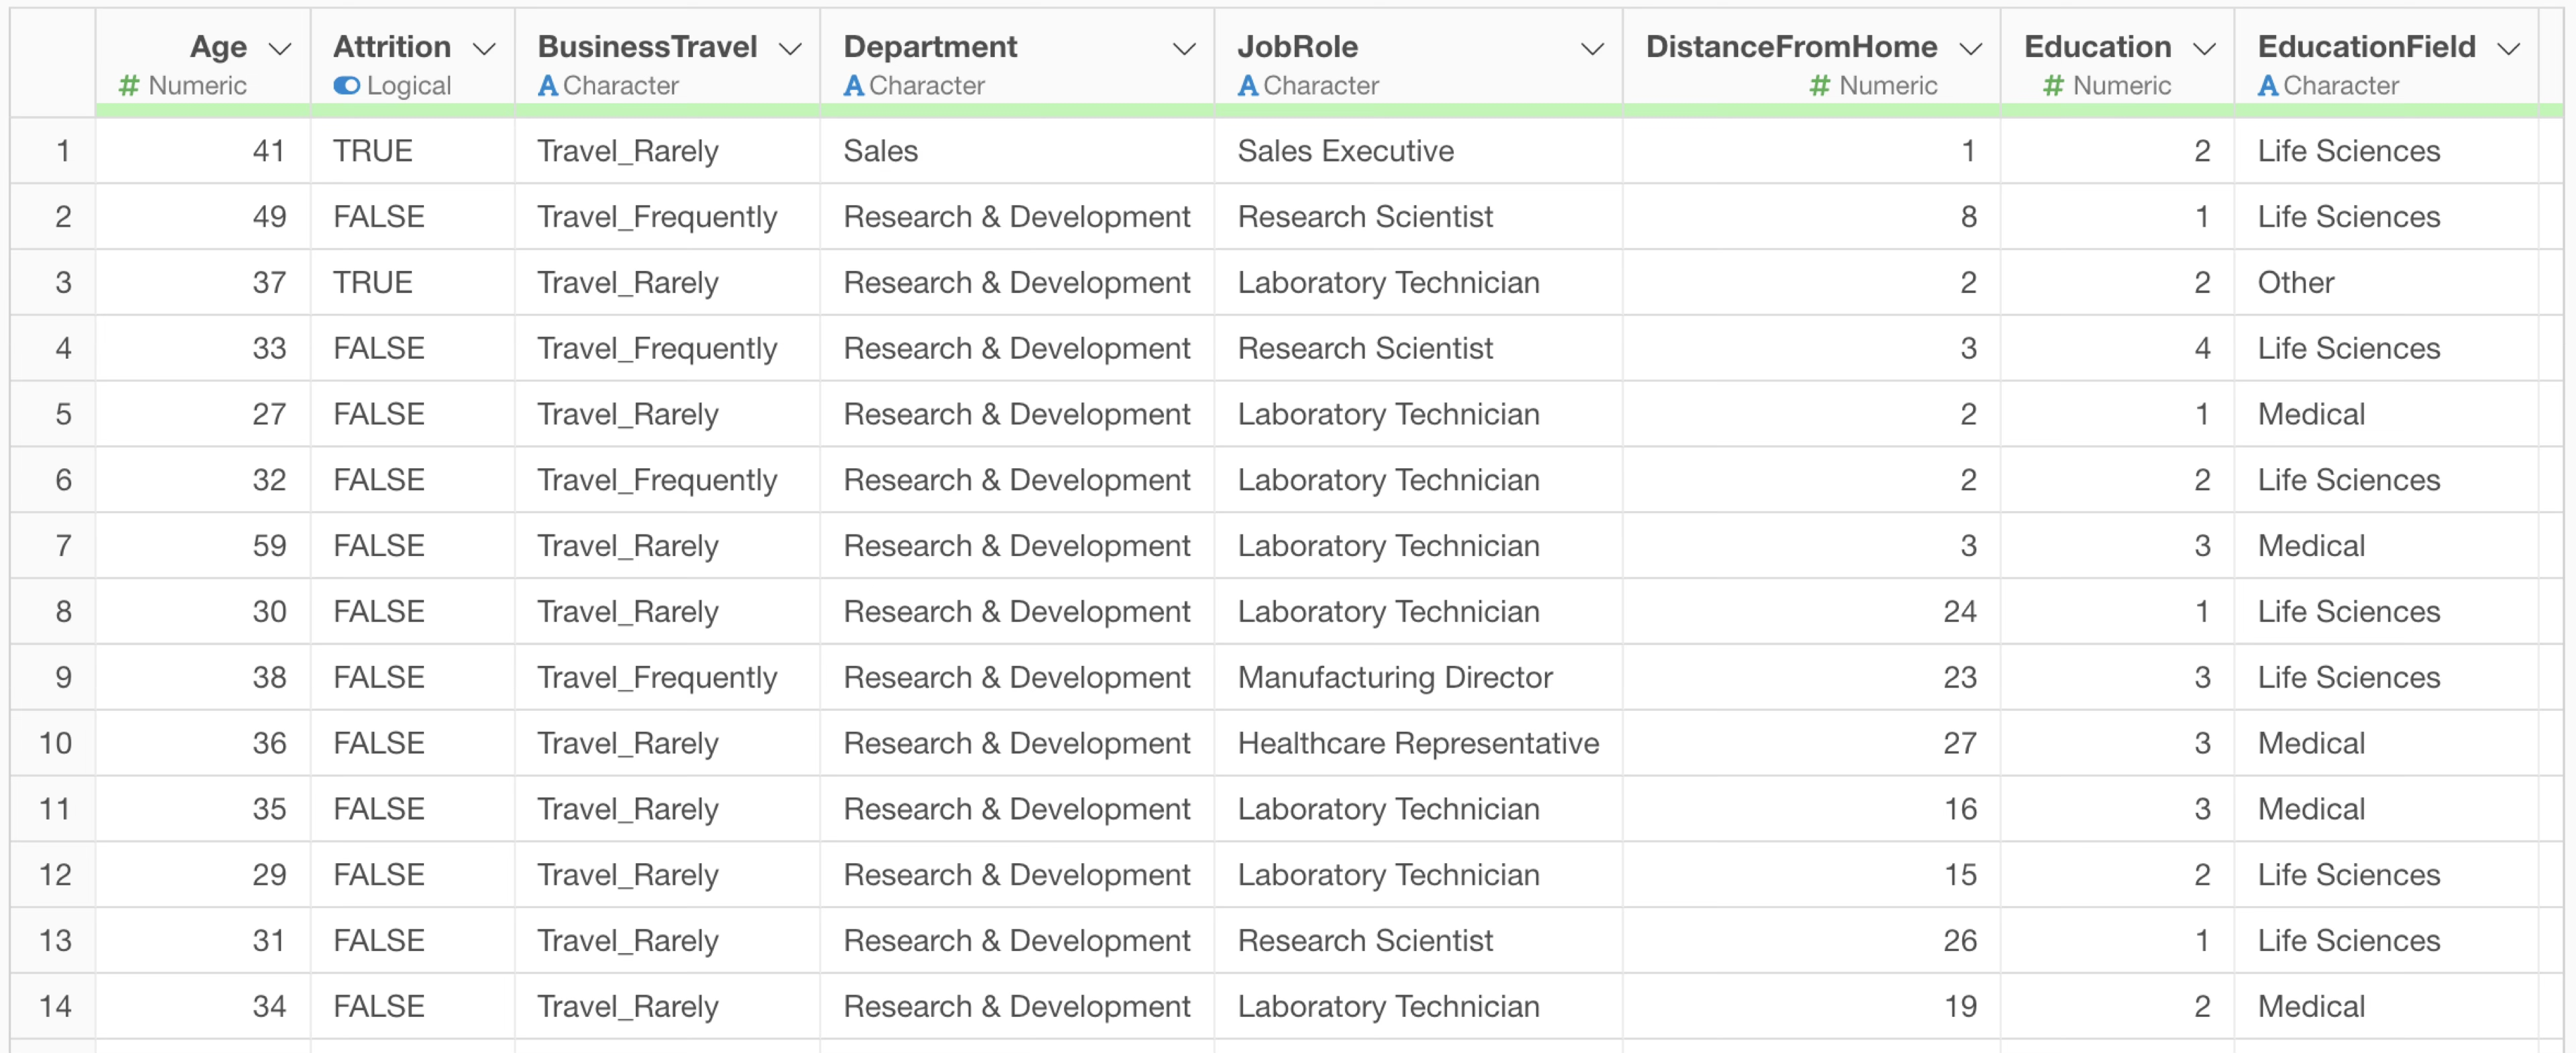
In such cases, to prevent the AI from unintentionally generating aggregation code, you can write a prompt that adds the calculated result as a column, as shown below.
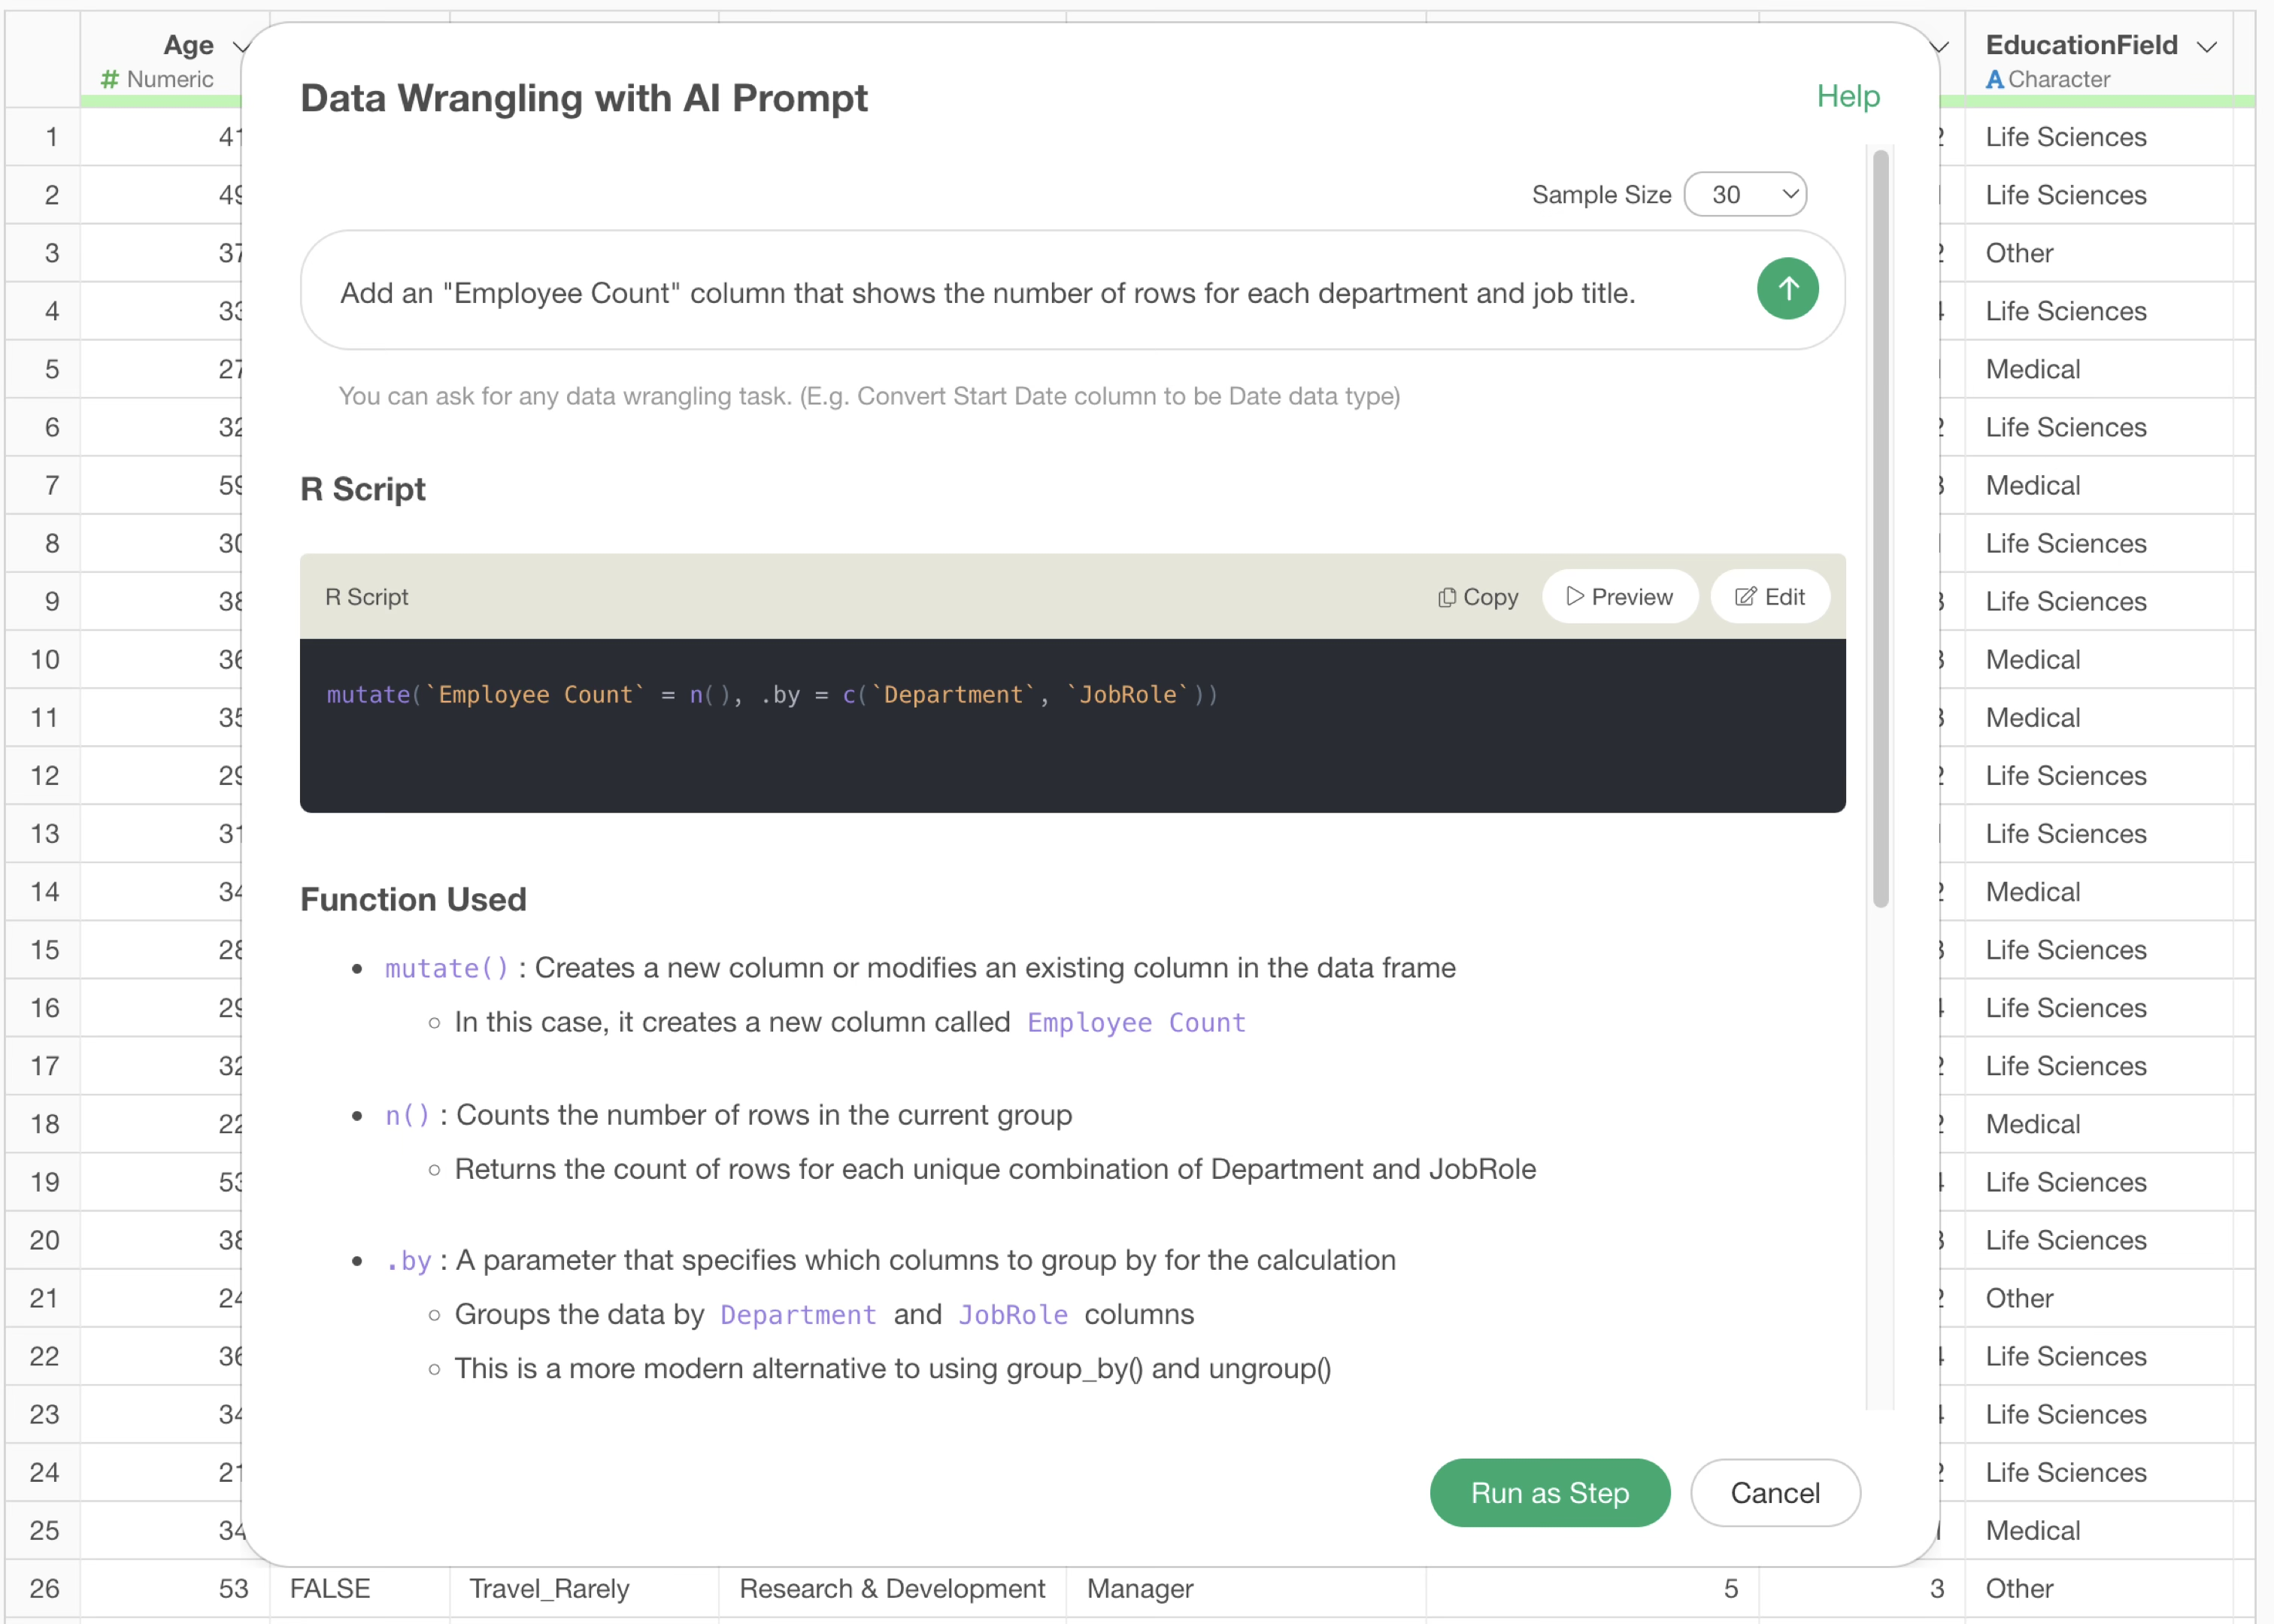
Add an Employee Count column that shows the number of rows for each department and job title.
Then, the AI generates code to calculate a column without performing aggregation.
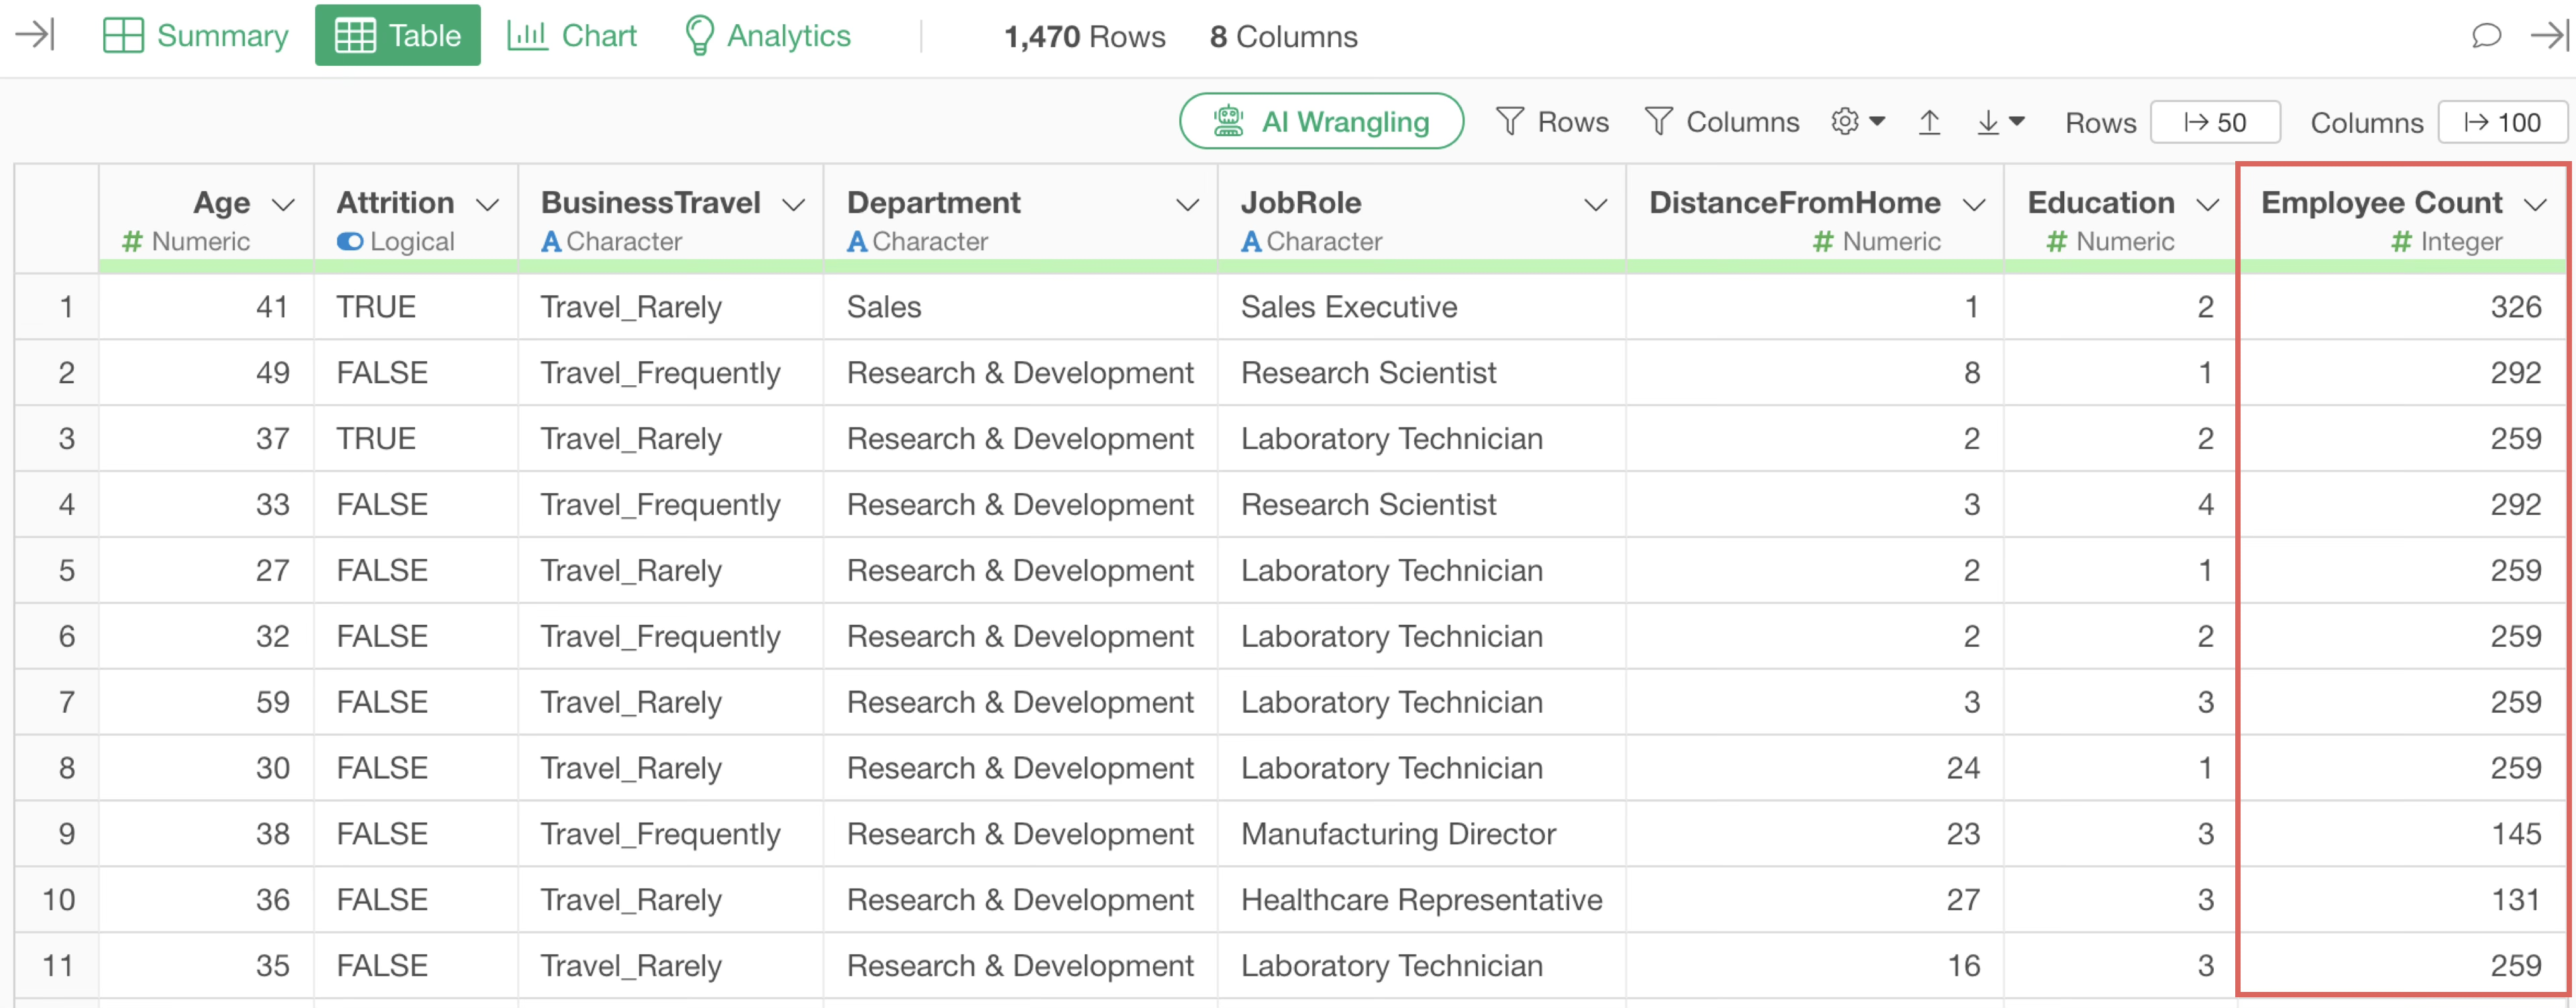
By executing it as a step, you can confirm that the aggregated result has been added as a column.
Tips when calculations fail during aggregation
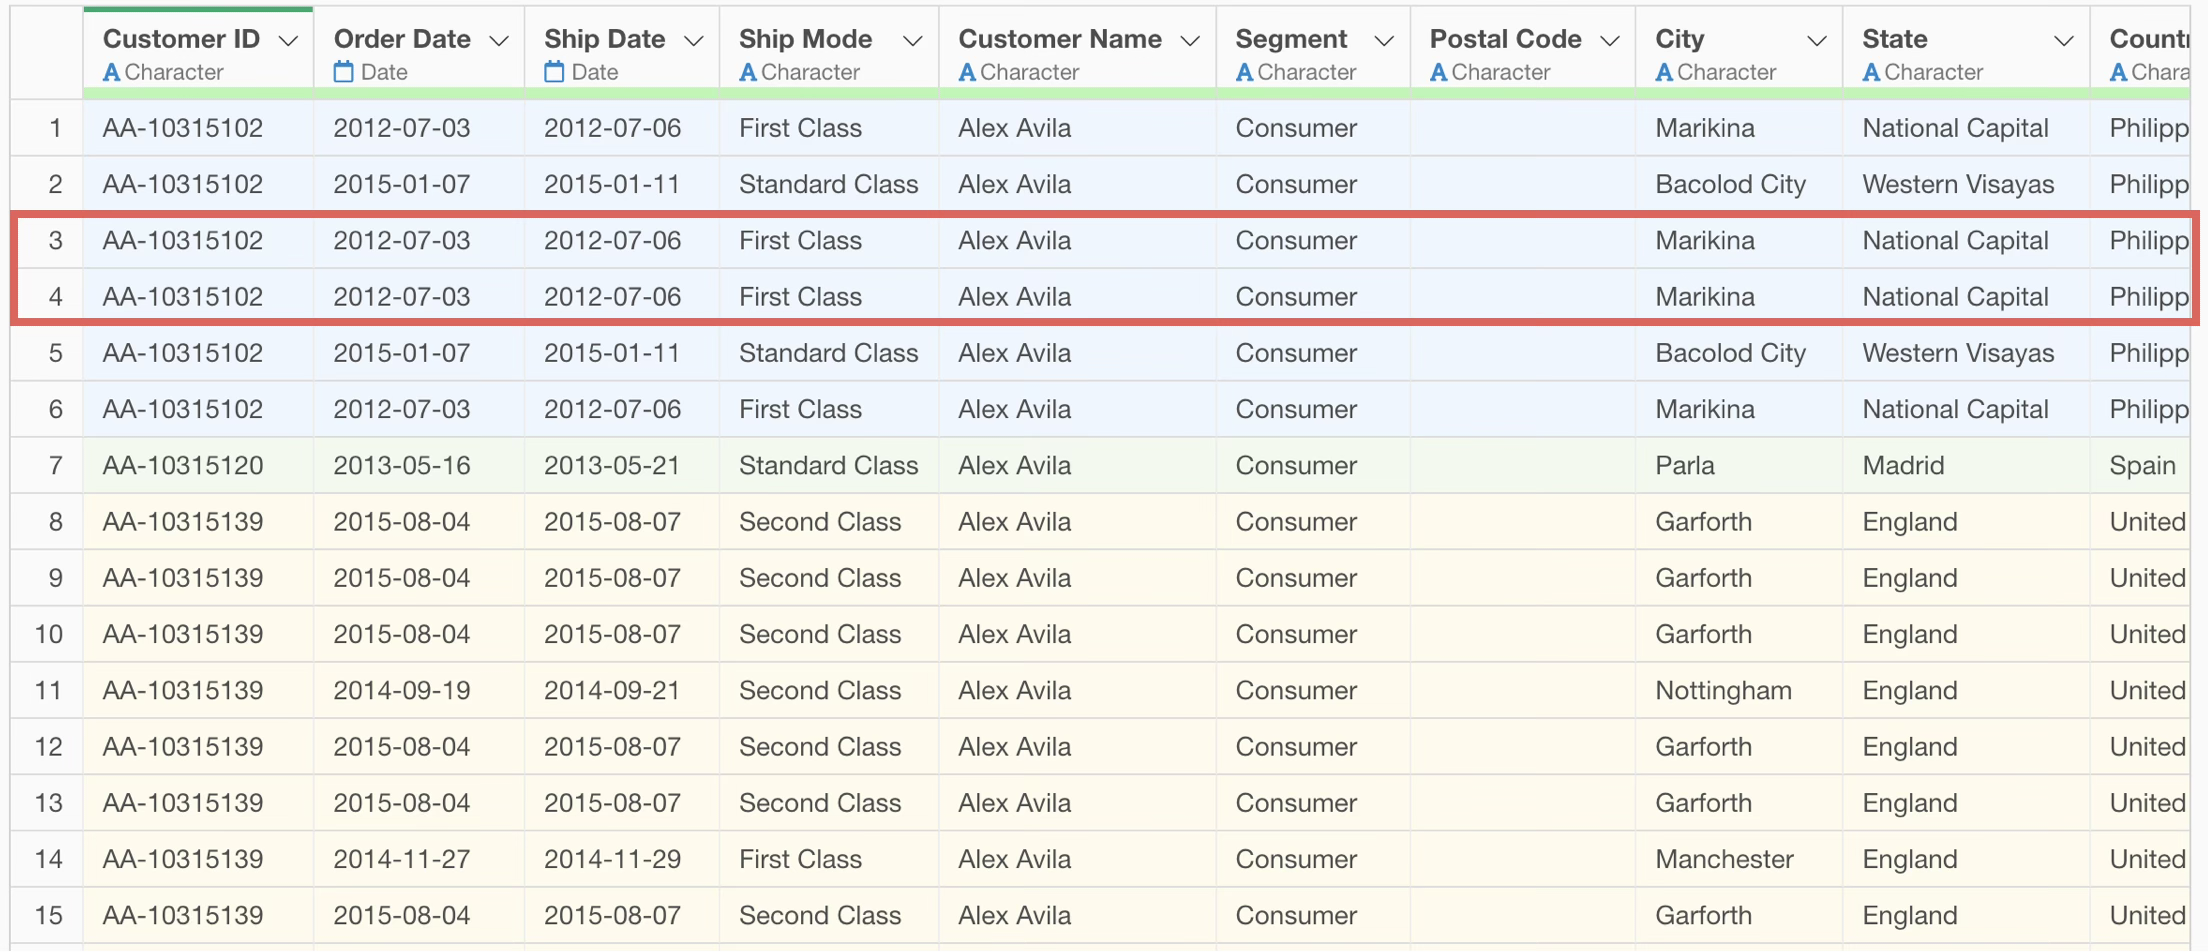
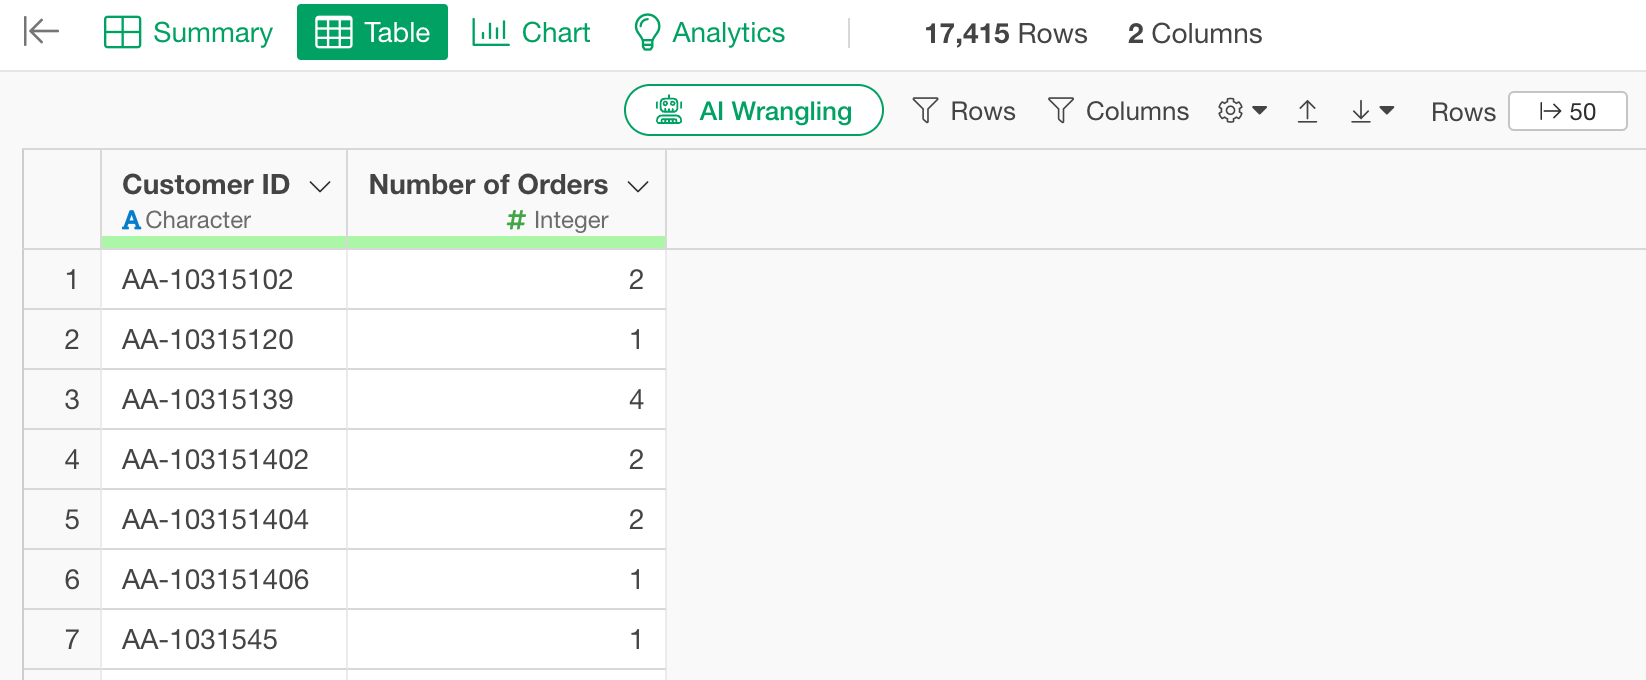
Here, we will explain using e-commerce purchase data where each row represents one purchased item.

For example, suppose you instructed the following prompt to aggregate the number of orders per customer:
Summarize the total number of orders by customer.It is trying to calculate the number of orders per customer, but it is using a function that counts the number of rows.
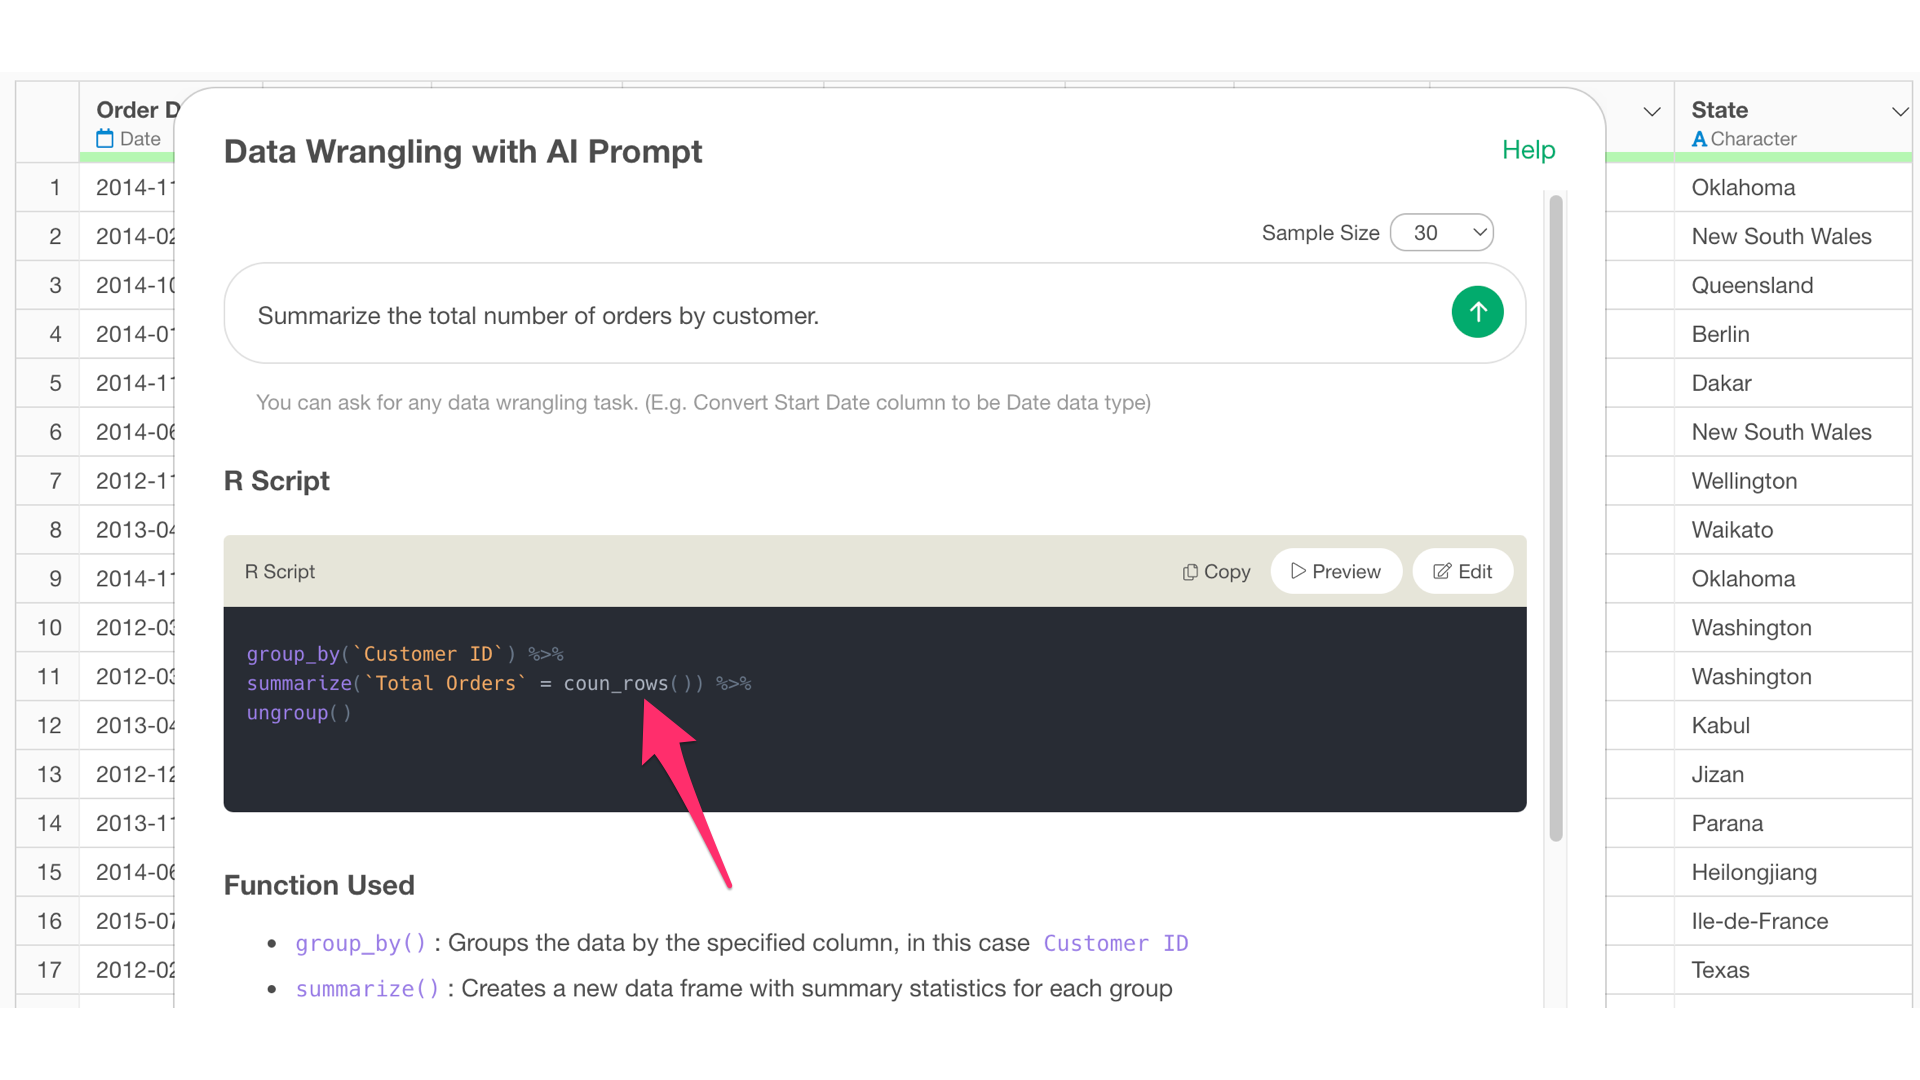
However, each row in this data represents one purchased item, not one order. Therefore, rows are separated by purchased items, and there are as many rows as there are types of items ordered.
Therefore, add the unit of one row of data to the beginning of the prompt.
Using data where each row represents a single item purchased, calculate the number of orders for each customer.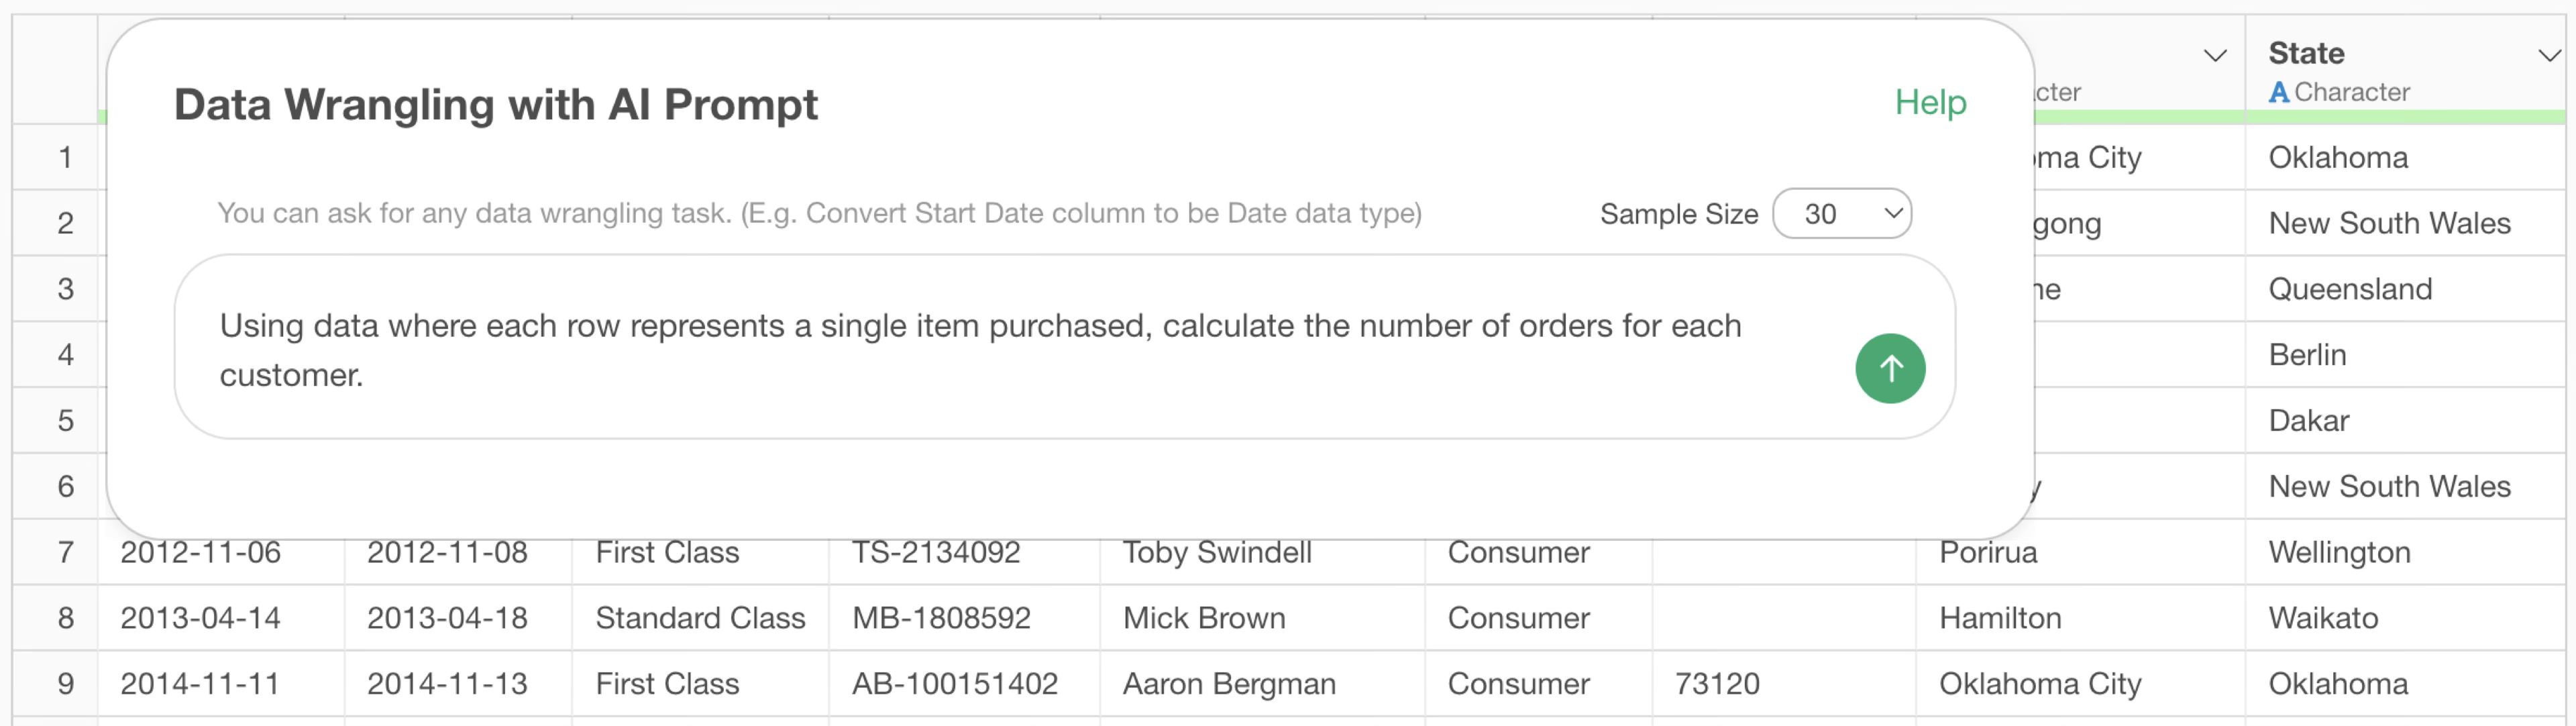
This changes the calculation of the number of orders to use the number of unique order dates instead of the number of rows.
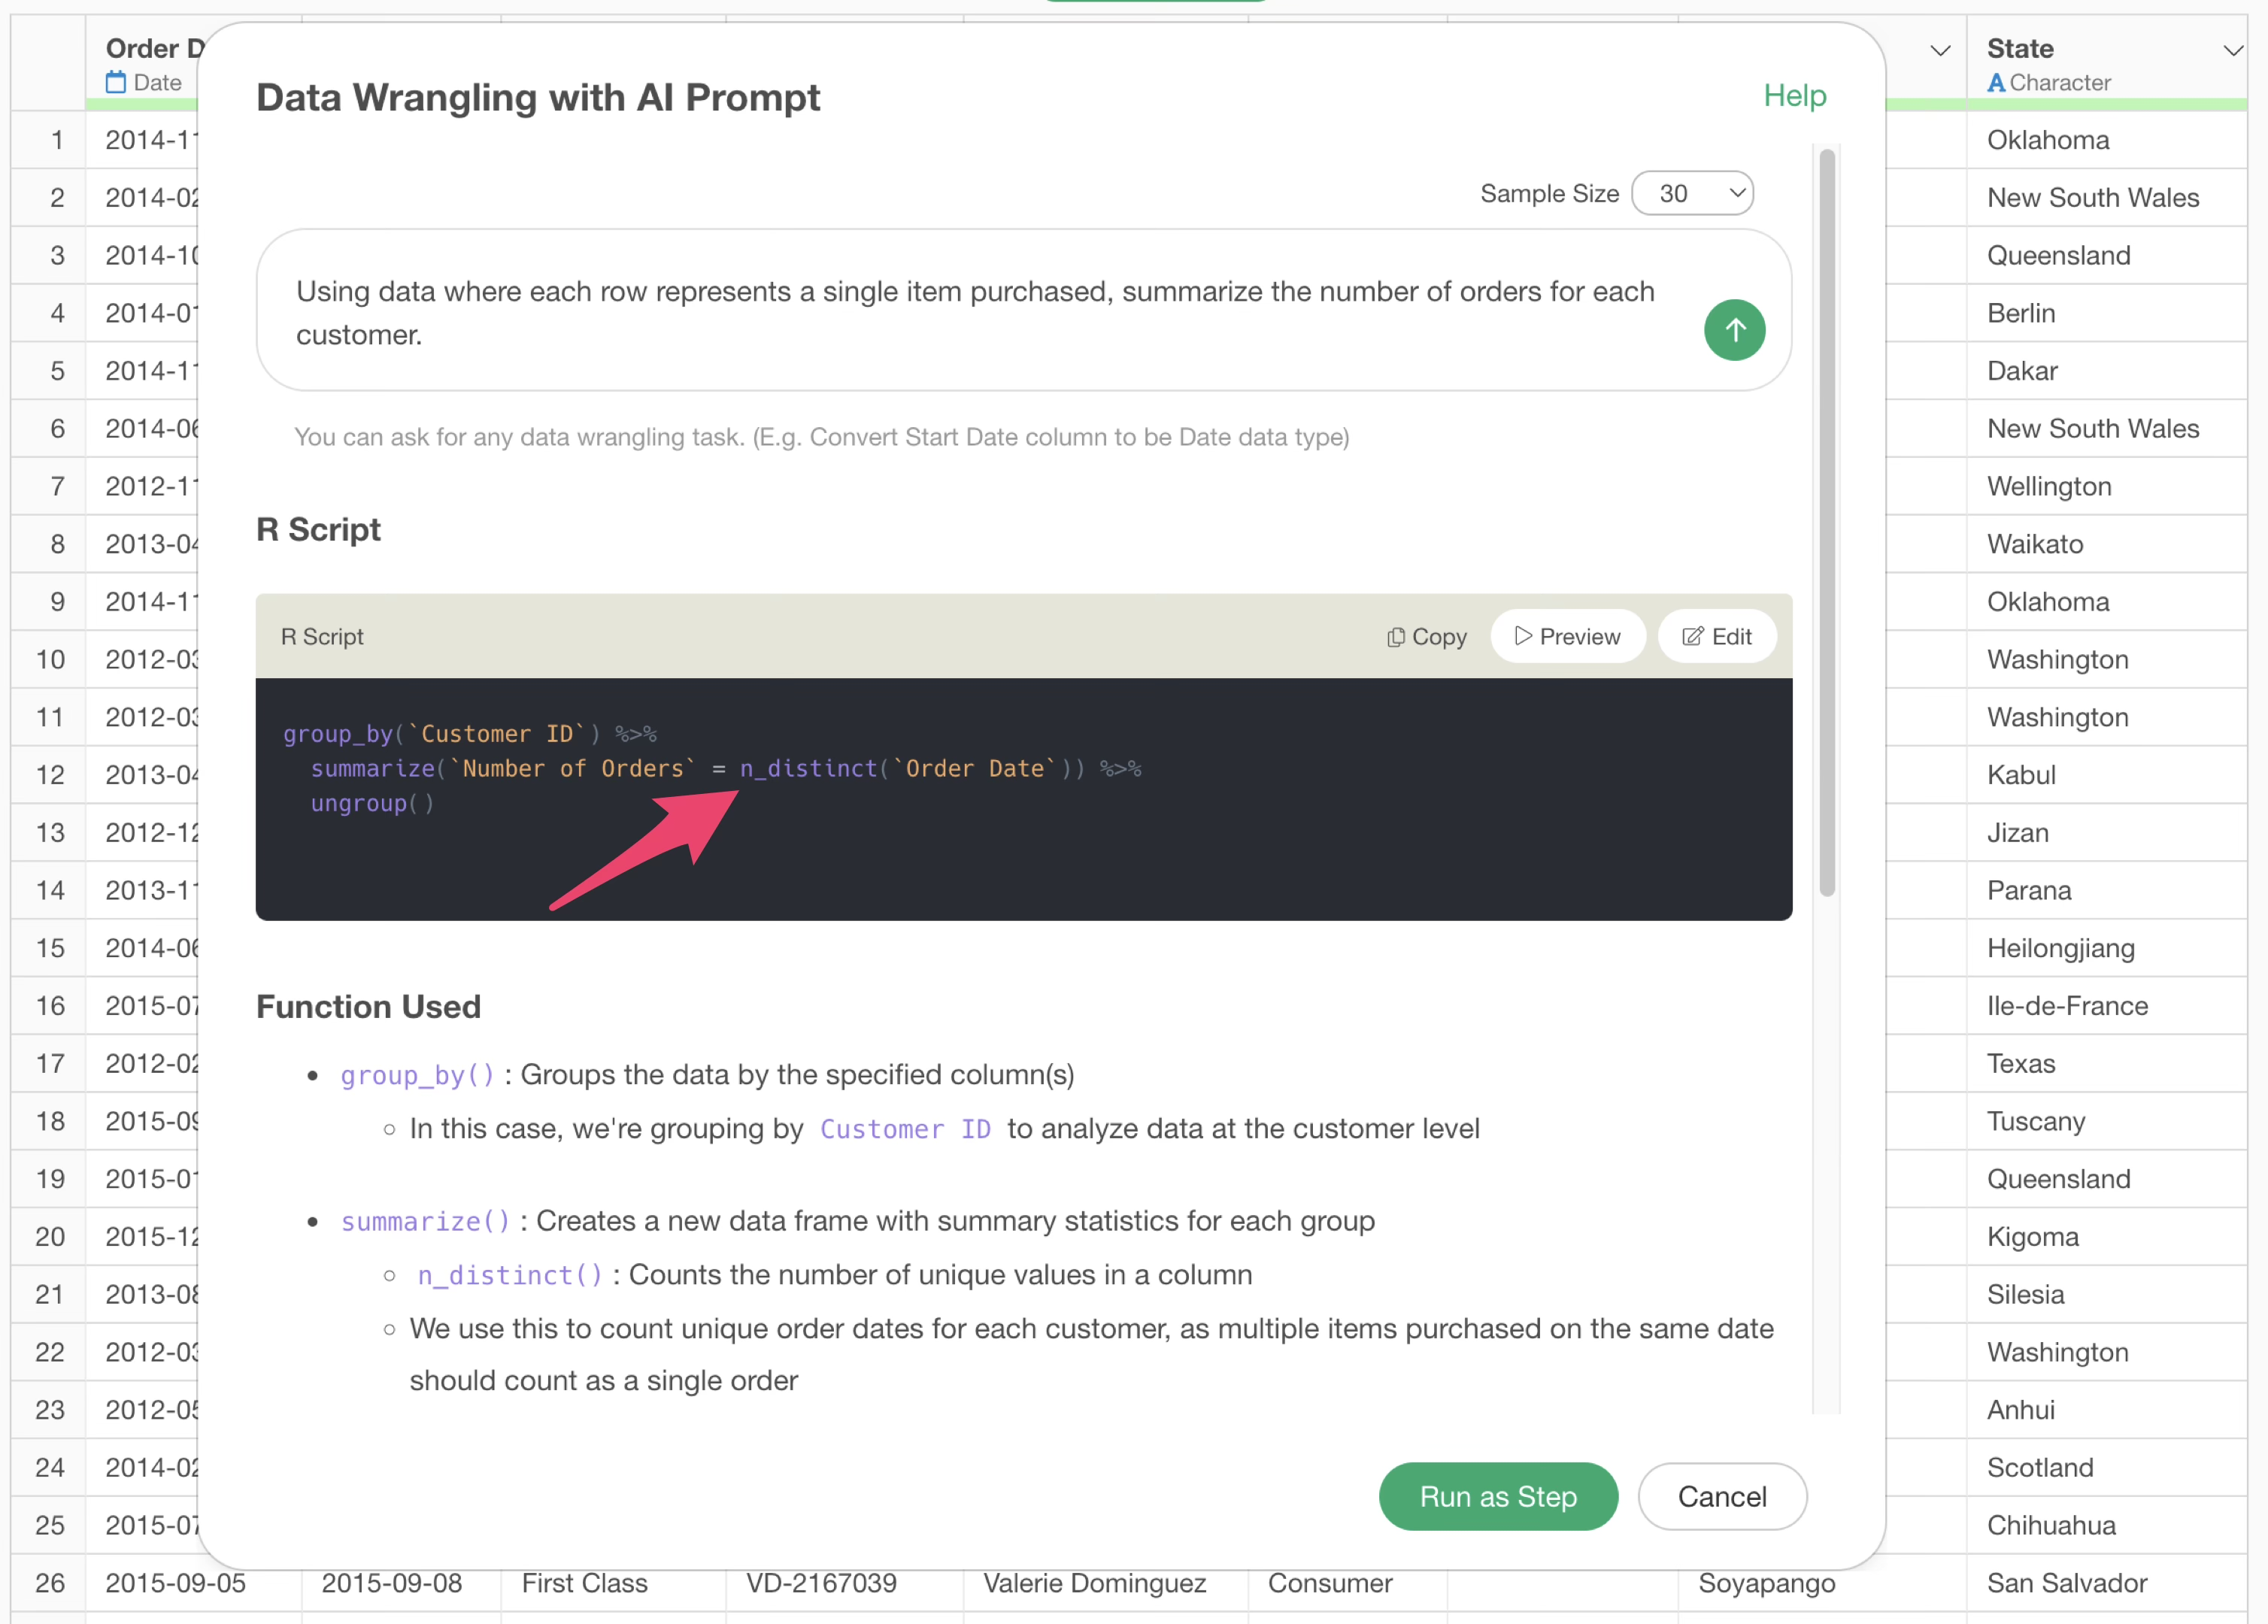
By executing it as a step, you can confirm that the number of orders per customer is calculated correctly.
Joining with other data
For example, suppose you have two datasets: GDP and Population.
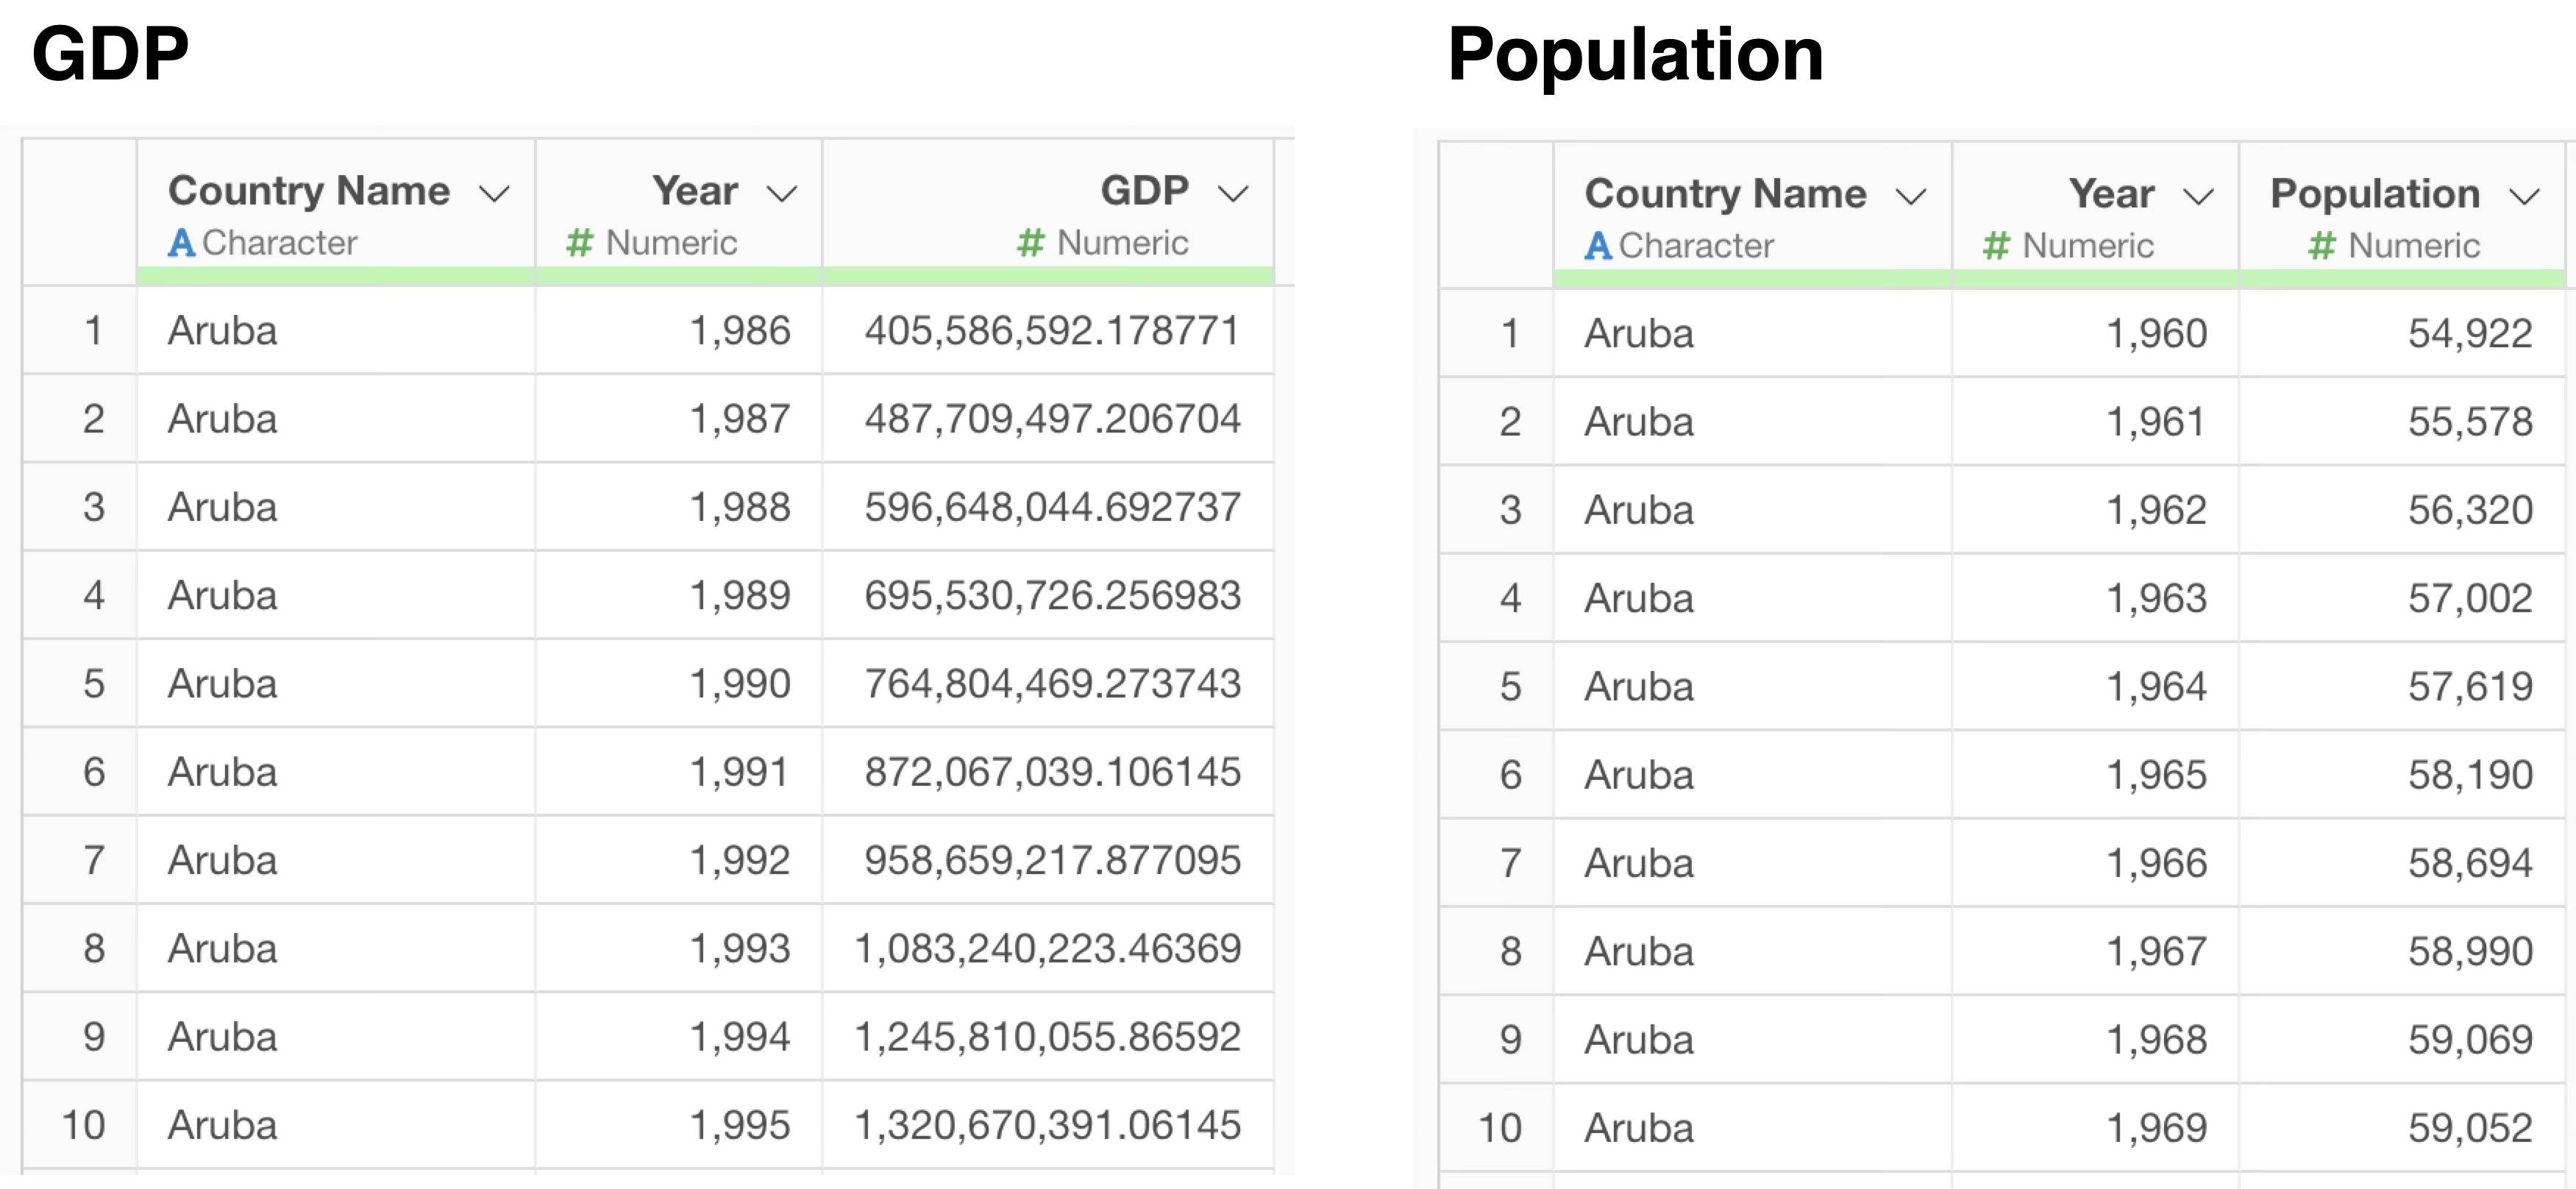
You want to join these two data frames, “GDP” and “Population”. In this case, a join key is required for the join.
Below is a simple example with a single join key.
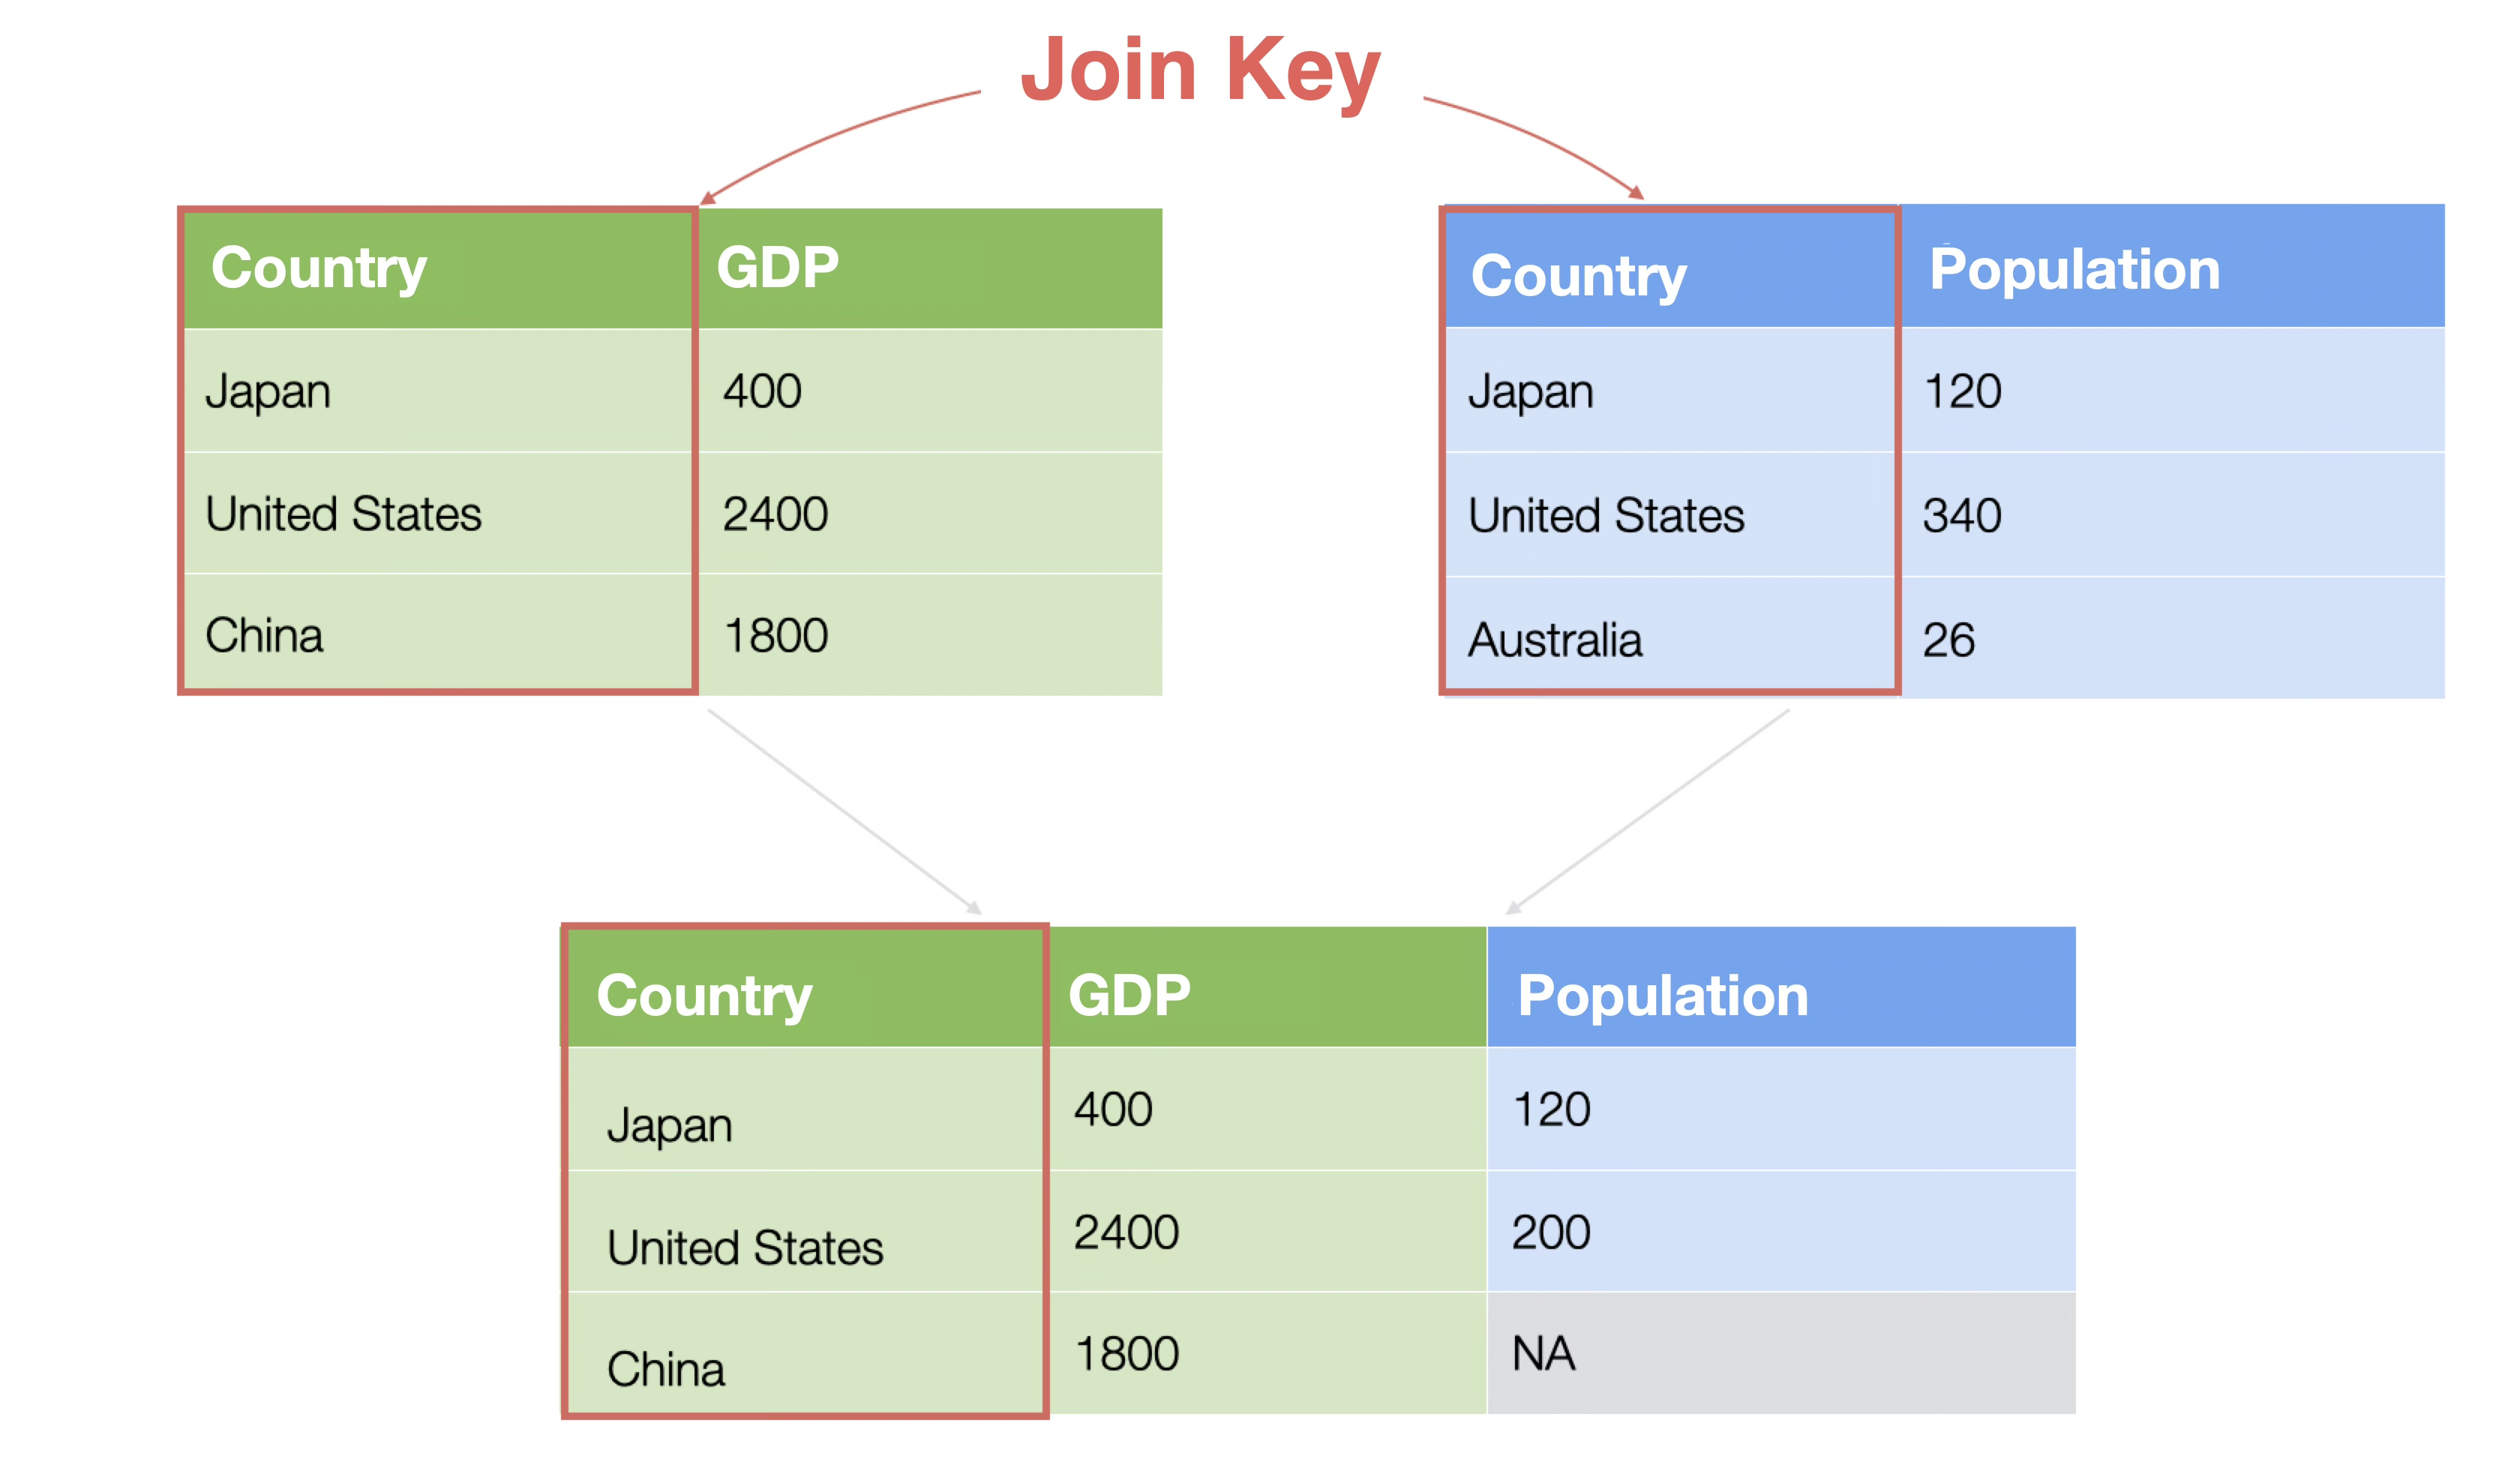
Depending on the data you want to join, there may be multiple join keys, such as two or three.

With traditional UI-based joining, you had to check what the key columns were in each dataset by looking at both datasets. However, with the AI Prompt feature, it automatically infers the join keys based on the data.
To reference other data frames for joining, enter “@”. This allows you to specify data frames in that project.
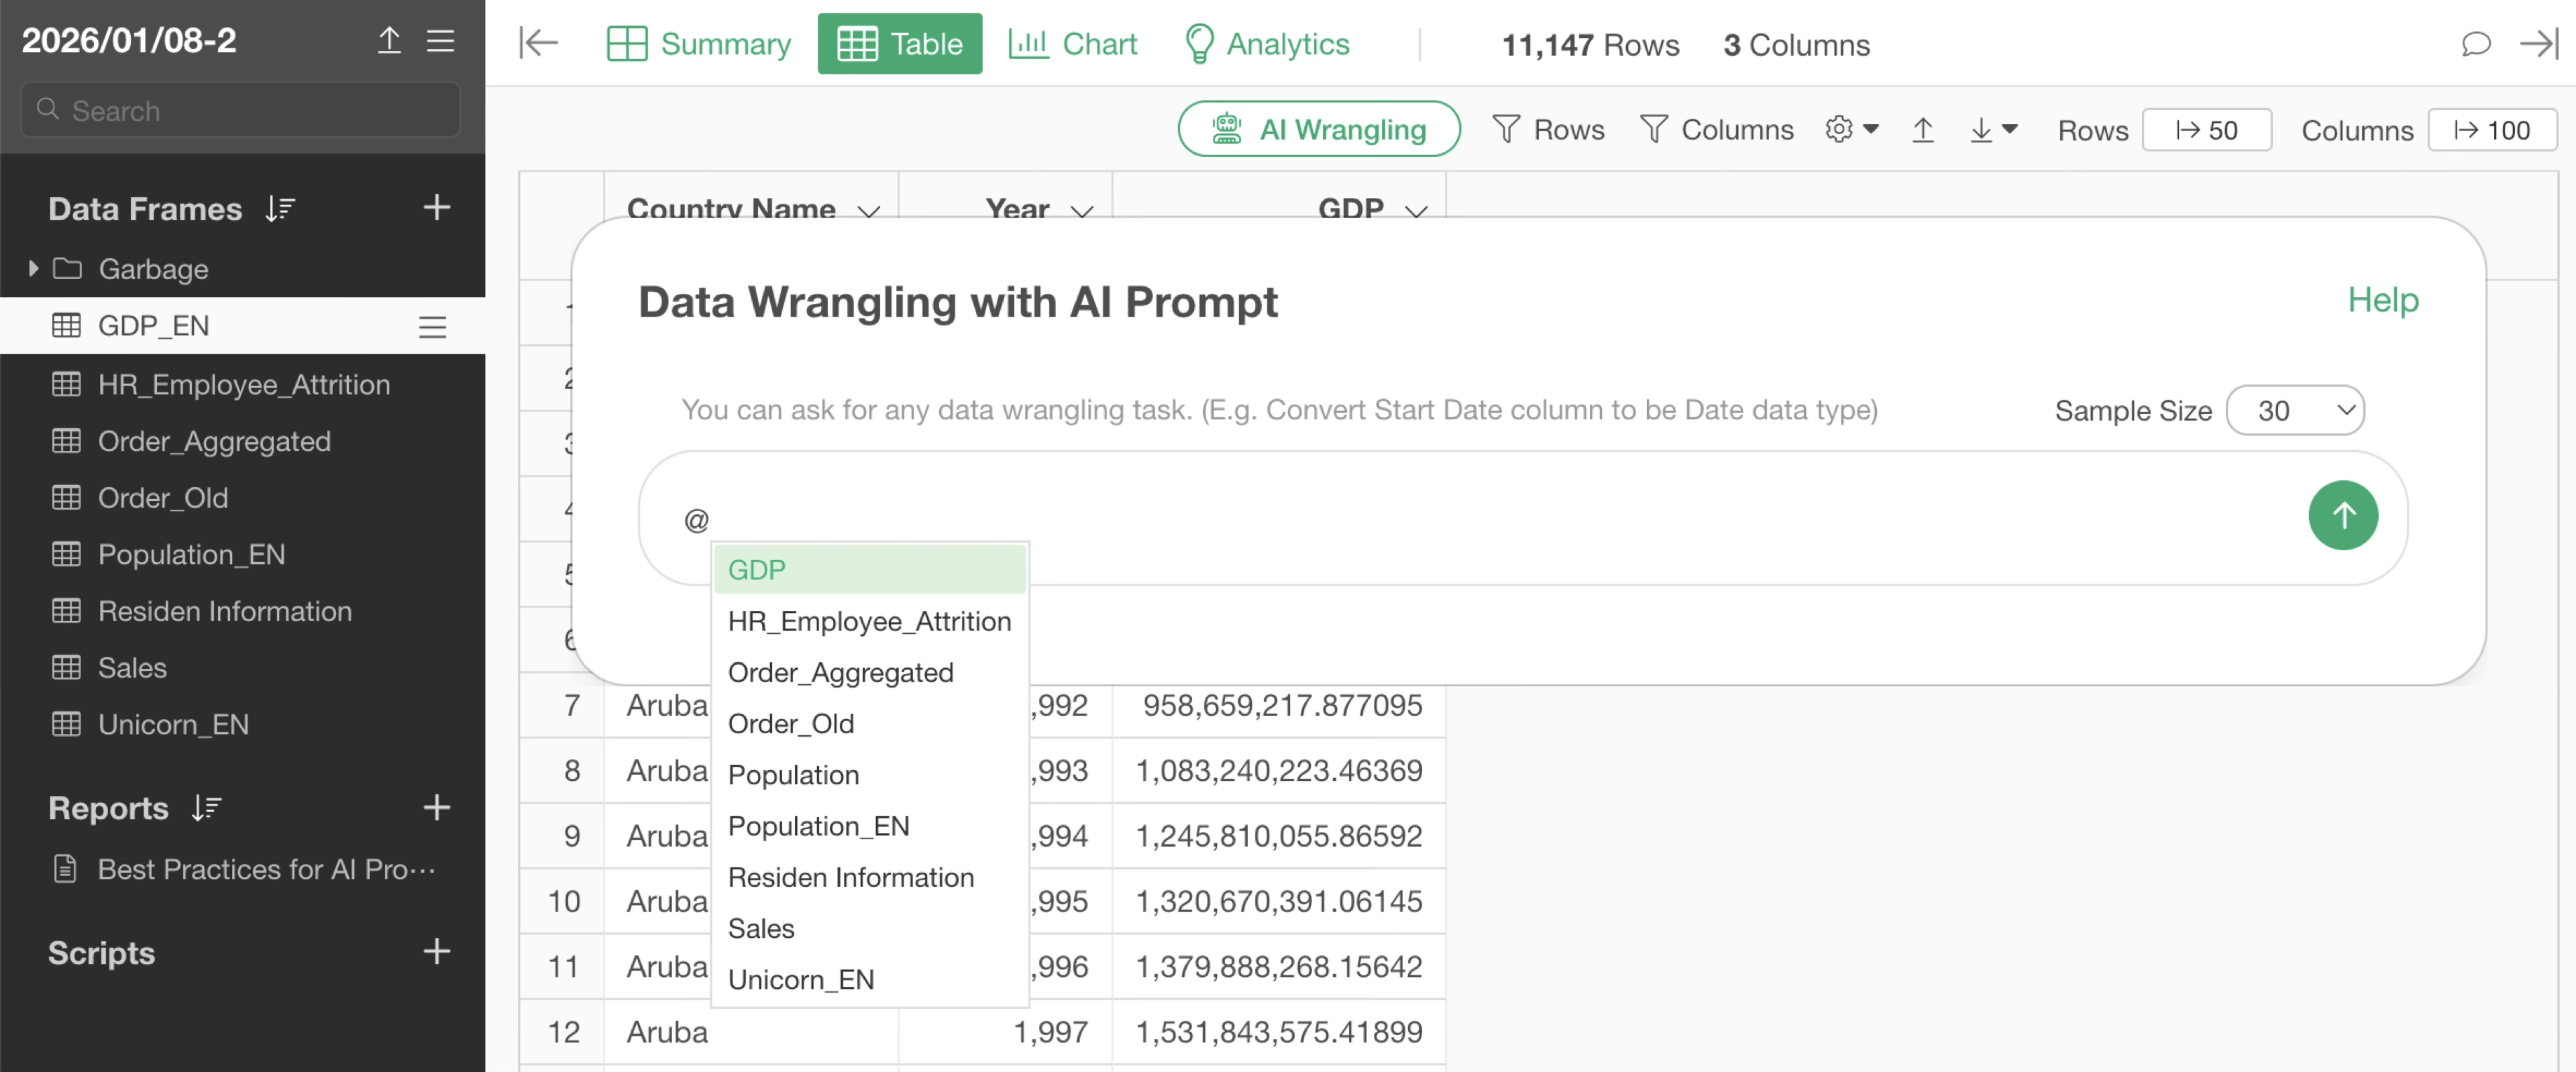
When joining, you specify the prompt as follows:
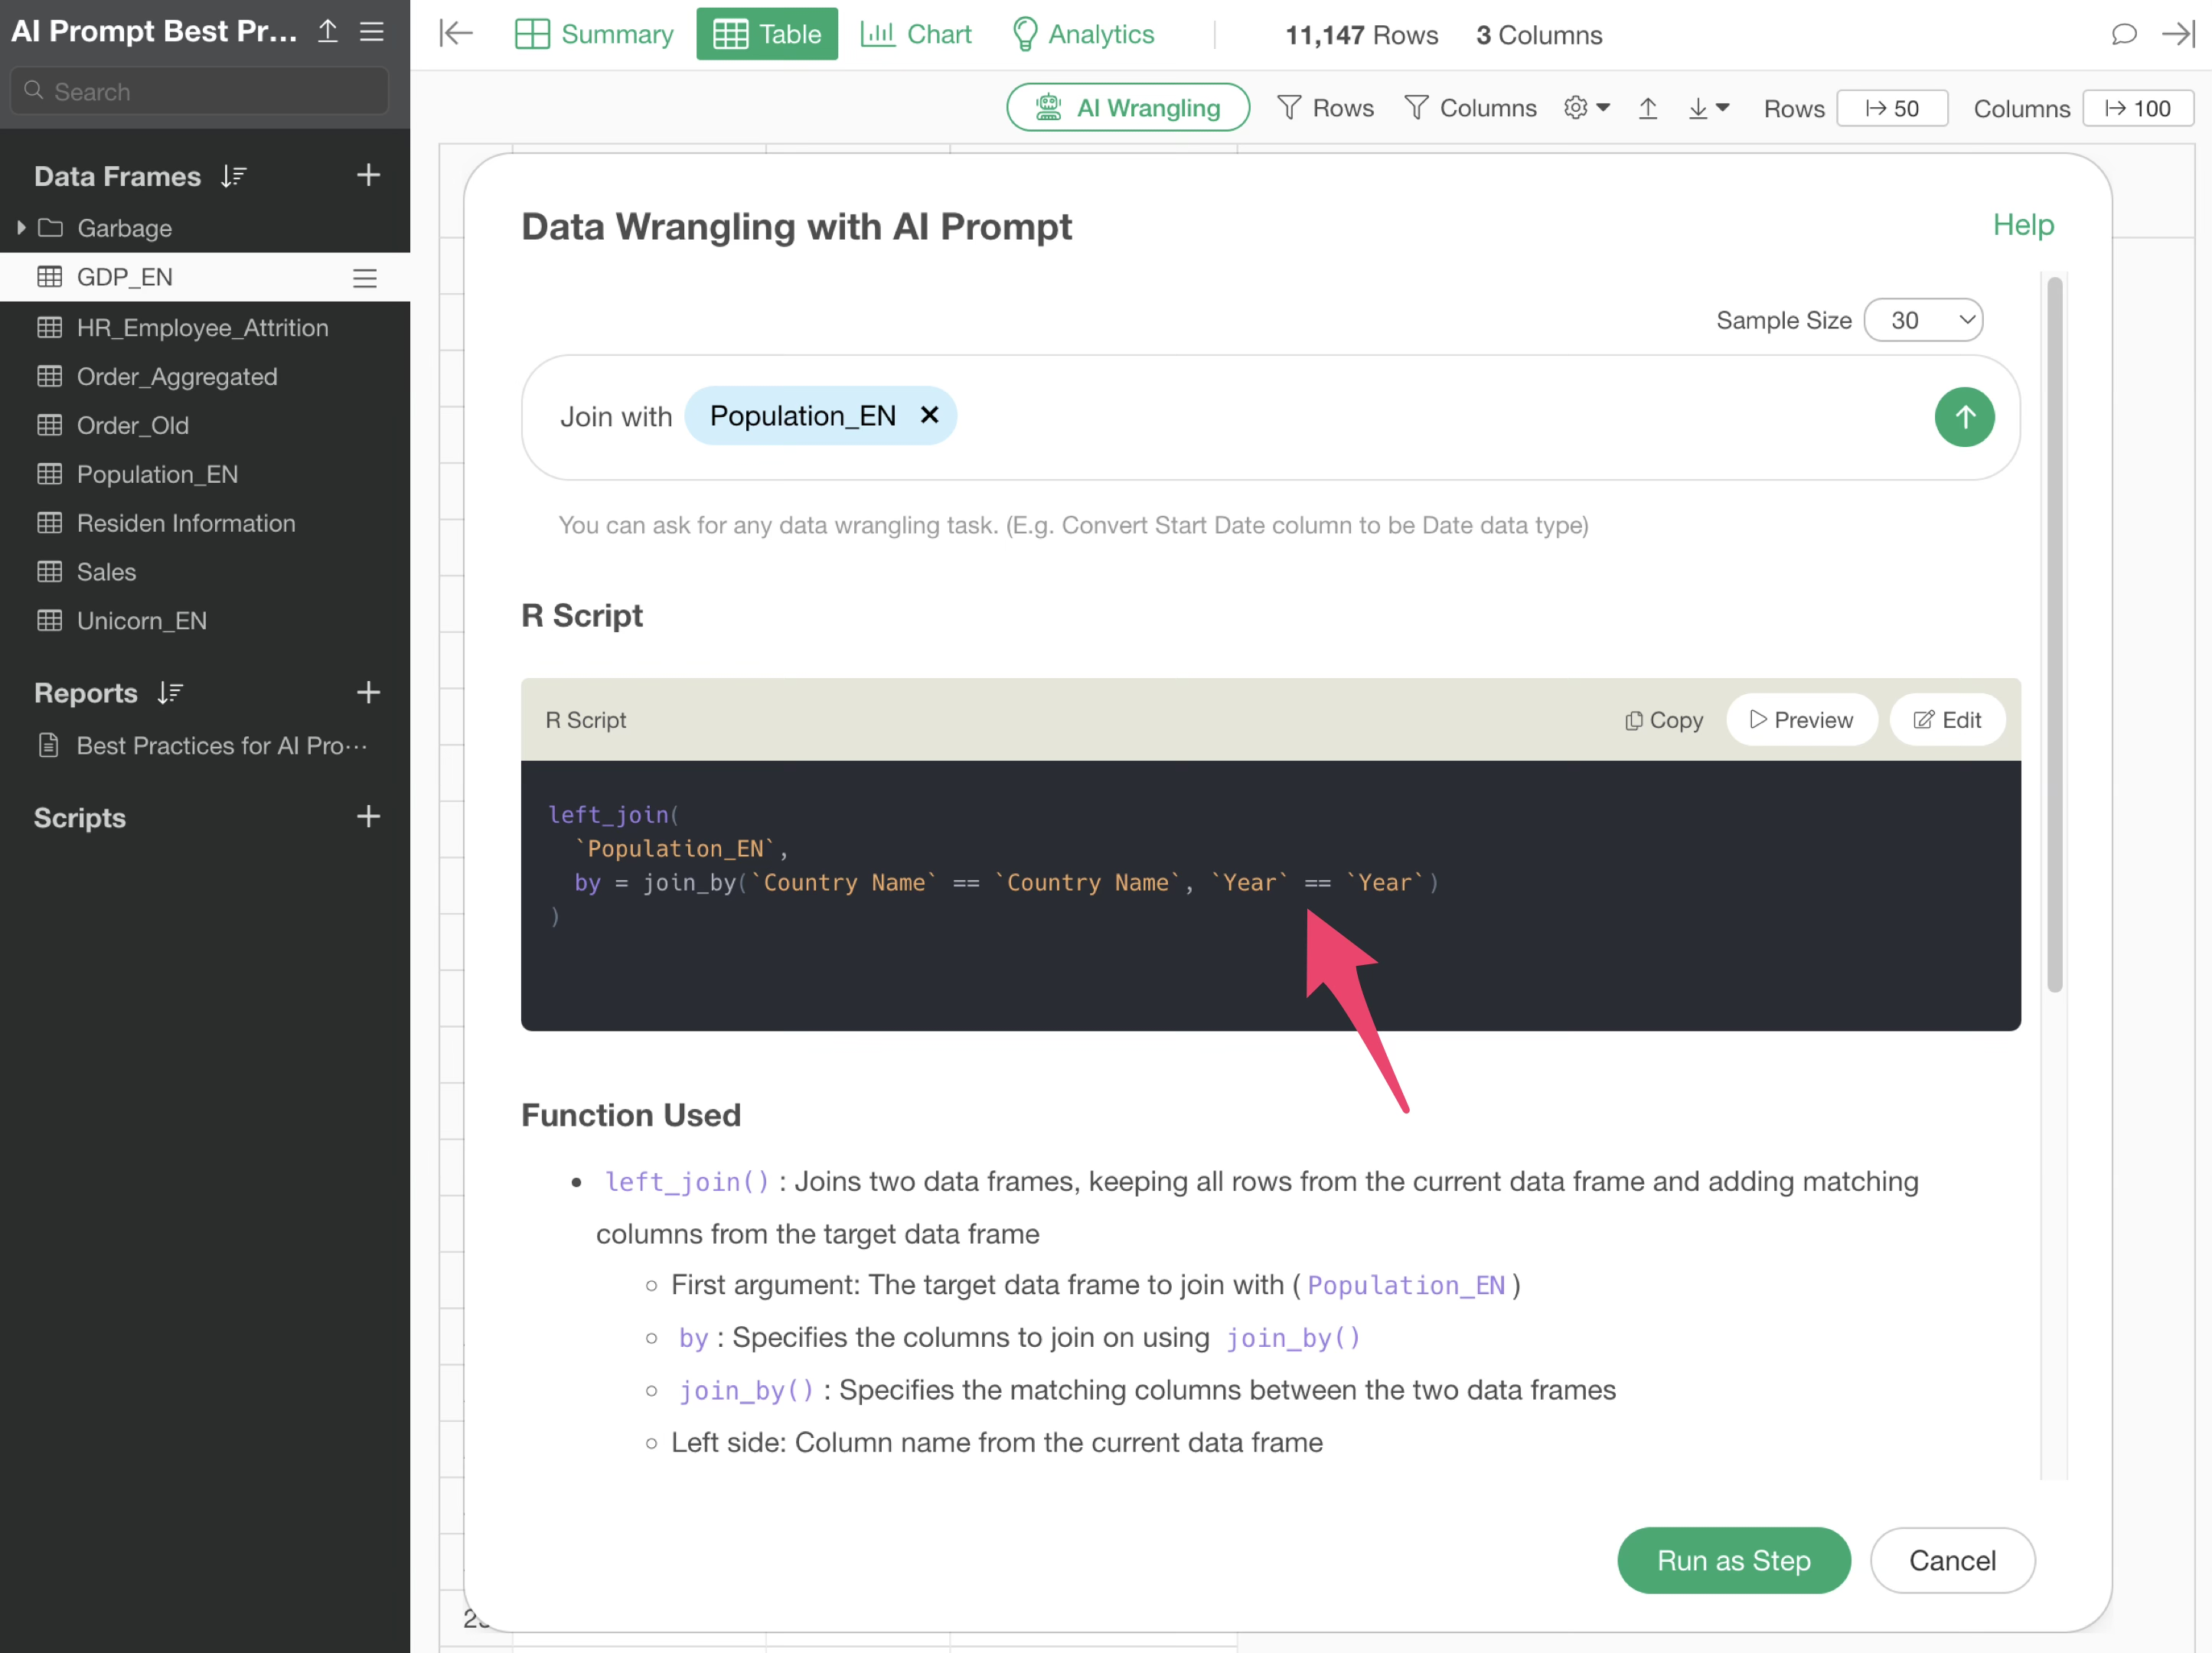
Join with Population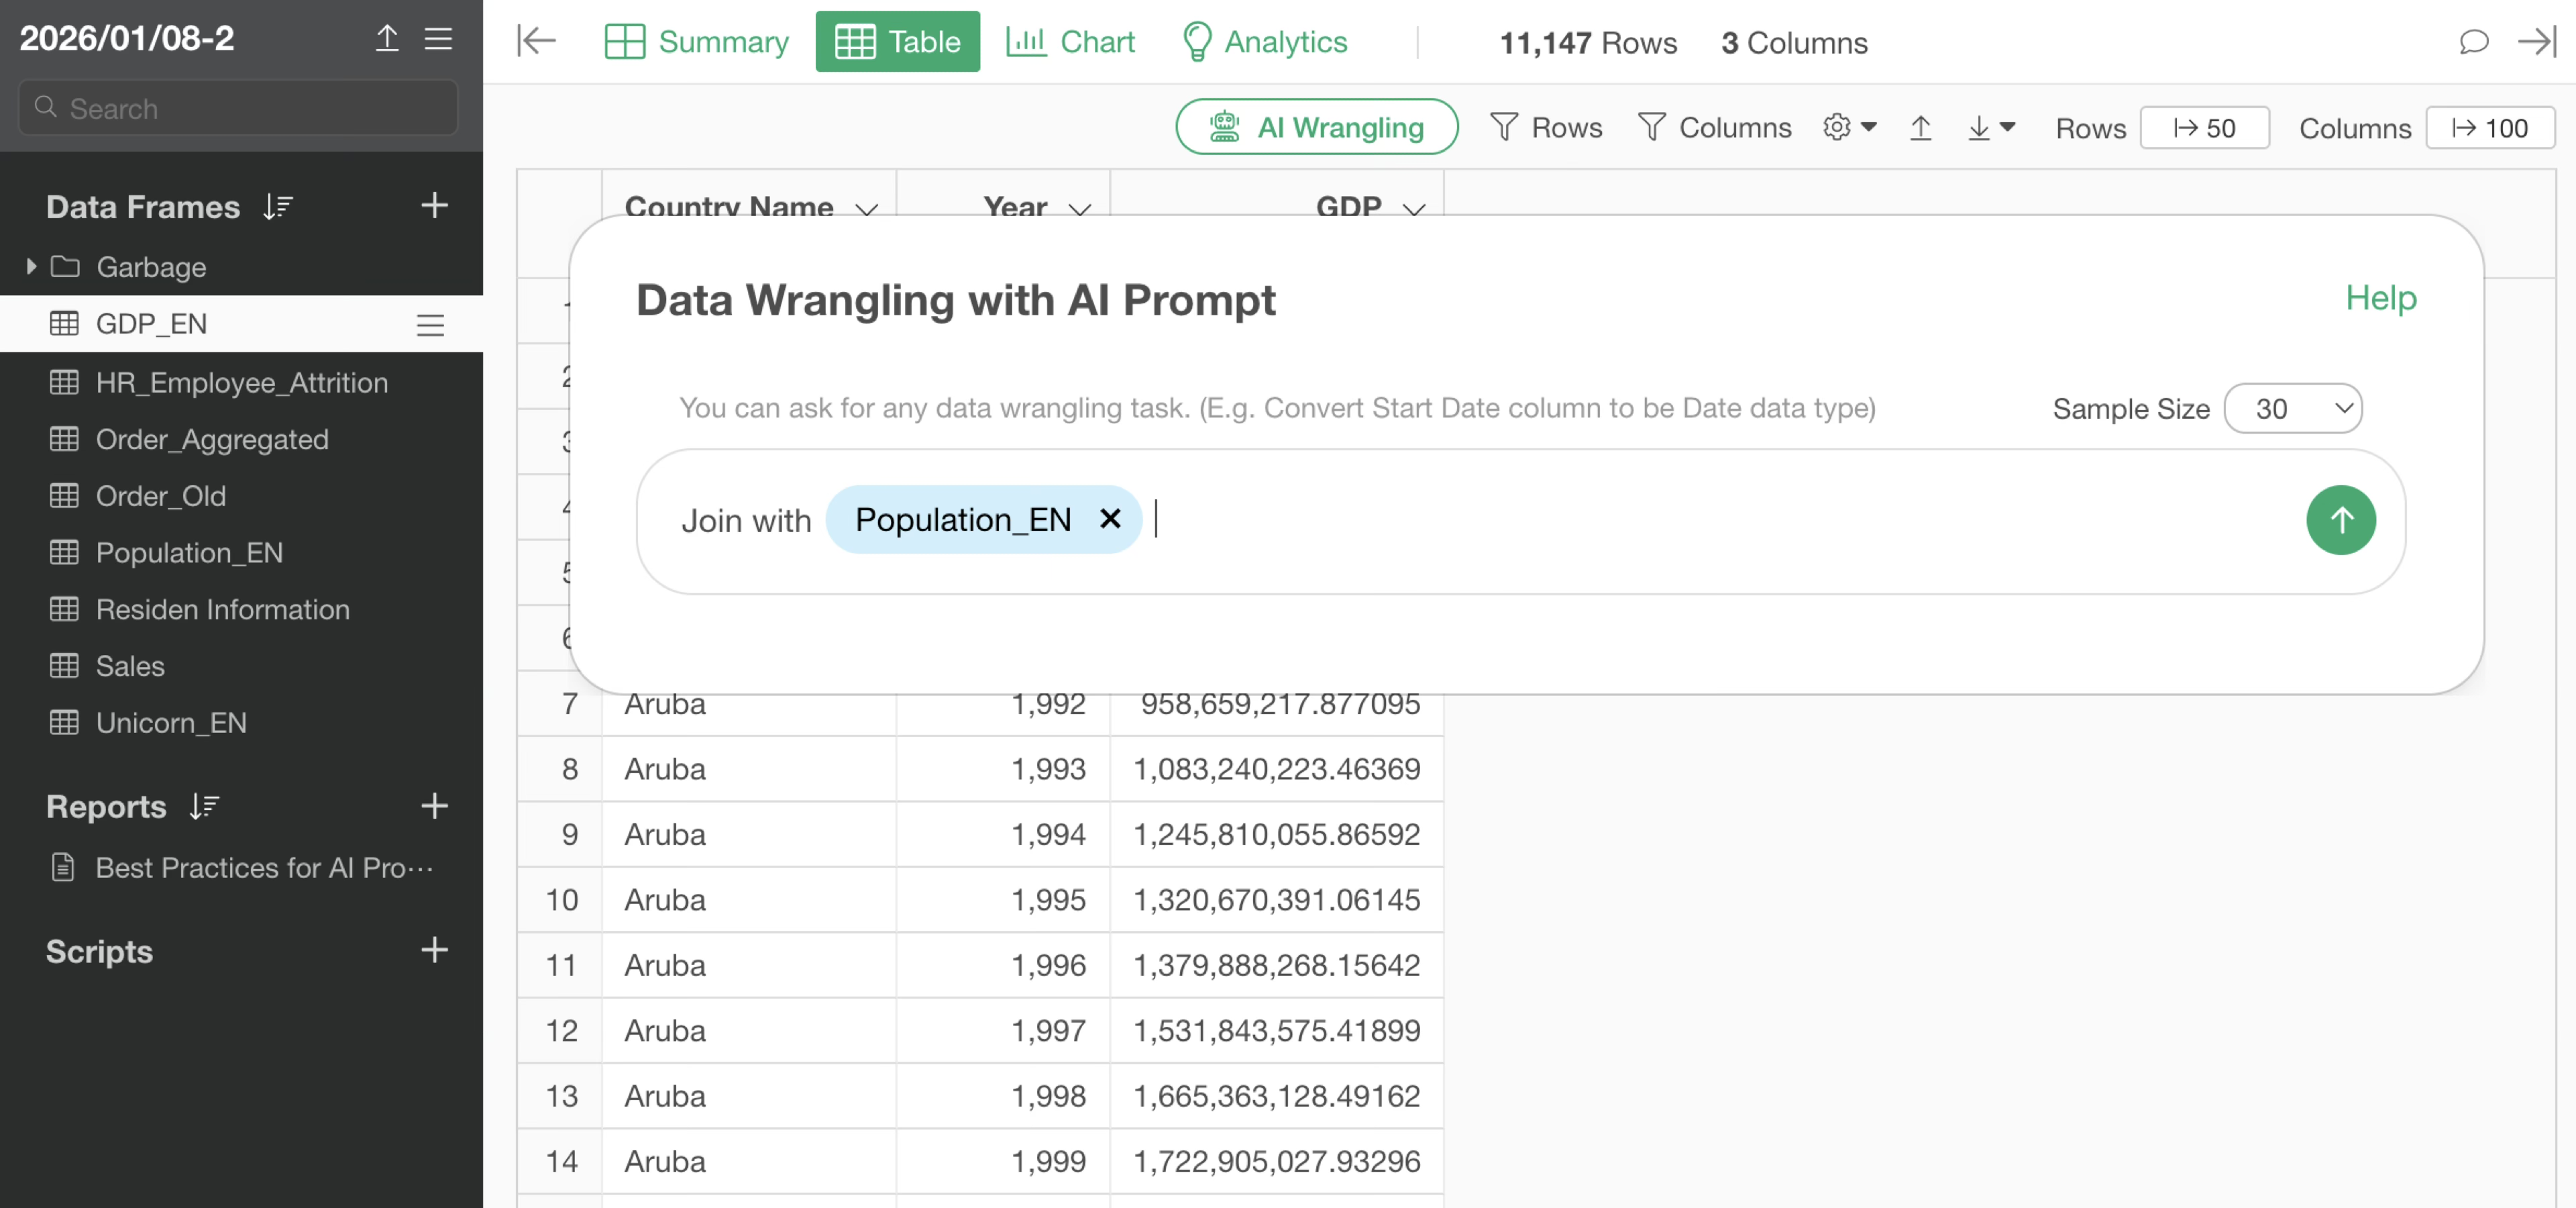
By executing the prompt, an R command for joining with the Population data is returned. Even if the column names are different, it automatically identifies what is presumed to be the same column and sets it as the join key.
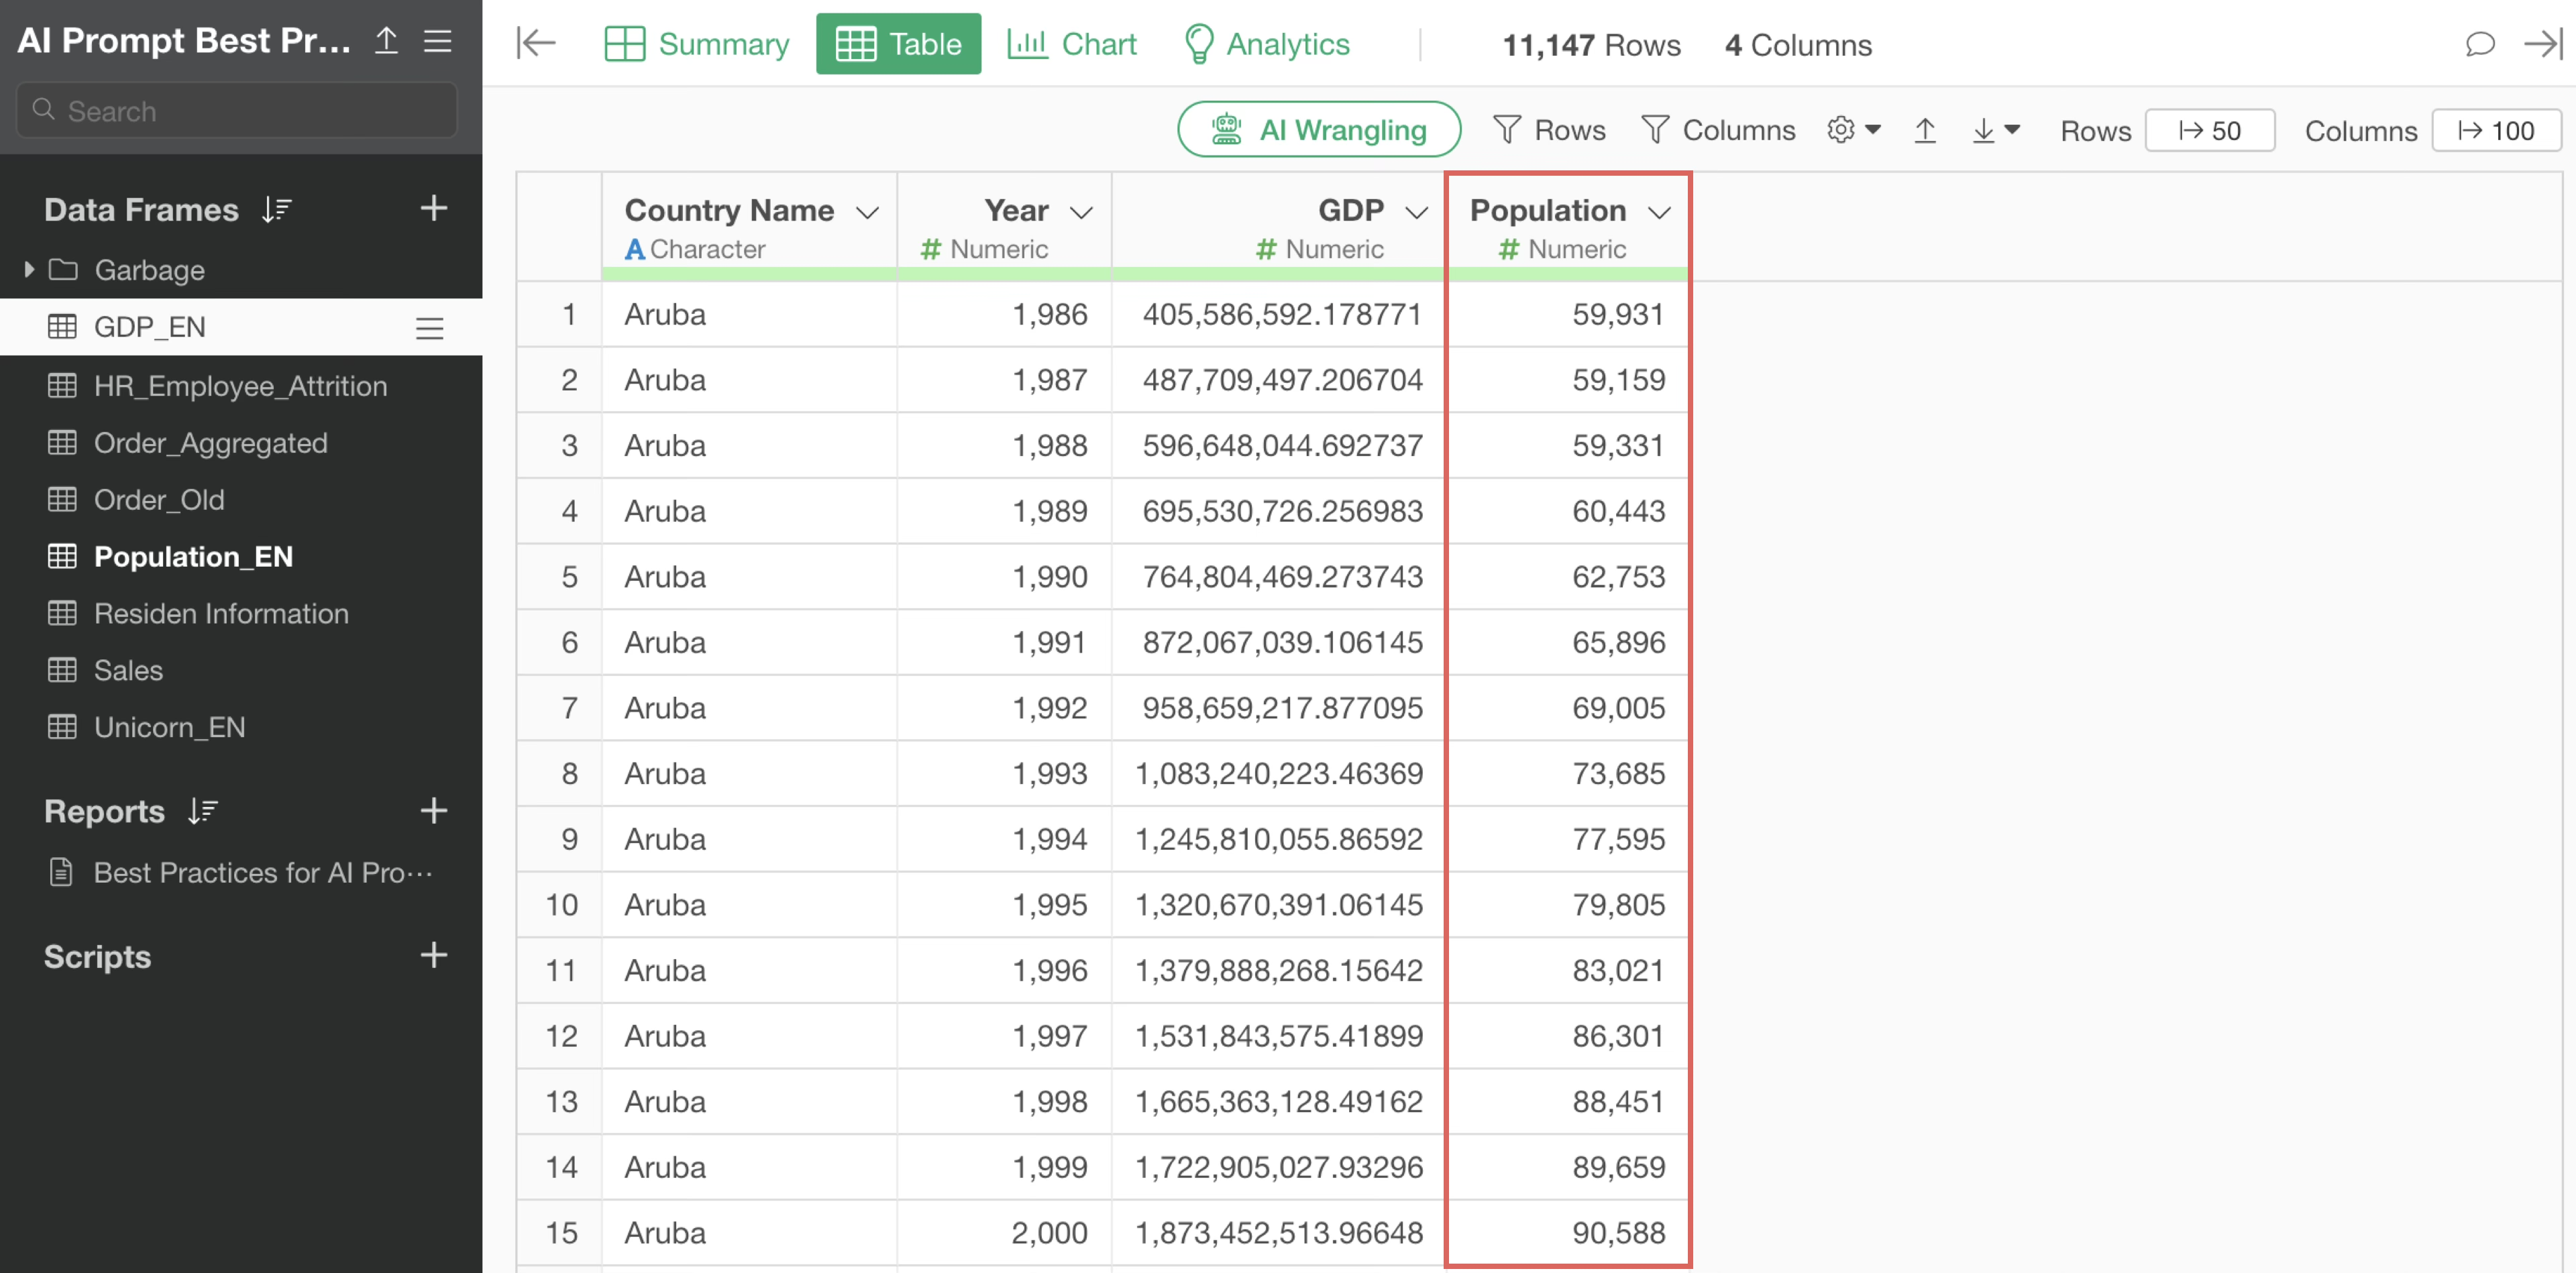
By executing it as a step, we were able to join the population data to the GDP data.
Tips for when text data processing doesn’t work well
We will use unicorn company data where each row represents one company and is separated by investor.

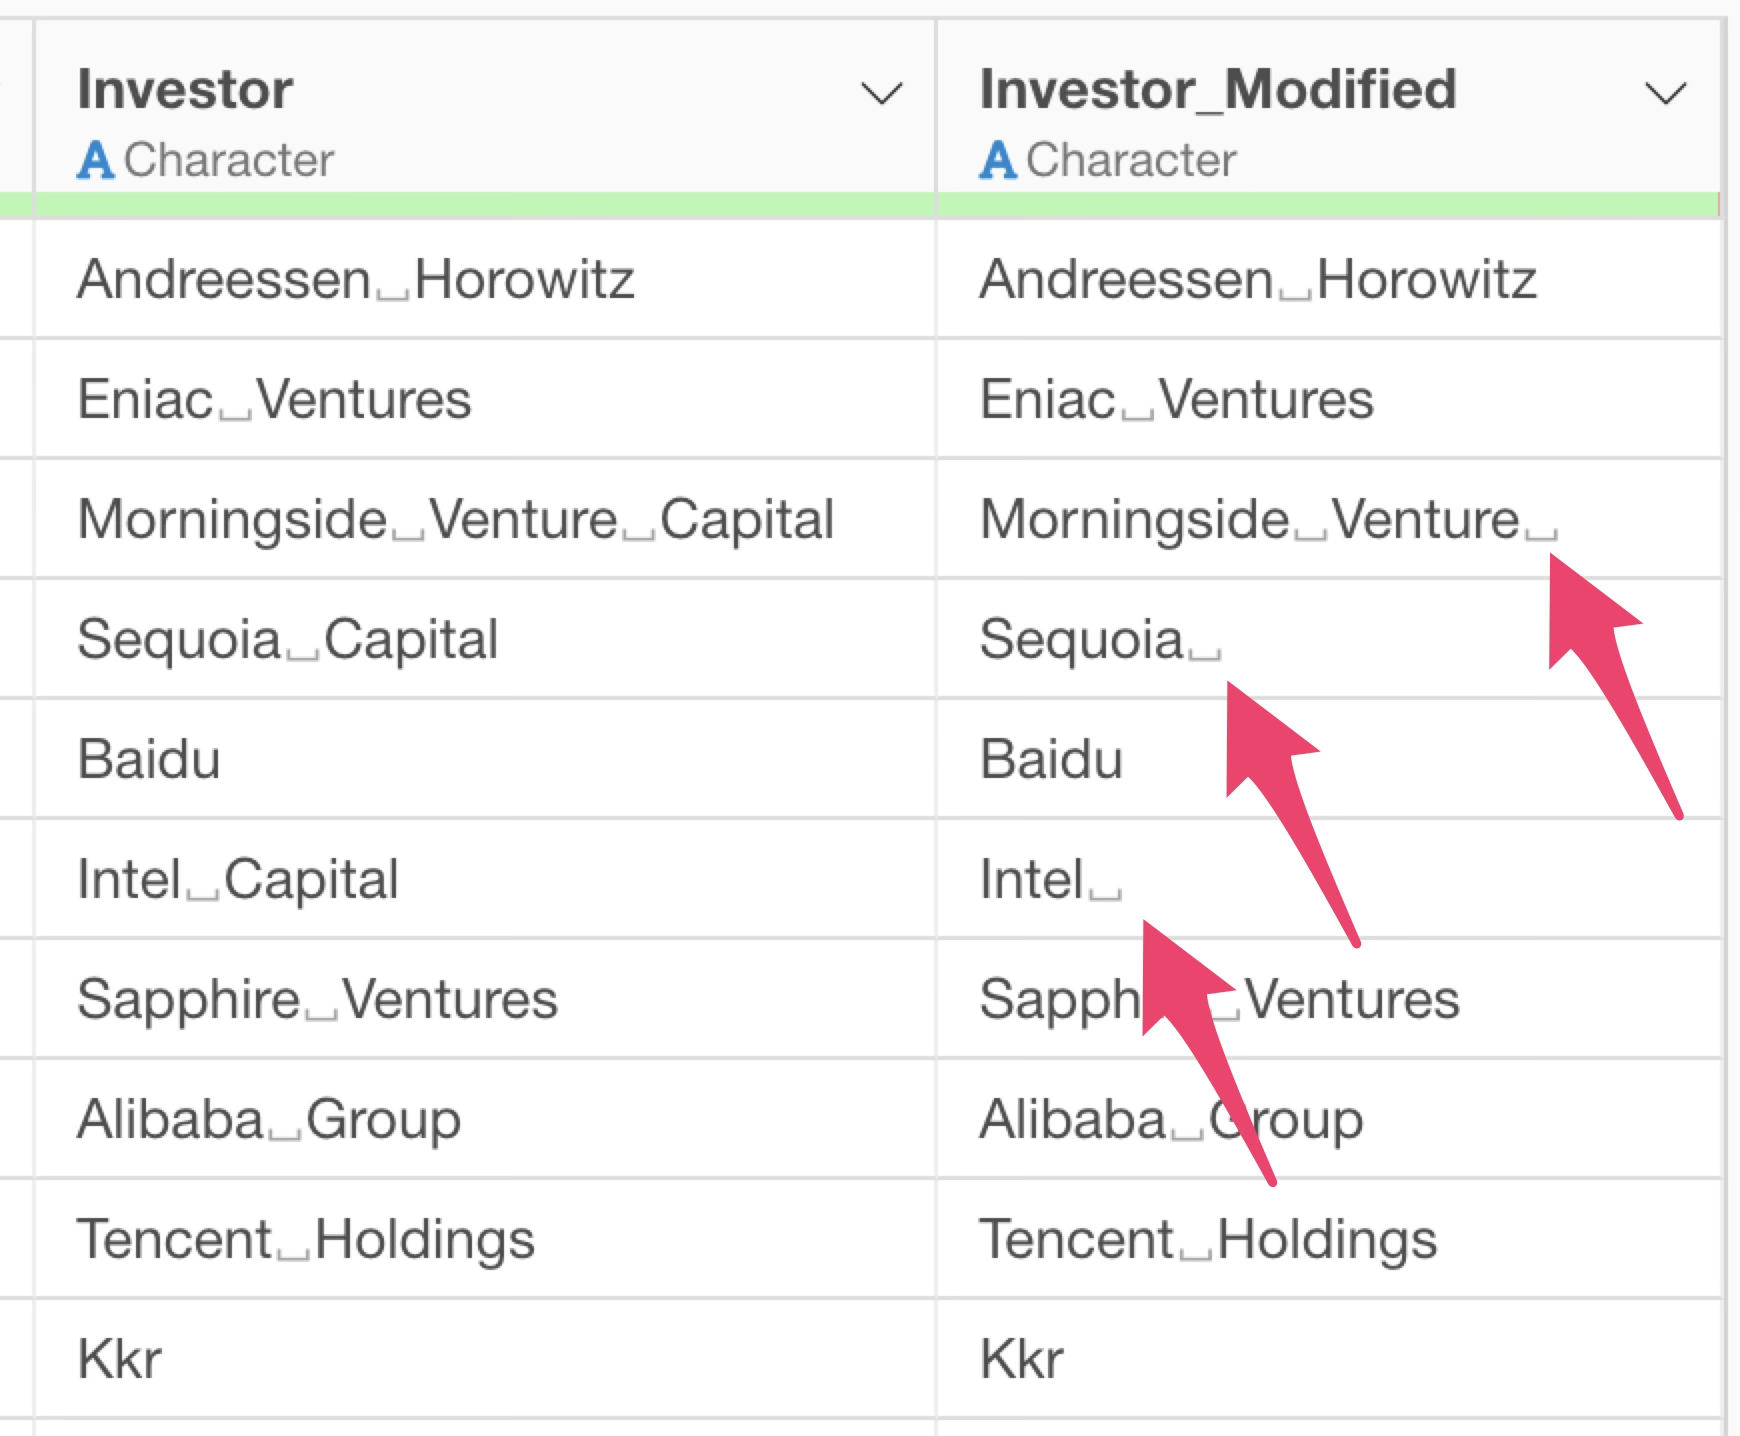
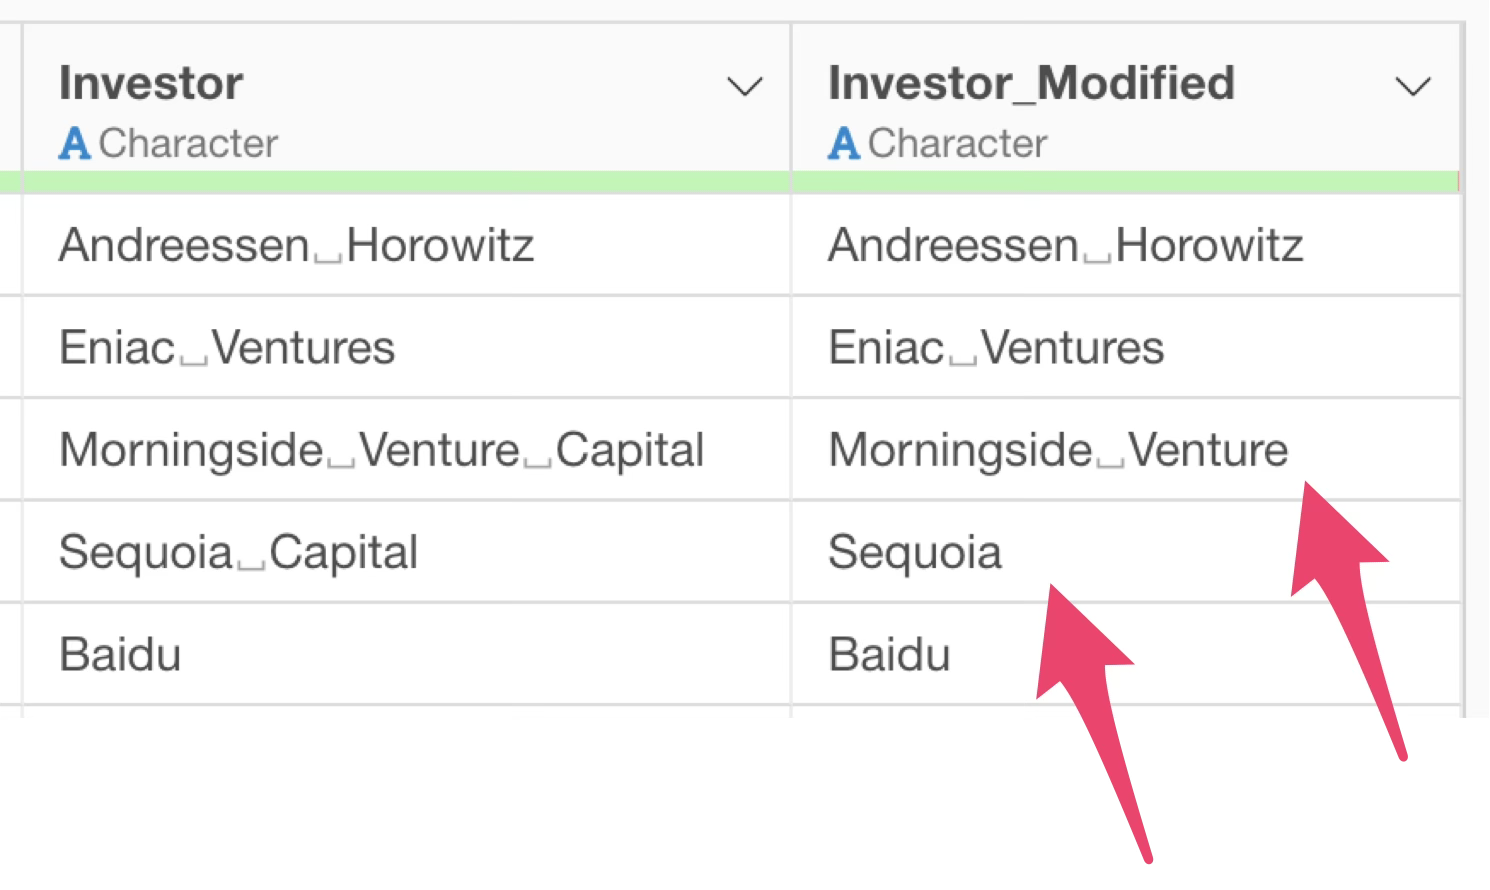
For example, suppose you want to remove the word “Capital” from the investor column. Therefore, you instruct the following prompt:
Remove the word Capital from the Investor column.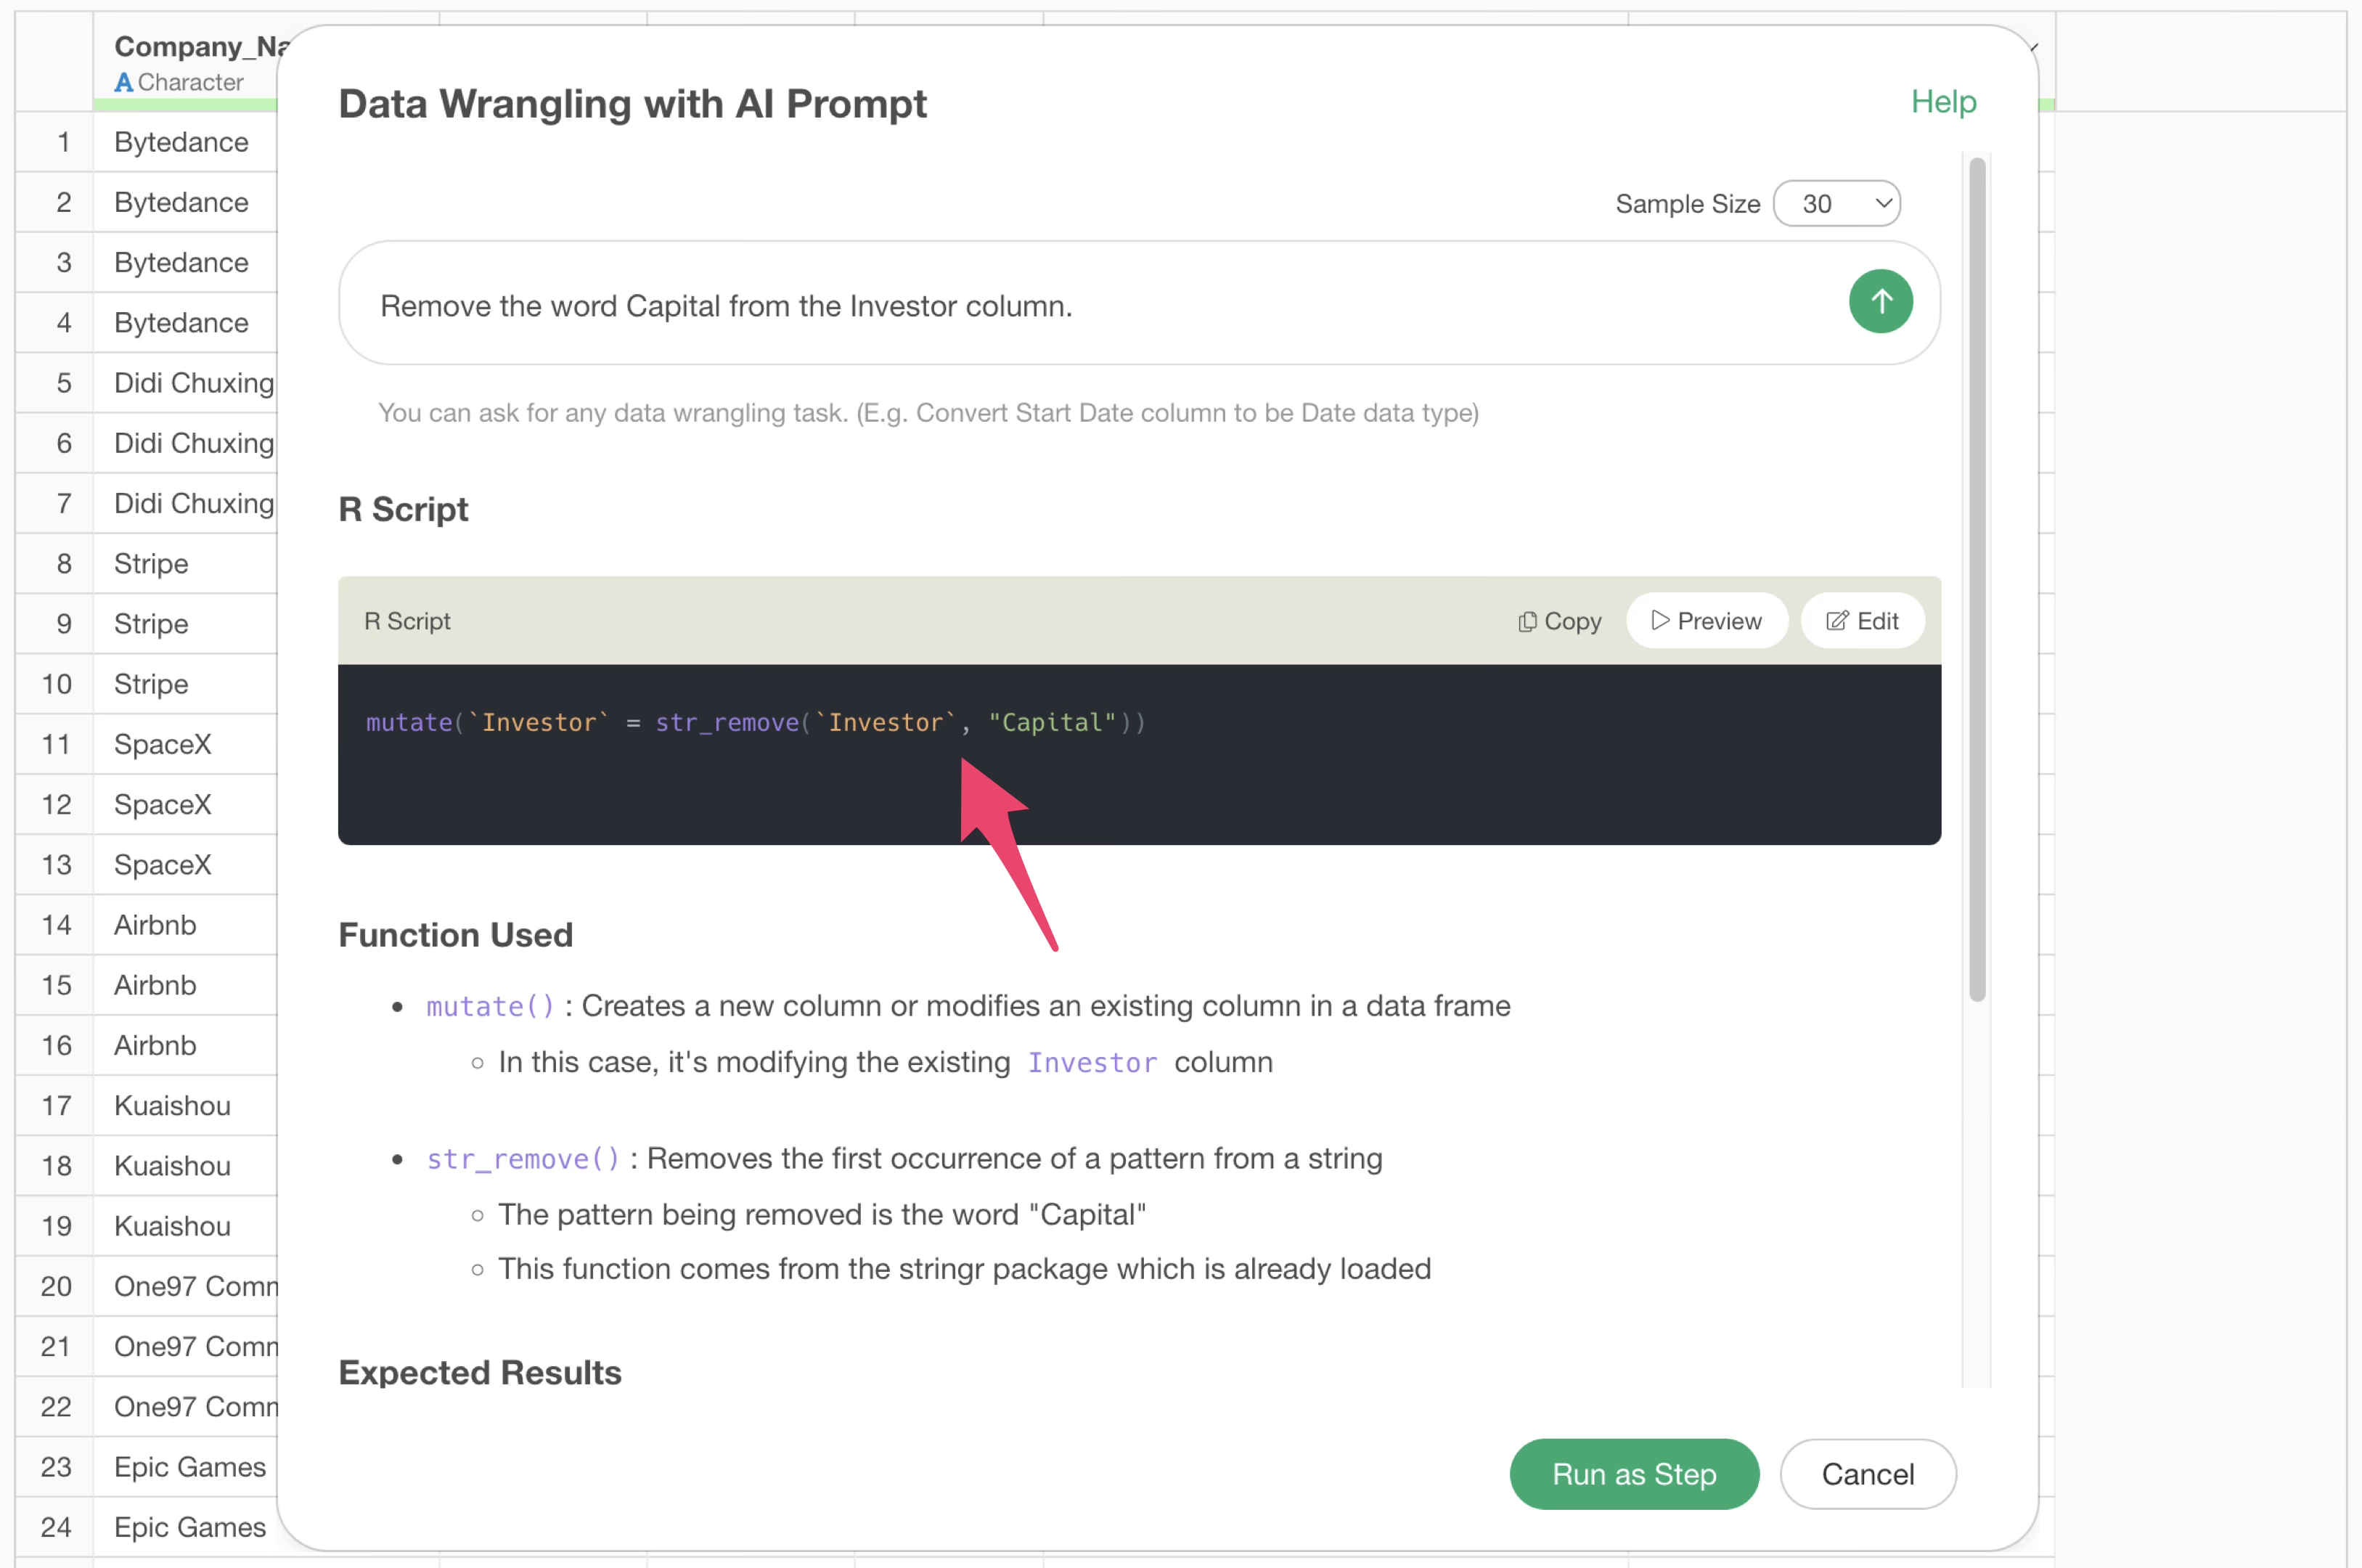
This removes the word “Capital”, but there are a few issues.
That is, “Capital” with an uppercase first letter is removed, but “capital” with all lowercase letters is not.

Furthermore, although the word “Capital” was removed, the space that was before “Capital” remains.
So, let’s enclose the column name “投資家” (Investor) and the specified word “Capital” in double quotes (“).
Remove the "Capital" from "Investor".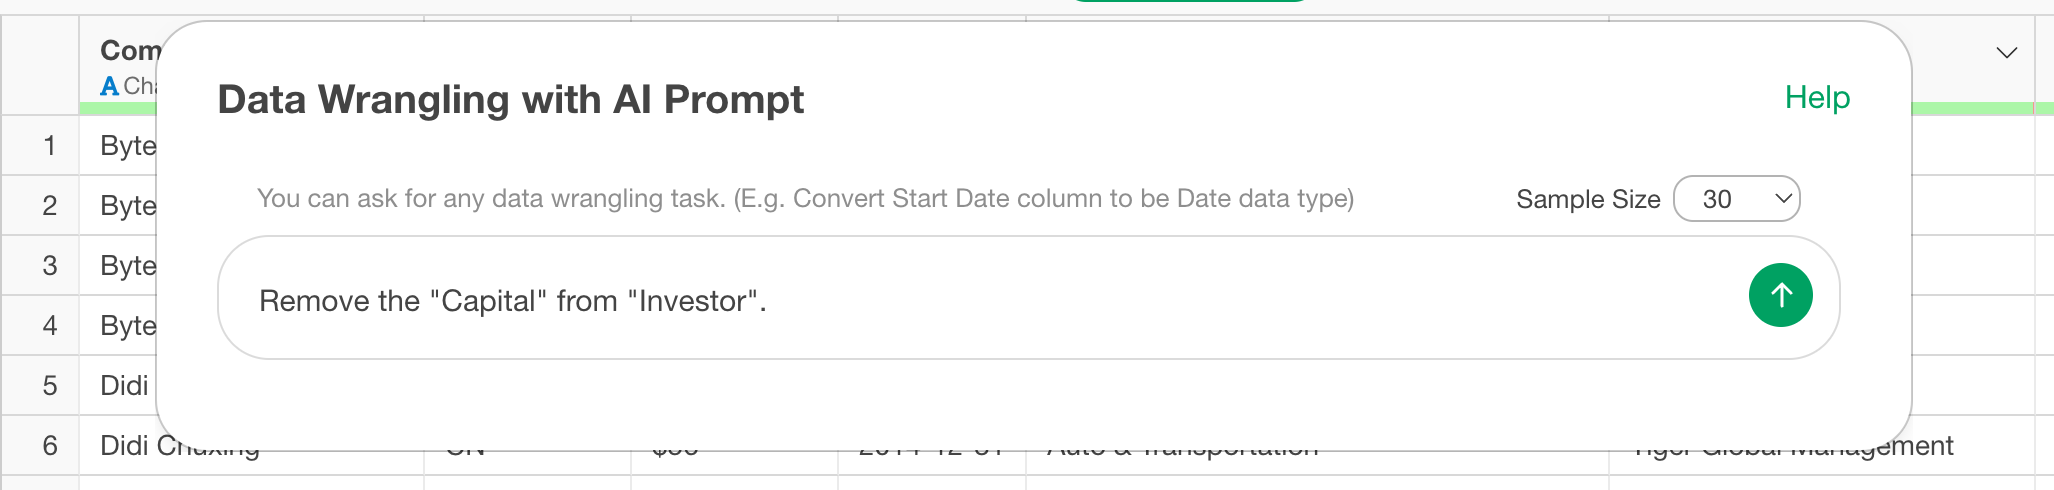
This is because the AI Prompt feature uses a mechanism called RAG (Retrieval Augmented Generation), which searches for relevant content within Exploratory based on the prompt and then finds appropriate processing content based on the returned results.
In this process, if specific words like “投資家” (Investor) or “Capital” are included, the search results may be biased by those words. To suppress this, we enclose them in double quotes.
This confirms that Exploratory correctly references information from its content, and there is a difference in the results returned by the R command.
Result returned by the original prompt:
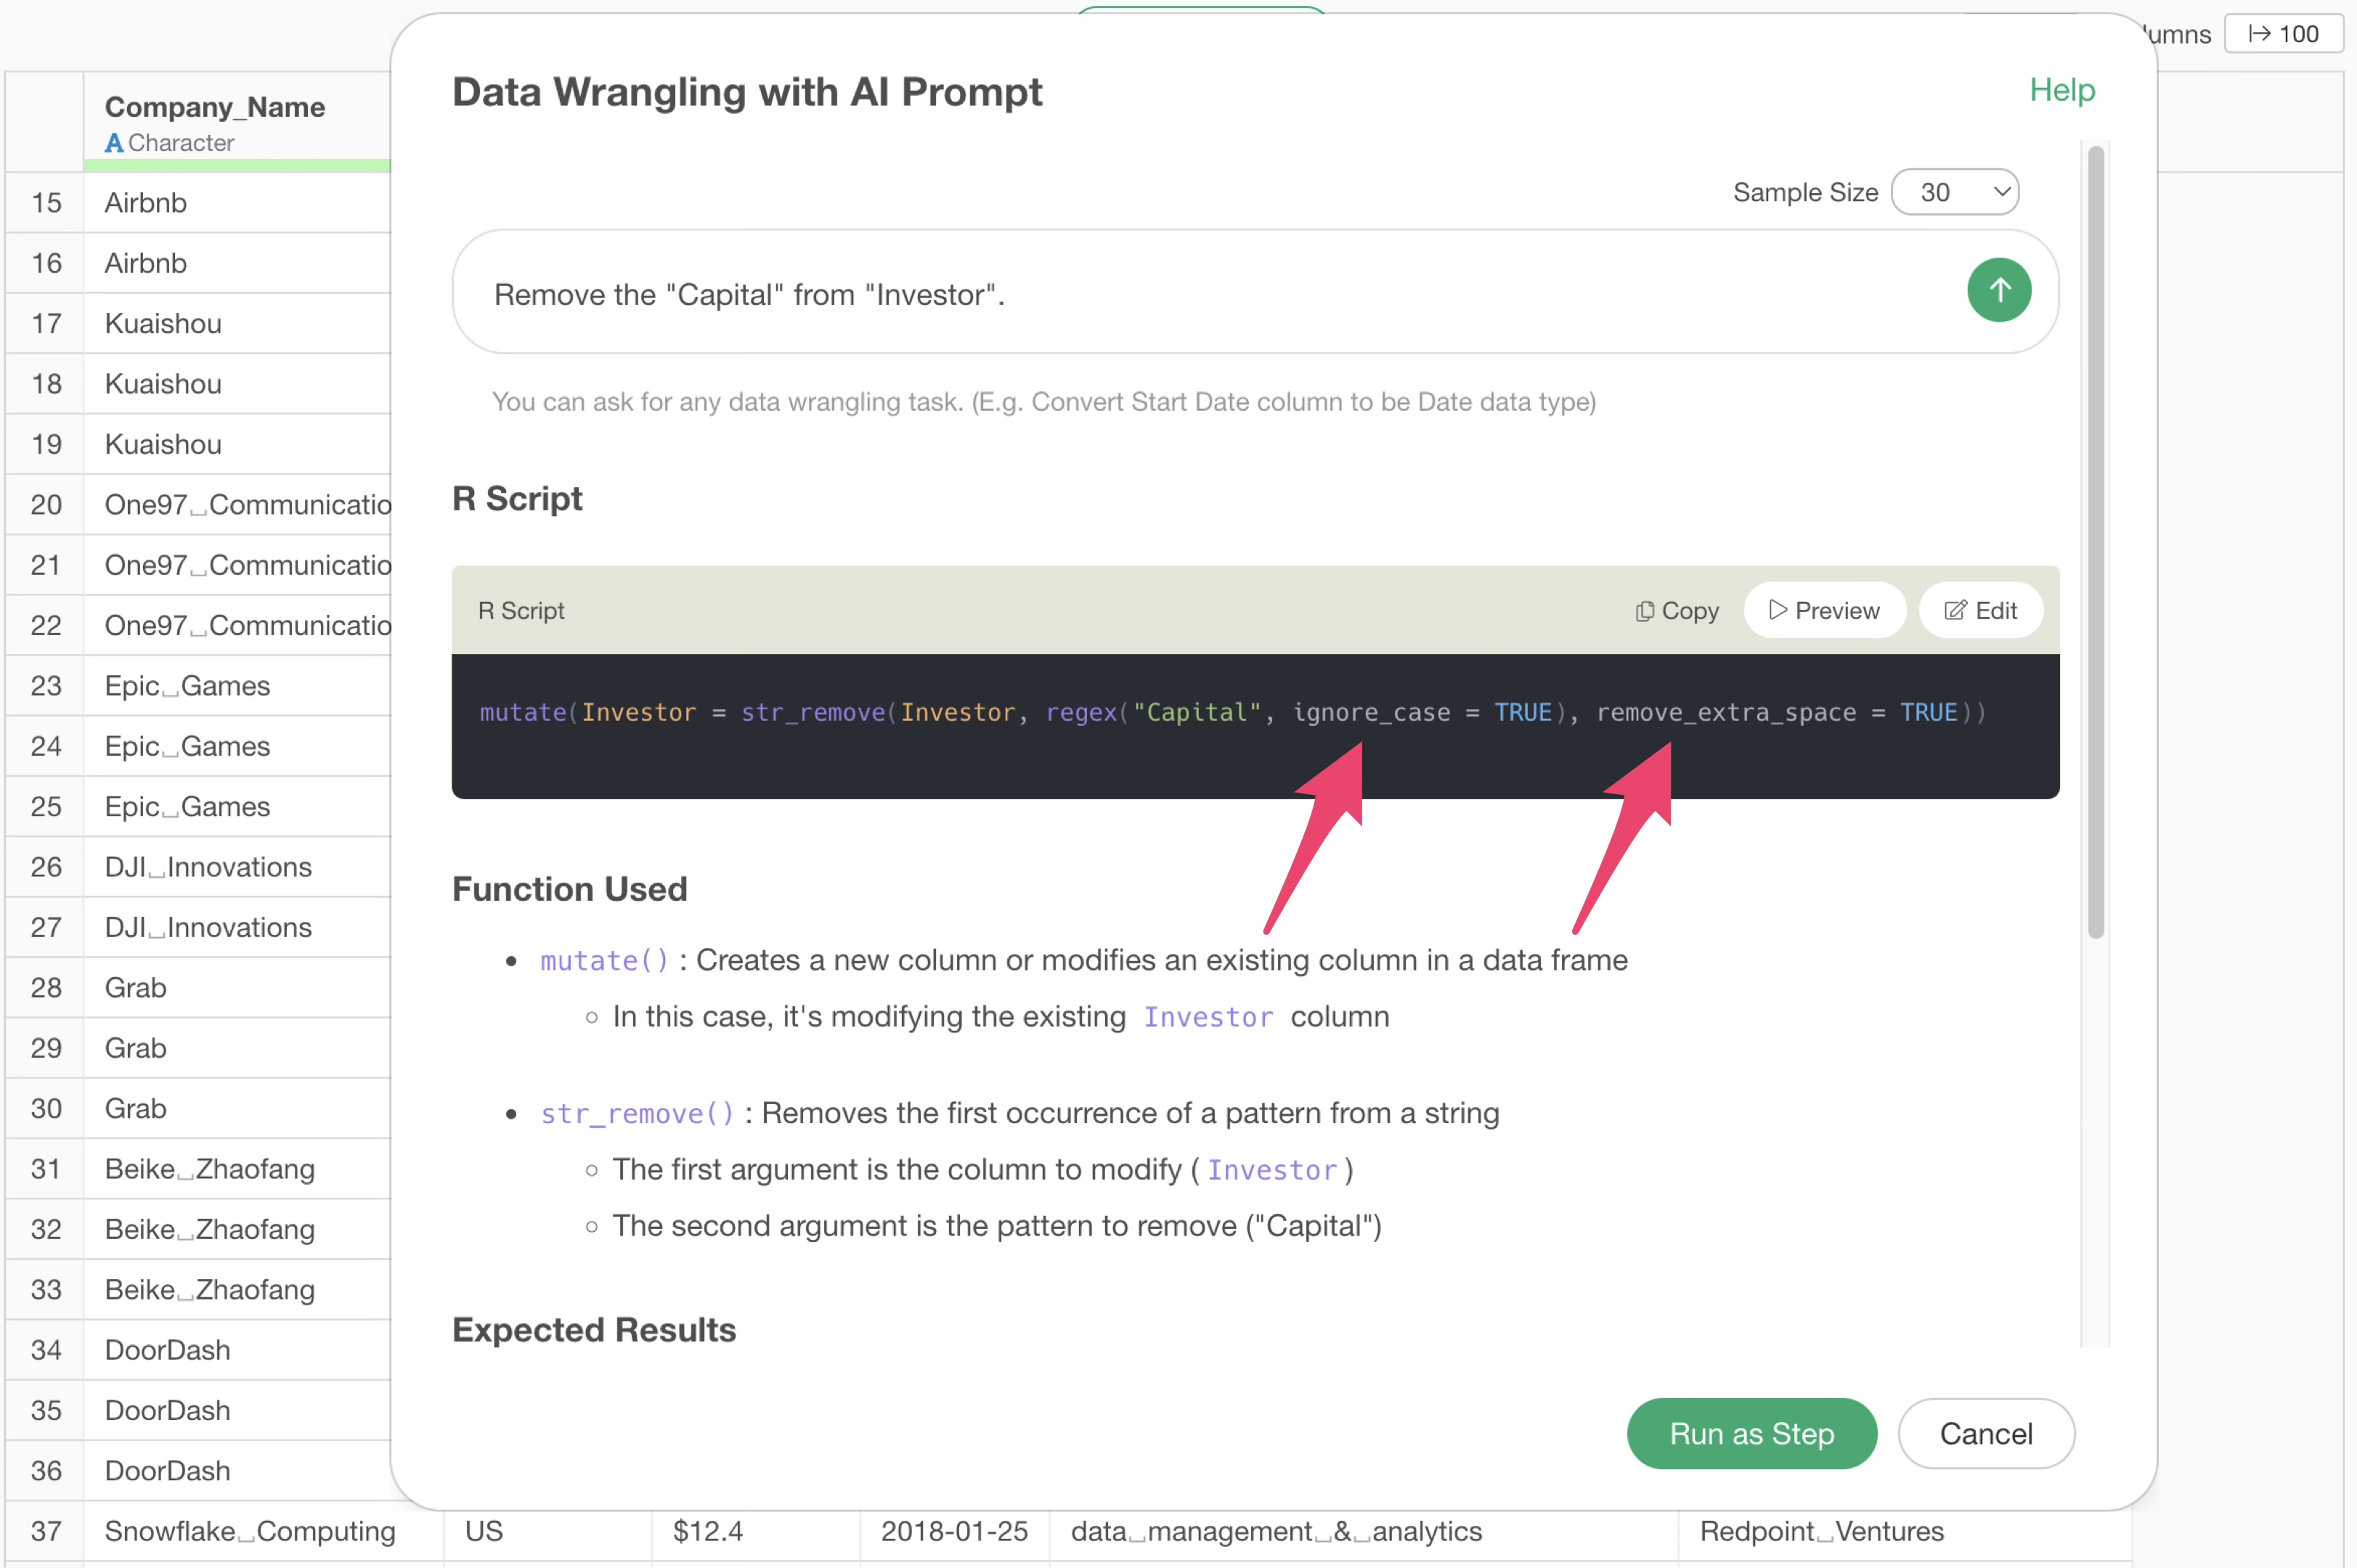
mutate(`Investor` = str_remove(`Investor`, ”Capital”))Result returned by the prompt with double quotes:
mutate(`Investor` = str_remove(`Investor`,regex("Capital", ignore_case = TRUE), remove_extra_space = TRUE))The key points in the result returned when using double quotes are
the ignore_case and remove_extra_space
arguments.
ignore_case = TRUE is an argument that allows processing
to ignore “case sensitivity”. Therefore, “capital” in lowercase, which
was not removed before, is now removed.
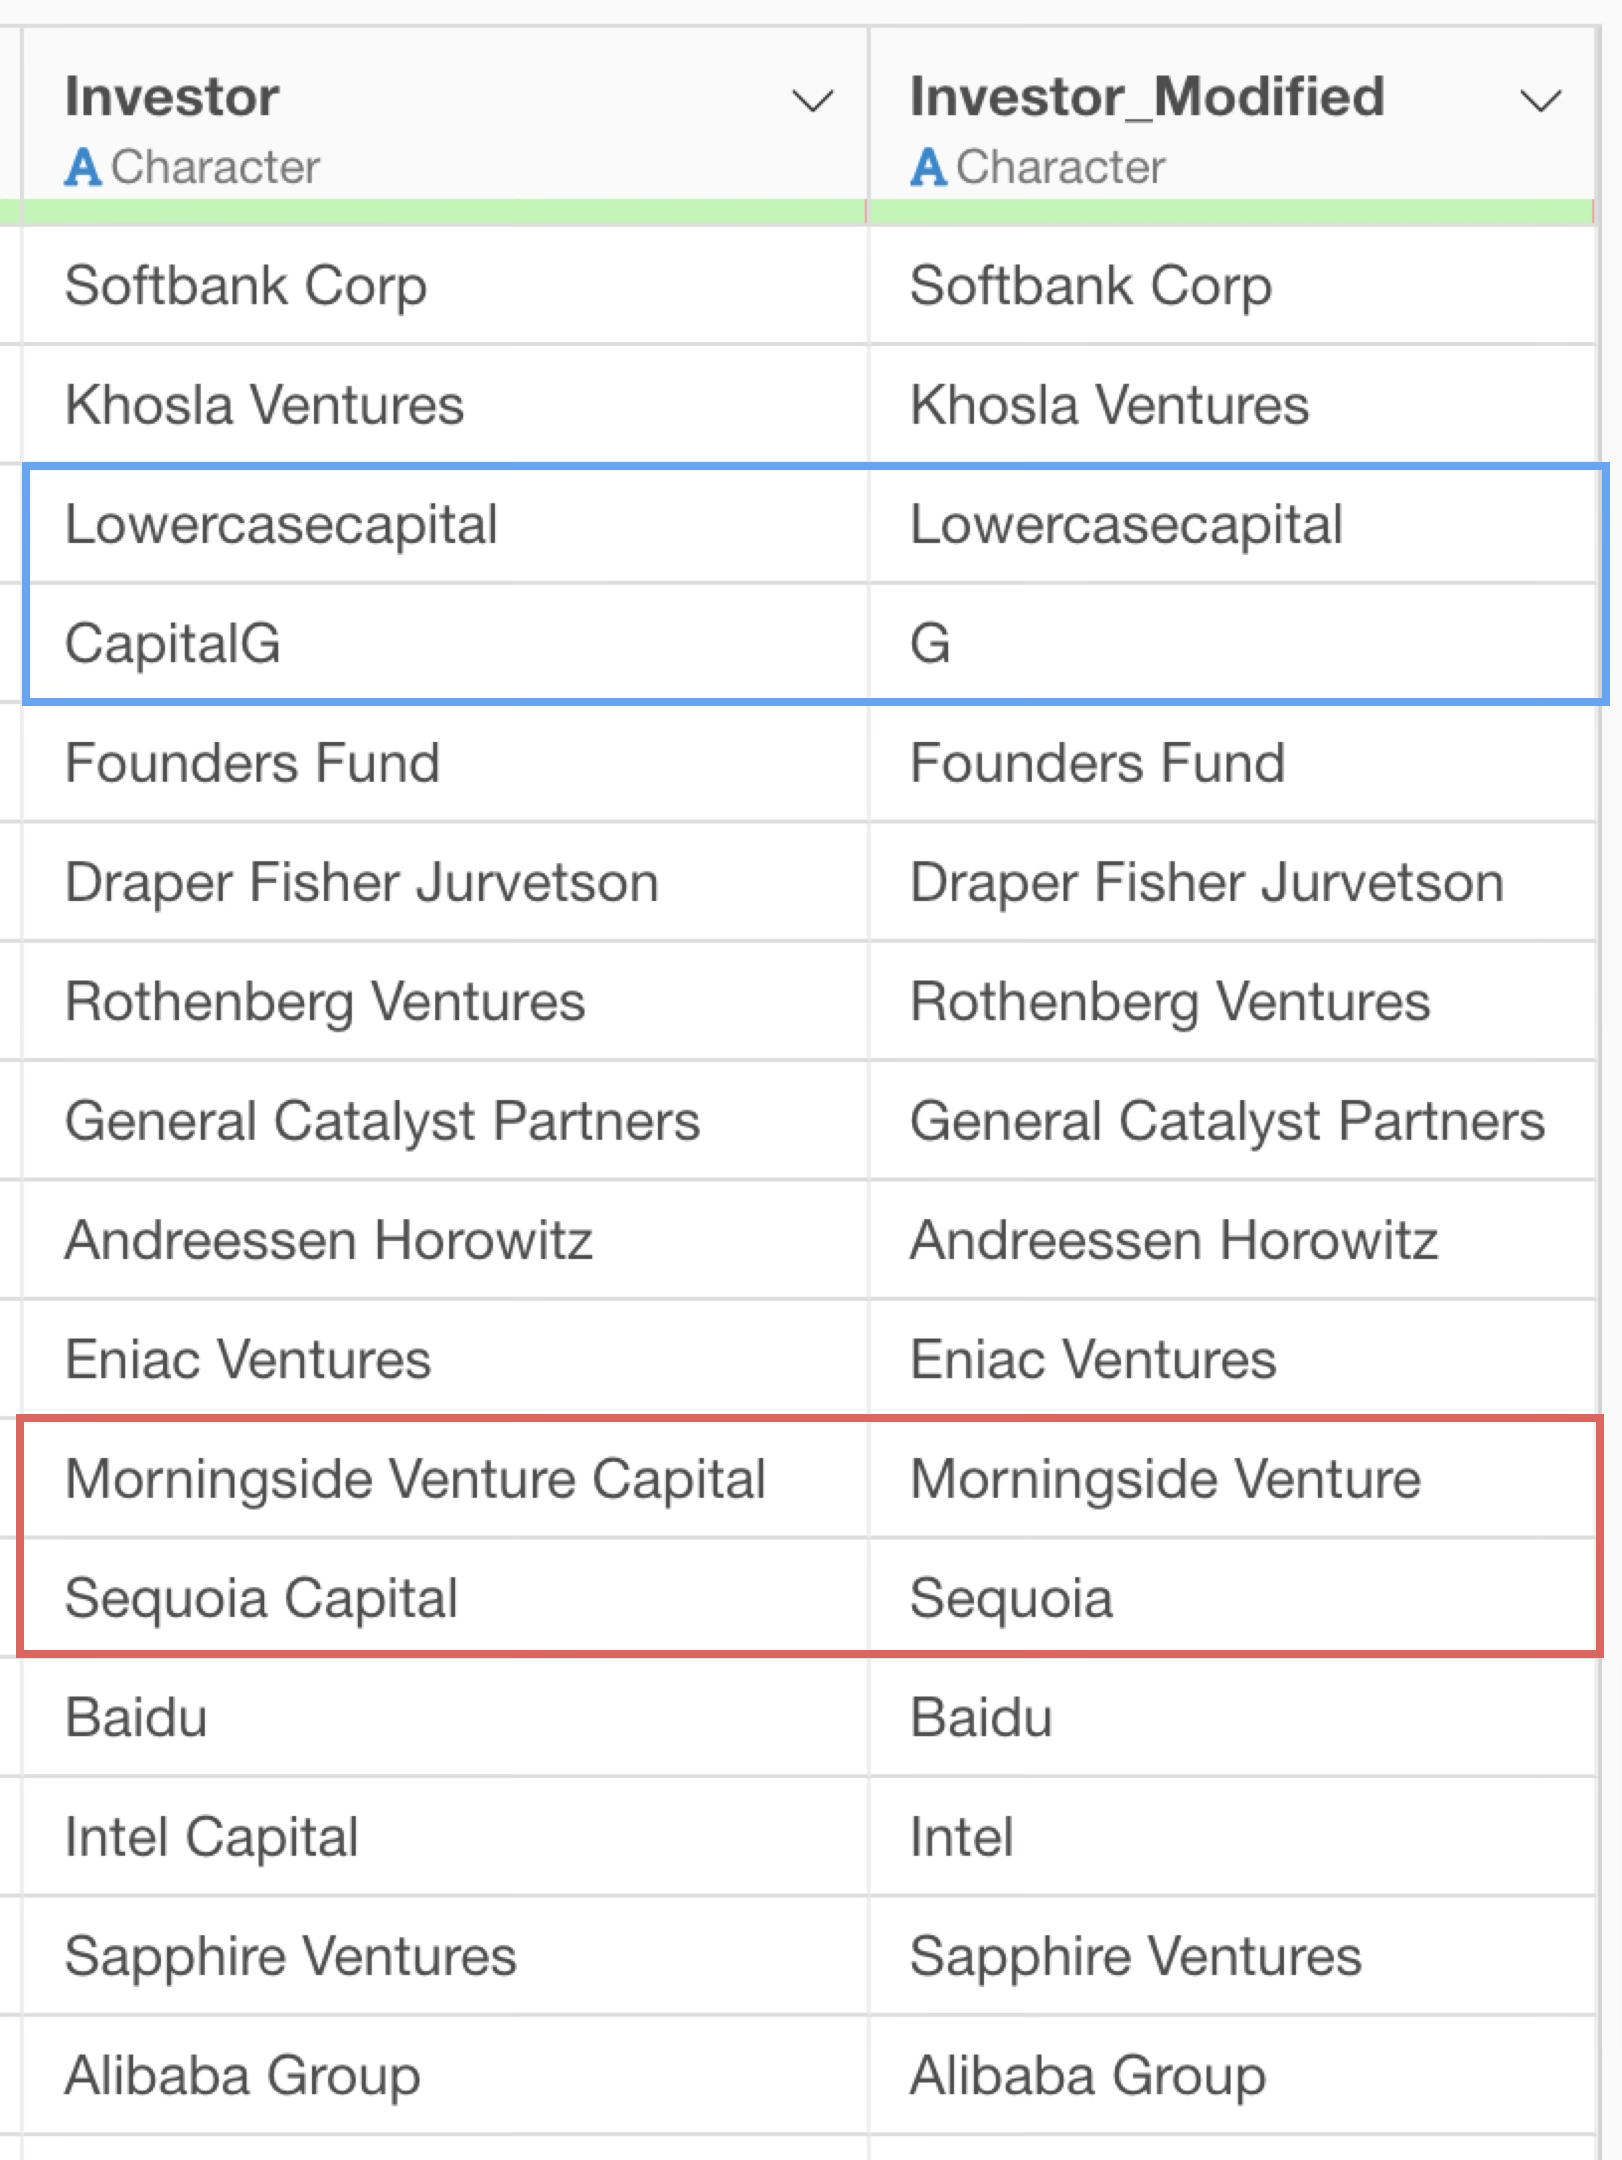
Next, remove_extra_space = TRUE is an argument to remove
unnecessary spaces after processing. This confirms that the original
space is removed when “Capital” is deleted.
 Thus,
if text data processing does not return the desired results, try
enclosing the column name or specified text in double quotes!
Thus,
if text data processing does not return the desired results, try
enclosing the column name or specified text in double quotes!
Appendix
The AI Prompt feature offers far more exciting uses than the data processing supported by Exploratory’s UI to date. Here are a few examples of how it can be used.
Batch Column Name Replacement
For example, in survey data, it is common to use question numbers such as “Q1” and “Q2” as column names.
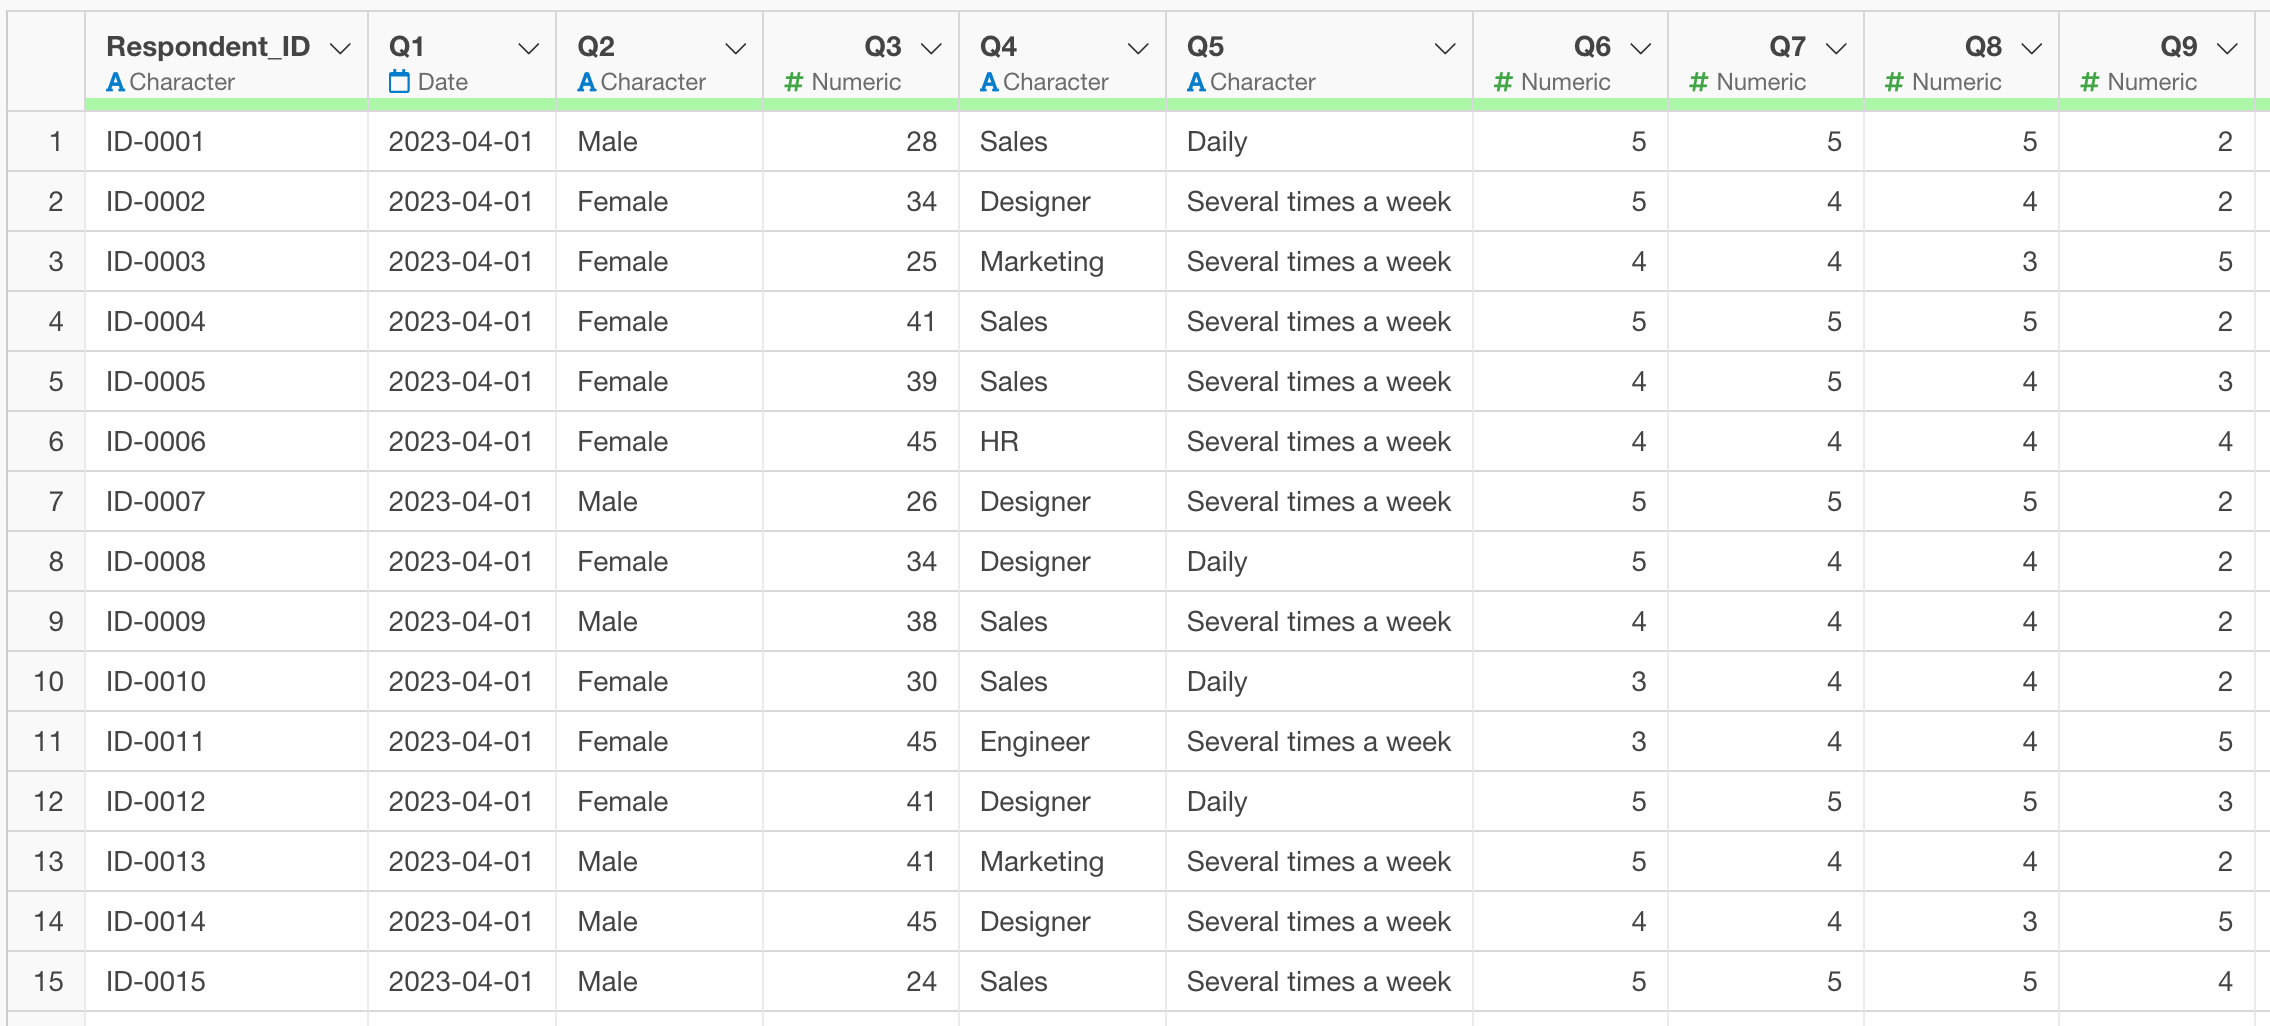
With such data, if you try to analyze it, you won’t know what the question numbers represent, so you need to associate each question number with its corresponding question name. Therefore, you want to replace the question to the exact description.
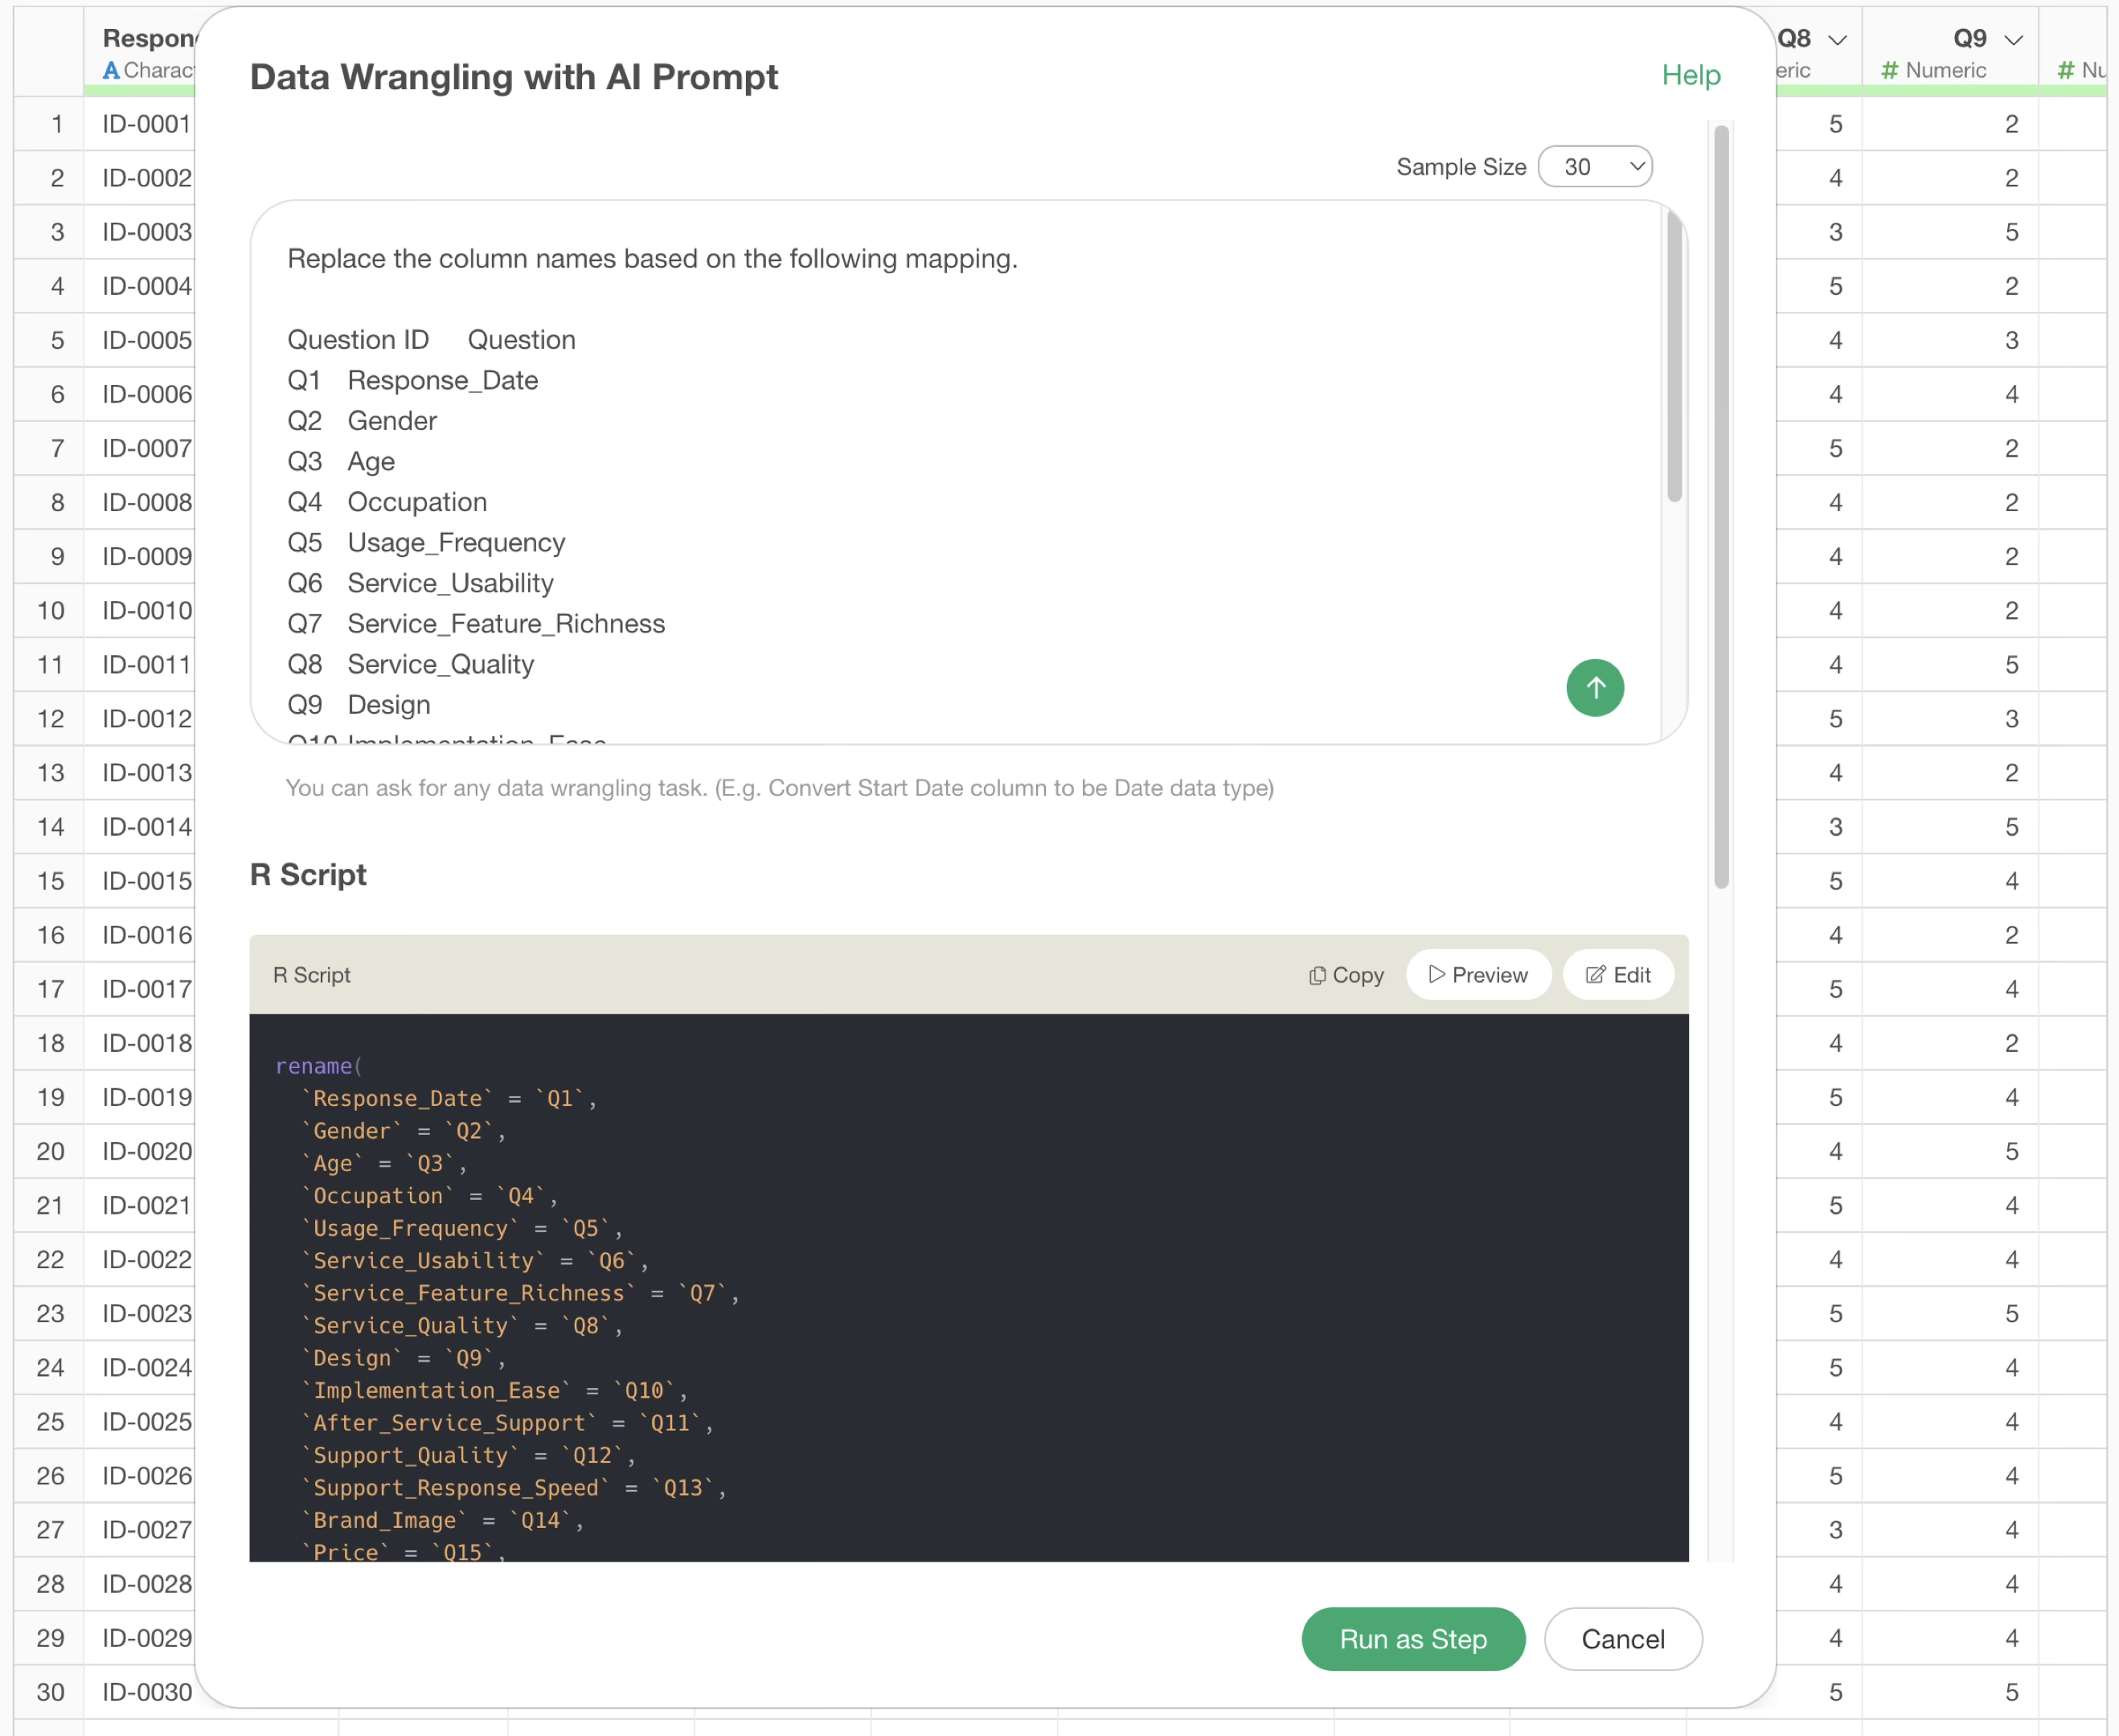
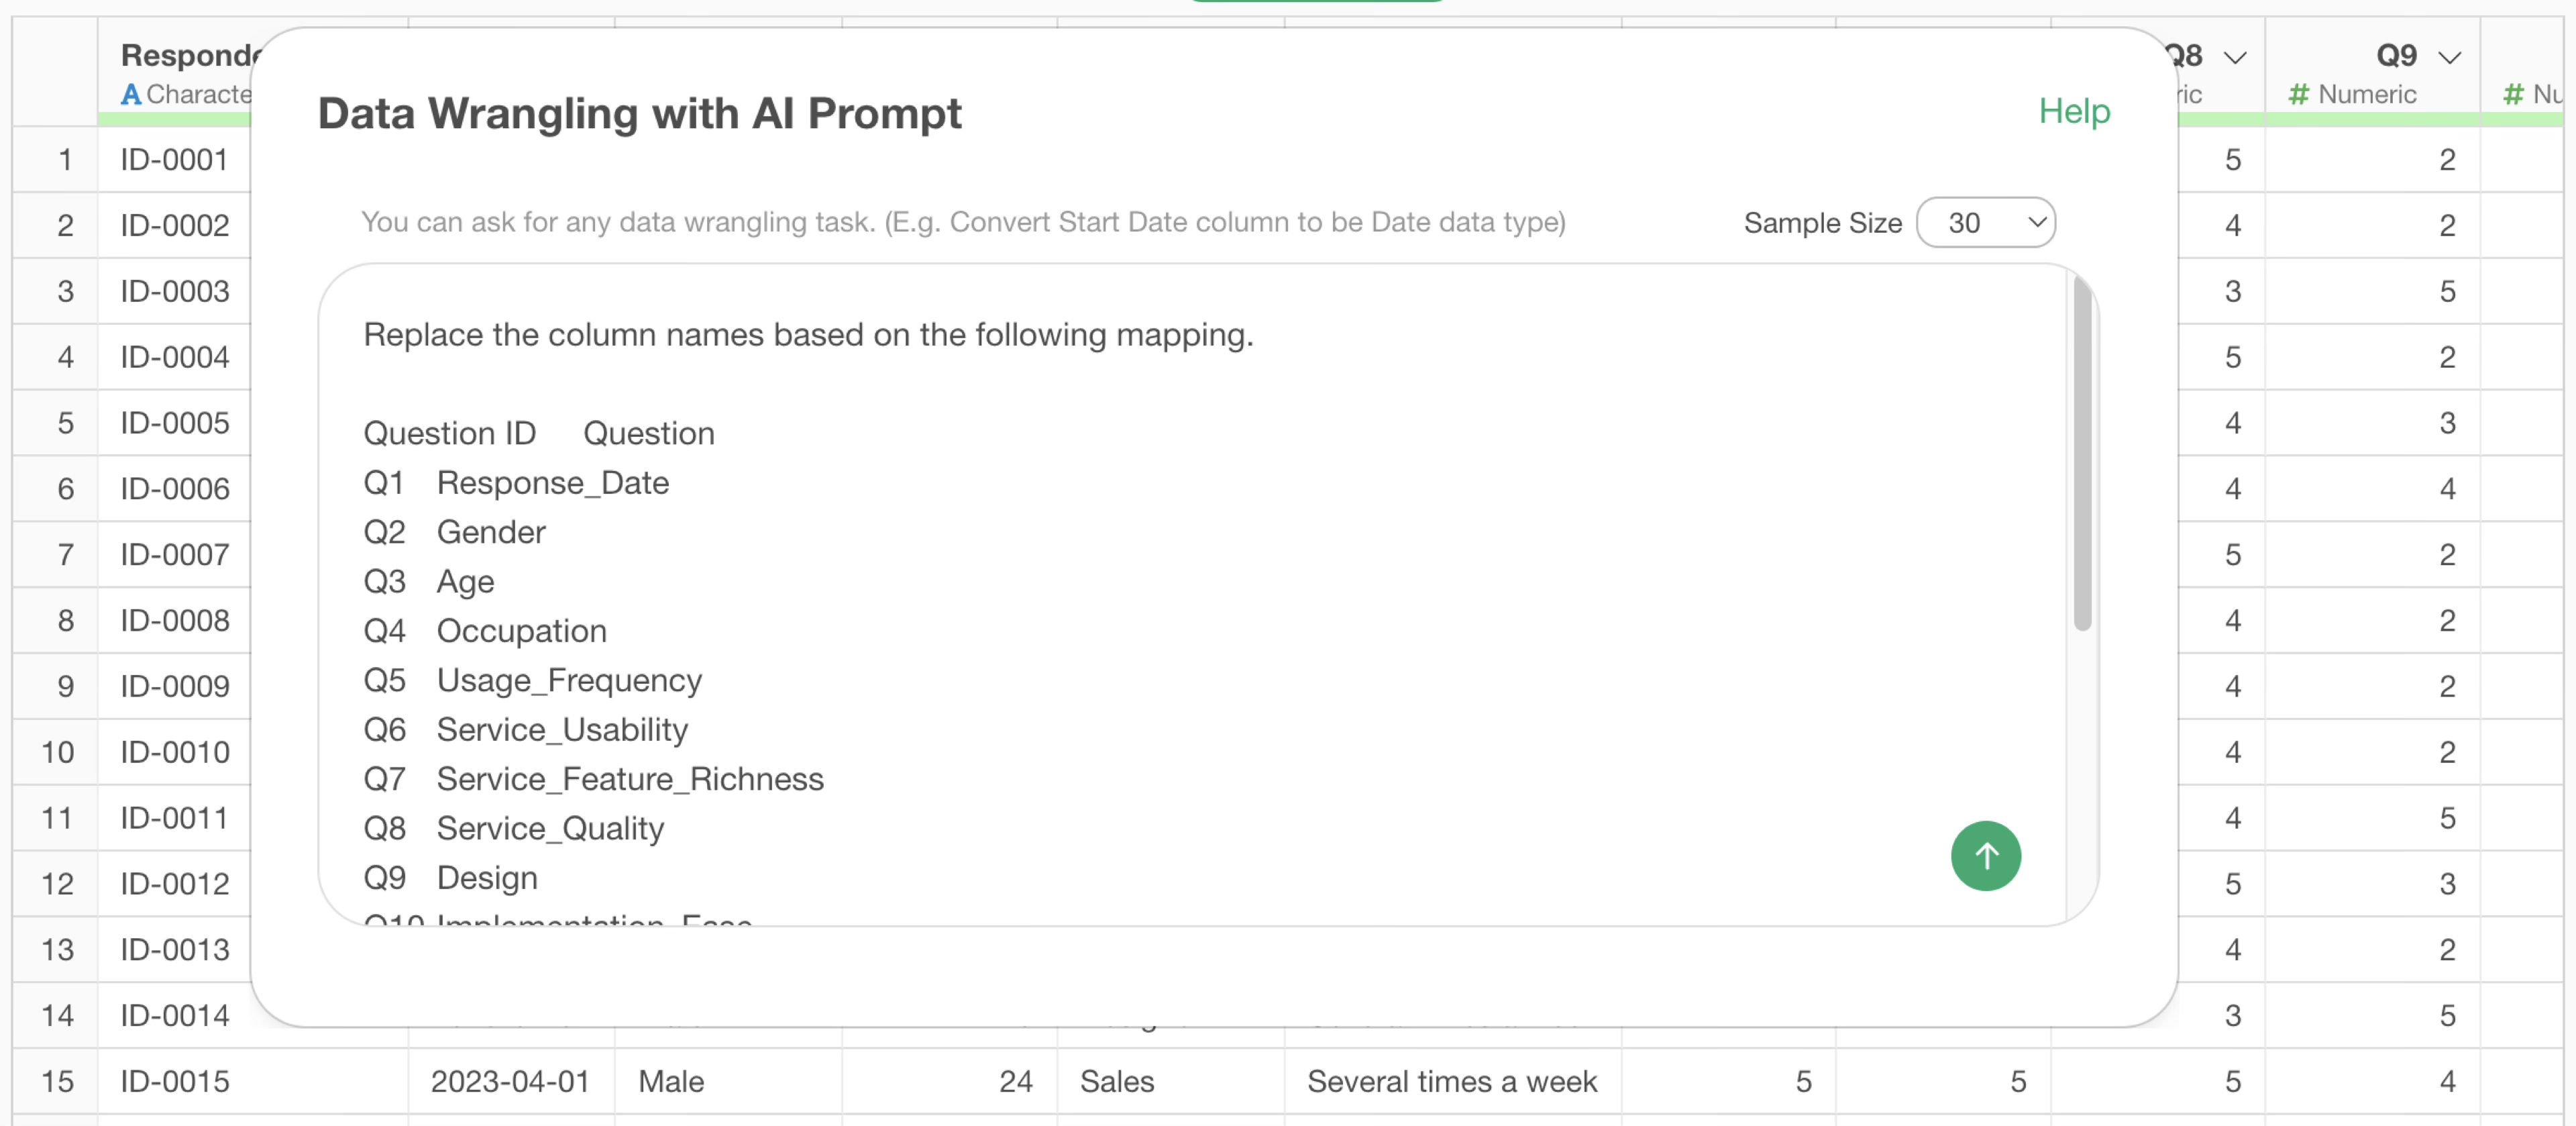
Therefore, specify and execute the following in the prompt.
Replace the column names based on the following mapping.
Question ID Question
Q1 Response_Date
Q2 Gender
Q3 Age
Q4 Occupation
Q5 Usage_Frequency
Q6 Service_Usability
Q7 Service_Feature_Richness
…
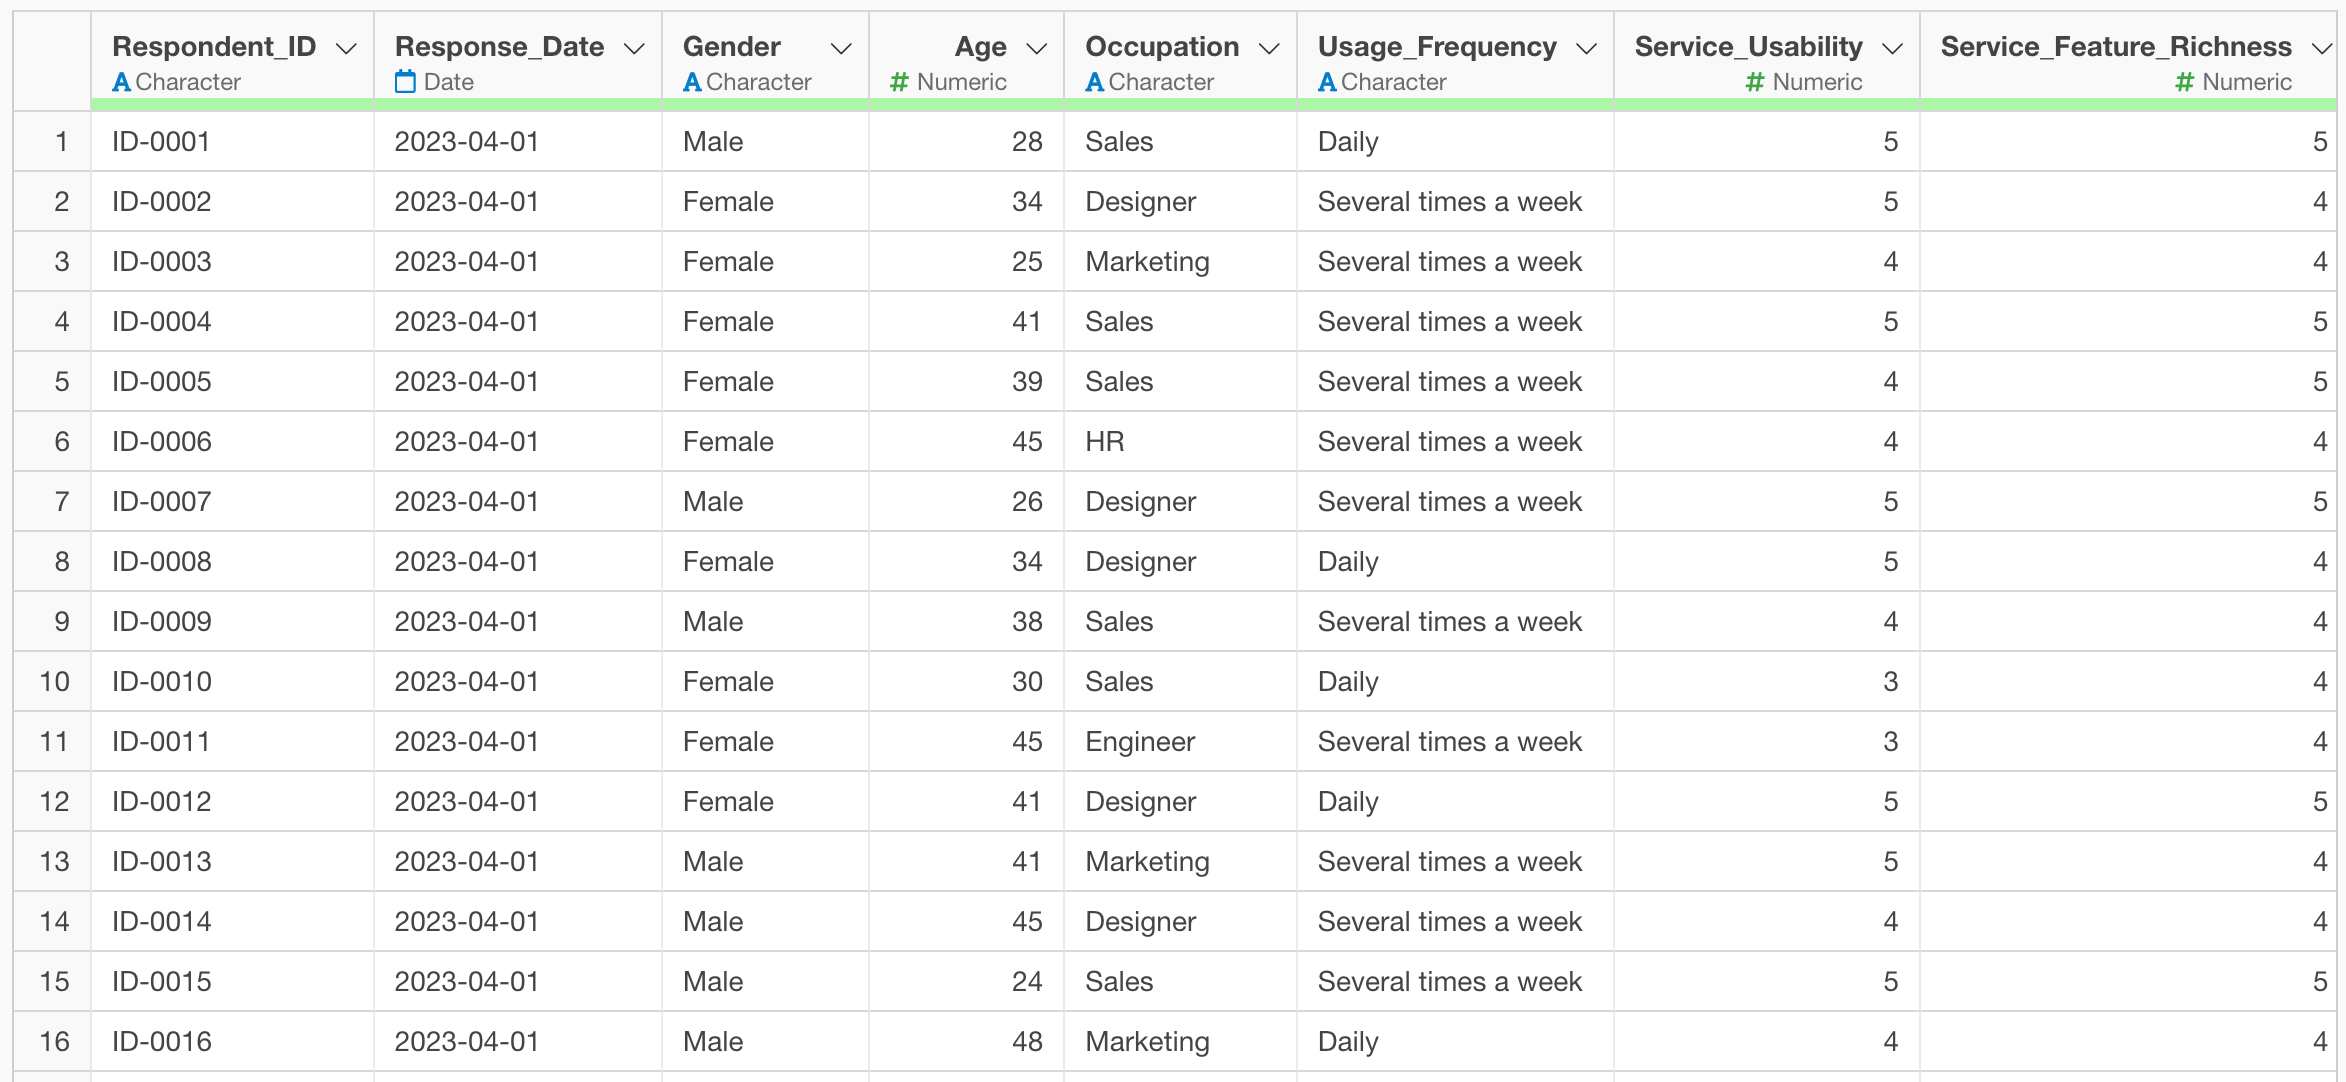
Q19 Reasons for RecommendationThis returns an R command that replaces the column names, which were question numbers, with the question names all at once.
By executing it, we were able to replace the column names all at once! In this way, column name replacement, which used to be tedious, can now be done easily and quickly using the AI Prompt feature.
Batch Value Replacement
Earlier, we introduced an example of replacing question numbers in column names with question names, but it is also possible to replace values in bulk. In the example of survey data, gender, age, and occupation may also be stored as numerical raw data.
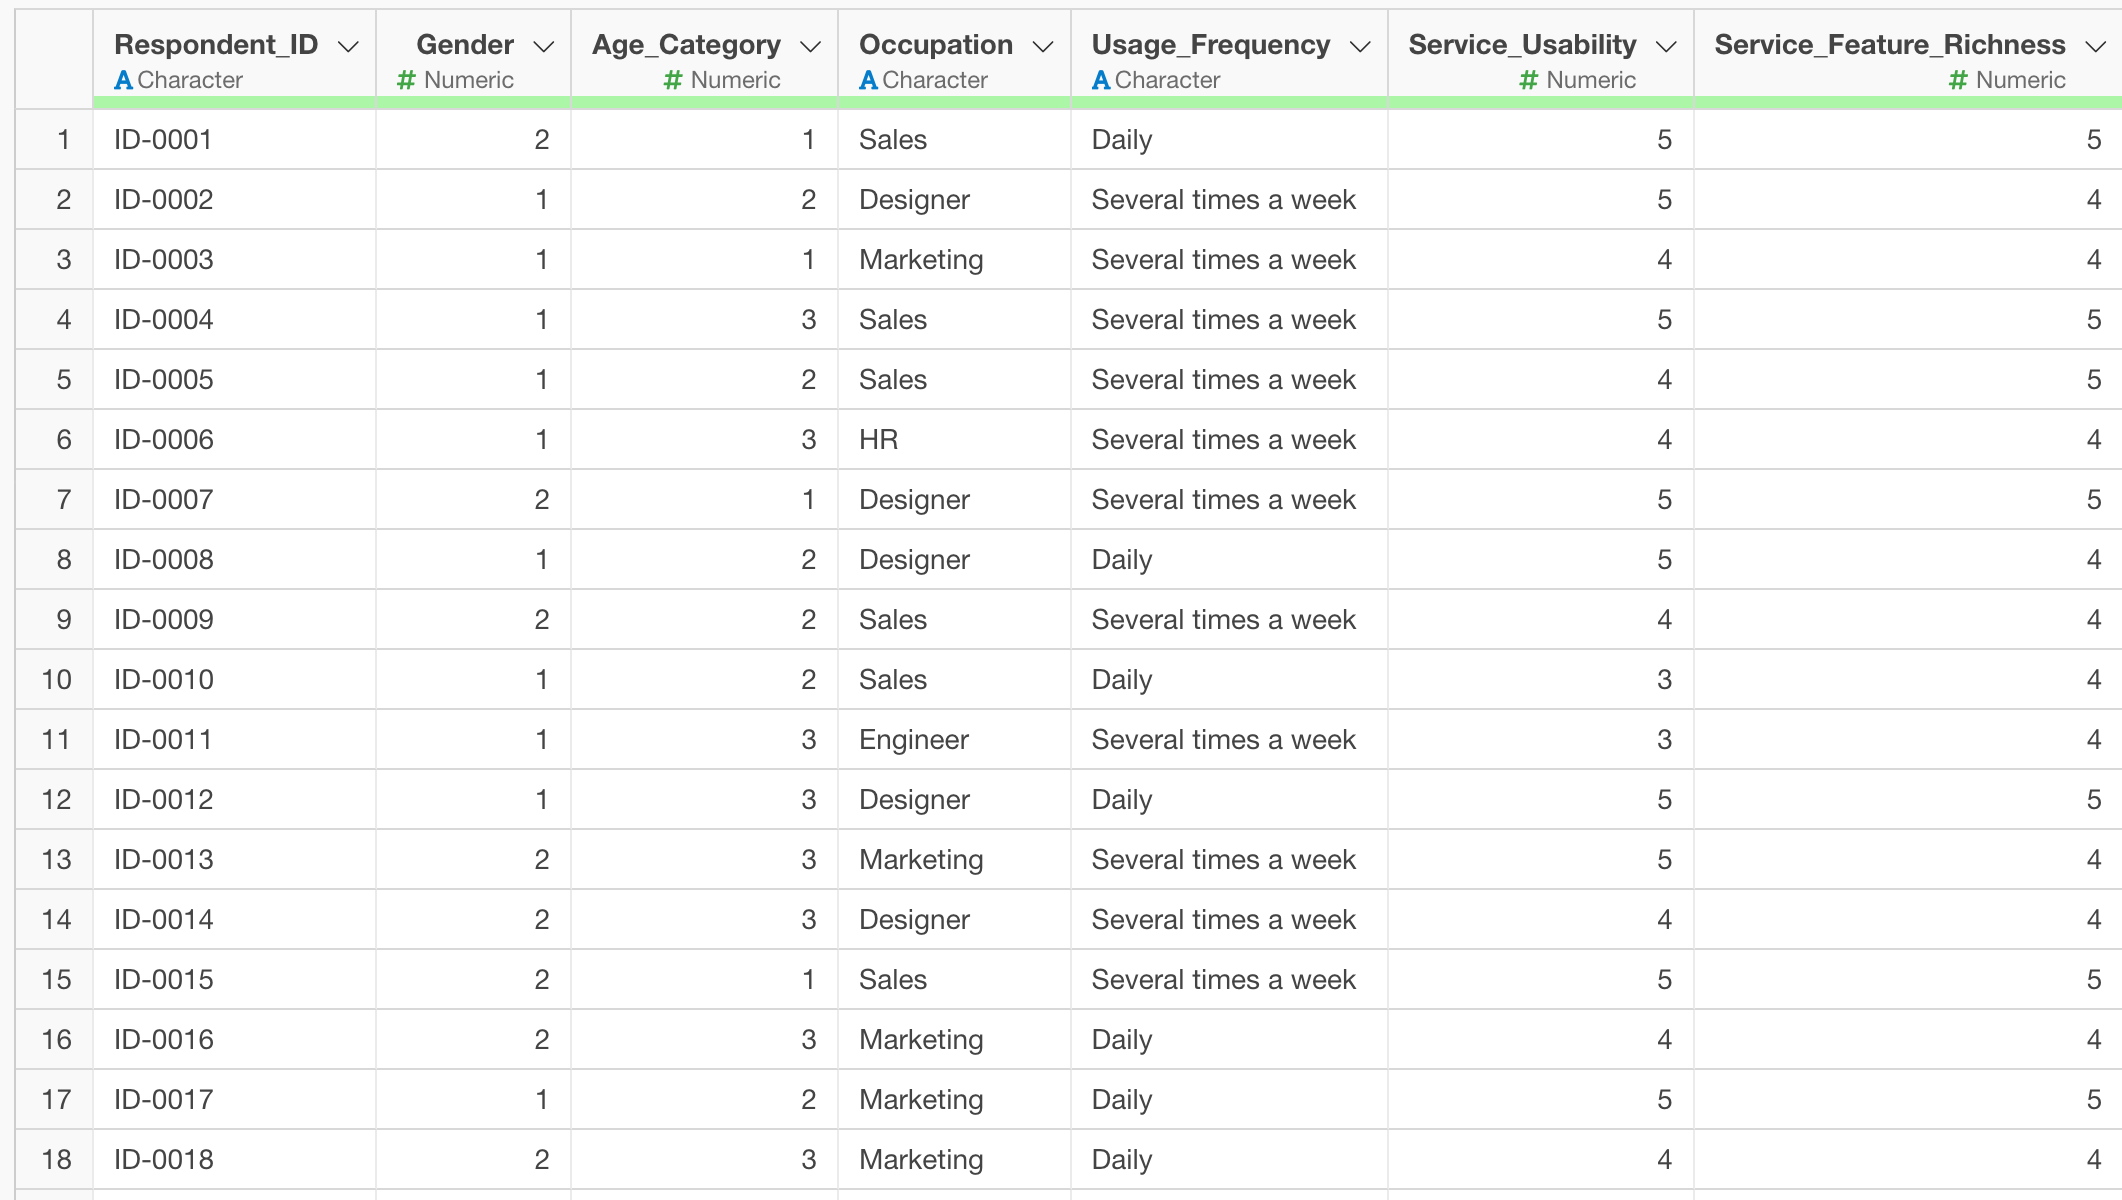
Therefore, suppose you want to replace each question name and answer number with the corresponding answer label in bulk. In this example, you want to change the value 1 for gender to the label “Female”, and the value 1 for age to the label “20s”.
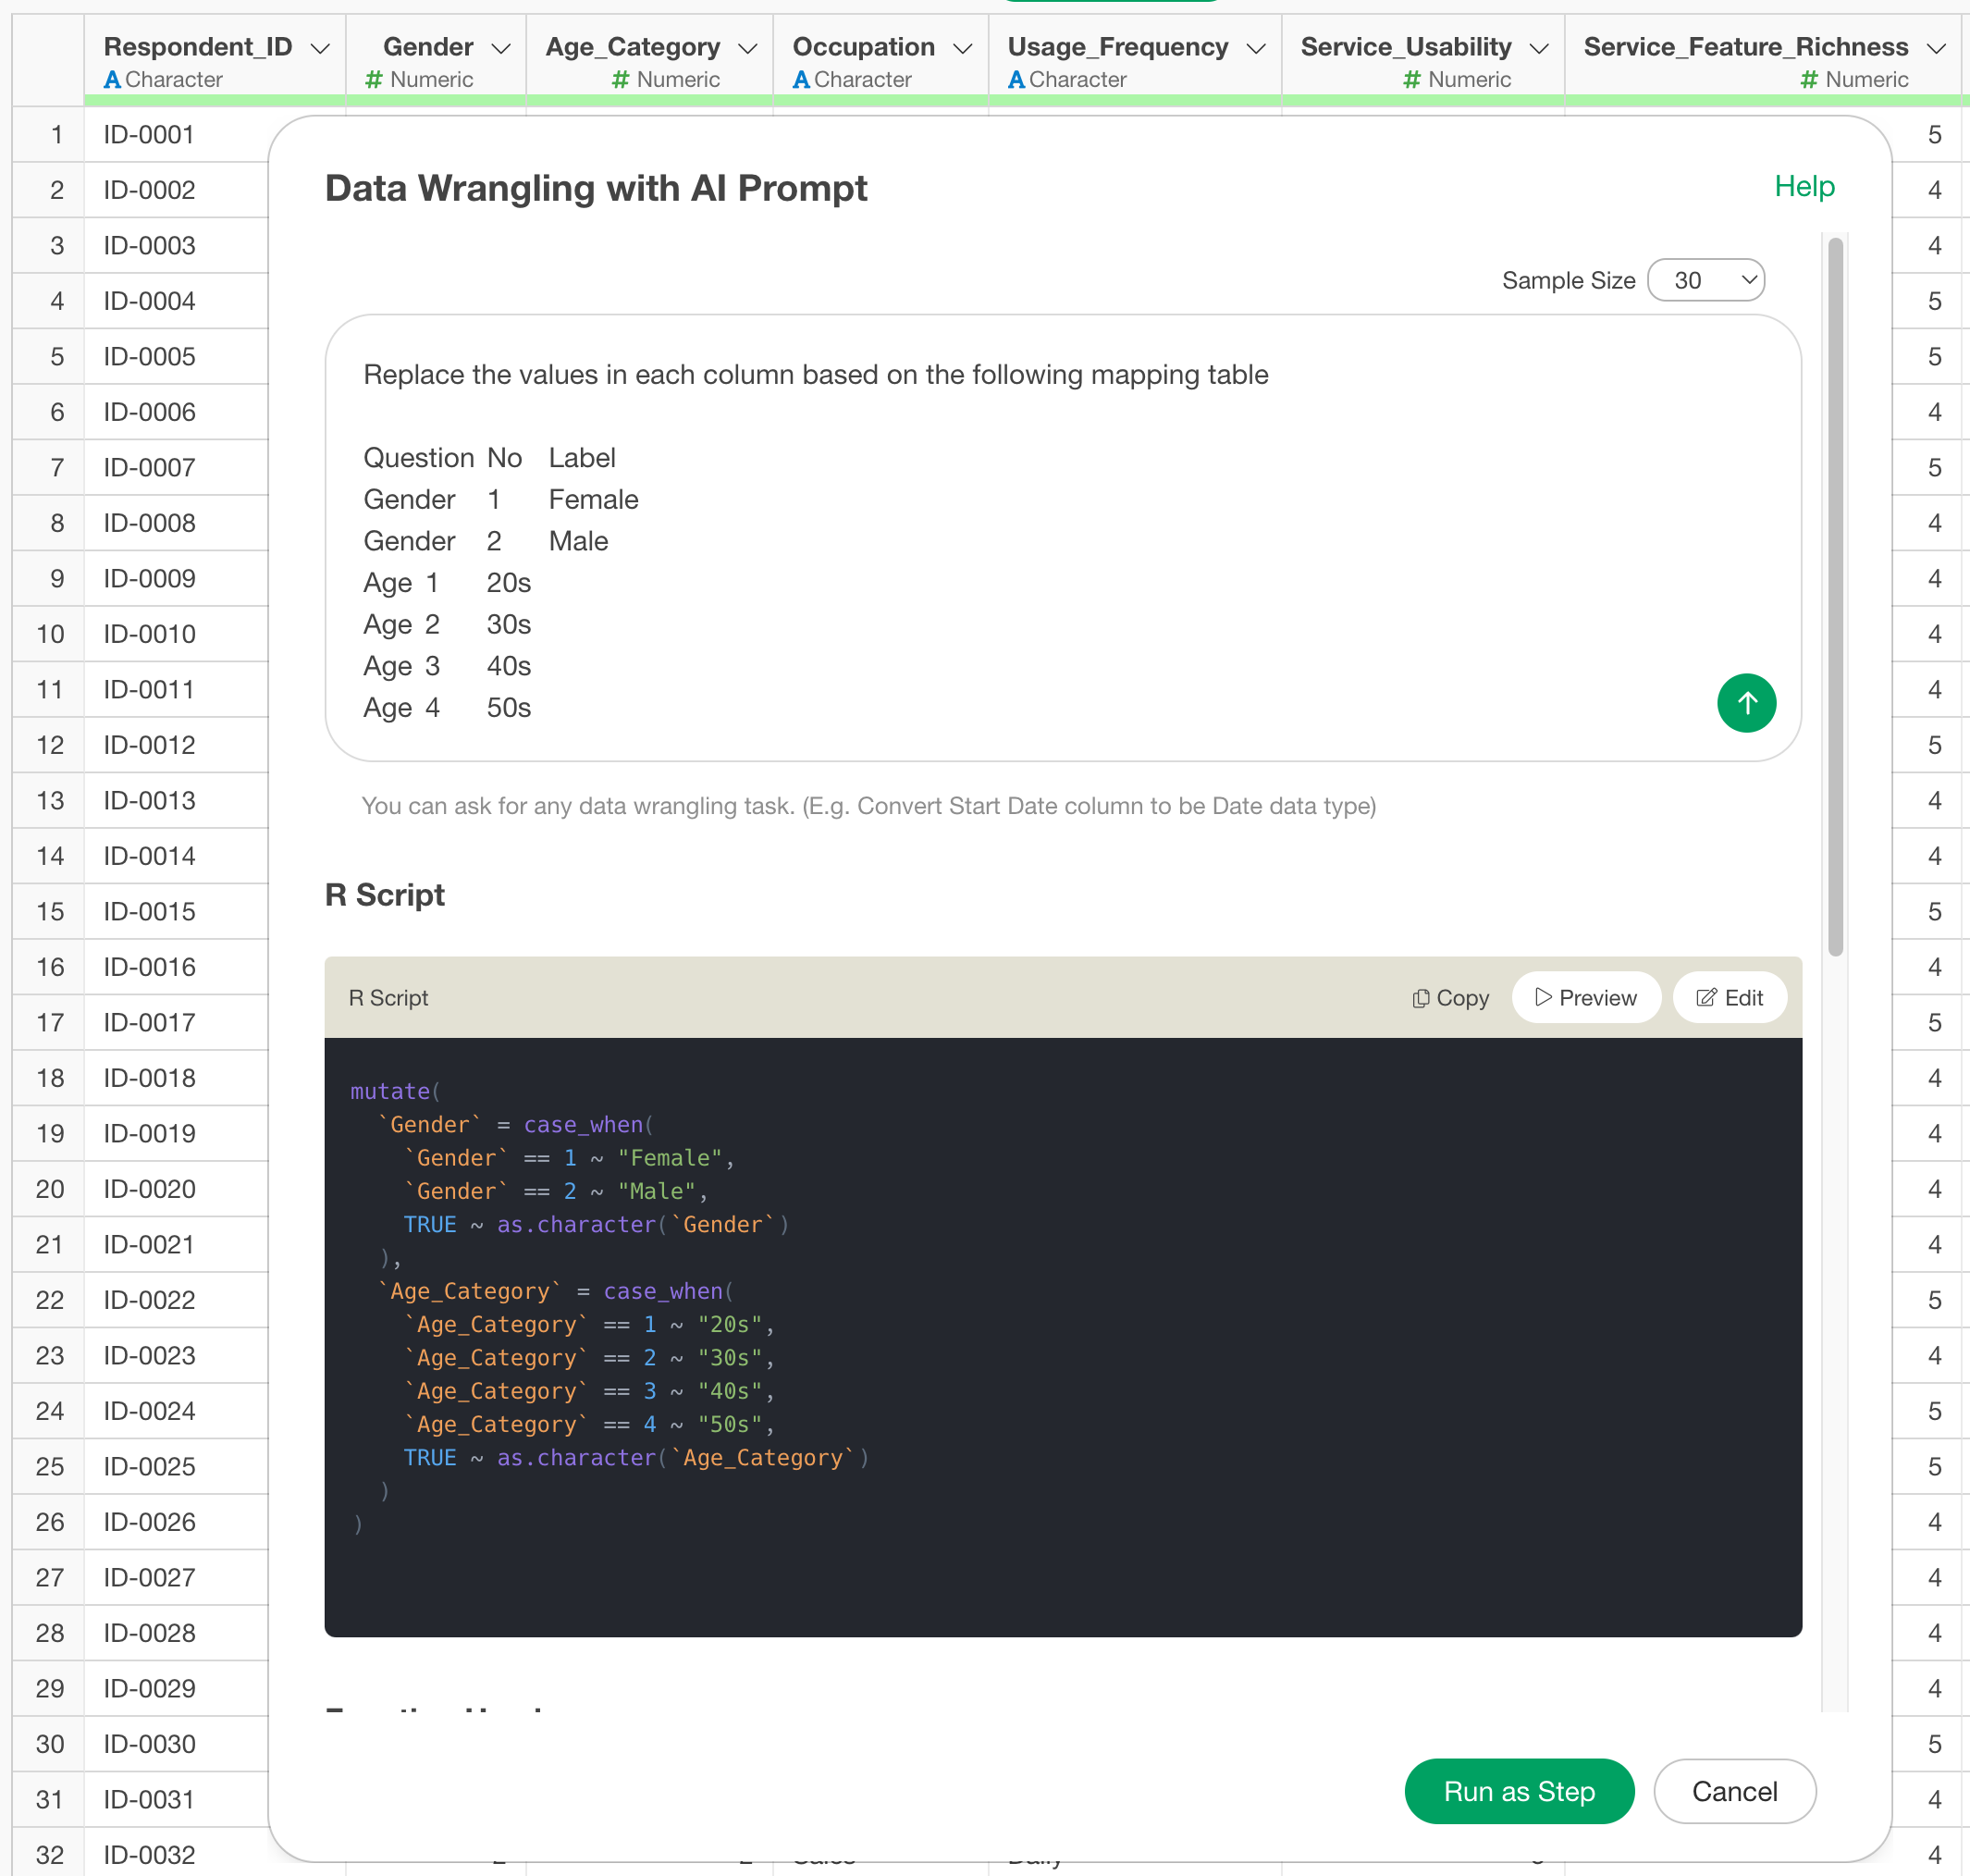
Therefore, specify and execute the following in the prompt.
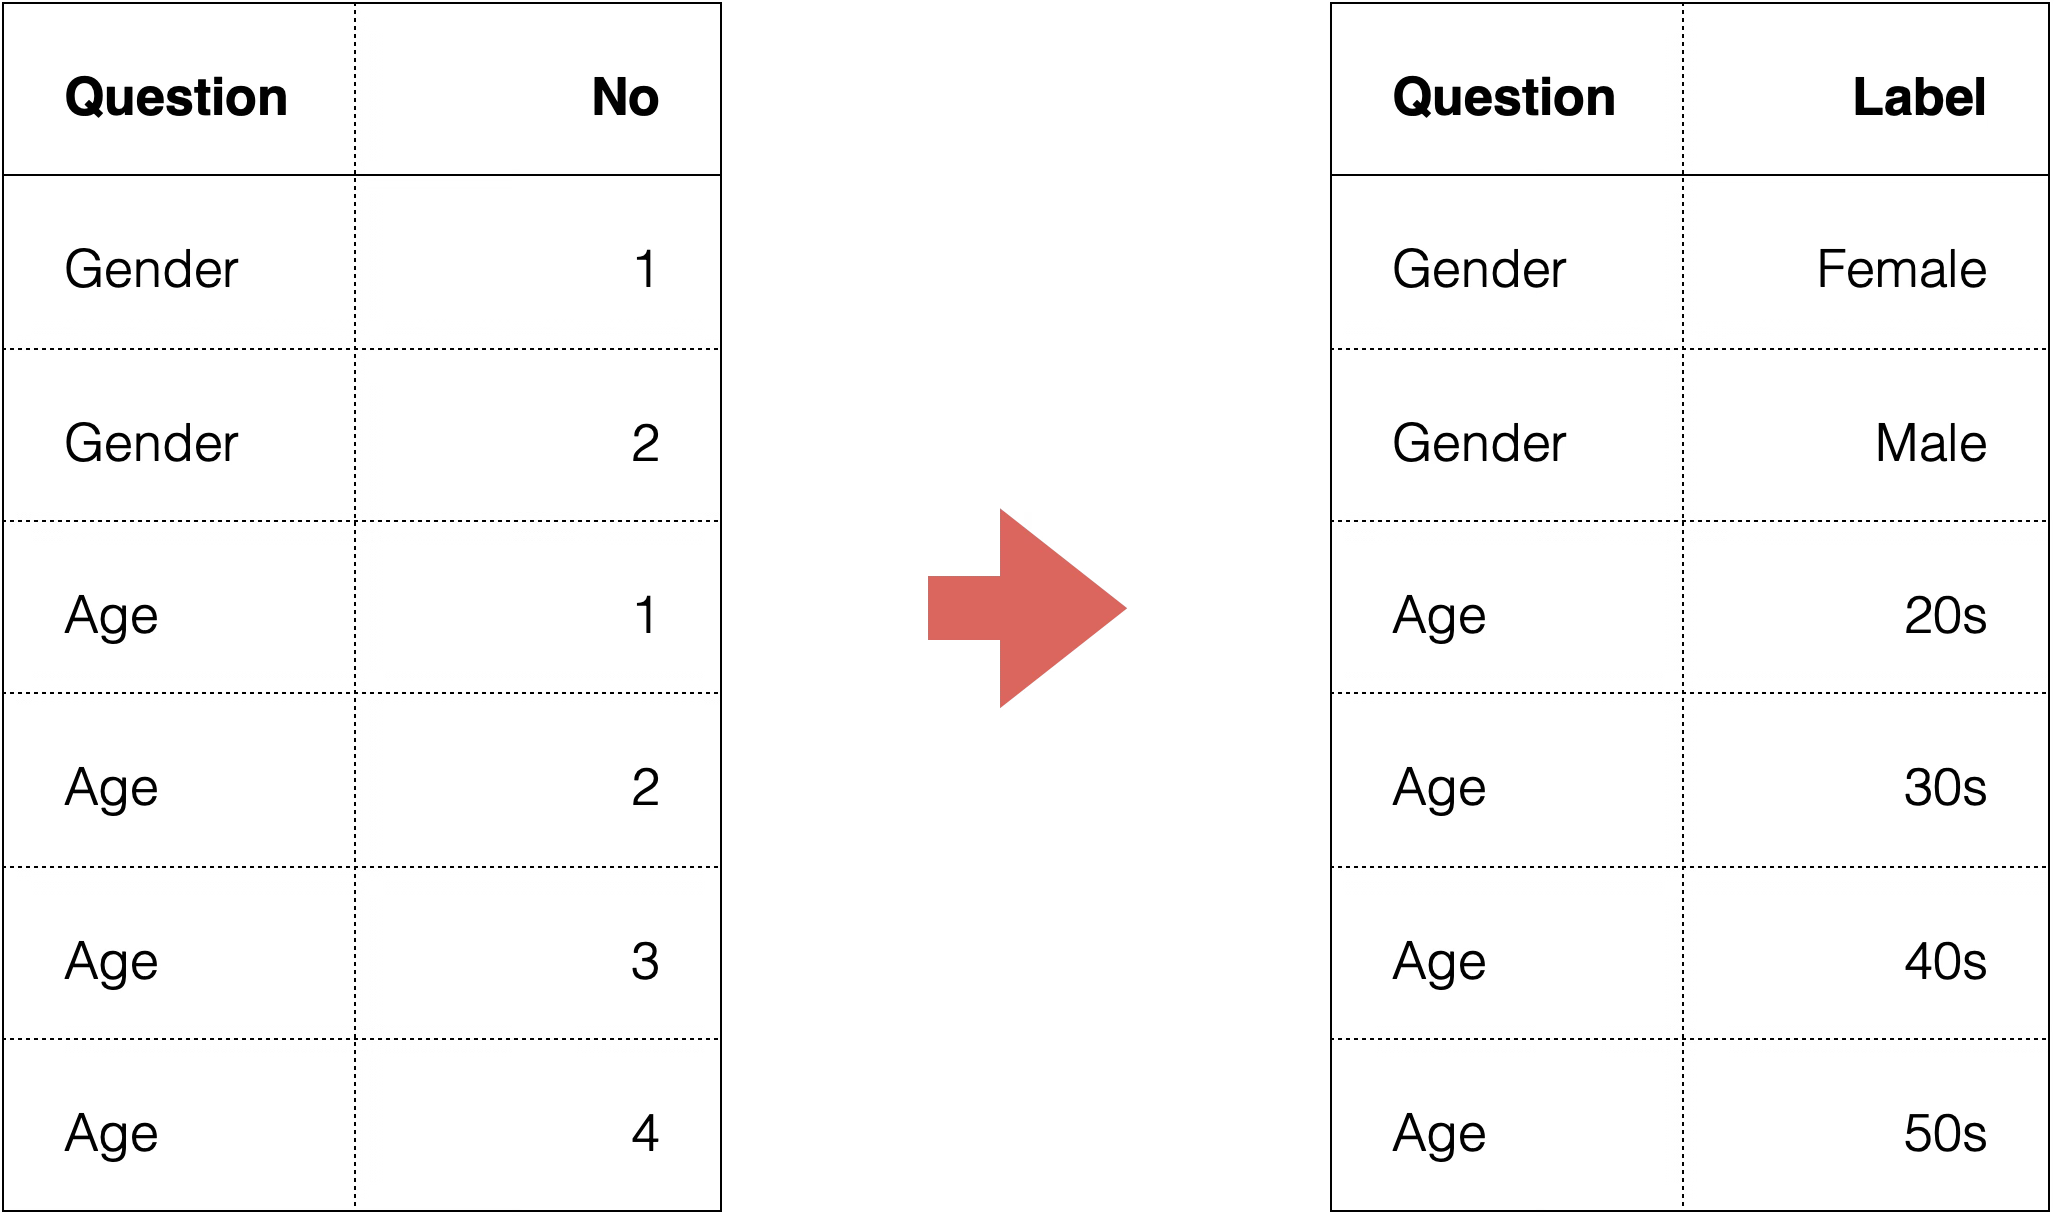
Replace the values in each column based on the following mapping table

Question    No  Label
Gender  1   Female
Gender  2   Male
Age 1   20s
Age 2   30s
Age 3   40s
…
This returns an R command that replaces the answer numbers with the corresponding labels all at once.
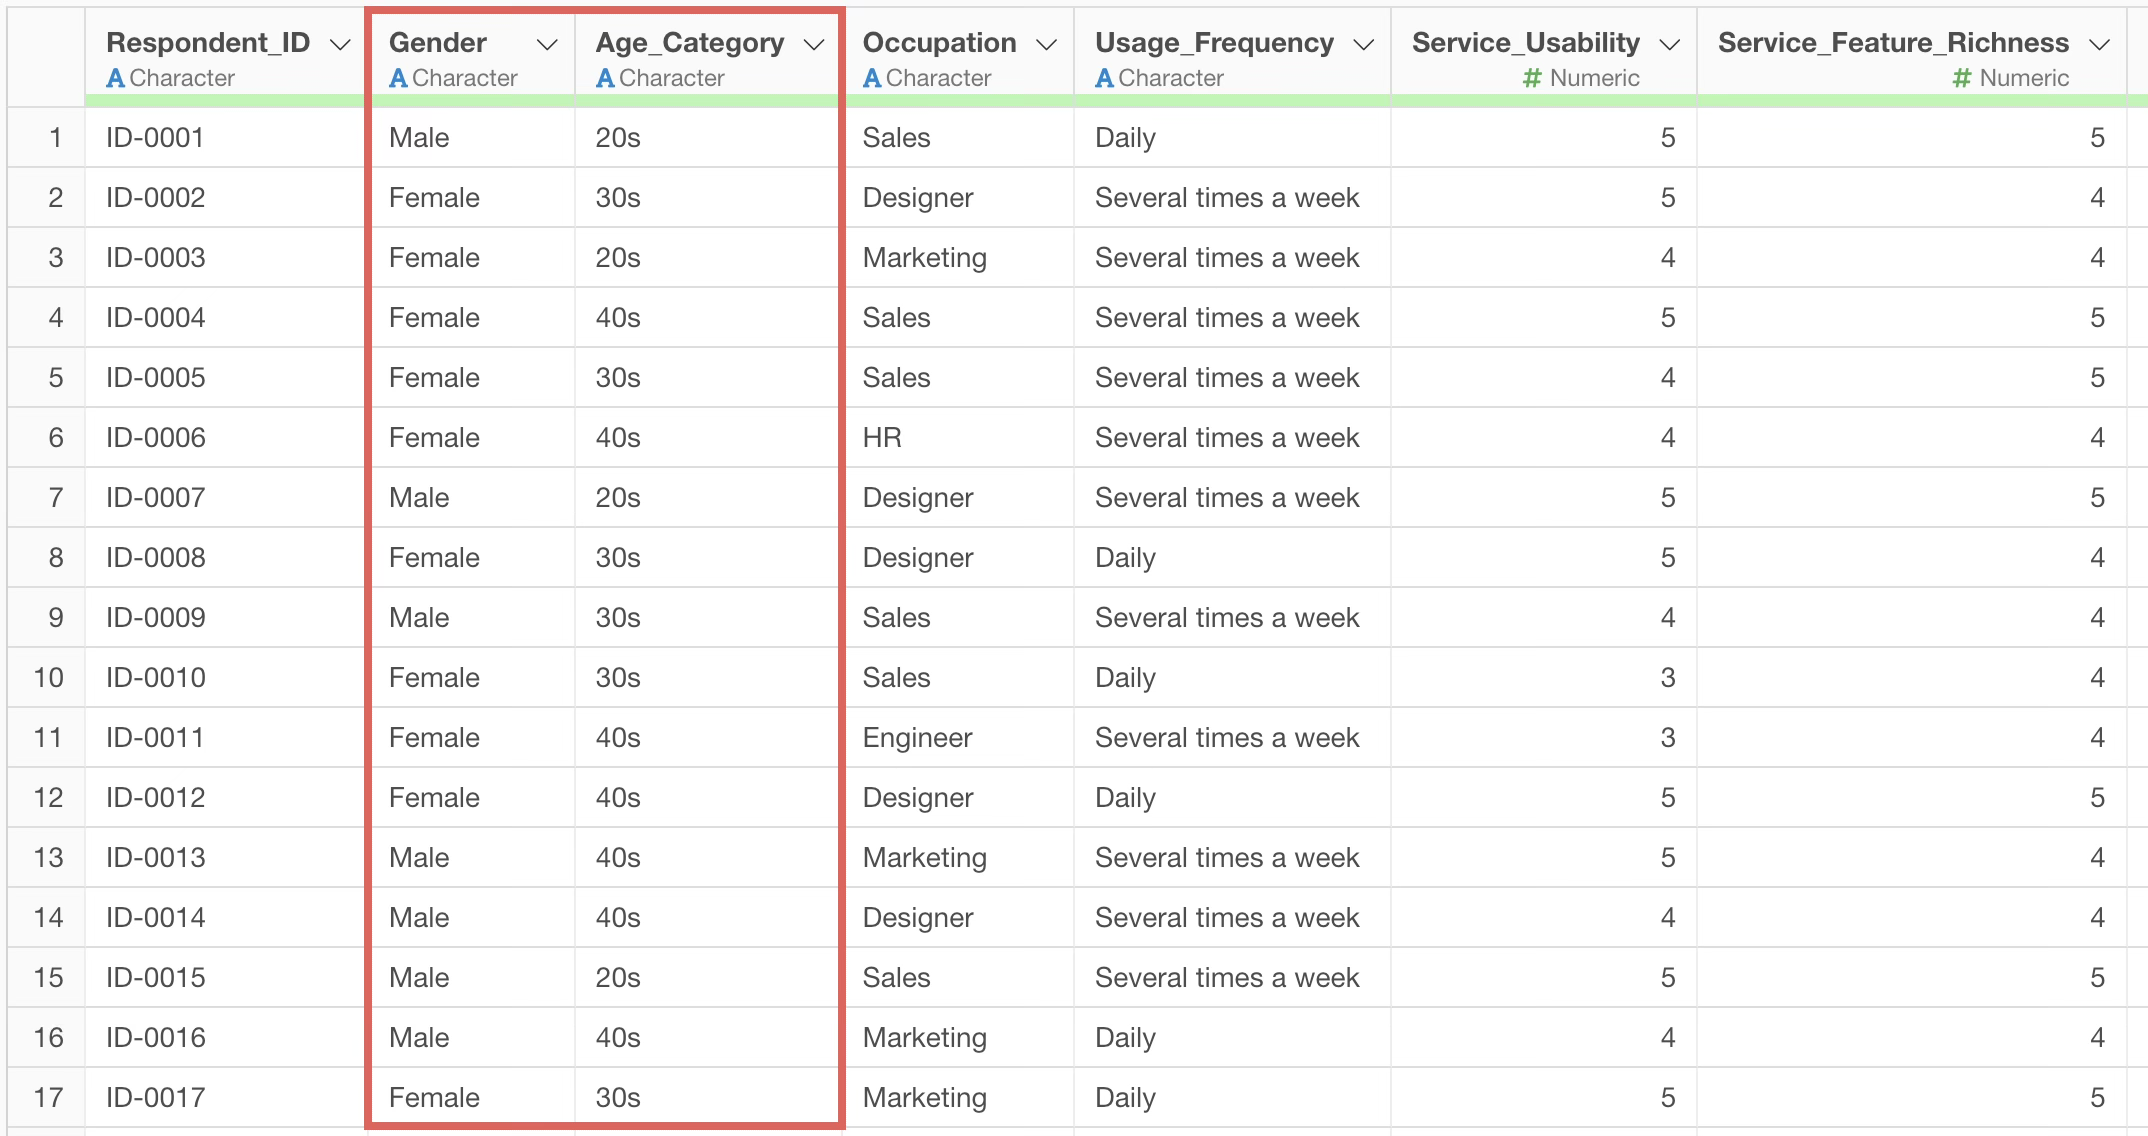
By executing it, we were able to replace the values all at once! Value replacement can also be done all at once by simply specifying the original value and the new value!
About the number of rows in sample data
The AI Prompt feature provides sampled data to the LLM to return good results when executing prompts. However, it is not used as training data, but rather to make better suggestions, so there is a specification for sample data.
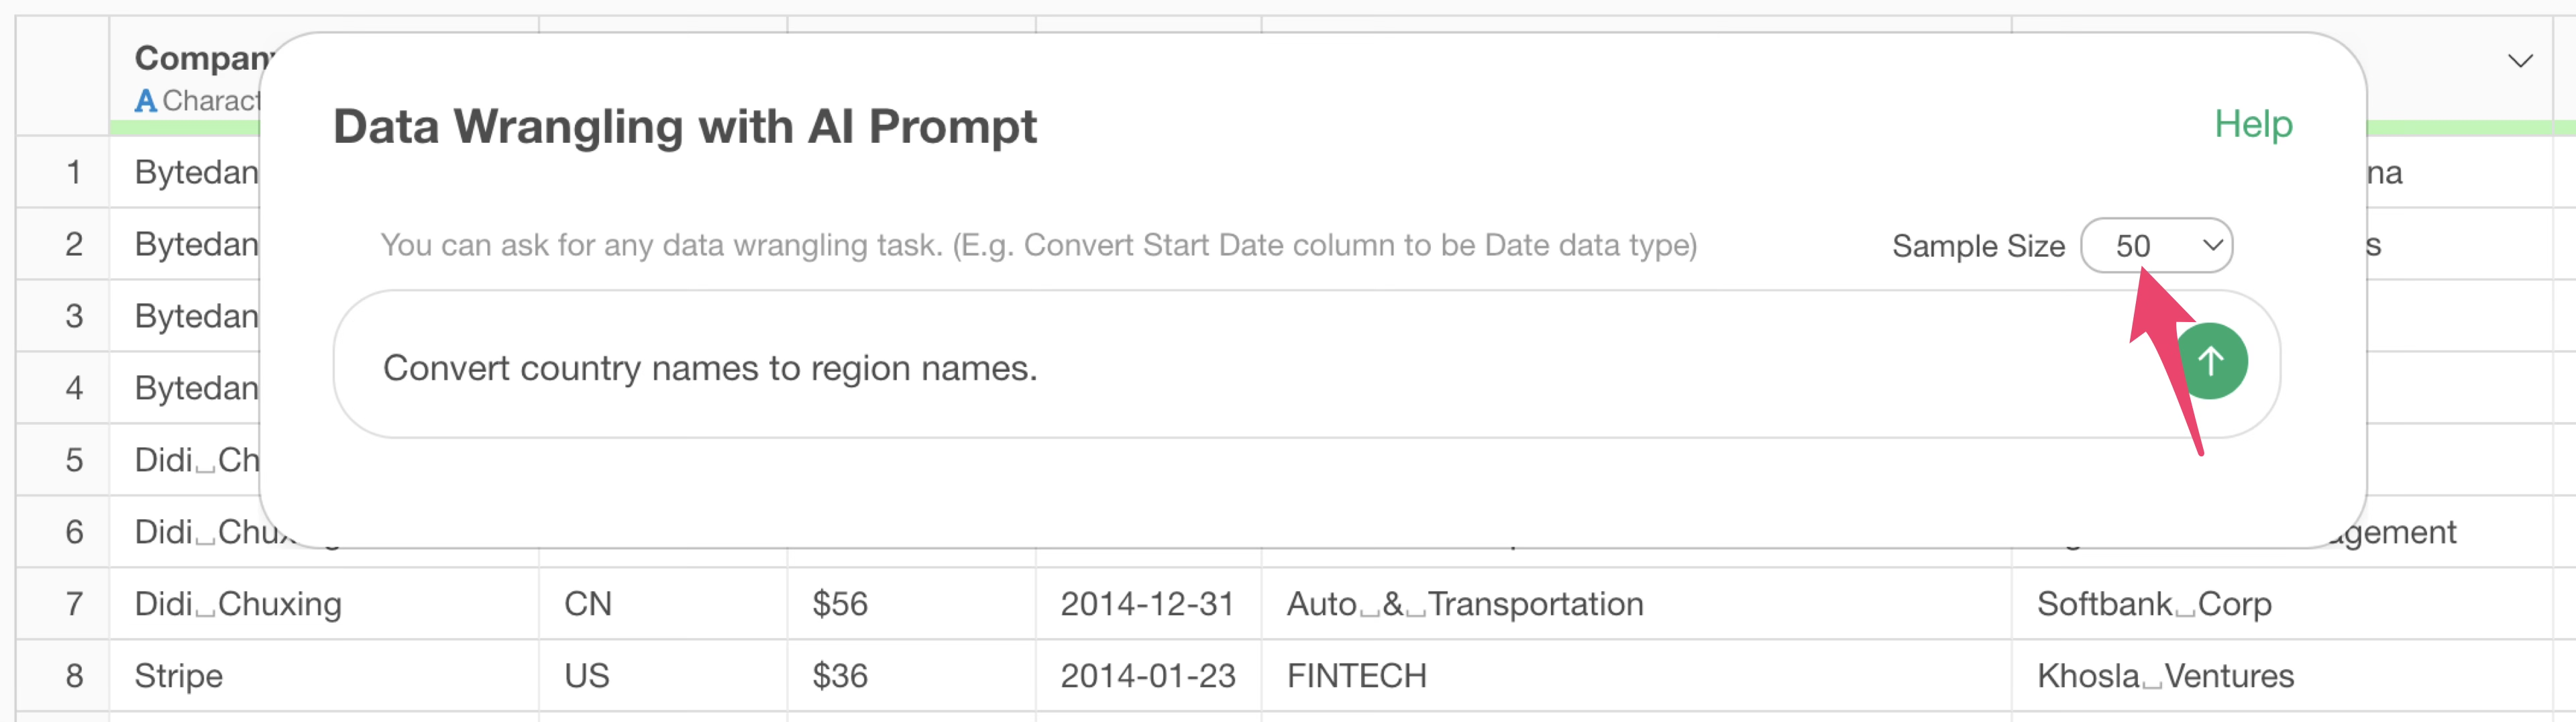
The default is 50 rows, but if you do not want to pass sample data, you can set it to 0 rows.
Now, let’s look at how this sample data affects the results.
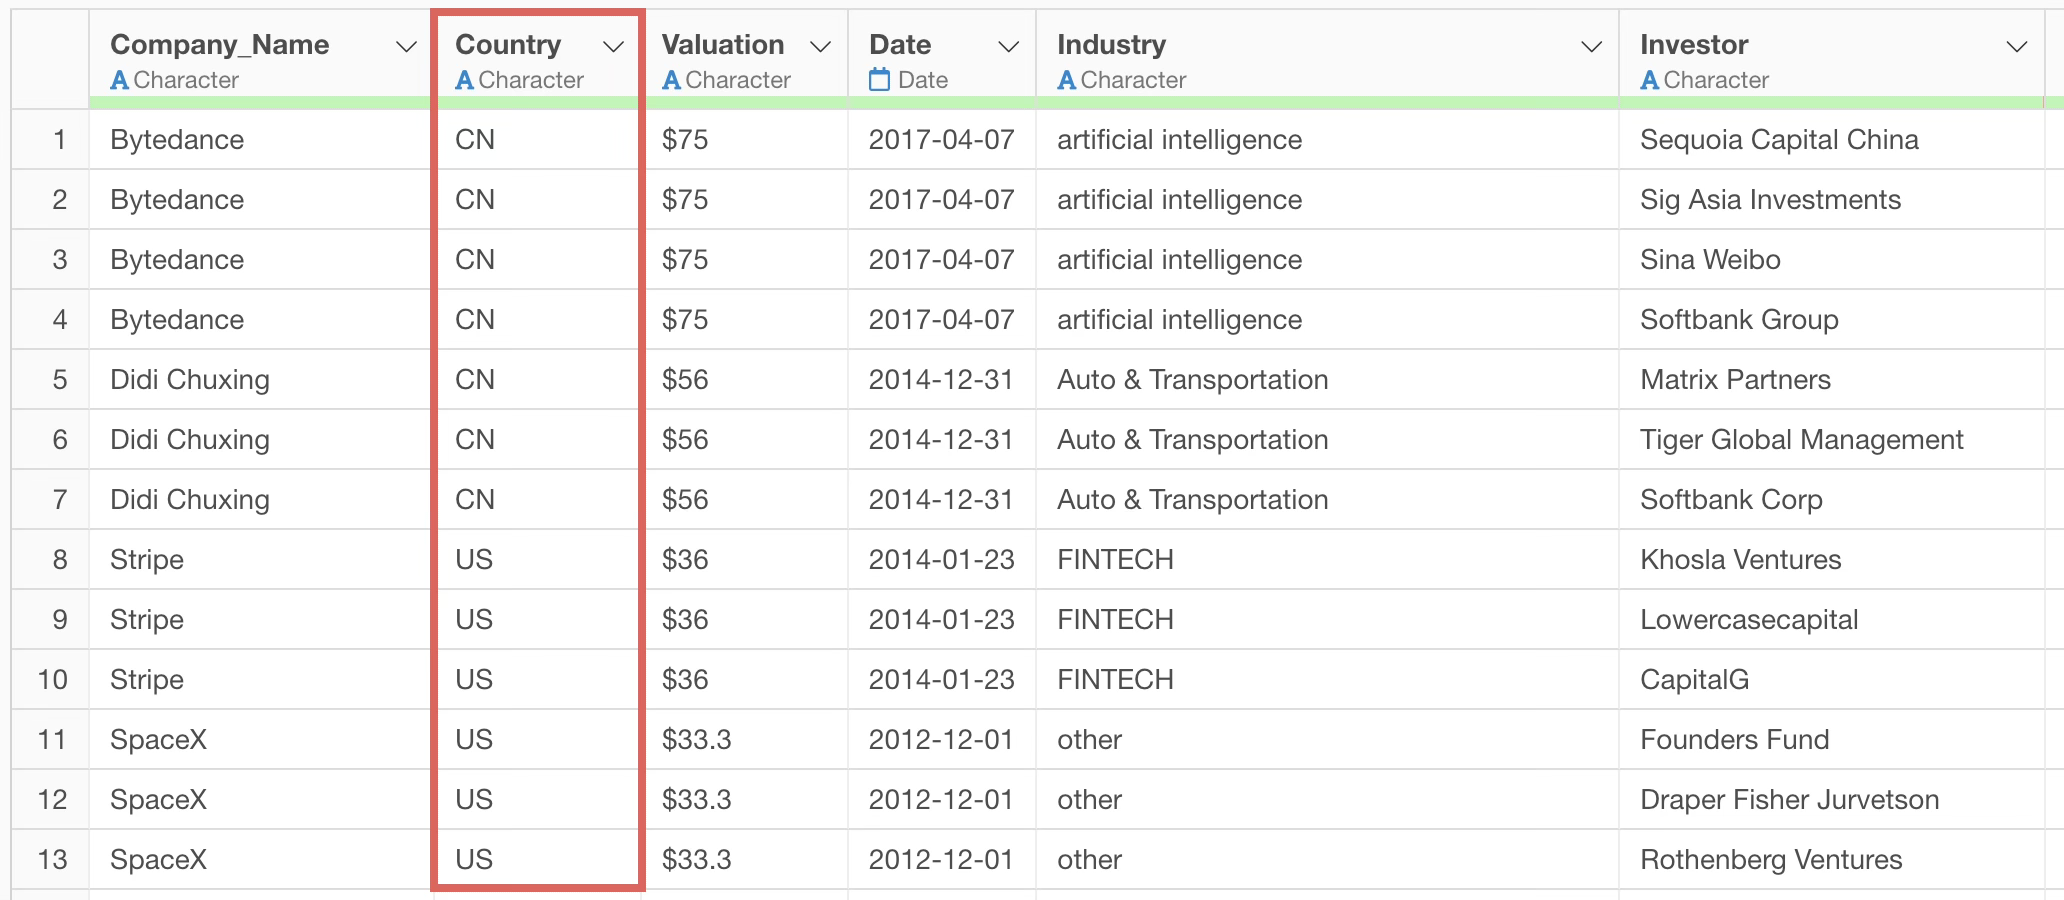
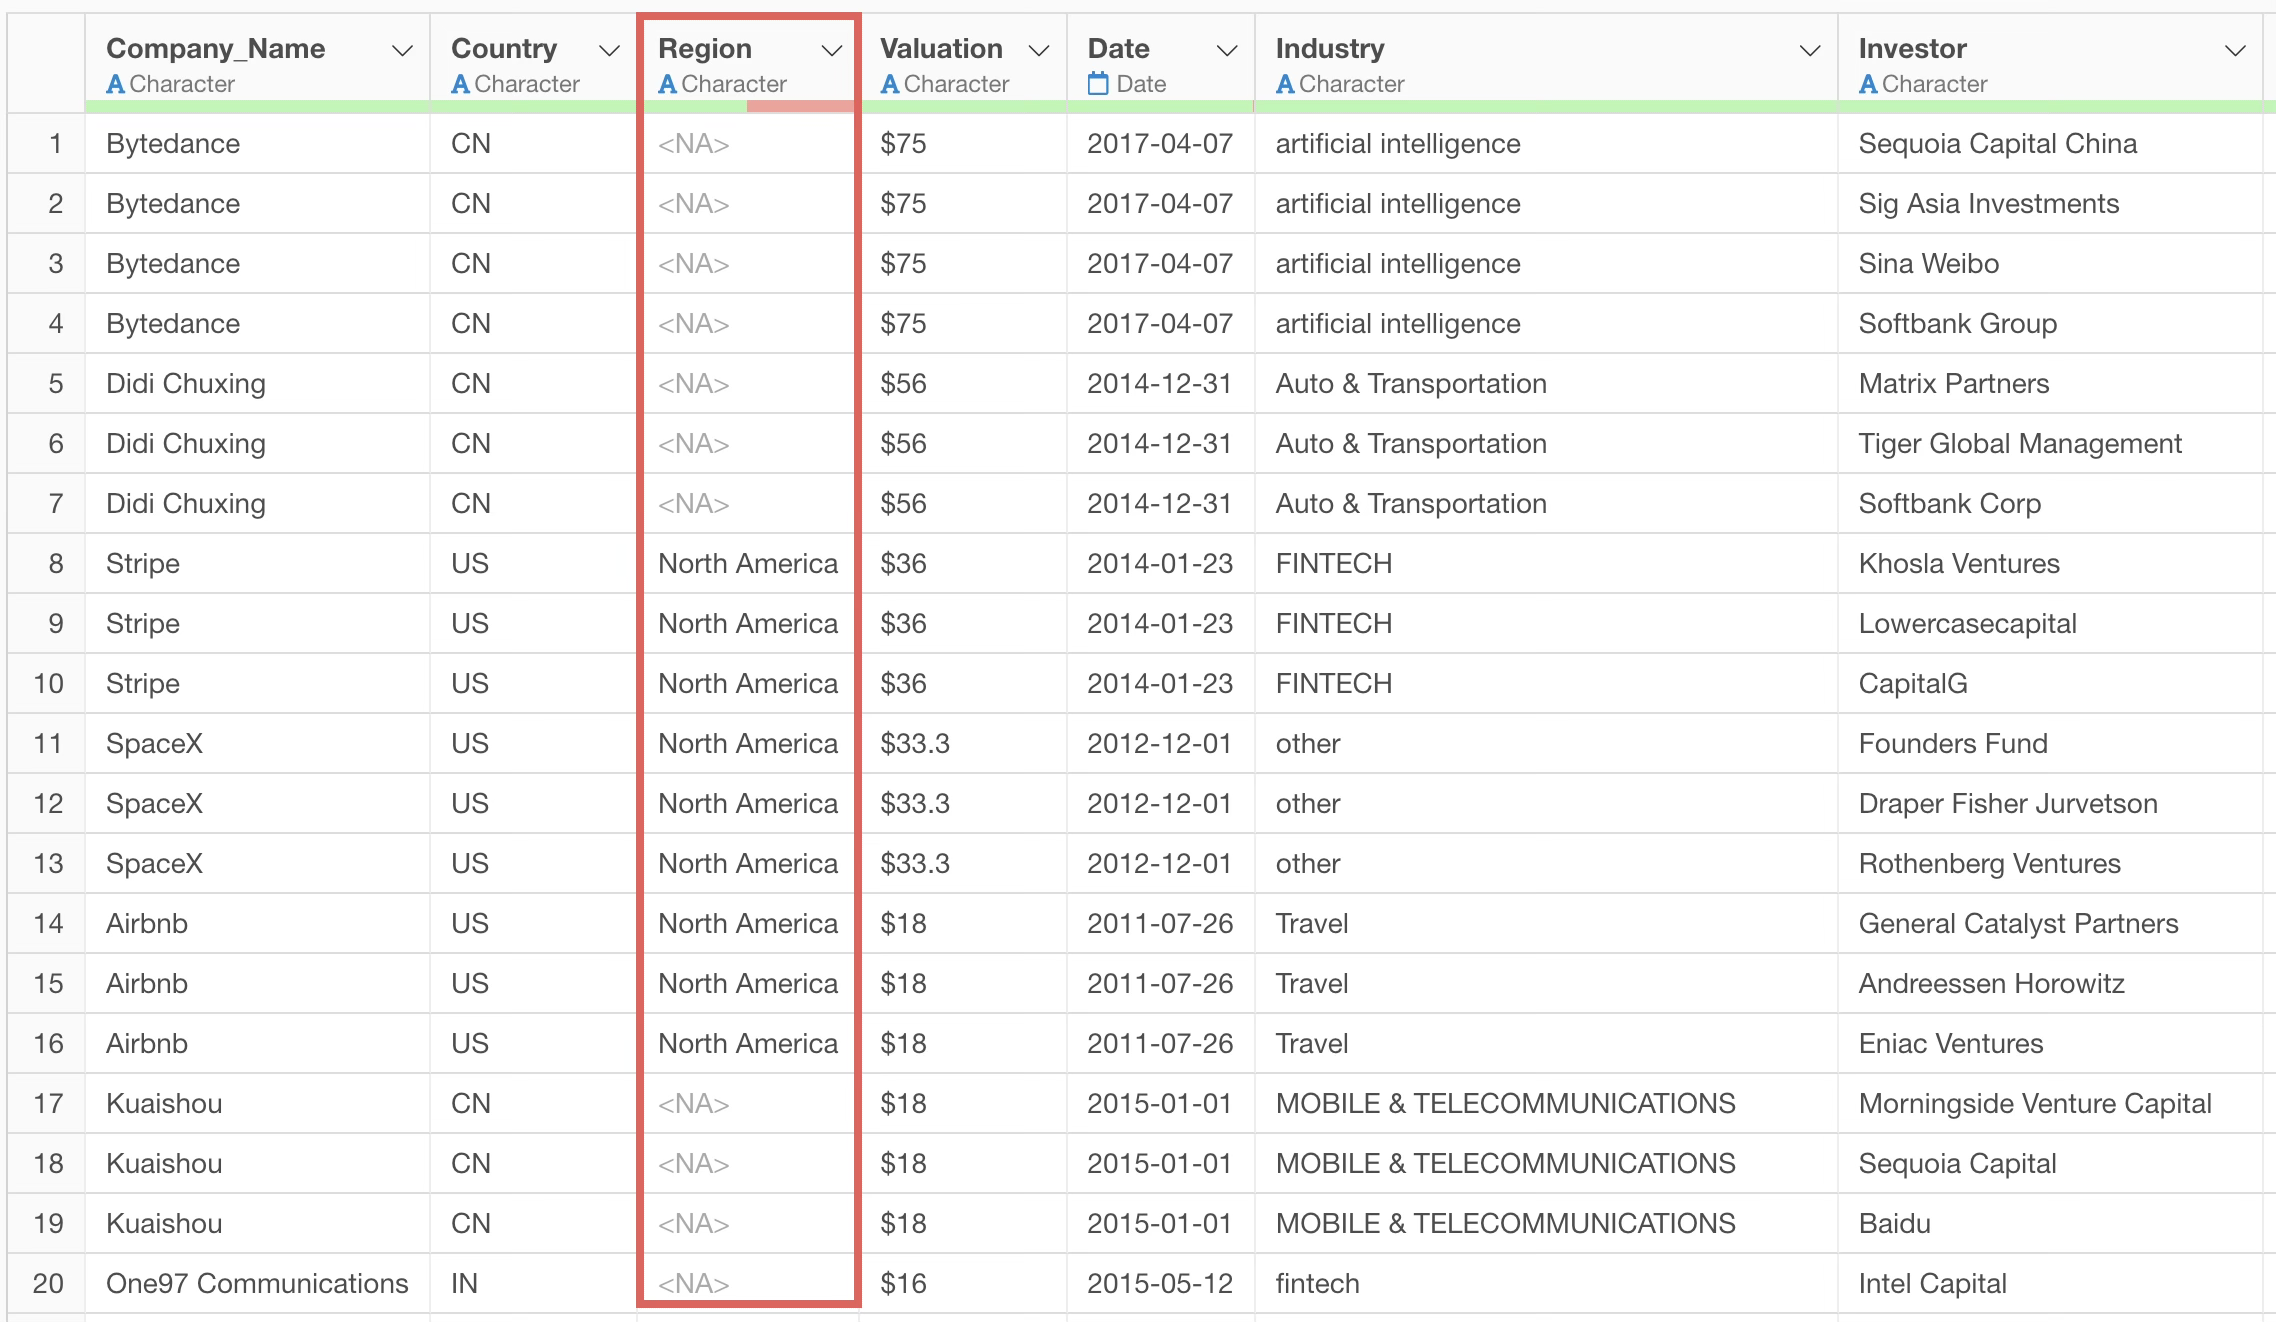
We have data where each row represents one unicorn company and there is a “Country” column. This country column holds 2-character country codes as values. This time, we want to create a region name column from this country column.
Set the sample data to “0 rows” and instruct the following prompt to convert from country to region name.
Convert country names to region names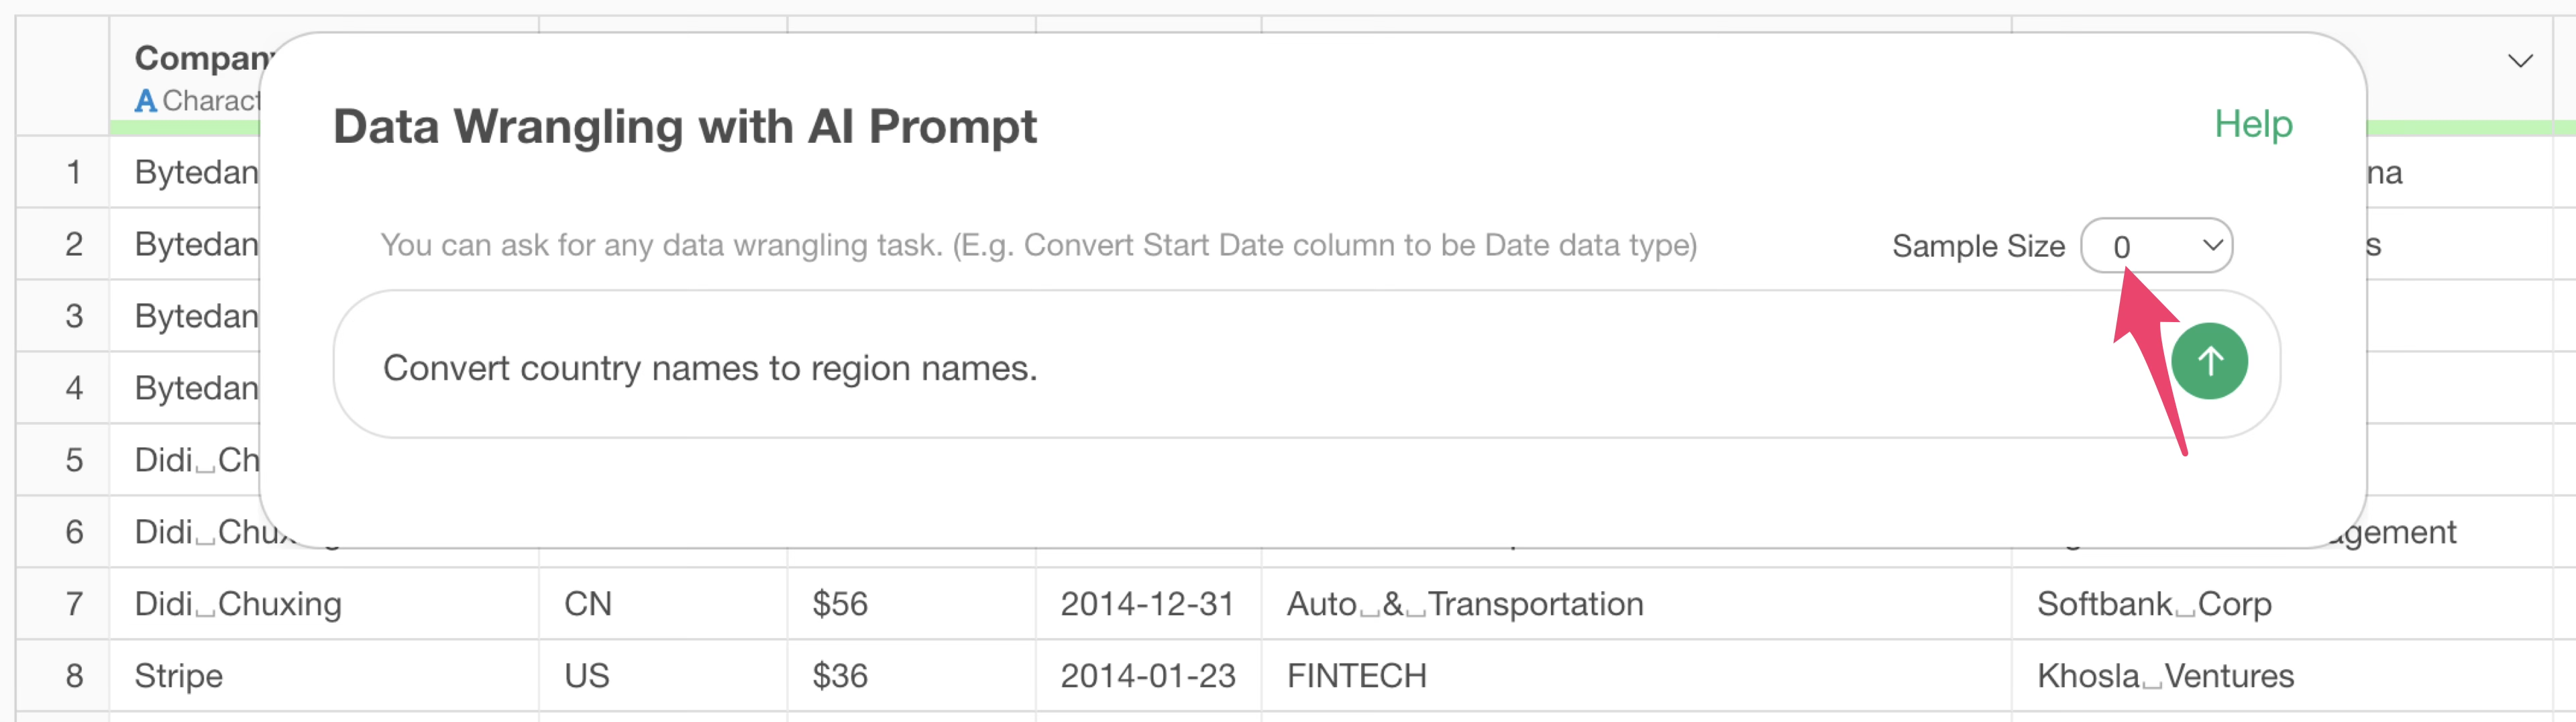
When this is executed, an R command is returned that converts from “country name” to “region name” instead of “2-character country code”.
Although the region name column was created, the correct process of converting from country code to region name was not performed, resulting in a very large number of missing values.
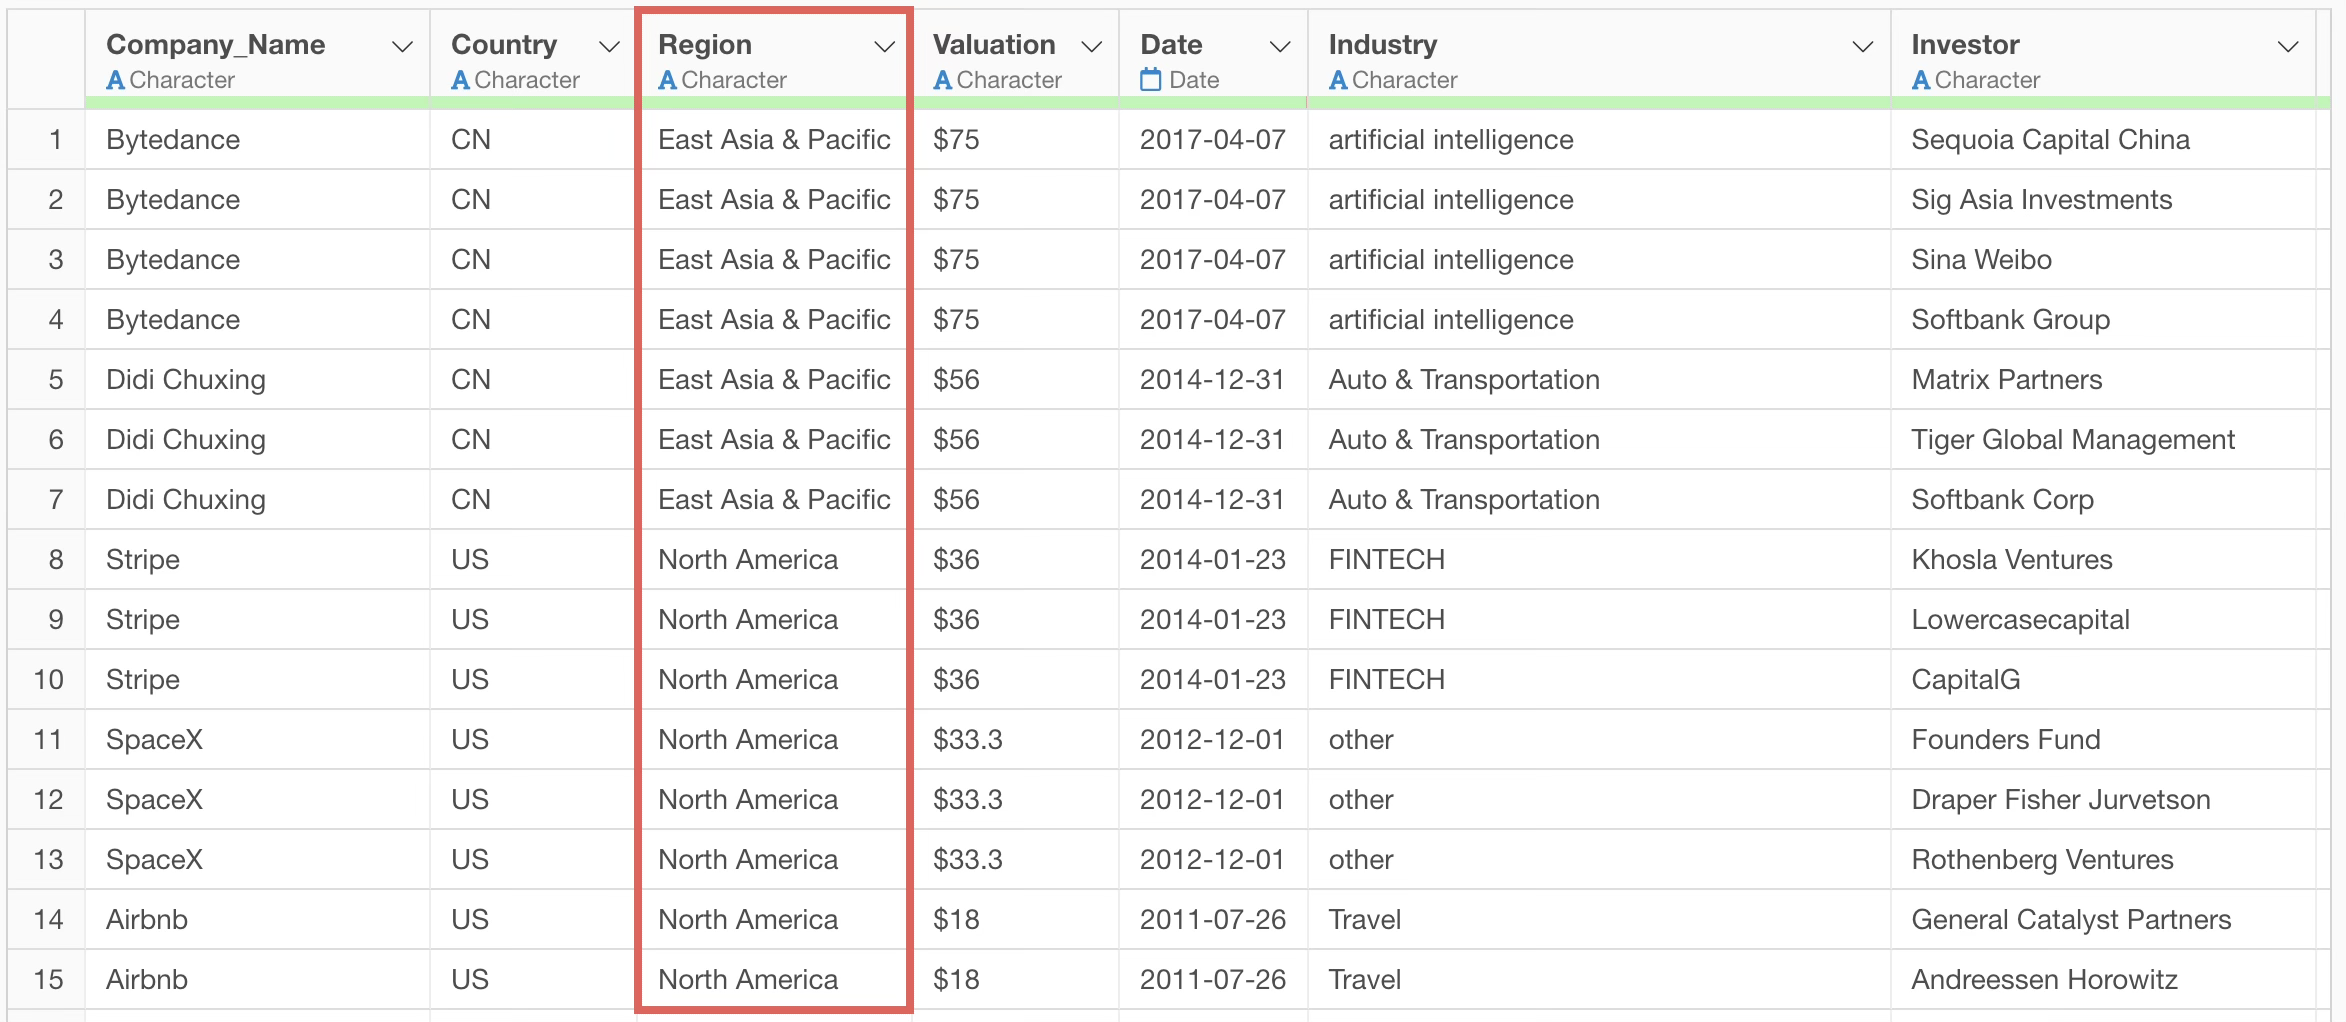
Now, suppose we instruct the same prompt with the default “50 rows” for the sample data.
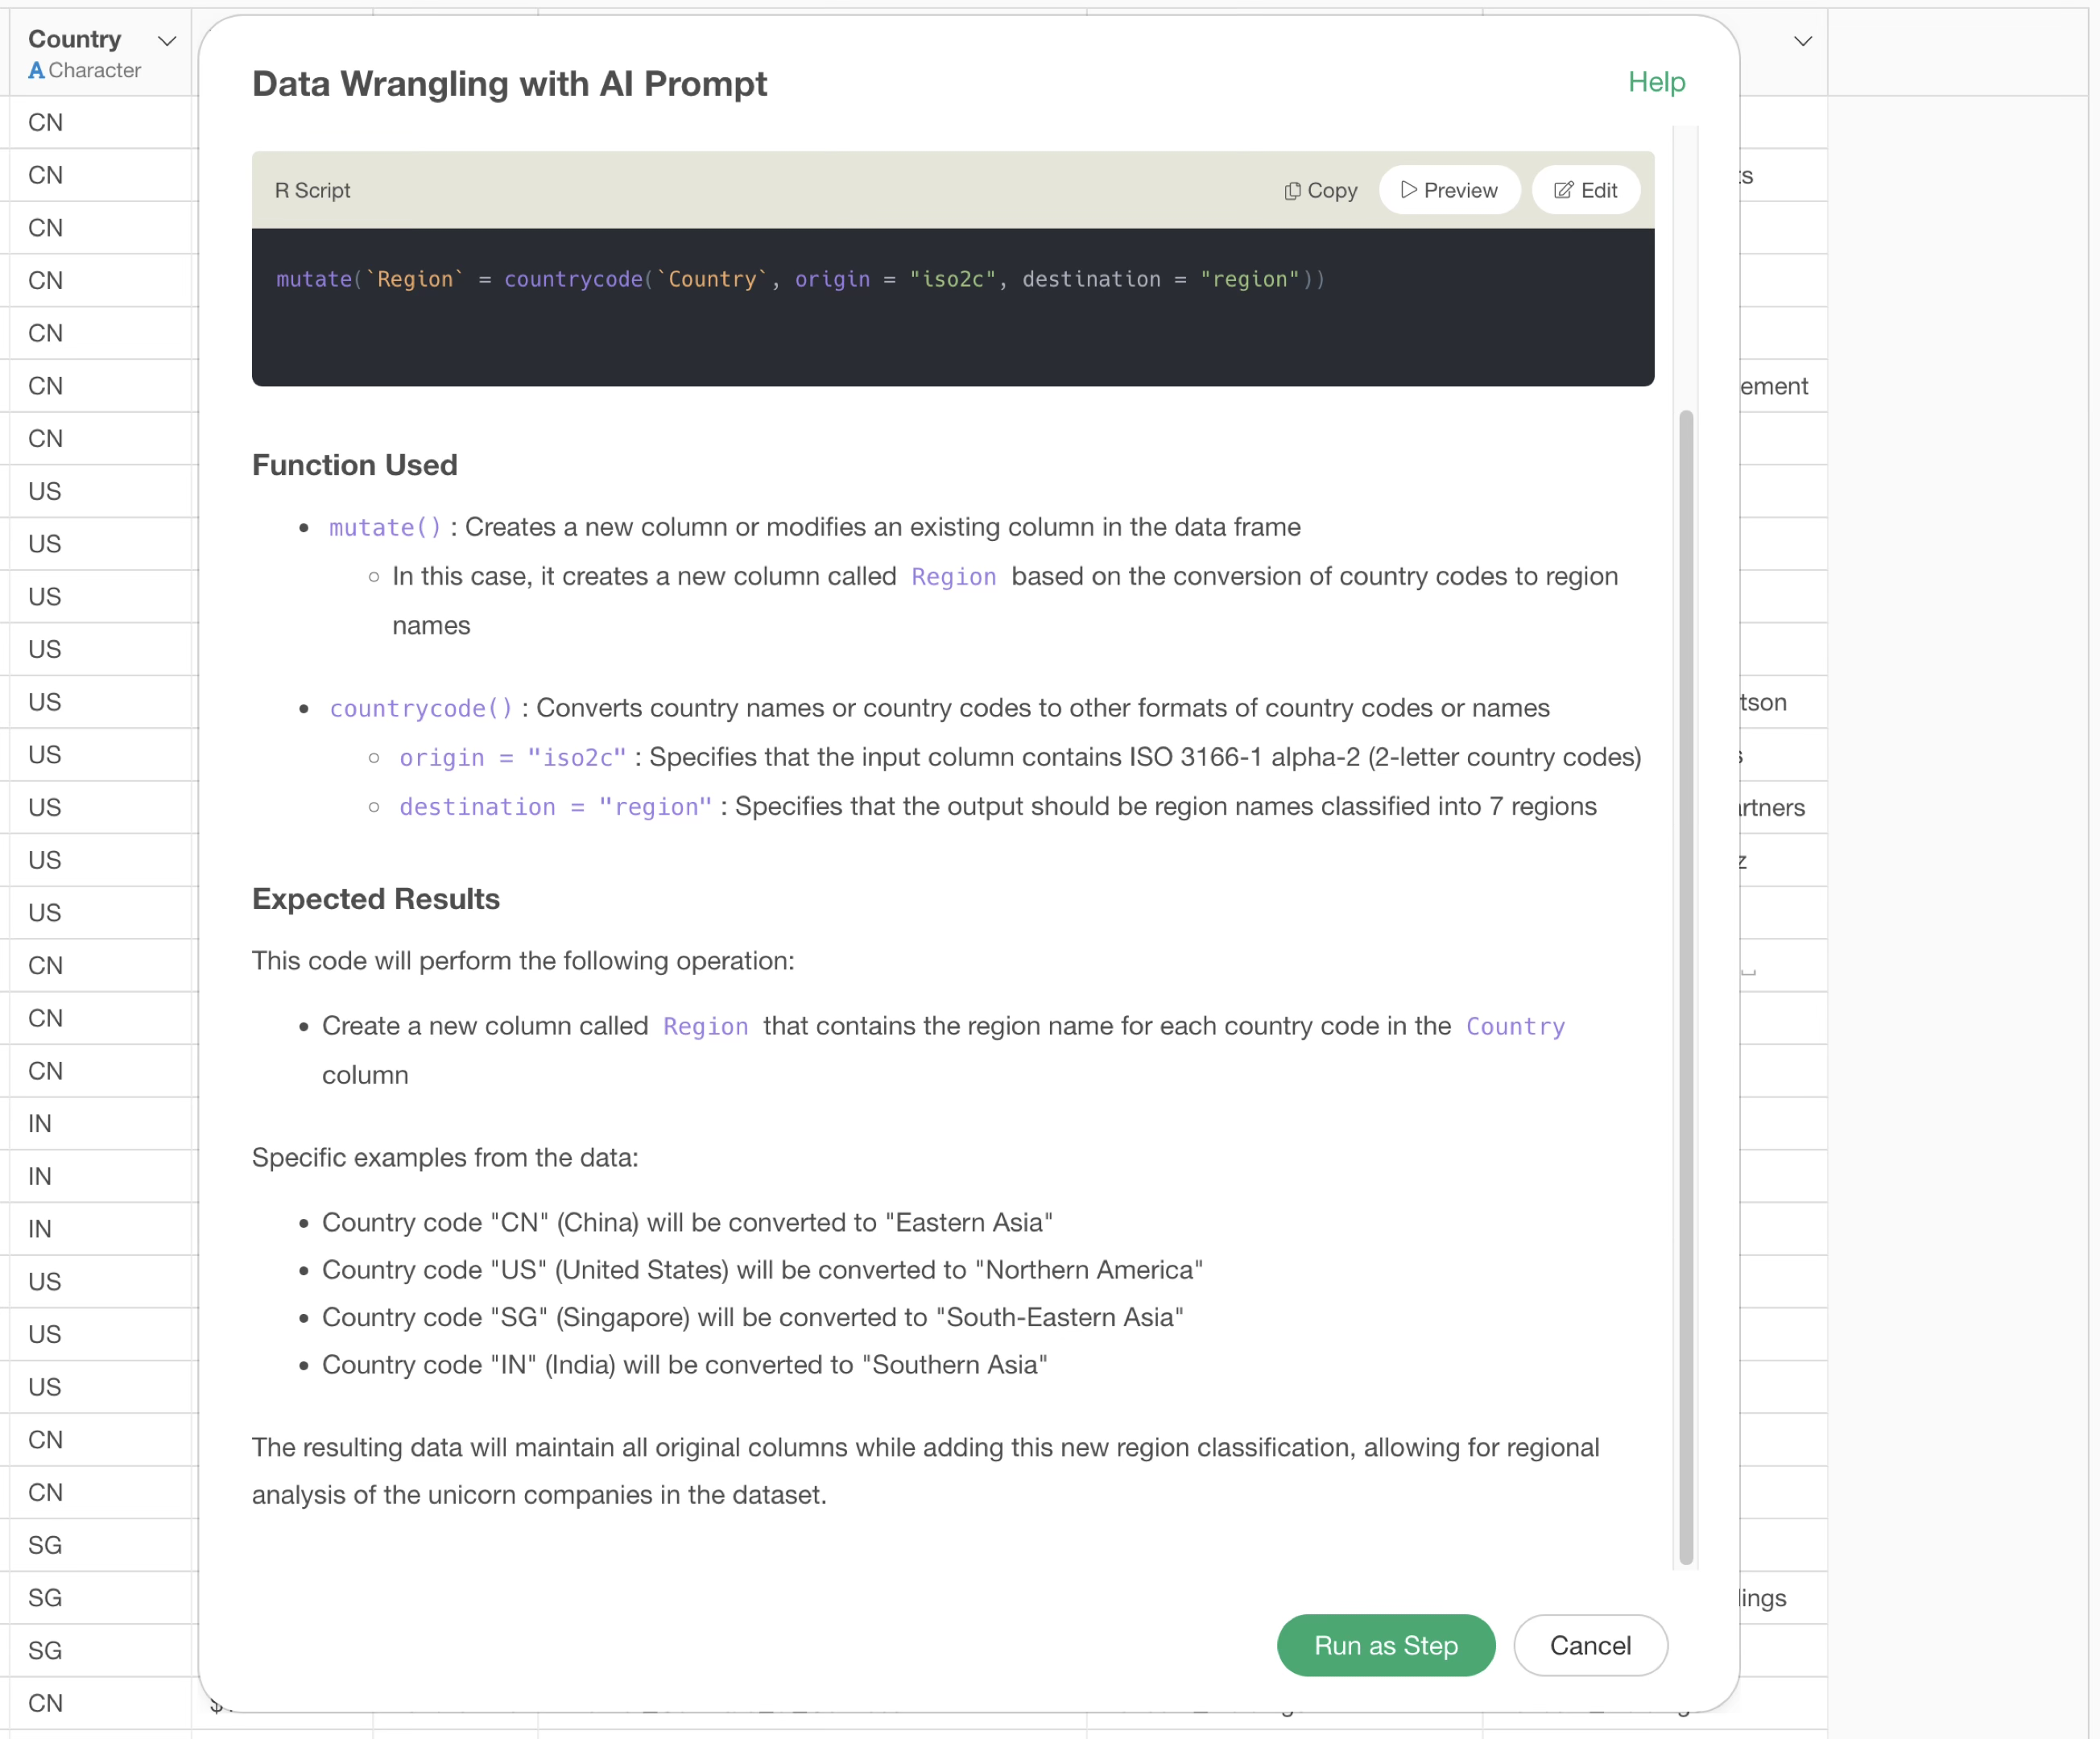
This returns an R command to convert from “country code” to “region name”.

By executing it as a step, we can see that the region name column now has no missing values and has been correctly converted from country code to country name.
In this way, when making processing decisions based on data values, providing sample data increases the probability of getting more accurate suggestions. It also has the advantage of inferring and returning results even with ambiguous prompts.
It is not impossible to use it even when sample data cannot be provided. For processes that do not require looking at data values, you can expect similar results without providing sample data.
If it doesn’t work well when you don’t provide sample data, you need to clearly describe the processing you want to perform.
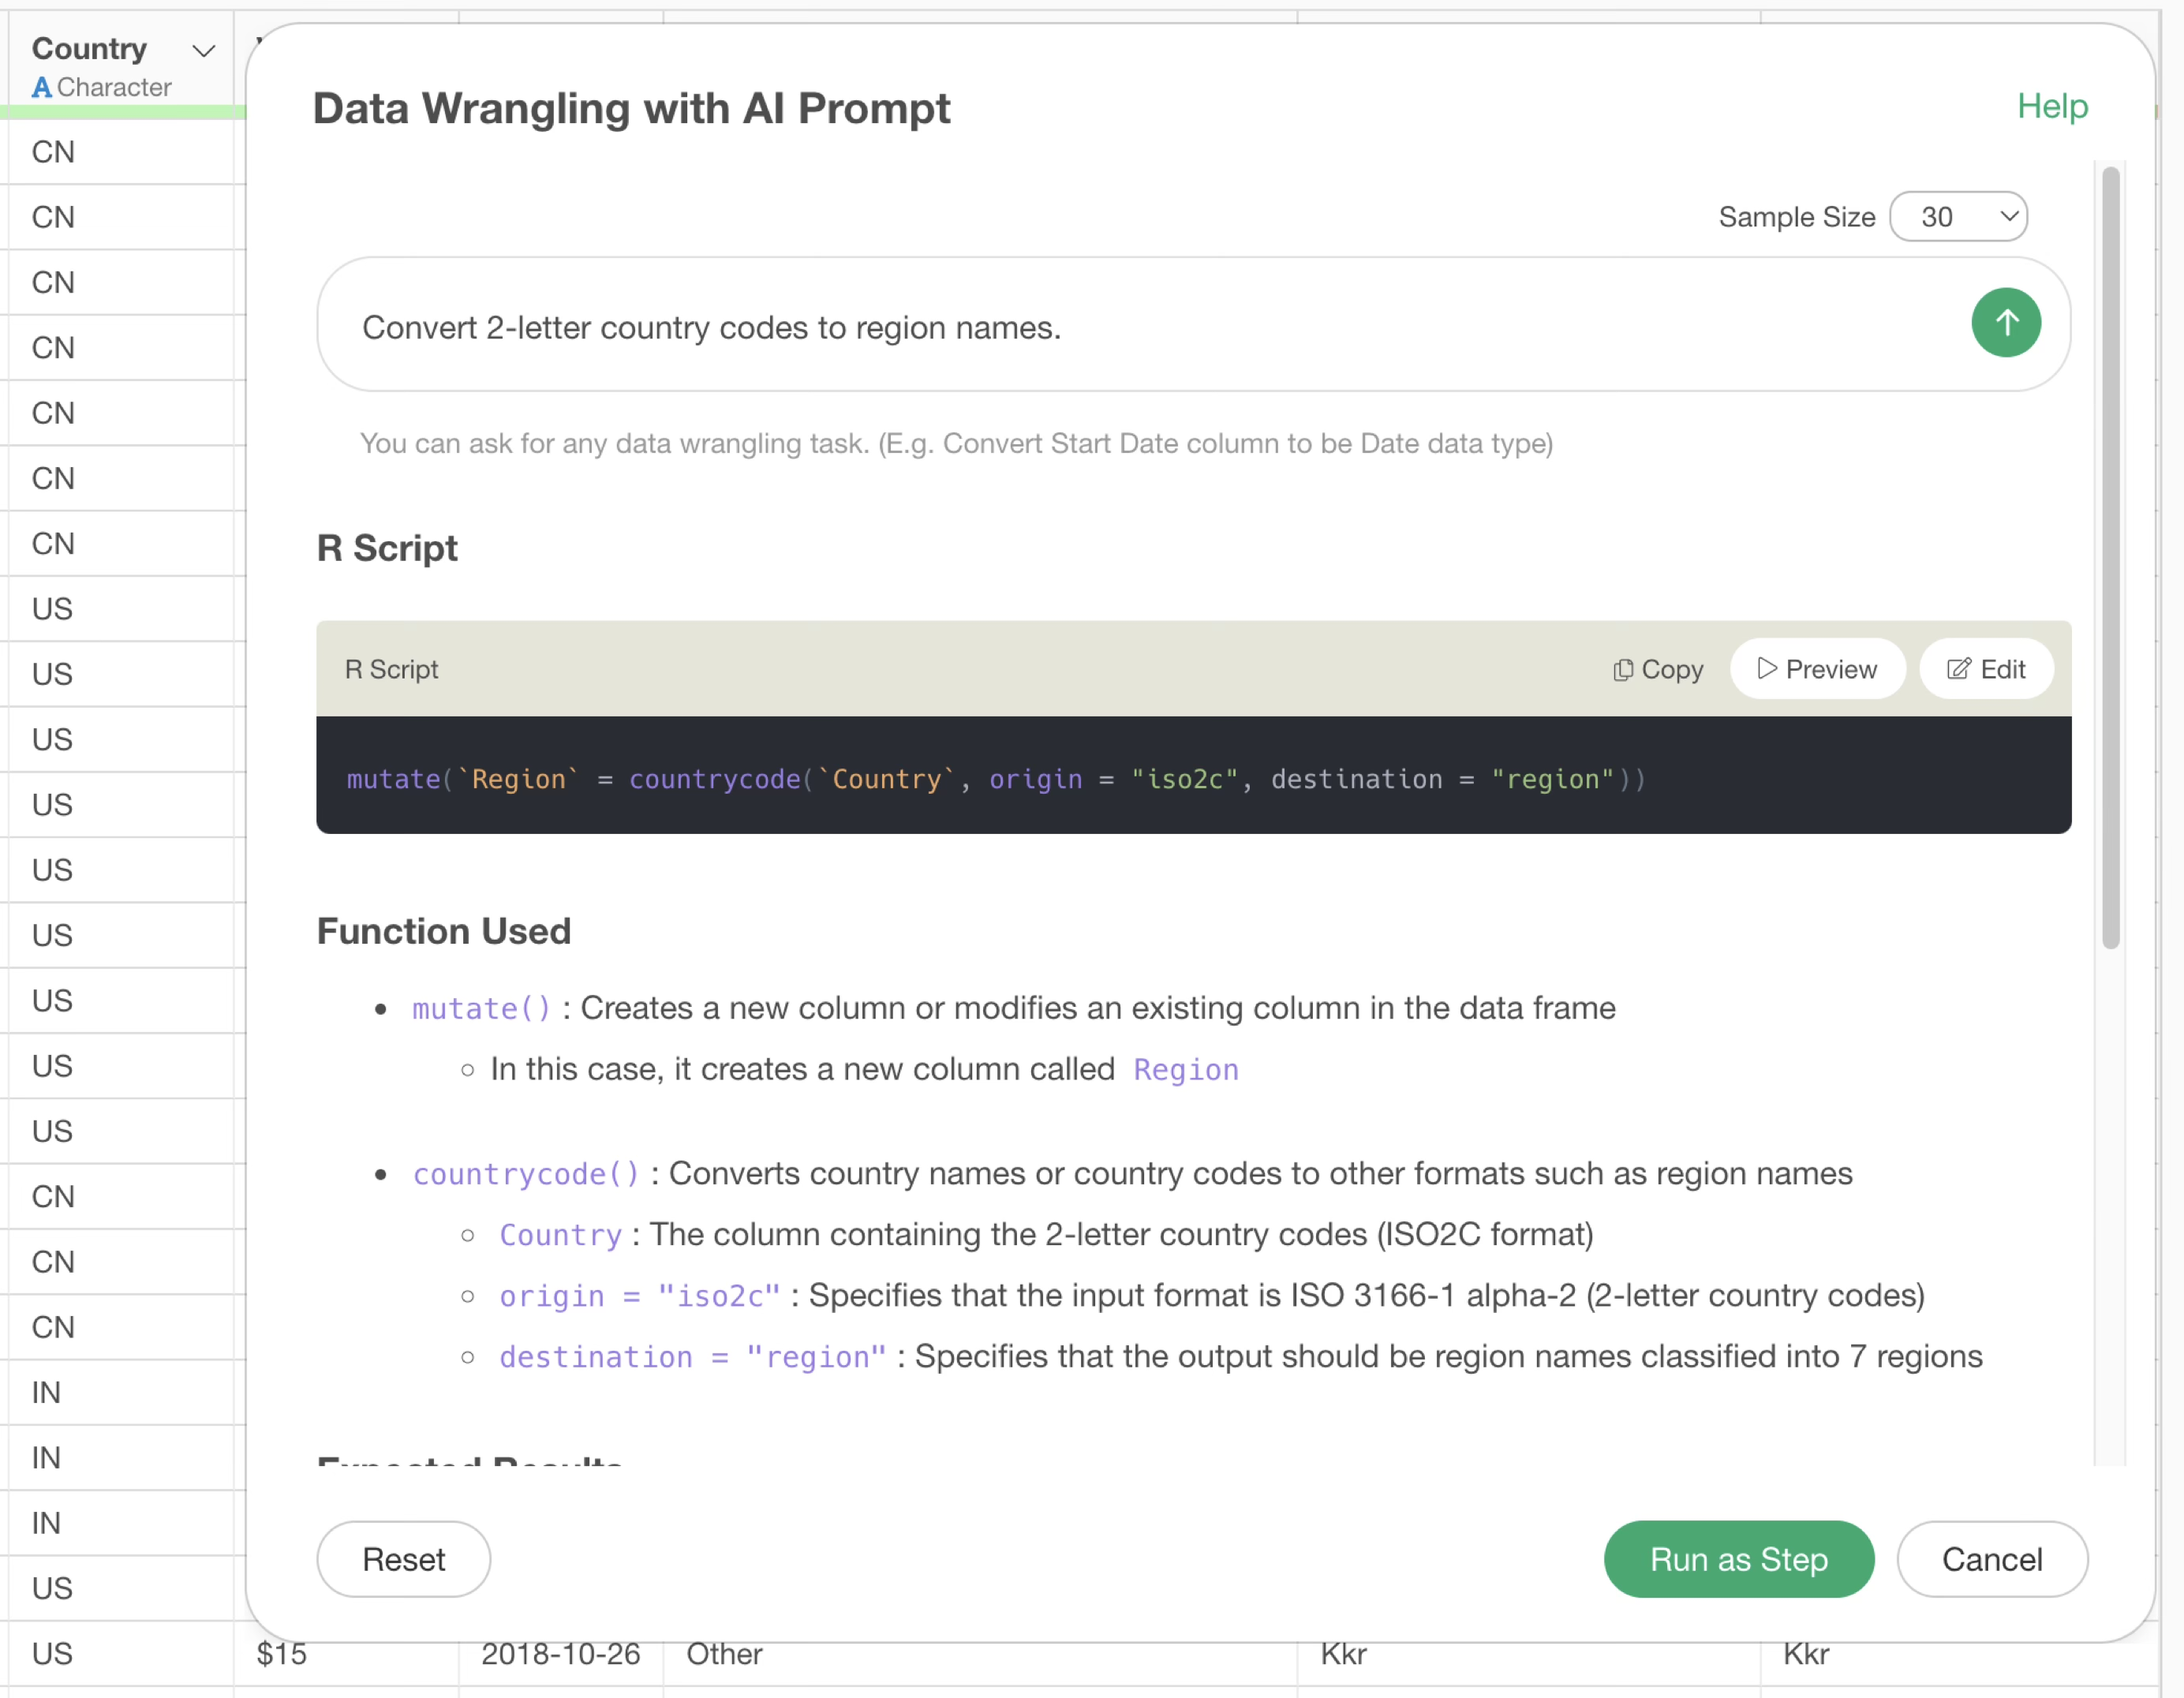
In the previous example, we used the prompt “Convert from country to region name,” but we will make it more specific and change it to the following prompt:
Convert 2-letter country codes to region names.
This will allow it to suggest the correct R command for converting from country code to region name.
Therefore, if you cannot provide sample data, adding data characteristics to the prompt will allow you to return results with better accuracy.
When to Use AI Functions
While AI Prompts are suitable for processing based on conditional expressions and calculations, AI Functions deliver more appropriate results for tasks requiring contextual understanding and judgment.
Tasks Where AI Functions Excel
AI Functions are suitable for the following types of tasks, as they analyze and make judgments about the content of each row:
Text Classification Based on Content
AI Functions are ideal for grouping free-text survey responses or similar content that requires understanding the meaning of text.
AI Function Prompt Example:
Please assign labels to categorize the provided text into the following groups:

Good Support
Bad Support
High Product Rating
Low Product Rating
High Rating for Features
Low Rating for Features
Comparison with Competitor Services
Implementation-Related Content
Pricing-Related Content
Other
This type of classification requires understanding the meaning of the text and cannot be expressed through conditional formulas.
Sentiment Analysis and Sentiment Scoring
Extracting emotions from text and converting them into scores is another area where AI Functions excel.
AI Function Prompt Example:
For each provided sentence, calculate a polarity score in the range of -1.0 to +1.0.

Scoring Criteria:

Extremely Positive (+0.8 ~ +1.0)
- Expressions showing strong satisfaction or praise
- Situations where problems are completely resolved
- Mentions of outstanding performance or quality

Positive (+0.4 ~ +0.7)
- Mentions of clear advantages or strengths
- Reports of good experiences or results
- Results exceeding expectations

Mildly Positive (+0.1 ~ +0.3)
- Small improvements or advantages
- Fulfillment of basic functions
- General sense of satisfaction

Neutral (-0.1 ~ +0.1)
- Statement of facts
- Explanations without emotion
- Simple situation descriptions

Mildly Negative (-0.3 ~ -0.1)
- Small inconveniences or challenges
- Minor issues
- Points with room for improvement

Negative (-0.7 ~ -0.4)
- Clear problems or dissatisfaction
- Disappointing results
- Lack of important functions

Extremely Negative (-1.0 ~ -0.8)
- Serious problems or malfunctions
- Strong dissatisfaction or negative emotions
- Major obstacles or hindrances

Factors to Consider in Assessment:
- Strength of expressions (degree adverbs like "very," "extremely," etc.)
- Degree of problem resolution (complete resolution, partial resolution, etc.)
- Relationship between expectations and results (above expectations, as expected, below expectations)
- Specificity and importance of advantages/disadvantages
- Overall context and intent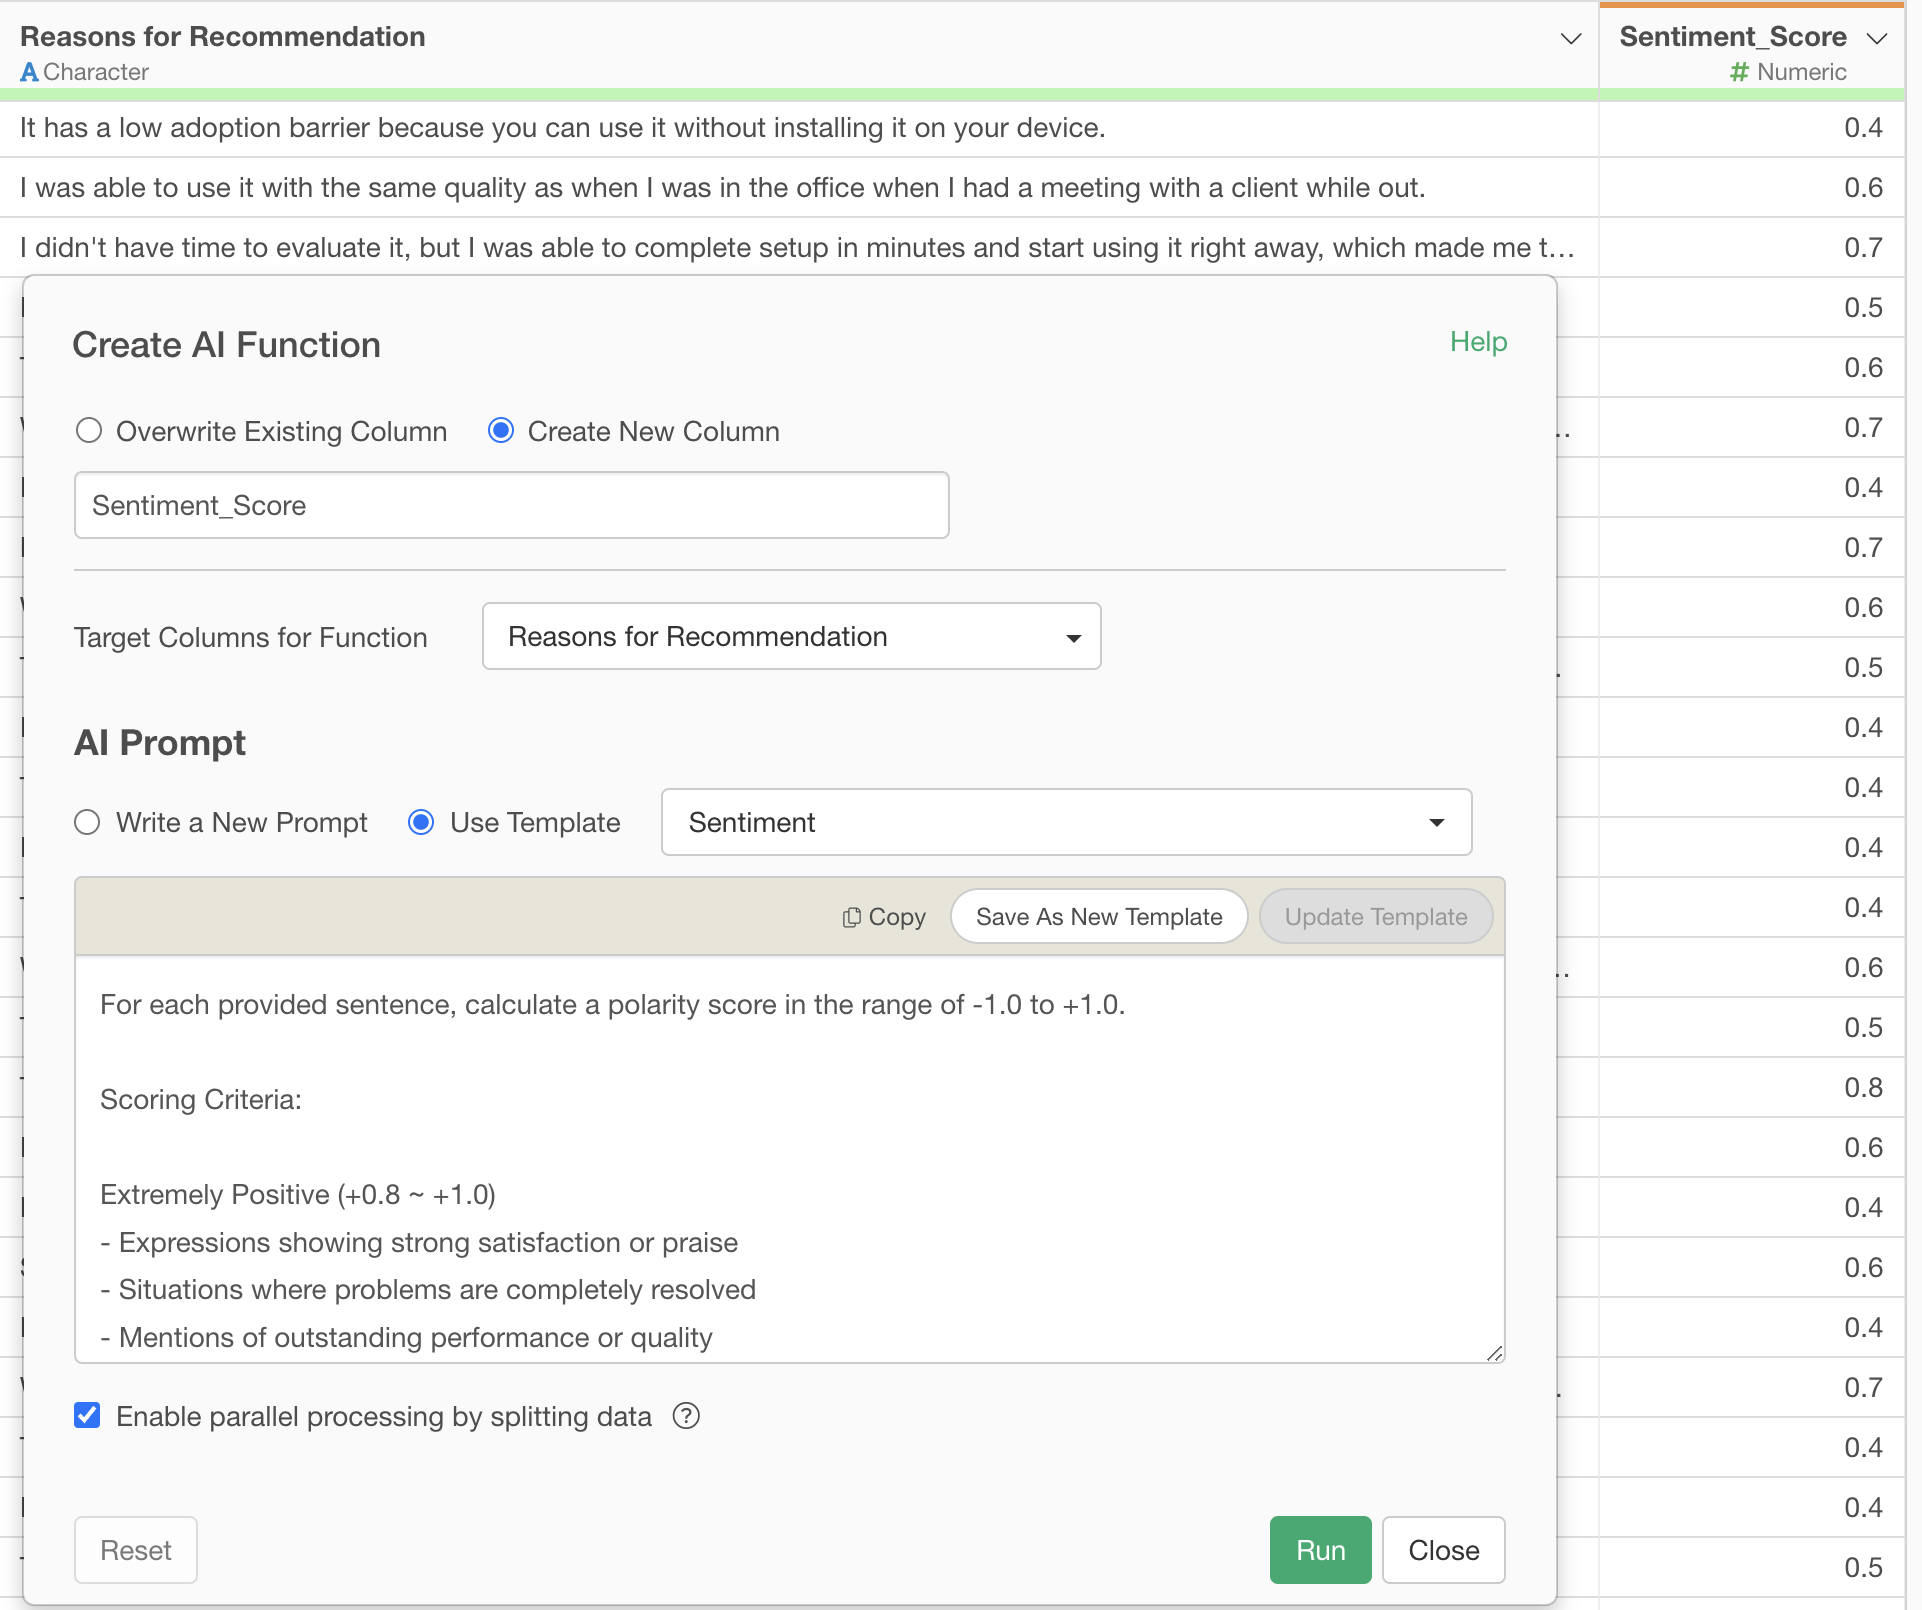
Sentiment scoring requires consideration of not just word occurrence but also the context and strength of expression throughout the entire text, making AI Functions the appropriate choice.
Other Tasks Suitable for AI Functions
- Translation: Natural translation that considers context
- Summarization: Extracting and condensing key points from text
- Classification: Determining industry from company names, identifying countries from phone numbers, etc.
For more details on how to use AI Functions, please see here.
Summary
In this note, we introduced best practices for writing effective prompts to master the AI Prompt feature, which allows data processing based on natural language, and to obtain more desired results!
The AI Prompt feature makes data processing tasks that used to take a long time easy and quick to execute, so please upgrade to the latest v12 and try it out!
If you haven’t used Exploratory yet, please try our 30-day free trial!