Best Practices for Improving Performance
This note introduces methods to improve processing performance in Exploratory.
How Exploratory Data Processing Works
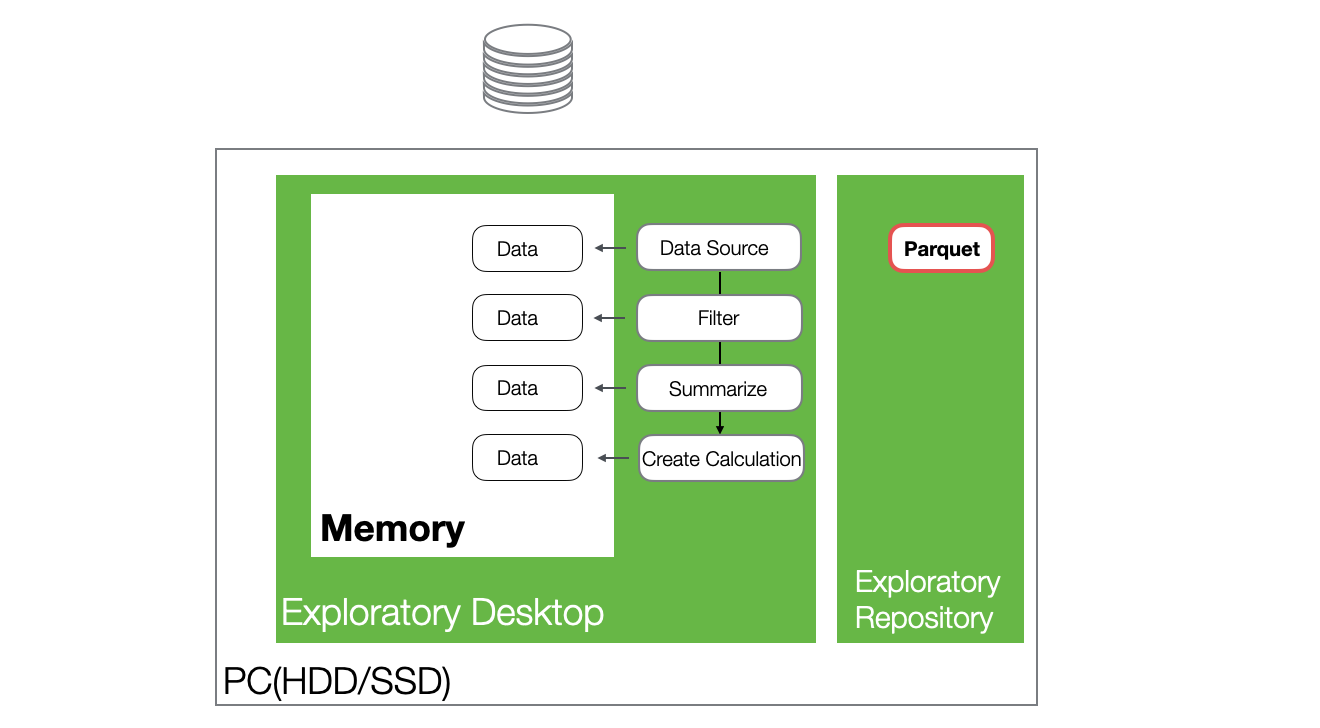
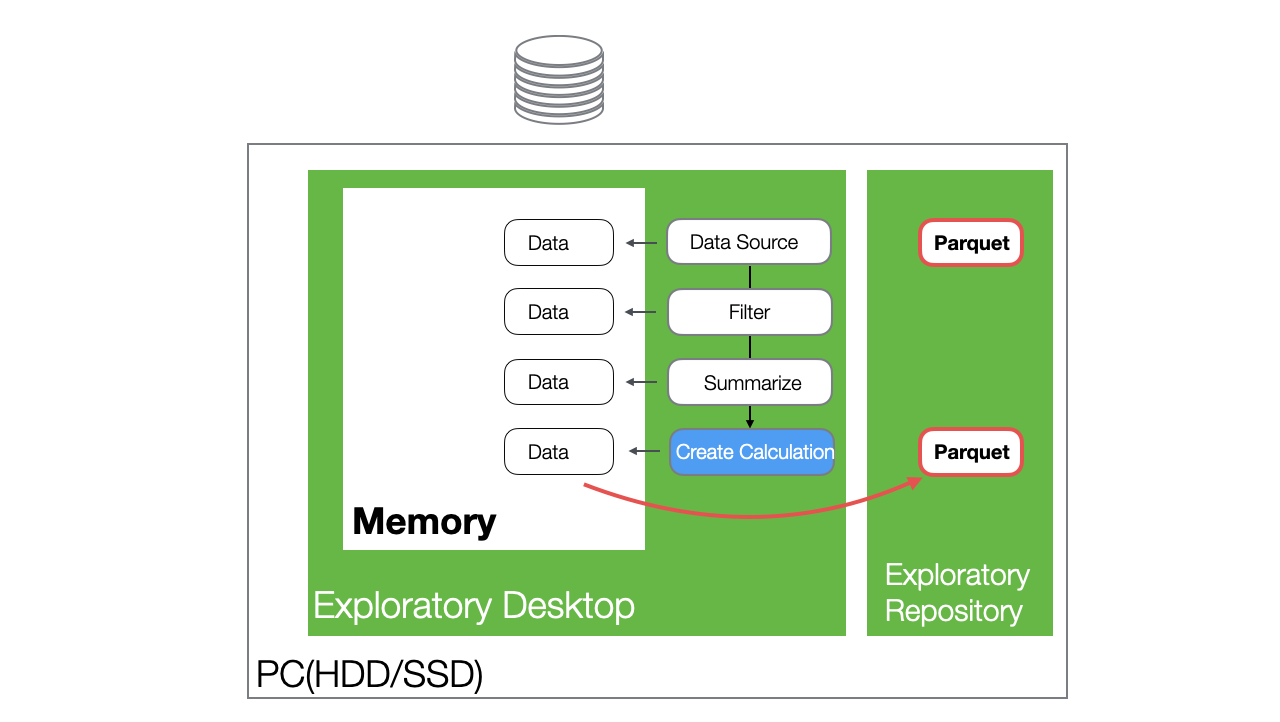
In Exploratory, when you import data, it is loaded into memory, and various processes are executed against that data in memory.
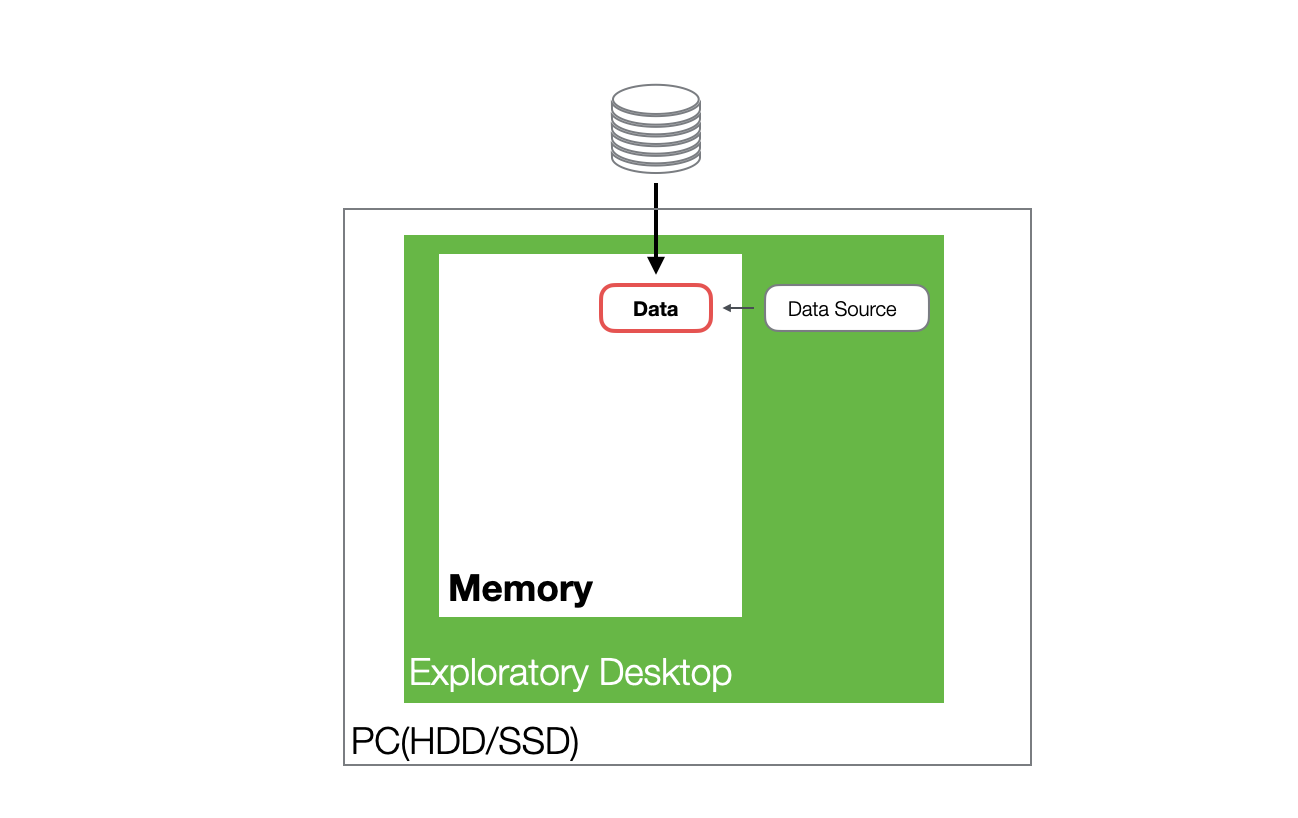
Additionally, when data is imported, Exploratory automatically generates a Parquet file, which is lightweight and fast to handle.
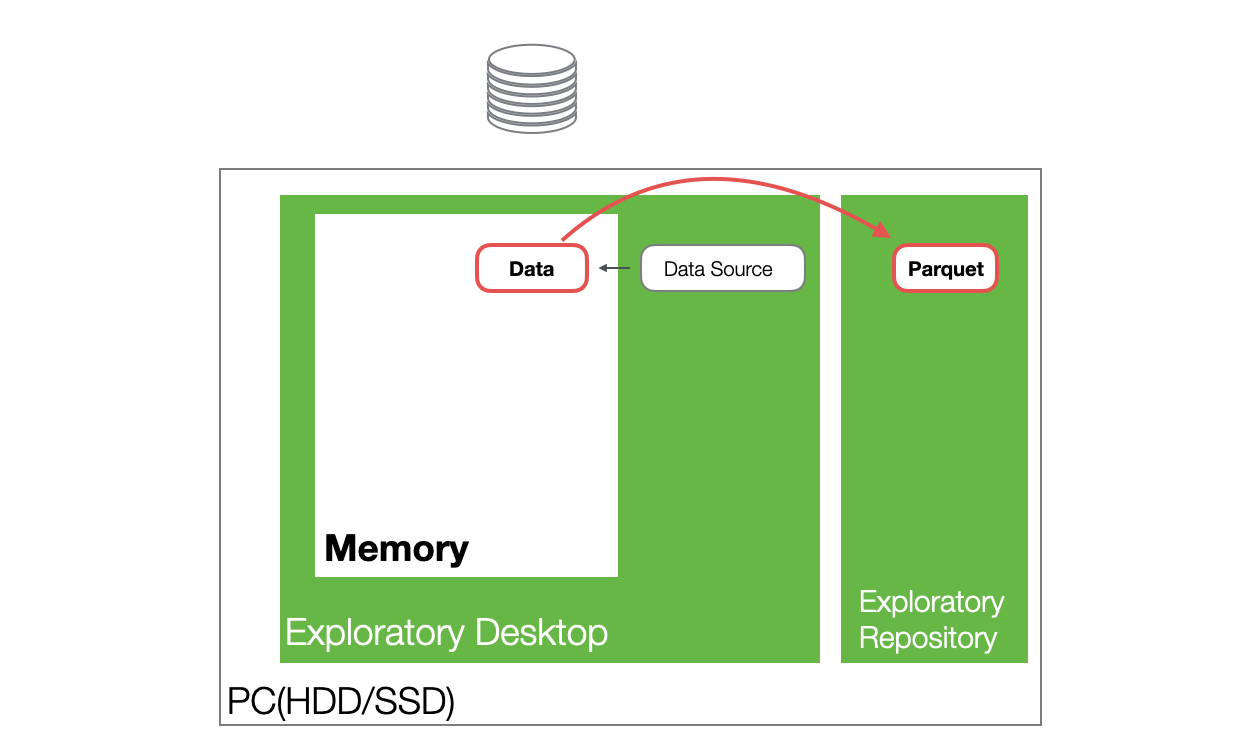
When you reopen a project and access the same data frame, the data is loaded into memory from the Parquet file stored on the hard disk.
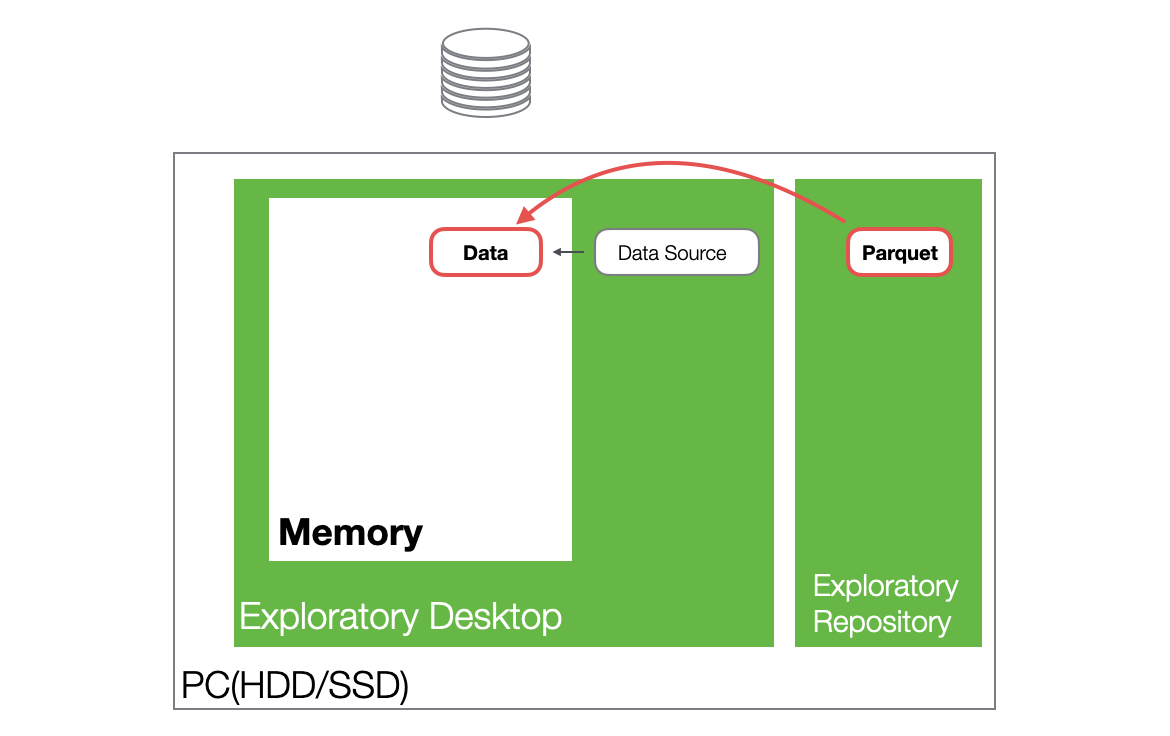
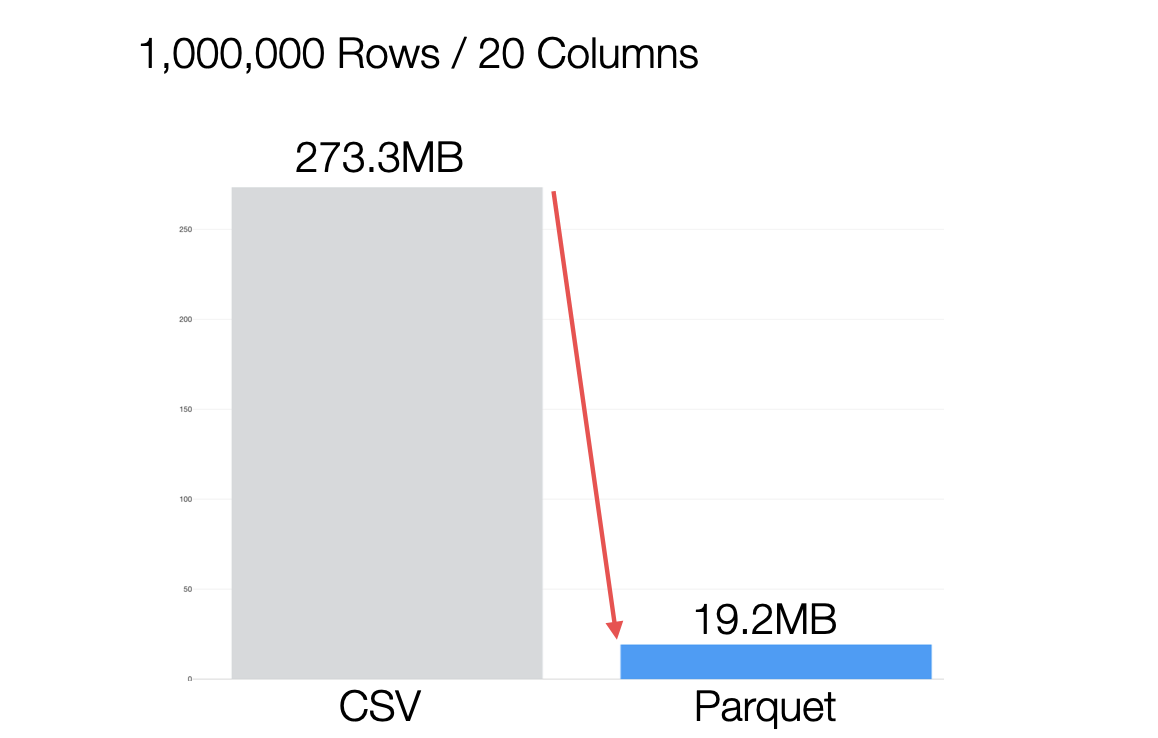
Furthermore, the generated Parquet files are significantly smaller in size compared to CSV files, providing excellent performance during data loading.
As you add data transformation steps, a data frame is created in memory for each step. At this time, the data is not copied entirely; instead, only optimized differences are added.
Because Exploratory handles data using this mechanism, memory usage increases when processing large datasets (with many columns or rows) or as the number of steps grows.
How to Check and Release Memory Usage
In Exploratory, if memory usage increases and the available memory becomes insufficient, the following two problems occur:
- An “Out of Memory” error appears.
- The application becomes slow.
Since other applications also use memory, if another application’s memory usage is high, you can identify and terminate it to release memory and secure capacity from Task Manager for Windows and Activity Monitor for Mac.
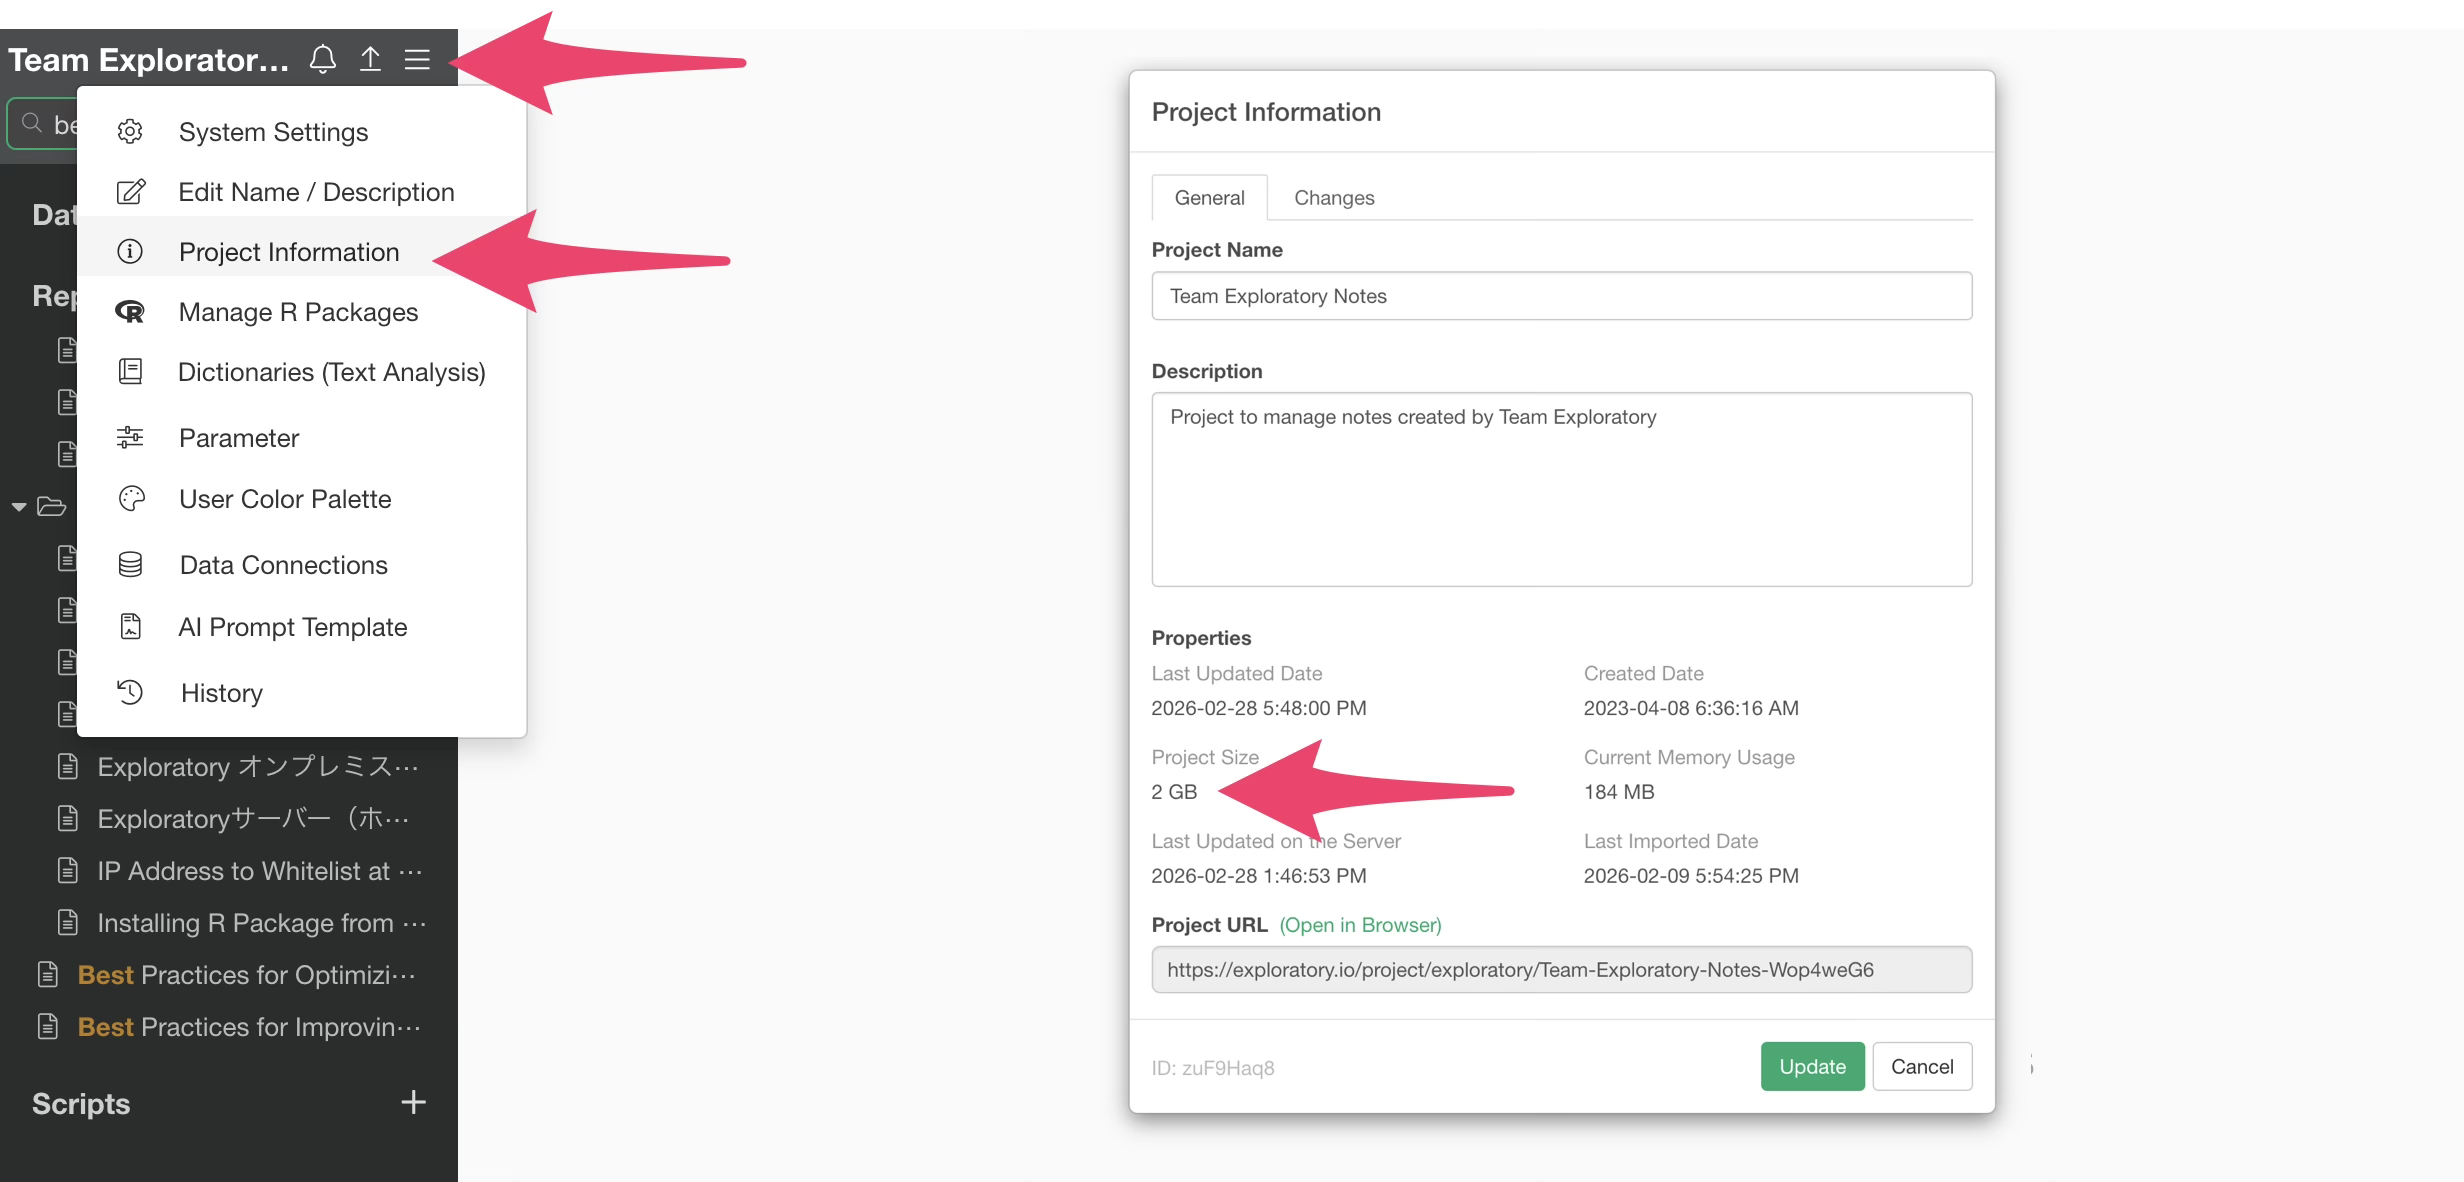
Additionally, you can check the amount of memory used by each Exploratory project from within the project. By closing unnecessary projects, you can release the memory space they were utilizing.
Changing the Maximum Memory Allocation Size for R
By increasing the maximum memory allocation size for R, you can reduce the likelihood of encountering errors caused by insufficient memory.
For Exploratory v15.3 or Later
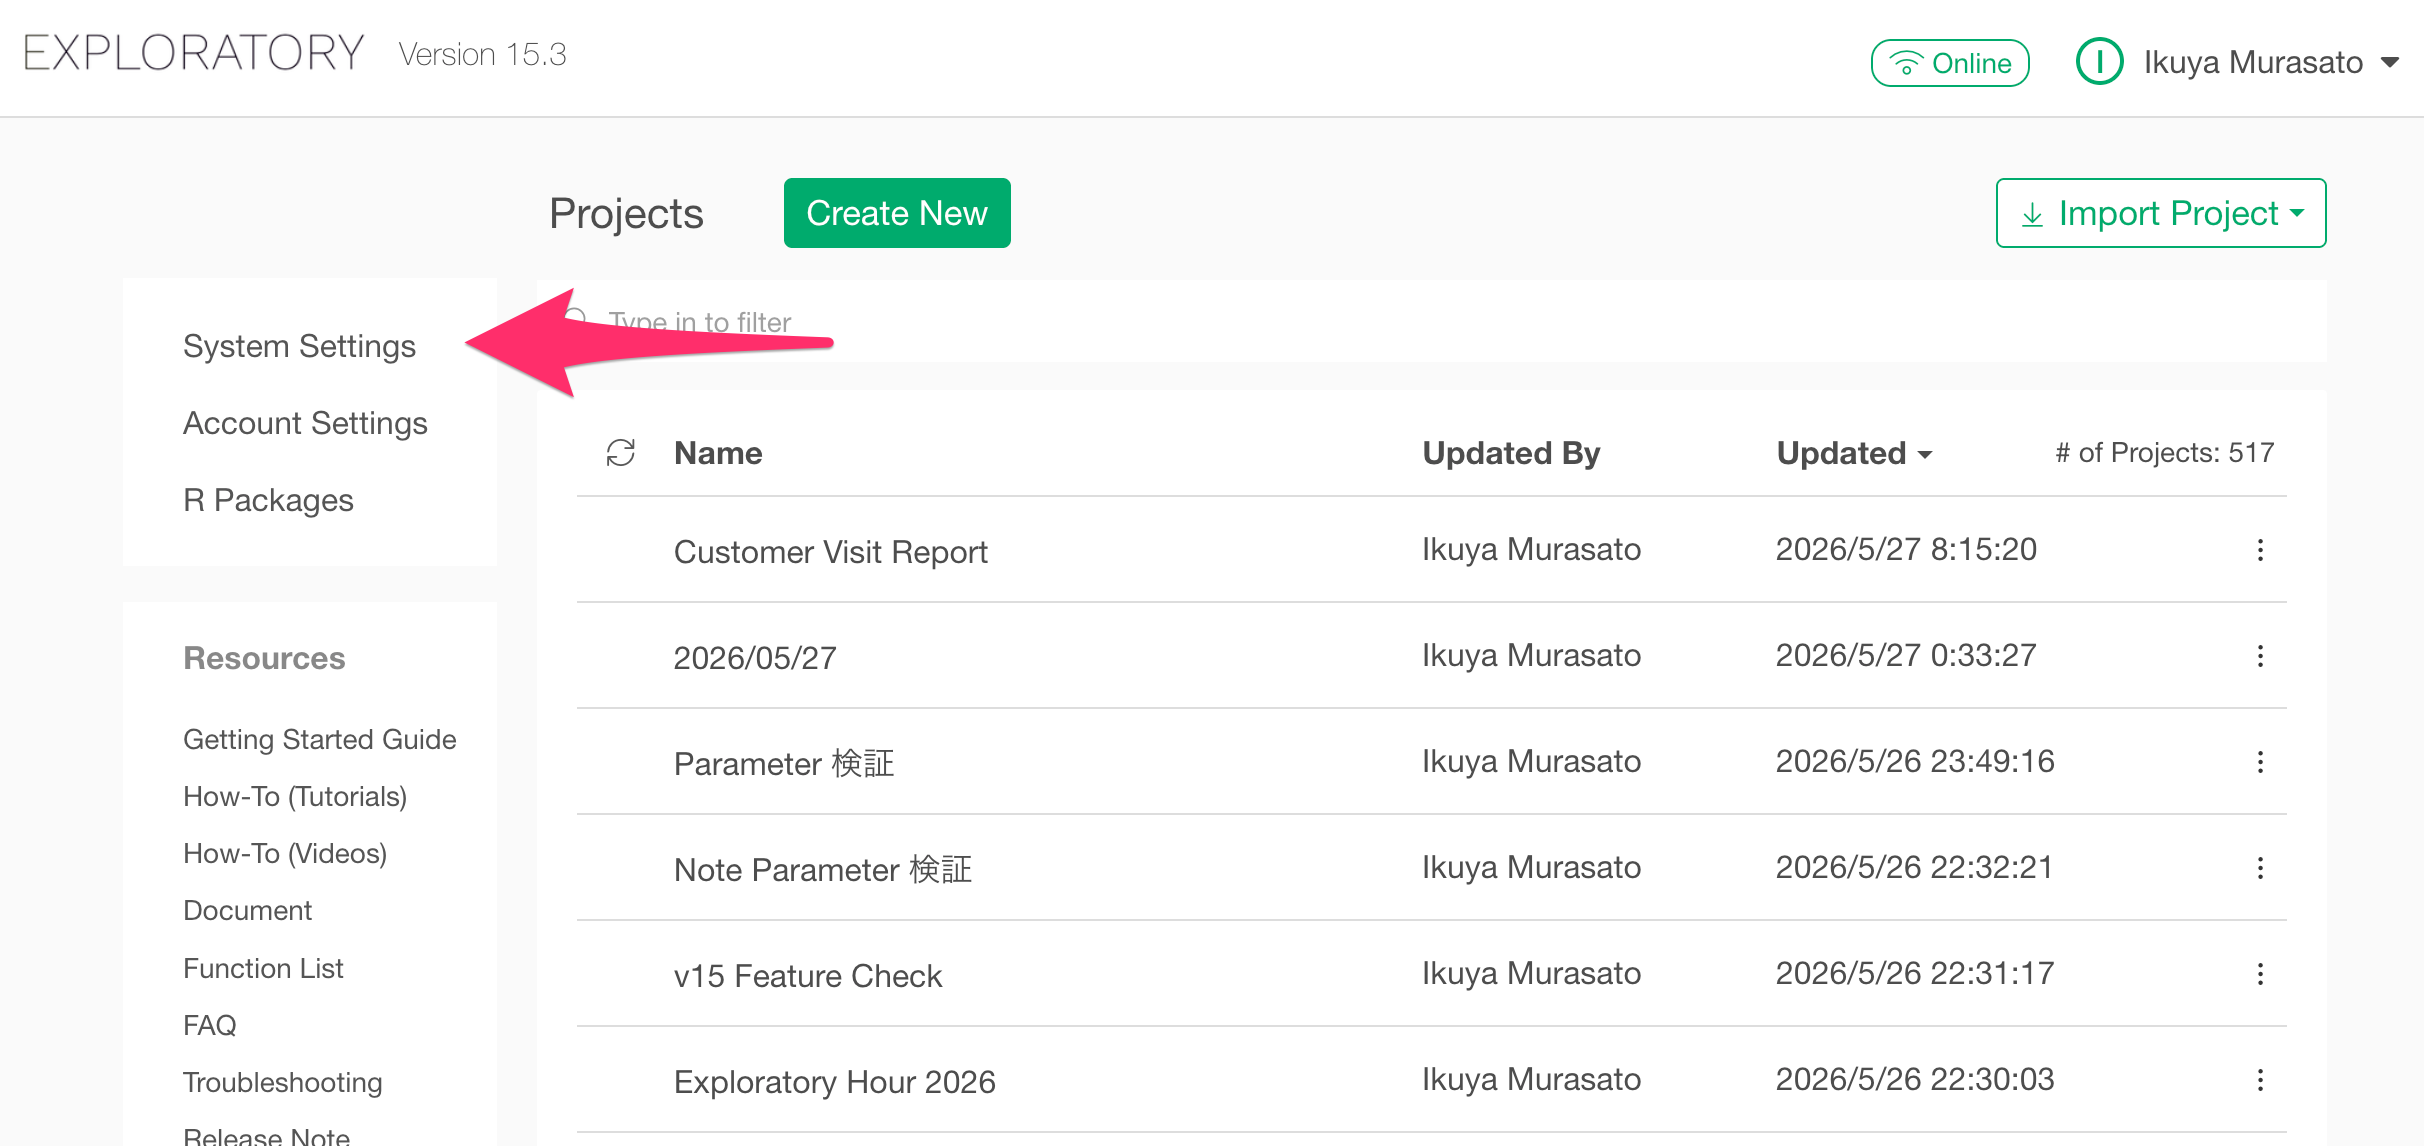
The maximum memory size allocated to R is modified through the System Settings.
You can access the System Settings from the project list view.
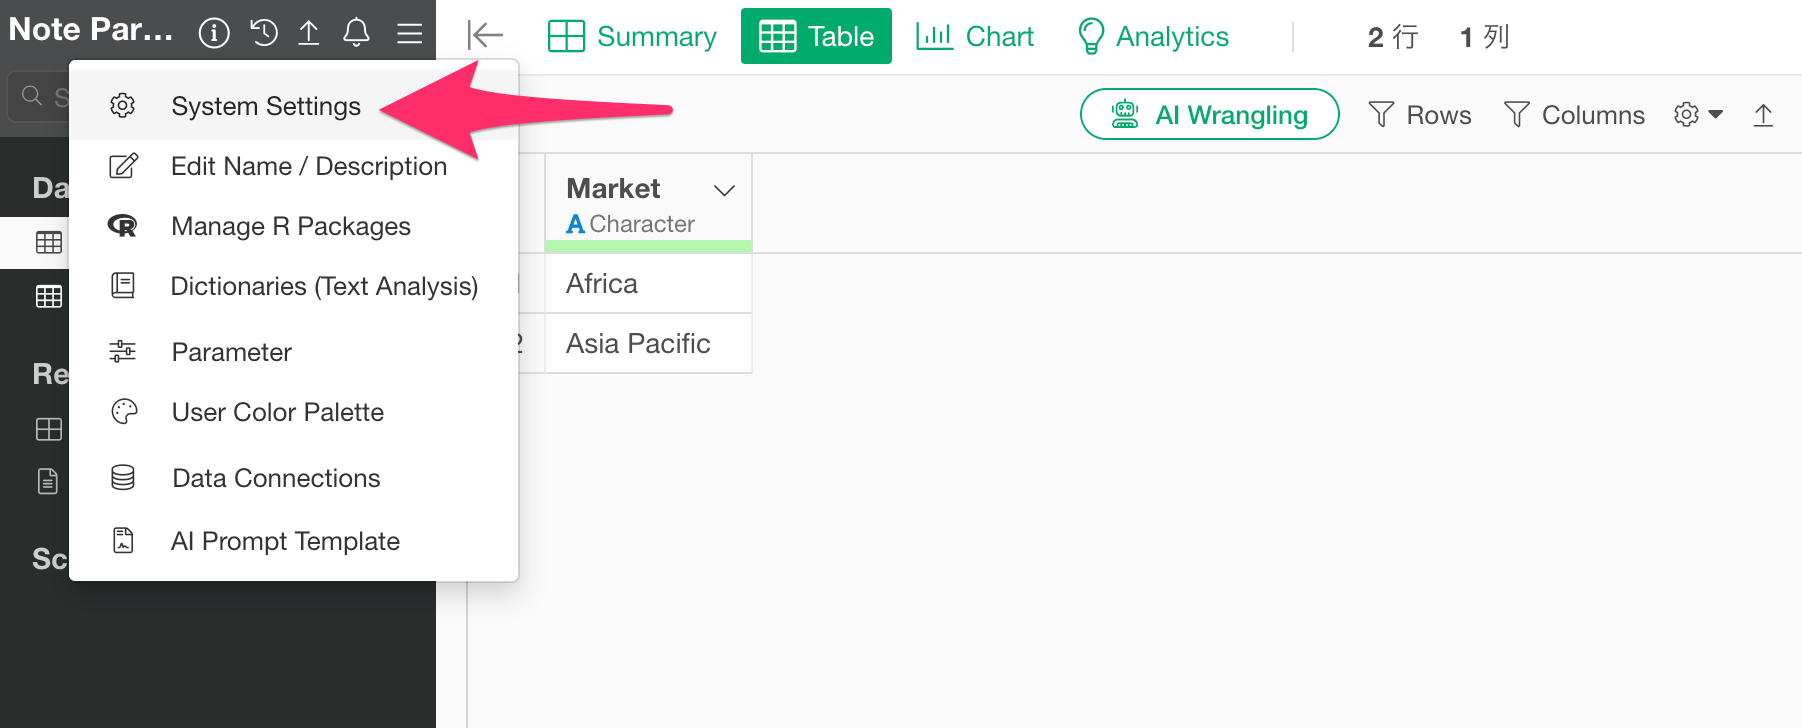
Alternatively, while a project is open, you can access it by clicking “System Settings” from the project menu in the top-left corner.
Next, in the “General” tab, enter your desired value (in GB) for “R Memory Allocation” based on your machine’s available memory.
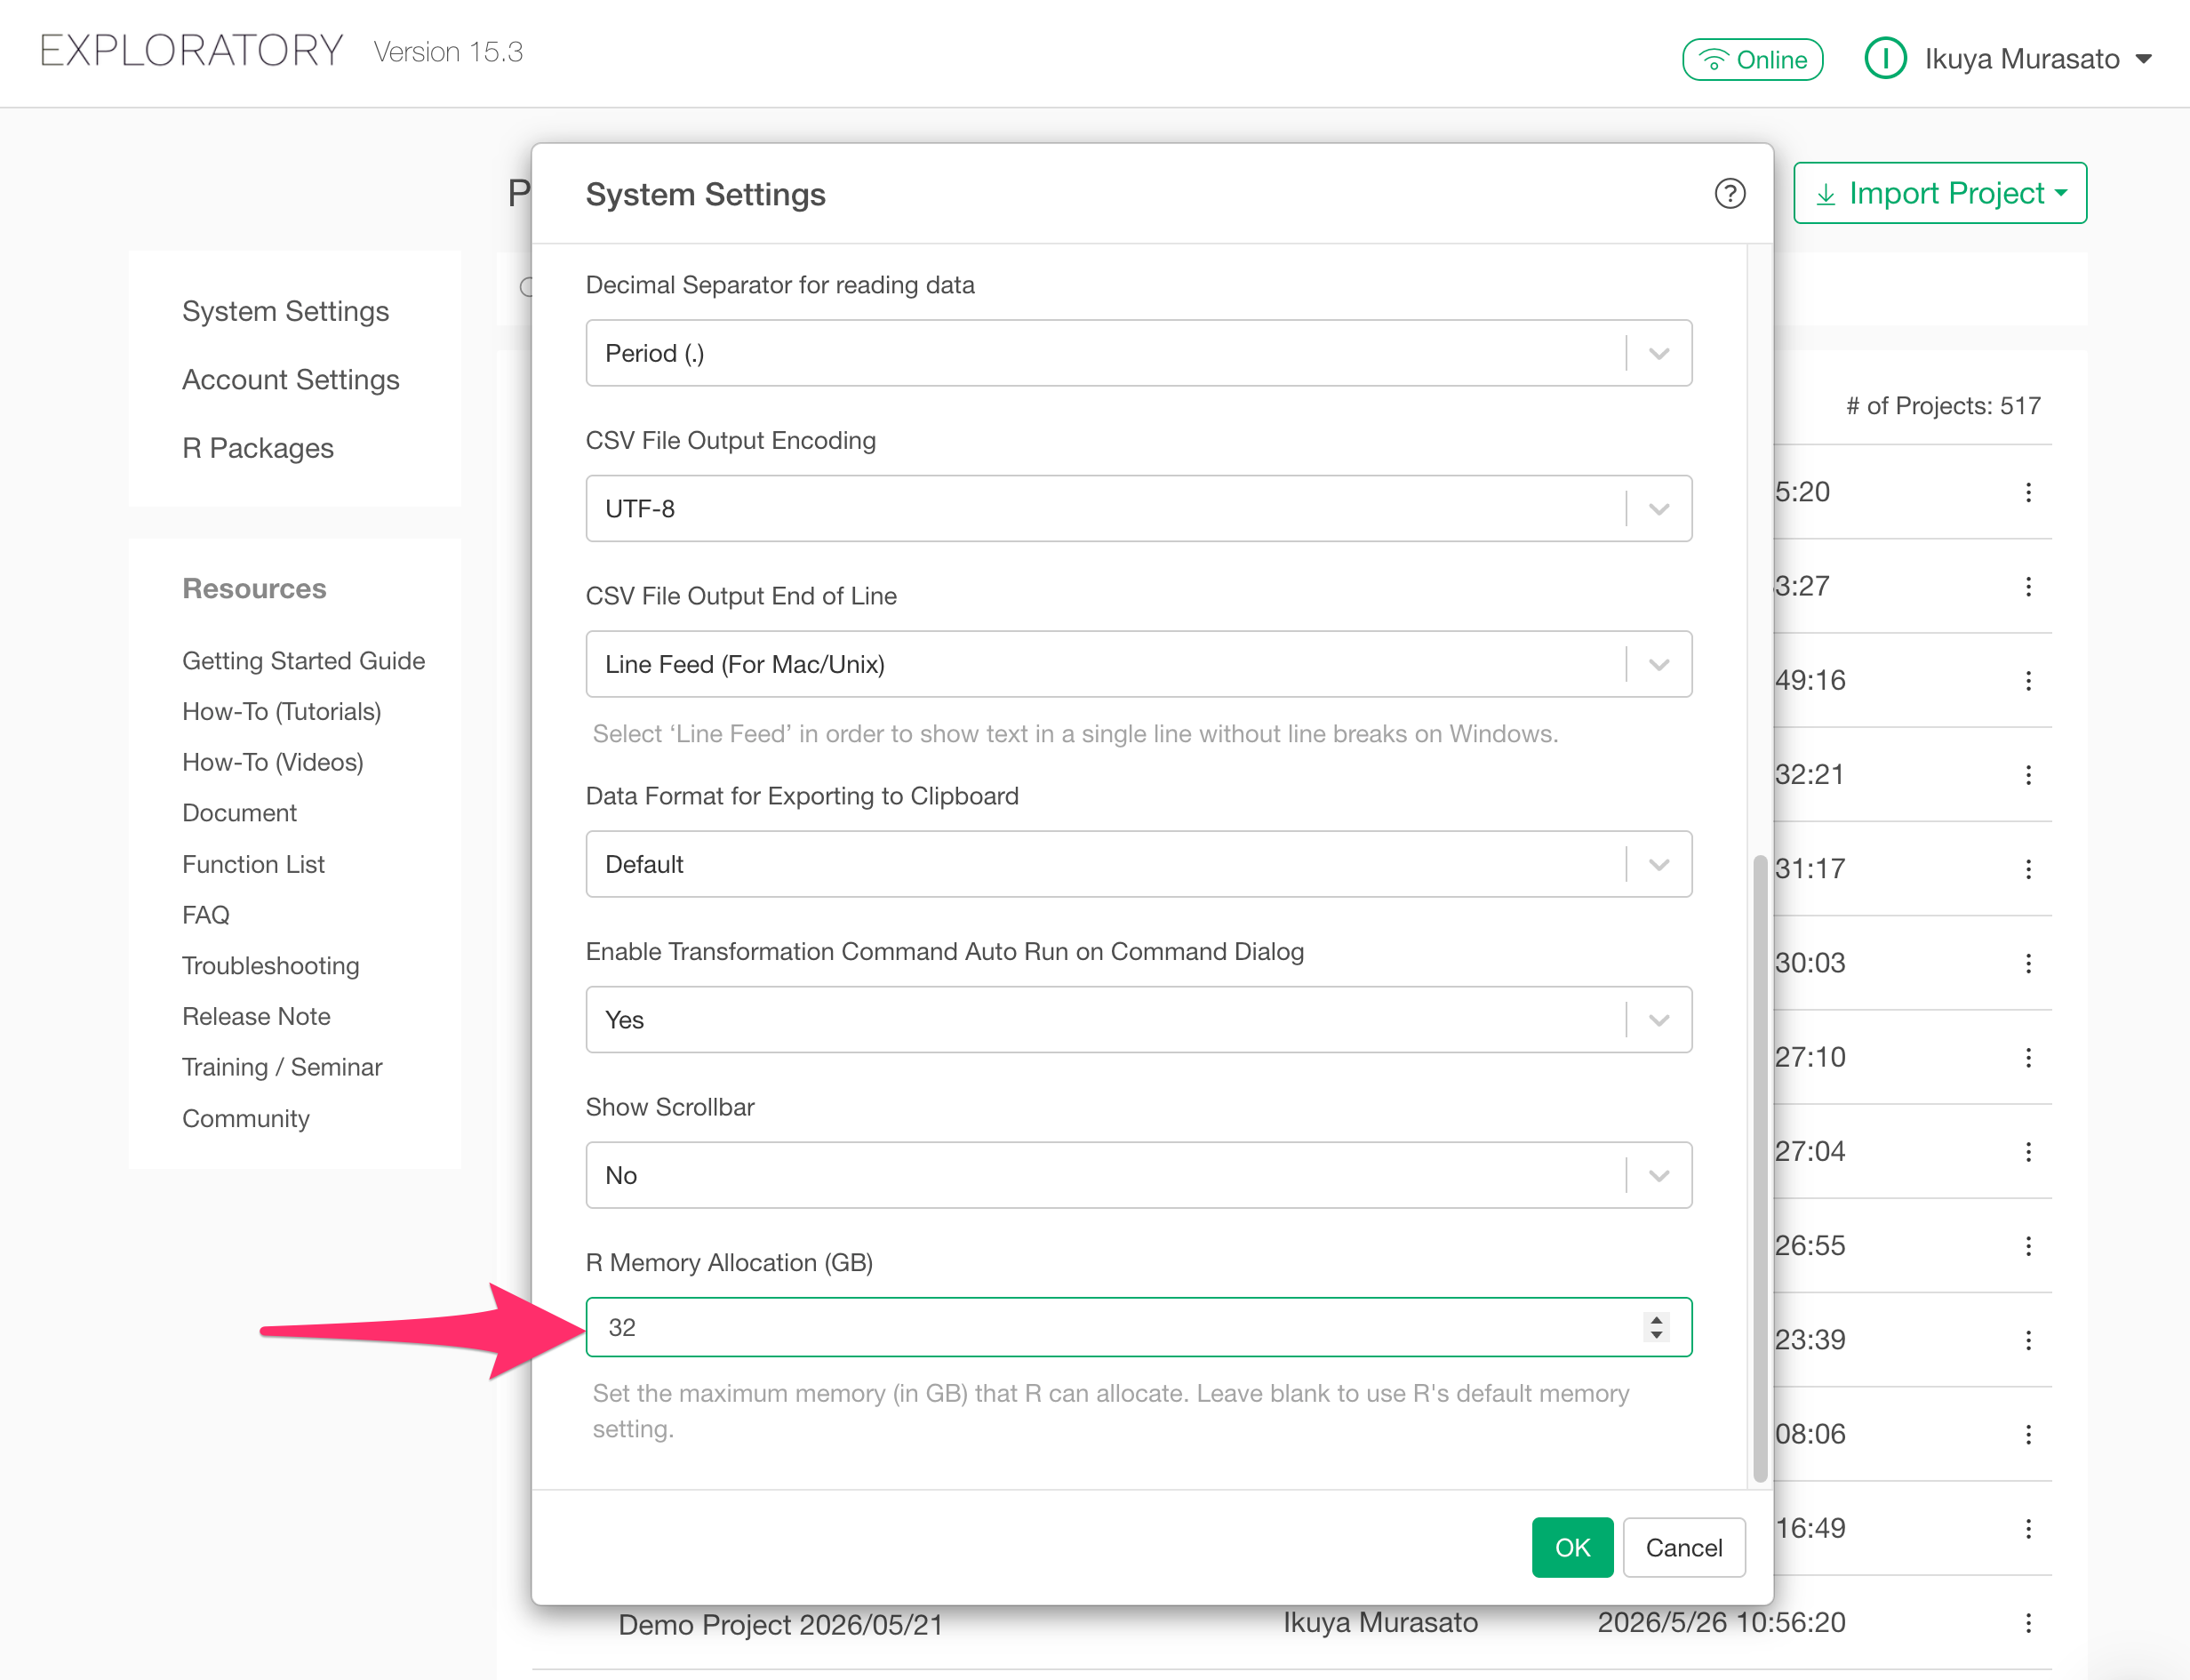
If left blank, an appropriate value will be set automatically based on your machine’s current memory status.
Please note that the maximum limit depends on the physical memory of your machine. For example, if you set 32GB on a machine that only has 16GB, the actual maximum memory size will be 16GB.
For Exploratory Versions Prior to v15.3
As shown in the image, click the “+” button next to “Scripts” within your project to create a new script, and enter the following command:
Sys.setenv('R_MAX_VSIZE'=32000000000)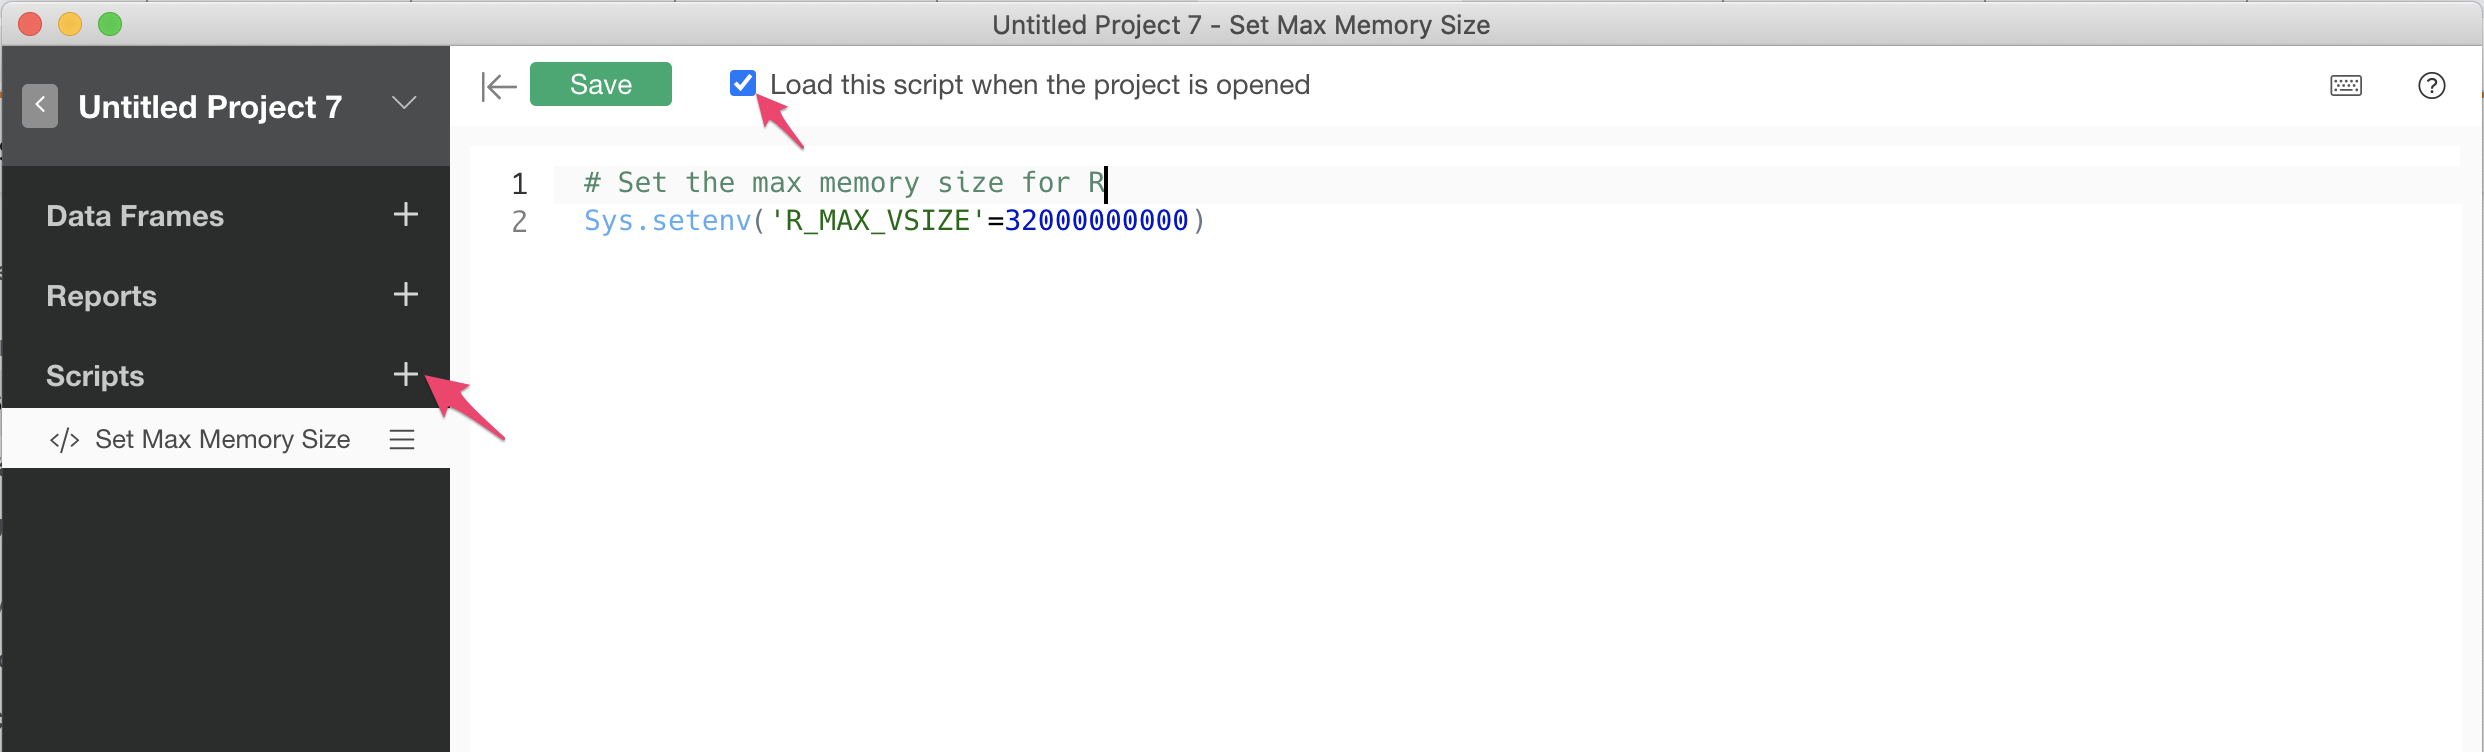
Ensure that the “Load this script when the project is opened” checkbox is checked, then click “Save” to specify the “R Max Memory Size.”
Note that this result also depends on the hardware specifications of the machine running Exploratory Desktop.
If your machine can only allocate up to 16GB of memory, the maximum memory size will remain 16GB even if you set it to 32GB.
Best Practices in Five Areas
From here, we will introduce specific methods to improve processing performance in Exploratory across the following five categories:
- Data Import
- Data Wrangling
- Charts/Analytics
- Dashboards
- Parameters
1. Data Import
Exploratory allows you to import various data from files and databases. Importing large amounts of data, especially from databases, can lead to the following performance-related issues:
- Data downloading takes a long time.
- It puts pressure on memory.
- Subsequent processes, such as data wrangling, take longer.
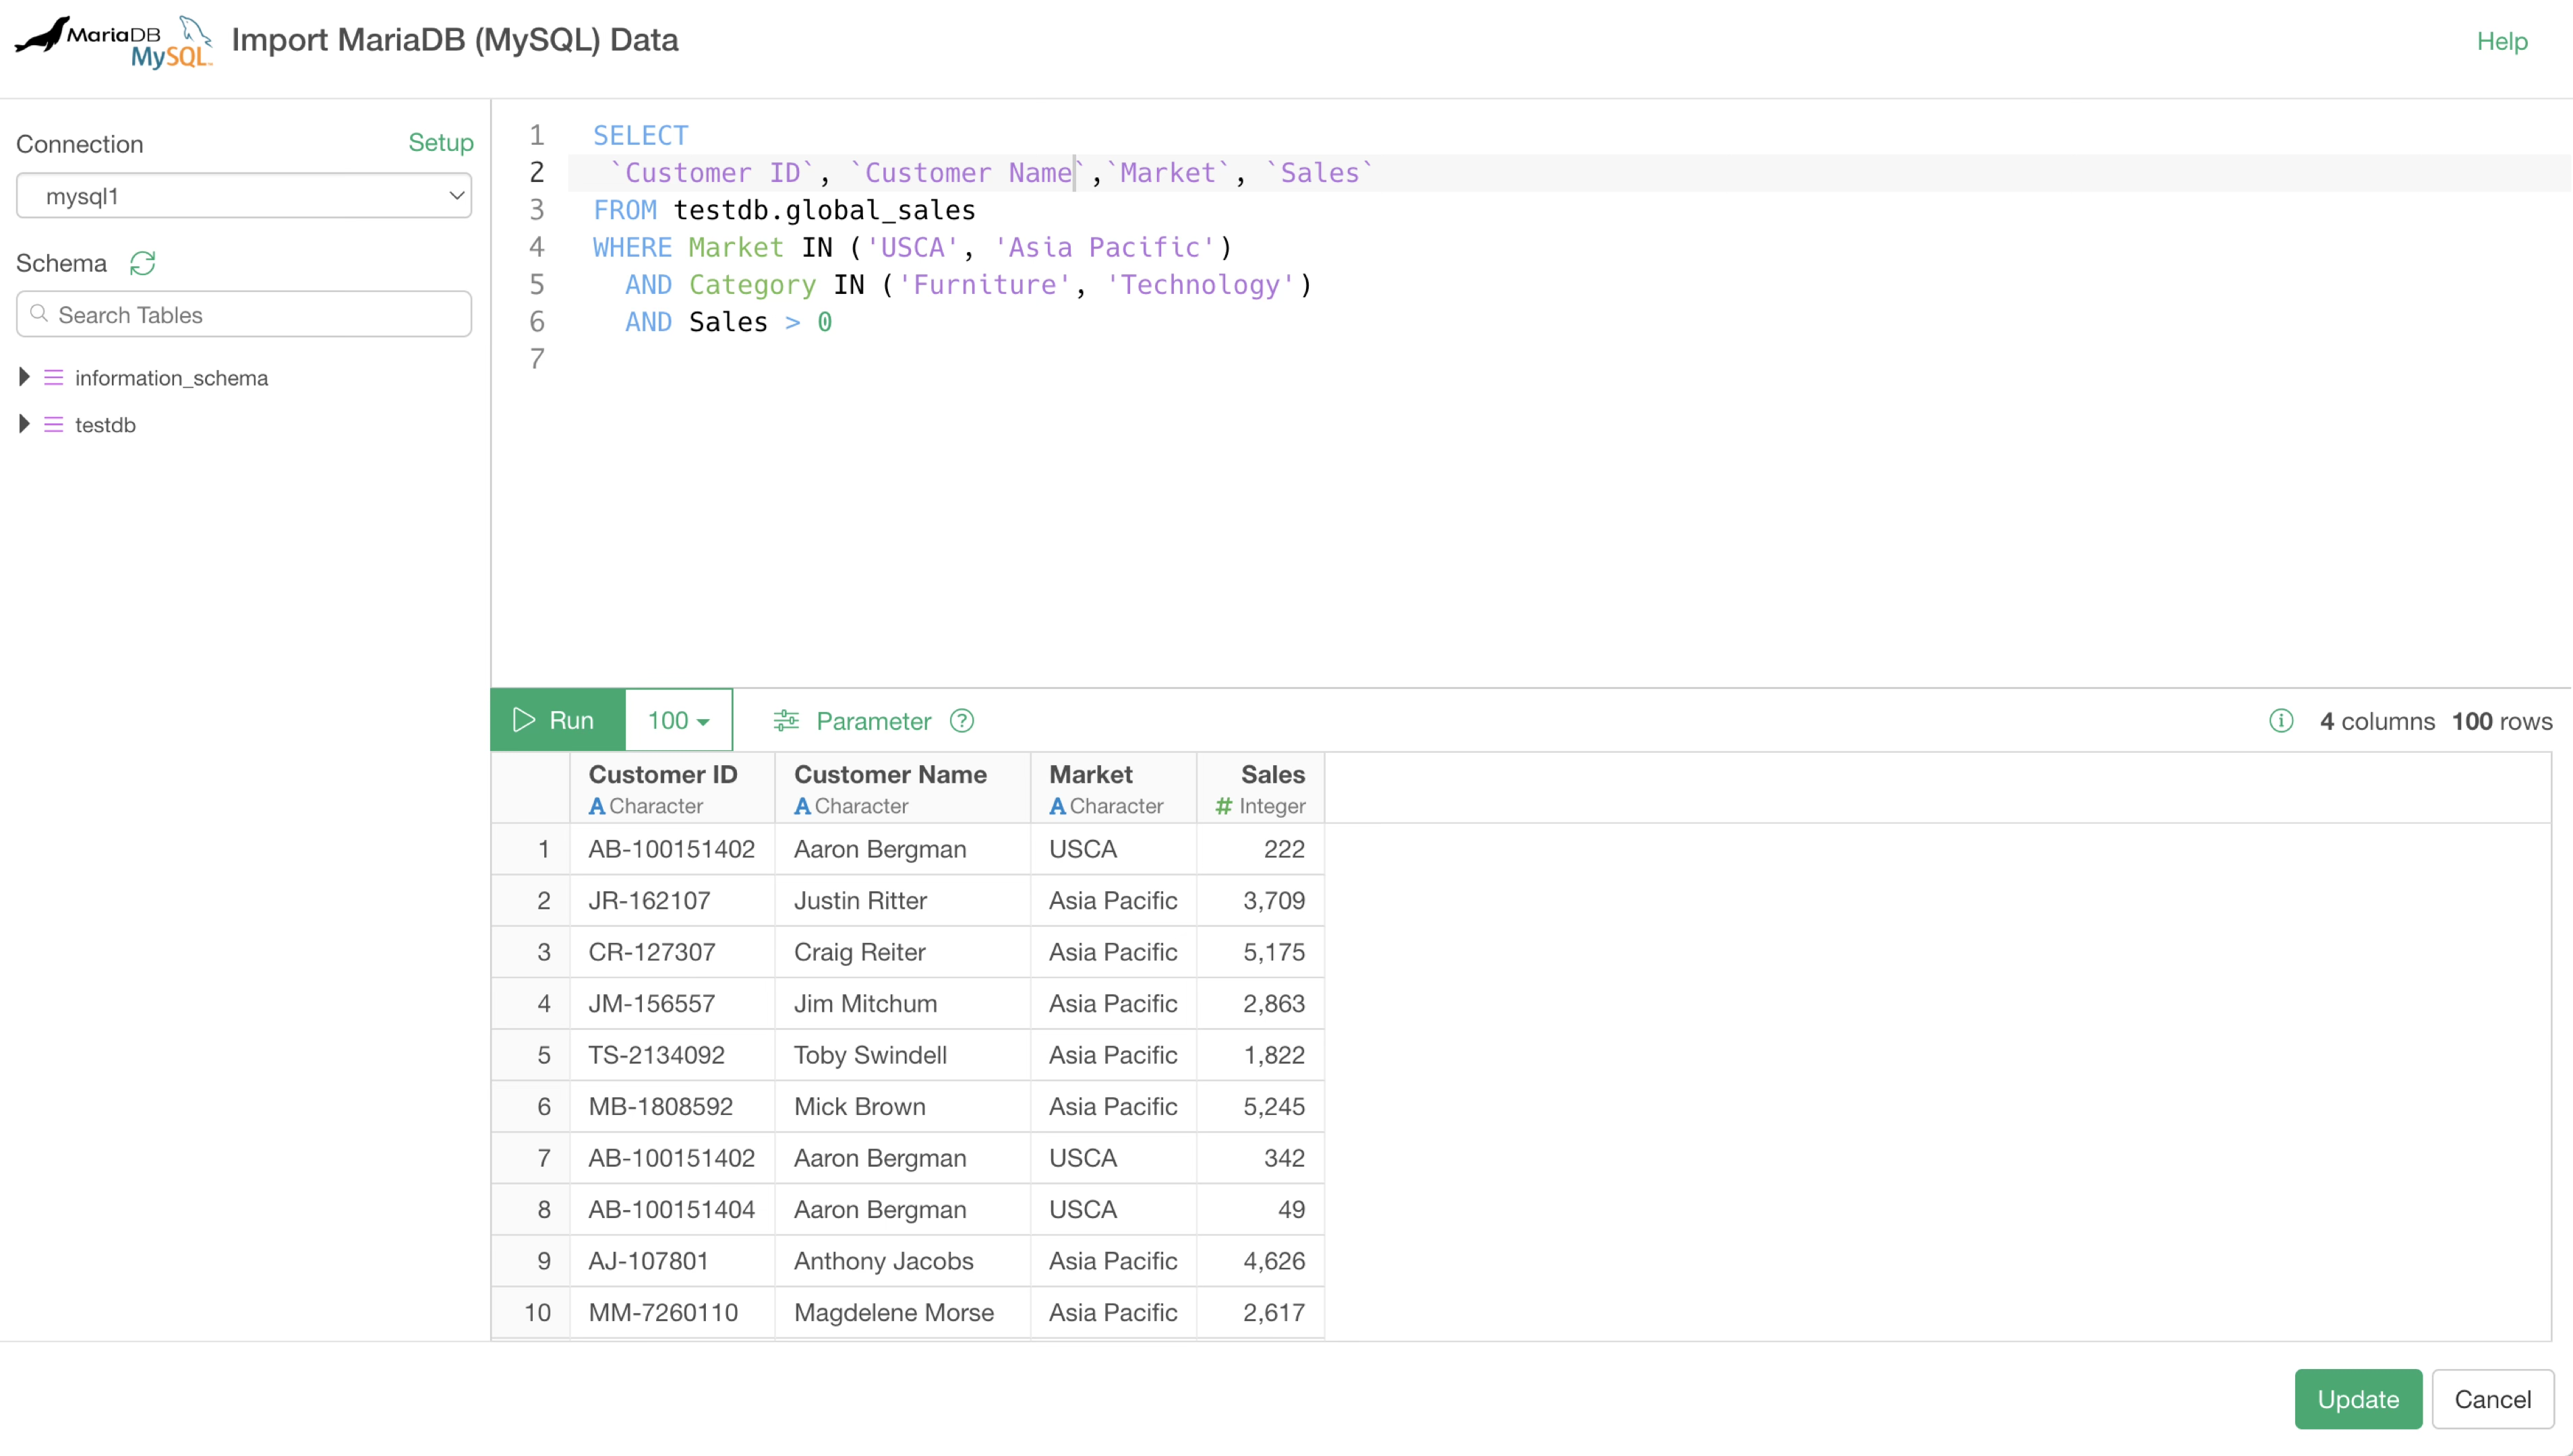
Therefore, when retrieving data from a database, you can improve efficiency using the following two methods:
- Use SELECT statements to import only the necessary columns.
- Write SQL to perform aggregation on the database side and import the aggregated data.
Importing Data from Oracle Database
When importing data from an Oracle database, you may be able to improve the data import speed by adjusting the “Fetch Buffer Size.”
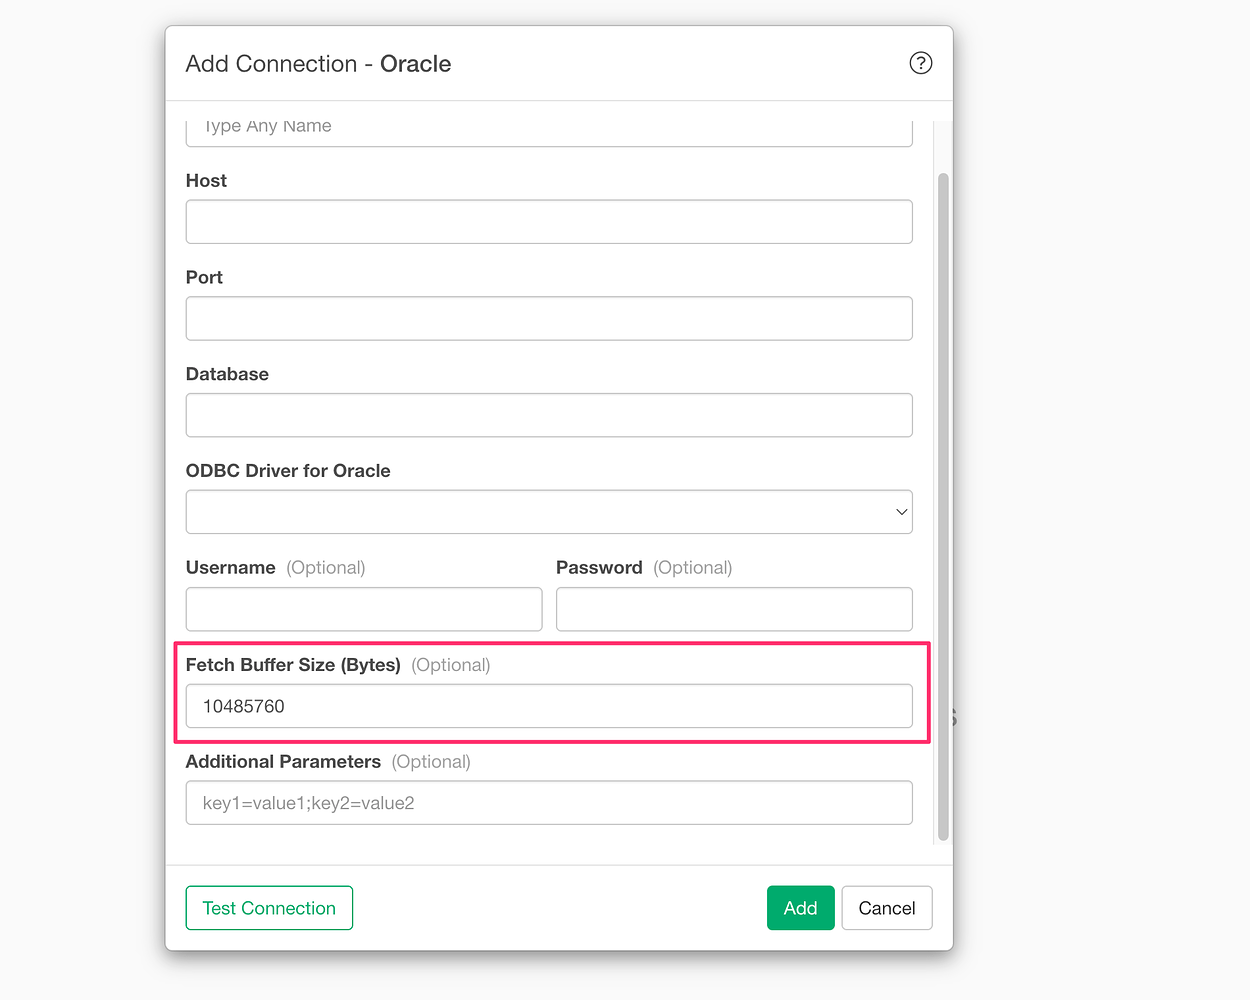
For more details, please refer to the following link:
- How to Improve Performance When Importing Data from Oracle Data Sources - Link
2. Data Wrangling
There are many best practices in the area of data wrangling. This section introduces them one by one.
As mentioned earlier, when you transform data in Exploratory, steps are added, and data is loaded into memory for each step.
By understanding this and performing efficient data transformation, you can reduce memory usage and improve performance.
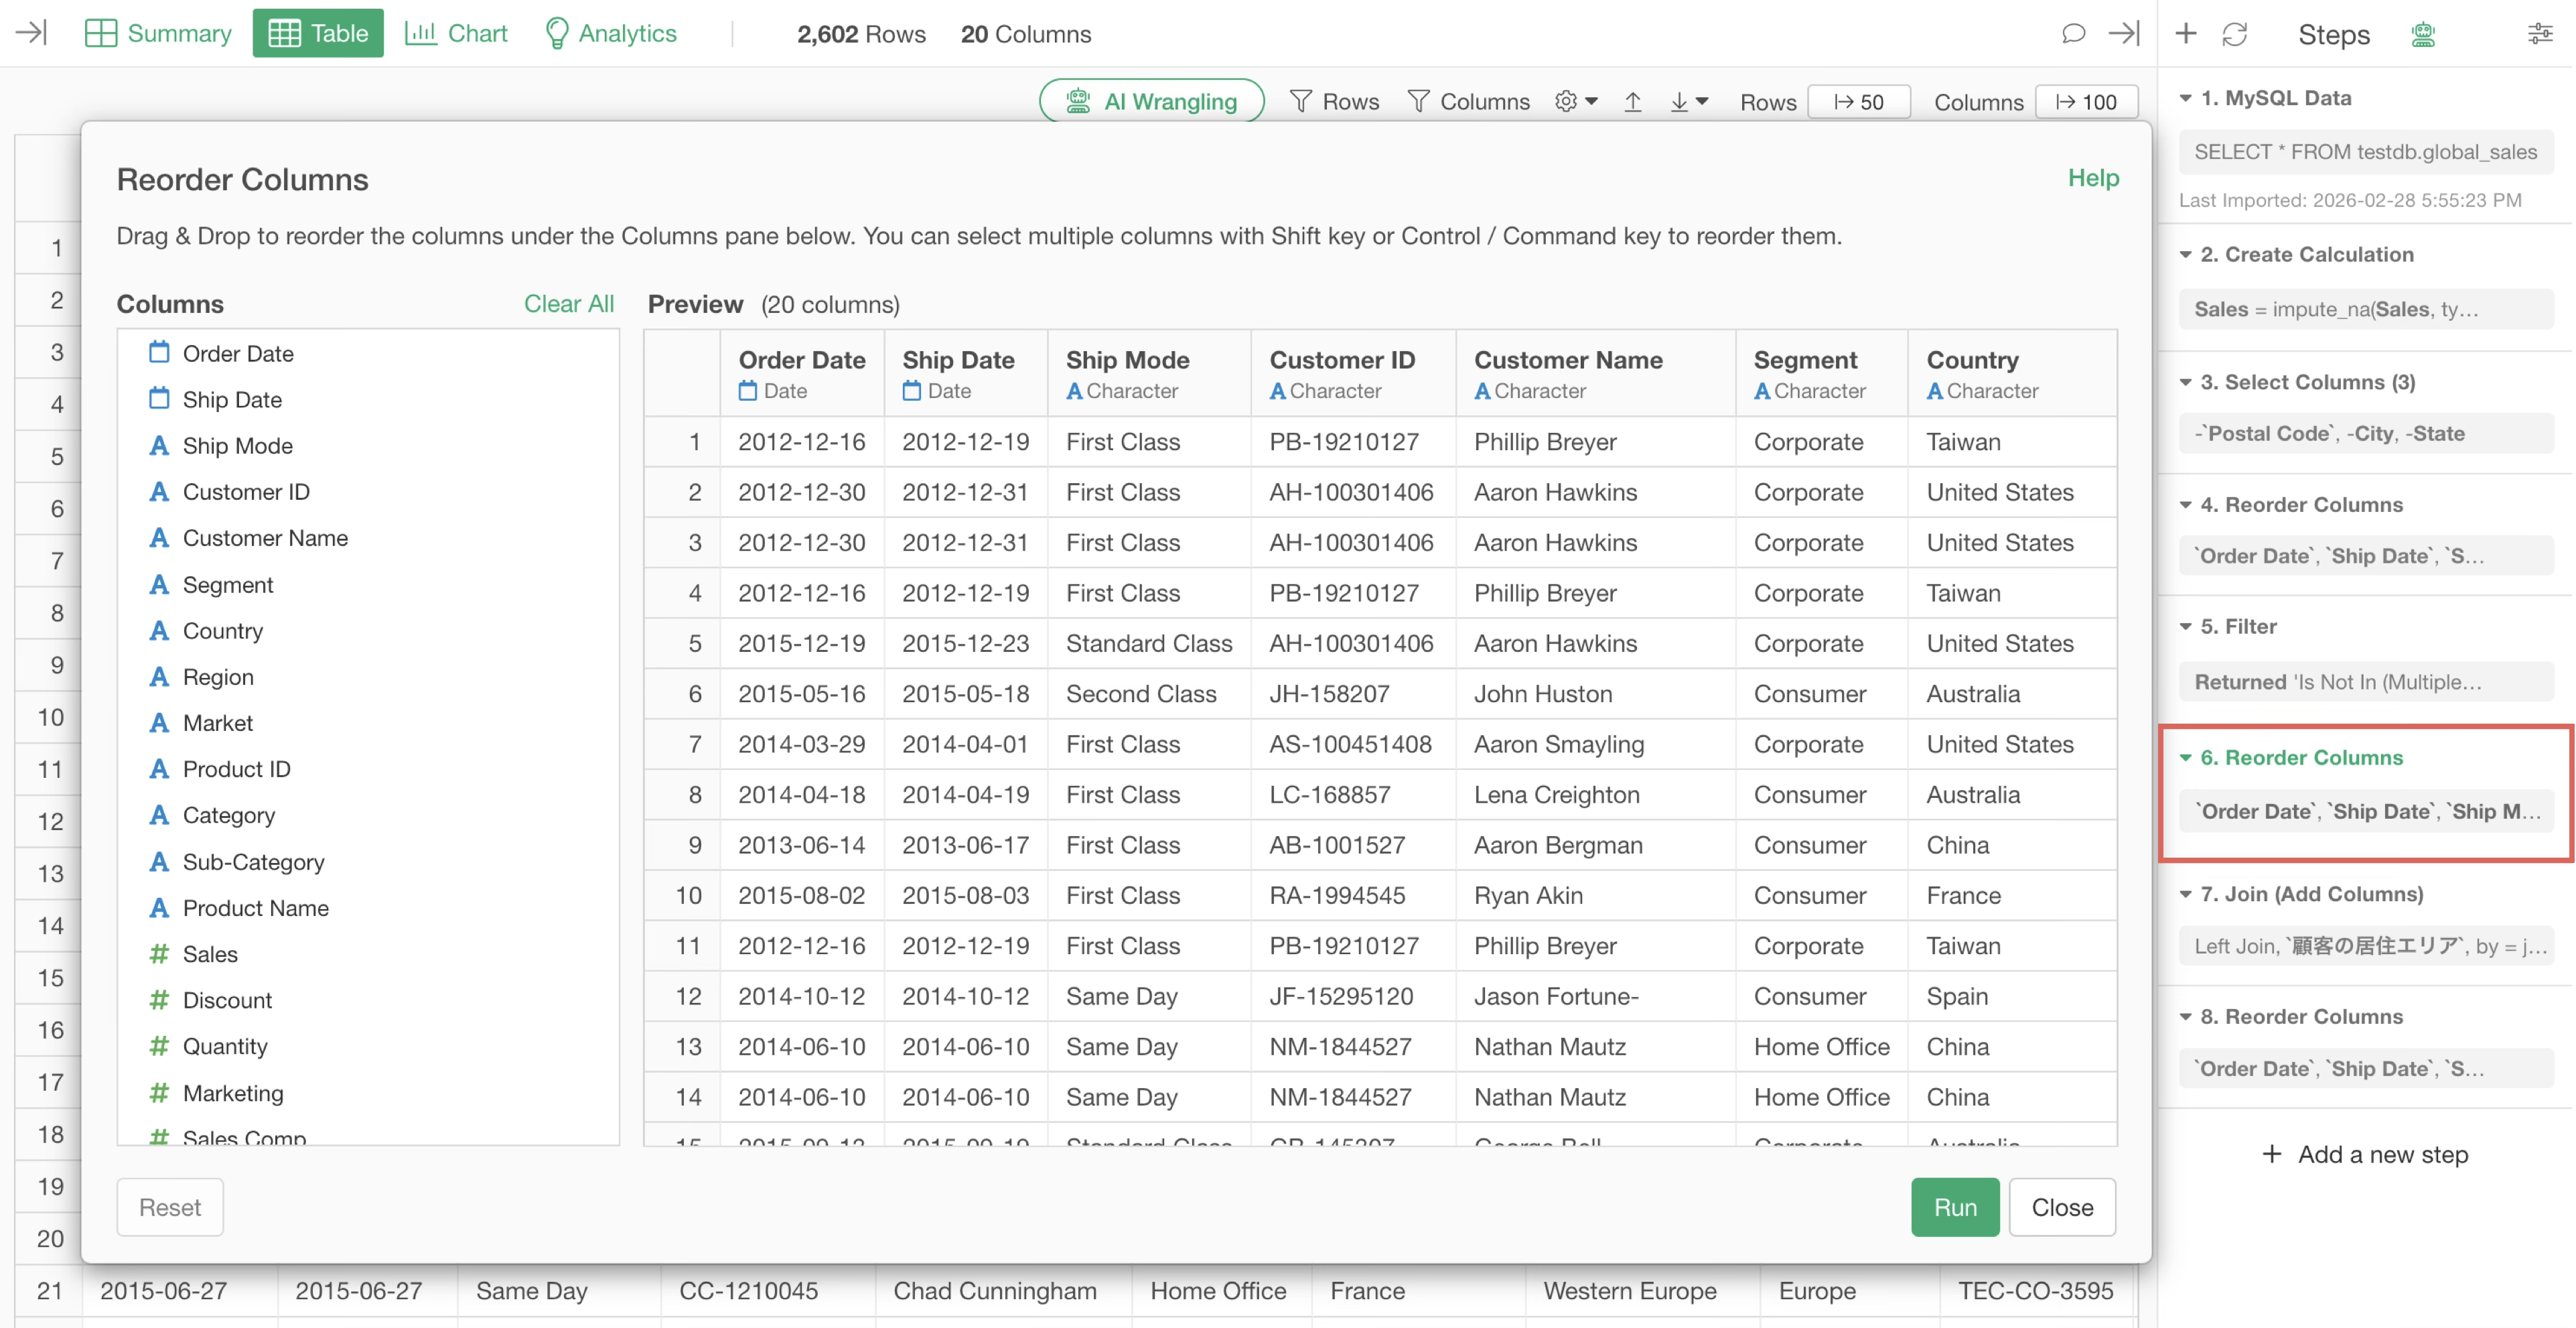
Consolidate Similar Processes into the Same Step
For example, if you perform similar processes across multiple steps, it unnecessarily consumes memory and leads to decreased performance.
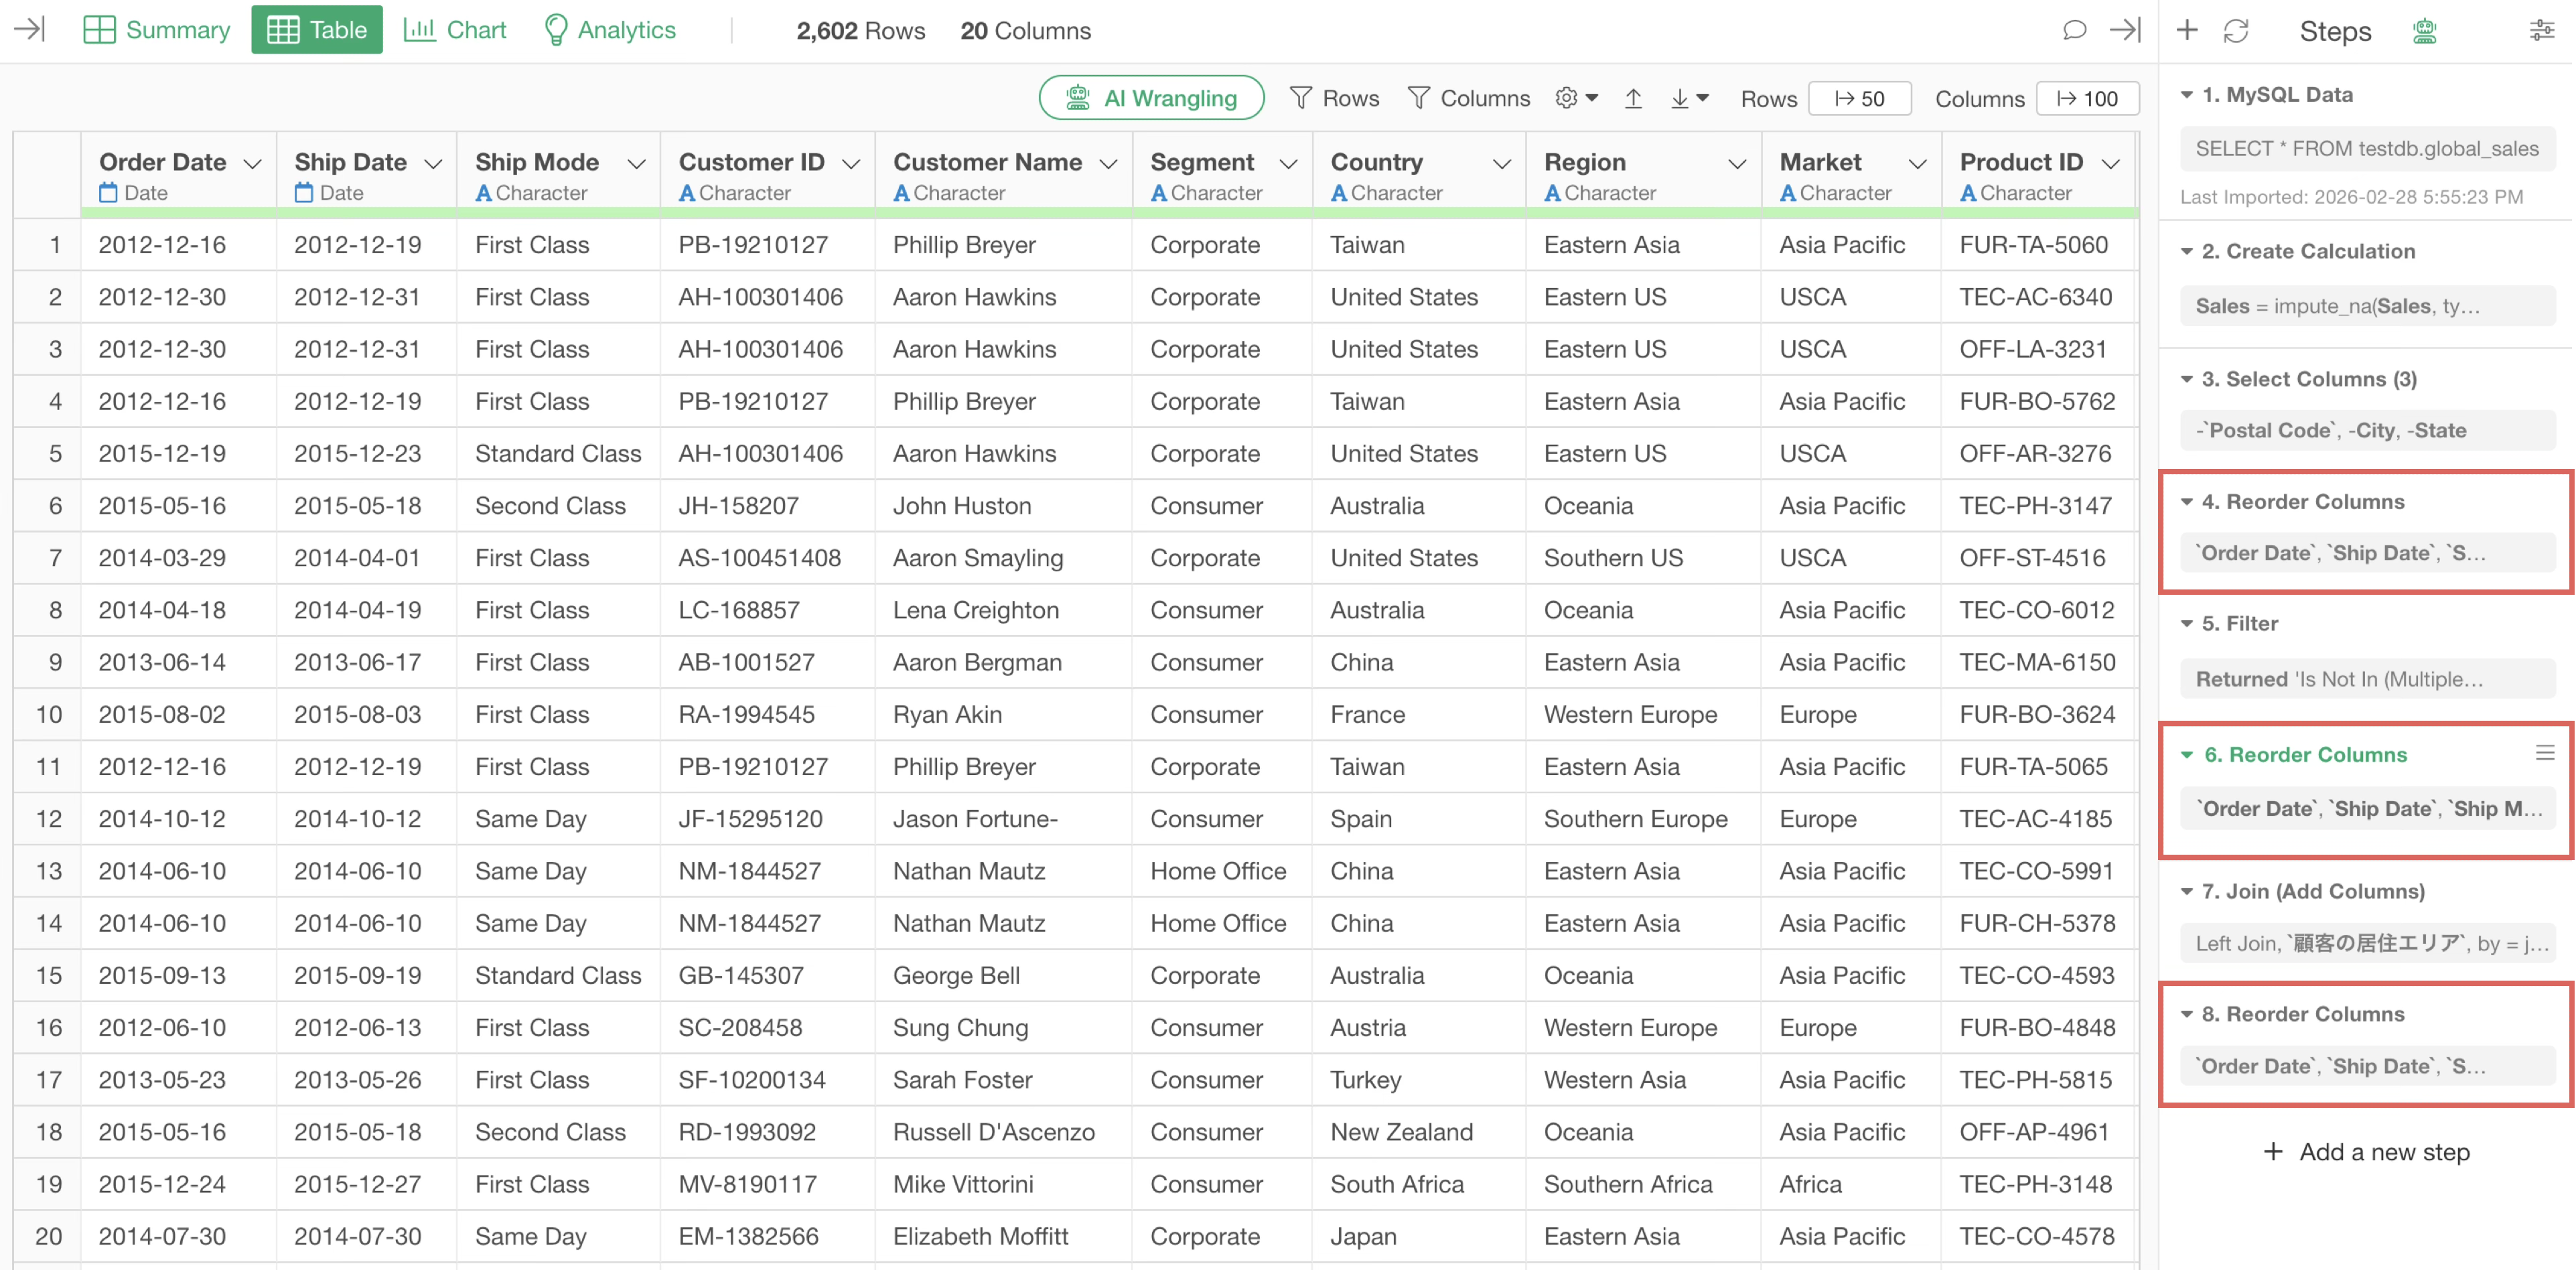
In the example above, the process of reordering columns is executed three times. If all these processes are consolidated into a single step, the load on memory can be reduced.
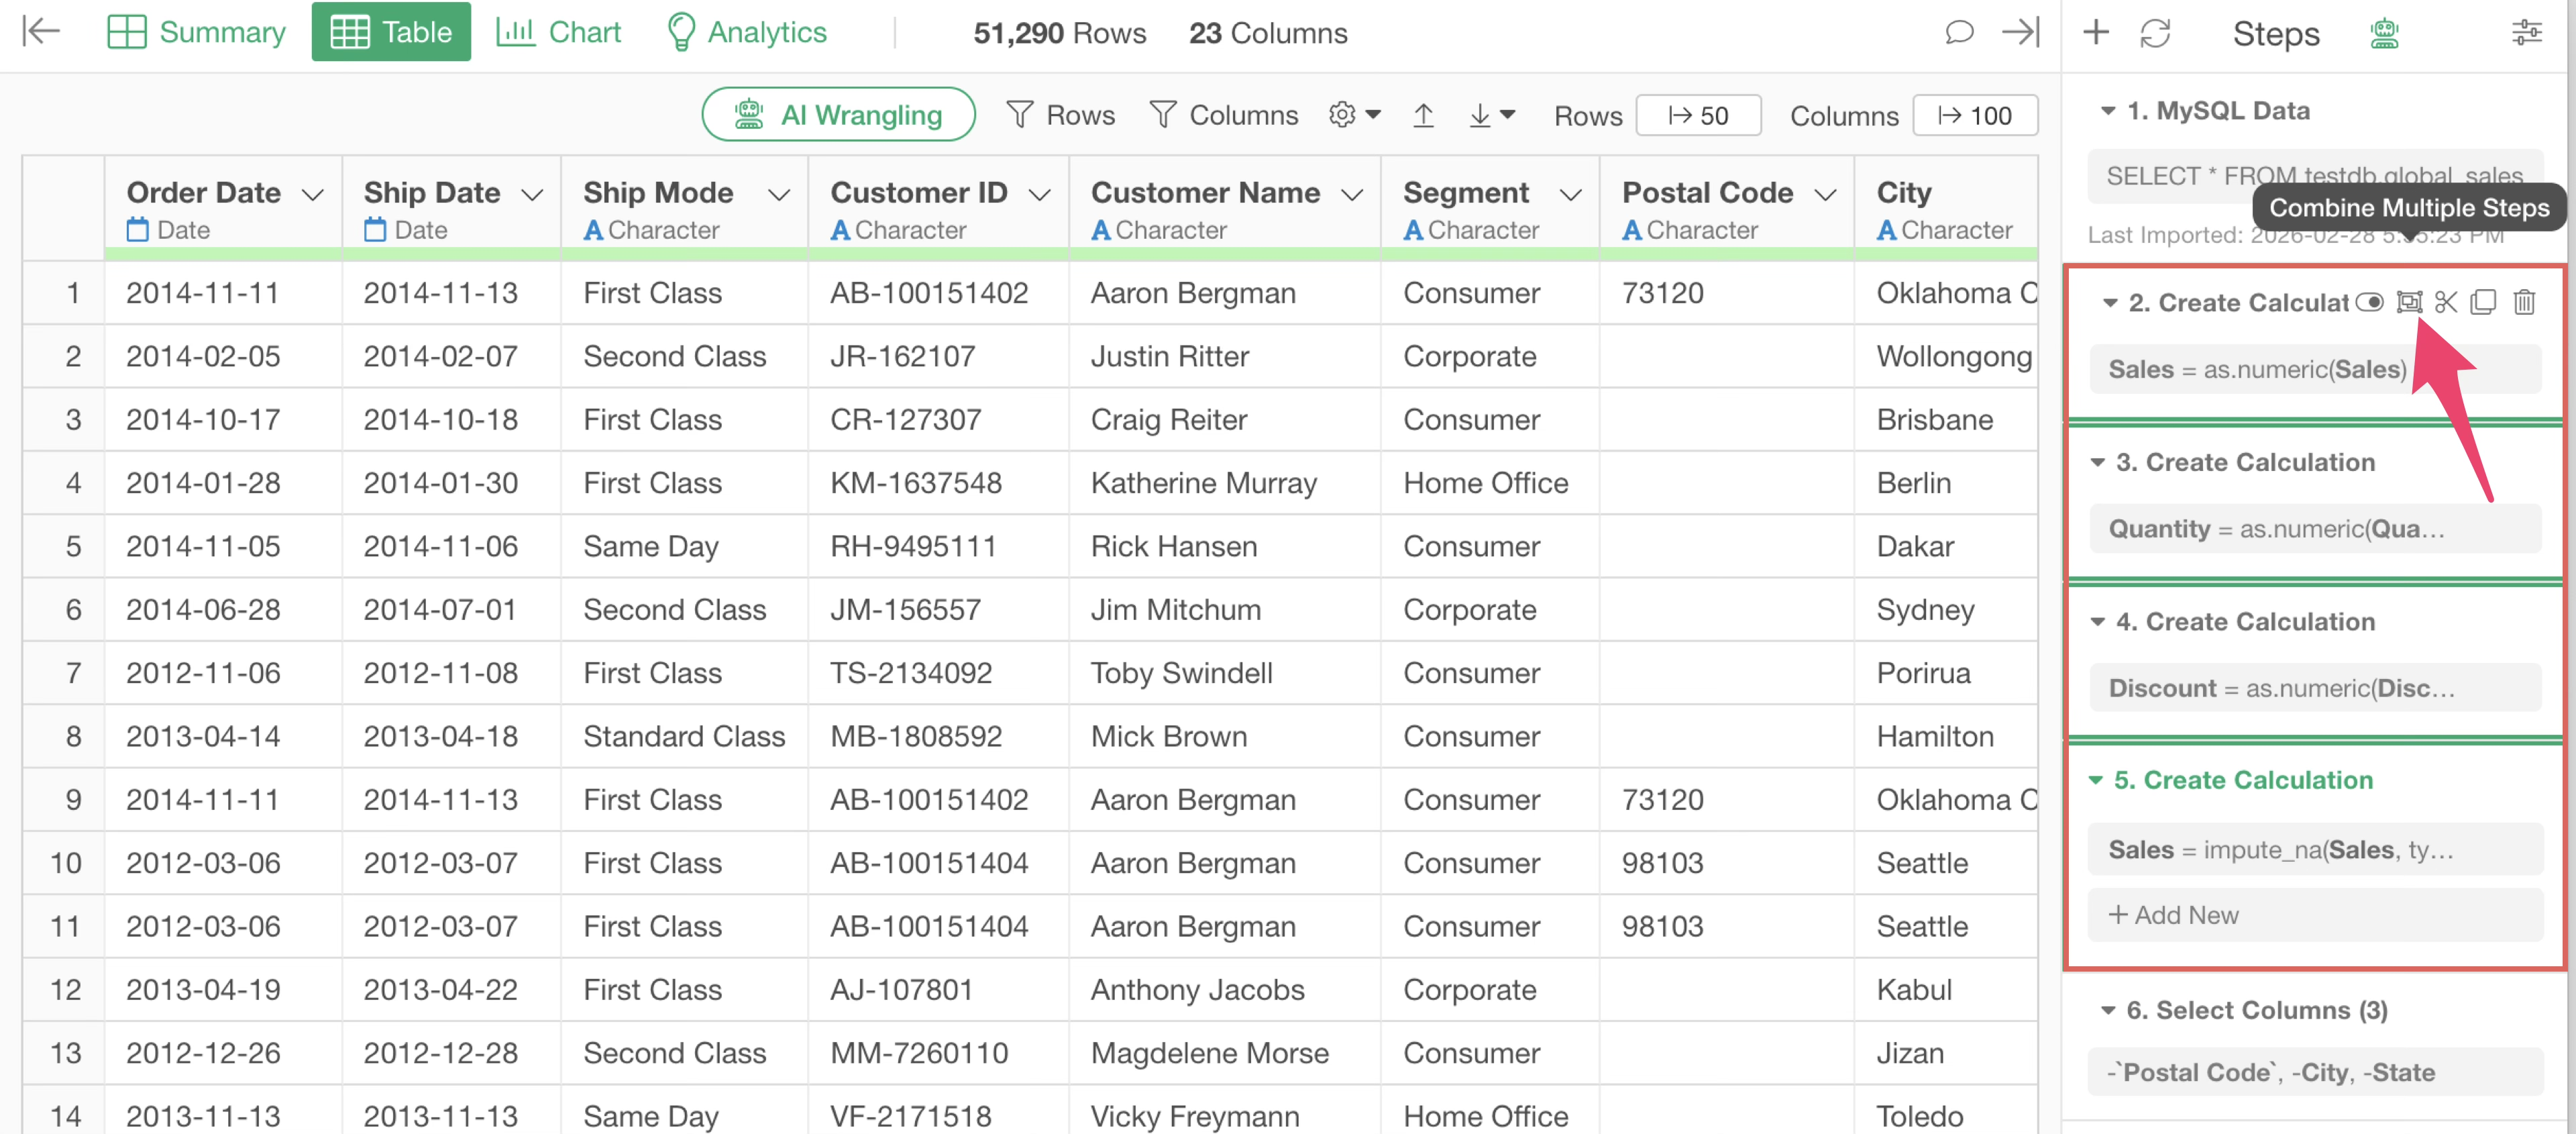
Furthermore, if similar processes (steps with the same process name) are consecutive across multiple steps, the execution results are loaded into memory “step by step.” Performance may be compromised because the process is executed for each step or because the results are loaded into memory for each step.
In such cases, consolidating multiple steps into one allows you to optimize the data loaded into memory.
Export and Use Processed Data When Reproducibility is Not Required
Because Exploratory has a step feature, you can achieve the following:
- Review data transformation processes later.
- Execute the same processes on updated data when the source data changes.
- Partially update data transformation processes by deleting, editing, or adding new steps.
On the other hand, there are cases where data transformation is complete and the reproducibility mentioned above is not required.
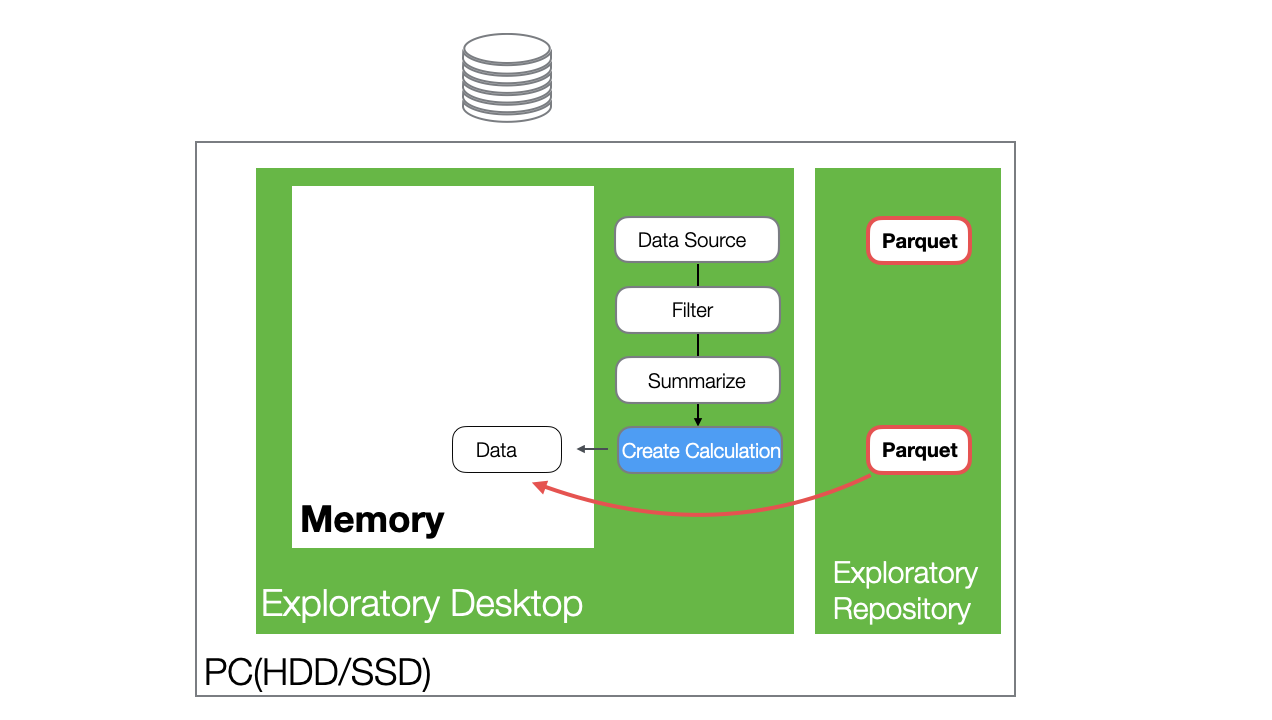
For example, if only the data from the final step is needed and step information is unnecessary, you can export the data as a file or data frame “without steps” from the last step and use that data.
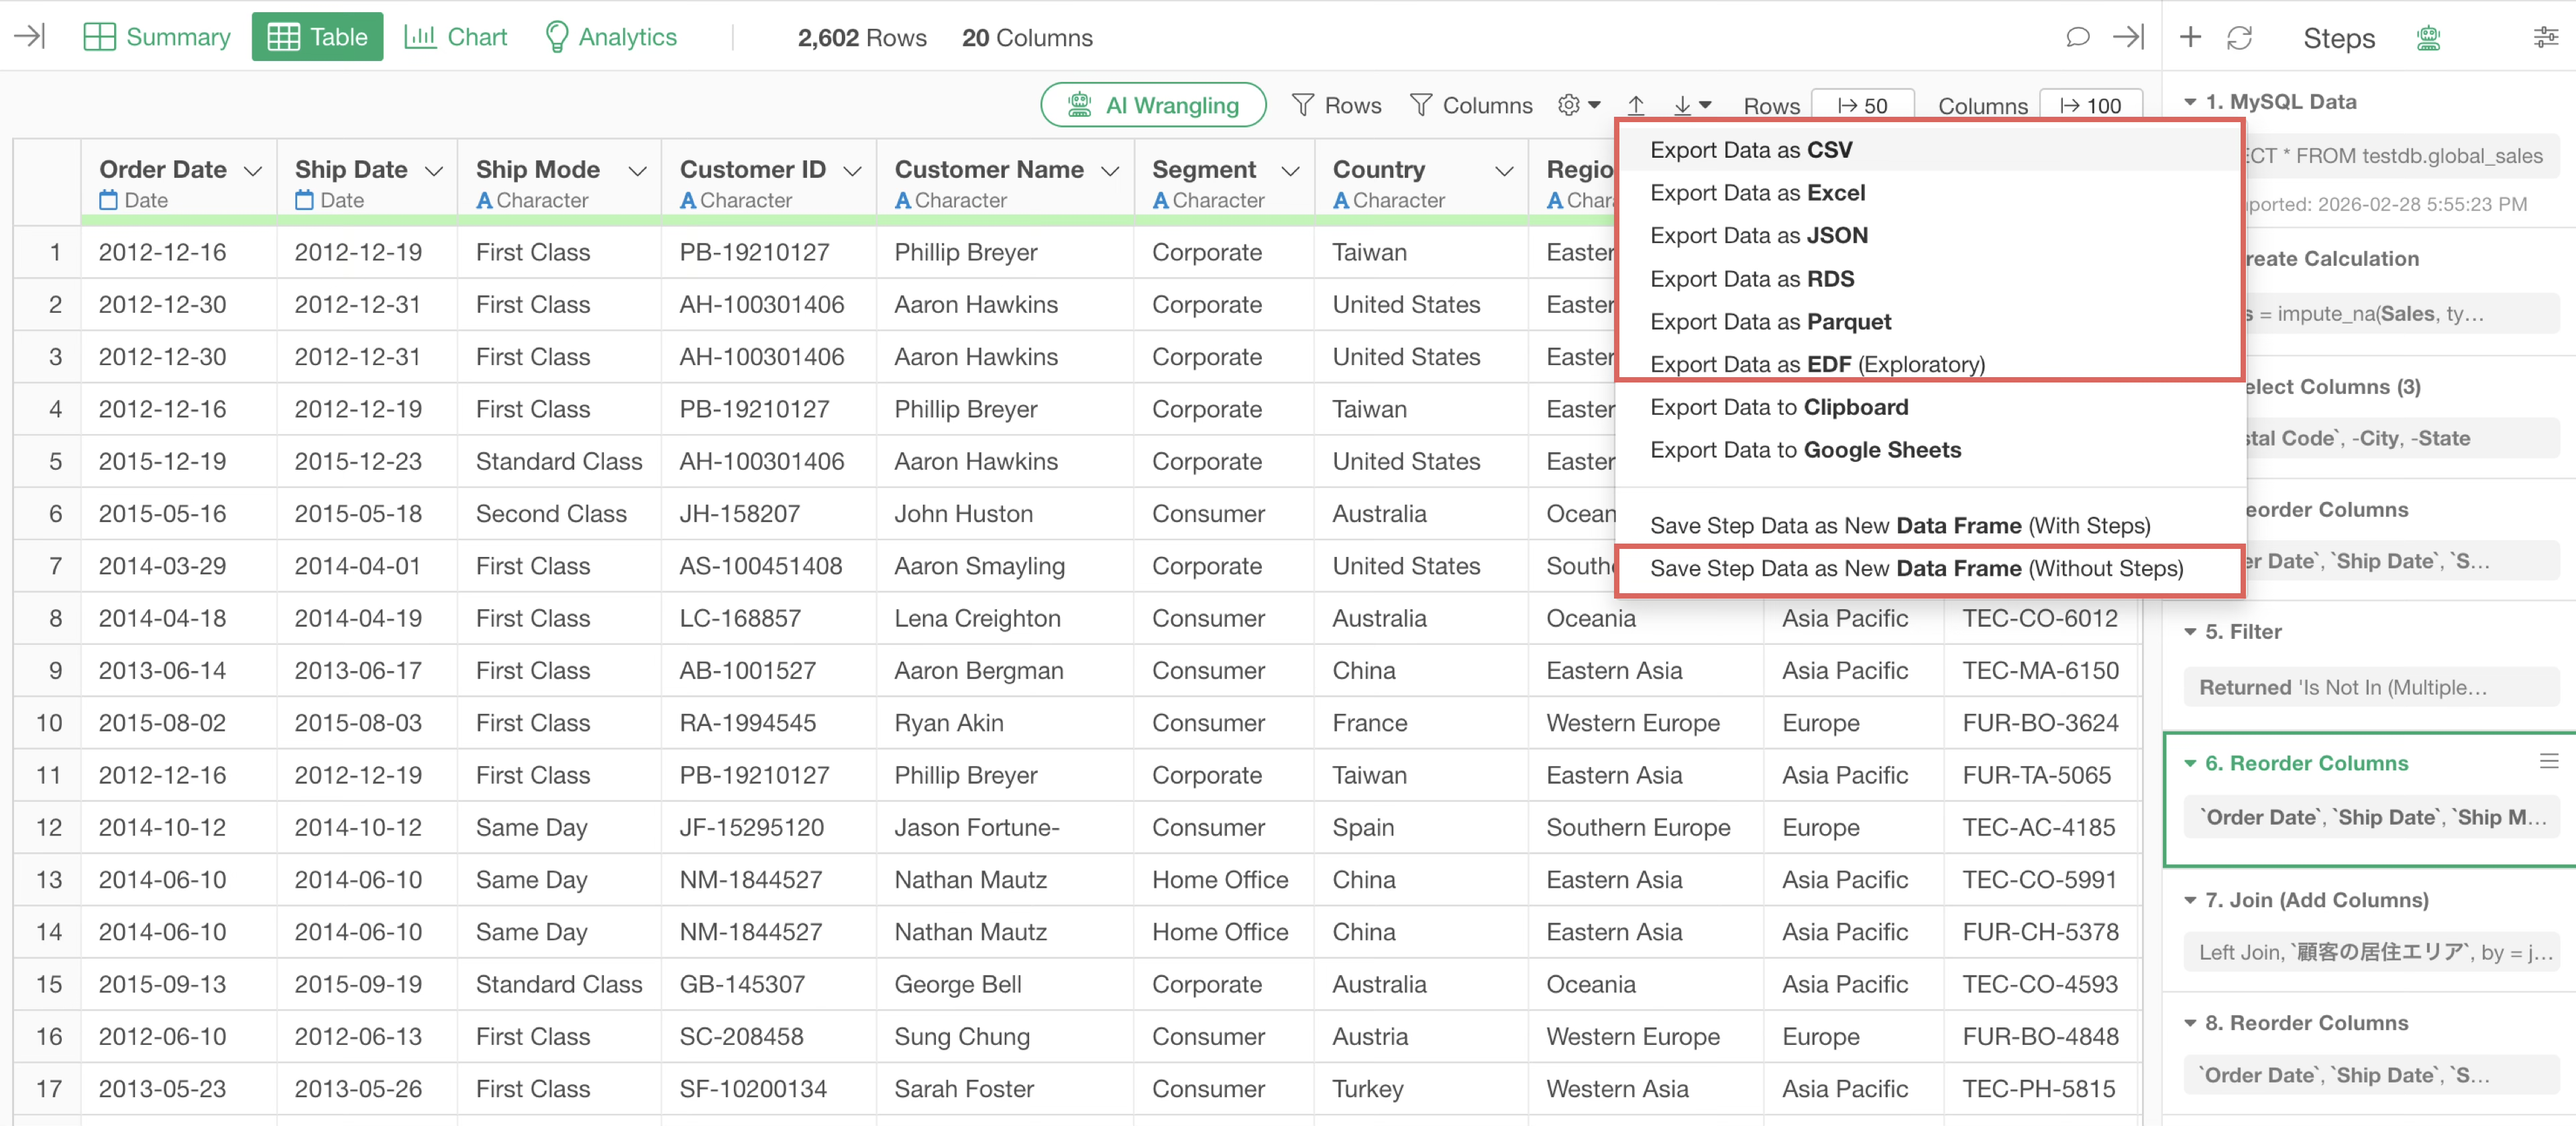
By using processed data that does not have steps, you can save memory usage.
However, note that this approach loses reproducibility, making it difficult to track the history of data transformation.
Reduce Data (Rows) Early Using Filters
One common task when transforming data in Exploratory is narrowing down data using “Filters.”
If you place the filter step later in the process, data transformation will be executed even on rows that are eventually unnecessary.
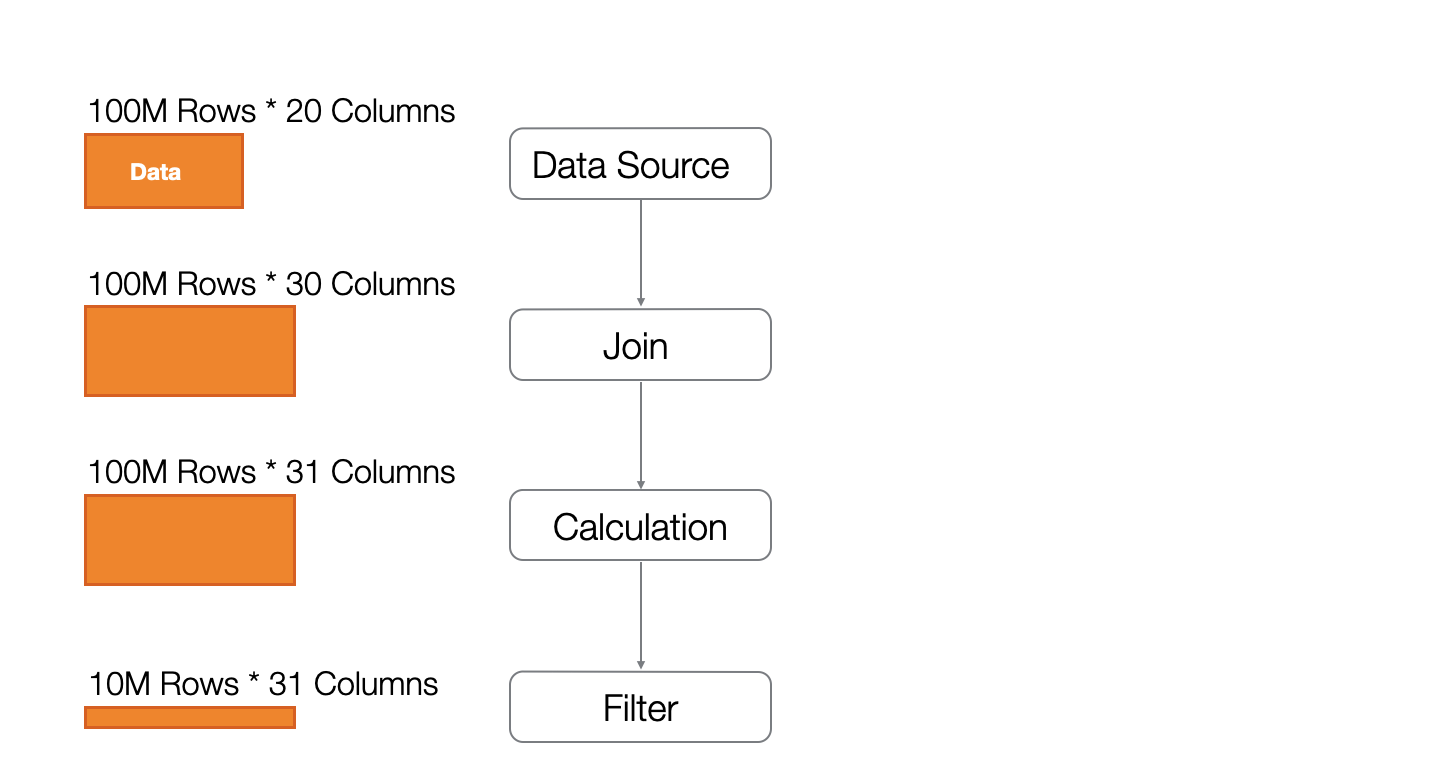
In the example above, data joining and calculations are performed on rows that will ultimately be filtered out, resulting in unnecessary processing.
By performing filtering at an early stage, you avoid data transformation on unnecessary rows, which not only reduces the load on memory but also increases processing speed.
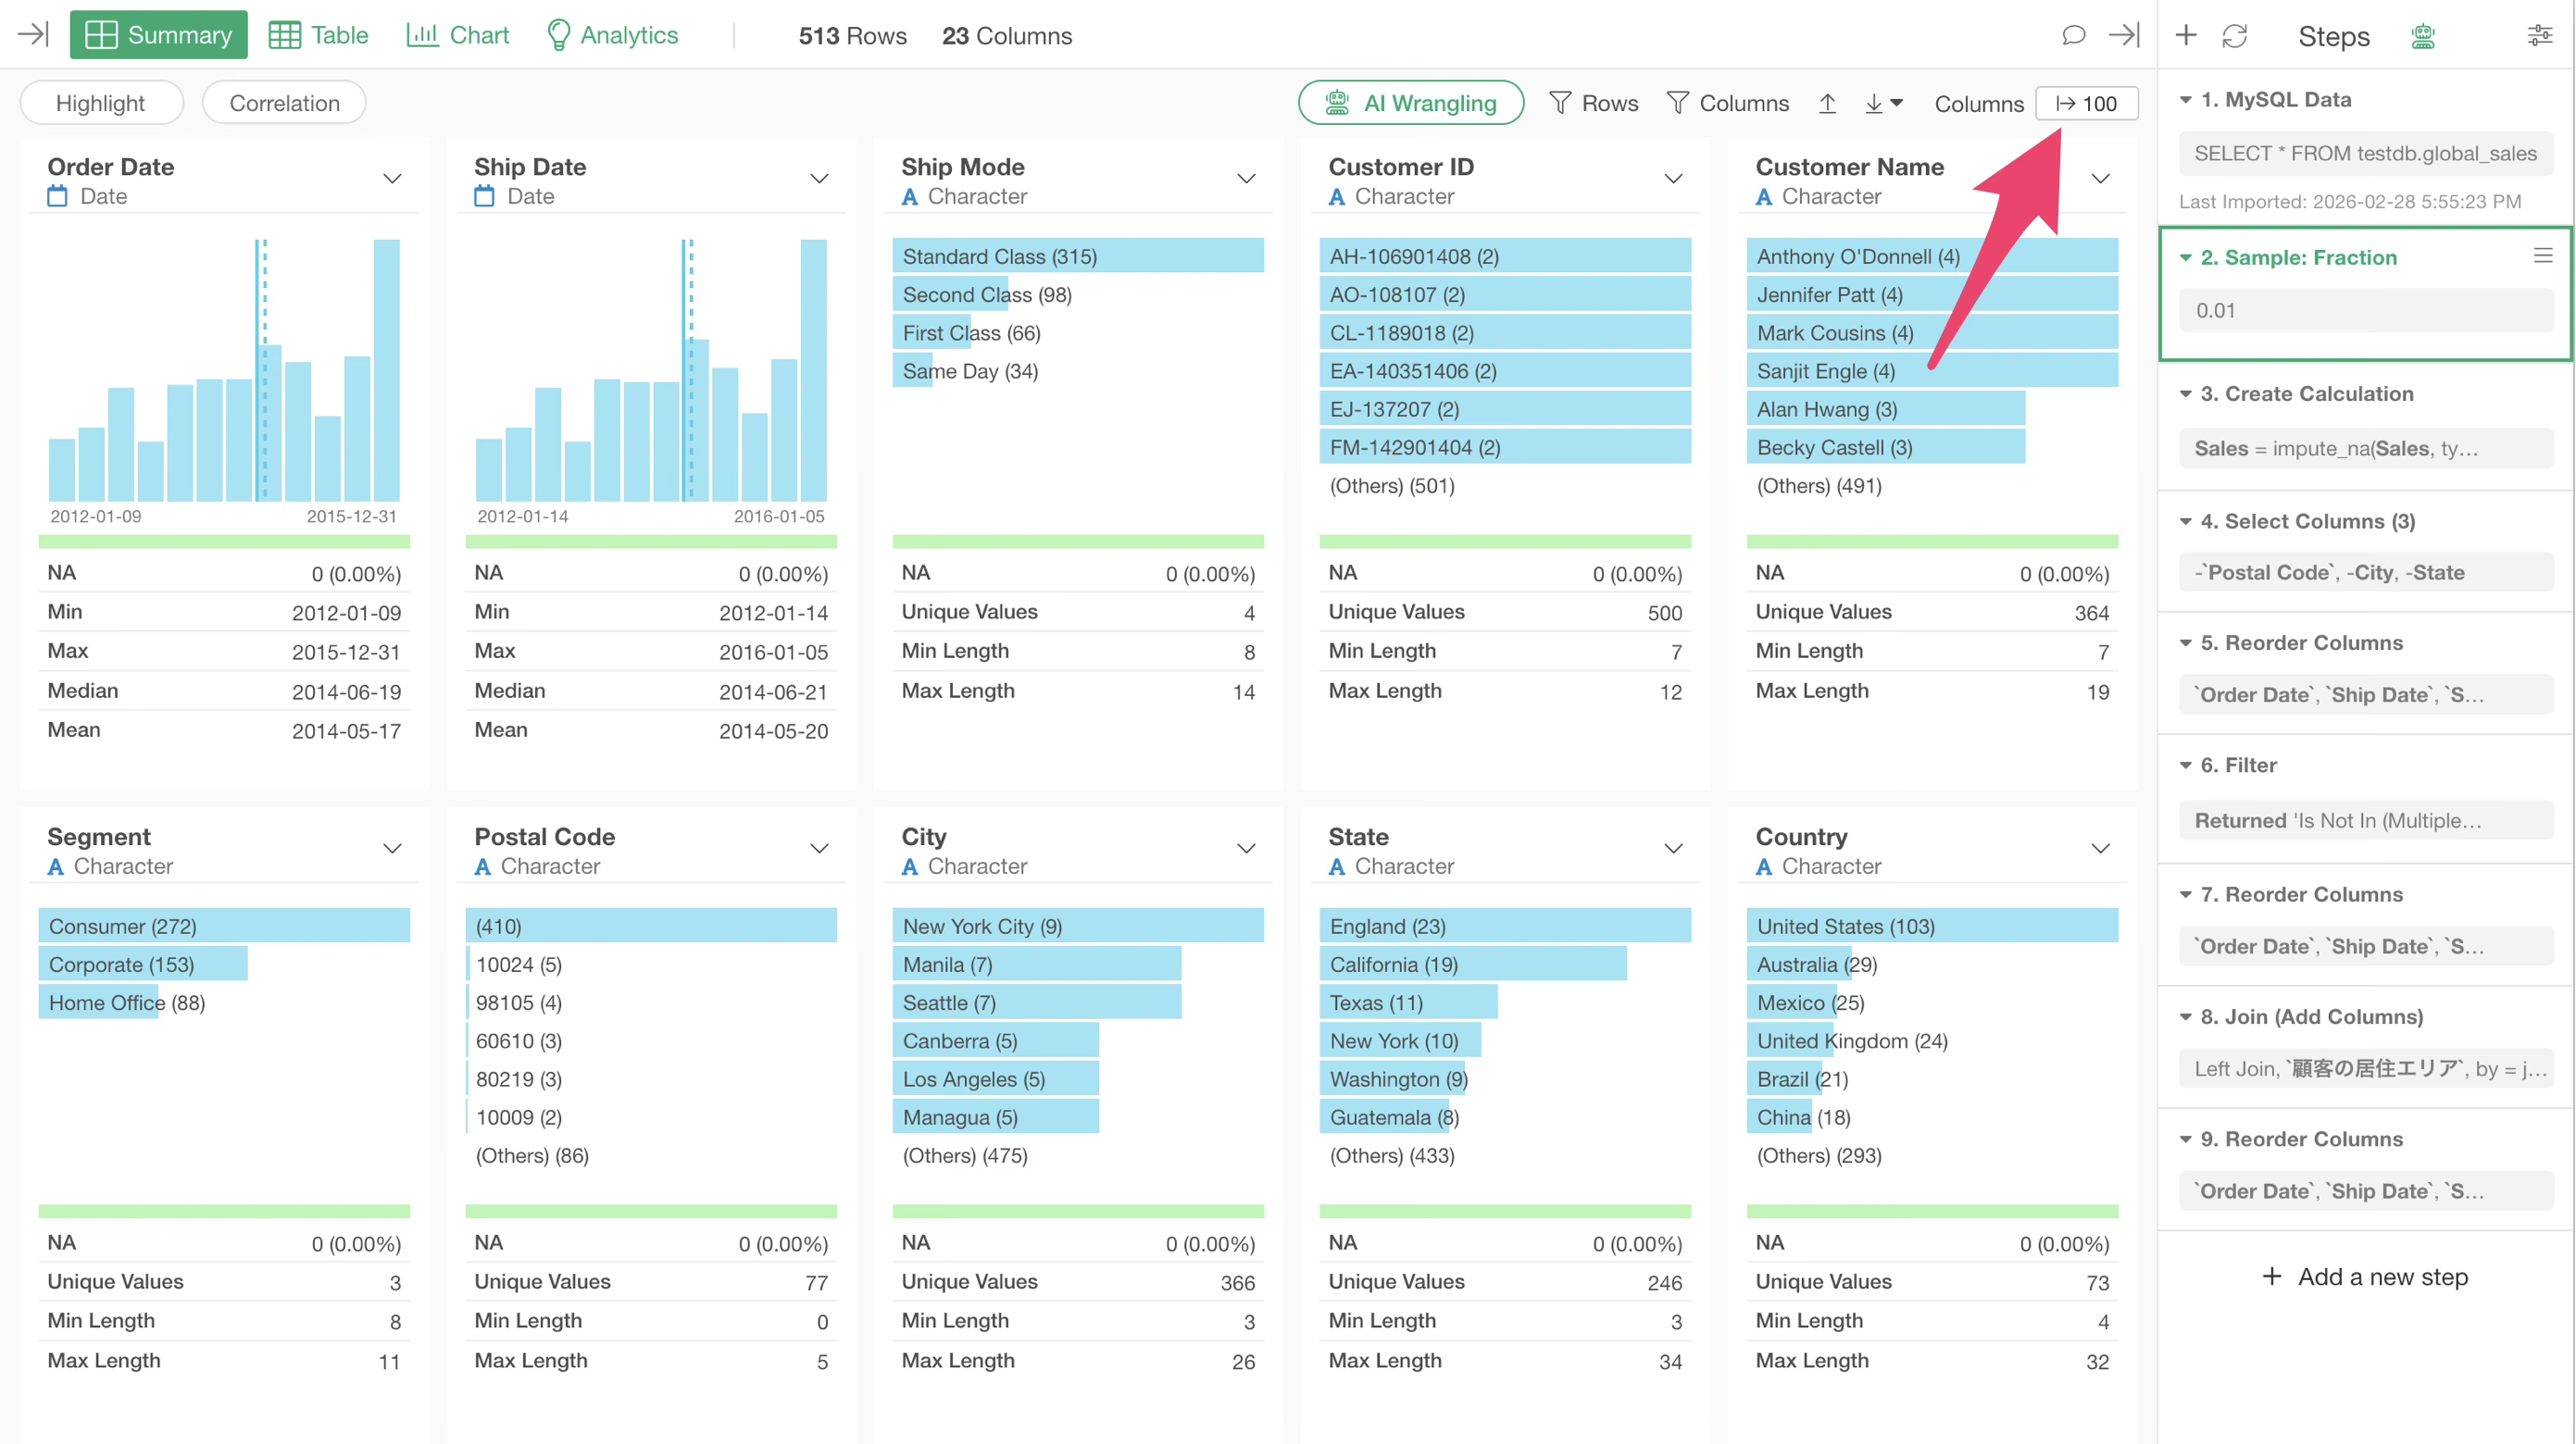
Sample Data and Disable Sampling After Transformation is Complete
When transforming or analyzing data exploratively, or during trial and error for data transformation, it is often sufficient to understand the general distribution or summary information of the data.
In such cases, you want to minimize the processing wait time that occurs every time a step is added or deleted.
It is effective to “Extract Sample” at an early stage of the steps.
Once data transformation and exploration have settled, you can execute the same process on all data by “disabling” or “deleting” the “Sample” step.

By taking this approach, even if you are handling large datasets, the processing for the large data only needs to be done once.
Display Only Necessary “Rows” and “Columns”
Every time a step is added or changed, Exploratory calculates summary information for all columns and then visualizes summary information for the specified number of columns.
In other words, since summary calculation and rendering occur every time you add or move a step, if the number of columns to display is large, the time for rendering increases.
Therefore, by reducing the number of columns to display, you can shorten the time required for rendering.

In the Table view, you can specify the number of “Rows” and “Columns” to display. In both cases, the fewer the number of items displayed, the faster the rendering.

Utilize the Cache Feature
As introduced in the “How Exploratory Data Processing Works” section, when you import data in Exploratory, a Parquet file is automatically generated for lightweight and fast handling.
Also, when reopening the same project, the Parquet file is read, allowing data to be loaded into memory at high speed.
On the other hand, since data for each step is not saved, reopening a data frame in a project that was once closed will re-execute the processes up to the last step after reading the Parquet file.
Therefore, reopening a project that uses large data may result in a wait for step execution, preventing you from starting work immediately.
If data transformation is finished and only the data for a specific (e.g., the last) step is needed, you can export and use the data. However, if you do not want to lose reproducibility or want to create charts for each step, that approach is not always effective.
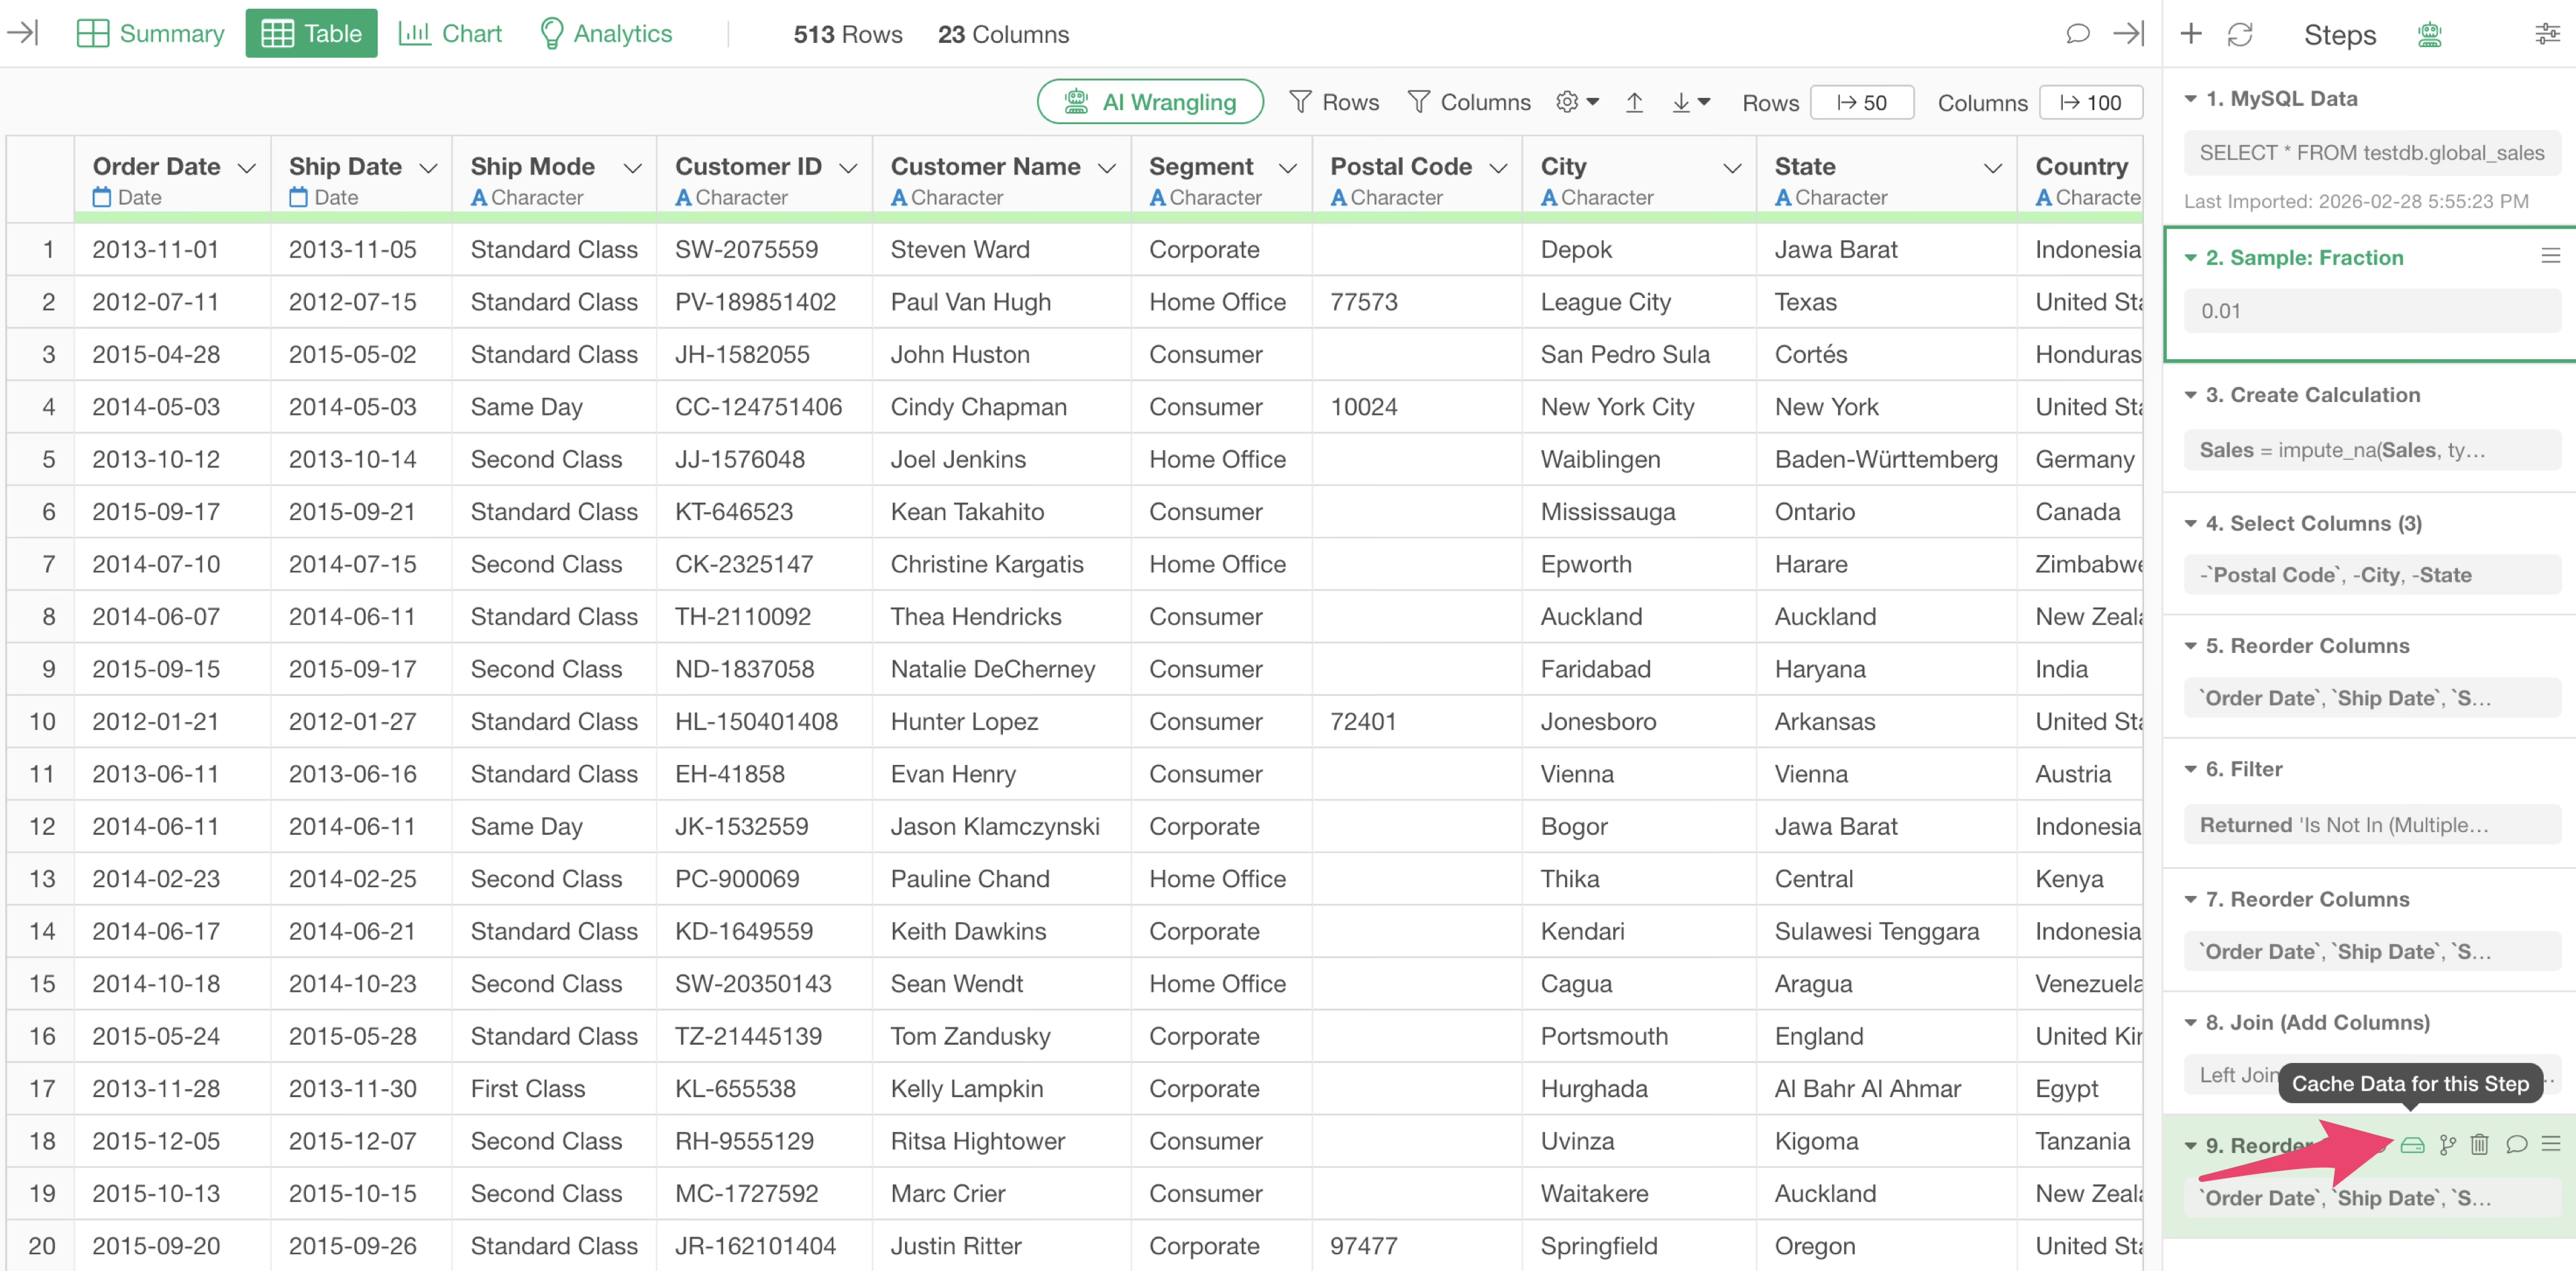
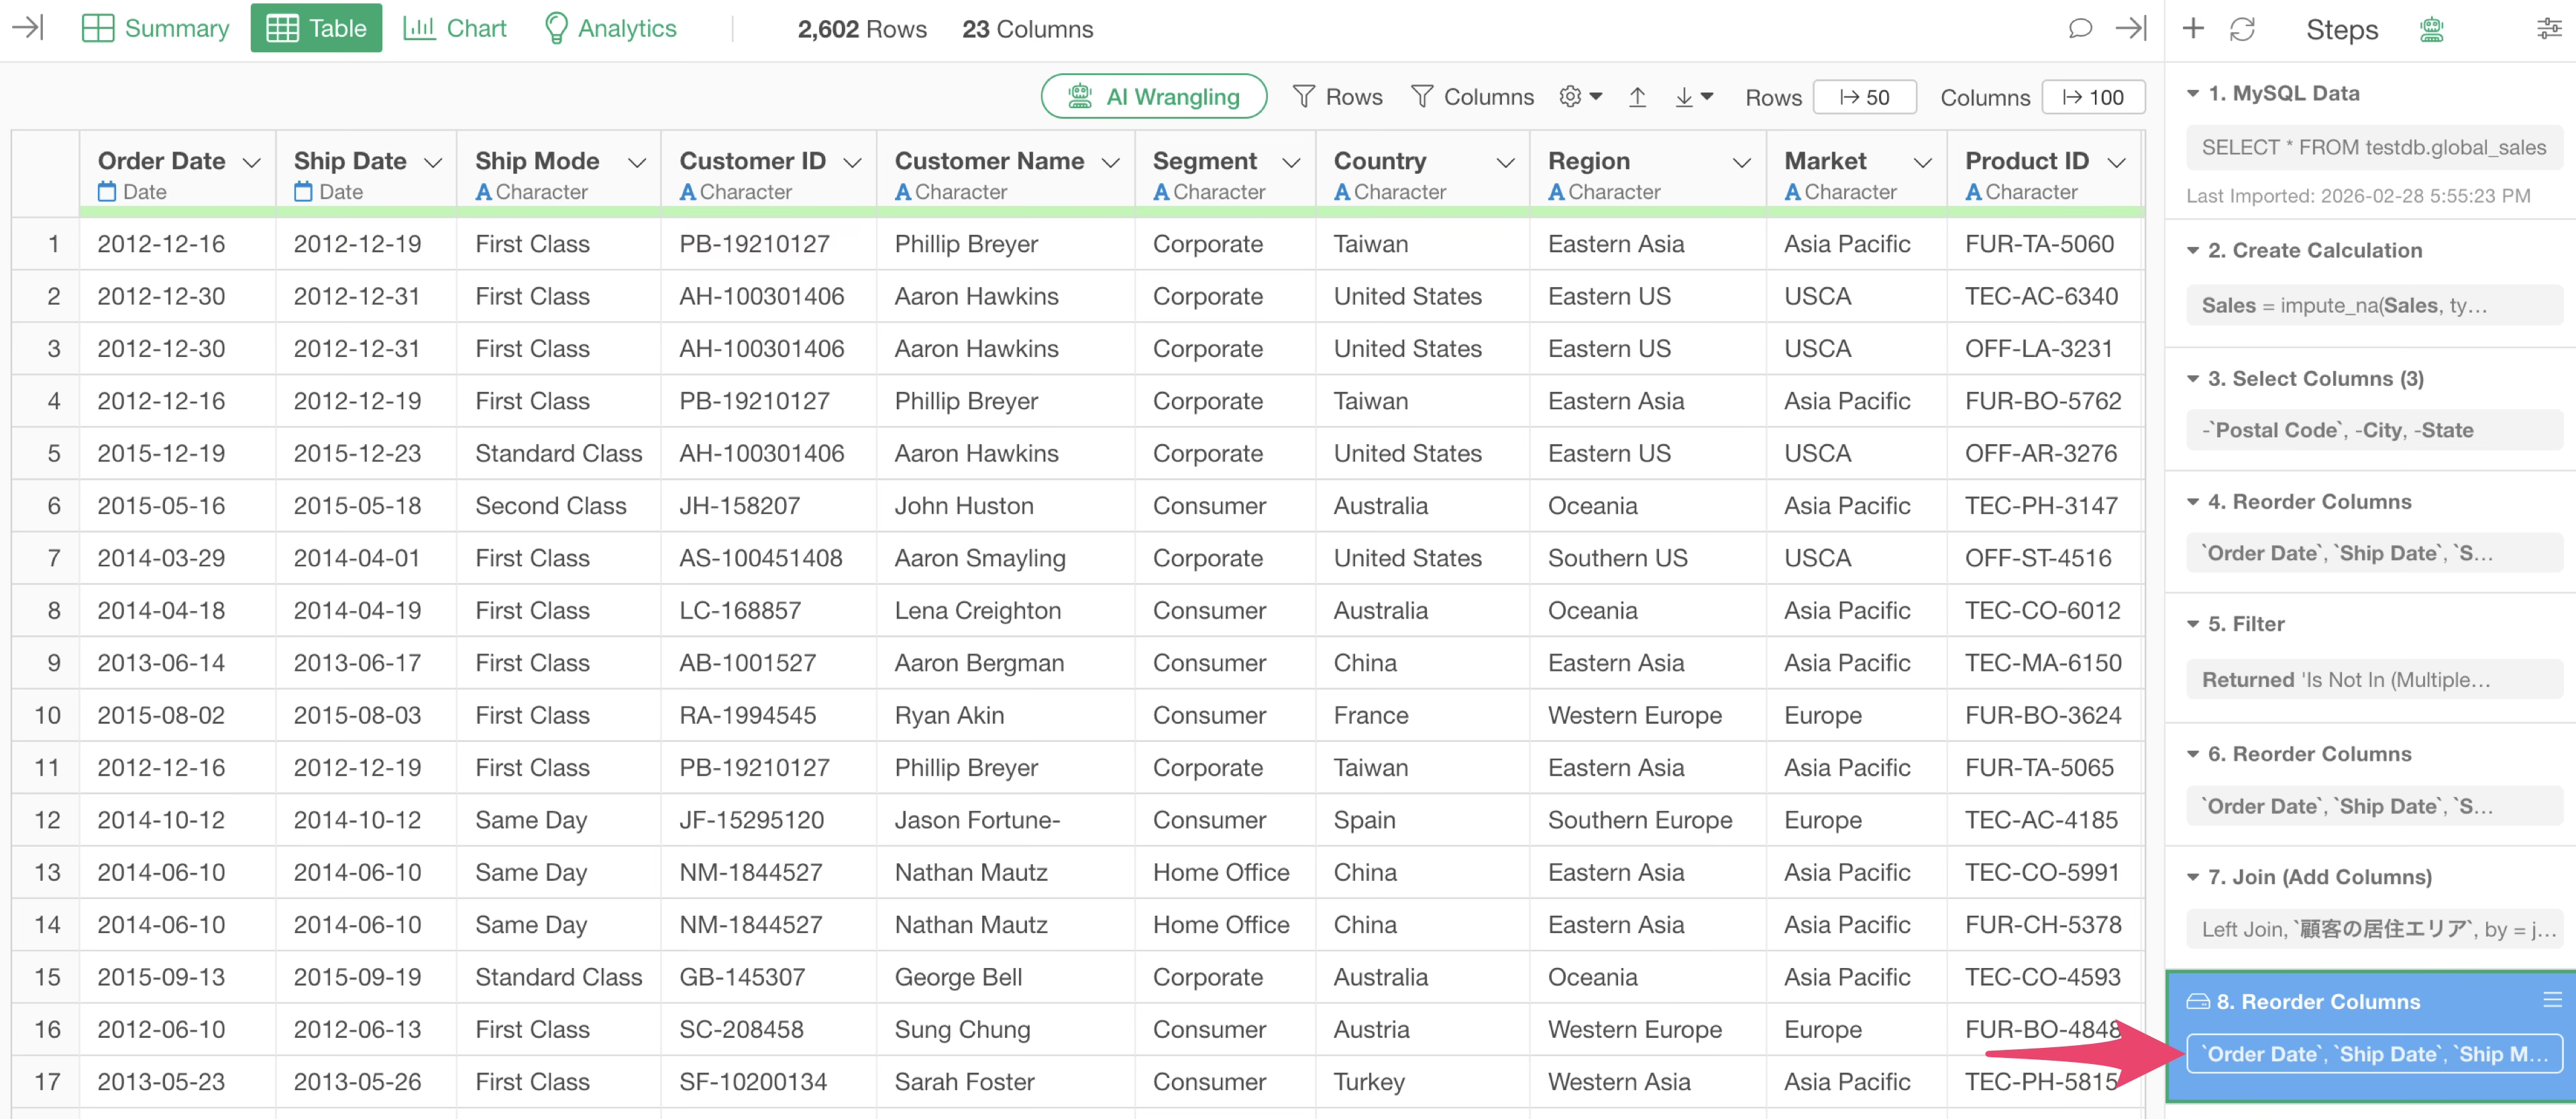
In such cases, you can cache the step data to save the data at that specific step.
When a step is cached, it turns blue, and you can load the data without processing the preceding steps.
Let’s explain this in more detail.
When you “cache” a step, a Parquet file is created and saved in the repository on your PC.
When you reopen the project and open the same data frame containing the cached step, the data is loaded from the cached Parquet file.
If there are steps after the cached step, the processes following the cached step will be executed when the data frame is opened.
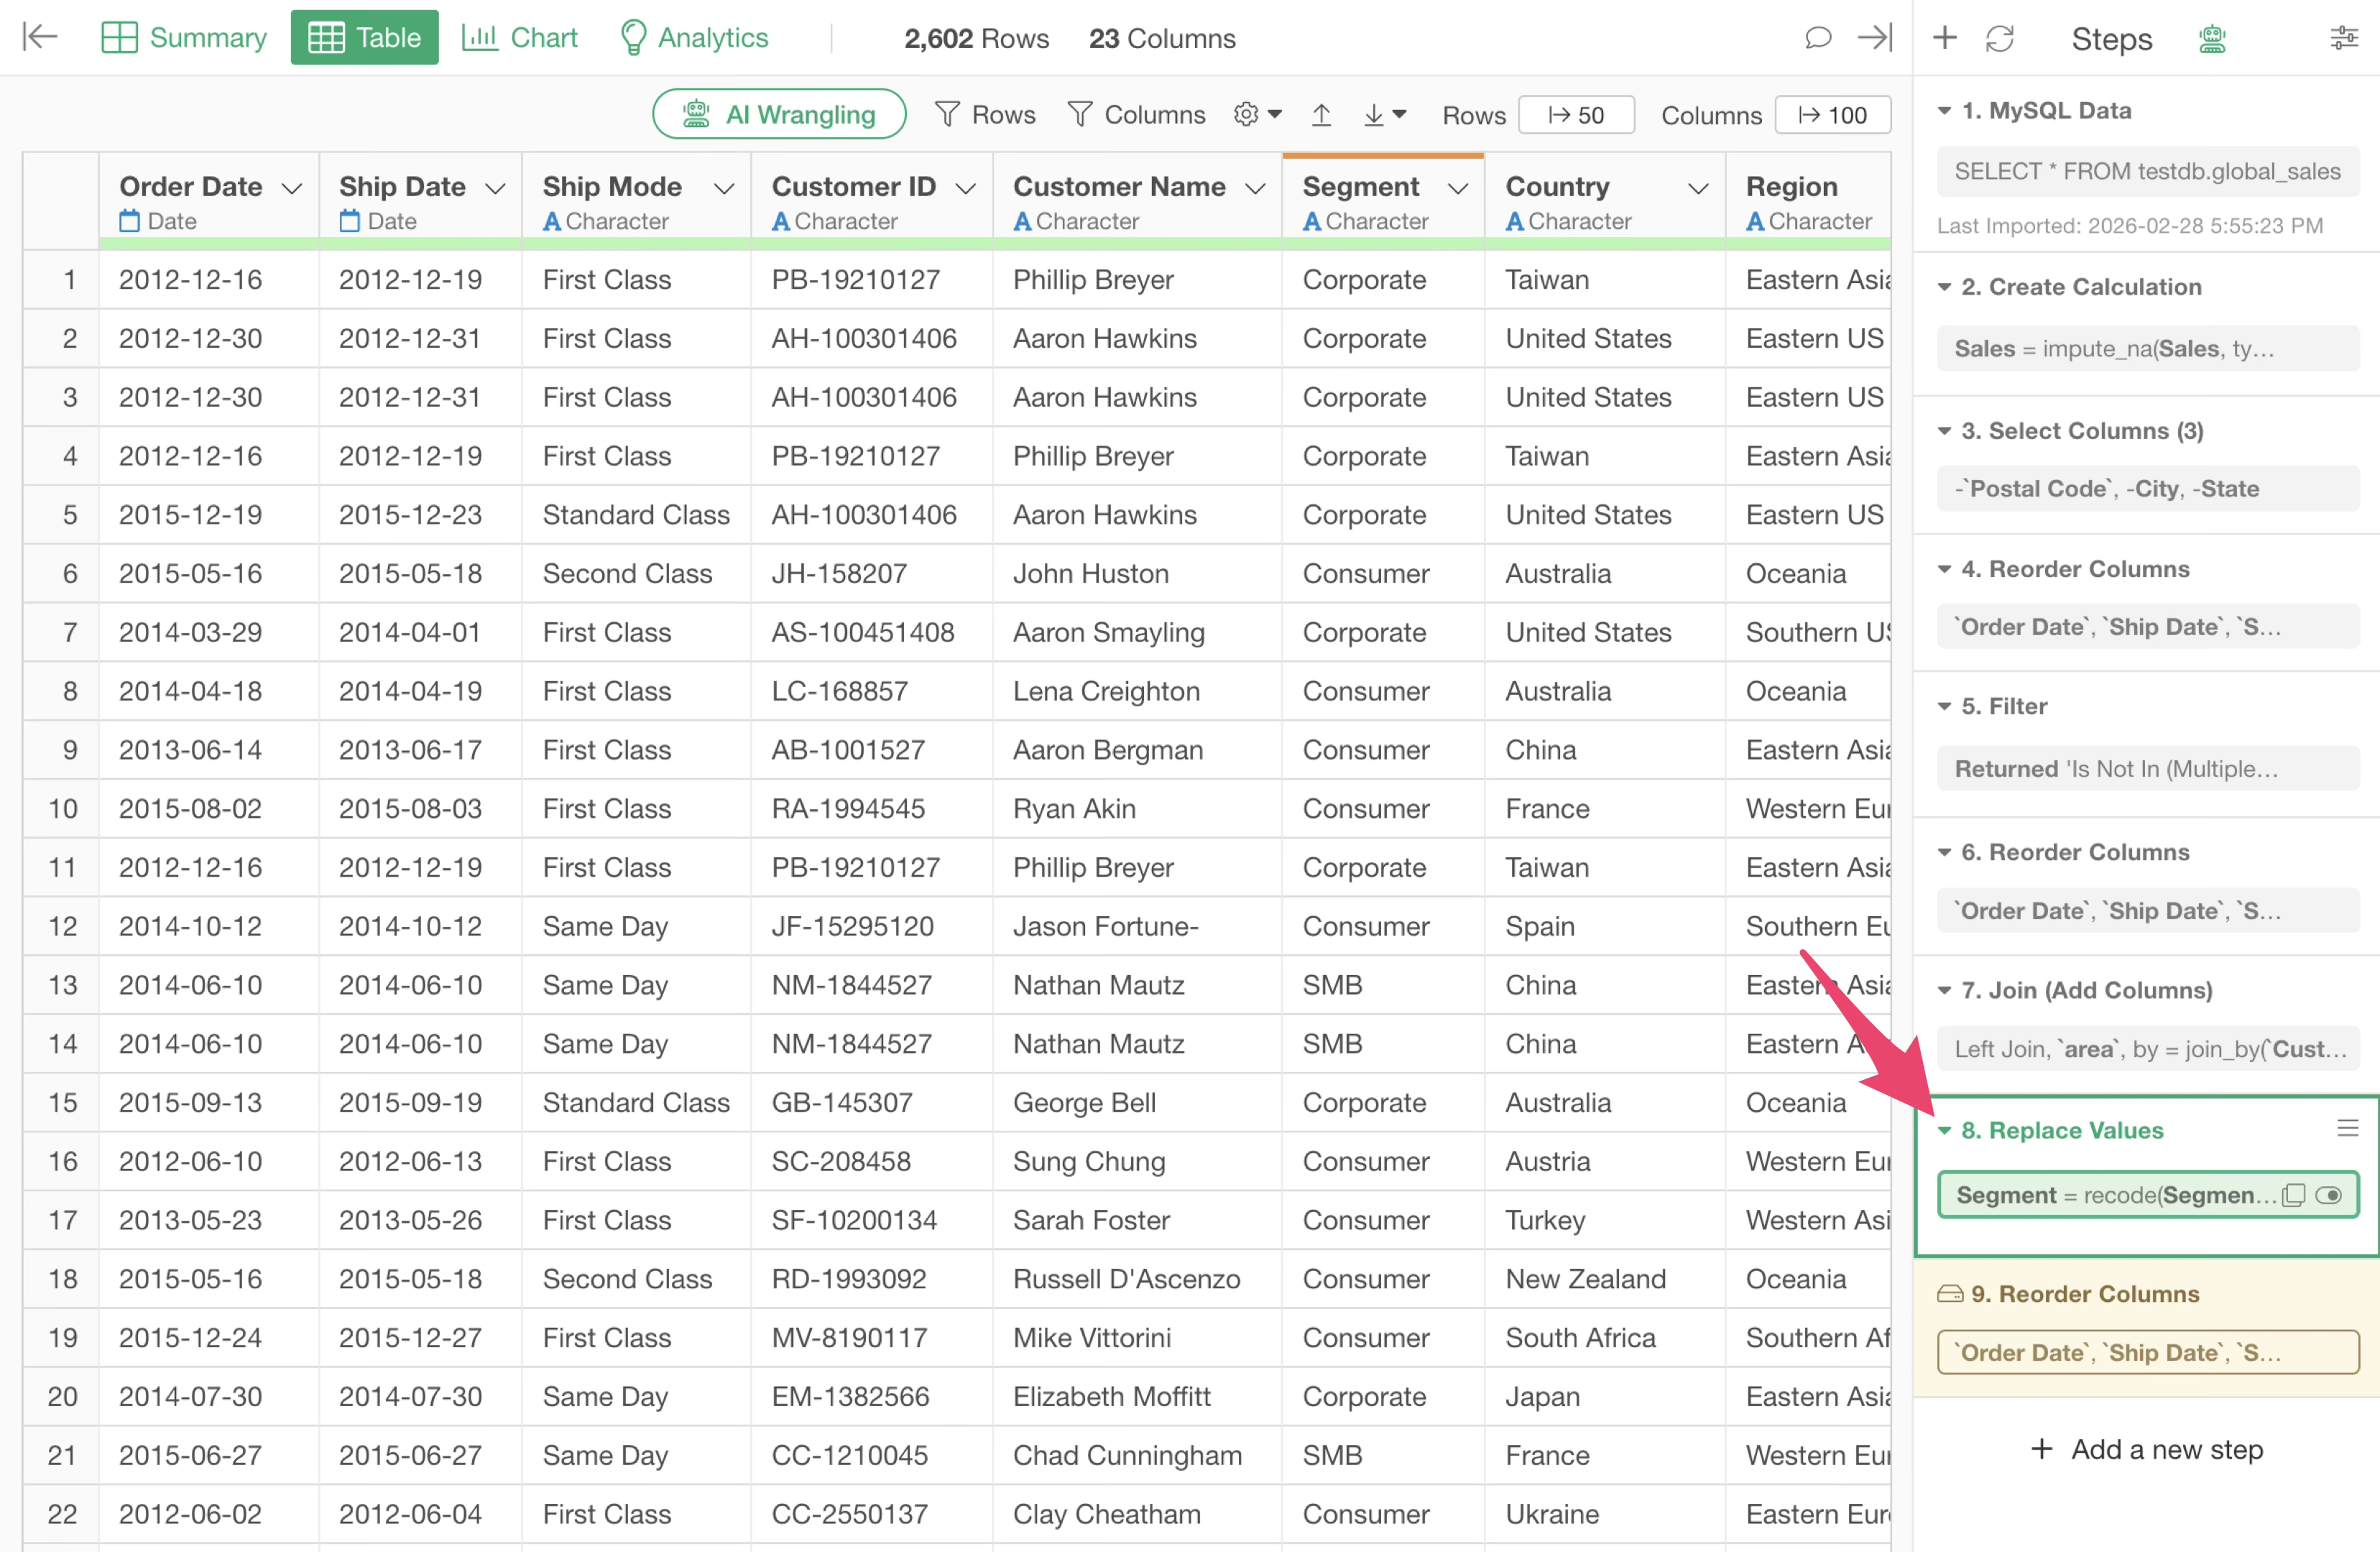
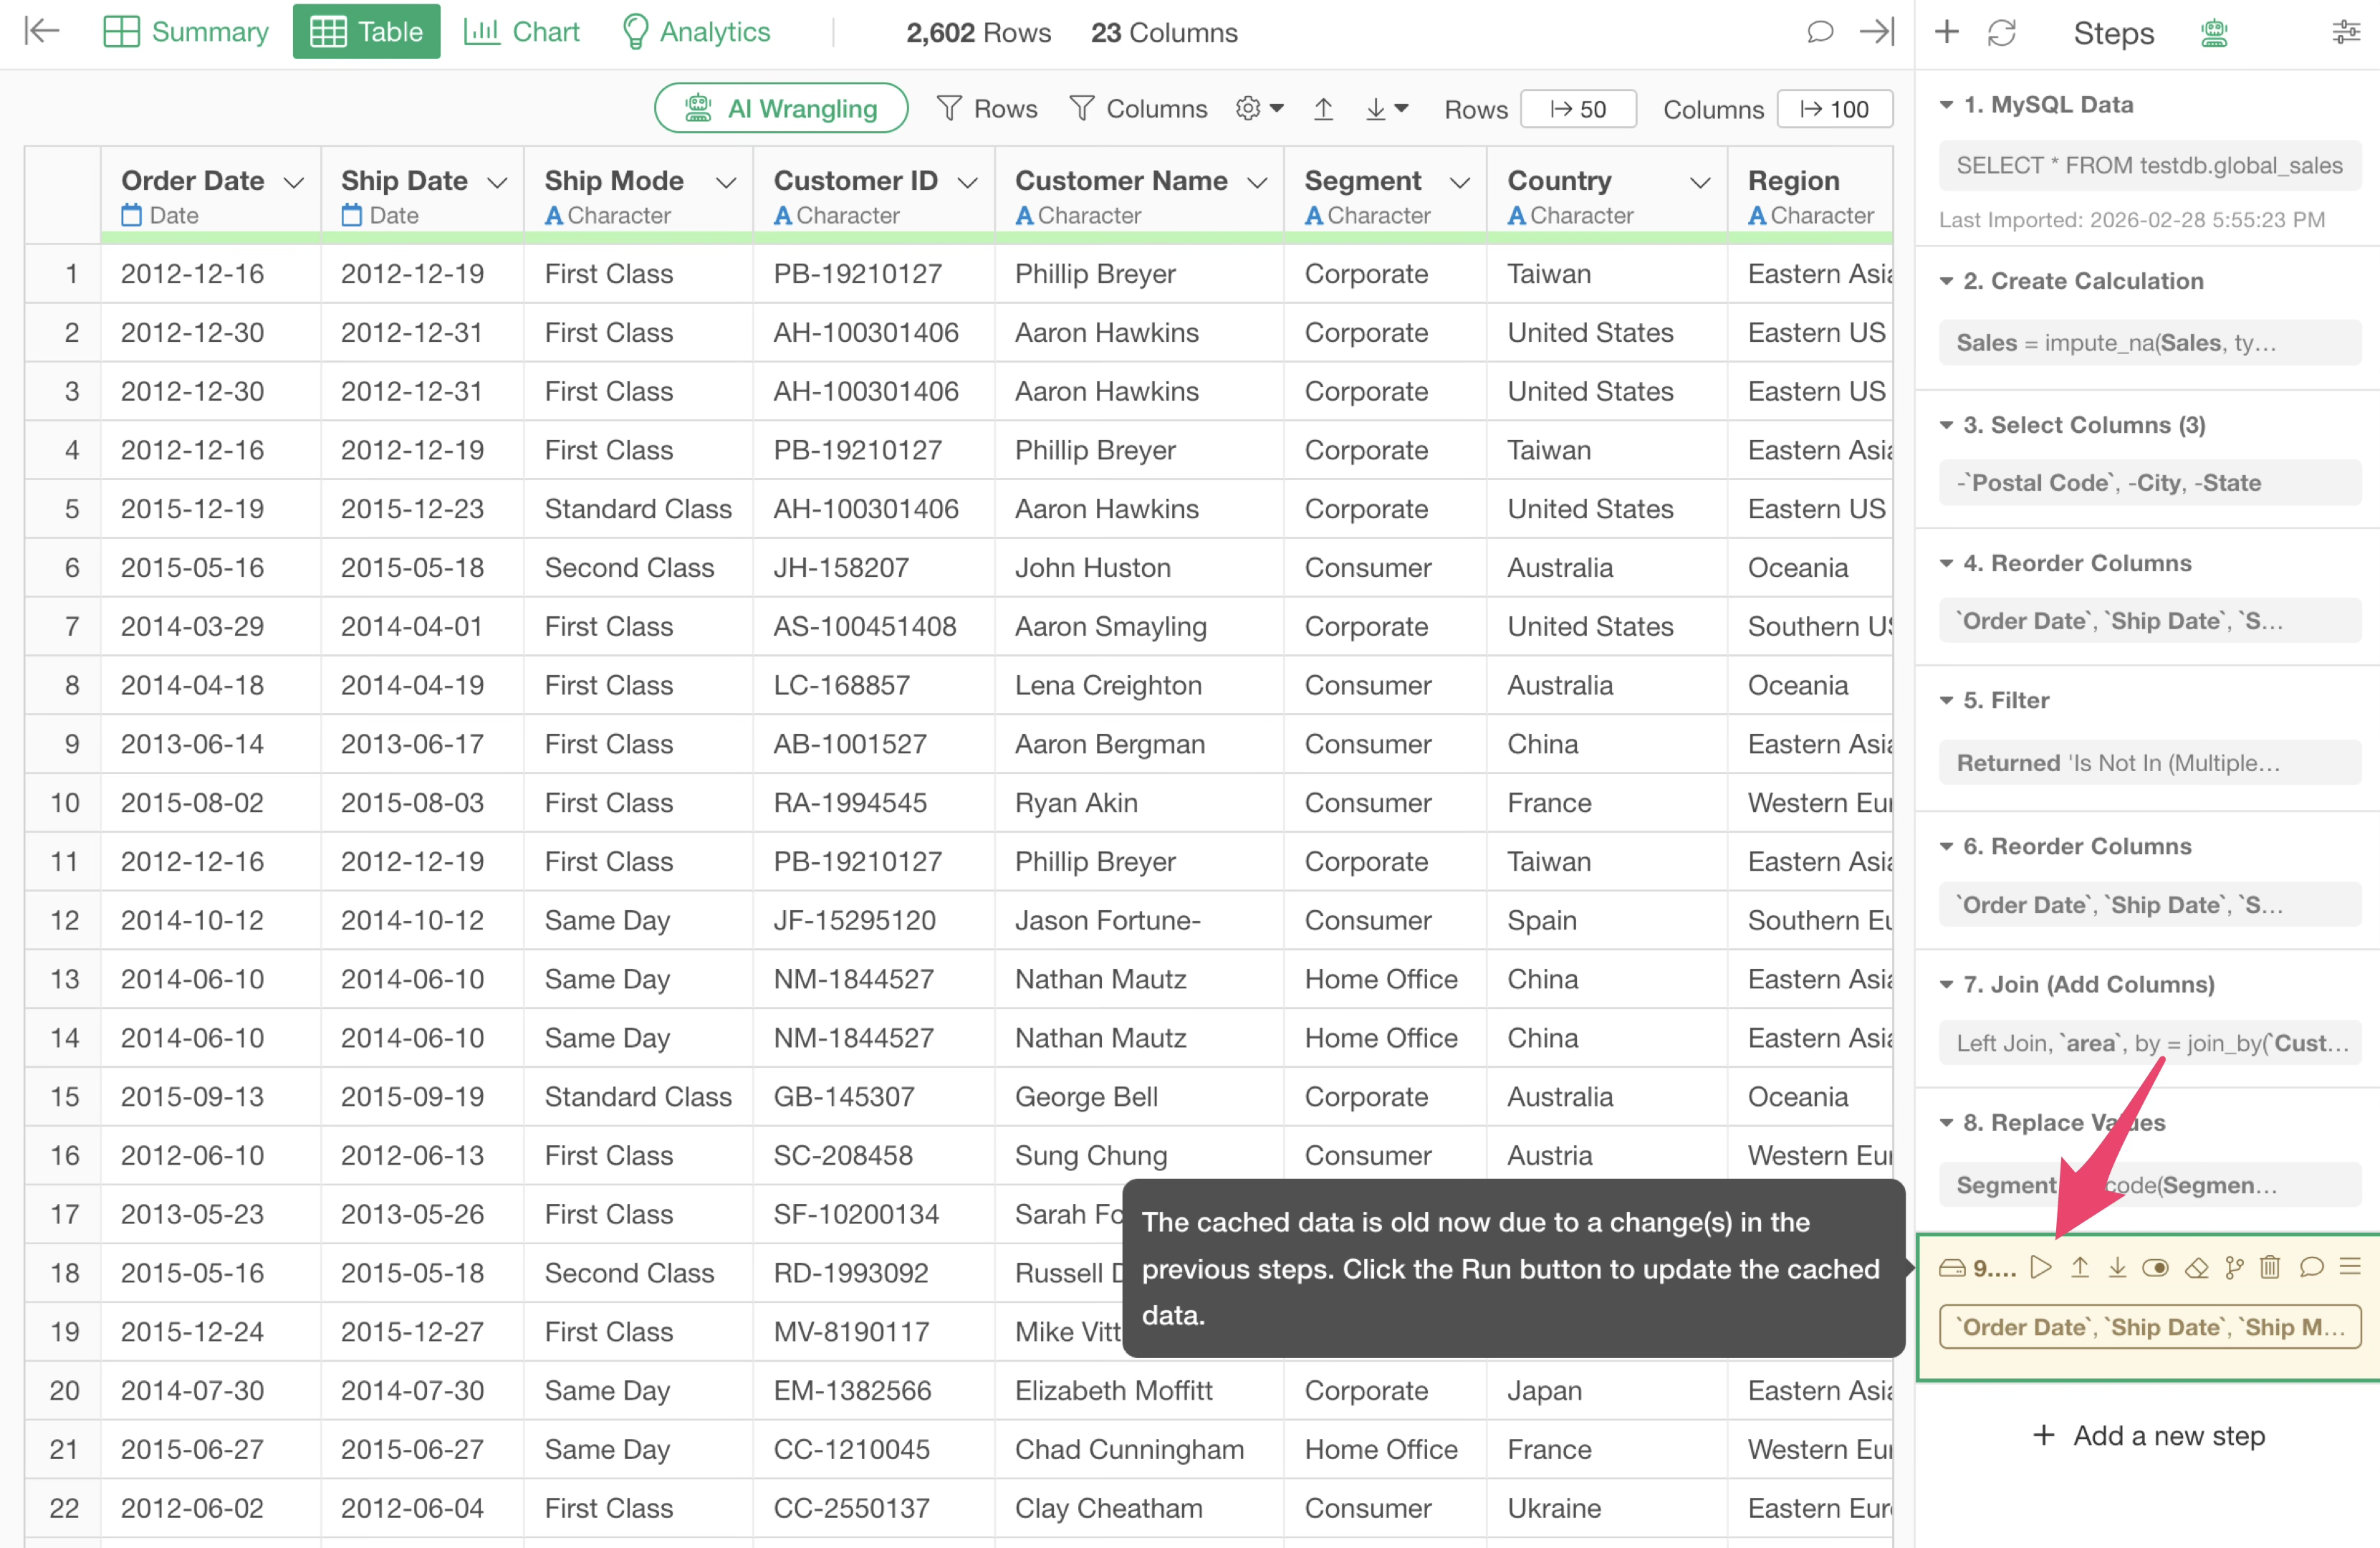
If a change is made to a step before the cached step, the color of that step changes to yellow, indicating that the cached data for that step has become outdated.

If you want to update the data of a cached step, you can click the “Run” button on the cached step to update the cache.

Ungroup Unnecessary Grouping
In Exploratory, you can use the “Group” feature when you want to perform calculations or filter by group.
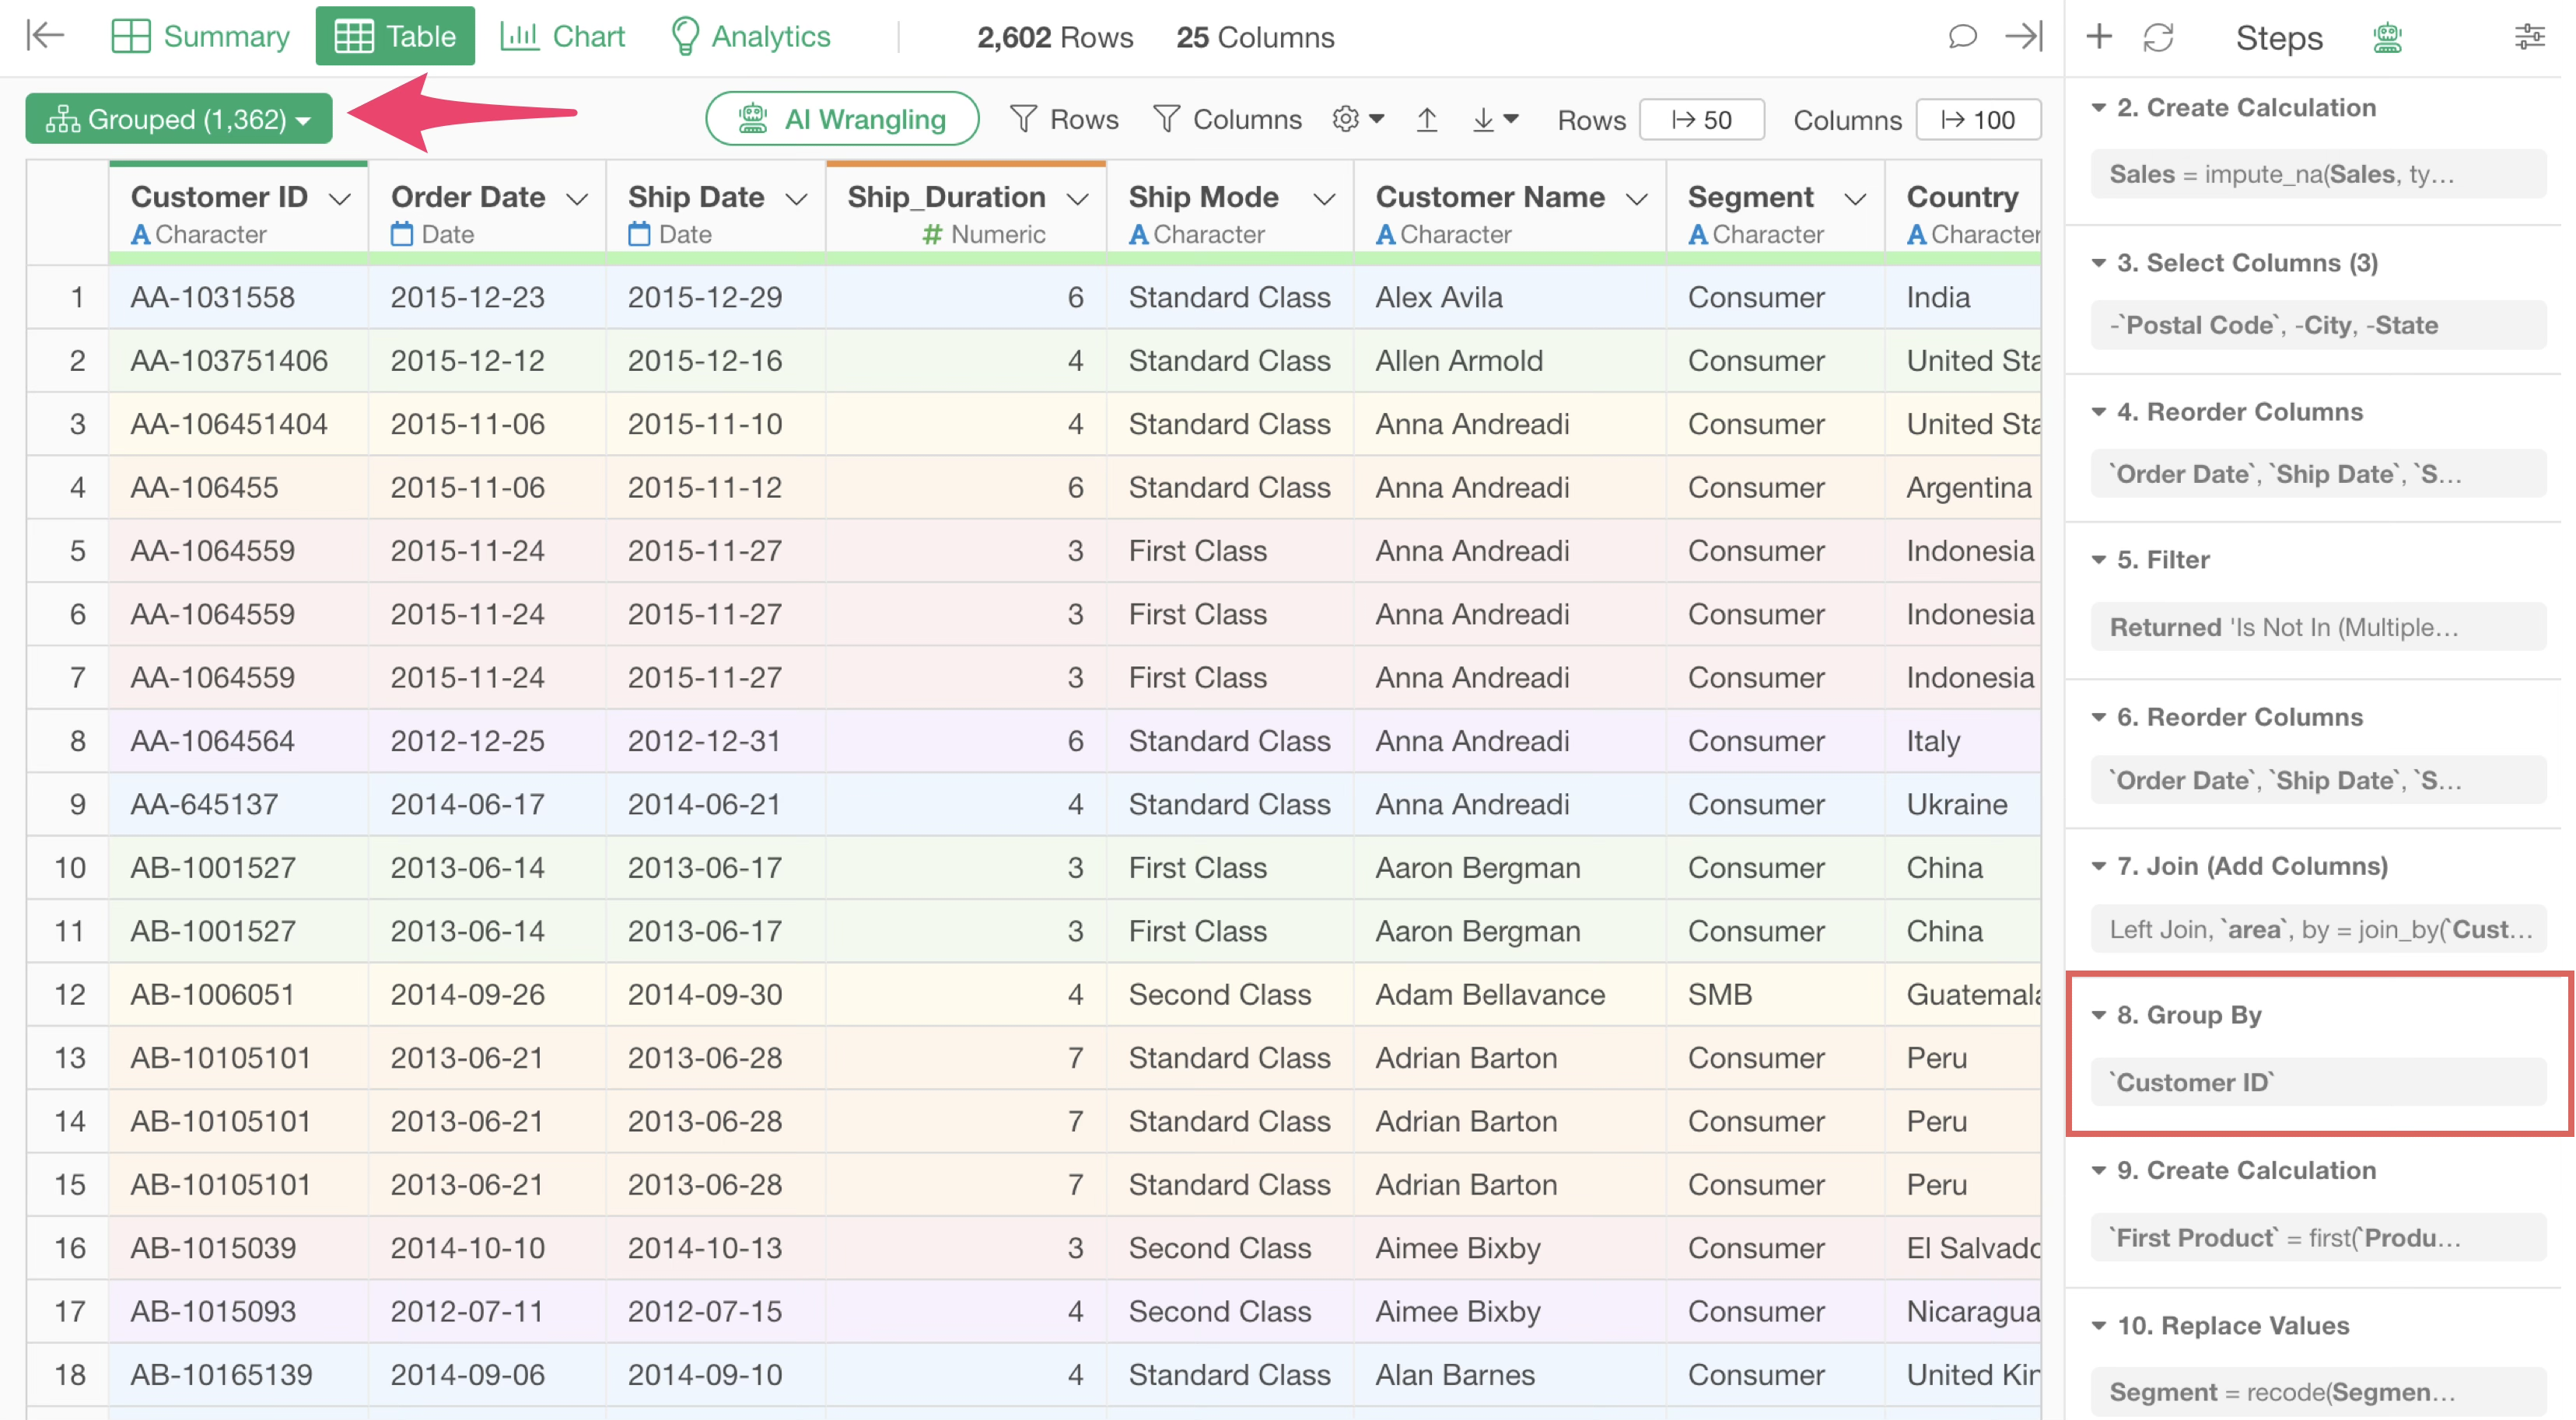
While it is a convenient feature for processing by group, you should ungroup if processing by group is no longer necessary.
This is because if grouping remains active, processing will always occur on a group basis, which can take extra time.
You can ungroup by clicking the green grouped button and selecting “Ungroup.”
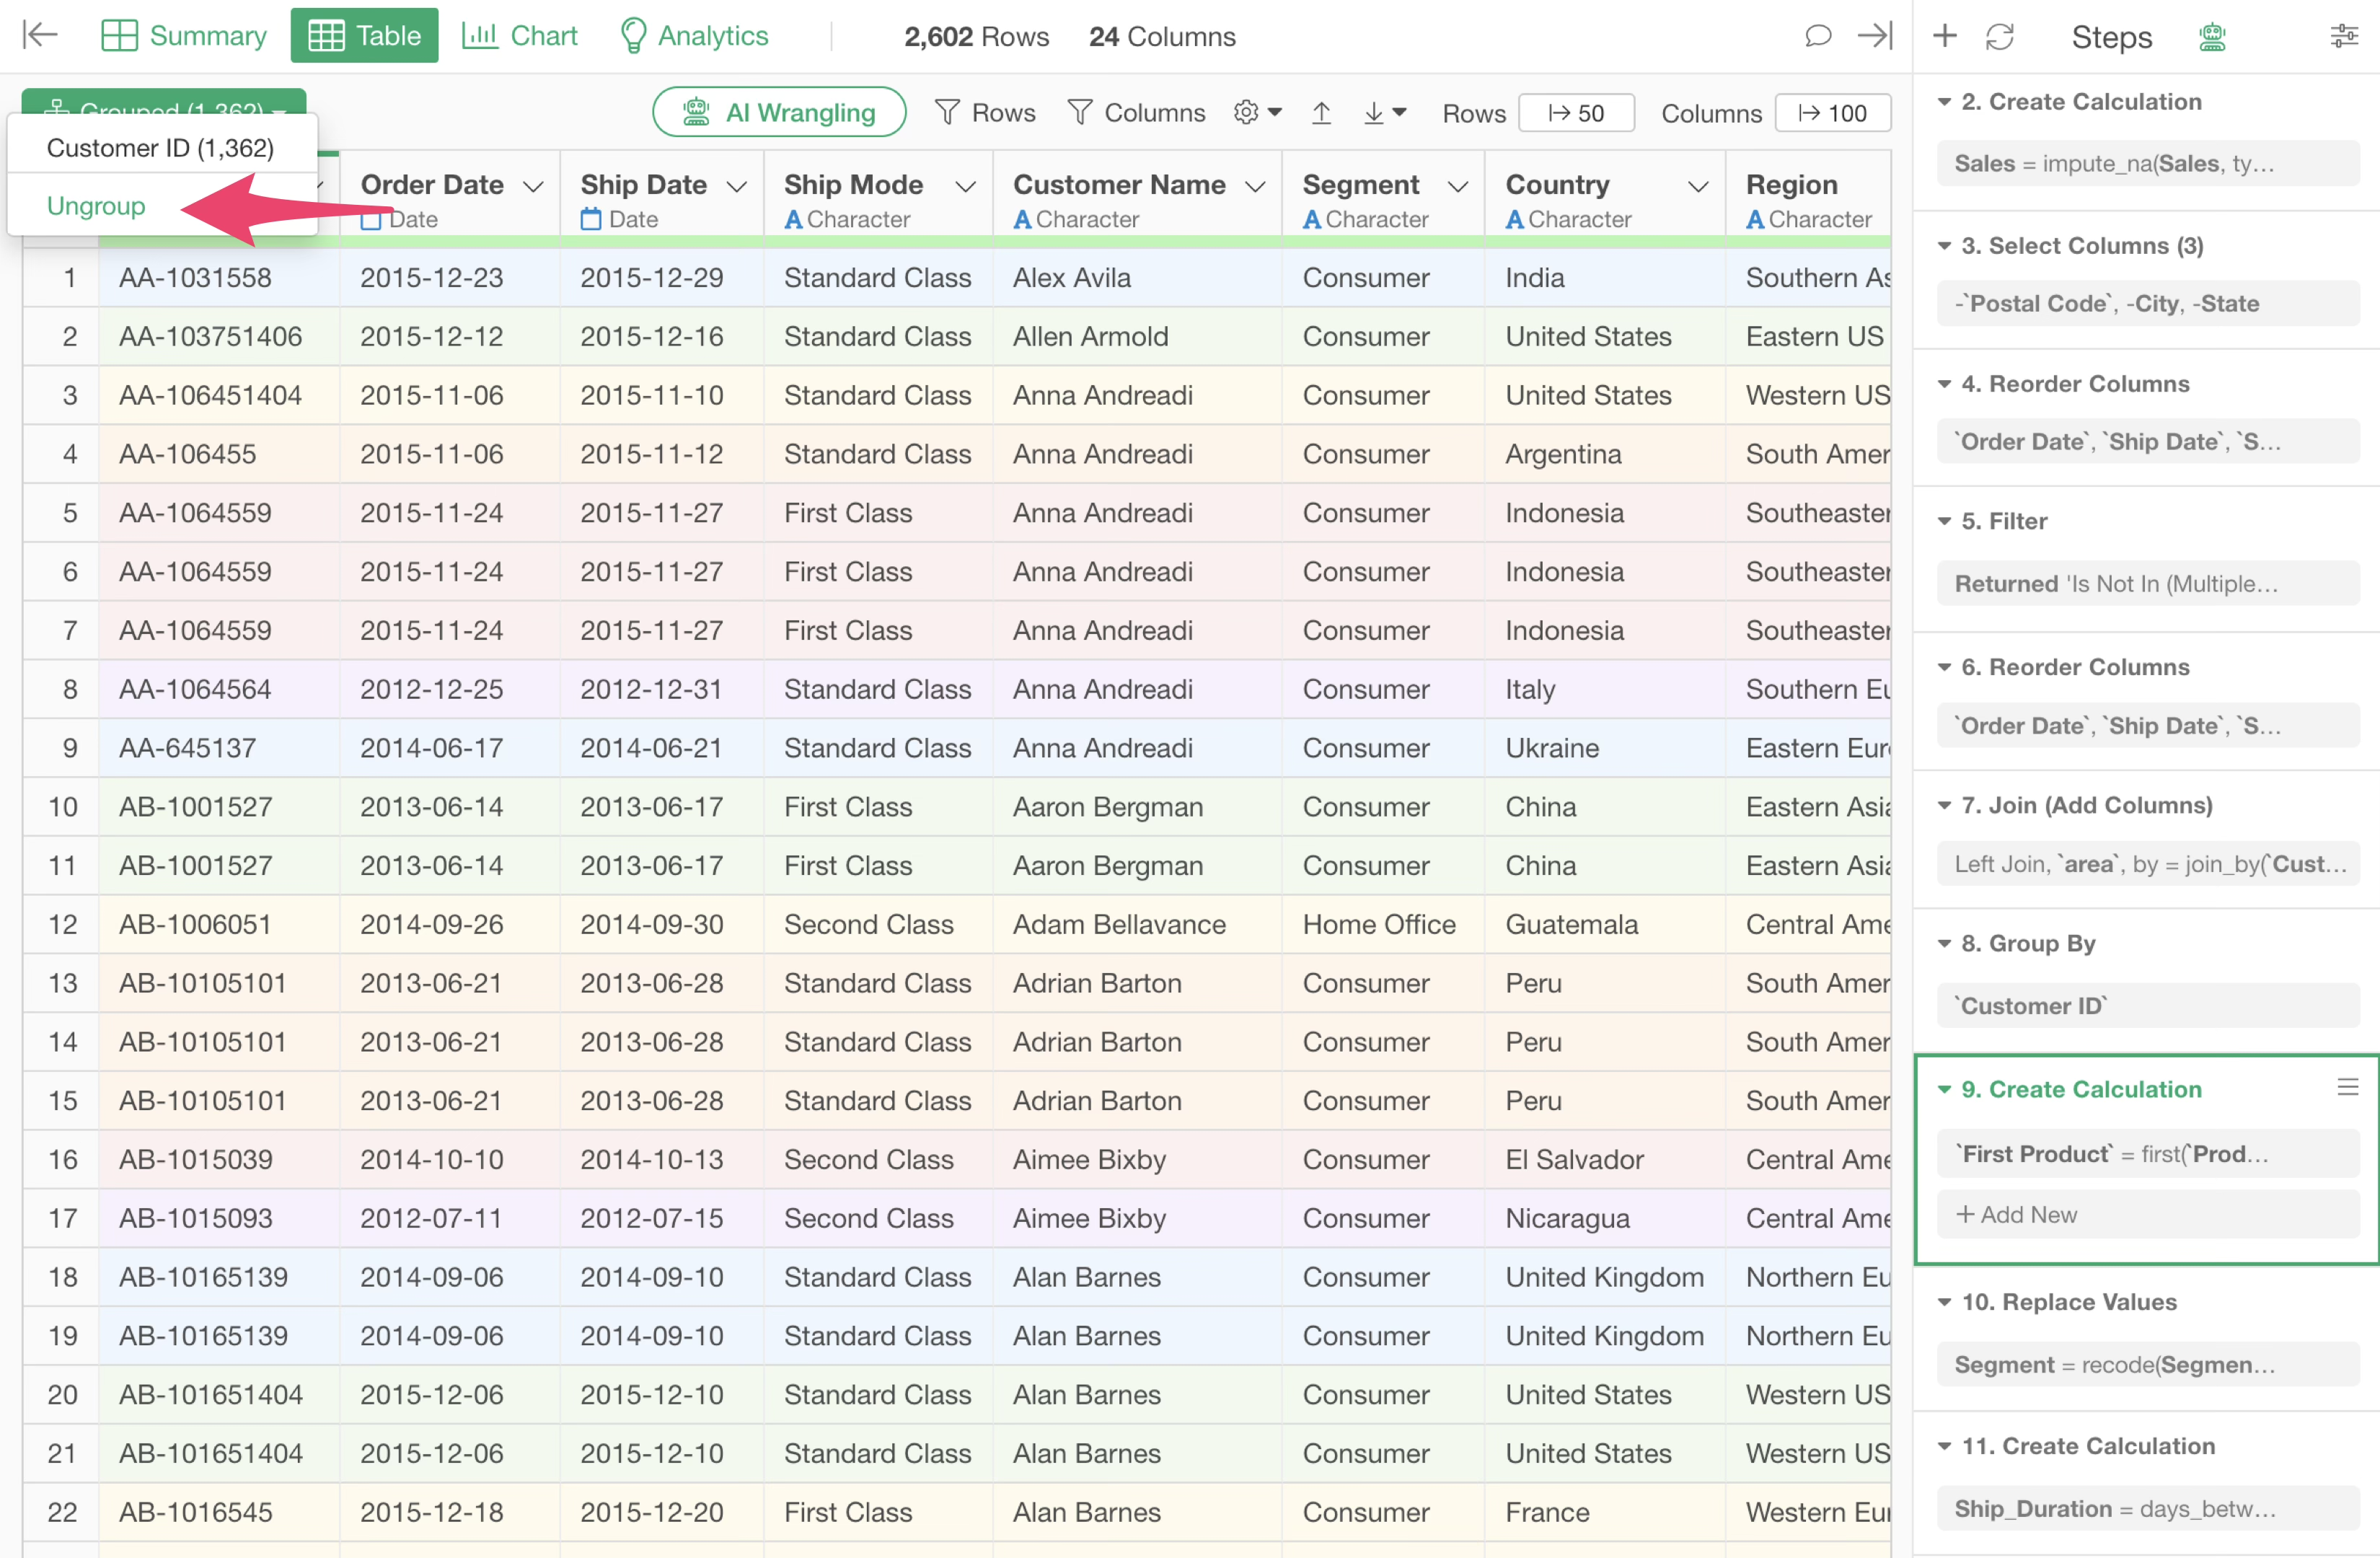
Ungrouping is added as a single step, and subsequent processes will not consider groups.
Perform Aggregation Without Using “Conditional Aggregation Functions”
Consider an example where each row represents one order, and columns contain information such as “Customer ID,” “Product Category,” and “Sales.”
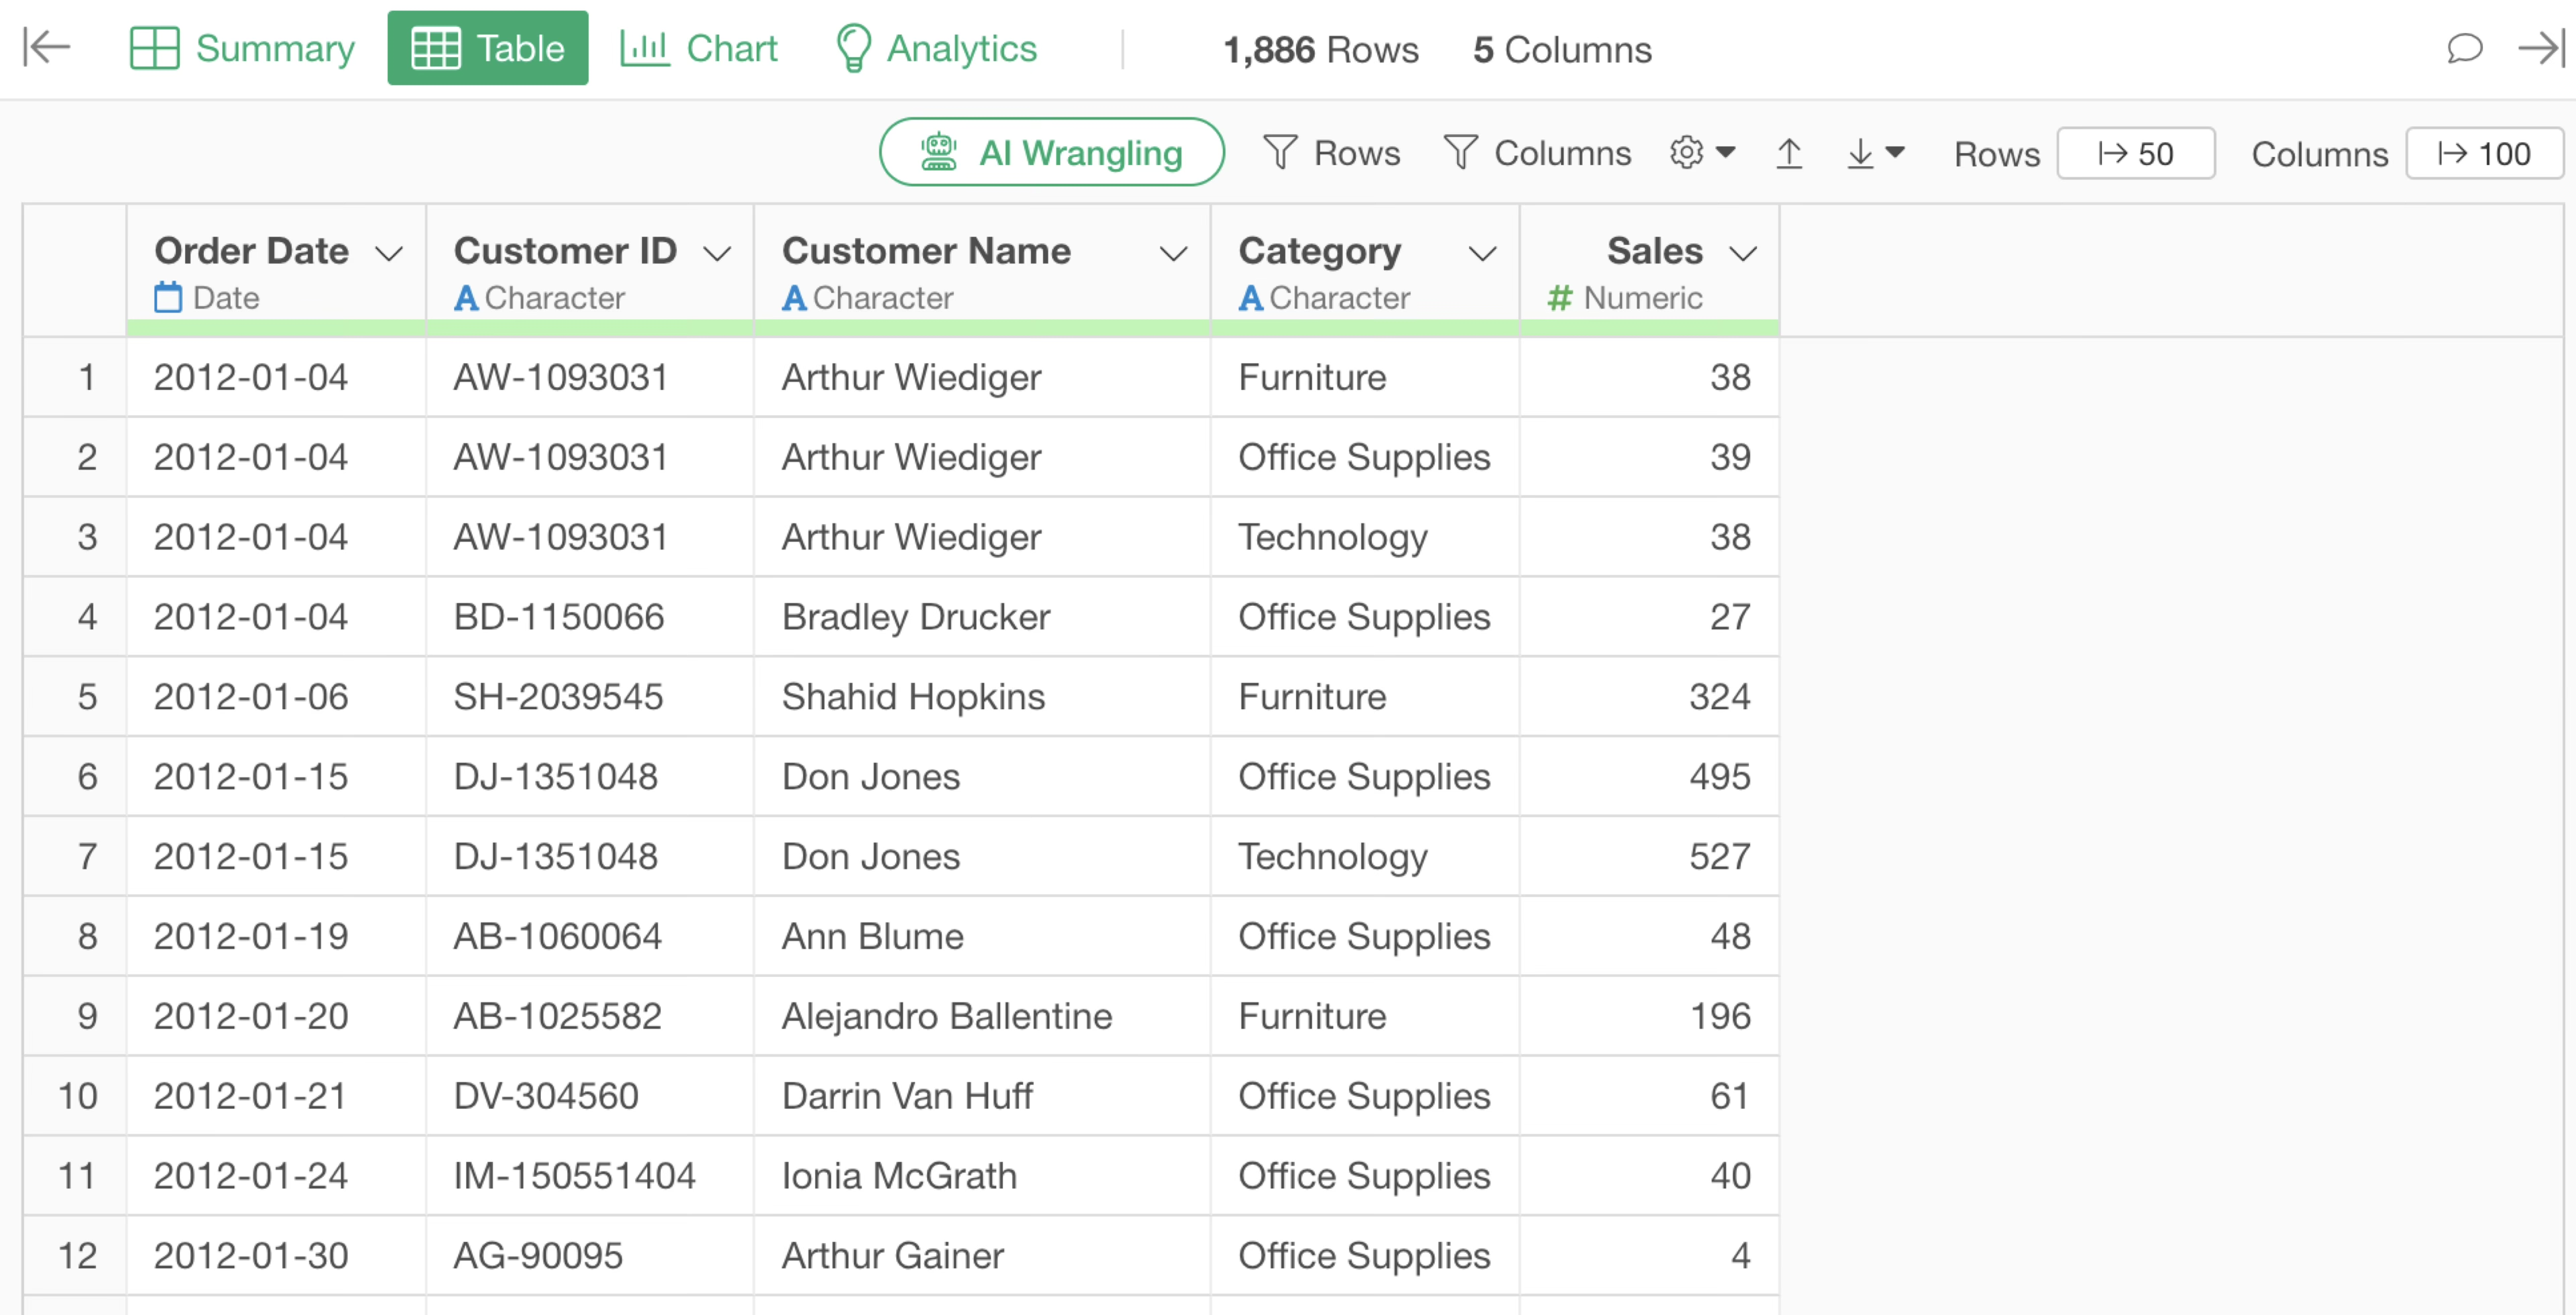
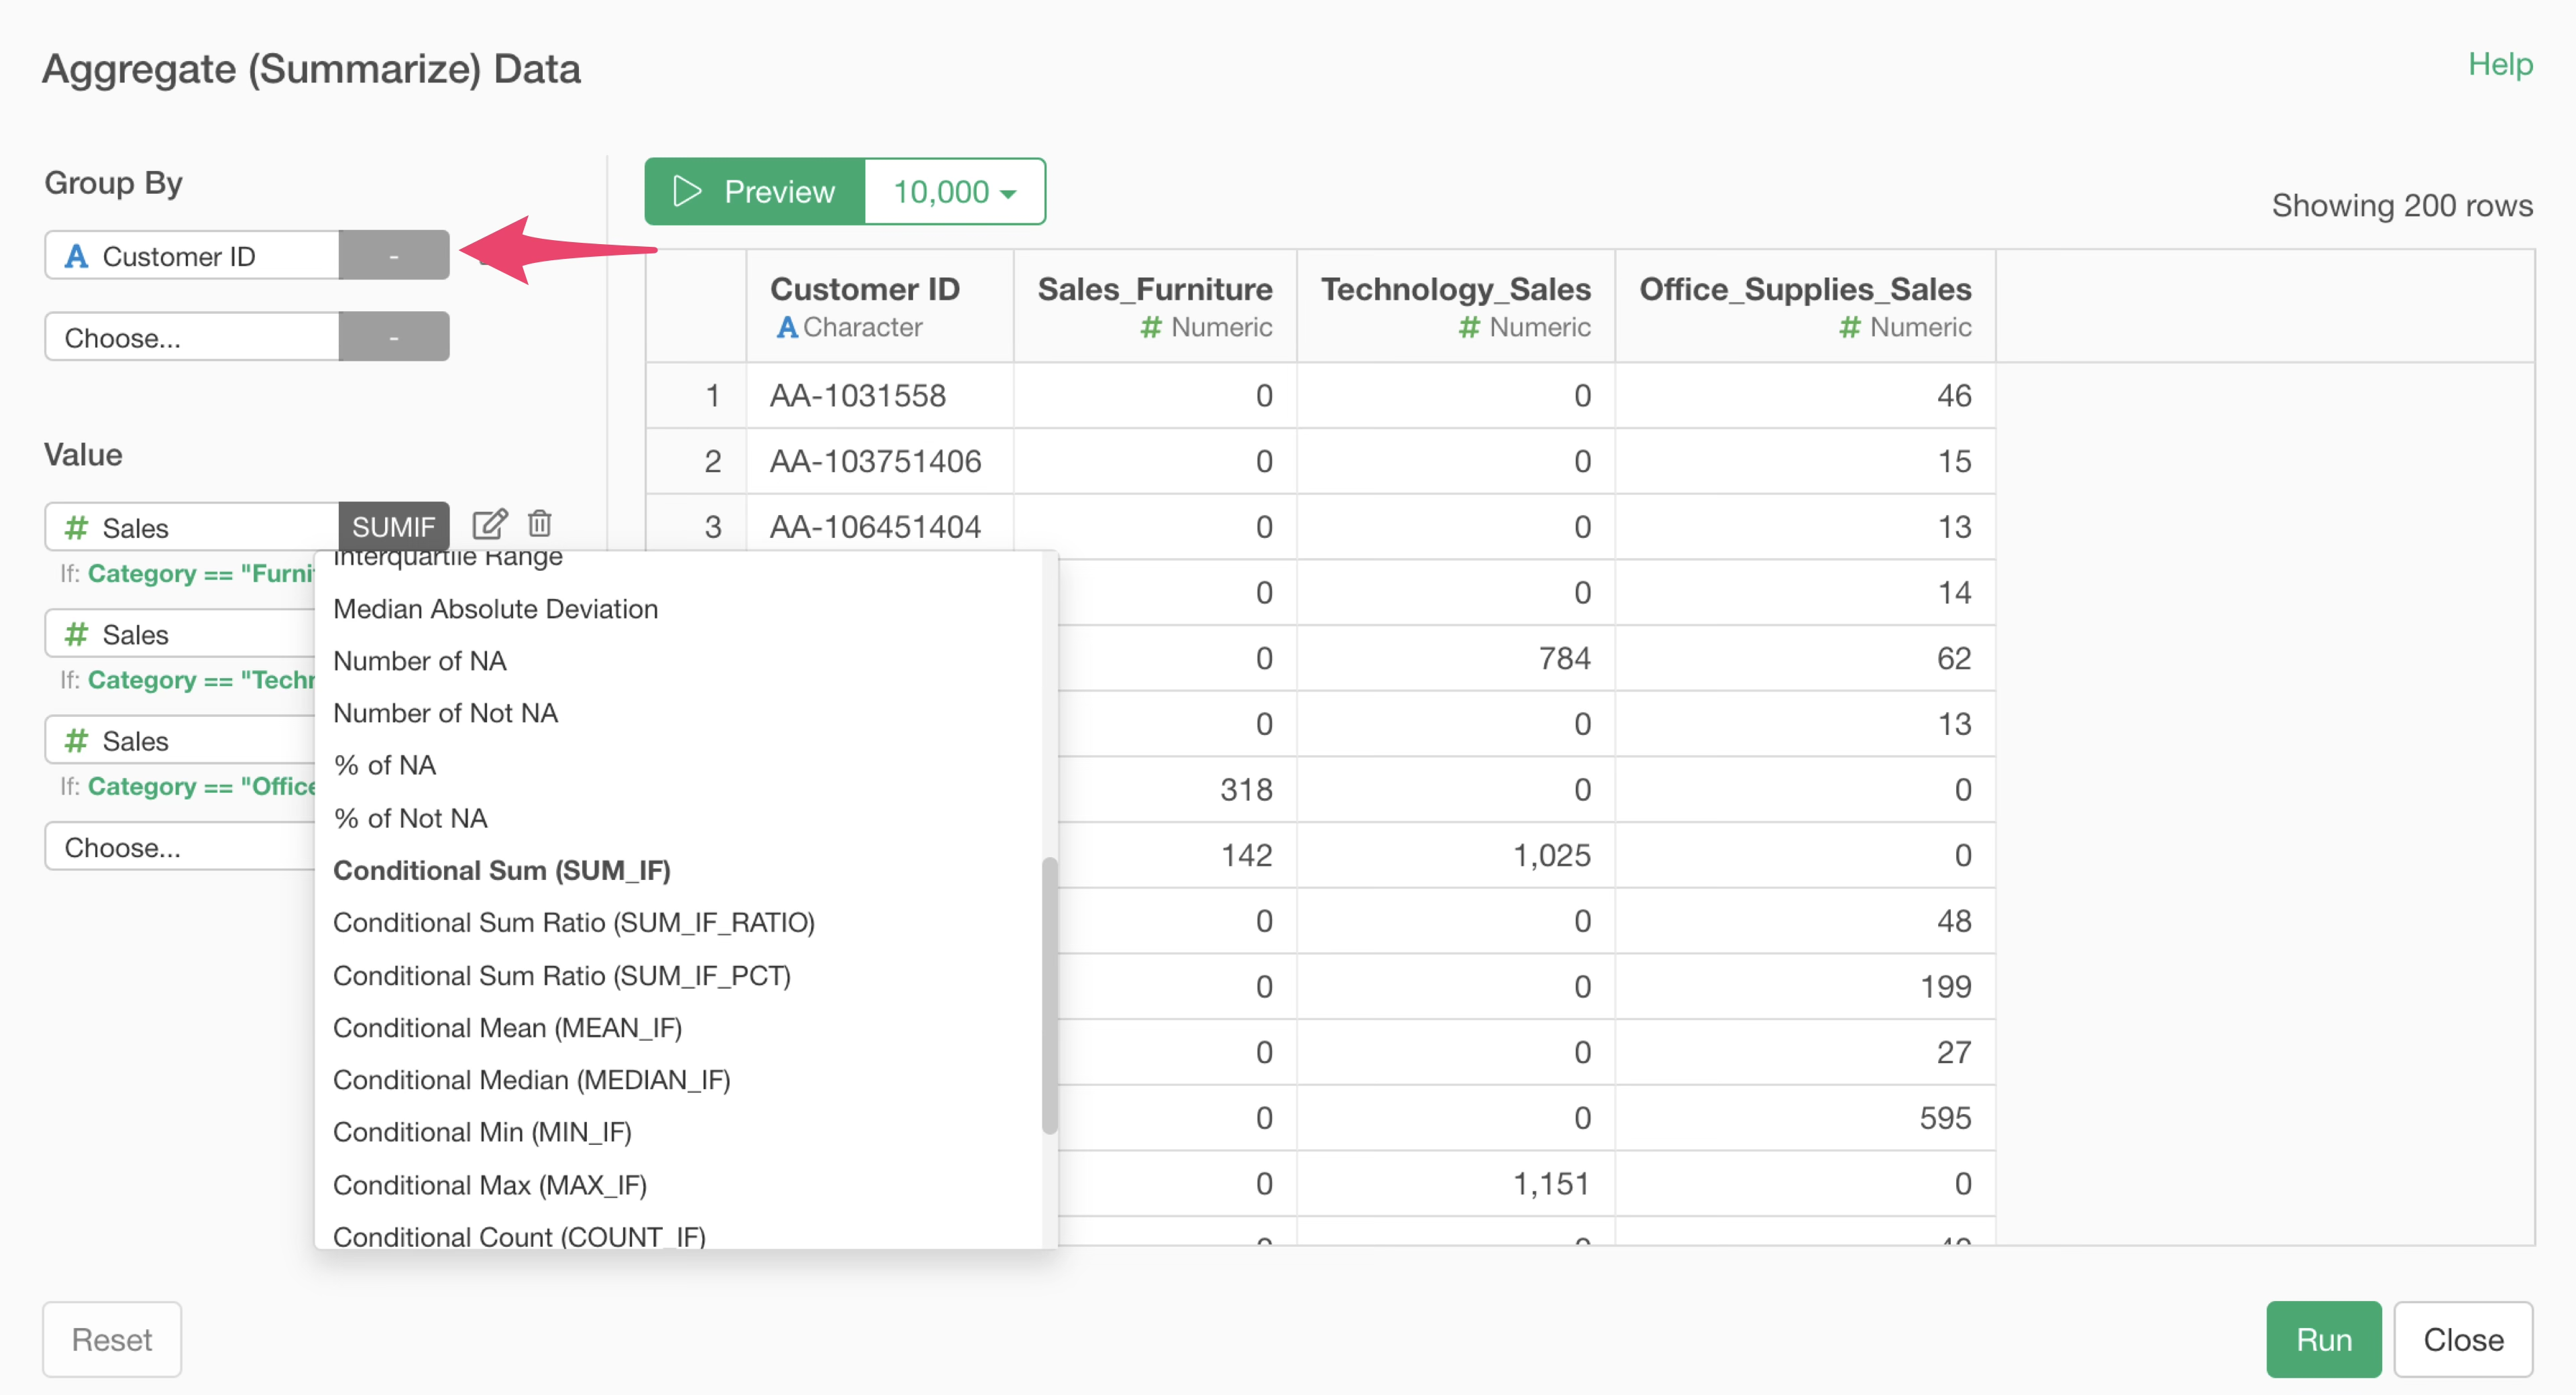
When you want to aggregate “Electronics Sales” and “Furniture Sales” for each customer using this data, you can easily perform aggregation based on complex conditions using conditional aggregation functions within the aggregation dialog.
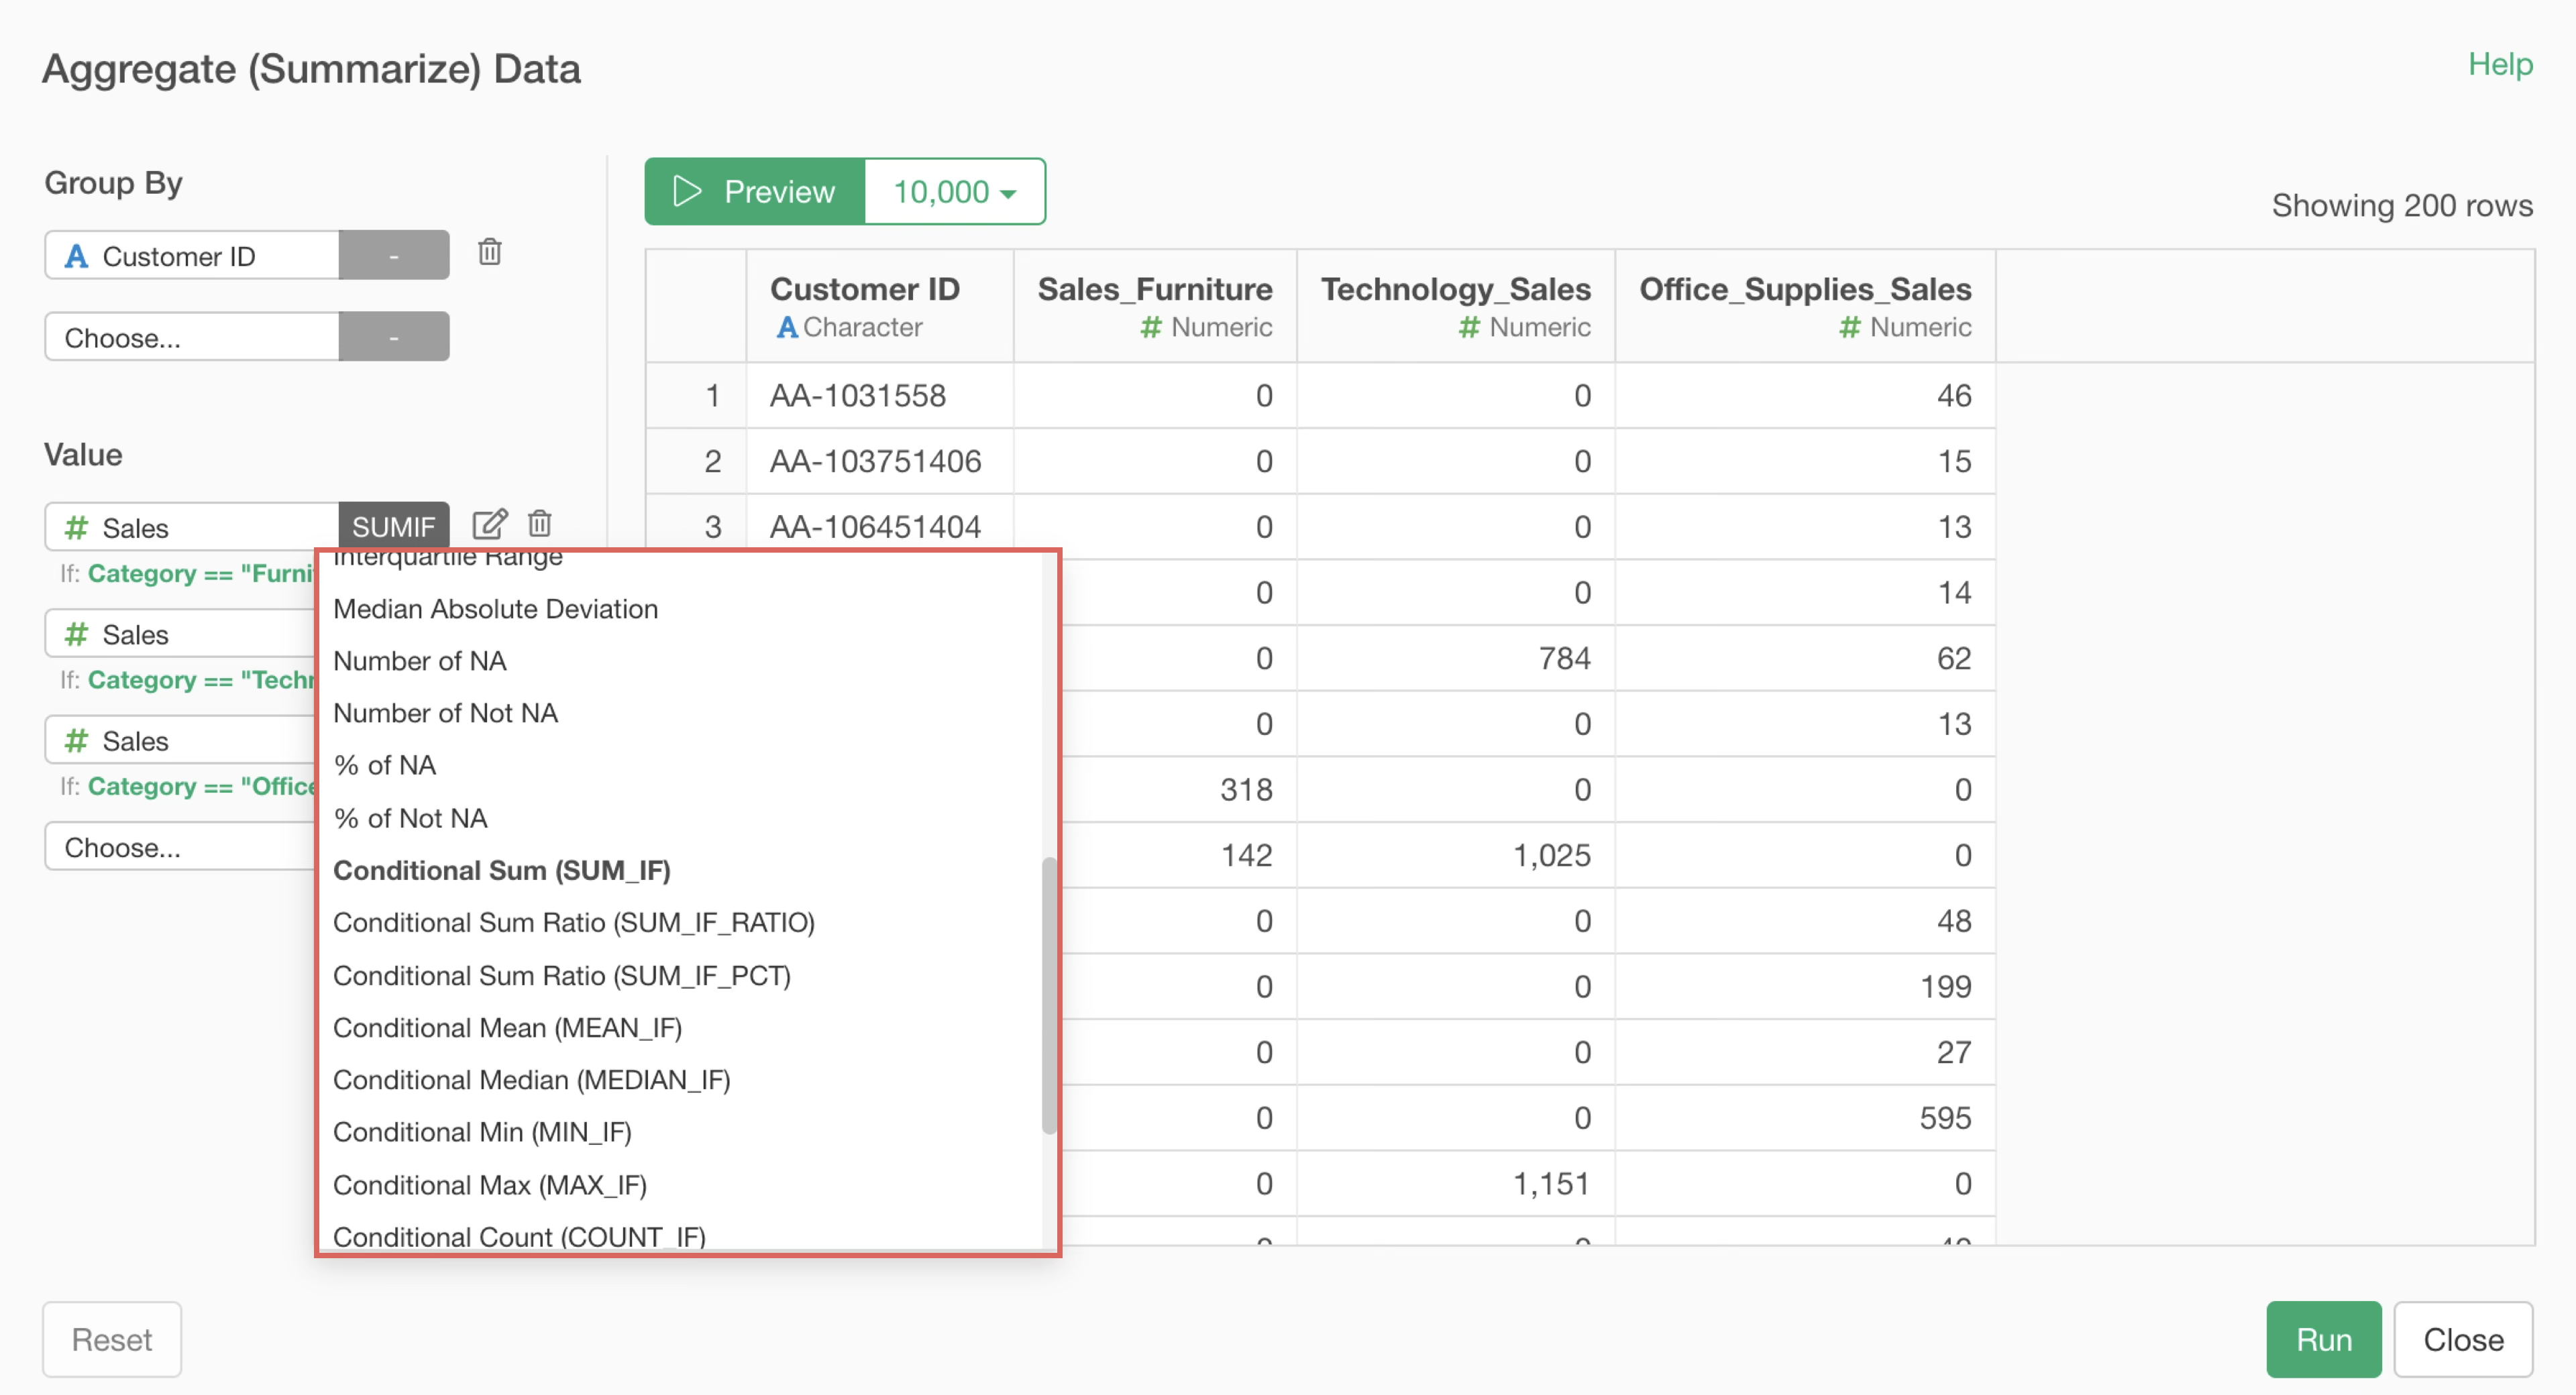
Such conditional aggregation is a more complex process than normal aggregation, so it takes more time.
Furthermore, the more unique values there are in the column selected for “Group,” the heavier the processing becomes. This is because the system must select rows matching the conditions for each group before performing calculations.
Therefore, when you want to perform conditional aggregation using data with many unique values in the “Group” column, you can improve processing efficiency by adding columns that meet the conditions in advance, rather than specifying conditions within the aggregation dialog.
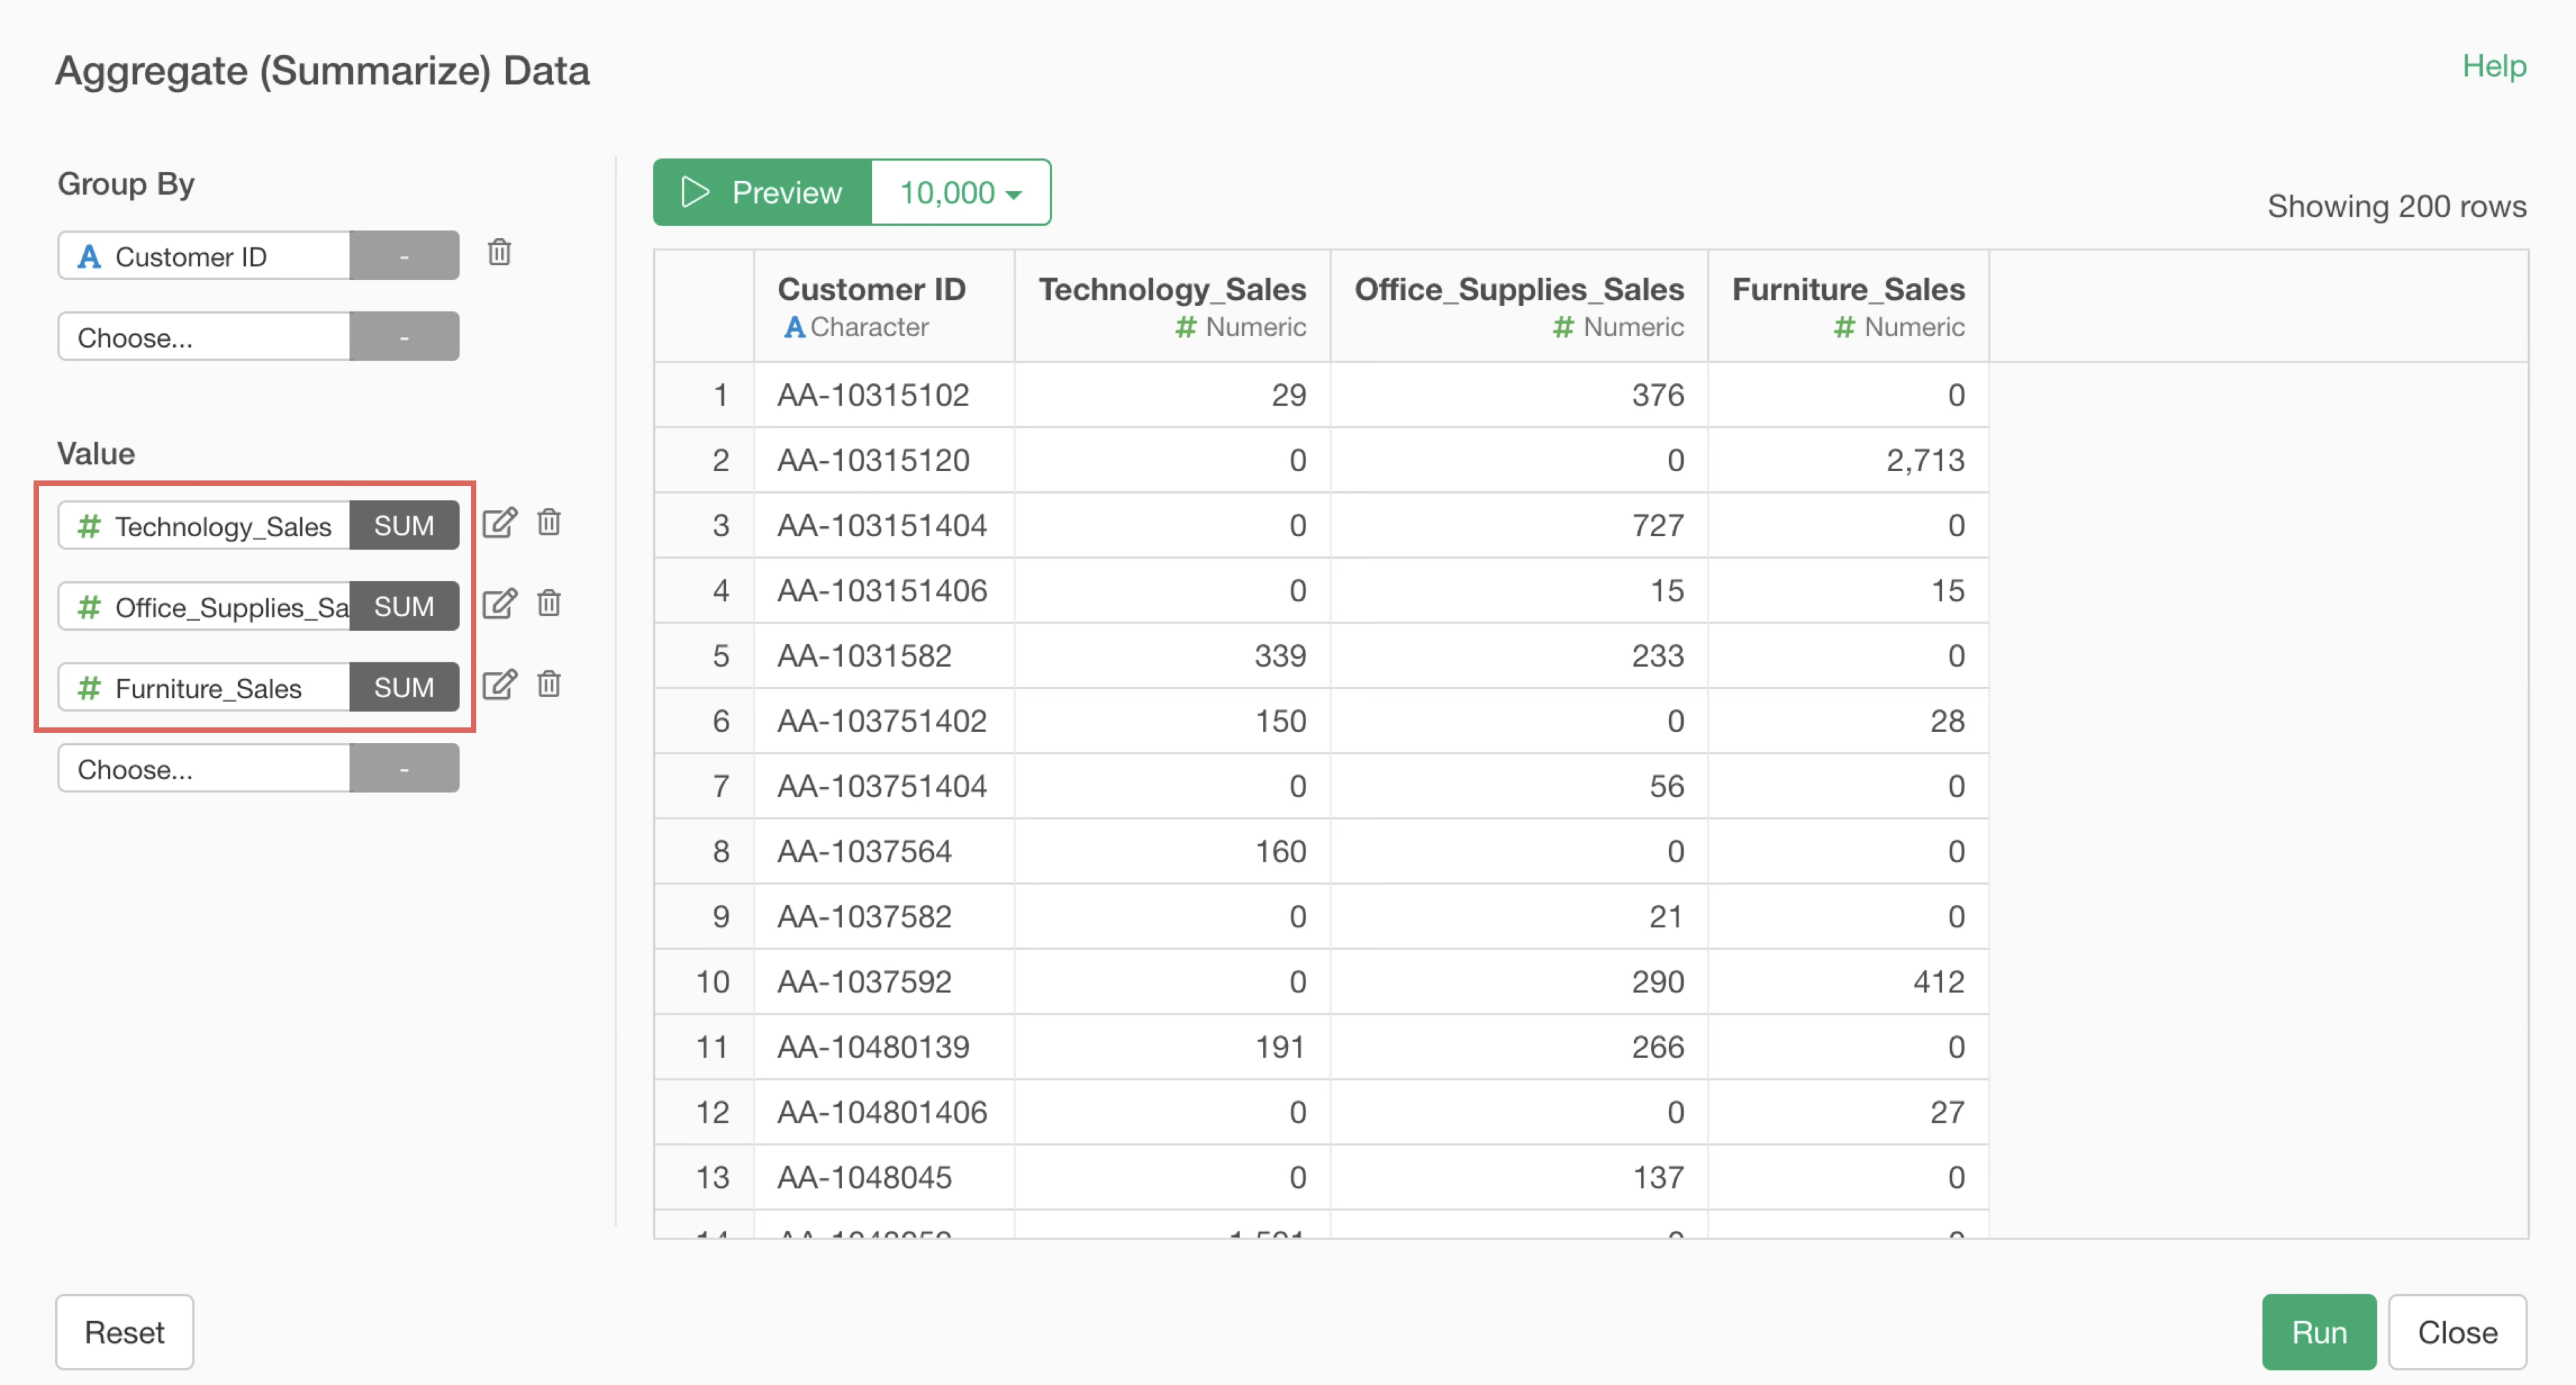
For example, in this case, use the “Calculate based on conditions” feature to add sales columns for each product category beforehand.
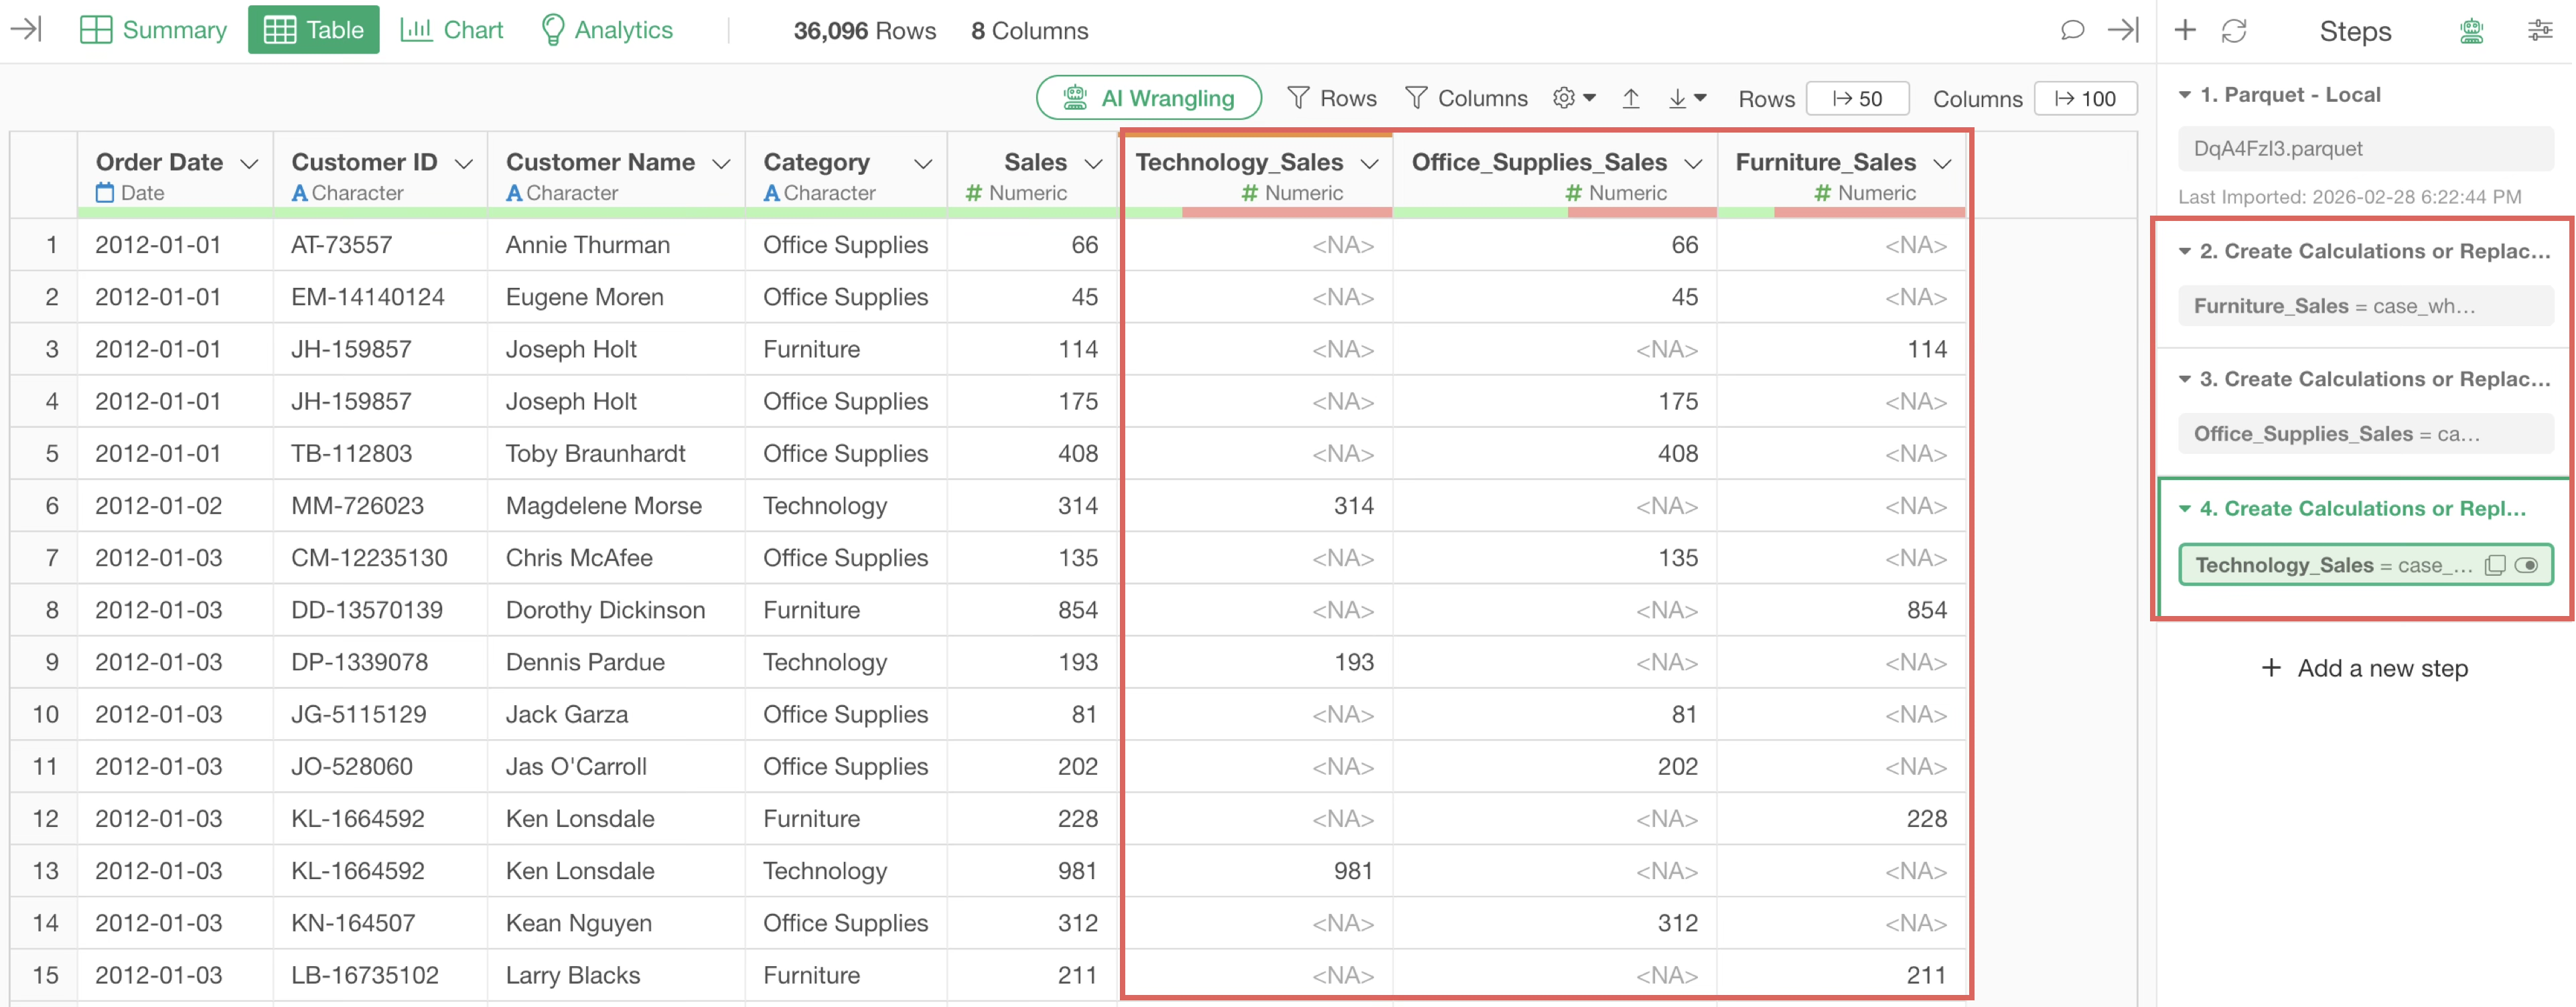
Then, in the aggregation dialog, you can achieve the same result simply by aggregating the pre-prepared columns without using conditional functions, thereby speeding up the aggregation process.
3. Charts/Analytics
Charts
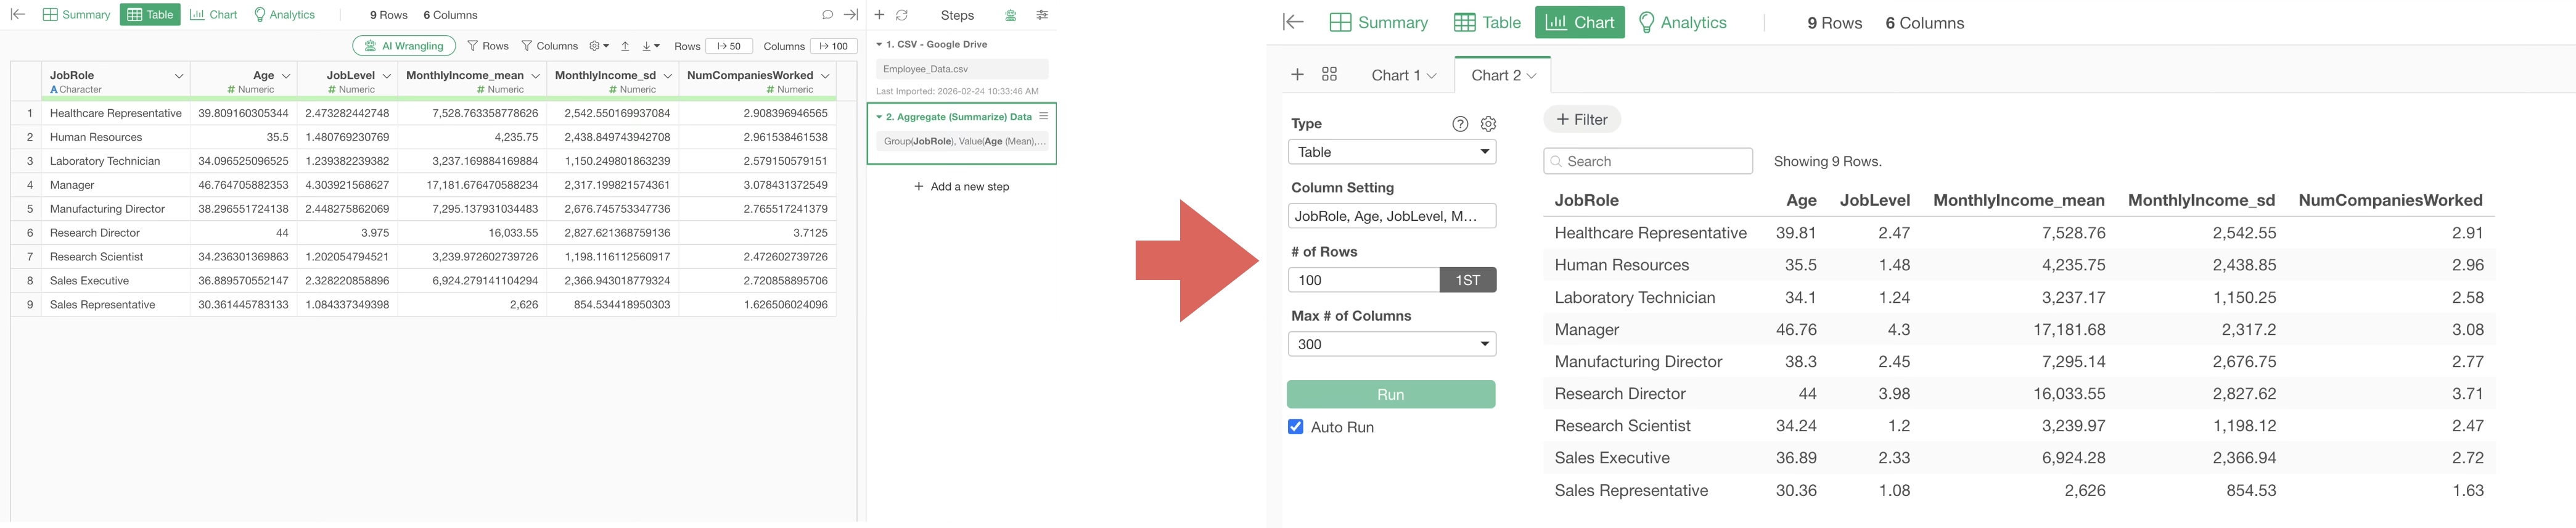
Summary Tables and Pivot Tables
In Summary Tables and Pivot Tables, aggregation processing runs every time you select a variable, which takes time.
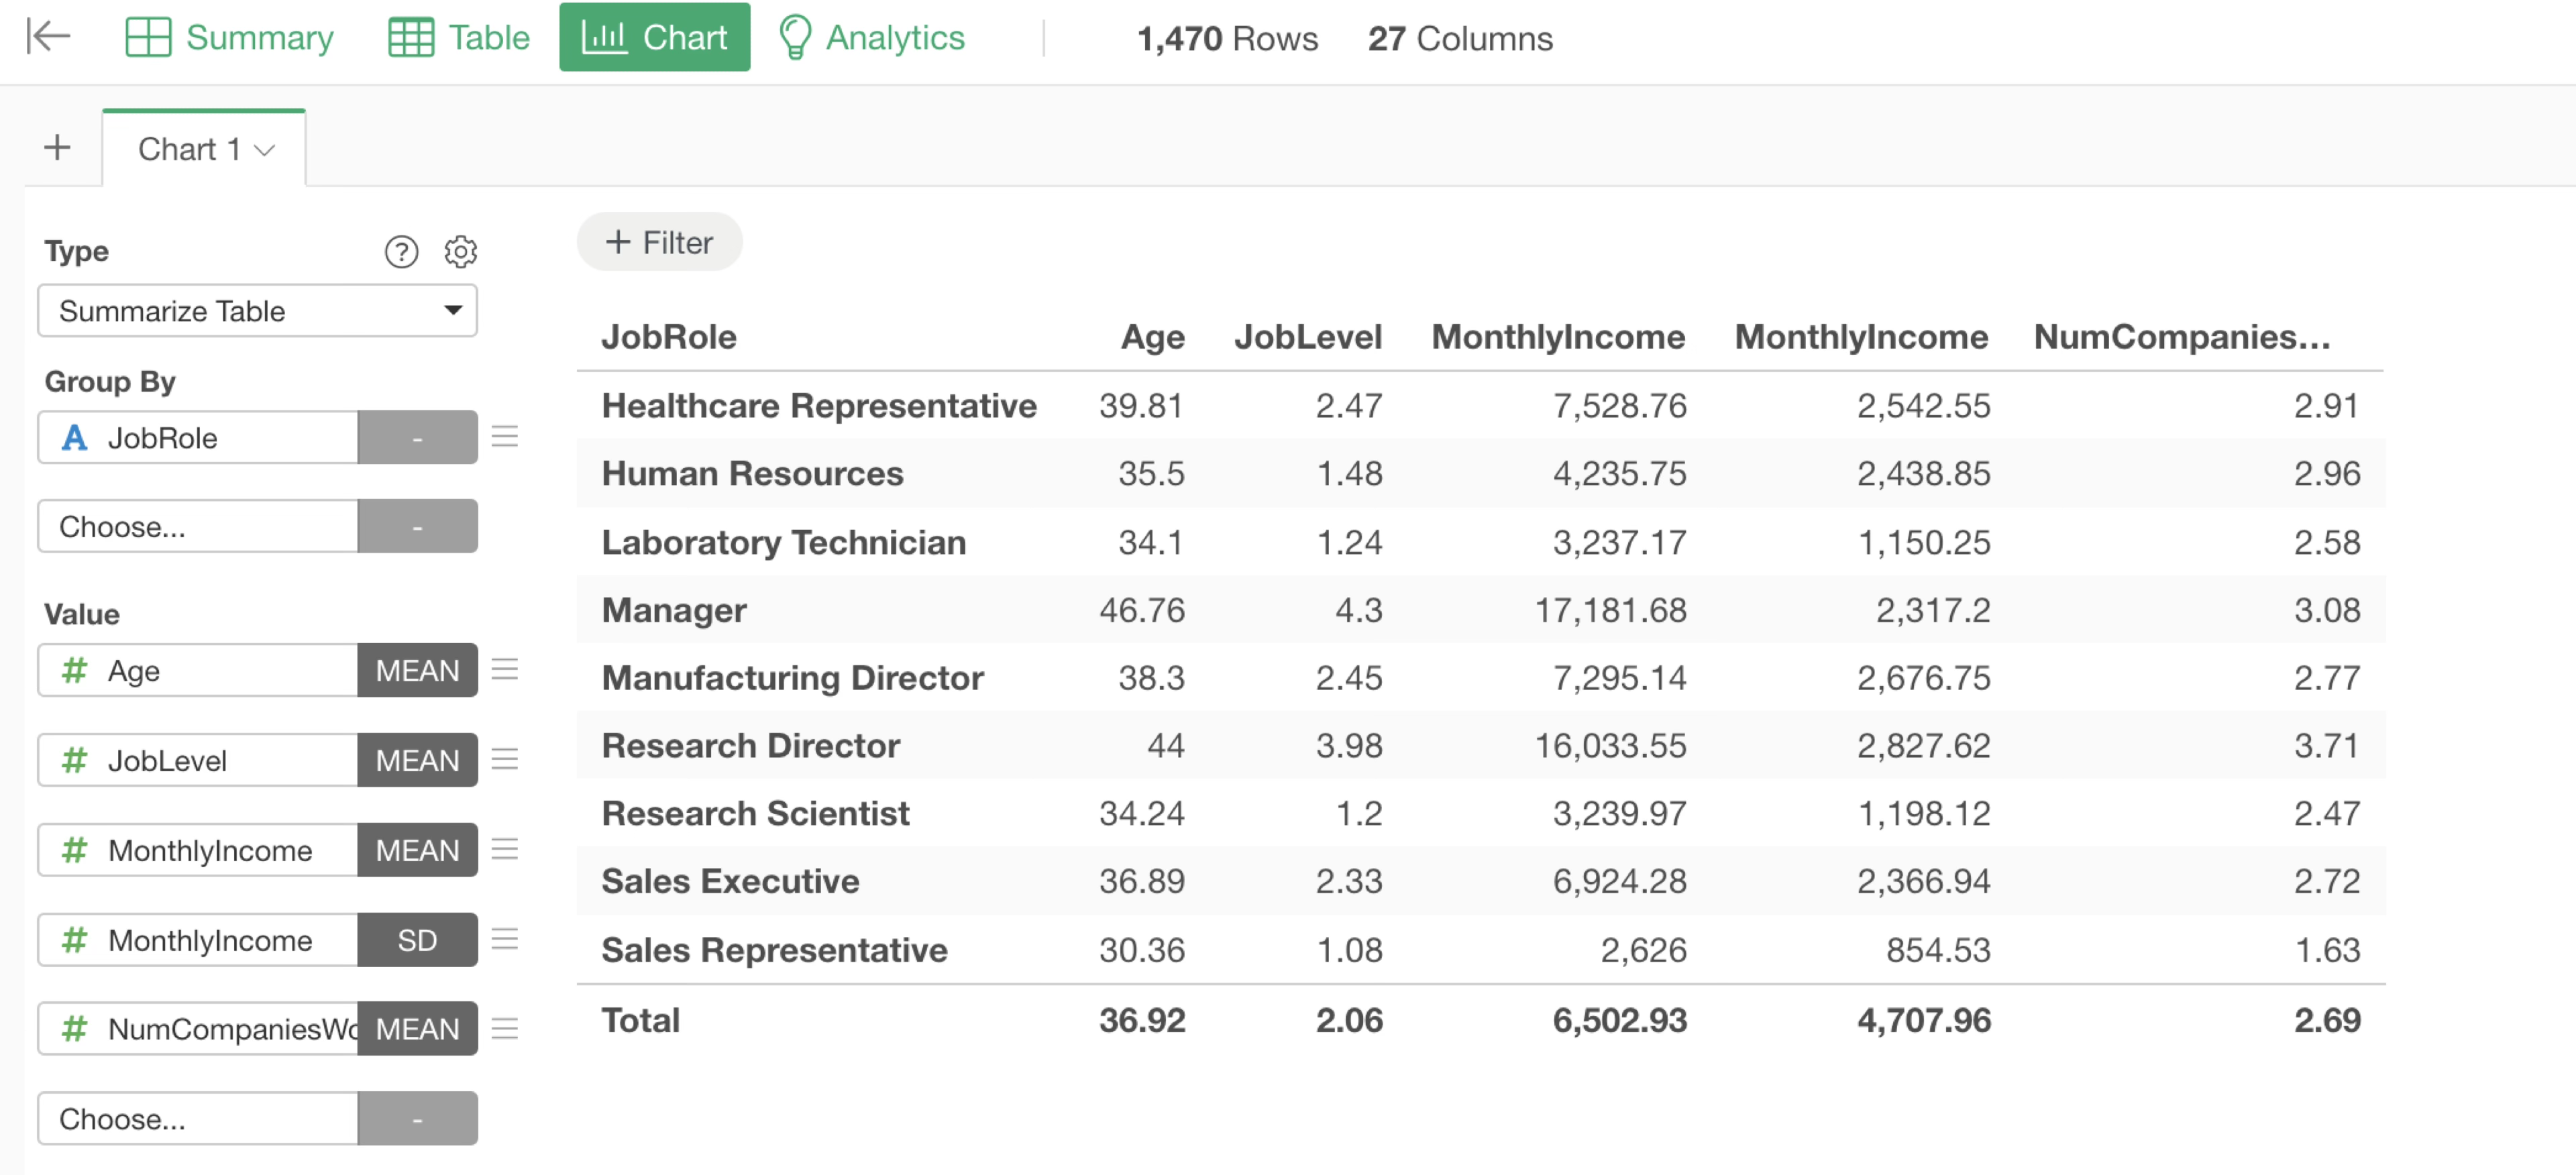
Therefore, adding an aggregation step in advance and visualizing the data in a “Table” is faster because it eliminates the need for aggregation processing on the chart.
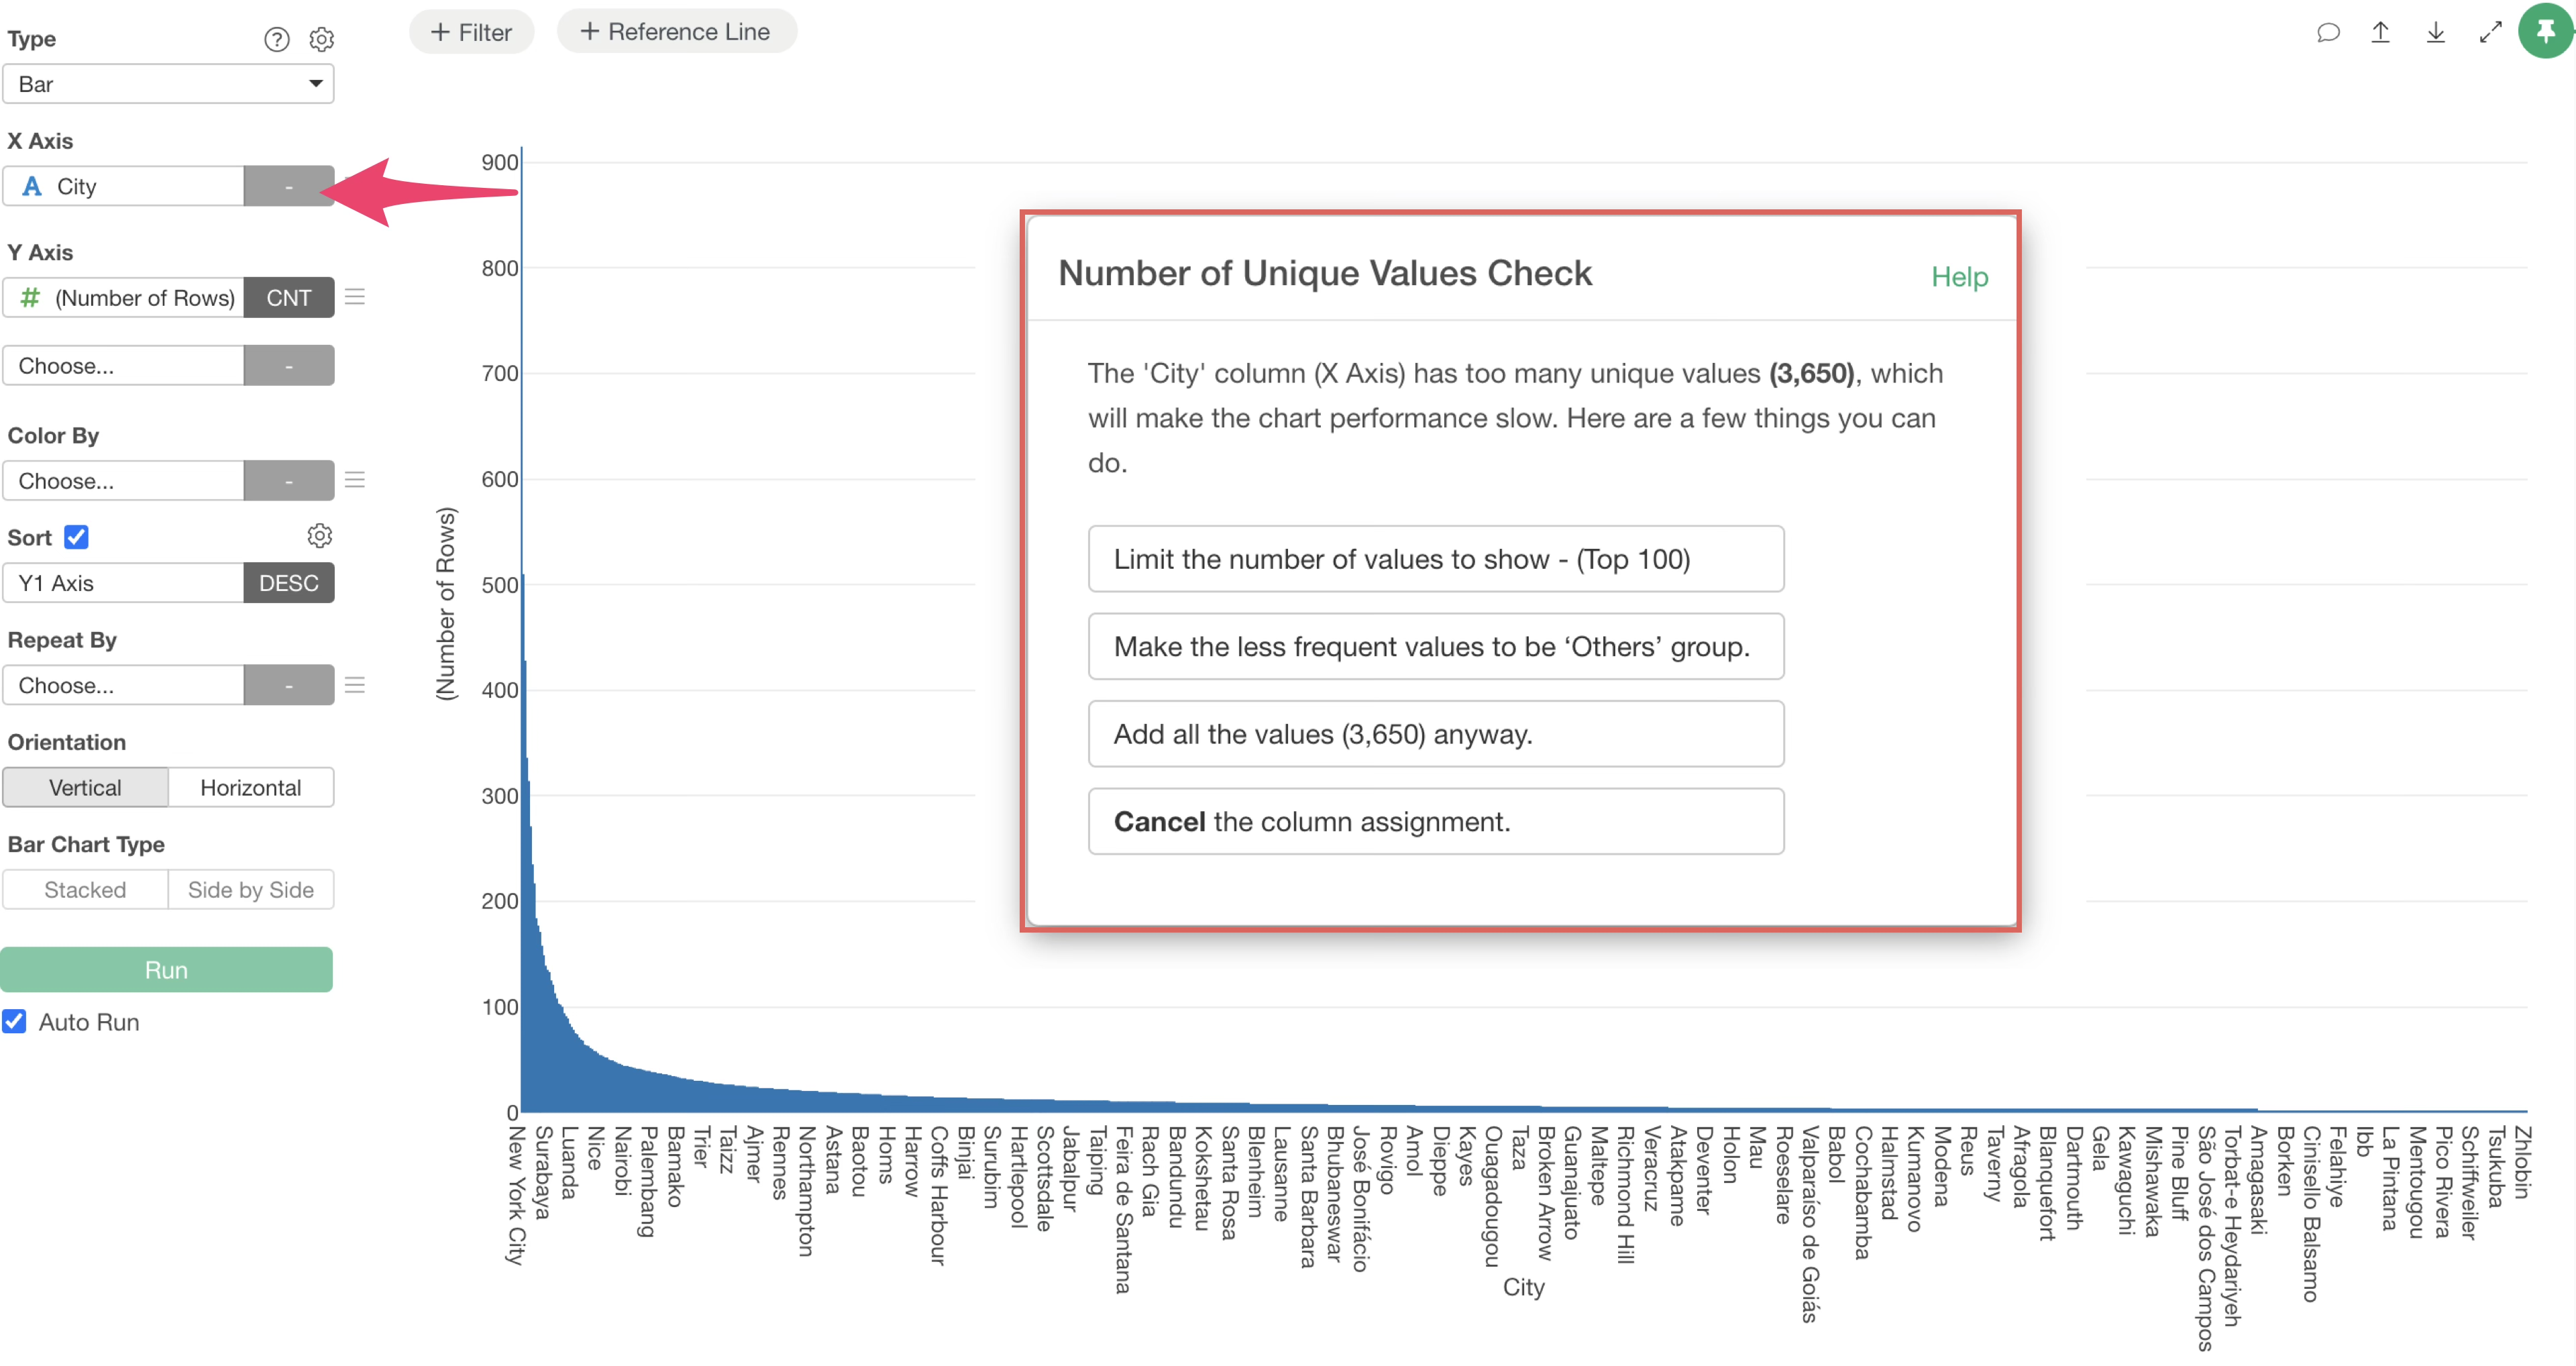
Visualizing Data with Many Categories
As data size increases, the number of categories tends to grow. Attempting to visualize too many categories can take a long time to render.
To prevent this, if you select a column with too many categories in a chart, a “Unique Value Check” confirmation screen appears, allowing you to control the information displayed.
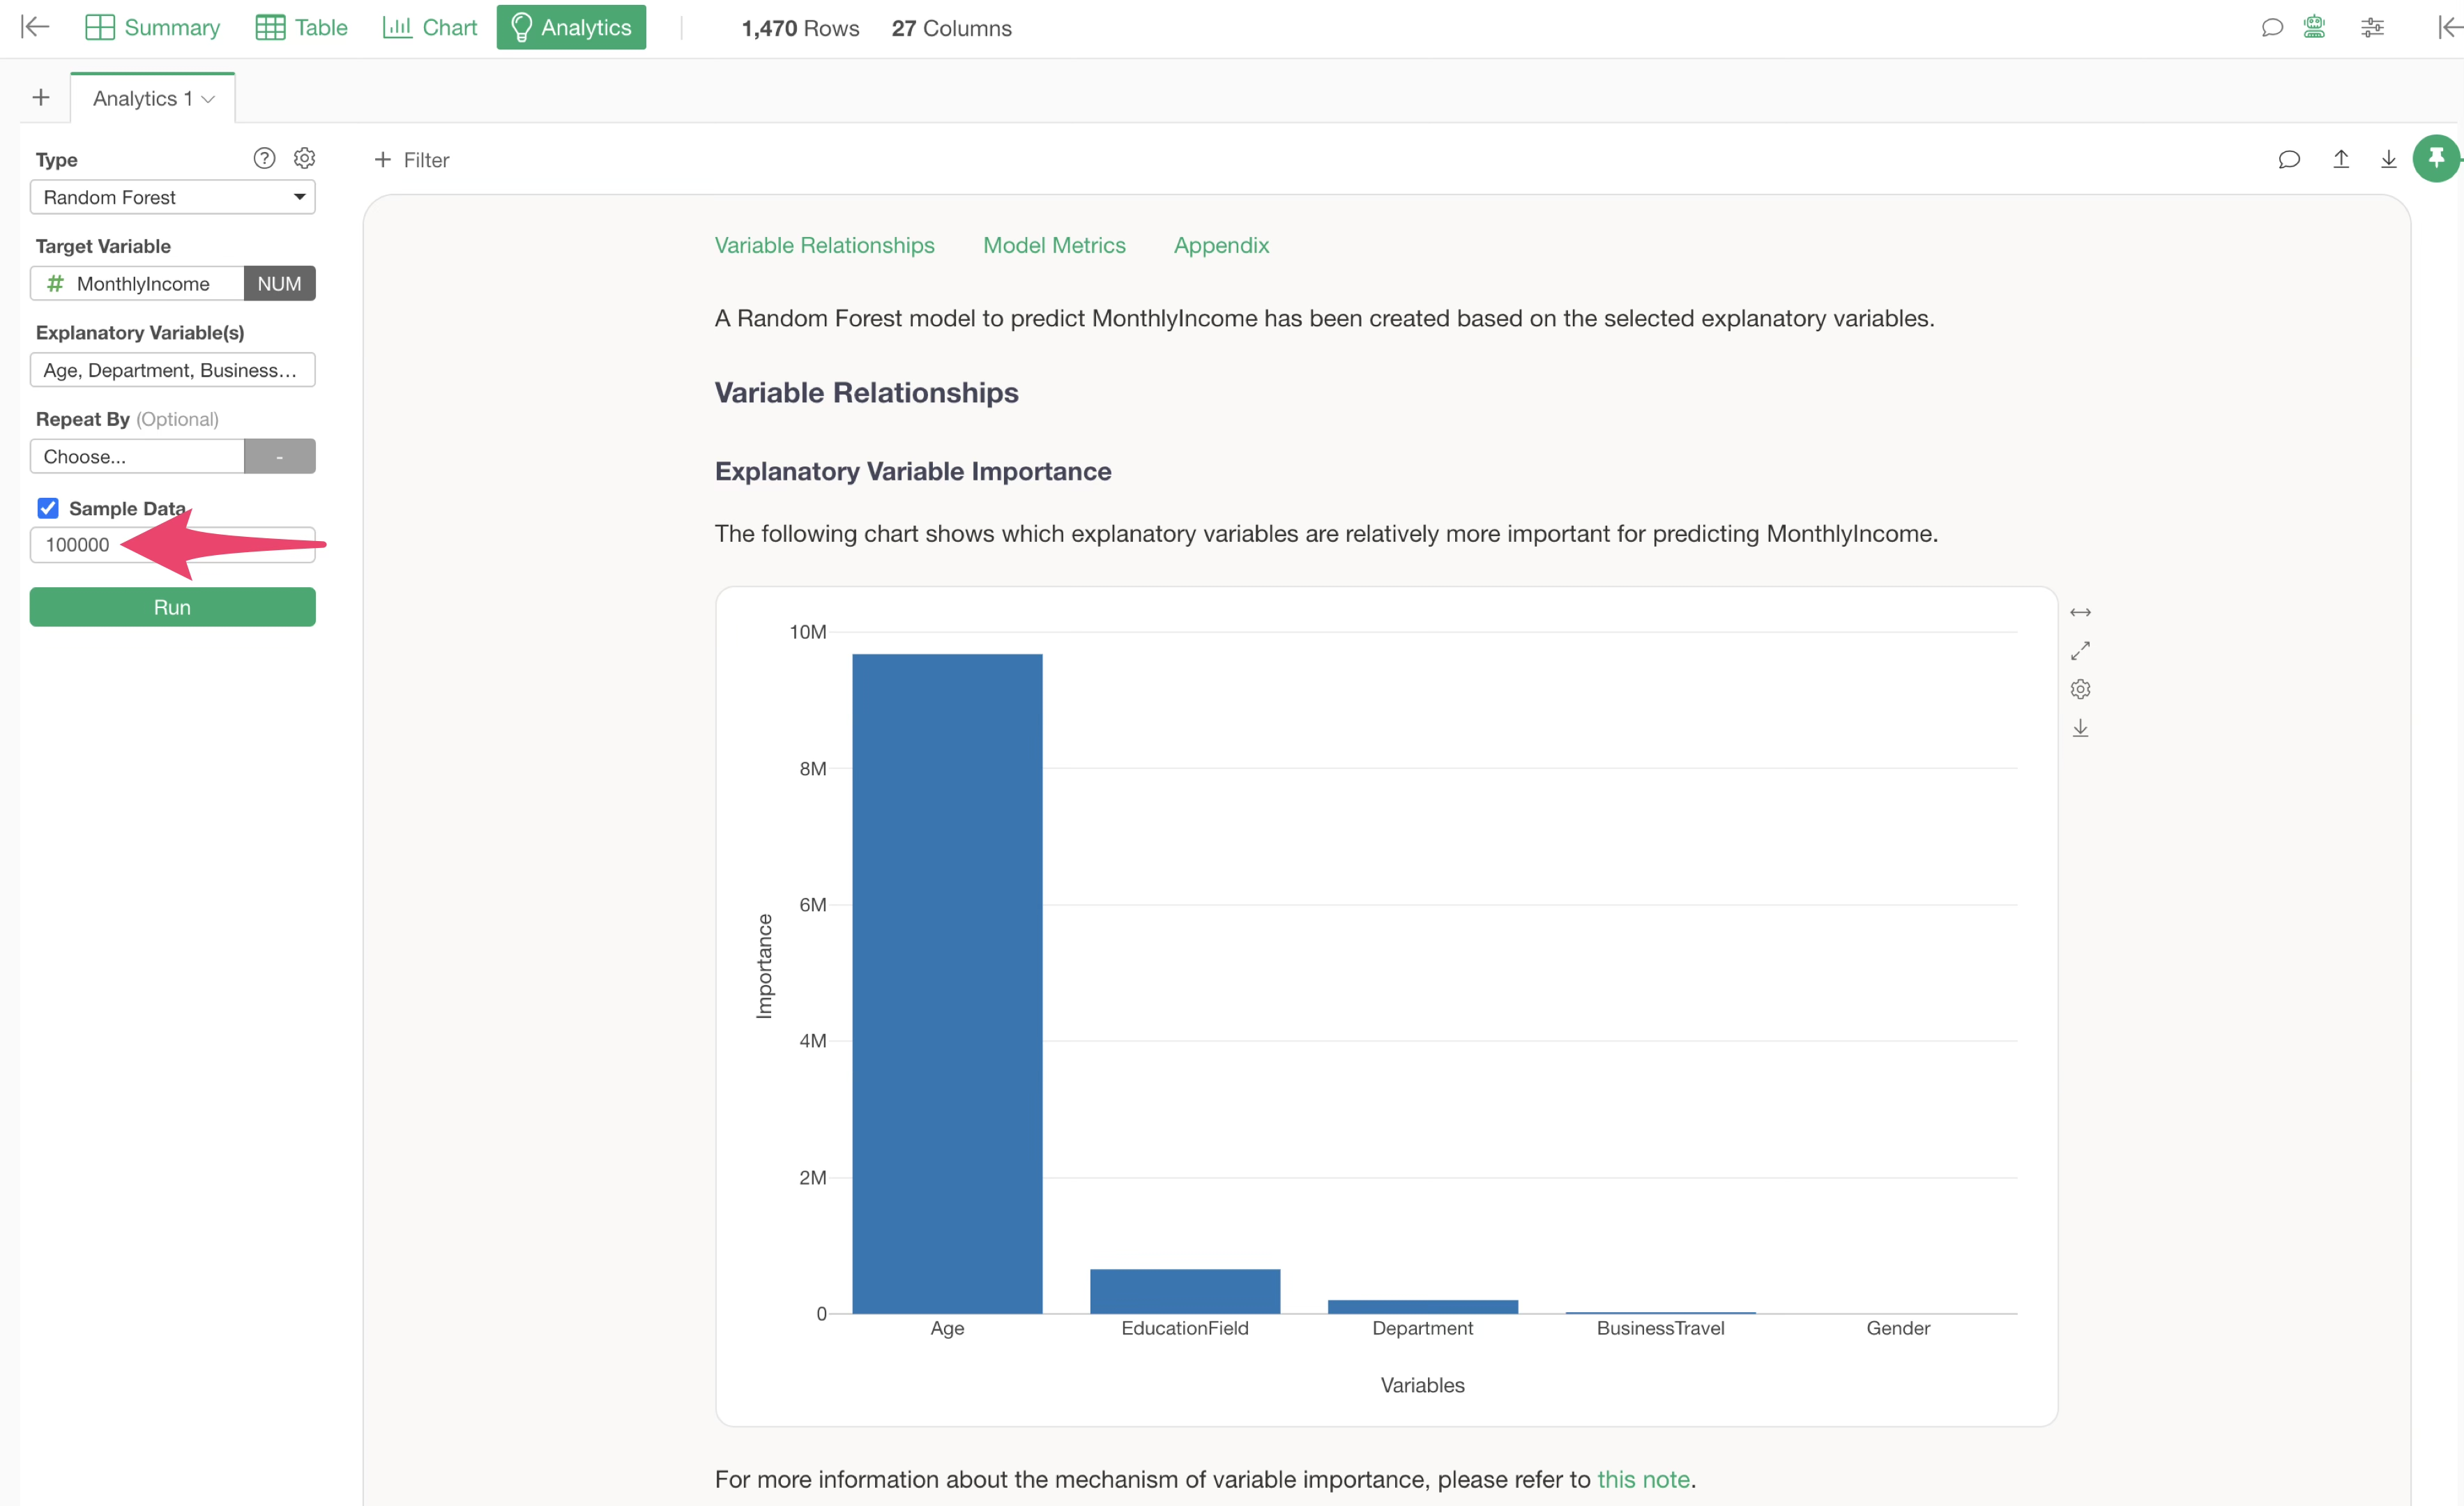
Analytics
Running Analytics on large datasets can take time for calculations.
If you want to check general prediction accuracy or correlation trends, you can adjust the model execution speed by specifying a sample size when running Analytics.
4. Dashboards
Dashboard Execution Mechanism and Performance Optimization
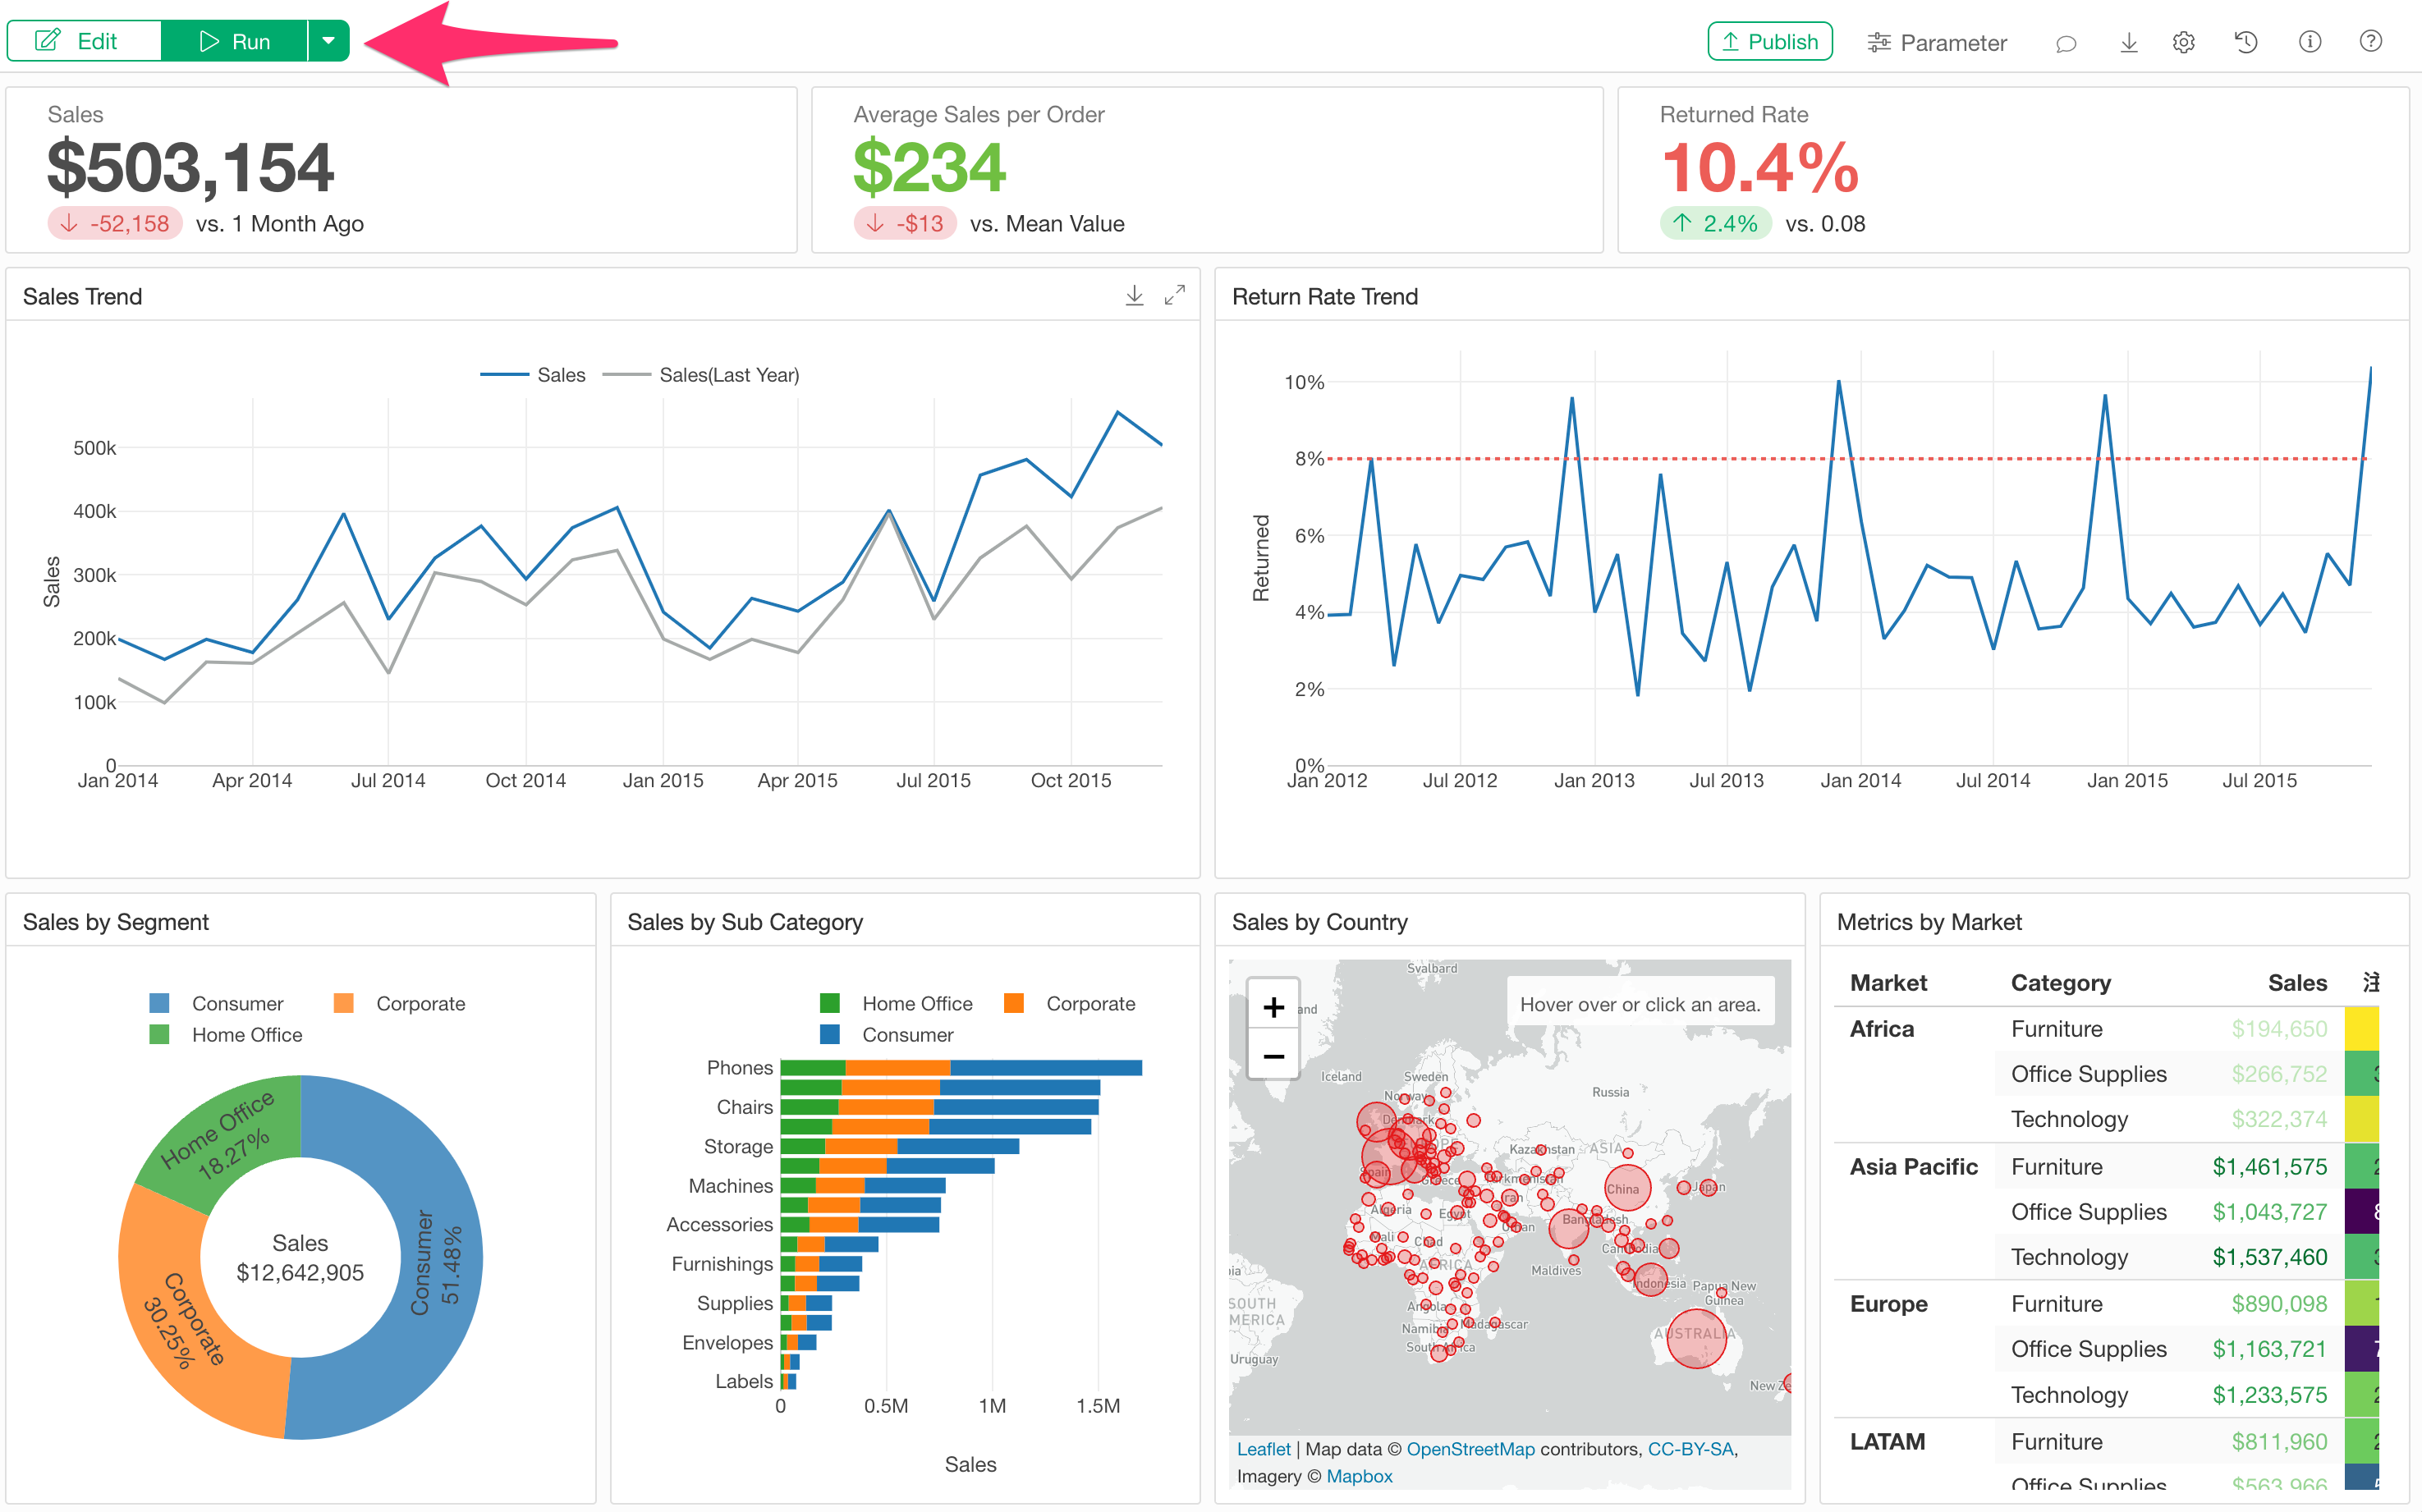
In Exploratory, when you open a chart directly from a data frame, it usually displays quickly because the necessary data is loaded from memory and rendered at high speed.
On the other hand, when executing a dashboard, while data is not re-retrieved from the data source, all steps except the data source are re-executed before the charts are rendered.
Therefore, dashboard execution is expected to take time if the following conditions apply:
- Large datasets are used.
- Multiple data frames are used.
- There are many steps.
- The dashboard has many pages or charts.
- It includes charts with many repetitions or pivot tables with a lot of information.
One effective approach to improve dashboard execution performance is to prepare a processed data frame using the Data Catalog and use that data for the dashboard charts, especially if heavy processes like merging multiple data frames or complex calculations exist in later steps.
Alternatively, if possible, creating charts at a step before heavy processing occurs can prevent those heavy processes from running every time the dashboard is executed.
Cache Steps to Lighten Interactive Mode
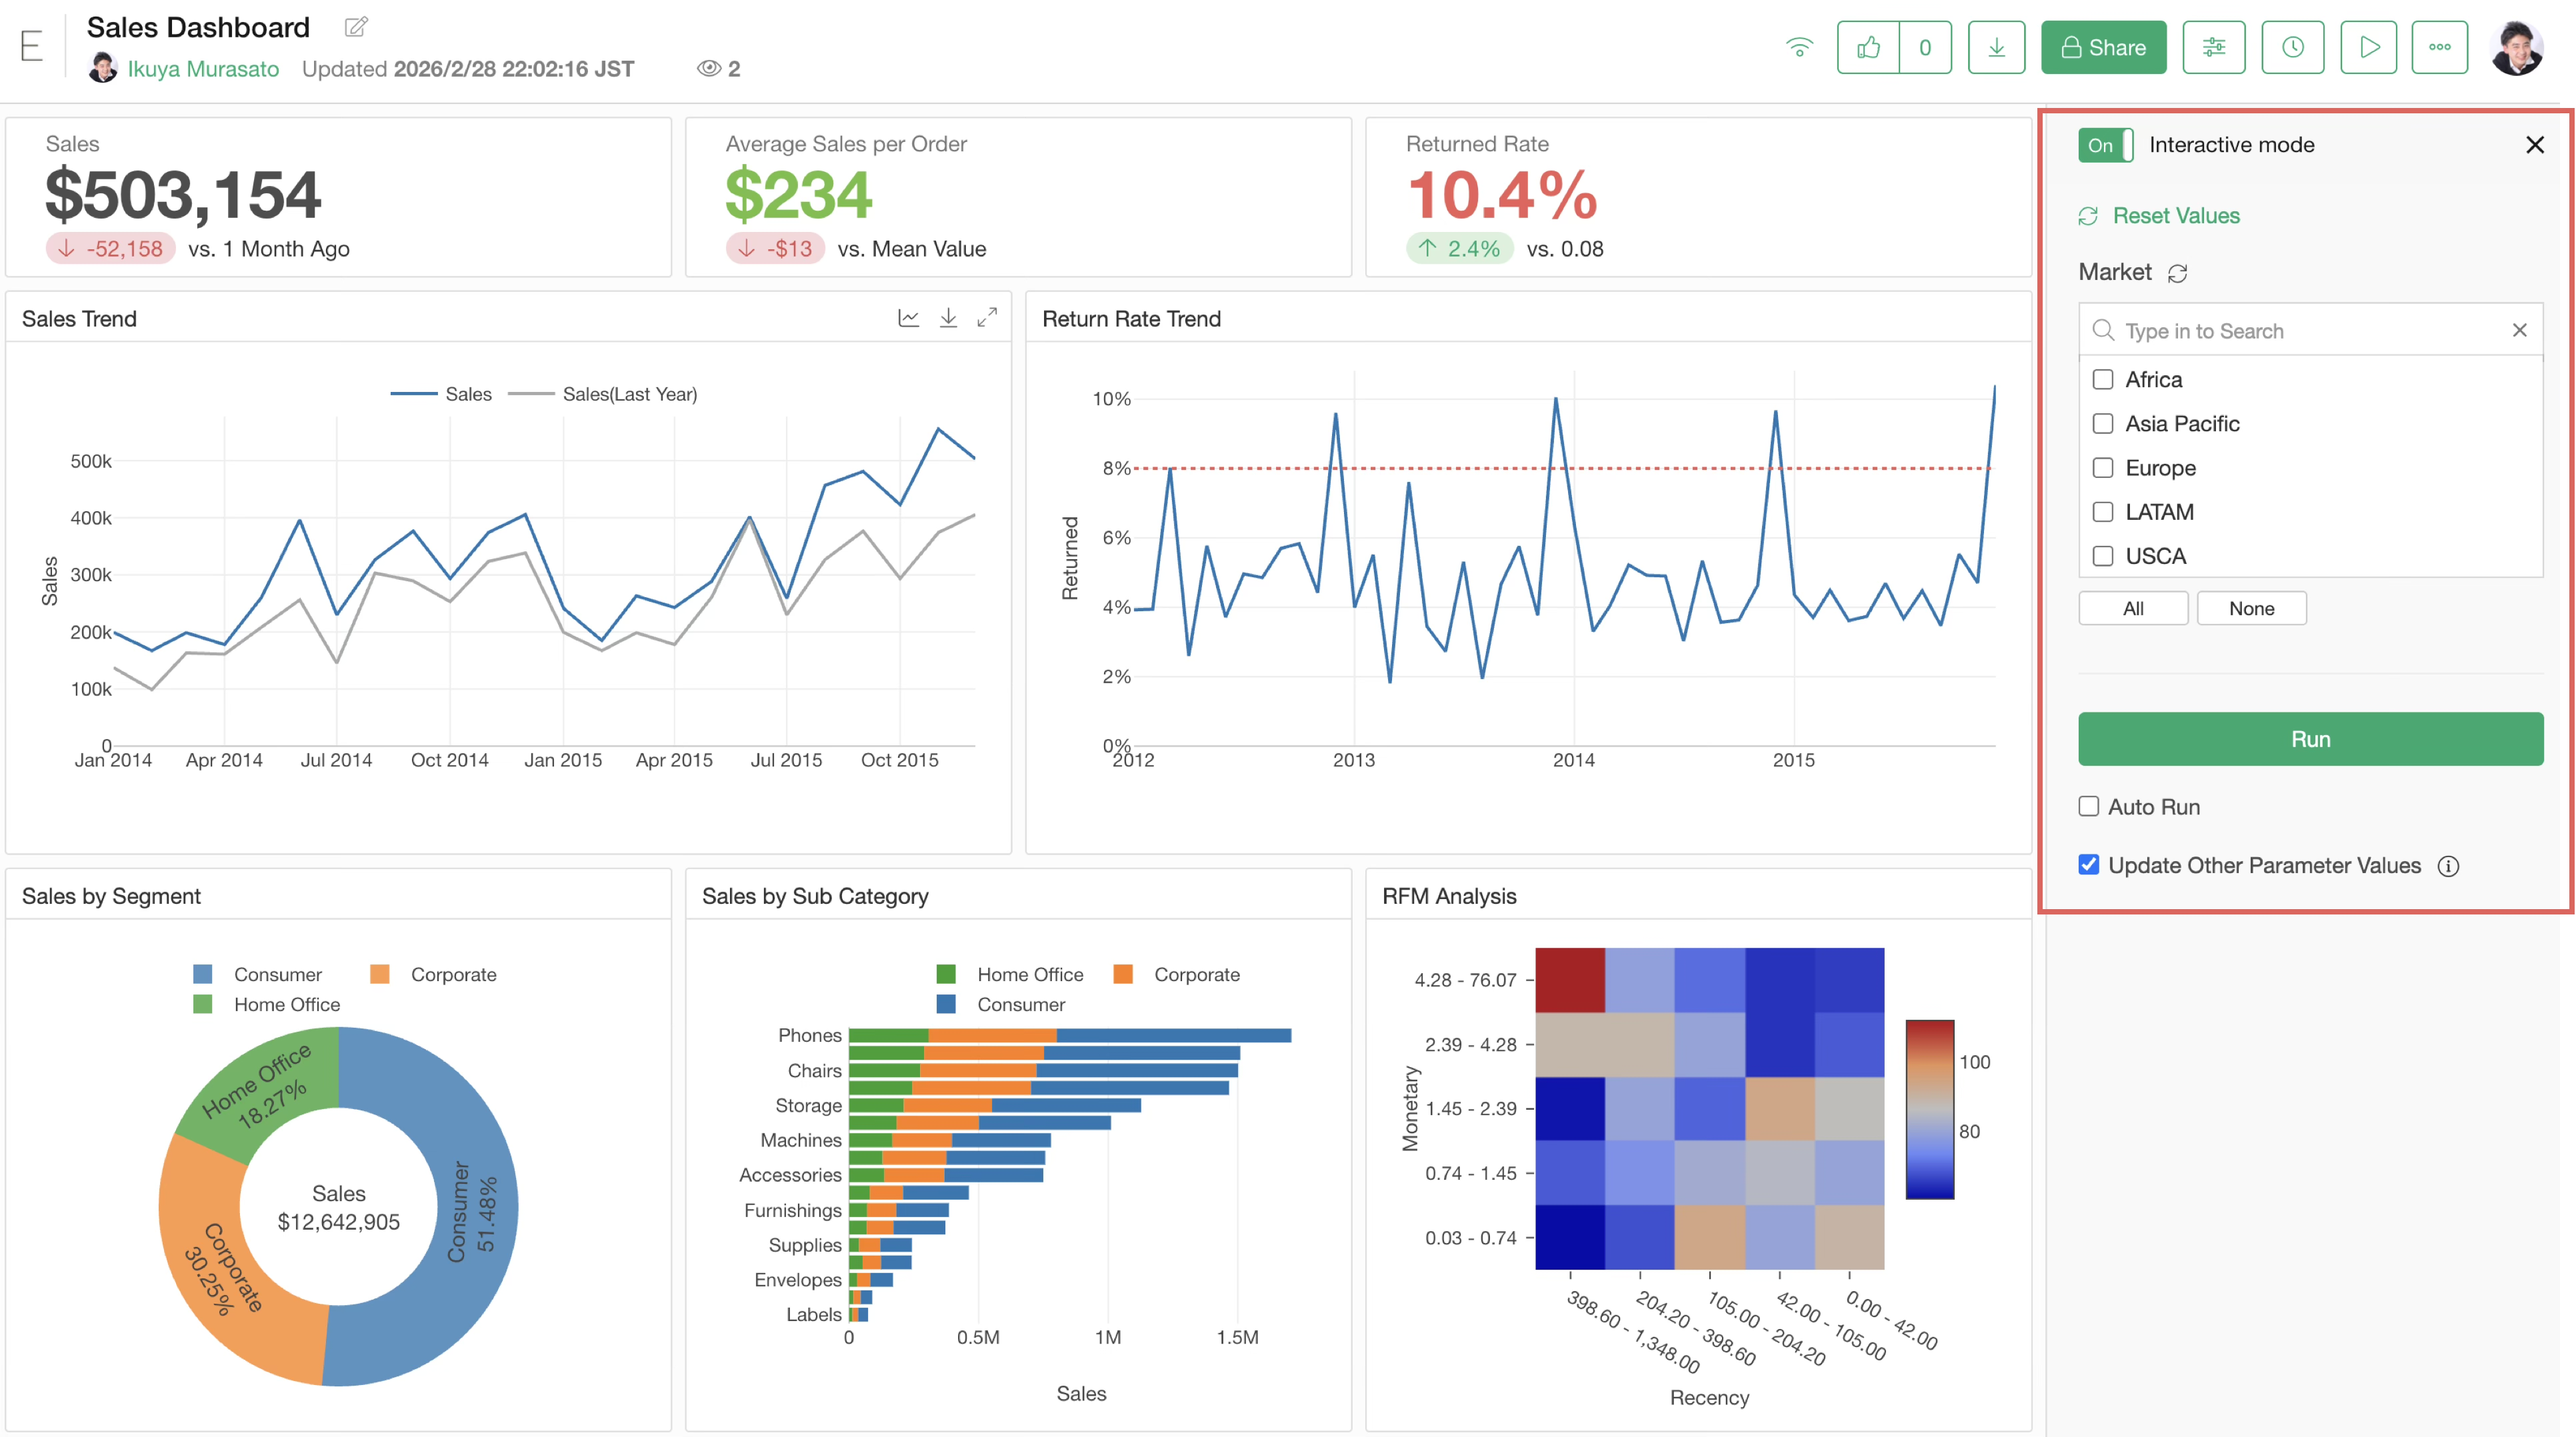
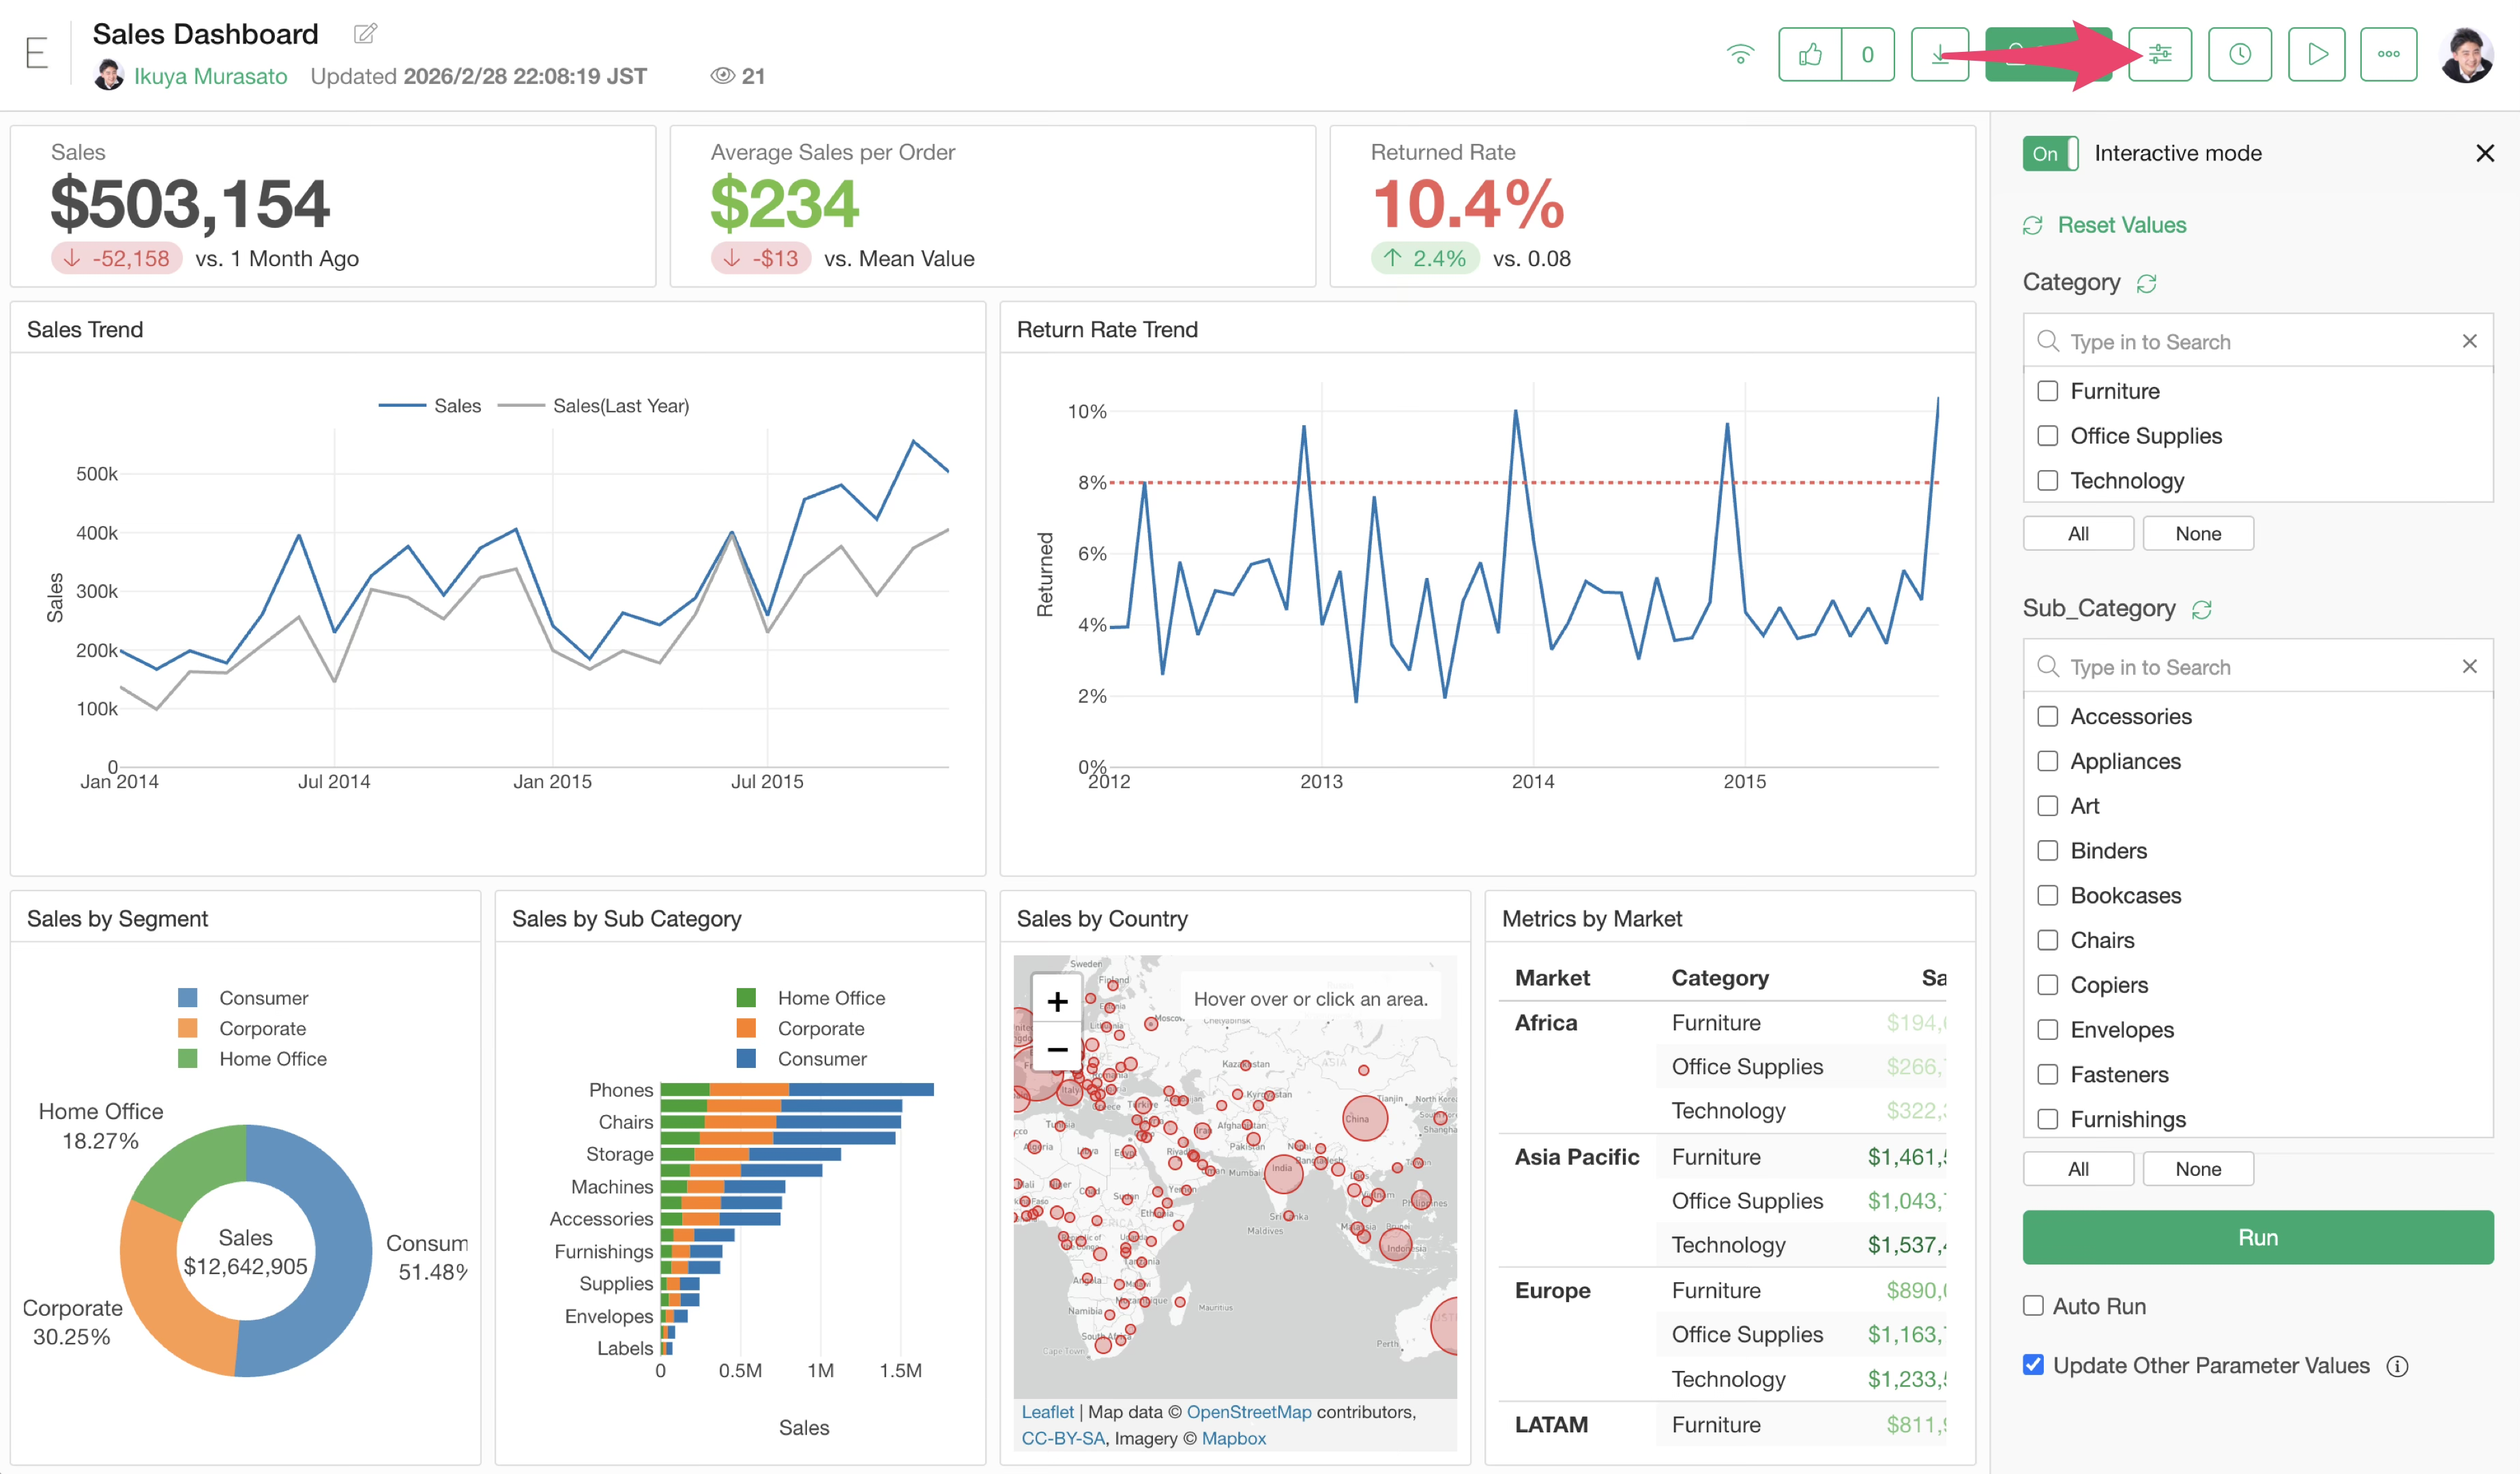
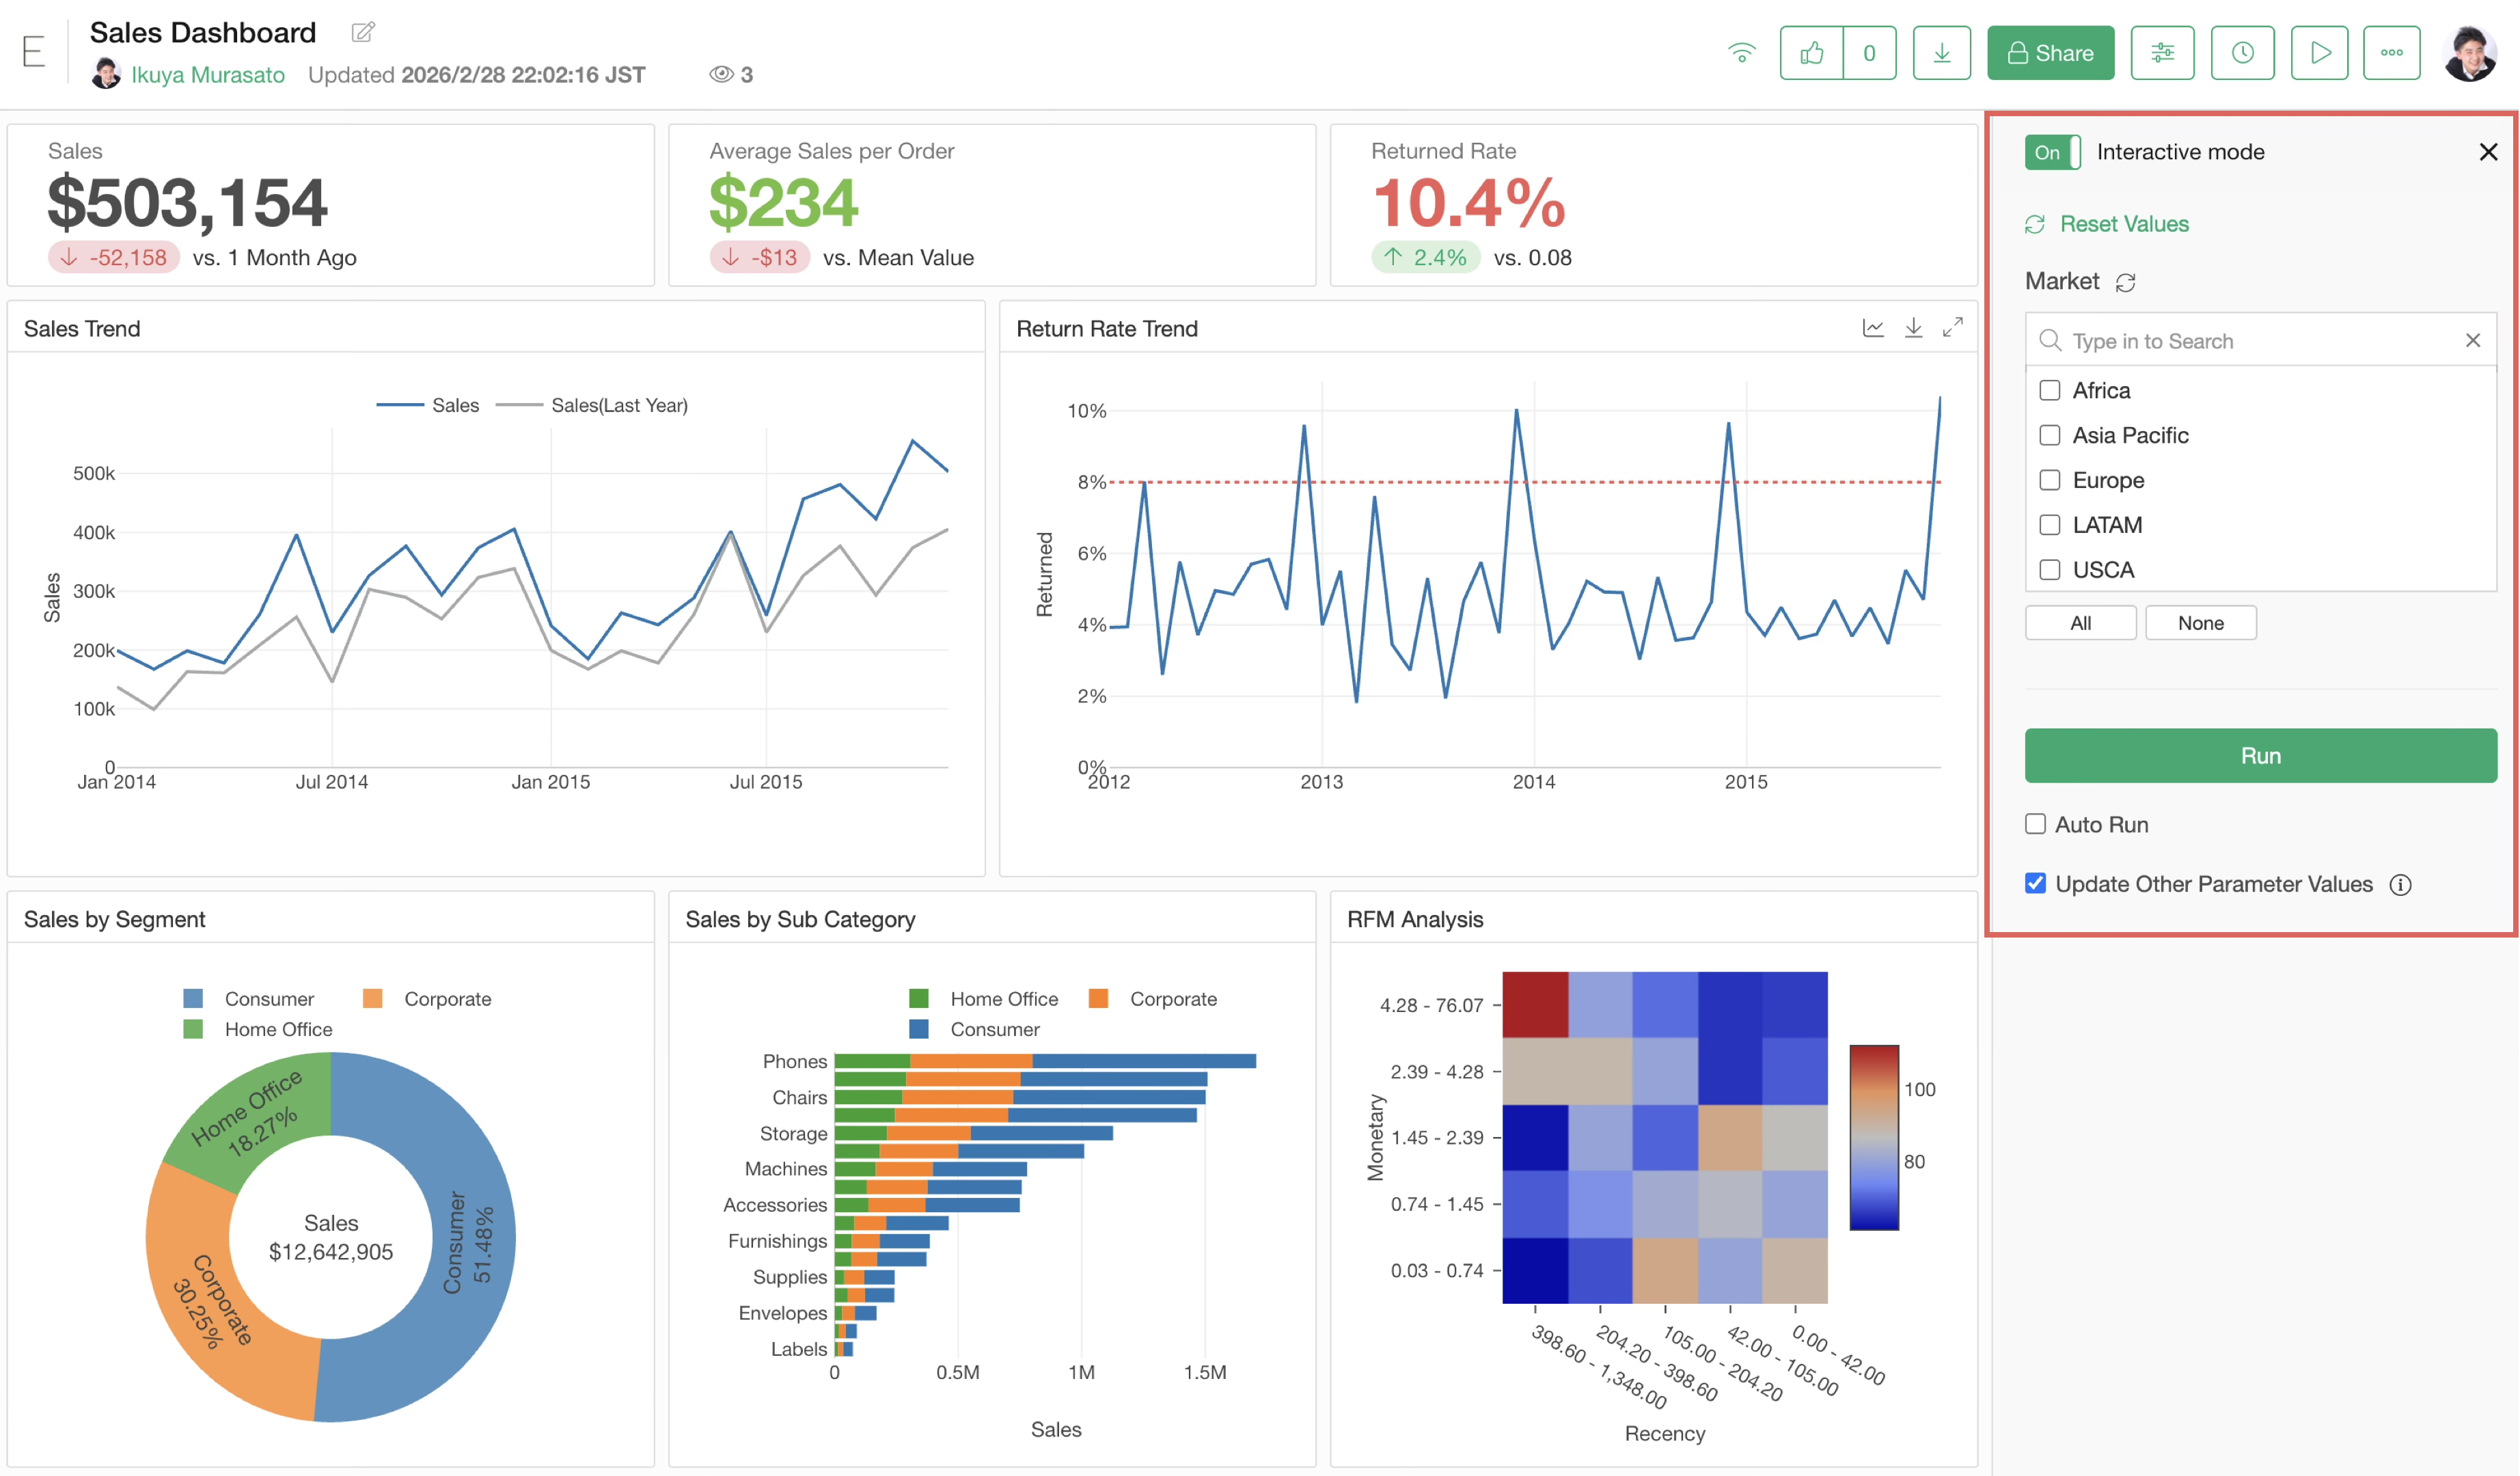
Exploratory has a feature called “Interactive Mode” for dashboards published to the server.
In Interactive Mode, you can “dynamically change data using parameters” or “click a chart to filter other charts.”
However, in Interactive Mode, data used in the charts included in the dashboard must be loaded to narrow down the data.
If that data involves joining other data frames or other time-consuming processes, starting and operating Interactive Mode will take time.
The reason is that if steps are not “cached,” the processes are executed sequentially starting from the data source. This leads to delays if the original data is large or if heavy processing is involved.
By caching steps, data is loaded from the point of the cache, shortening the processing time for steps and resulting in faster startup and operation of Interactive Mode.
For details on caching itself, please see this section.
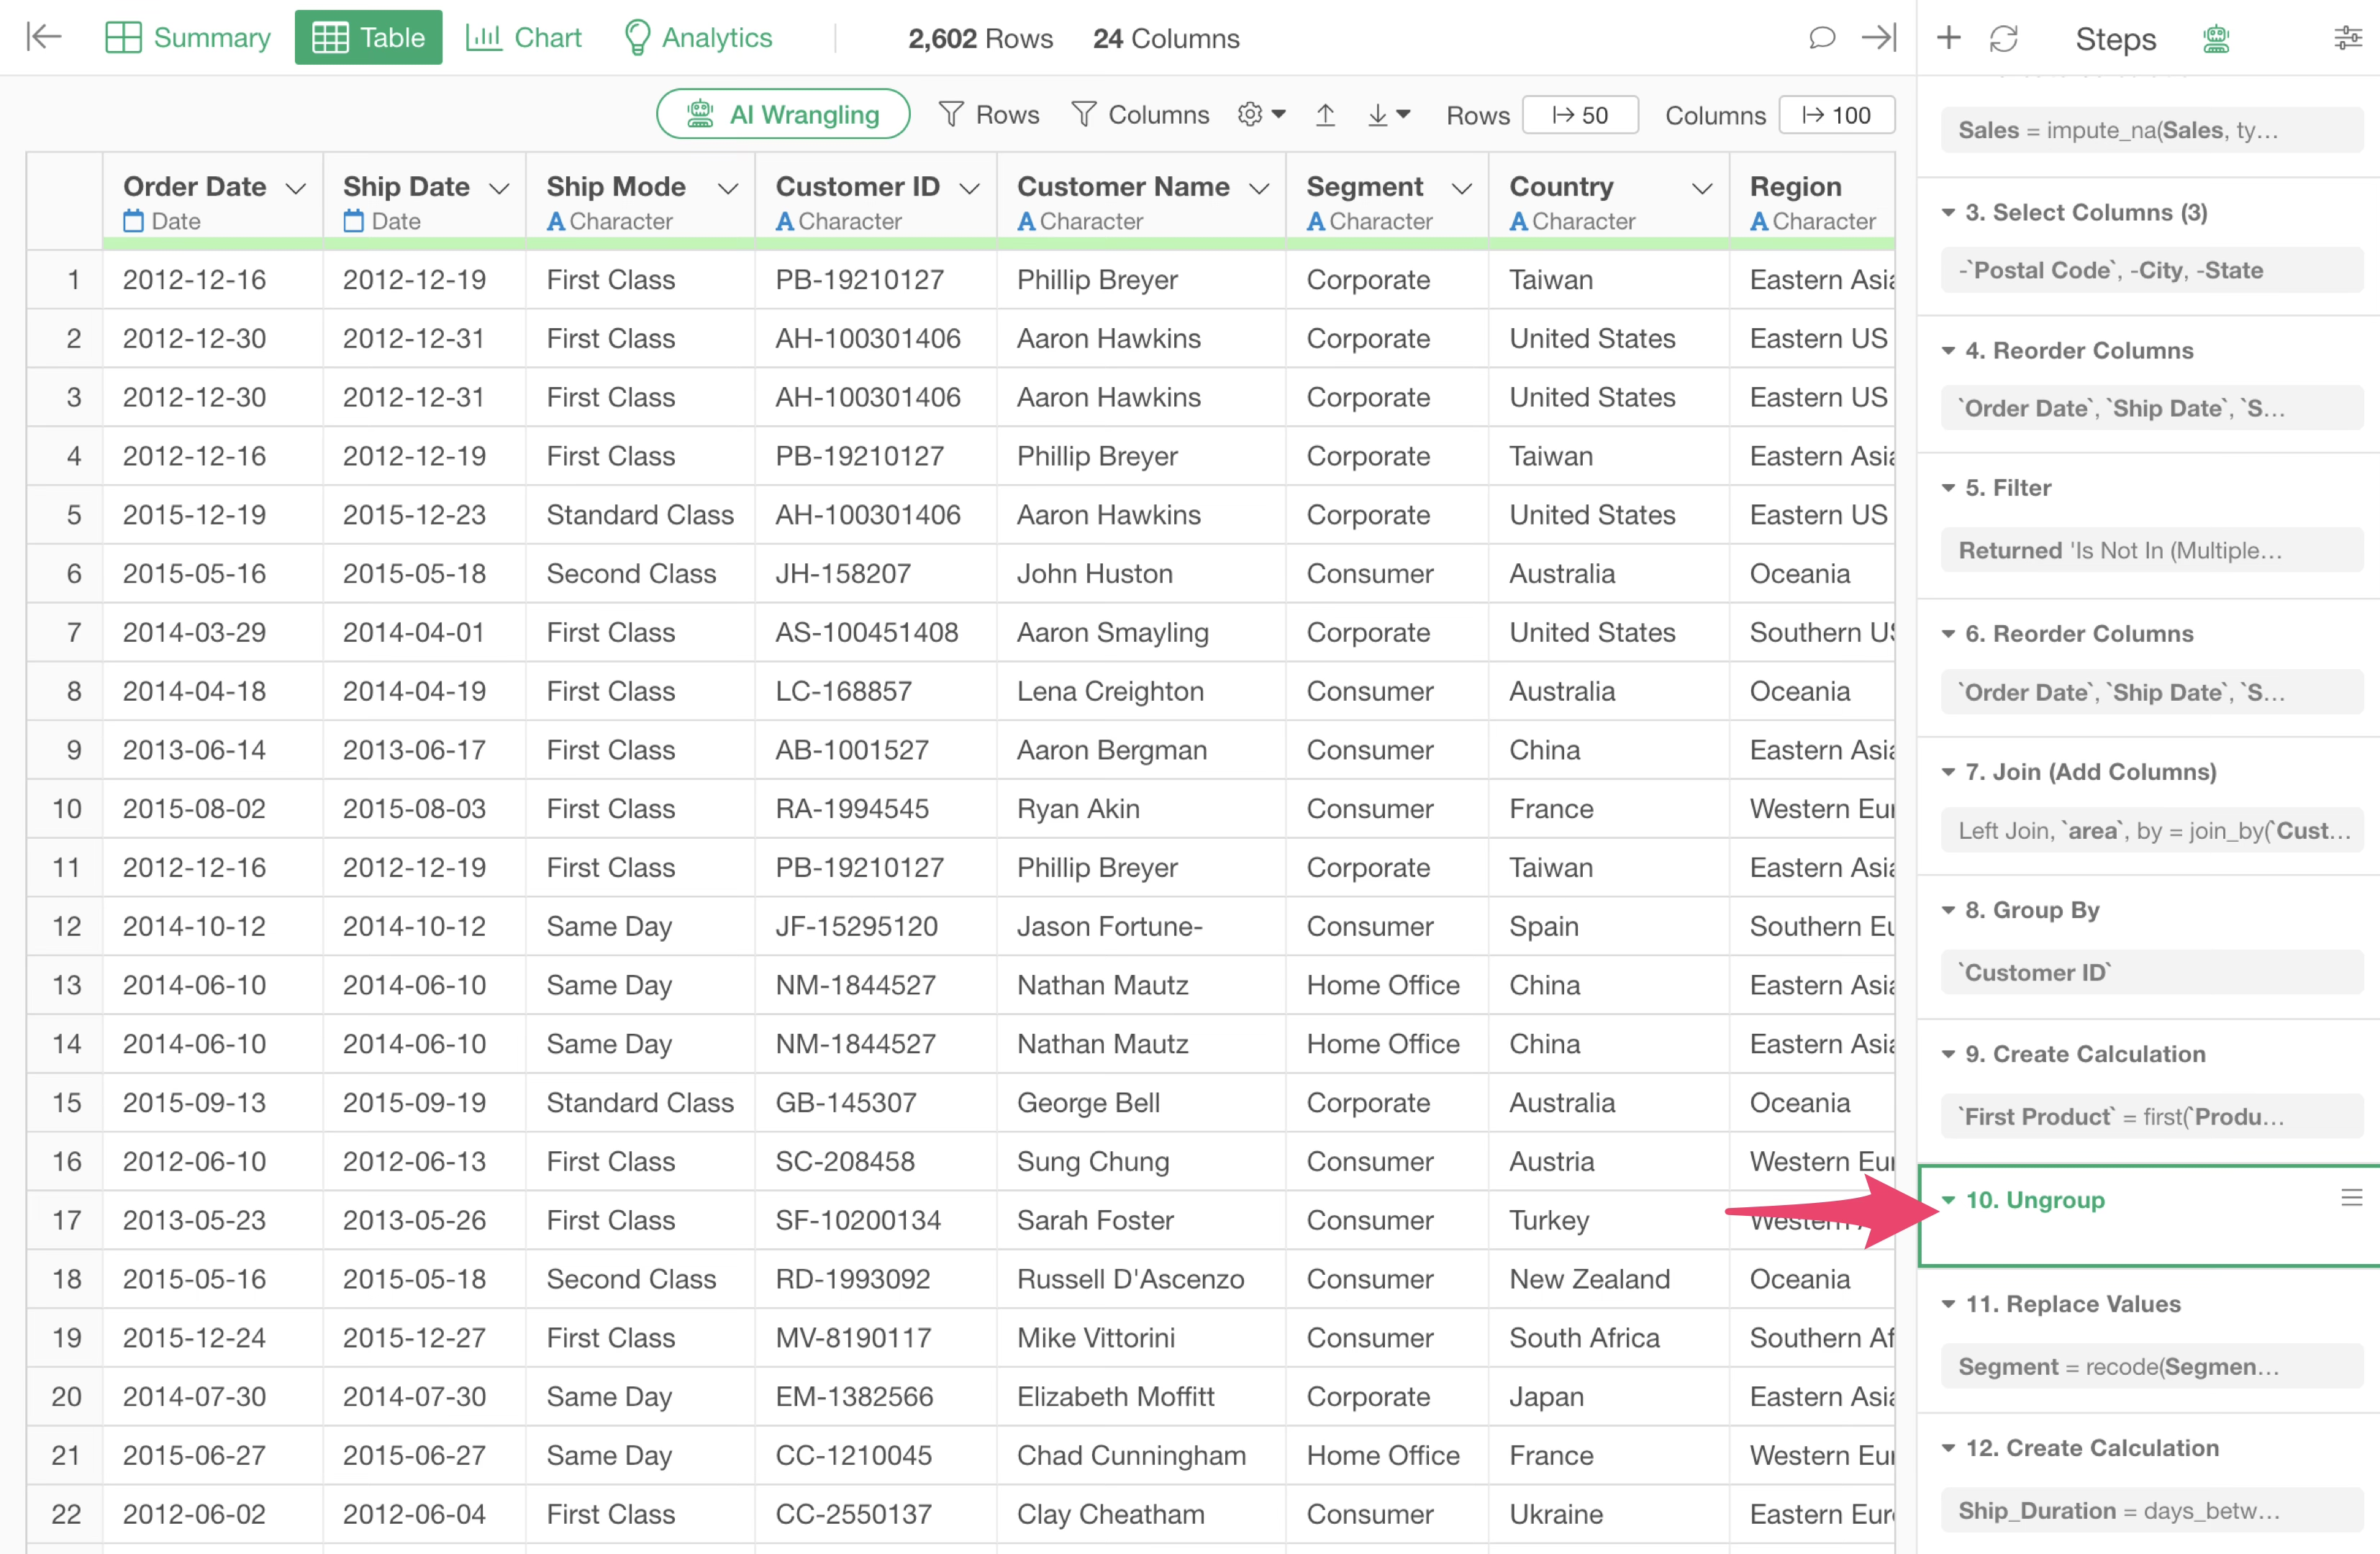
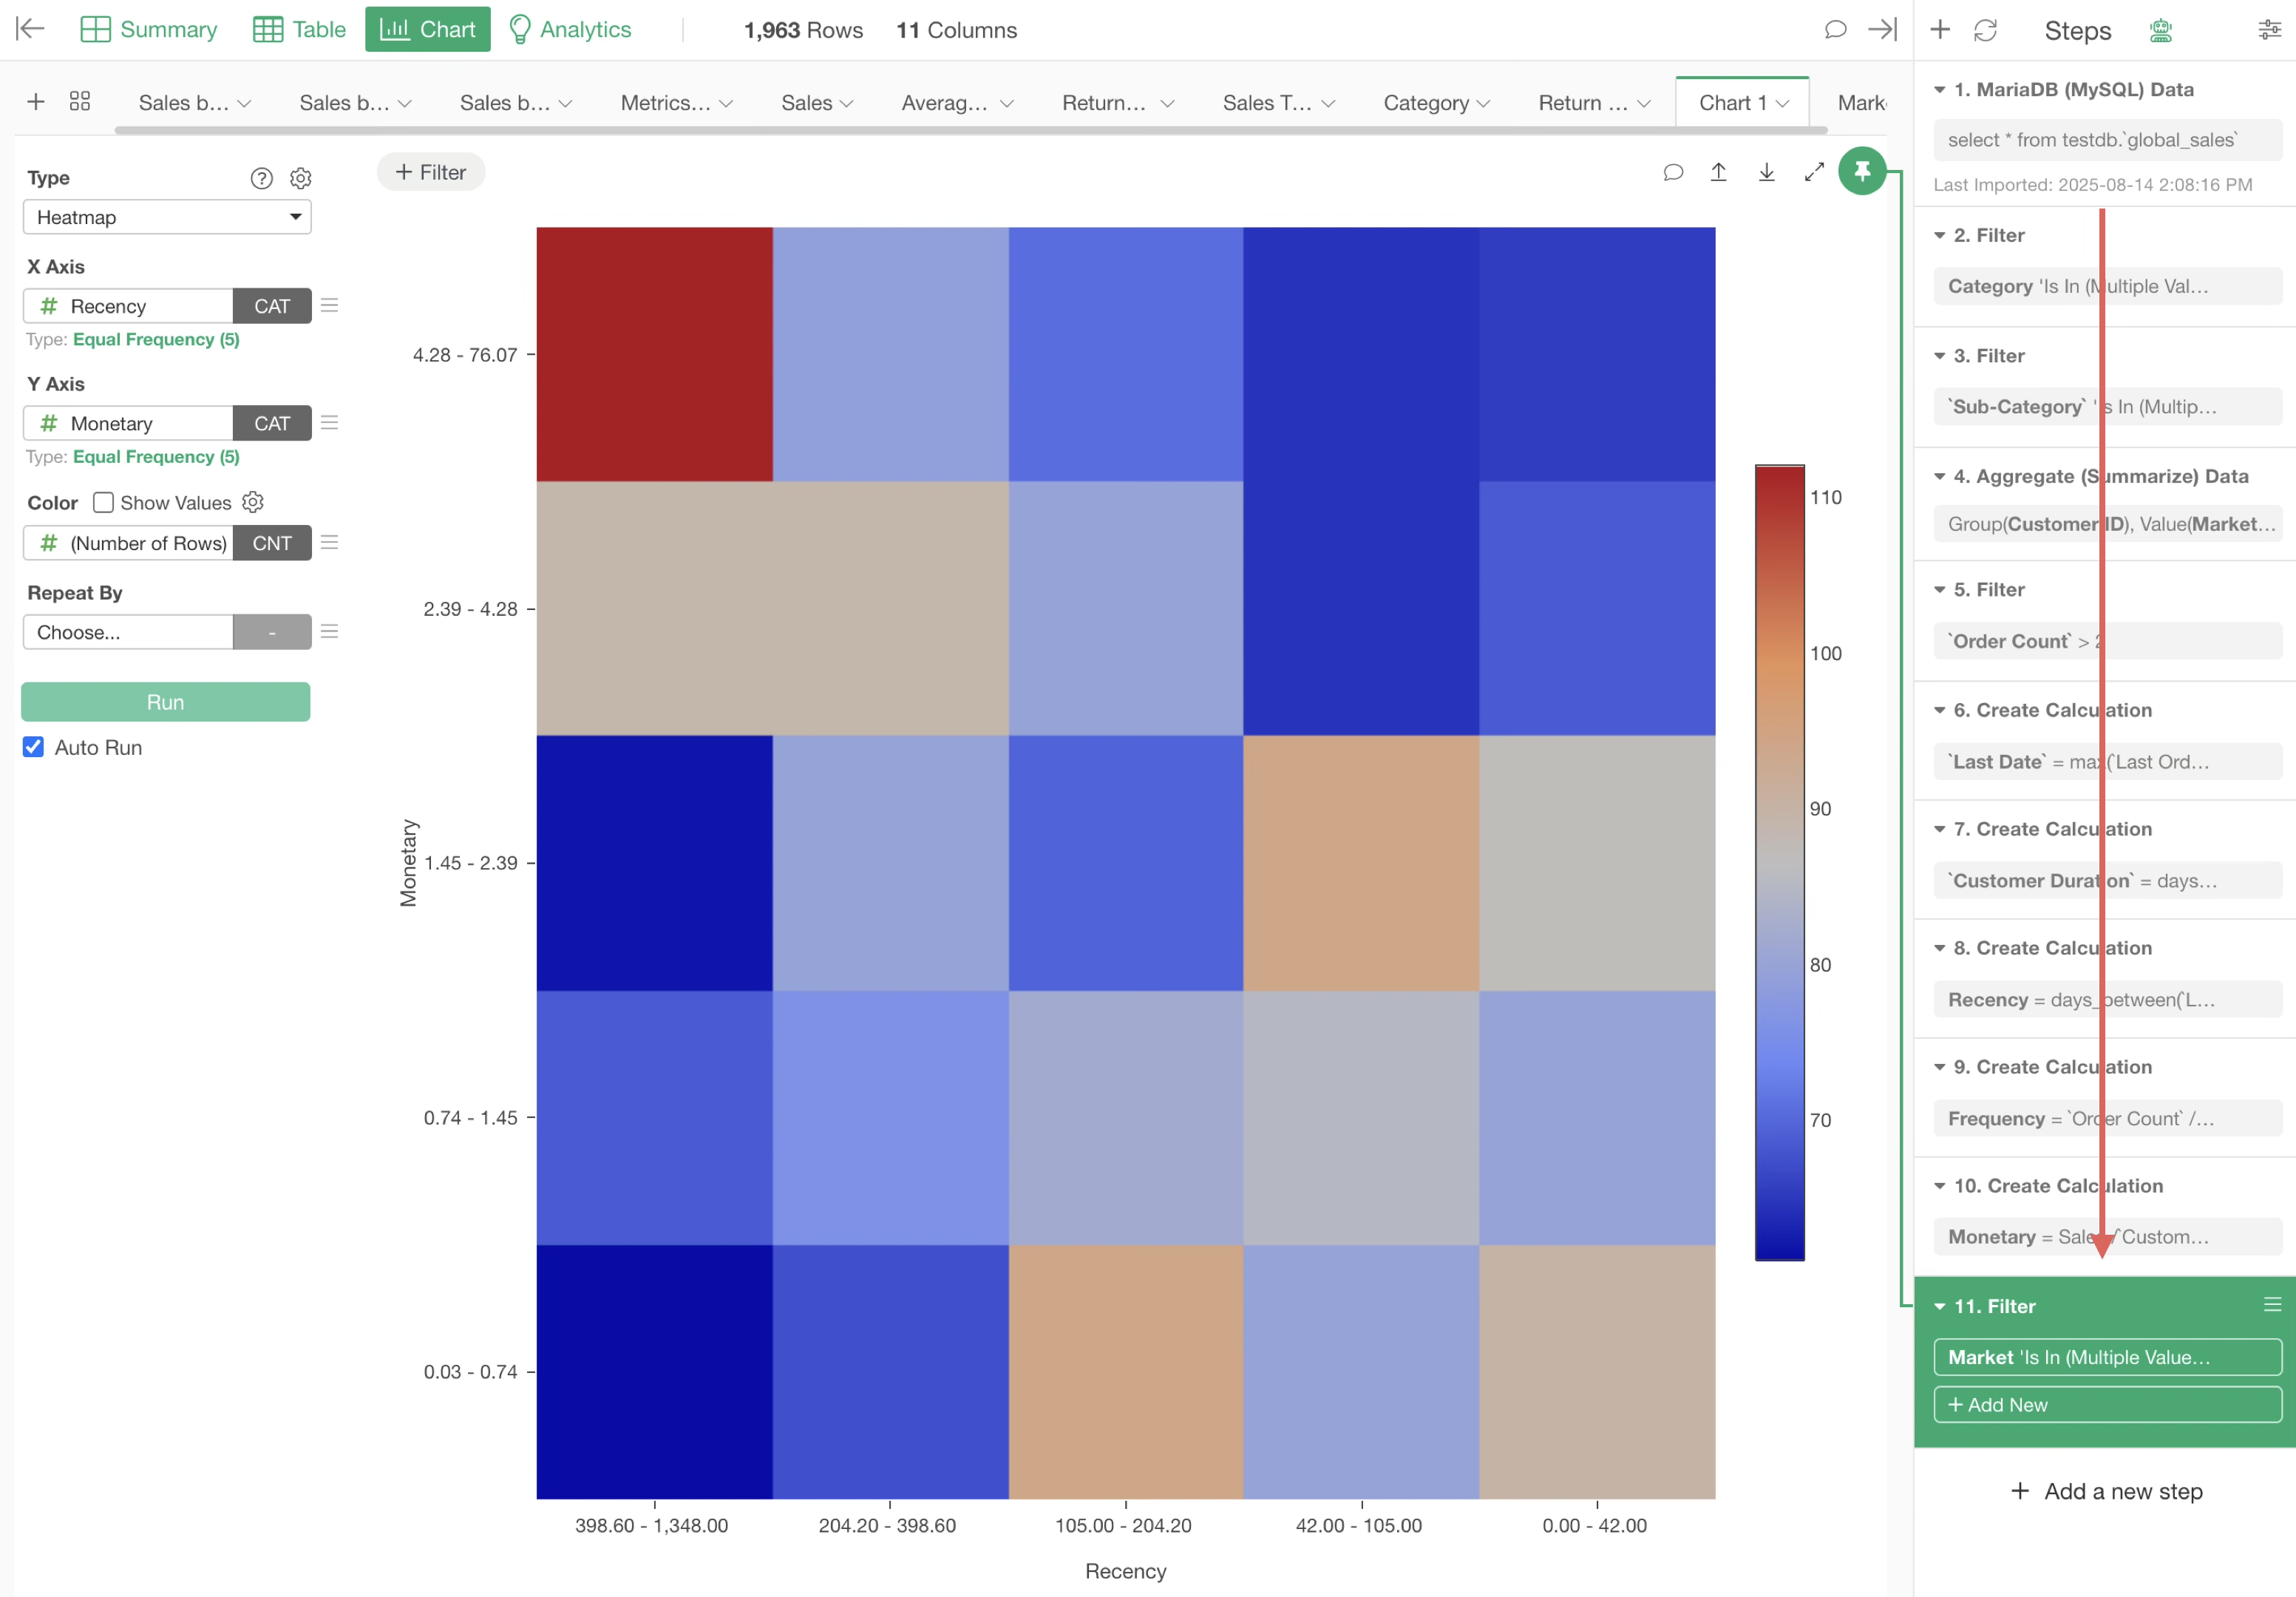
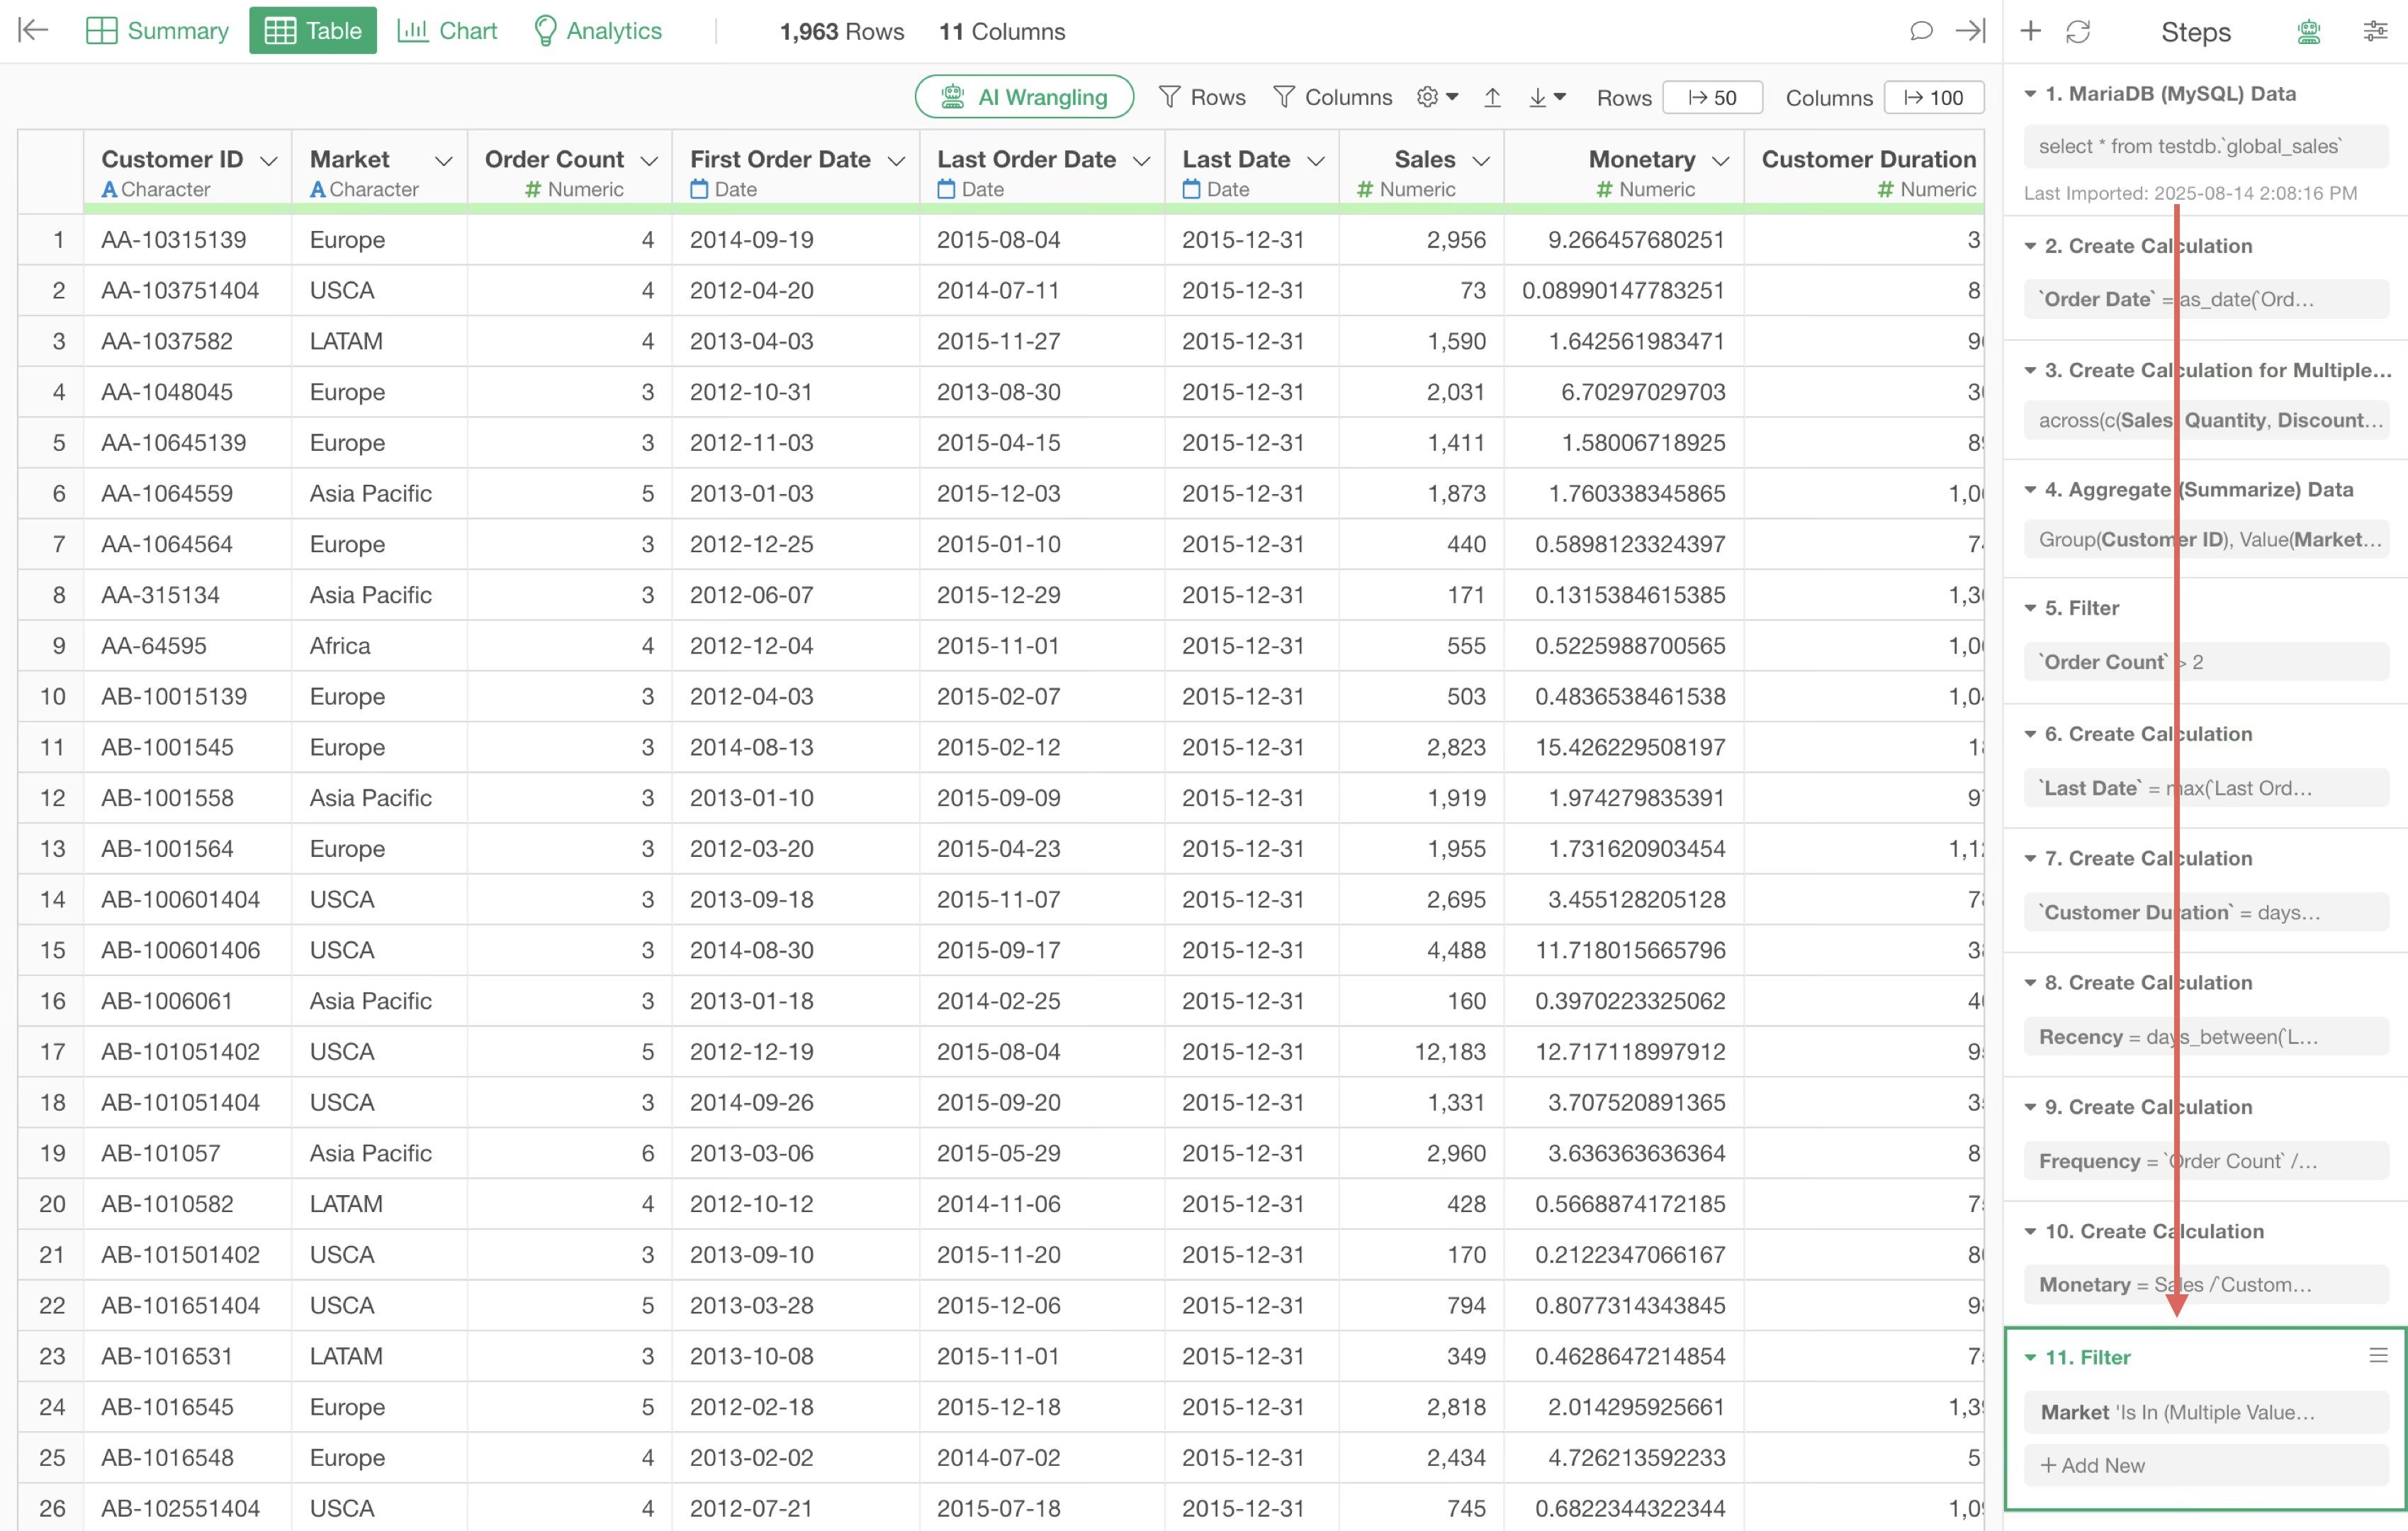
In the example below, since it is cached at the 10th step, data is loaded as of the 10th step, and only subsequent steps are processed.
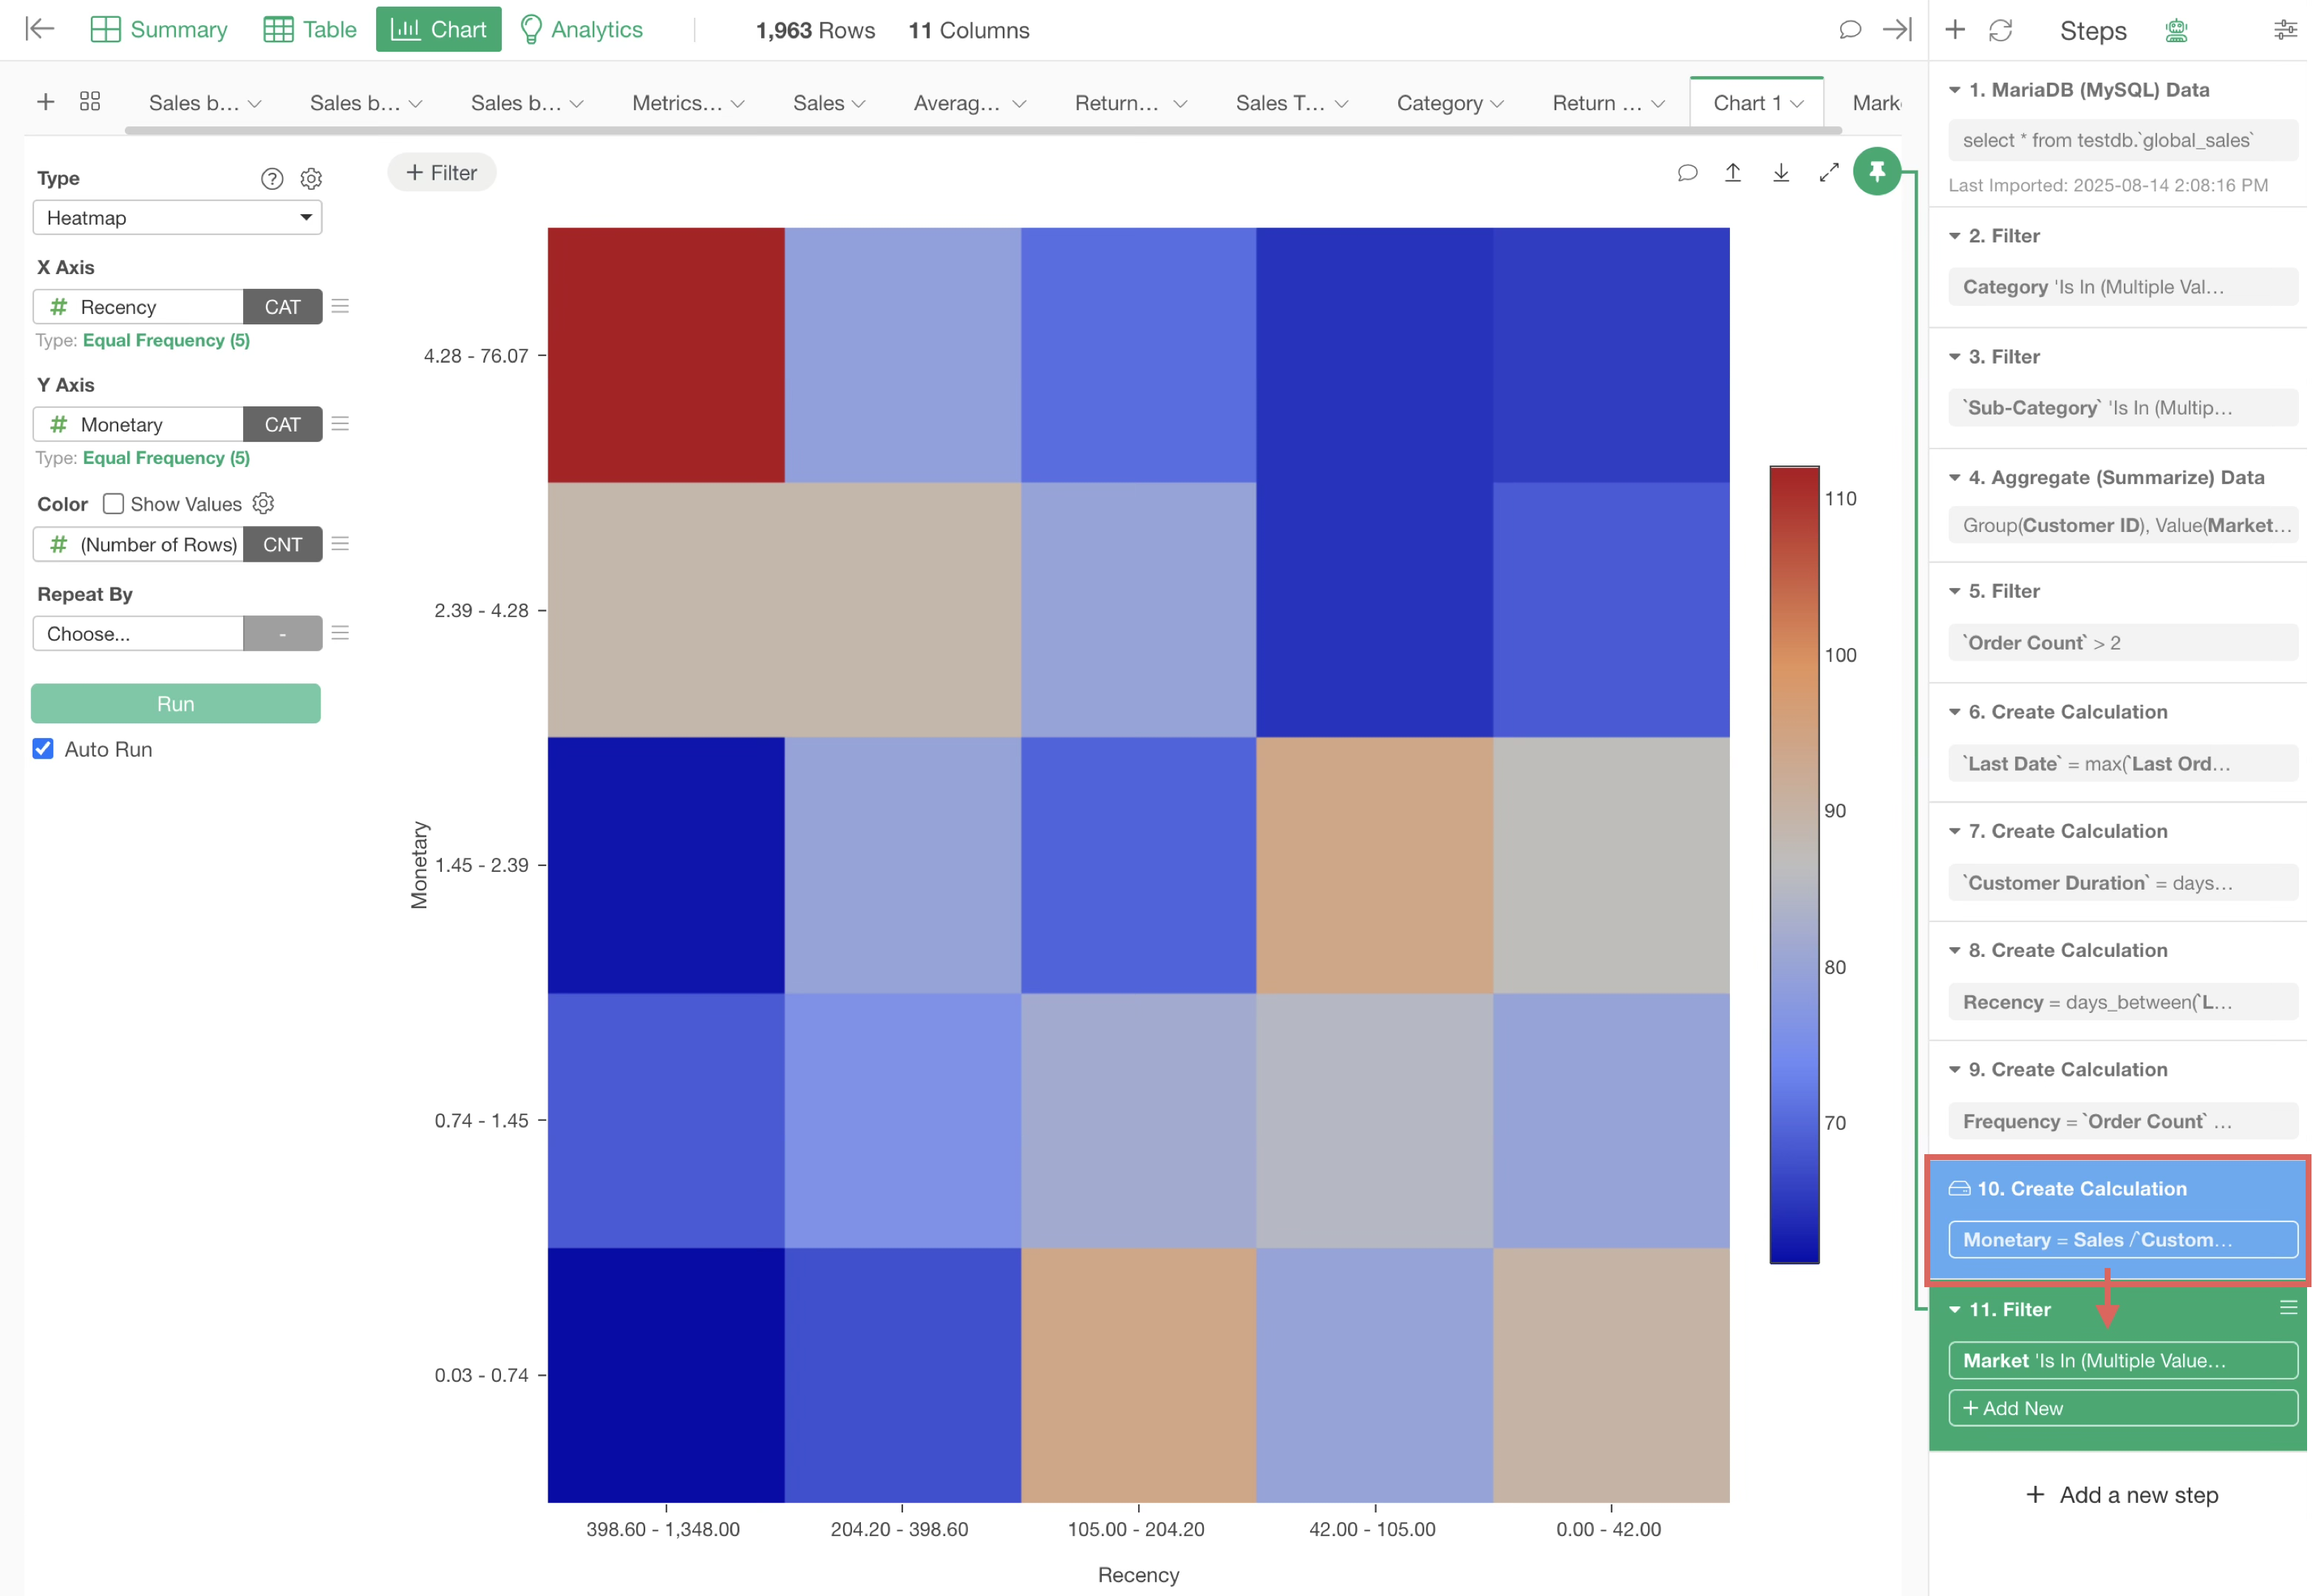
This means the processing for steps 2 through 10 is already completed, saving that processing time and improving Interactive Mode performance.
5. Parameters
If parameters are set for content published to the Exploratory server (dashboards, notes, etc.), anyone with permission to view that content can change the parameter values to filter data or dynamically change calculations.
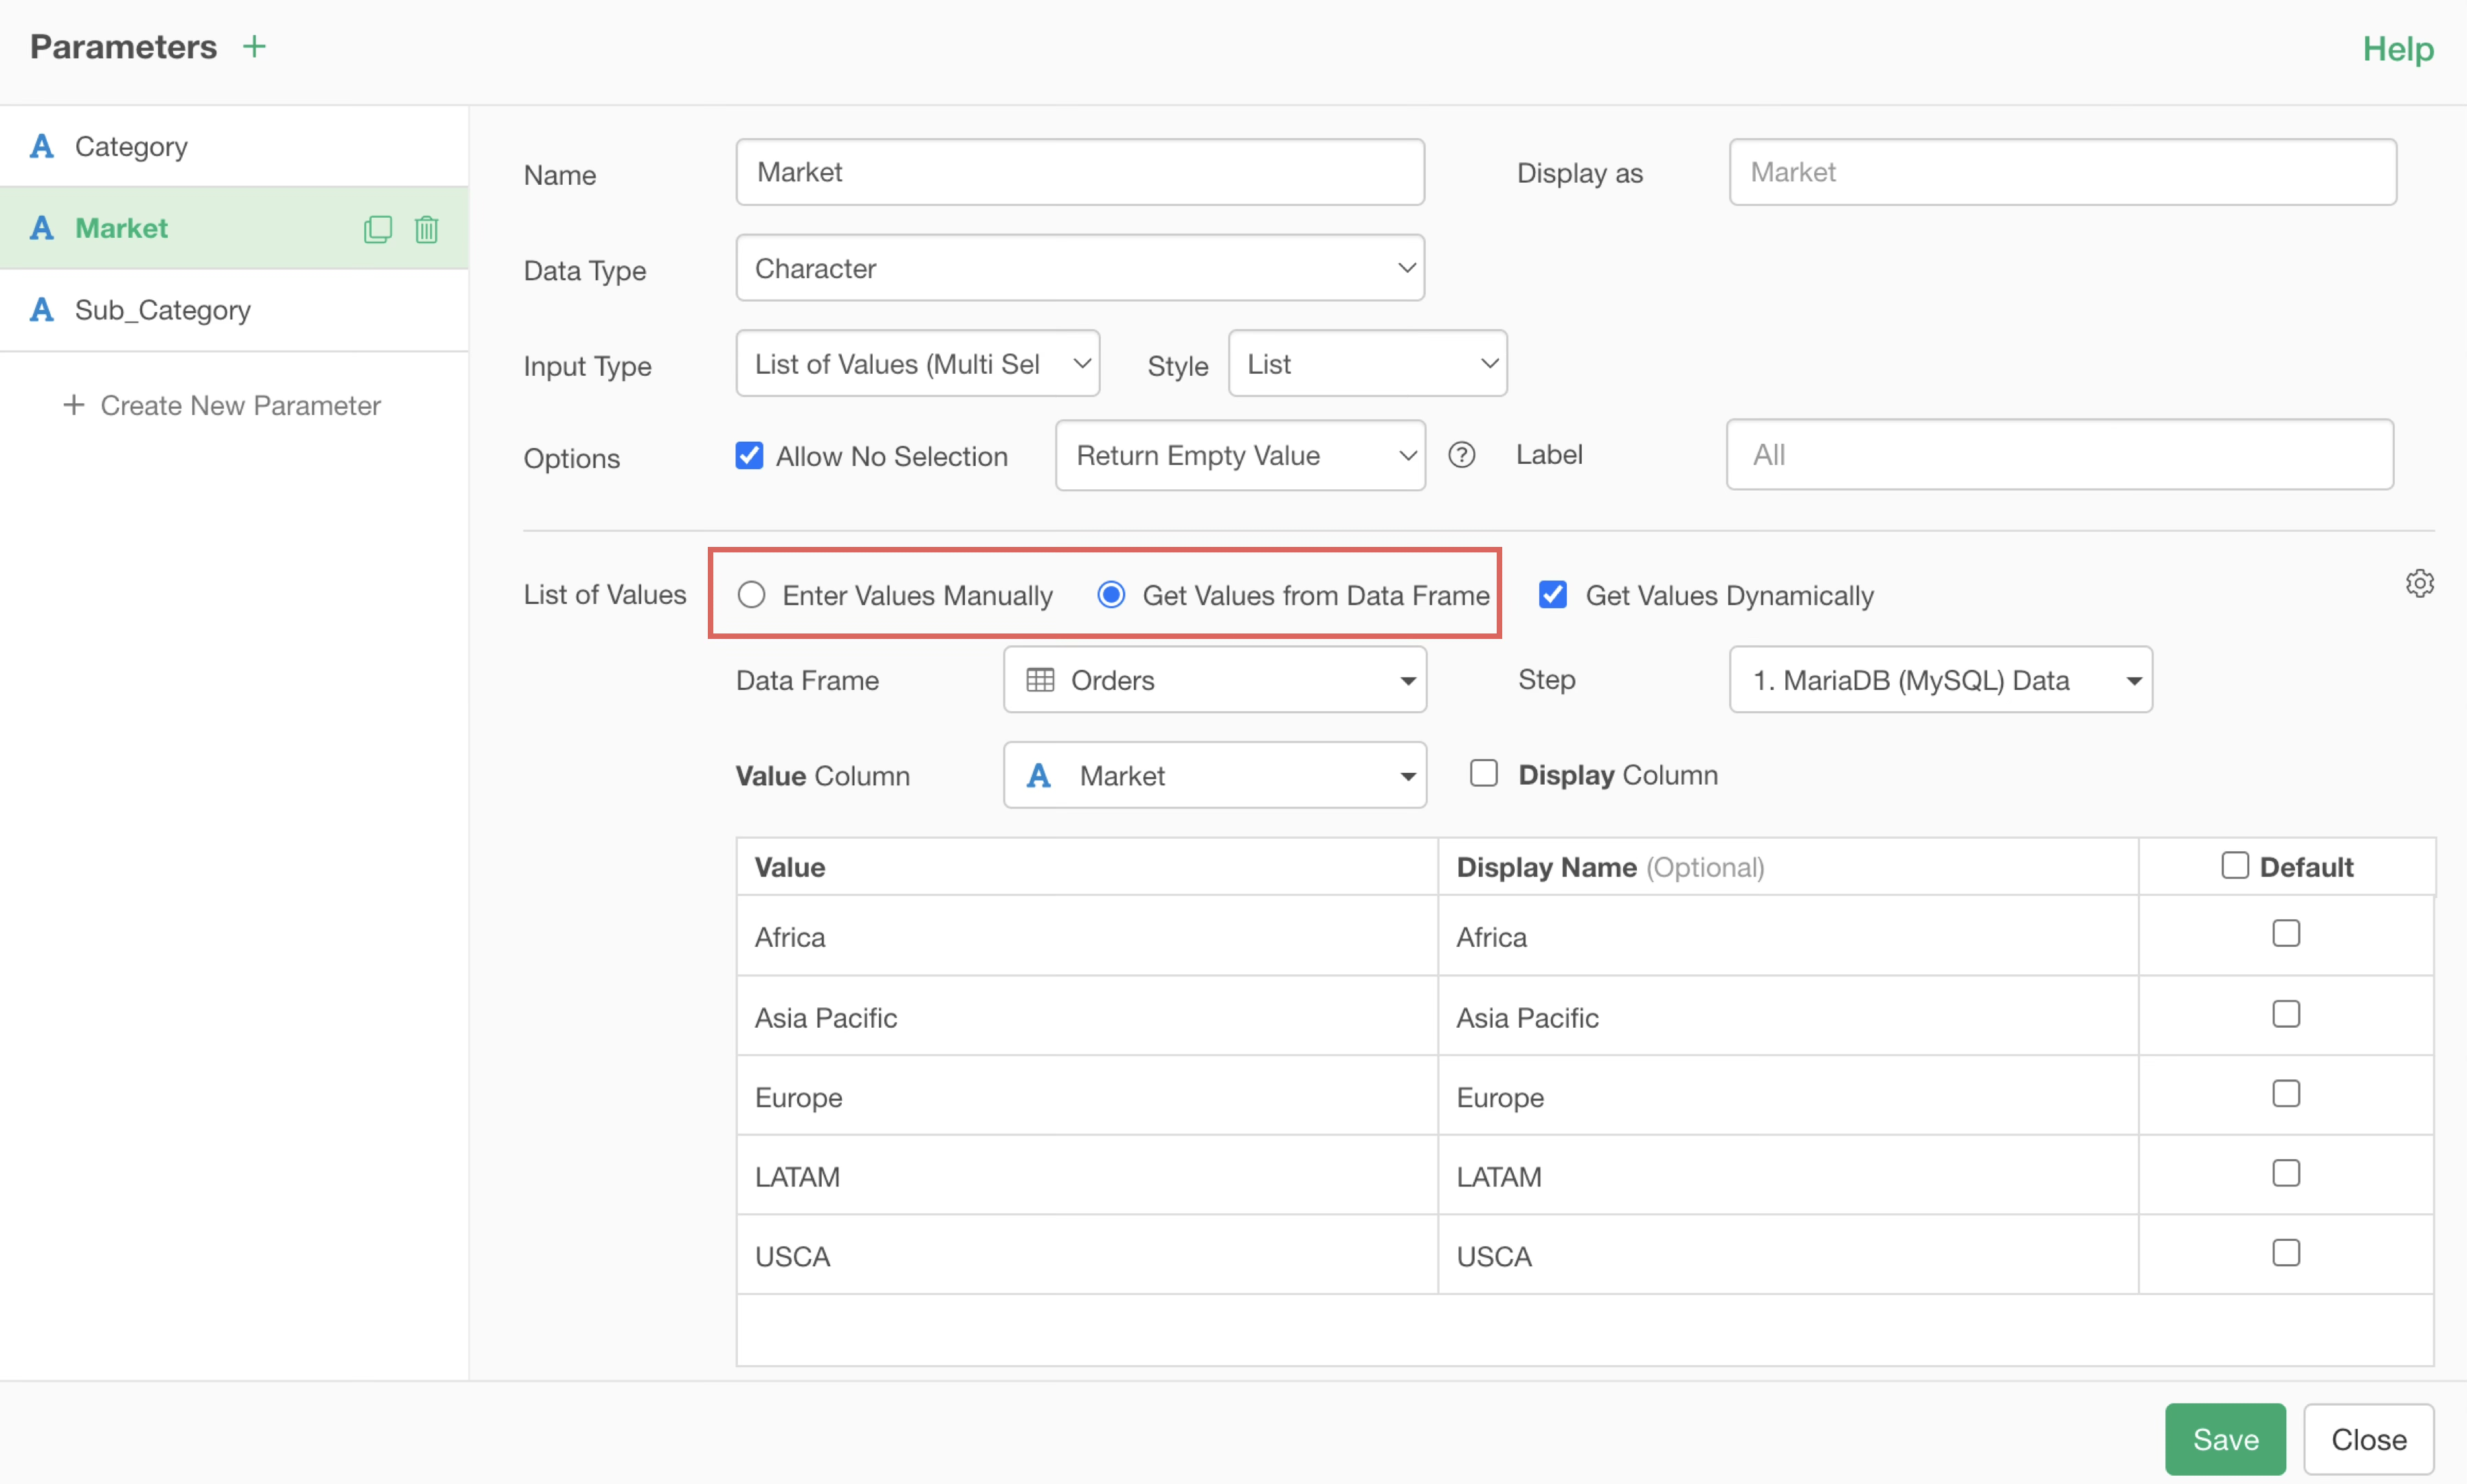
Information displayed as selectable values for parameters can be defined directly in the parameter settings screen or generated dynamically from a data frame.
When Interactive Mode is enabled to use parameters, it may take time to start.
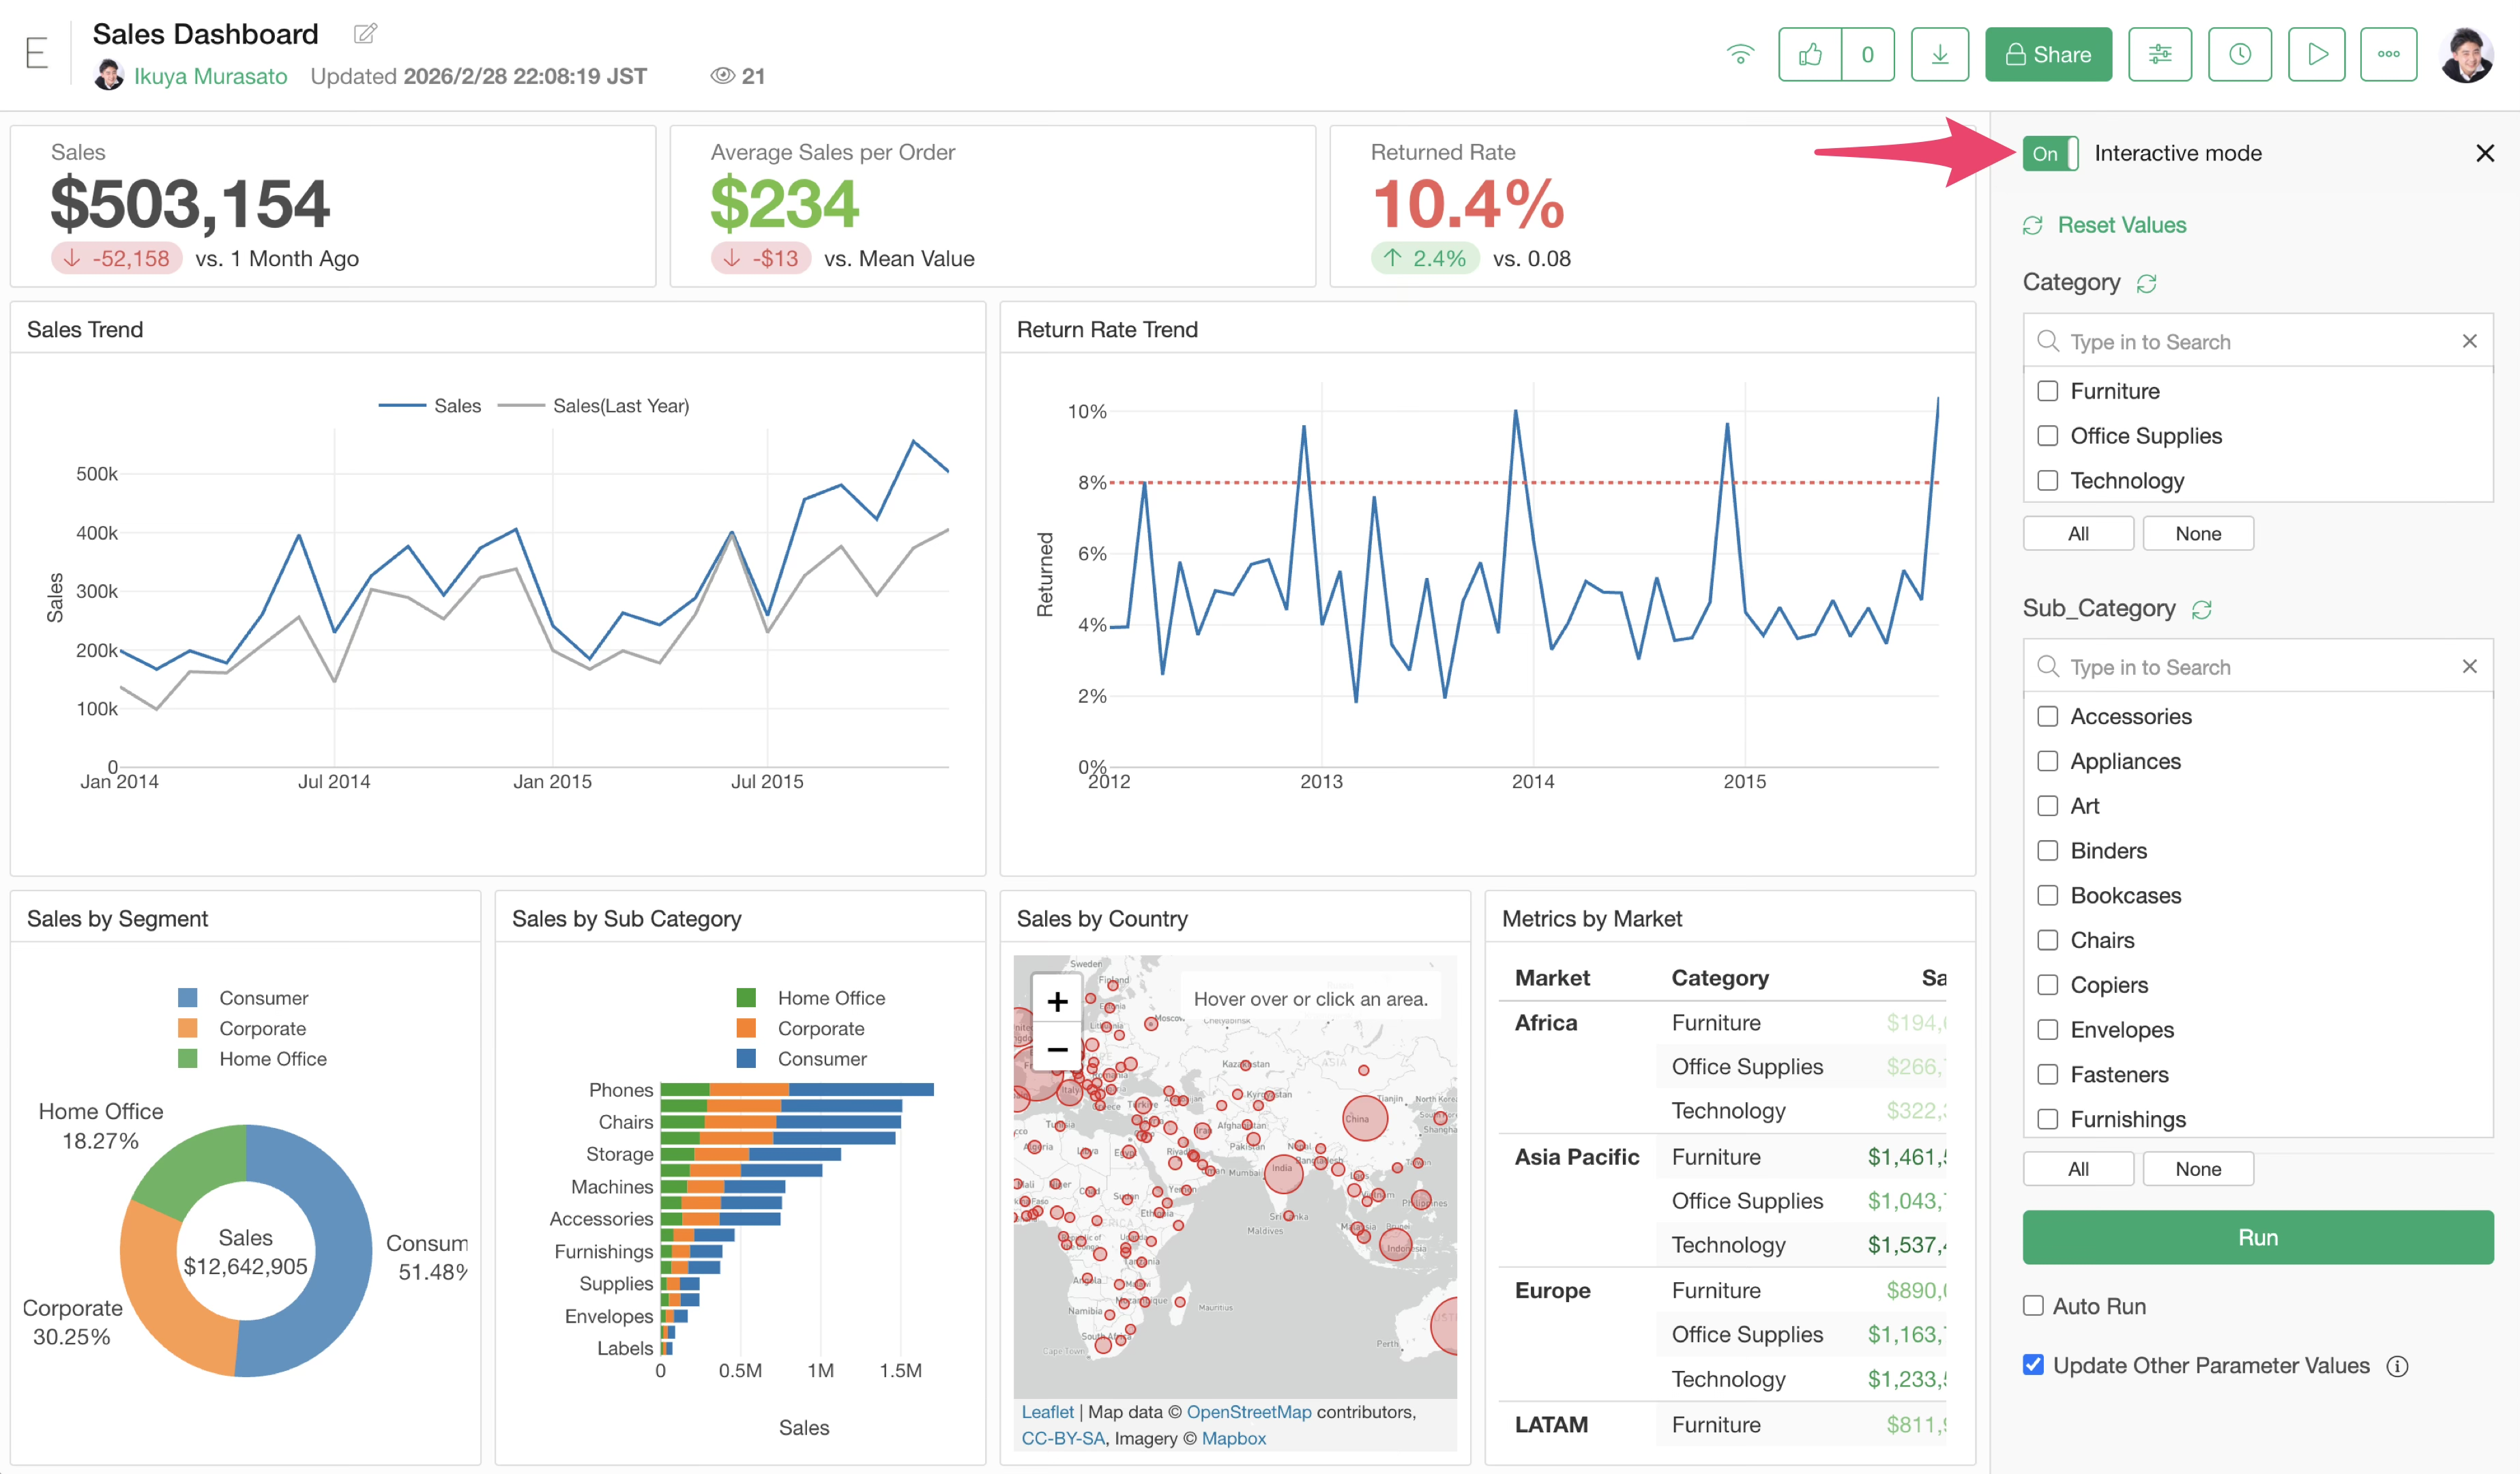
If the list of values is being generated dynamically, that may be one factor causing the delay in starting Interactive Mode.
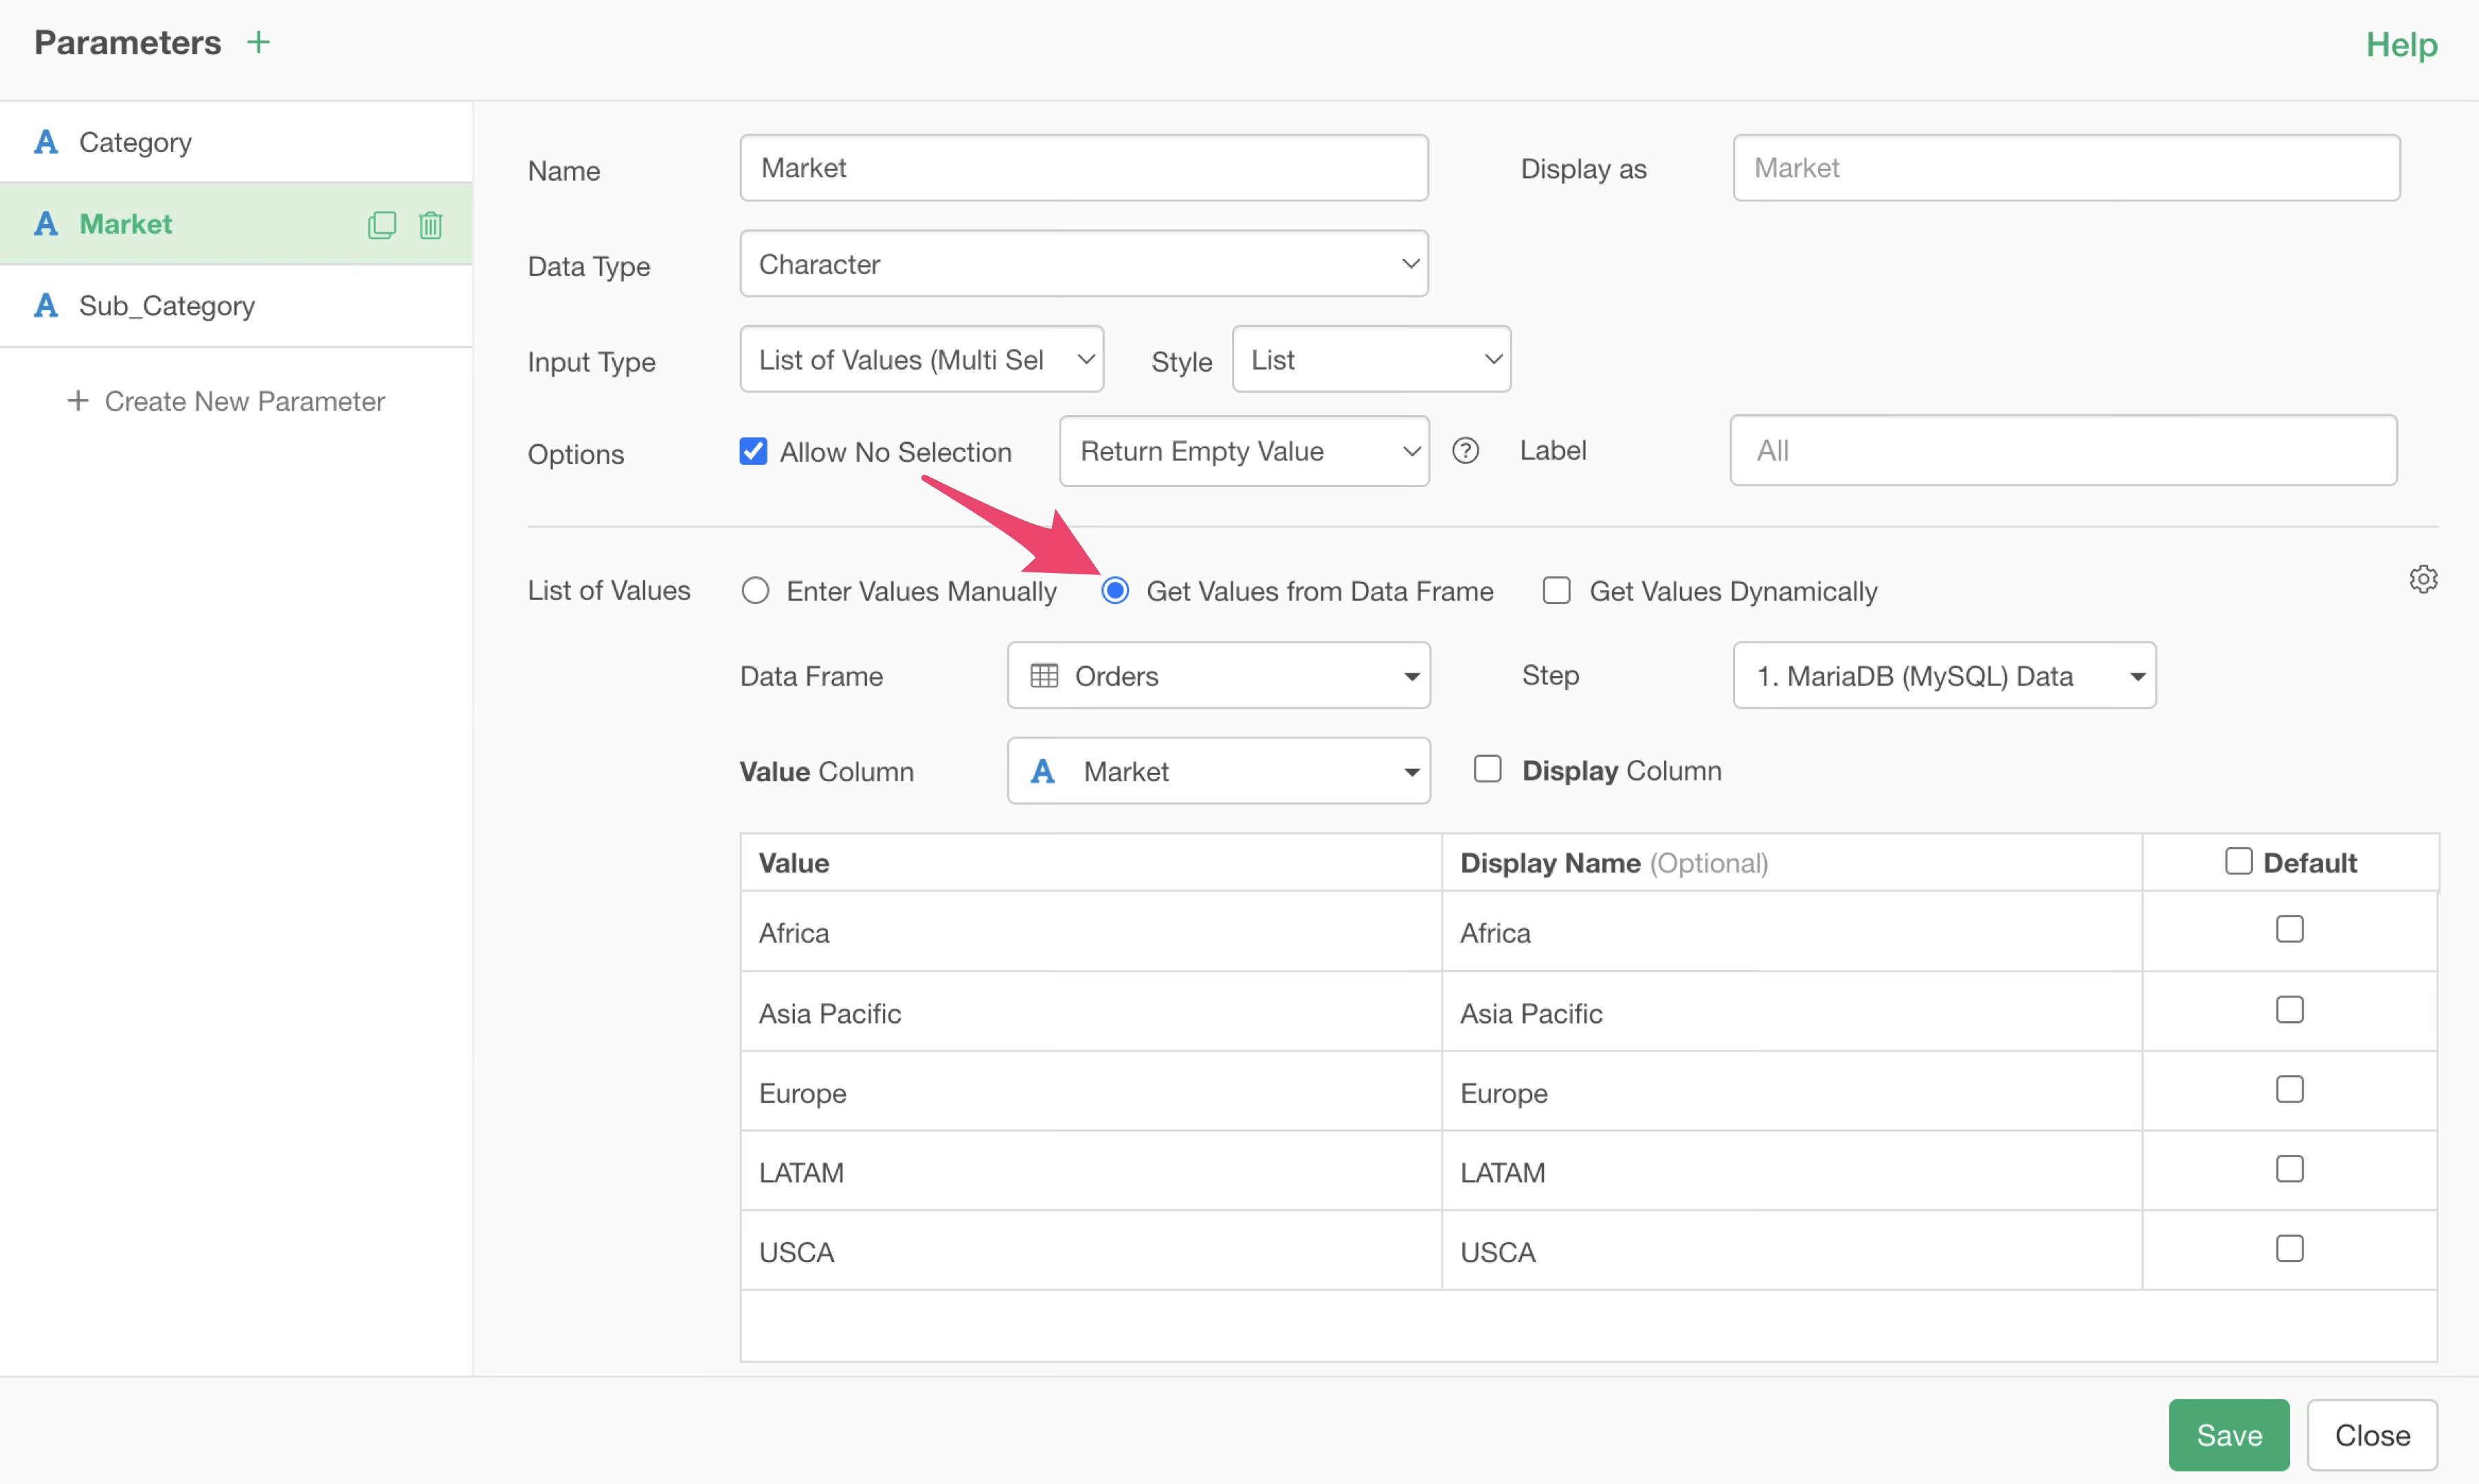
Therefore, if there is no need to dynamically update the list of parameter values, we recommend unchecking “Get Values Dynamically” in the parameter settings screen.
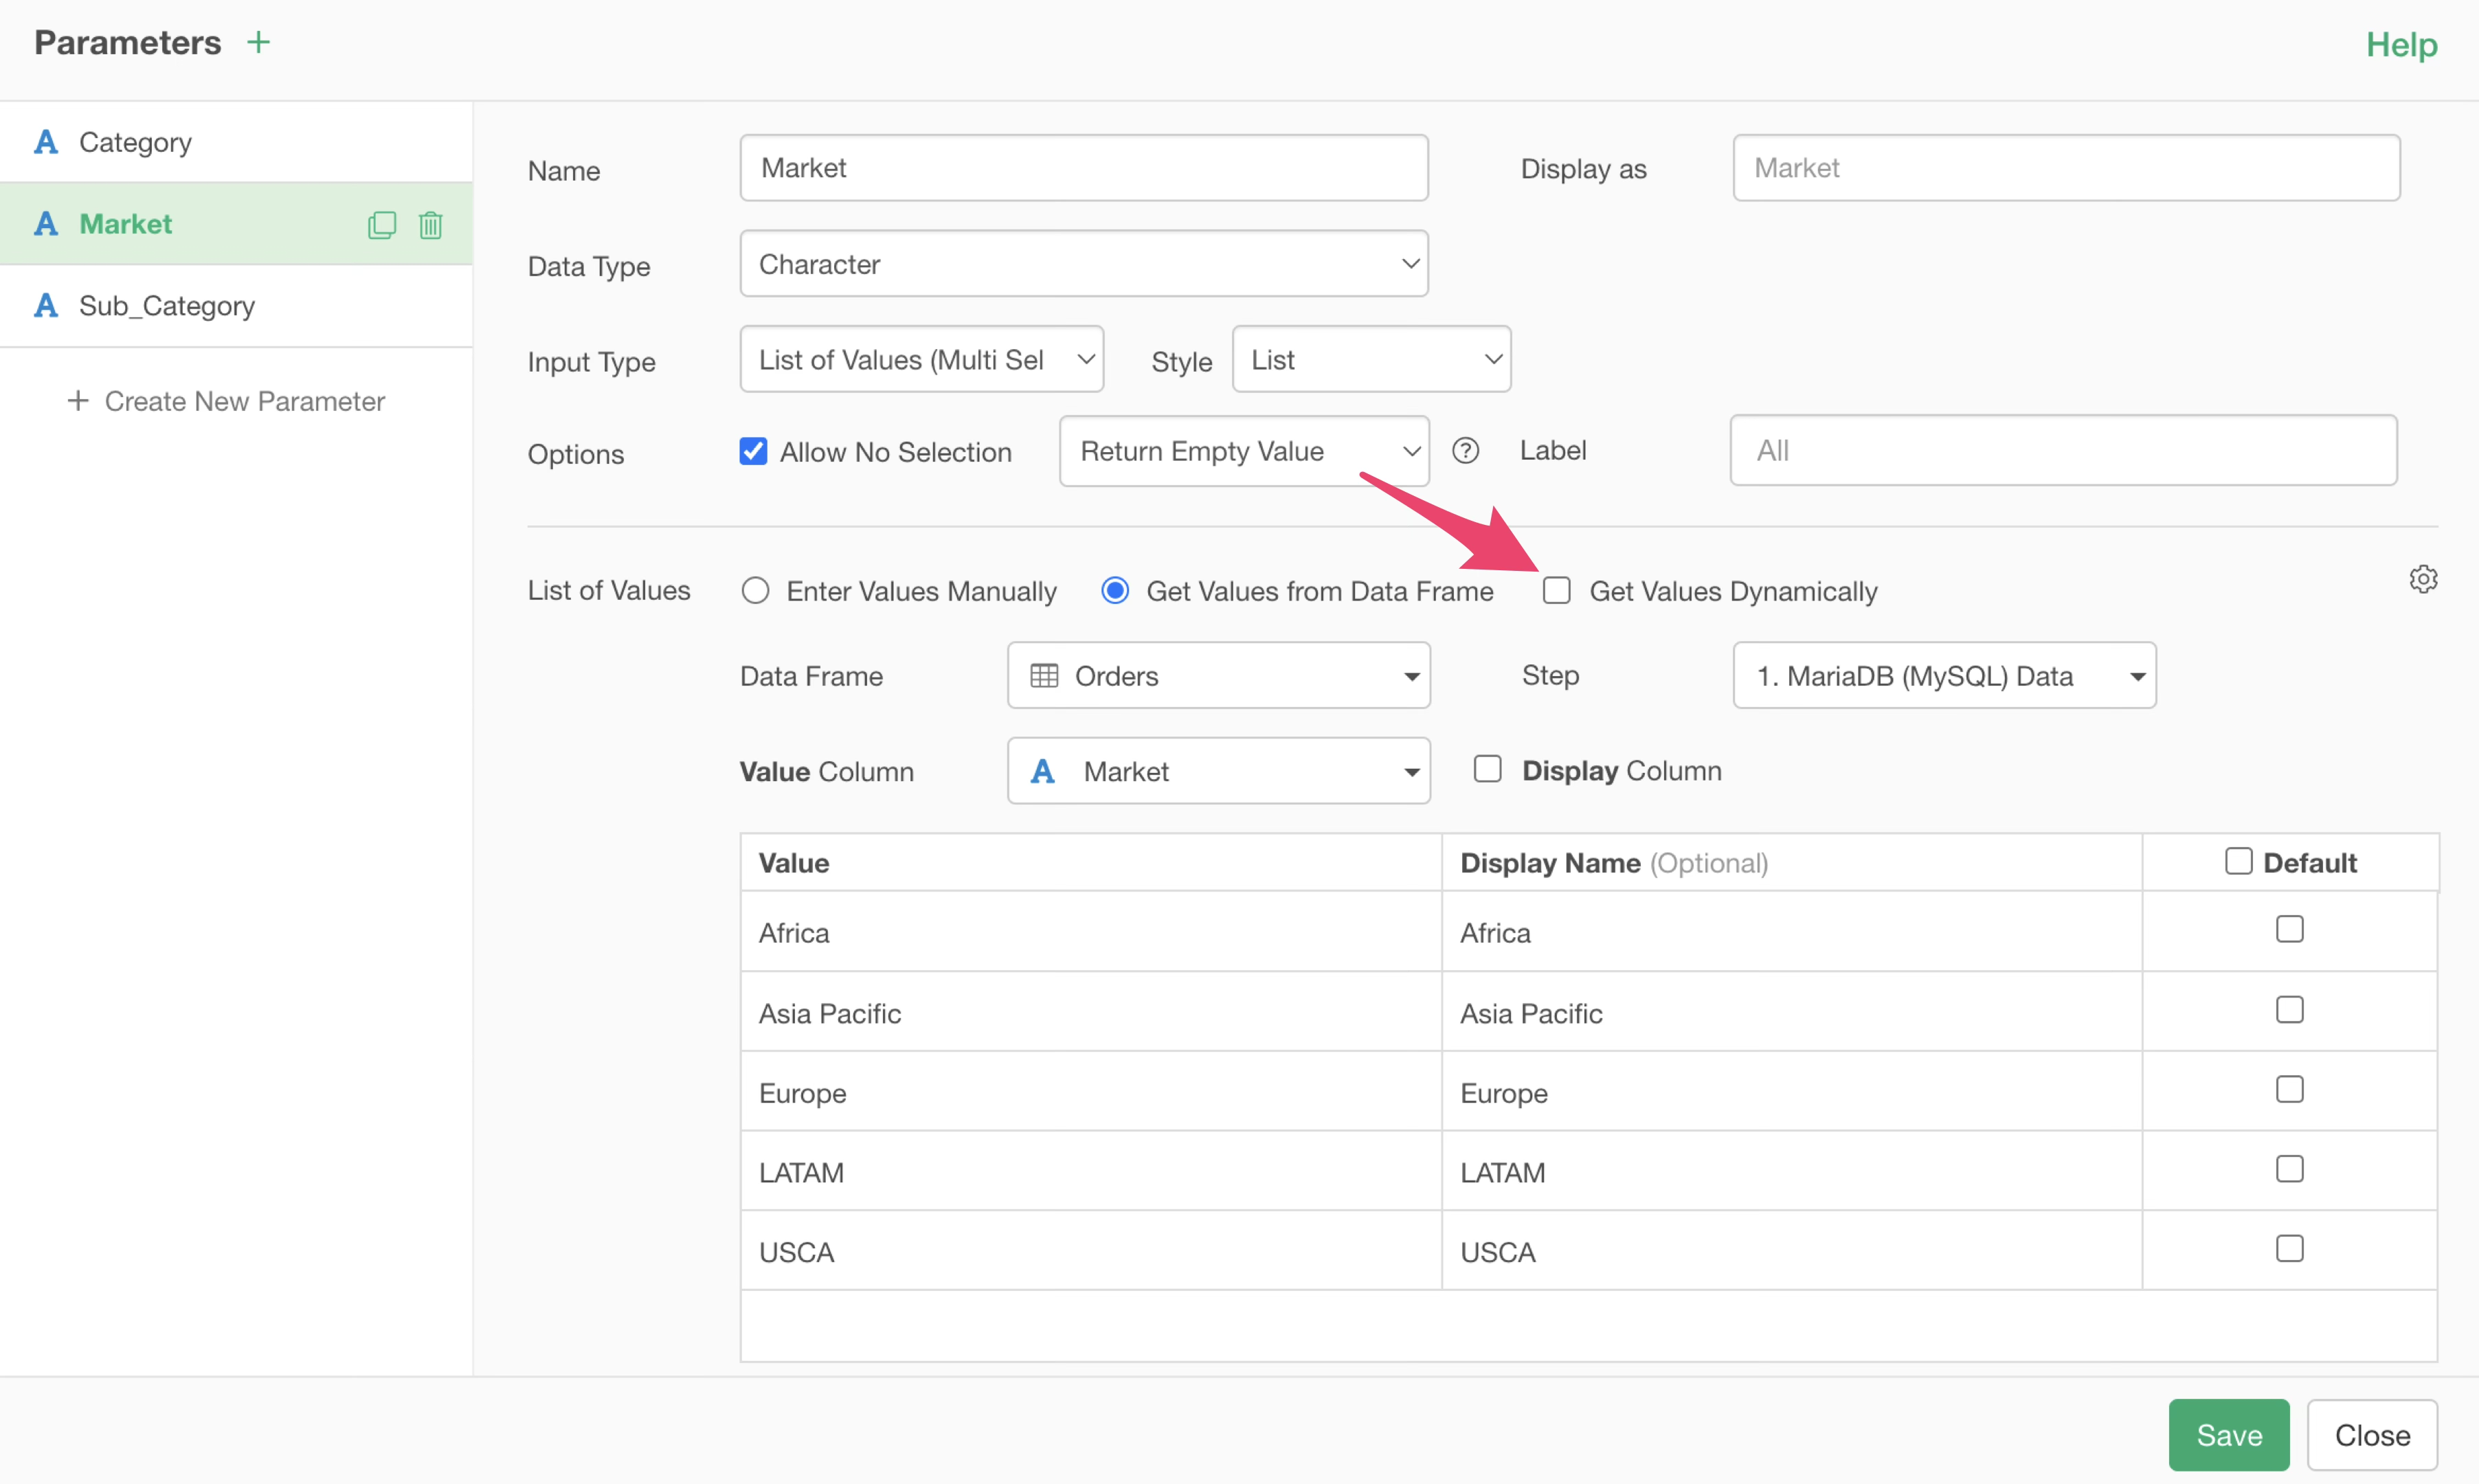
With this setting, the list of parameter values is cached and not generated dynamically every time. Using the cached list significantly shortens the time until Interactive Mode starts.
Note that if “Get Values Dynamically” is checked and the list of values is generated by referencing data from any step, the list of parameter values will be updated according to the content when the data is updated.
On the other hand, if “Get Values Dynamically” is unchecked, the cached list of values will be used even if the data is updated, so the list of parameter values will not be updated.
If you want to update the list of parameter values while “Get Values Dynamically” is unchecked, check “Get Values Dynamically” in the parameter settings screen of Exploratory Desktop, update the list, then uncheck it again and save the parameter.
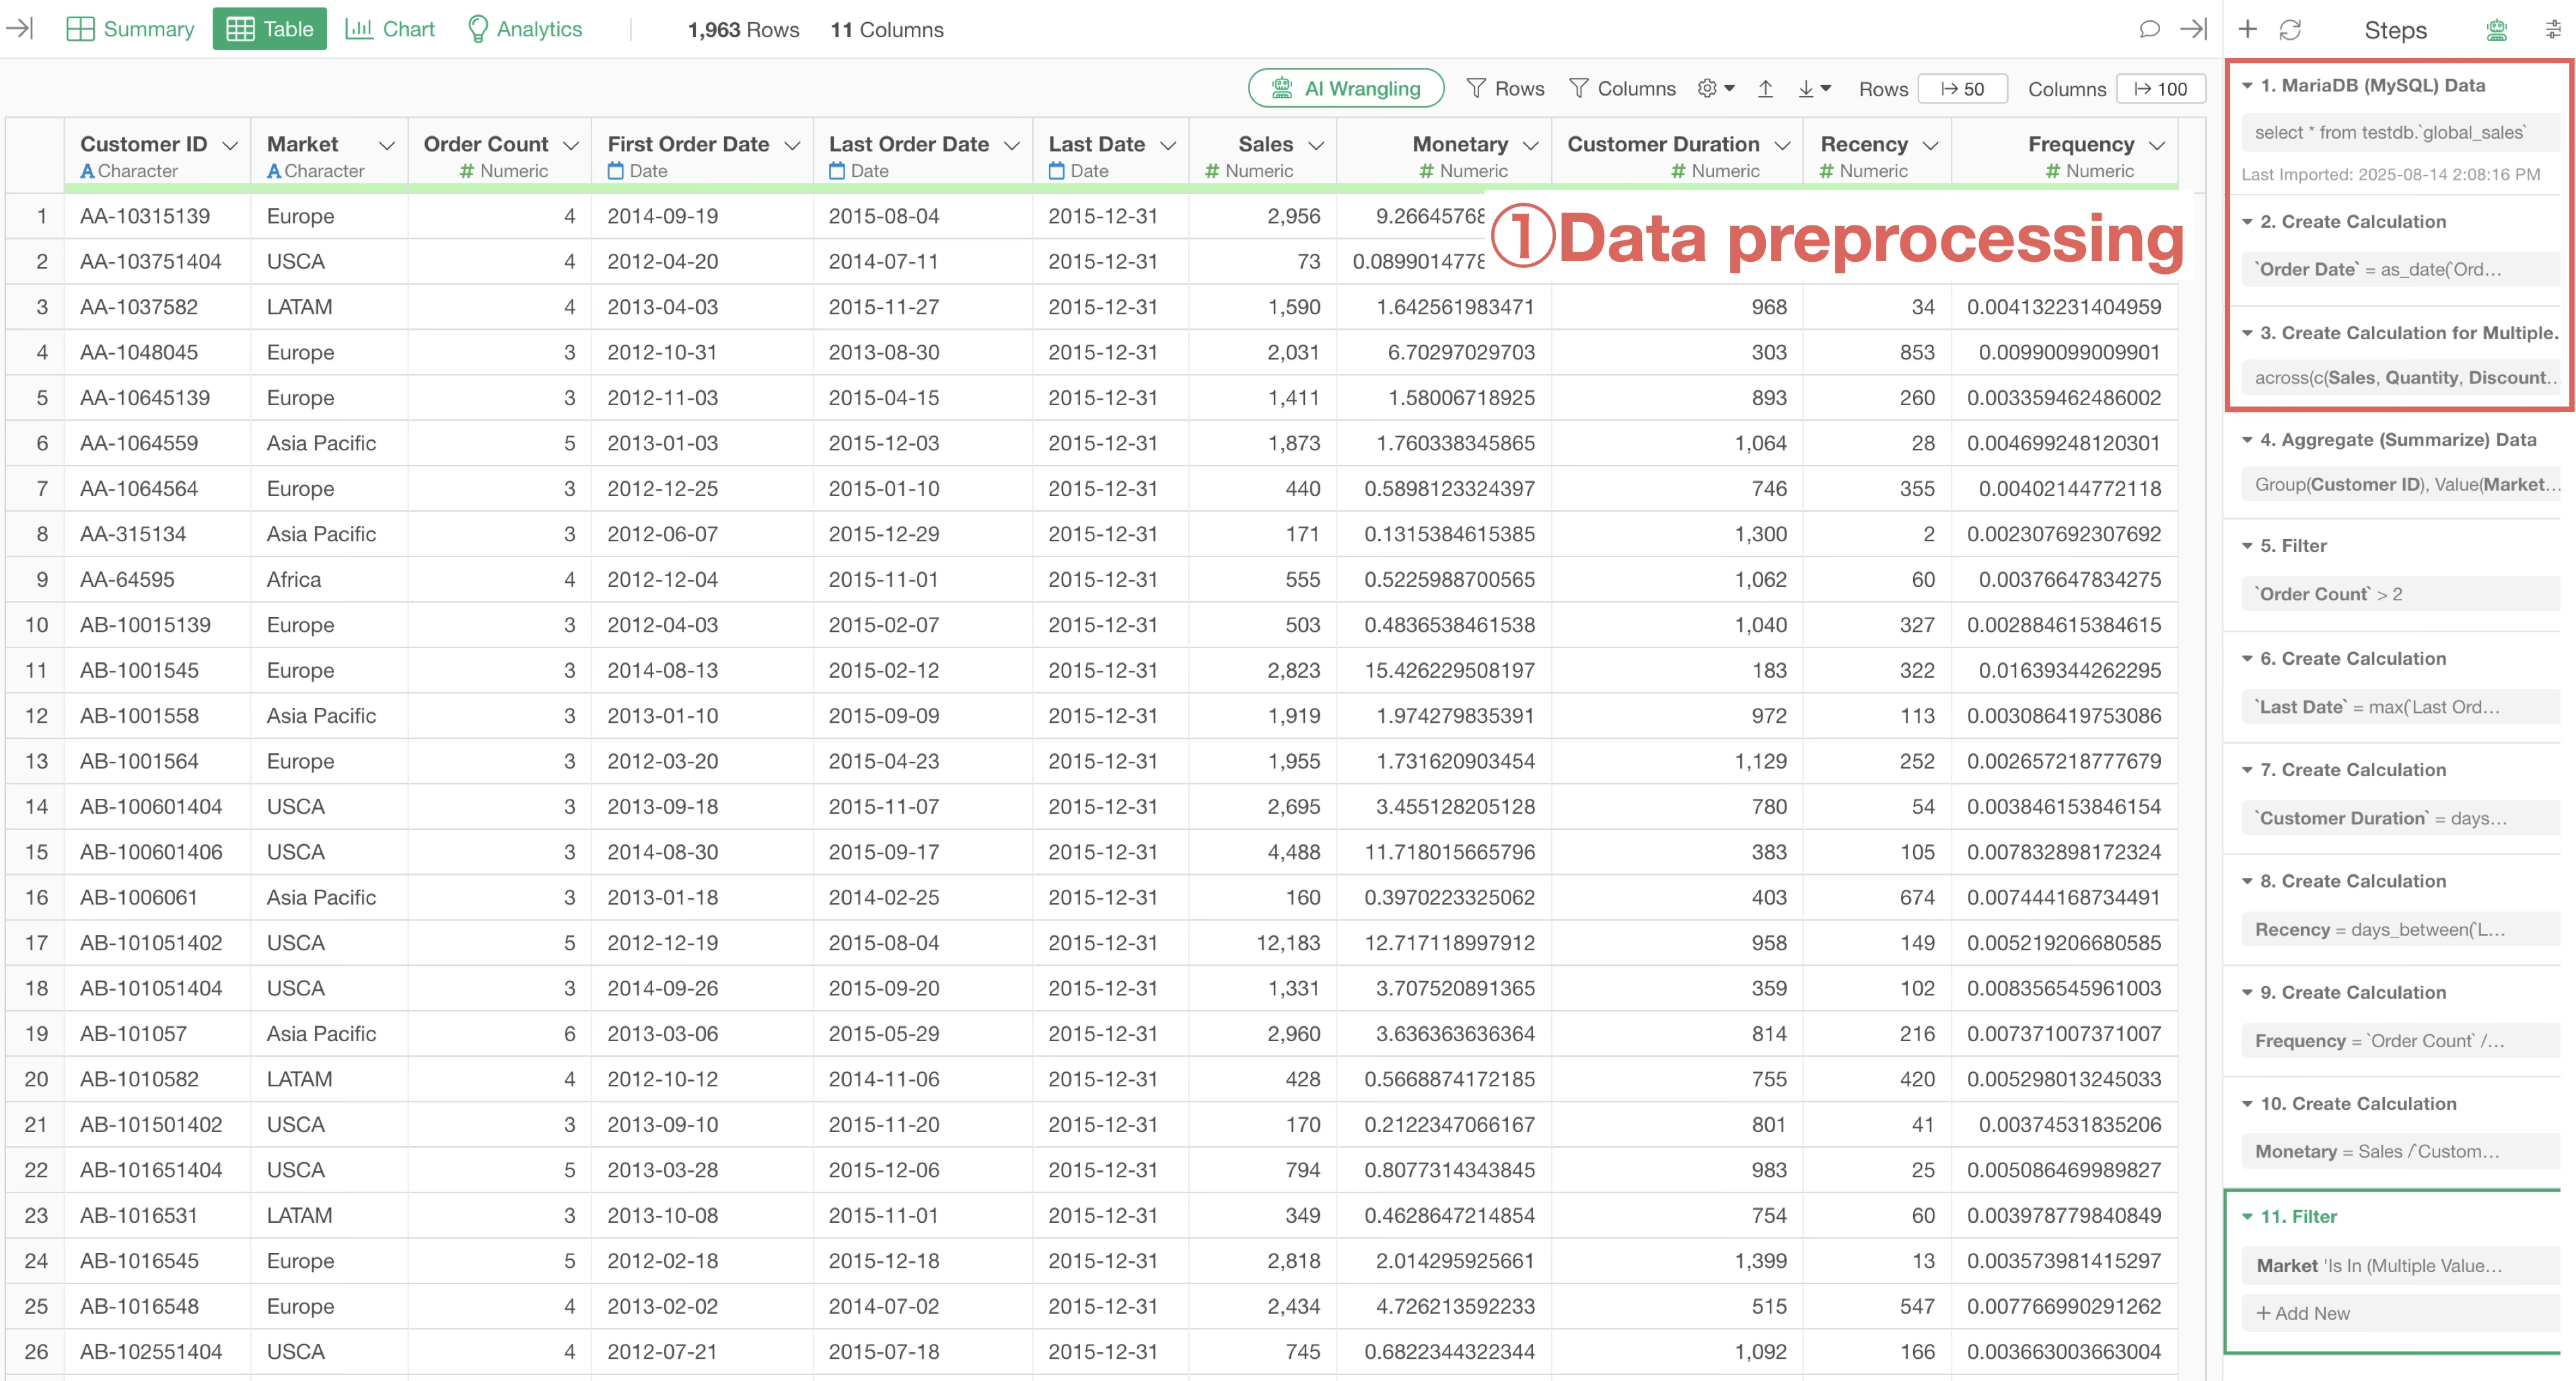
Order of Data Wrangling Processes (Efficiency)
In Exploratory, data wrangling (transformation/shaping) processes are managed as steps, and they are executed in order from top to bottom.
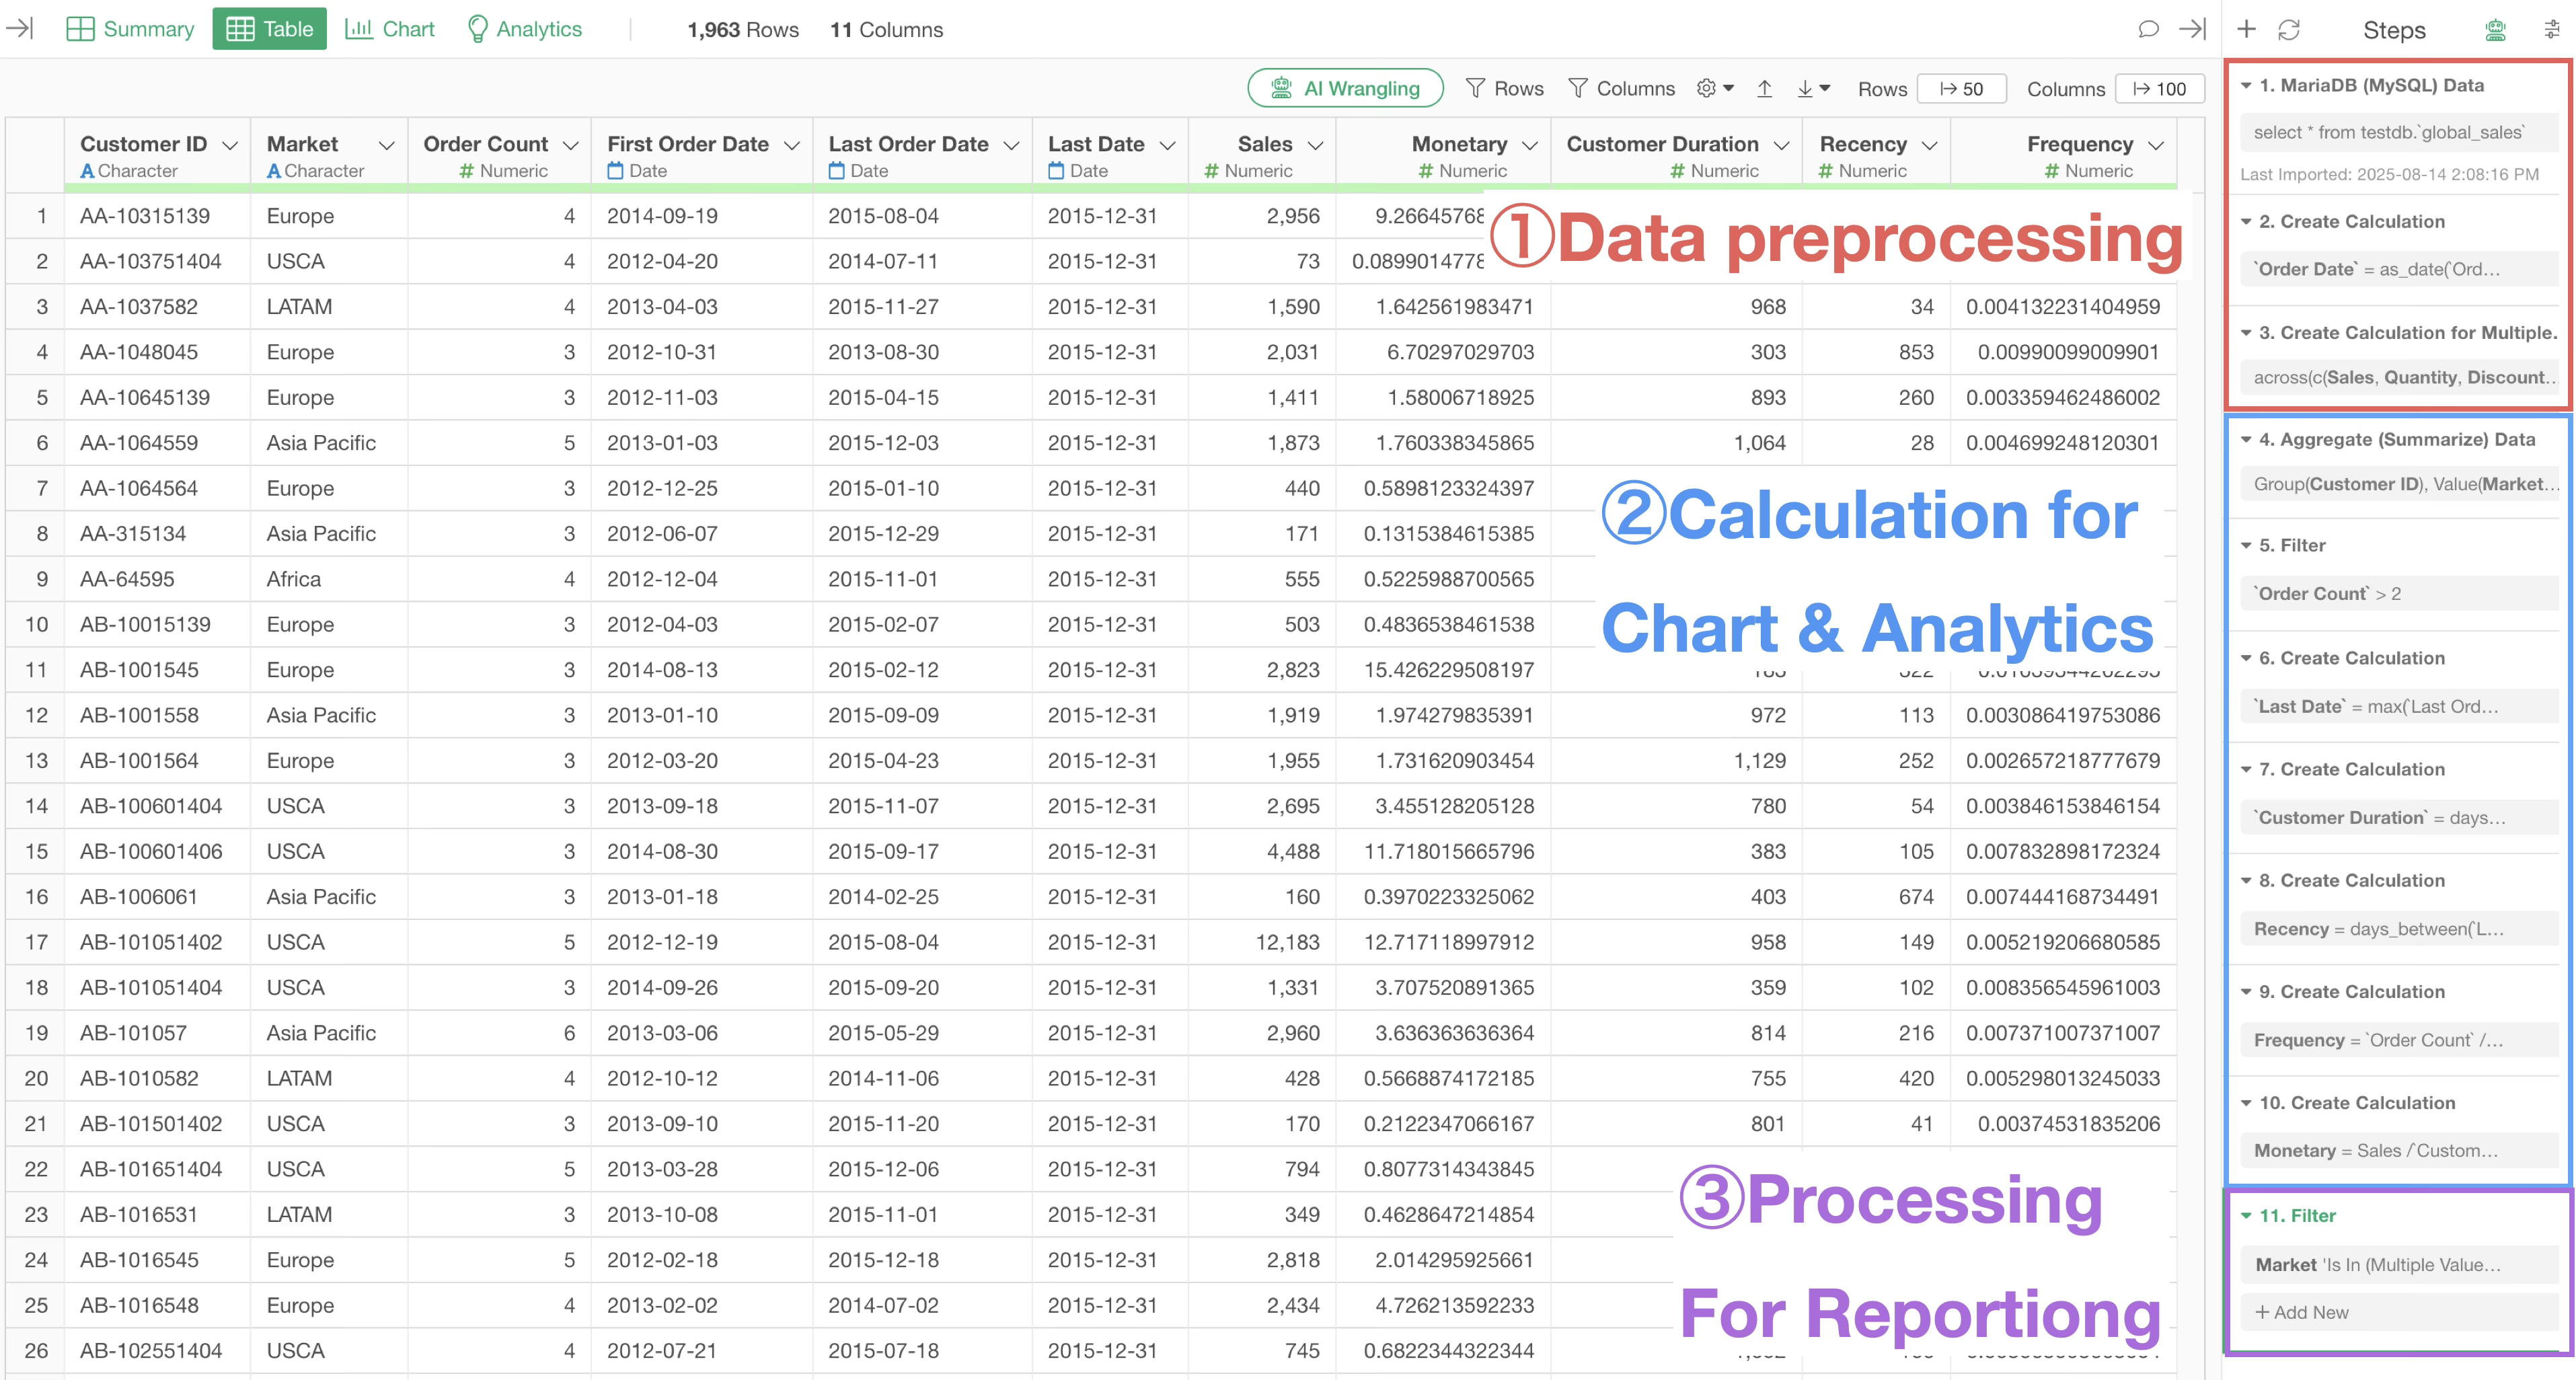
Data wrangling can be broadly divided into the following three types, and it is desirable to process them in this order:
- Processes to clean data (Preprocessing)
- Processes for charts, analytics, and calculations
- Processes for reporting (Parameters)
Necessity of Performing Data Preprocessing First
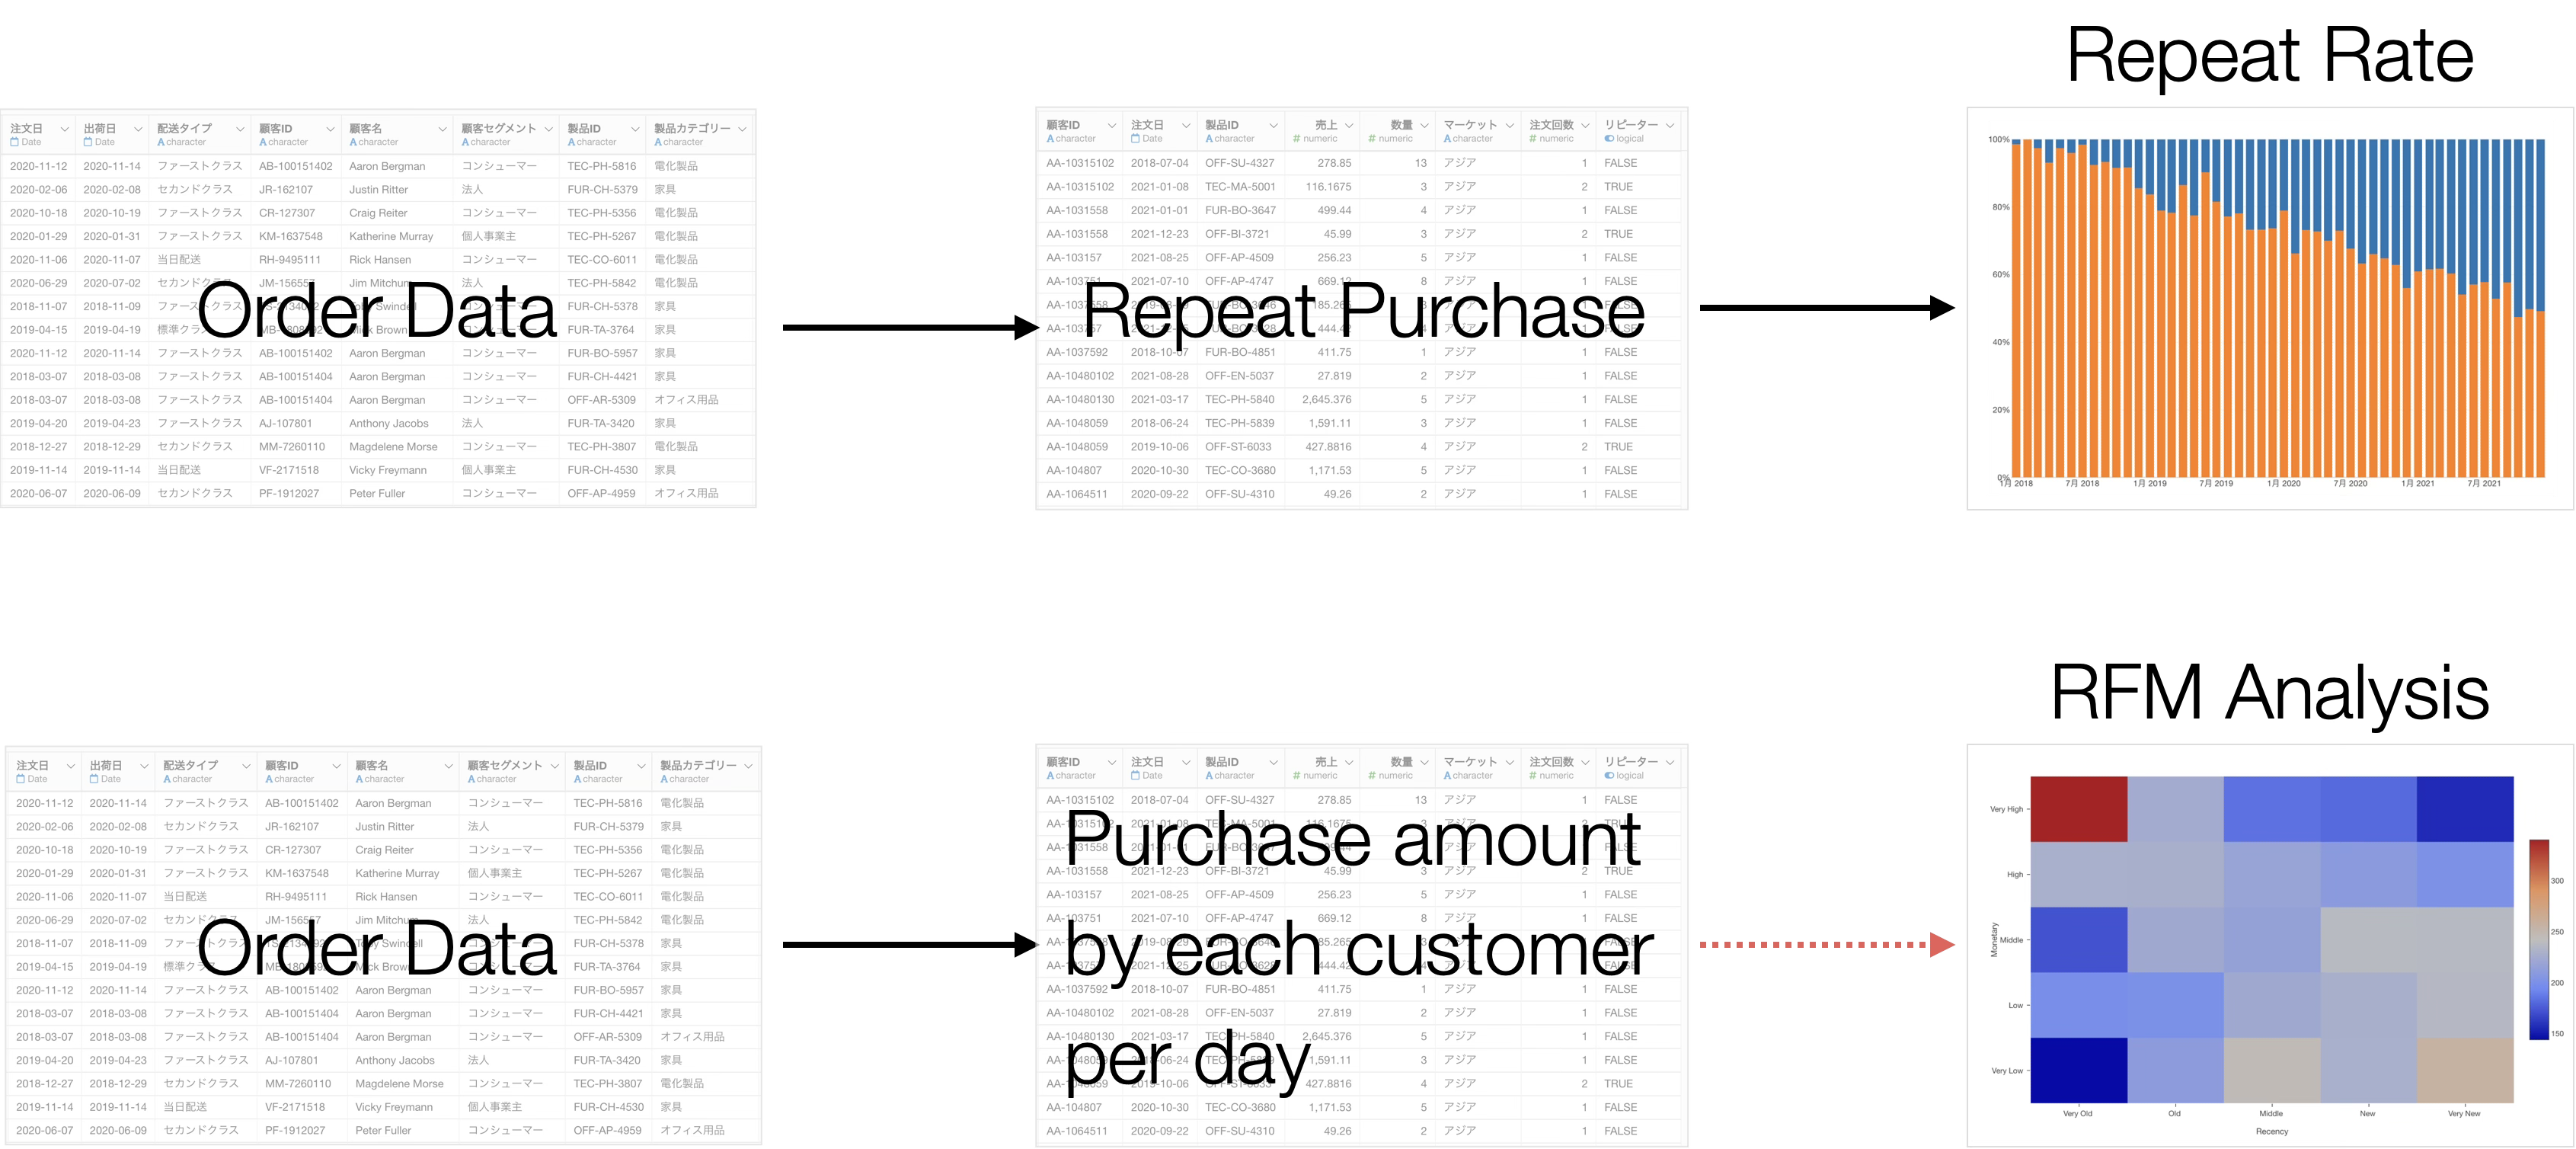
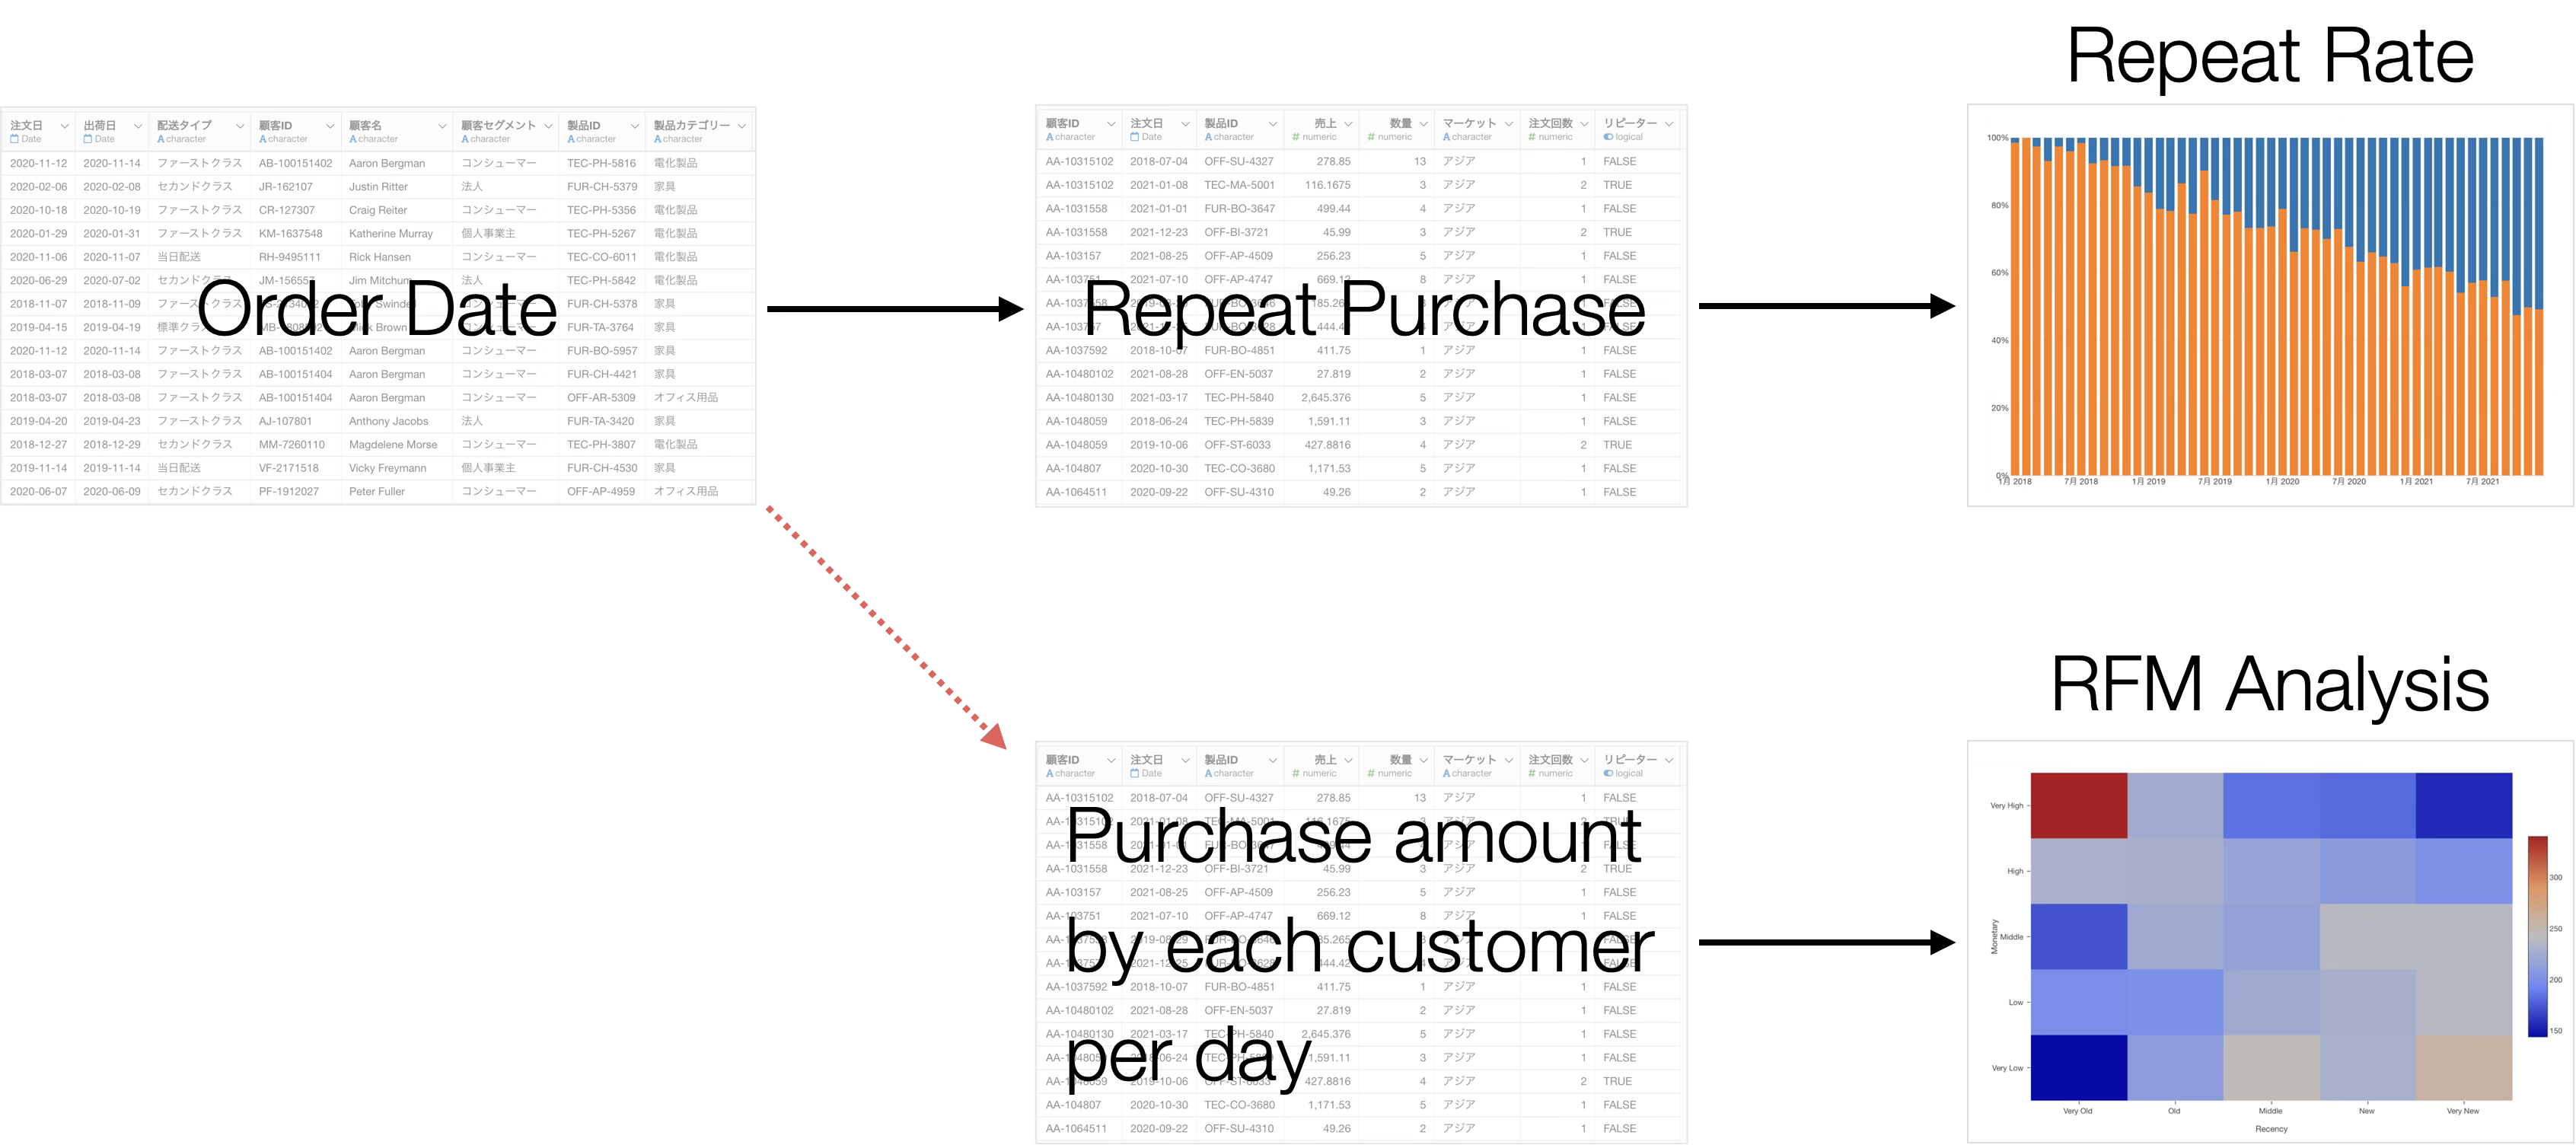
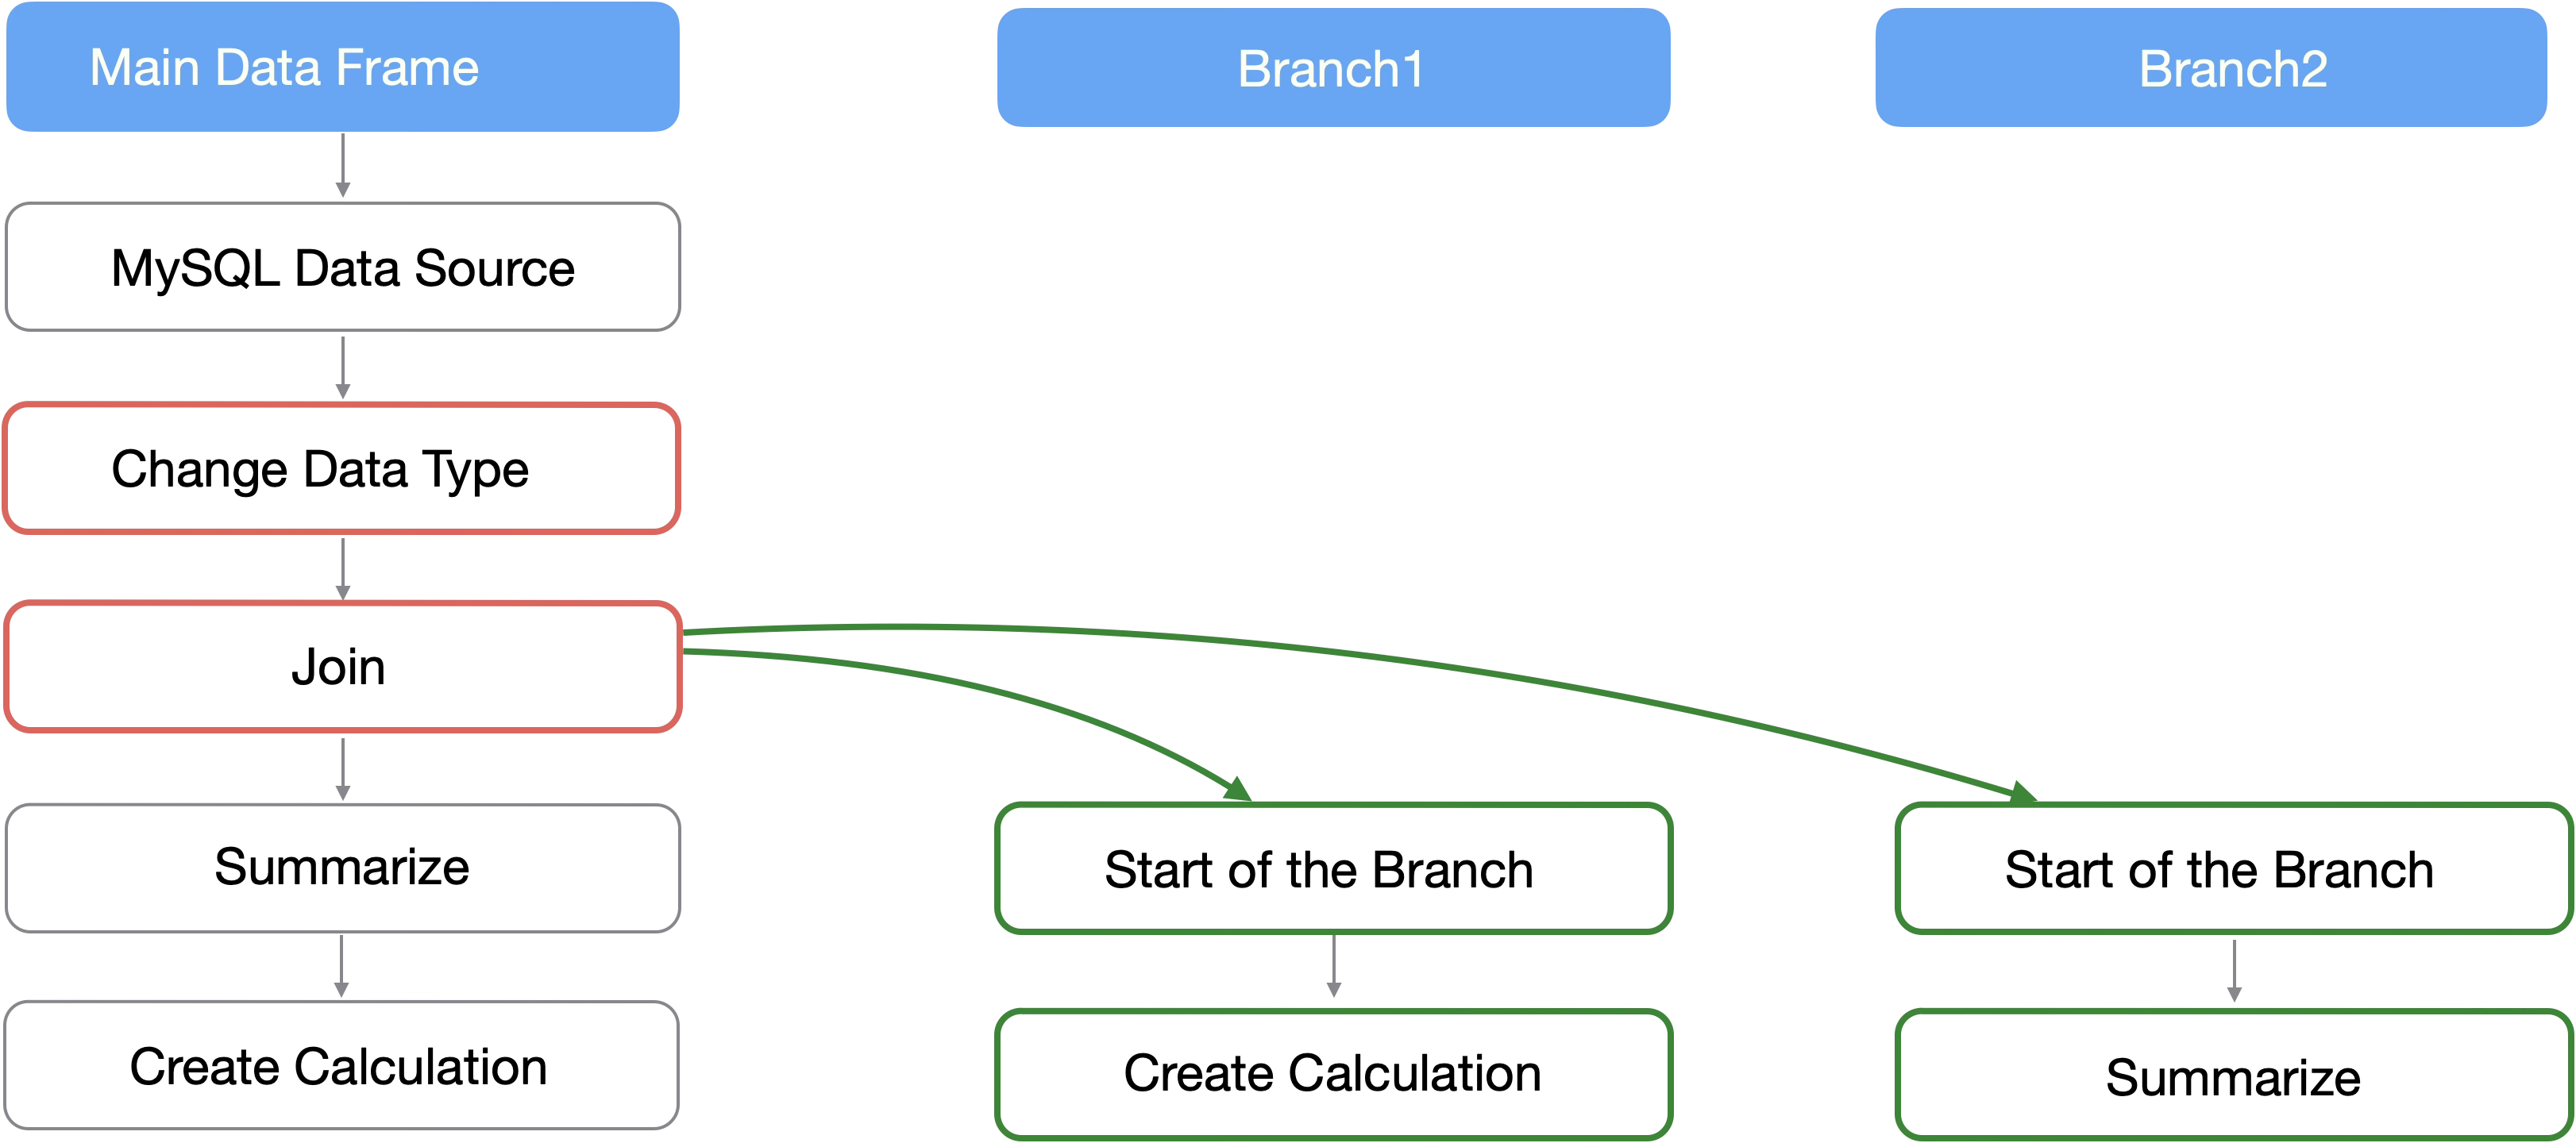
For example, suppose you want to perform “Repeat Purchase Ratio” and “RFM” analysis based on data where one row represents one order.
The required data shapes for these are different, and to perform data wrangling according to the purpose, you must create separate data frames for each.
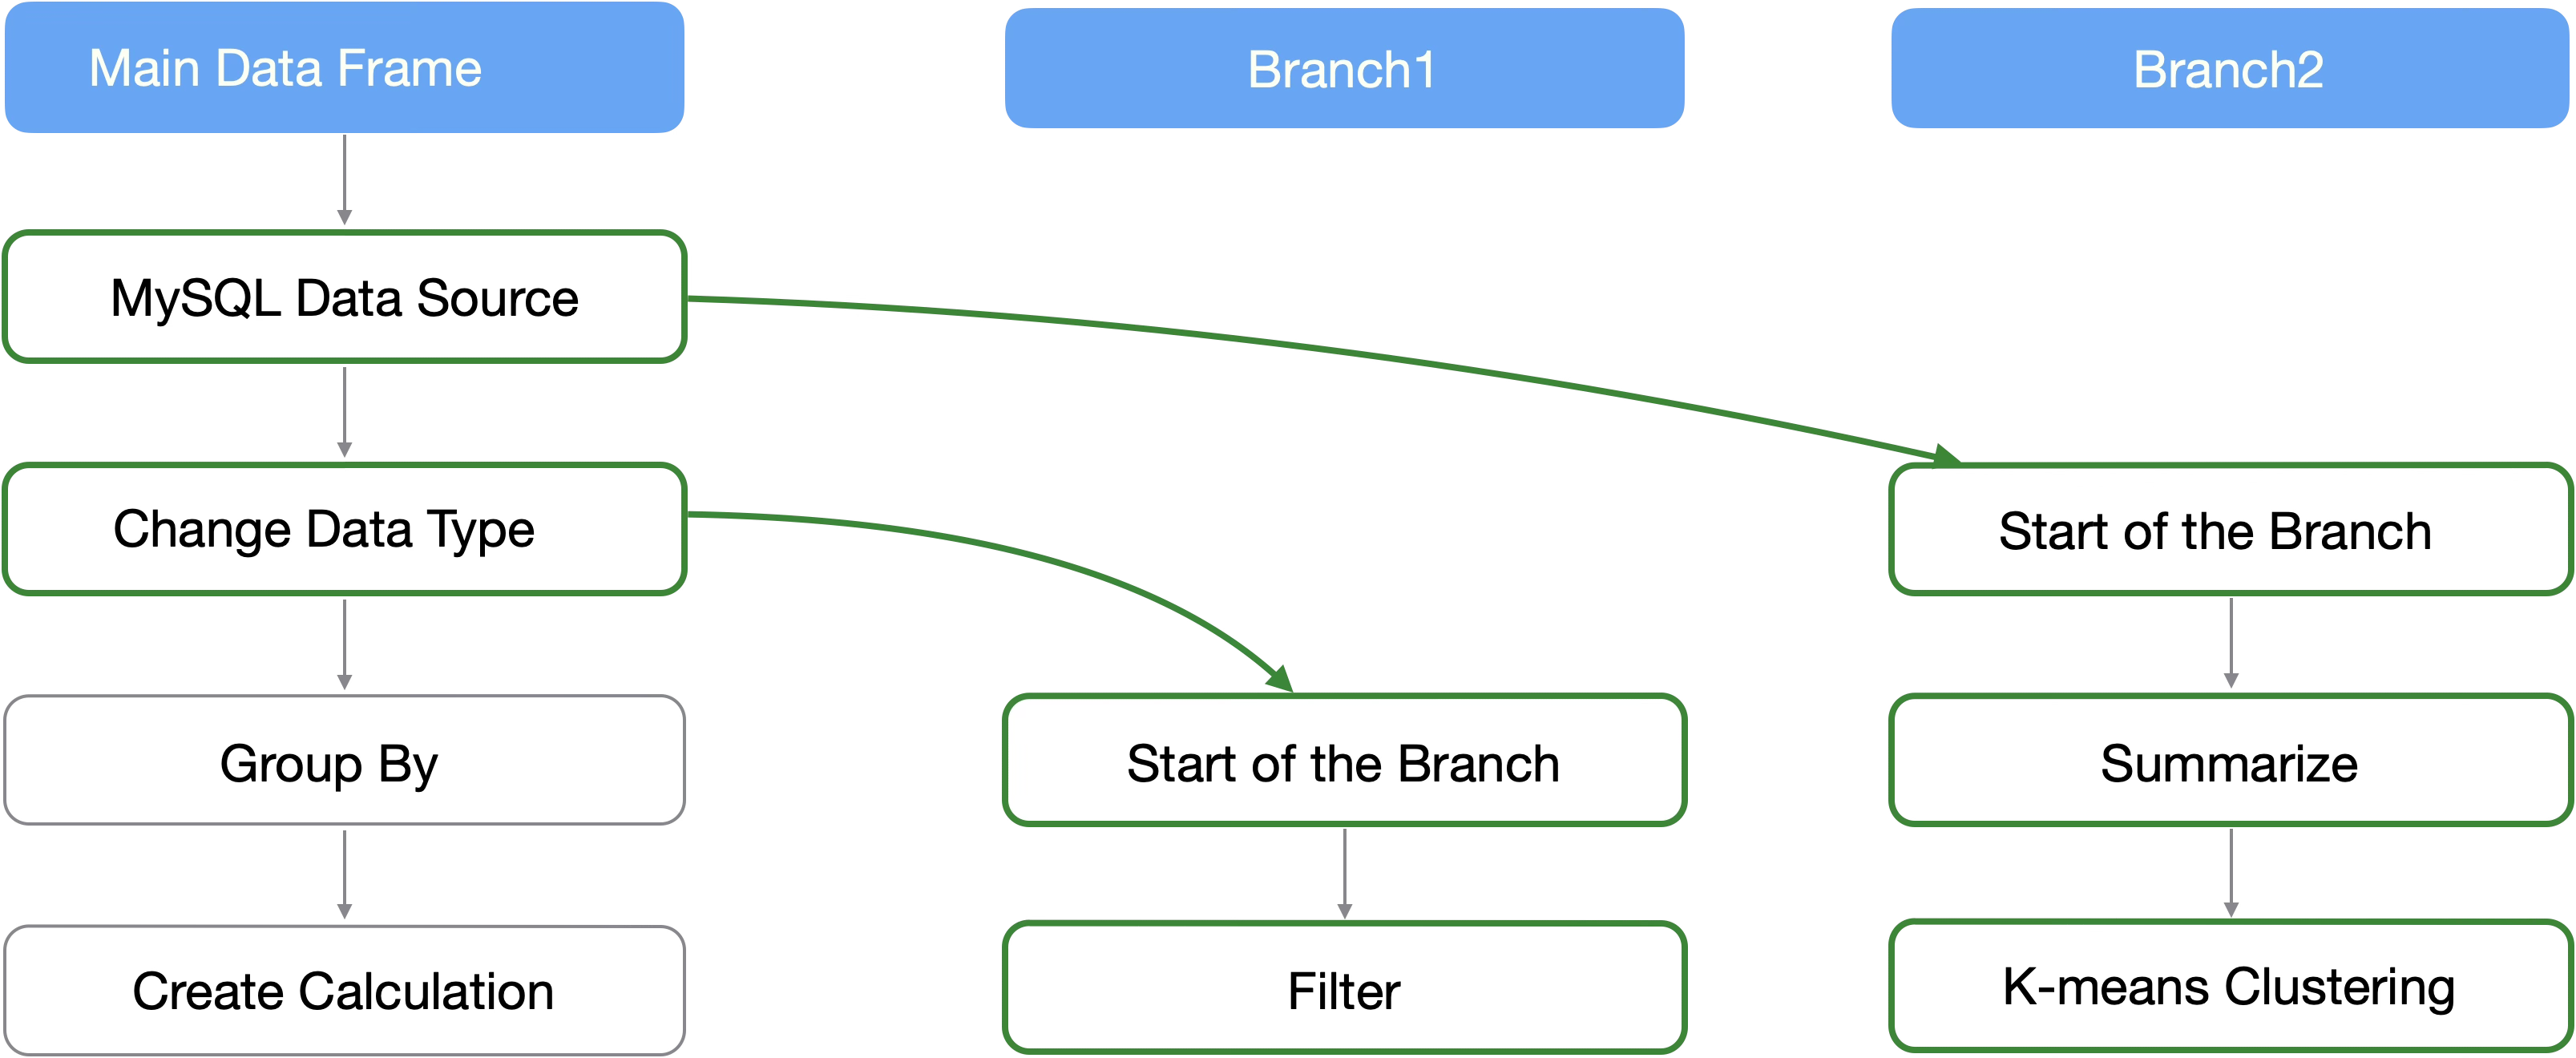
In Exploratory, you can create “Branch Data Frames” branched from a single data frame, allowing you to perform different data transformations in the main and branch data frames.
A branch can be created from any step in the main data frame, reflecting the processes performed up to that step. Furthermore, multiple branches can be created.
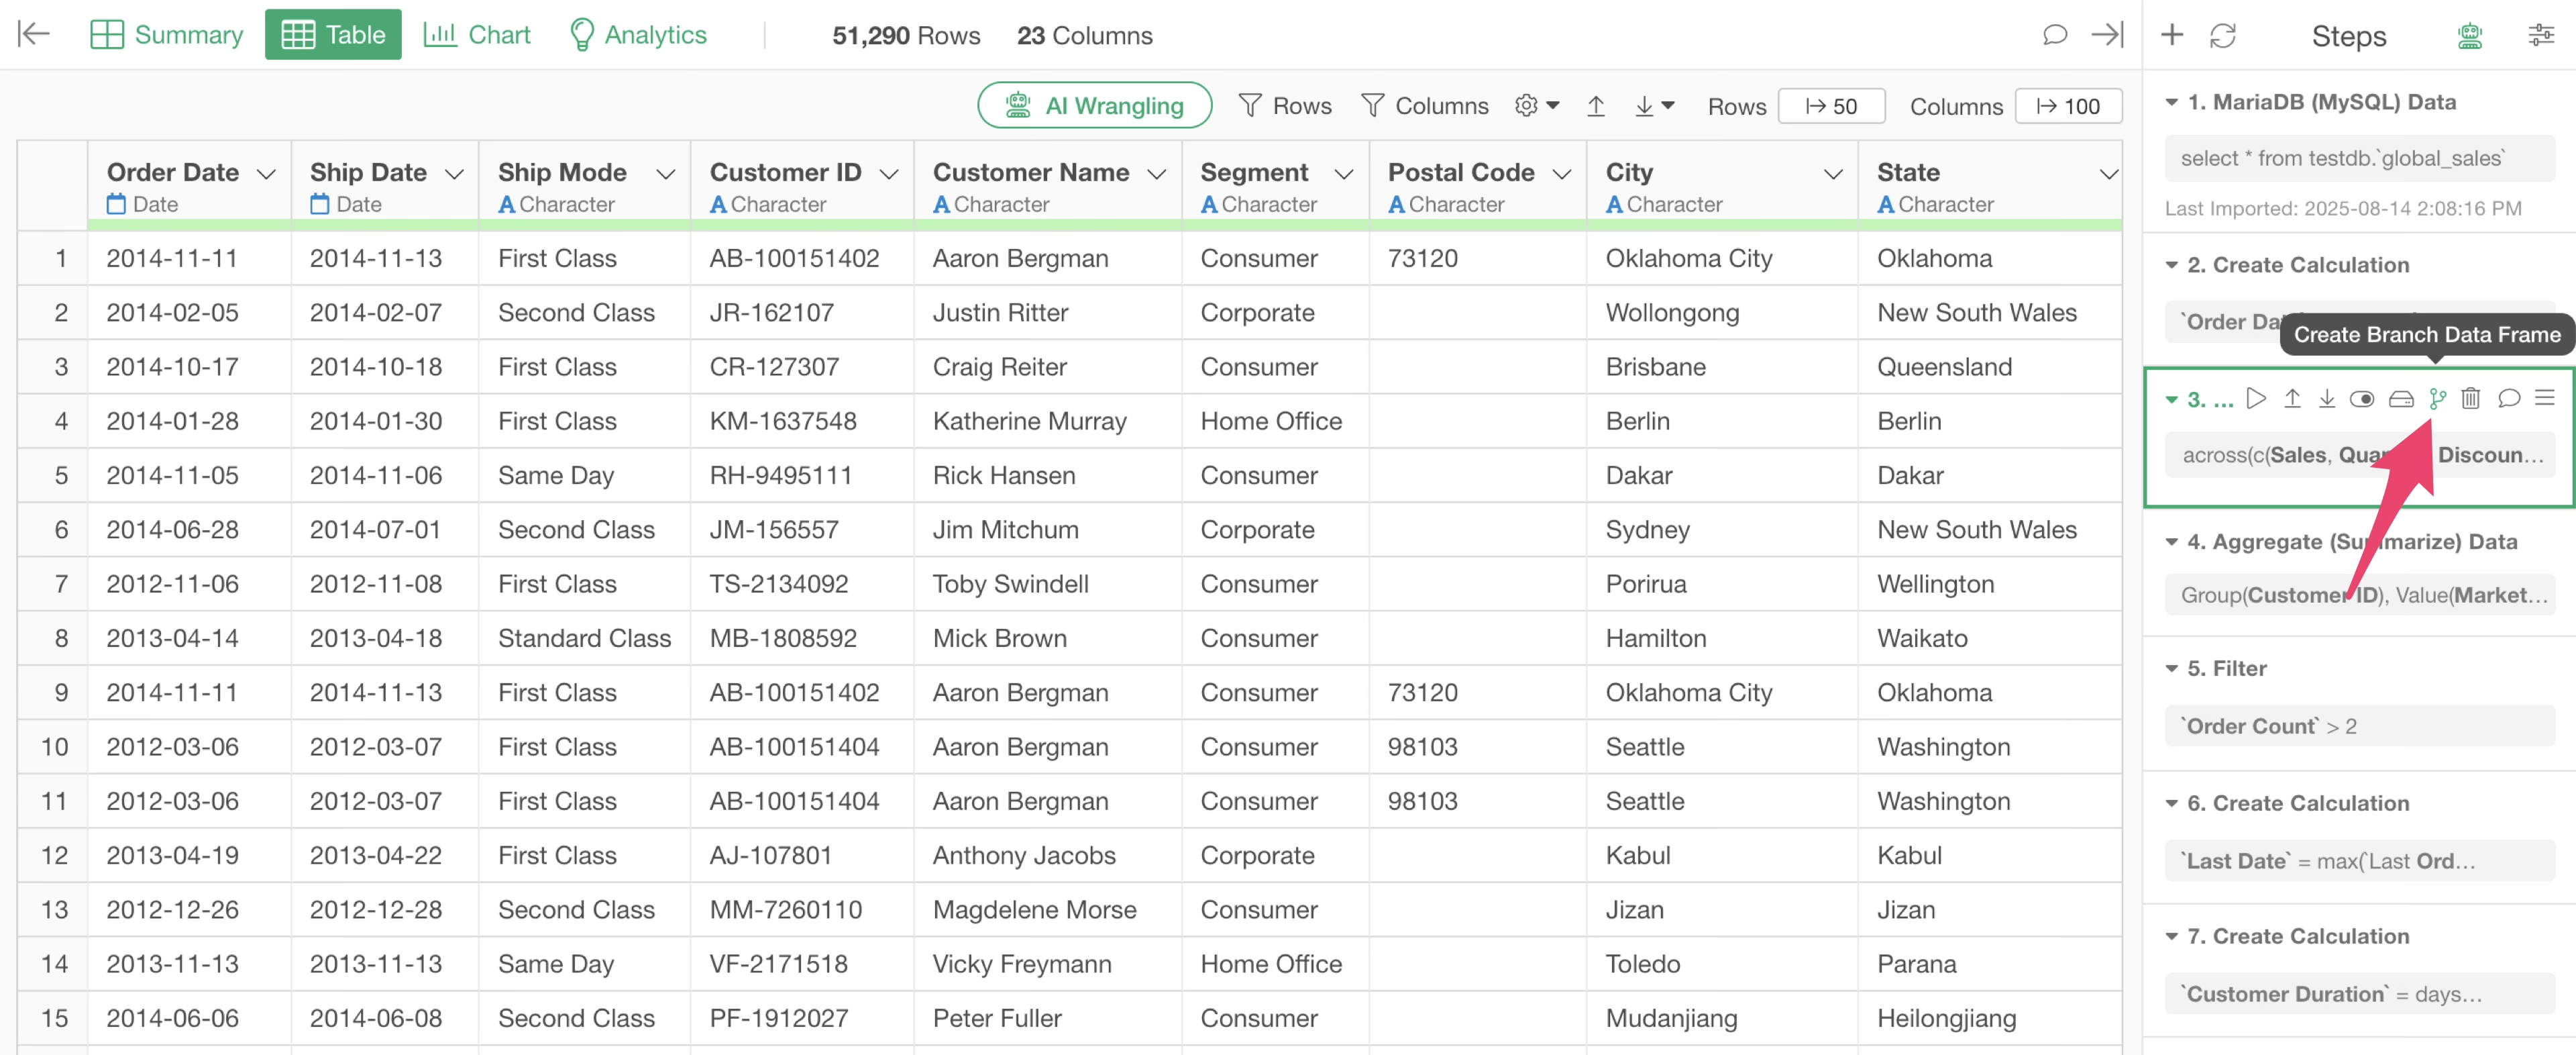
Branch data frames can be created from the “Branch” icon in the steps.
For detailed usage of branches, please see here.
For example, if you want to add data such as attribute information as columns using “Join,” it is inefficient to perform the same process for each branch.
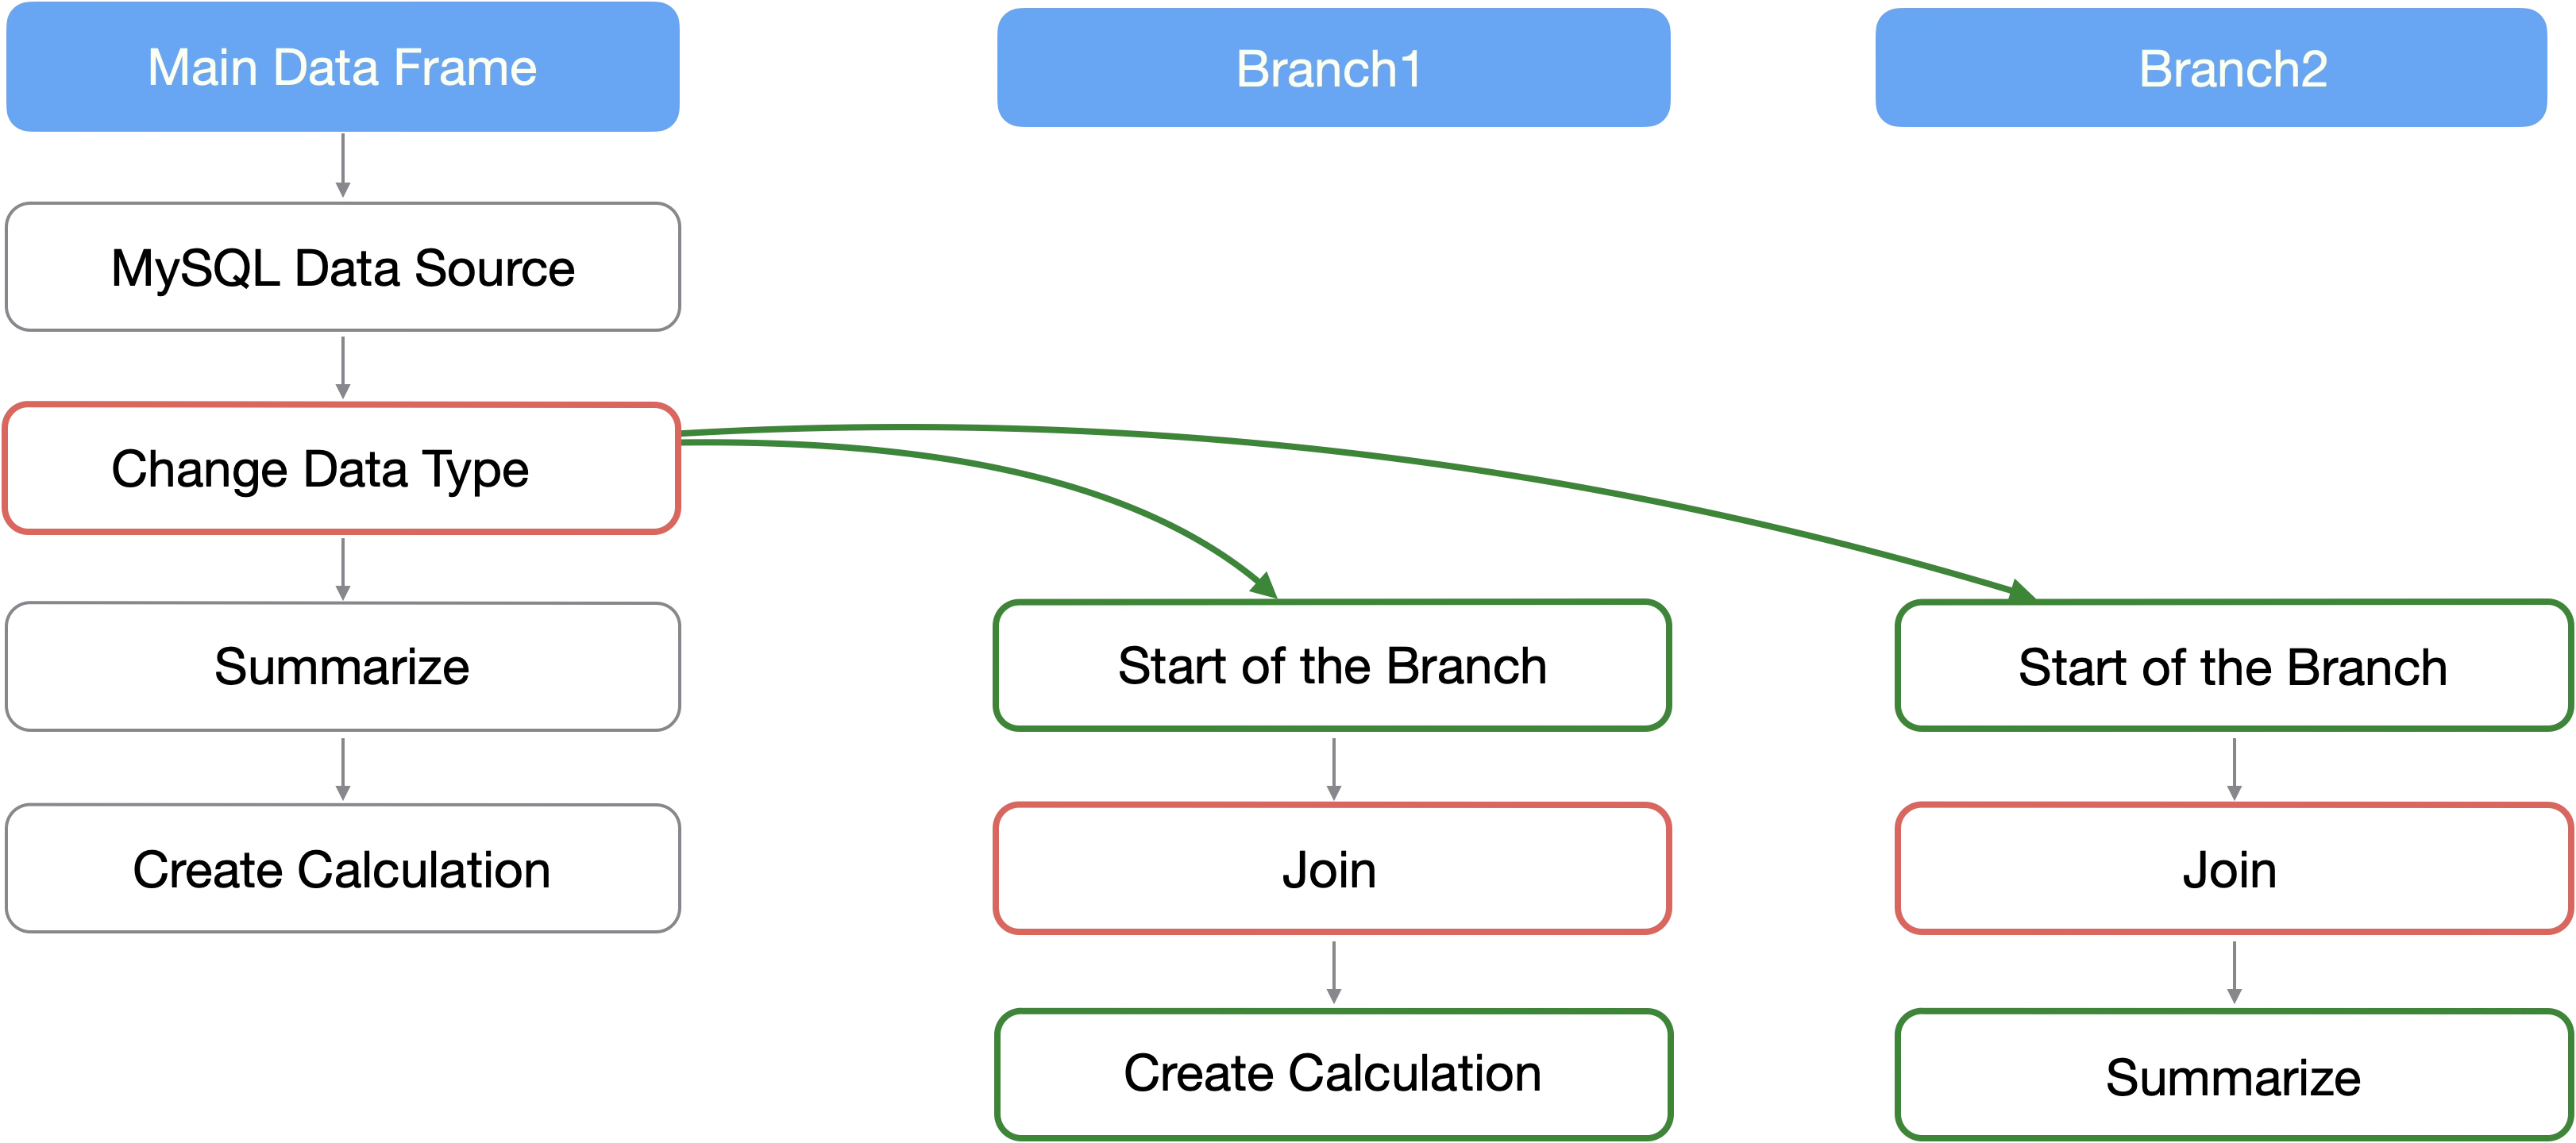
By performing common preprocessing in the main data frame, you can save the effort of preprocessing in each branch.
Therefore, performing data preprocessing in advance makes management easier during subsequent data wrangling and improves performance by eliminating the need to perform the same process multiple times.
Processes for Reporting (Parameters)
In Exploratory, you can effectively report the results of data analysis to others through dashboards and notes.
At that time, by using the parameter feature, you can dynamically change the data of charts displayed within the dashboard.
For detailed usage of parameters, please see here.
Additionally, parameters can be applied as a data wrangling step or as a filter within charts and analytics.
When parameters are set as a data wrangling step, processing may take time depending on the order of the steps.
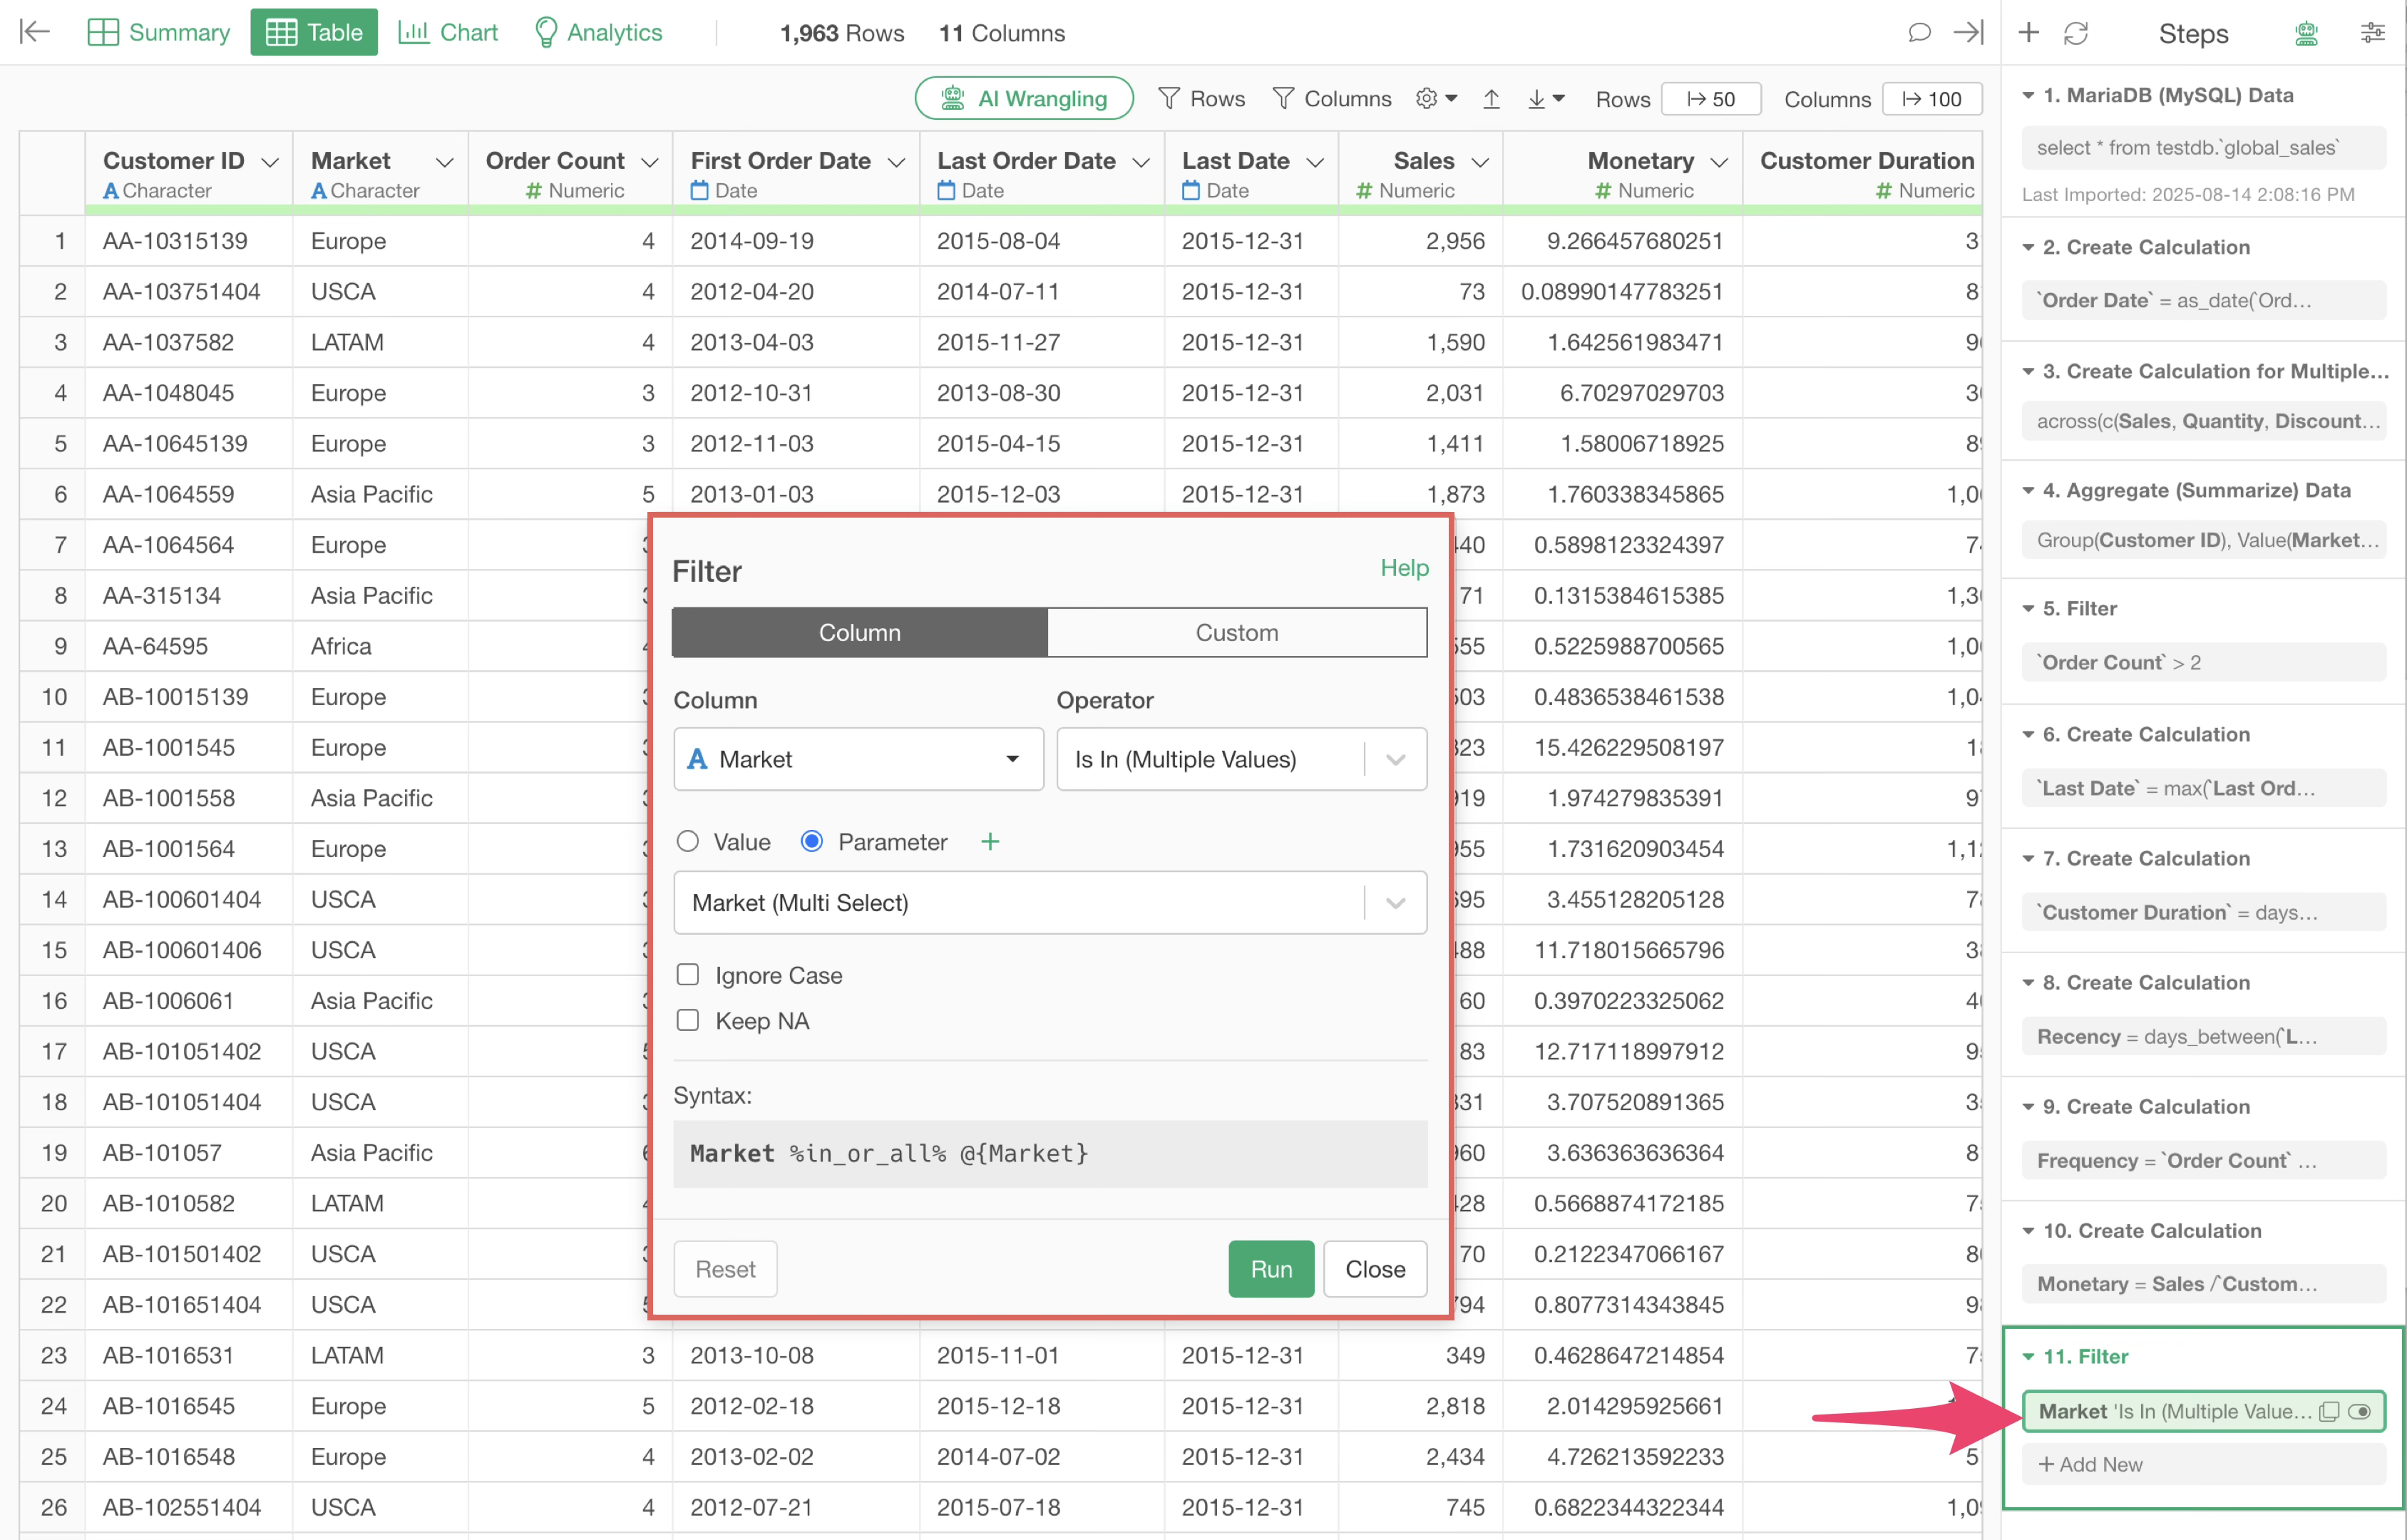
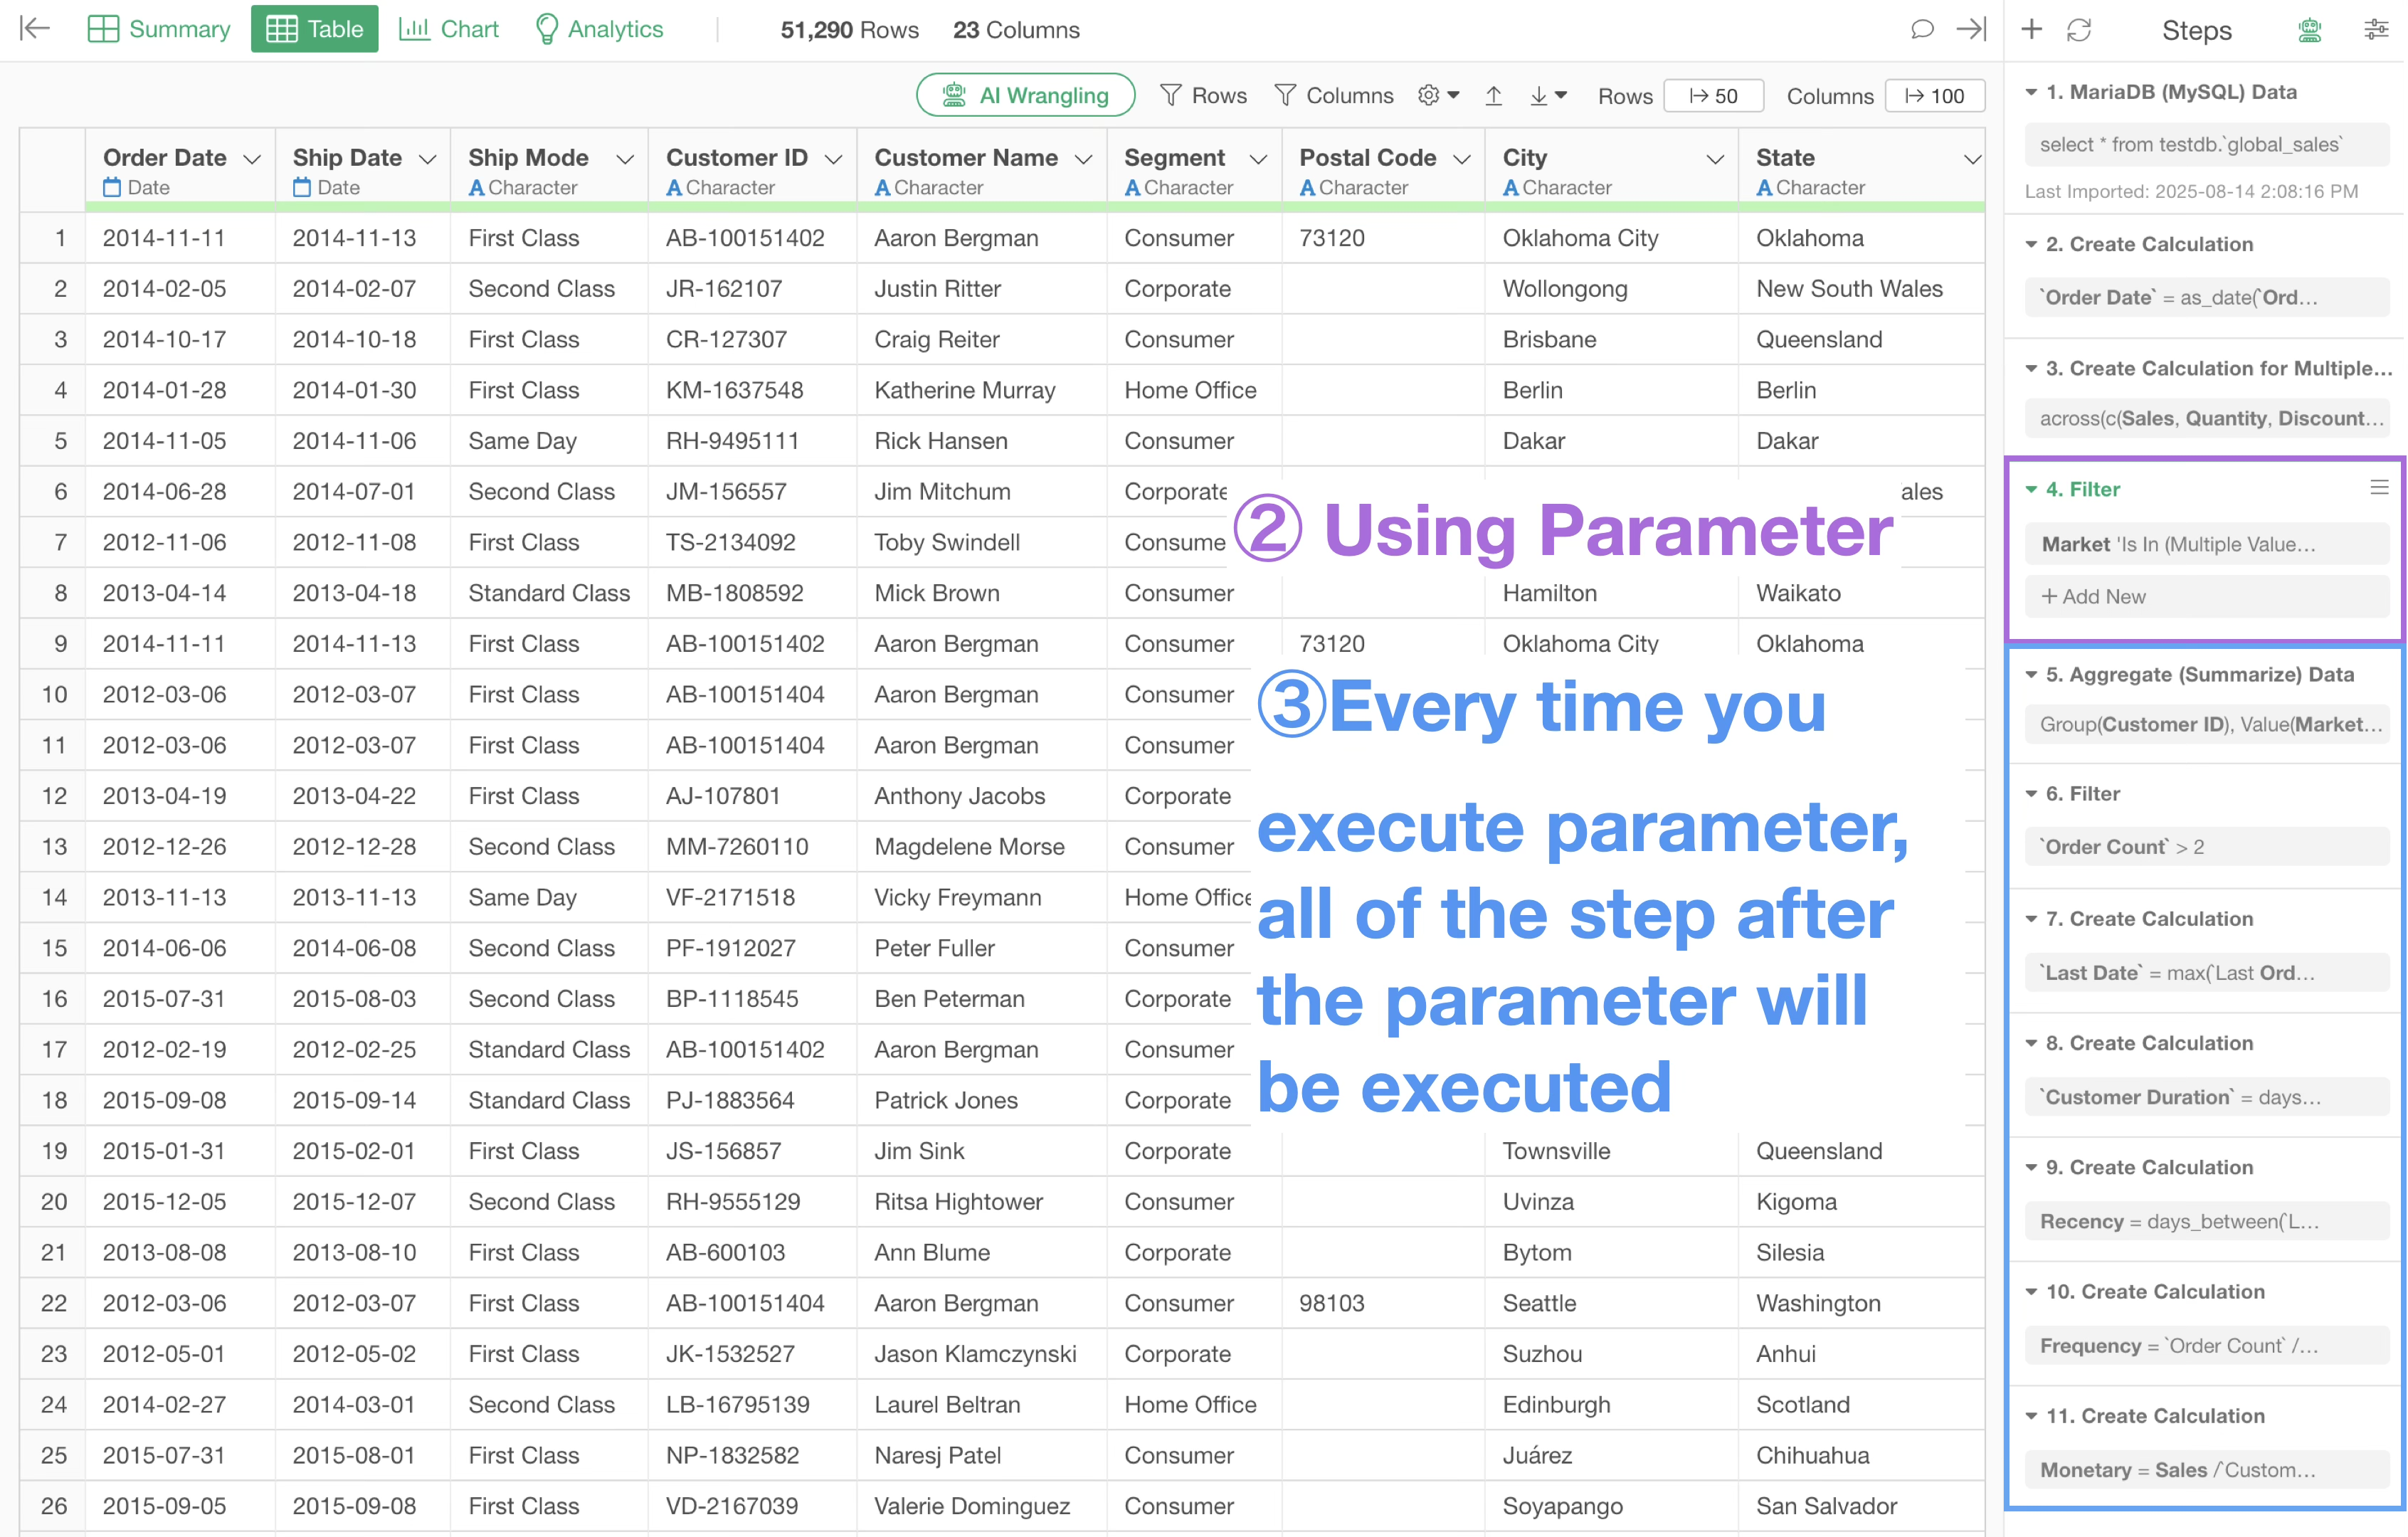
For example, if a parameter is embedded before a time-consuming process, every time you change a value with the parameter, the subsequent steps will run, which can take time.
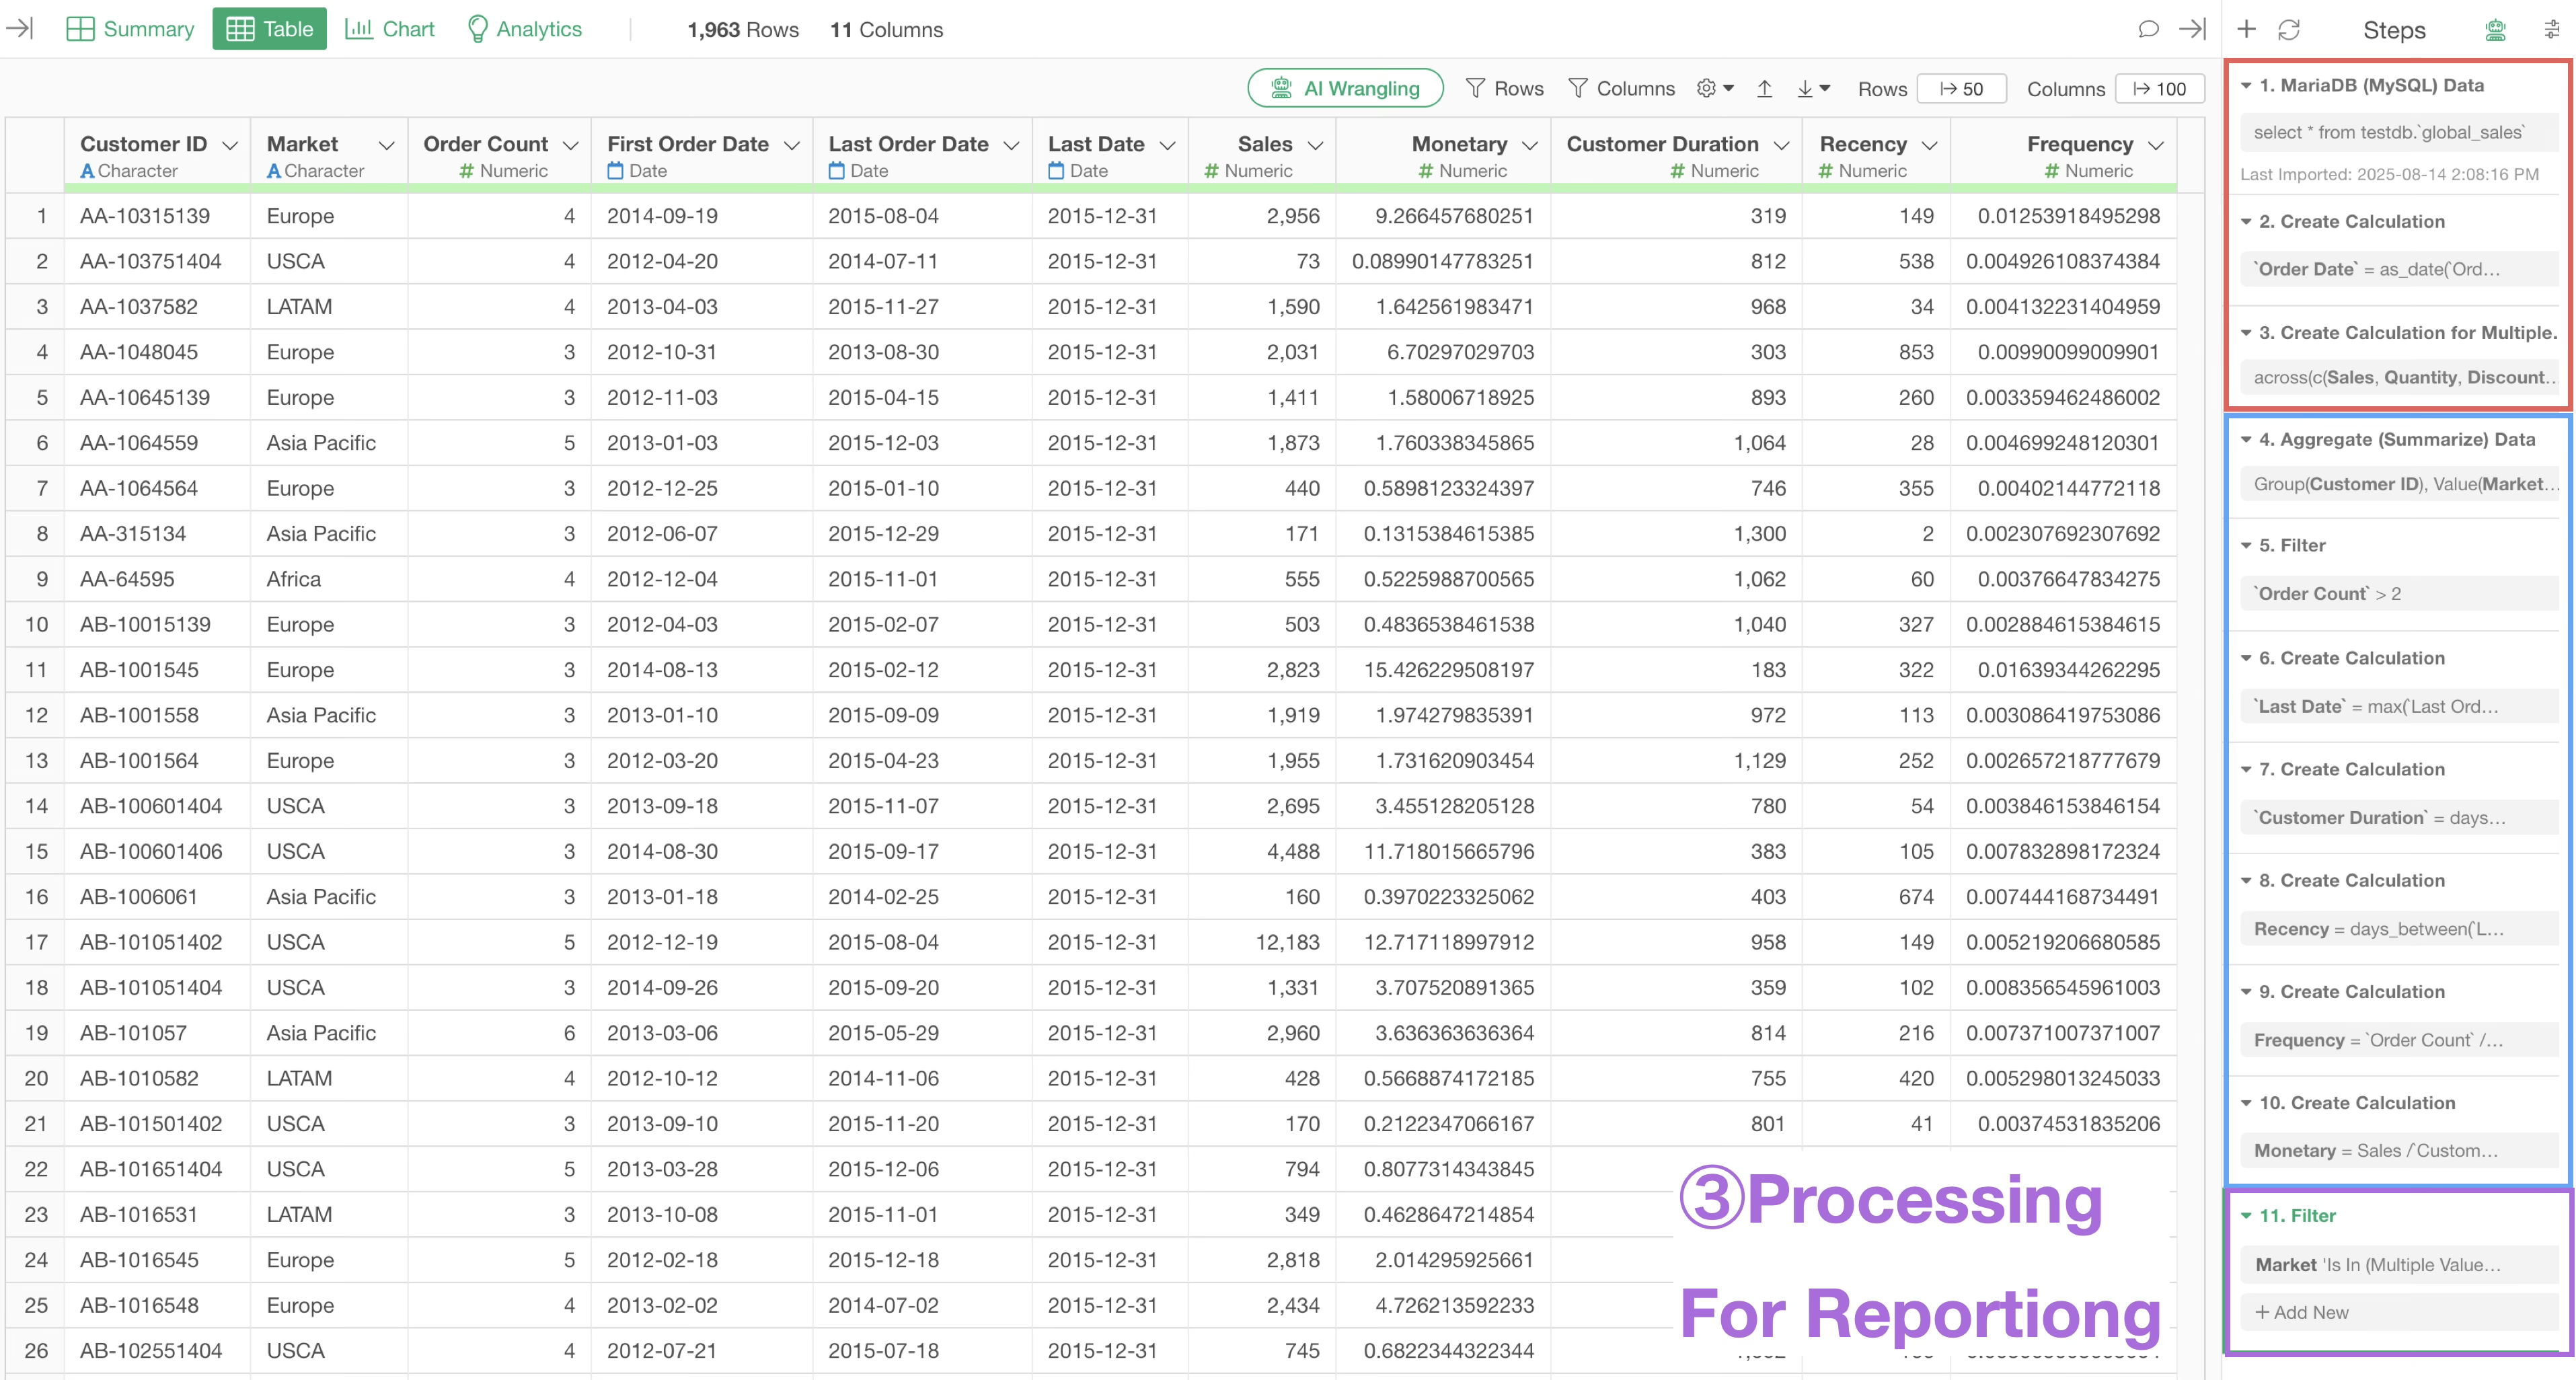
On the other hand, if the step using the parameter is set toward the end, as shown below, changing the value with the parameter will not trigger subsequent processing, so the results are returned immediately.
Depending on the content of the process you want to perform, it may be better to insert the step using the parameter at the beginning or in the middle. However, generally, having the parameter in a later step improves performance because it eliminates the execution of subsequent processes every time a change is made.