Data Reproducibility and Automation in Exploratory
Exploratory automatically records data wrangling processes as steps. These steps allow you to reproduce the same data processing on different datasets.
This note explains how to reproduce the same data processing in four scenarios:
- When the original file is updated
- When you want to change the data source
- When you want to use a different data frame
- When you want to share with others
1. When the Original File is Updated
Suppose you are using an Excel or CSV file stored locally.
If the latest data is added to the same file in the same directory, you do not need to change or re-select the file.
Simply click the “Re-import” button to load the updated data.
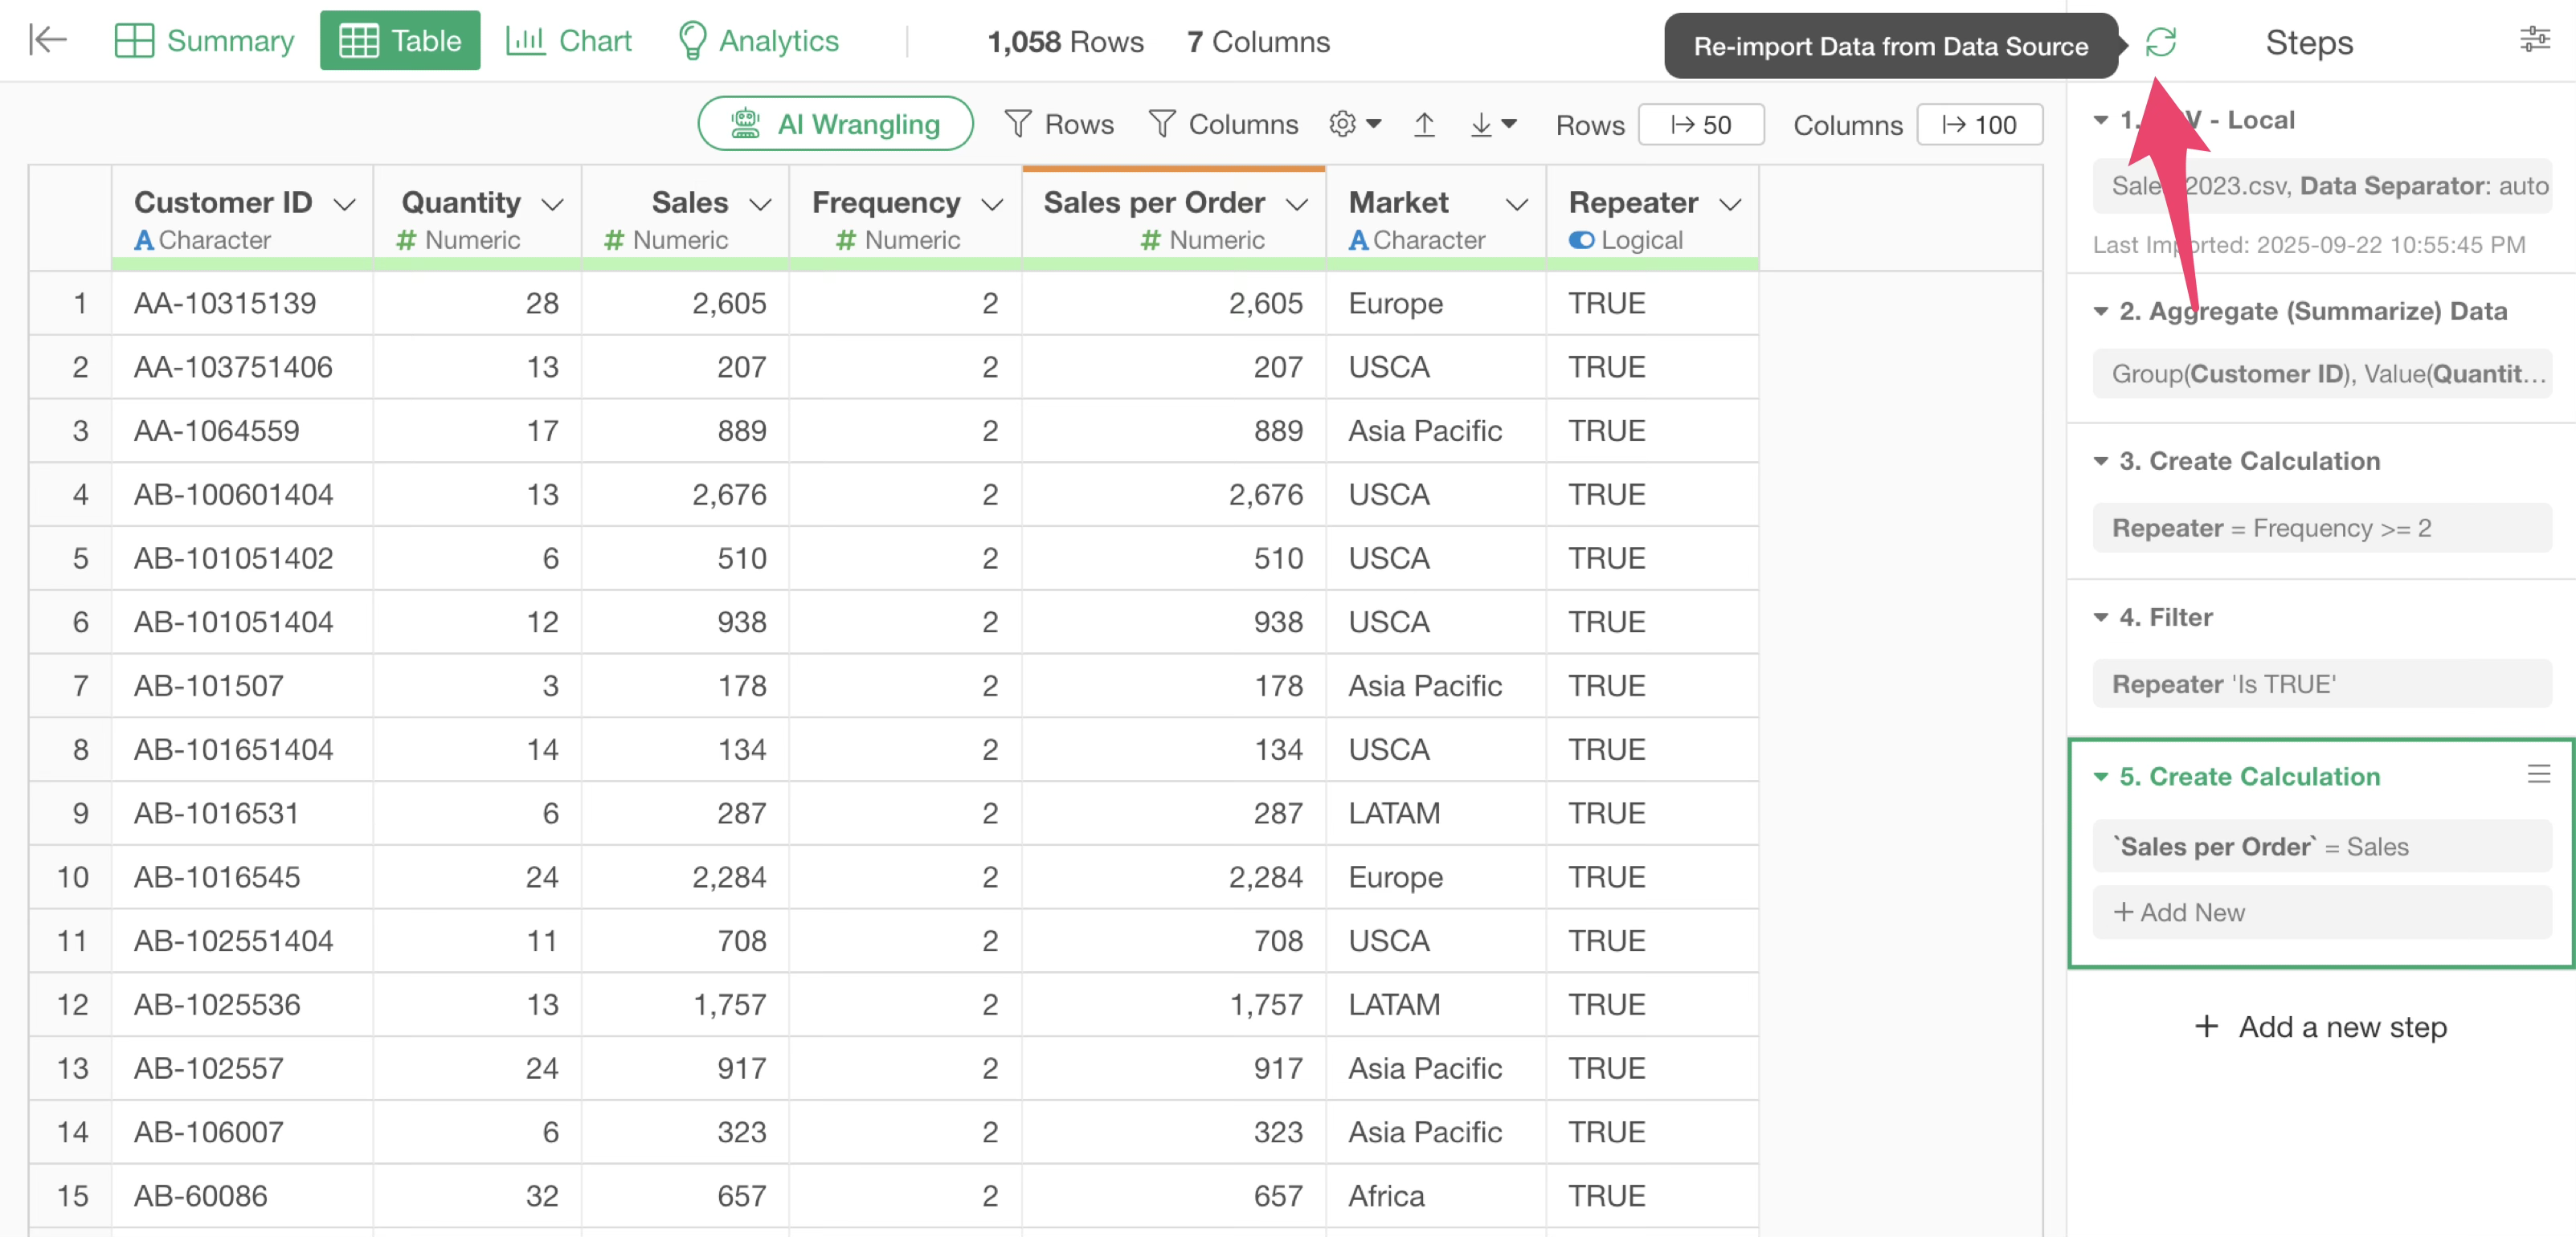
This action re-executes all the existing steps with the updated data.
2. When you want to change the data source
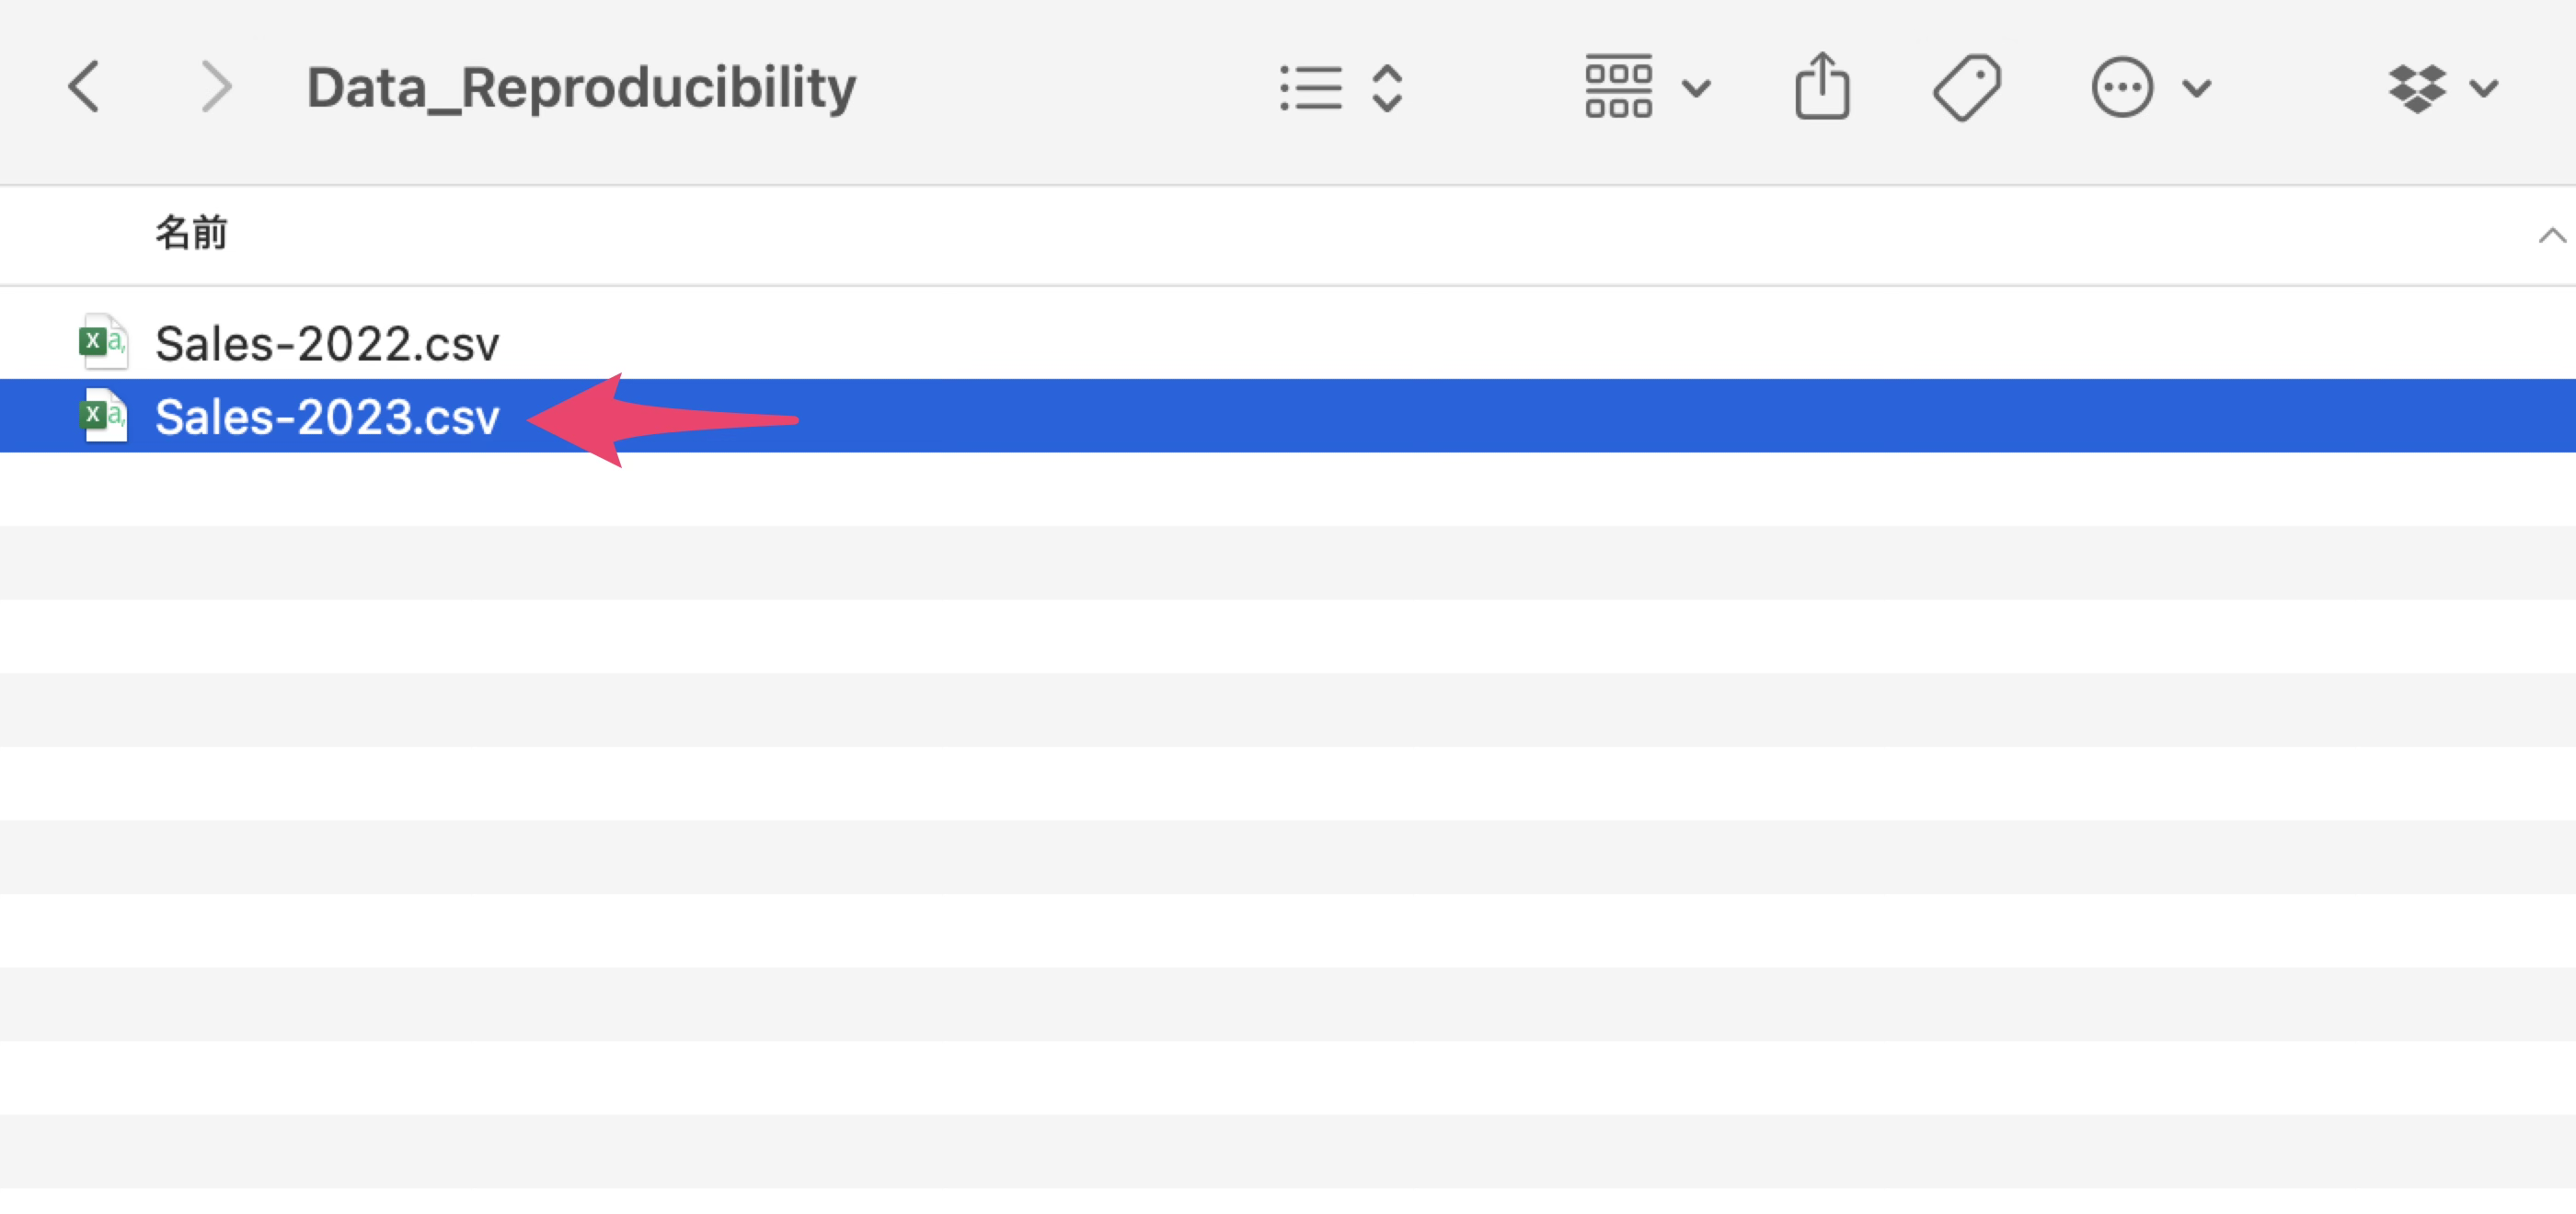
Imagine you have been using sales data from 2022.
Now, a new “Sales Data_2023” file has been added. You want to apply the same processing to the 2023 sales data by switching the data source while keeping the same data frame.
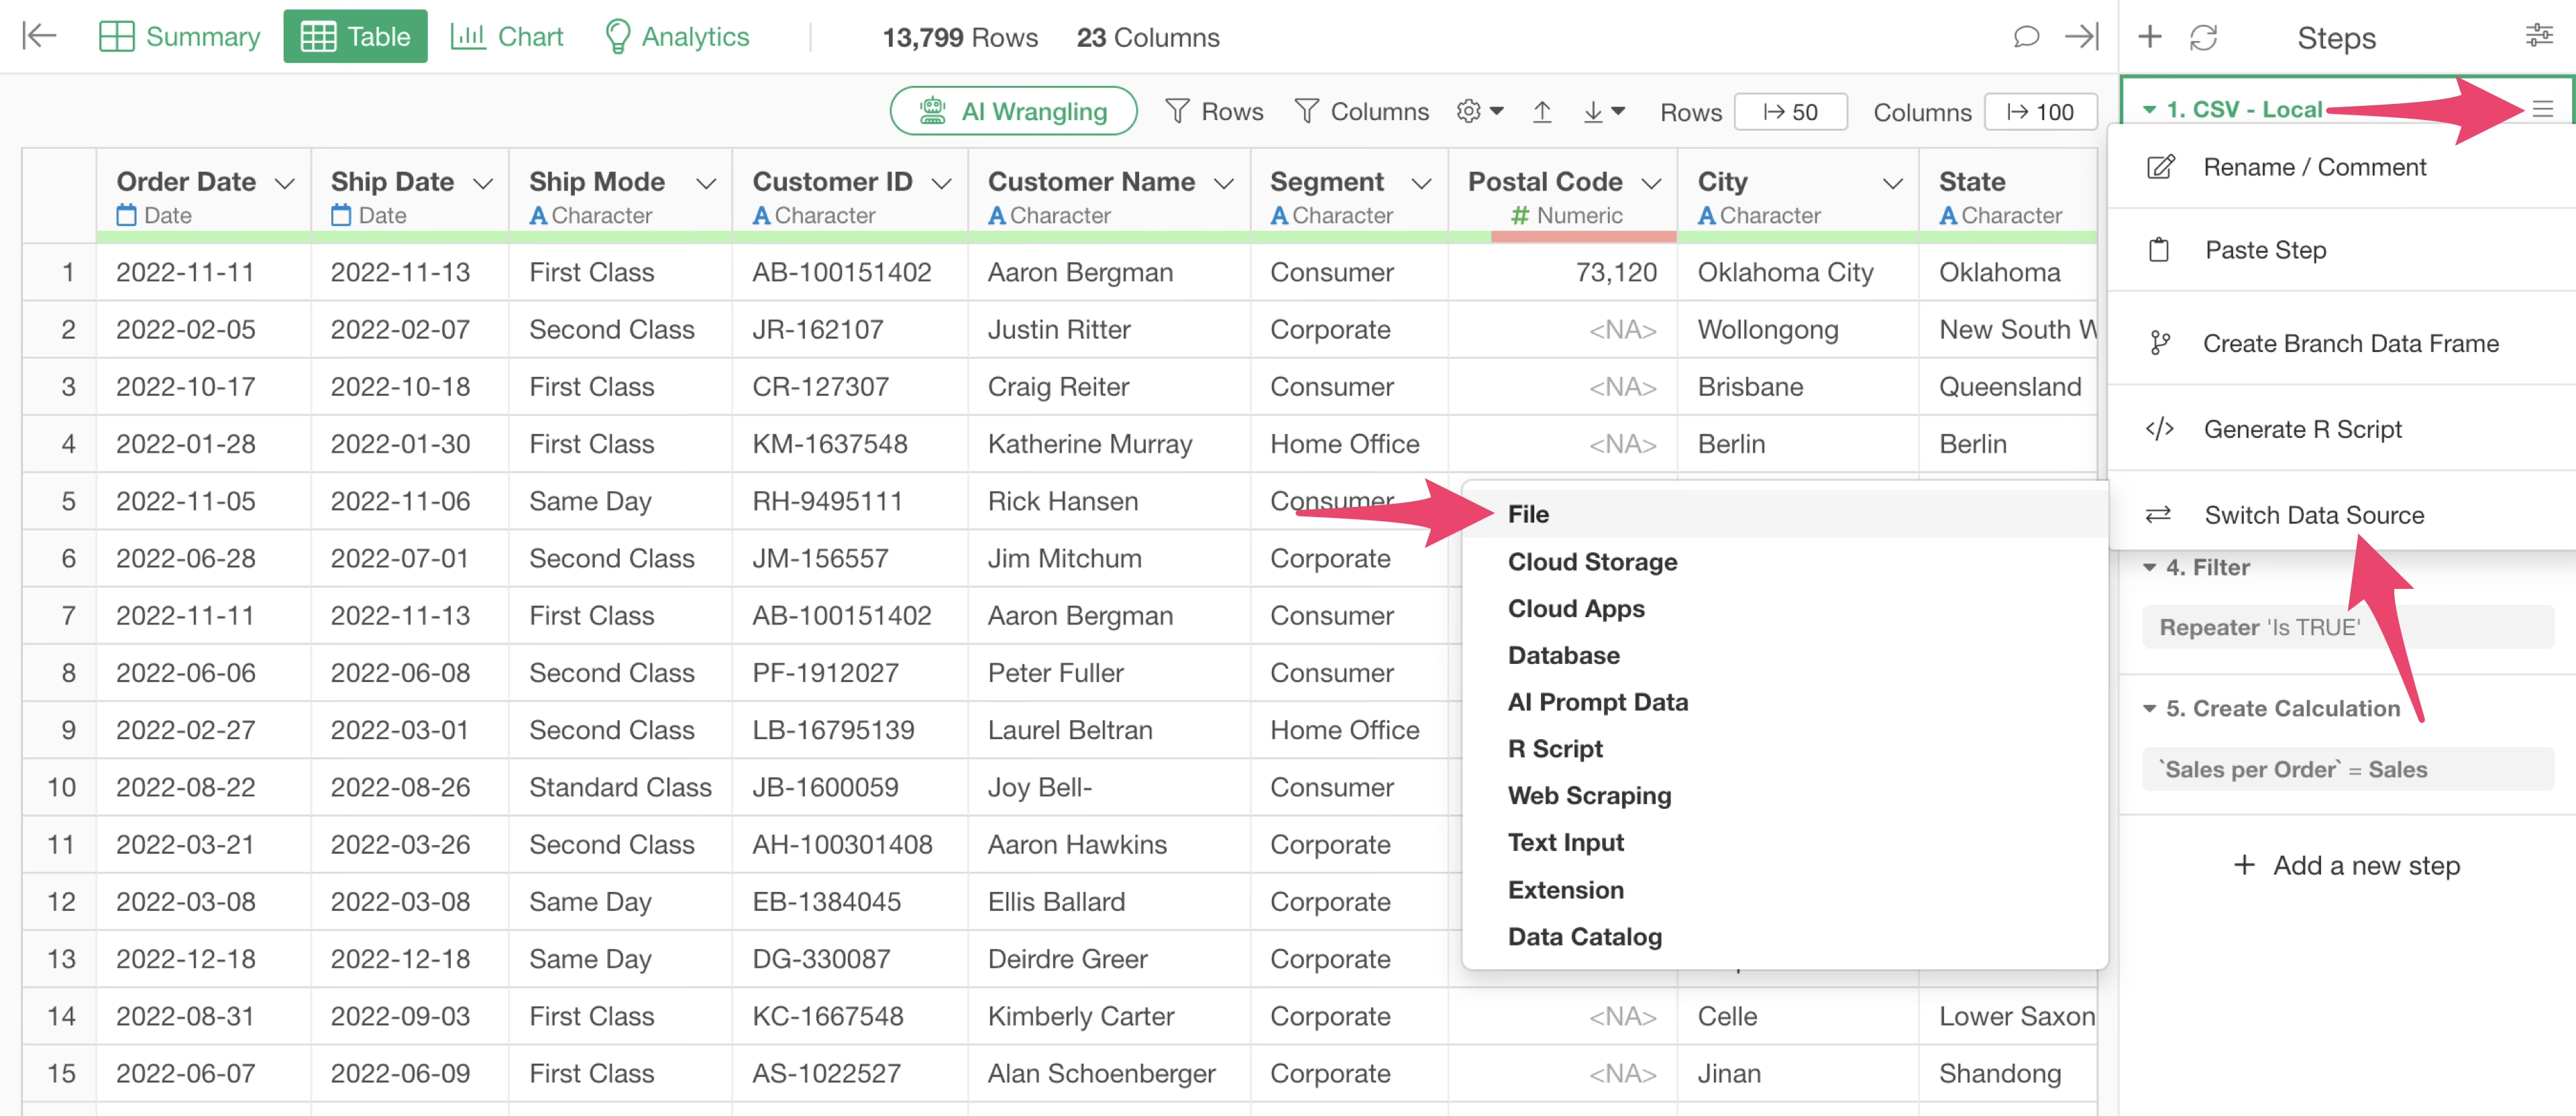
From the menu of the source step, select “Switch Data Source” and then choose “File.”
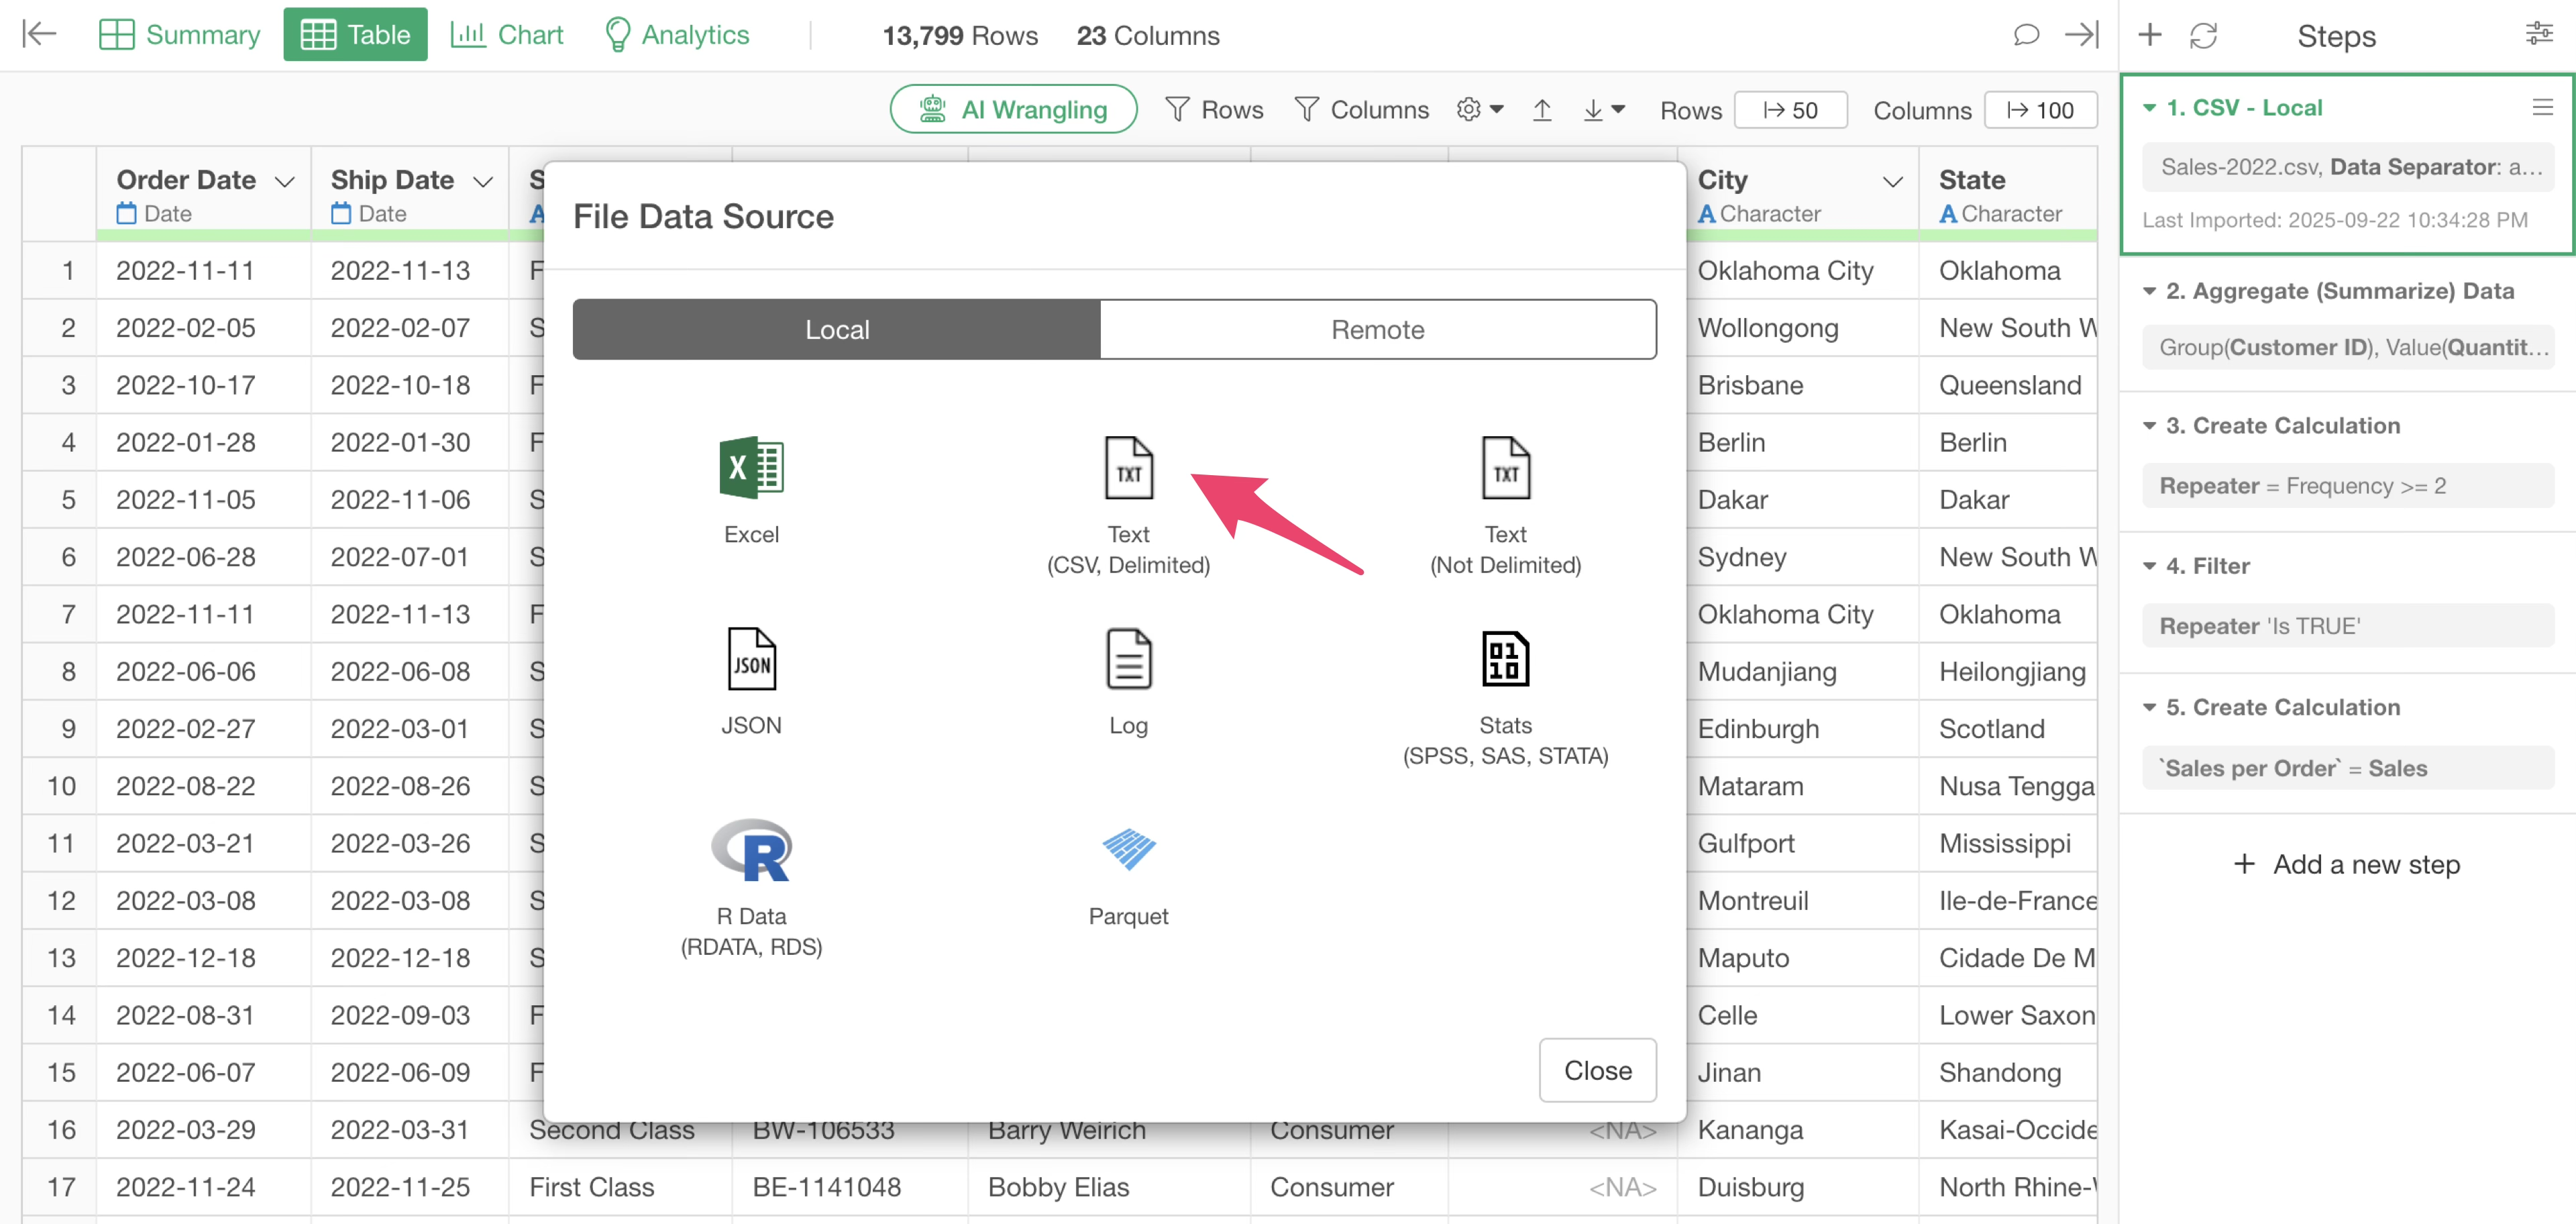
The File Data Source dialog appears. This time, we will select “Text.”
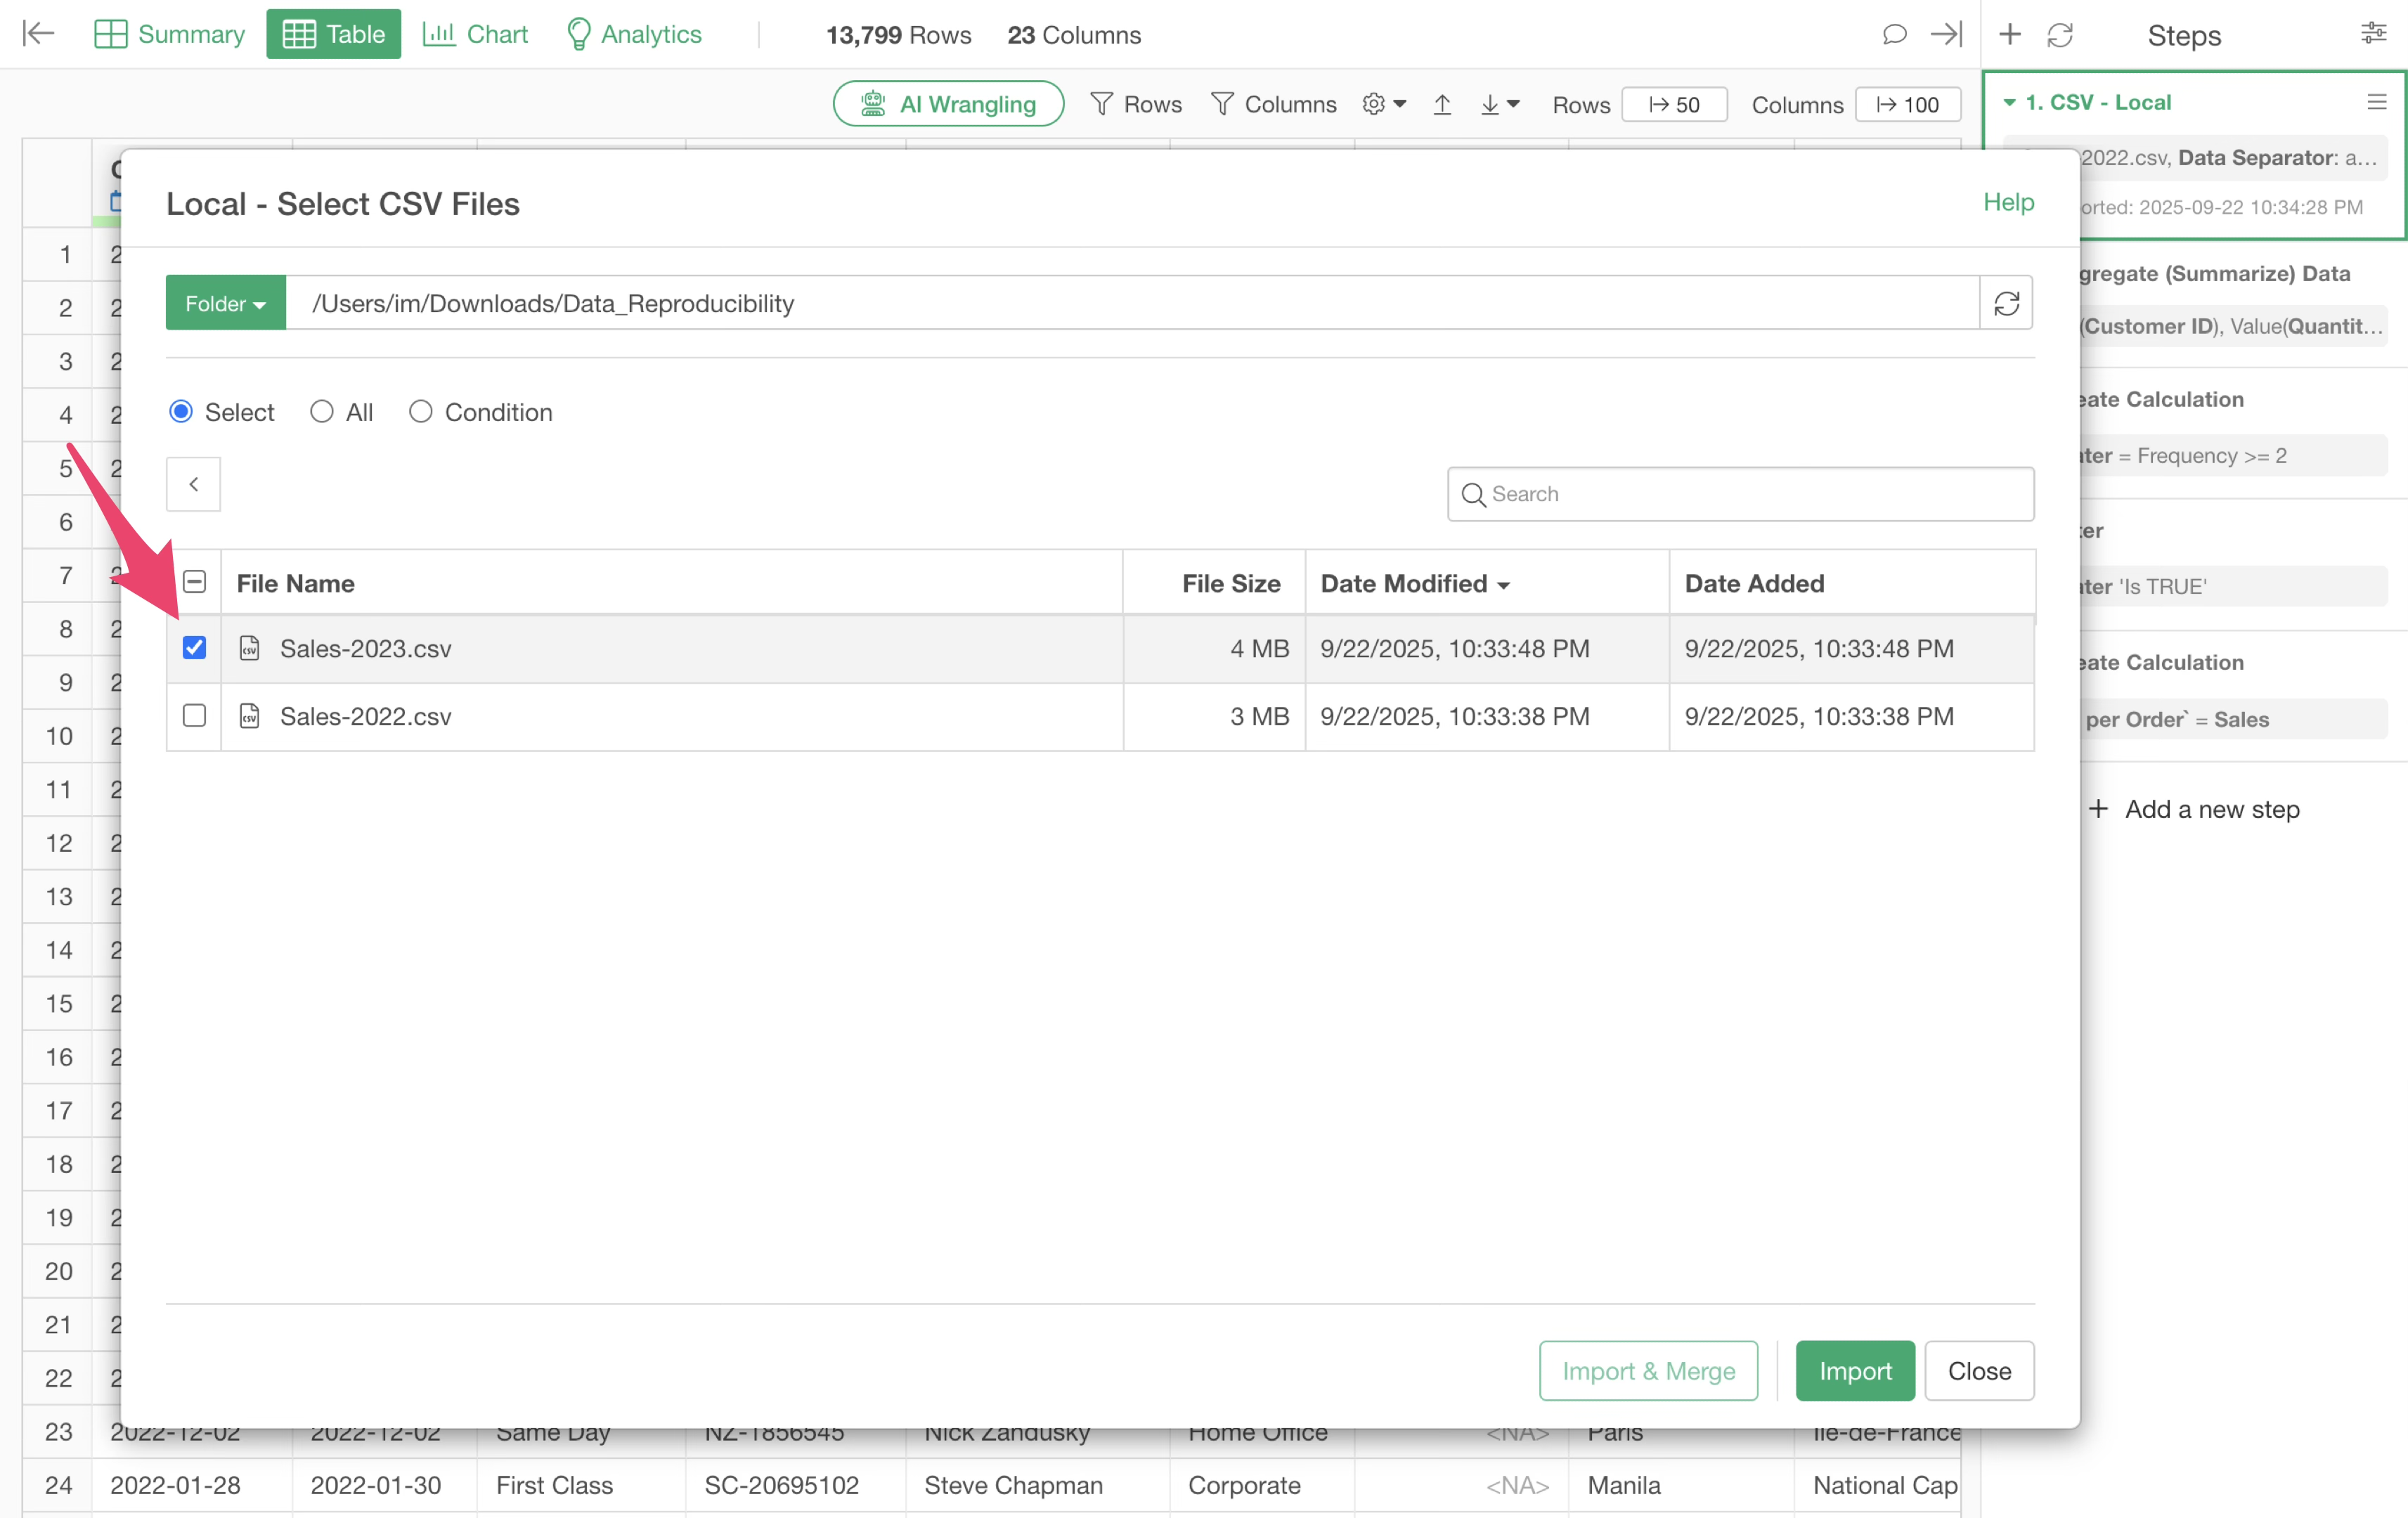
The file selection dialog opens.
Choose the “Sales-2023” file and click the “Import” button.
The import dialog appears. Click the “Update” button.
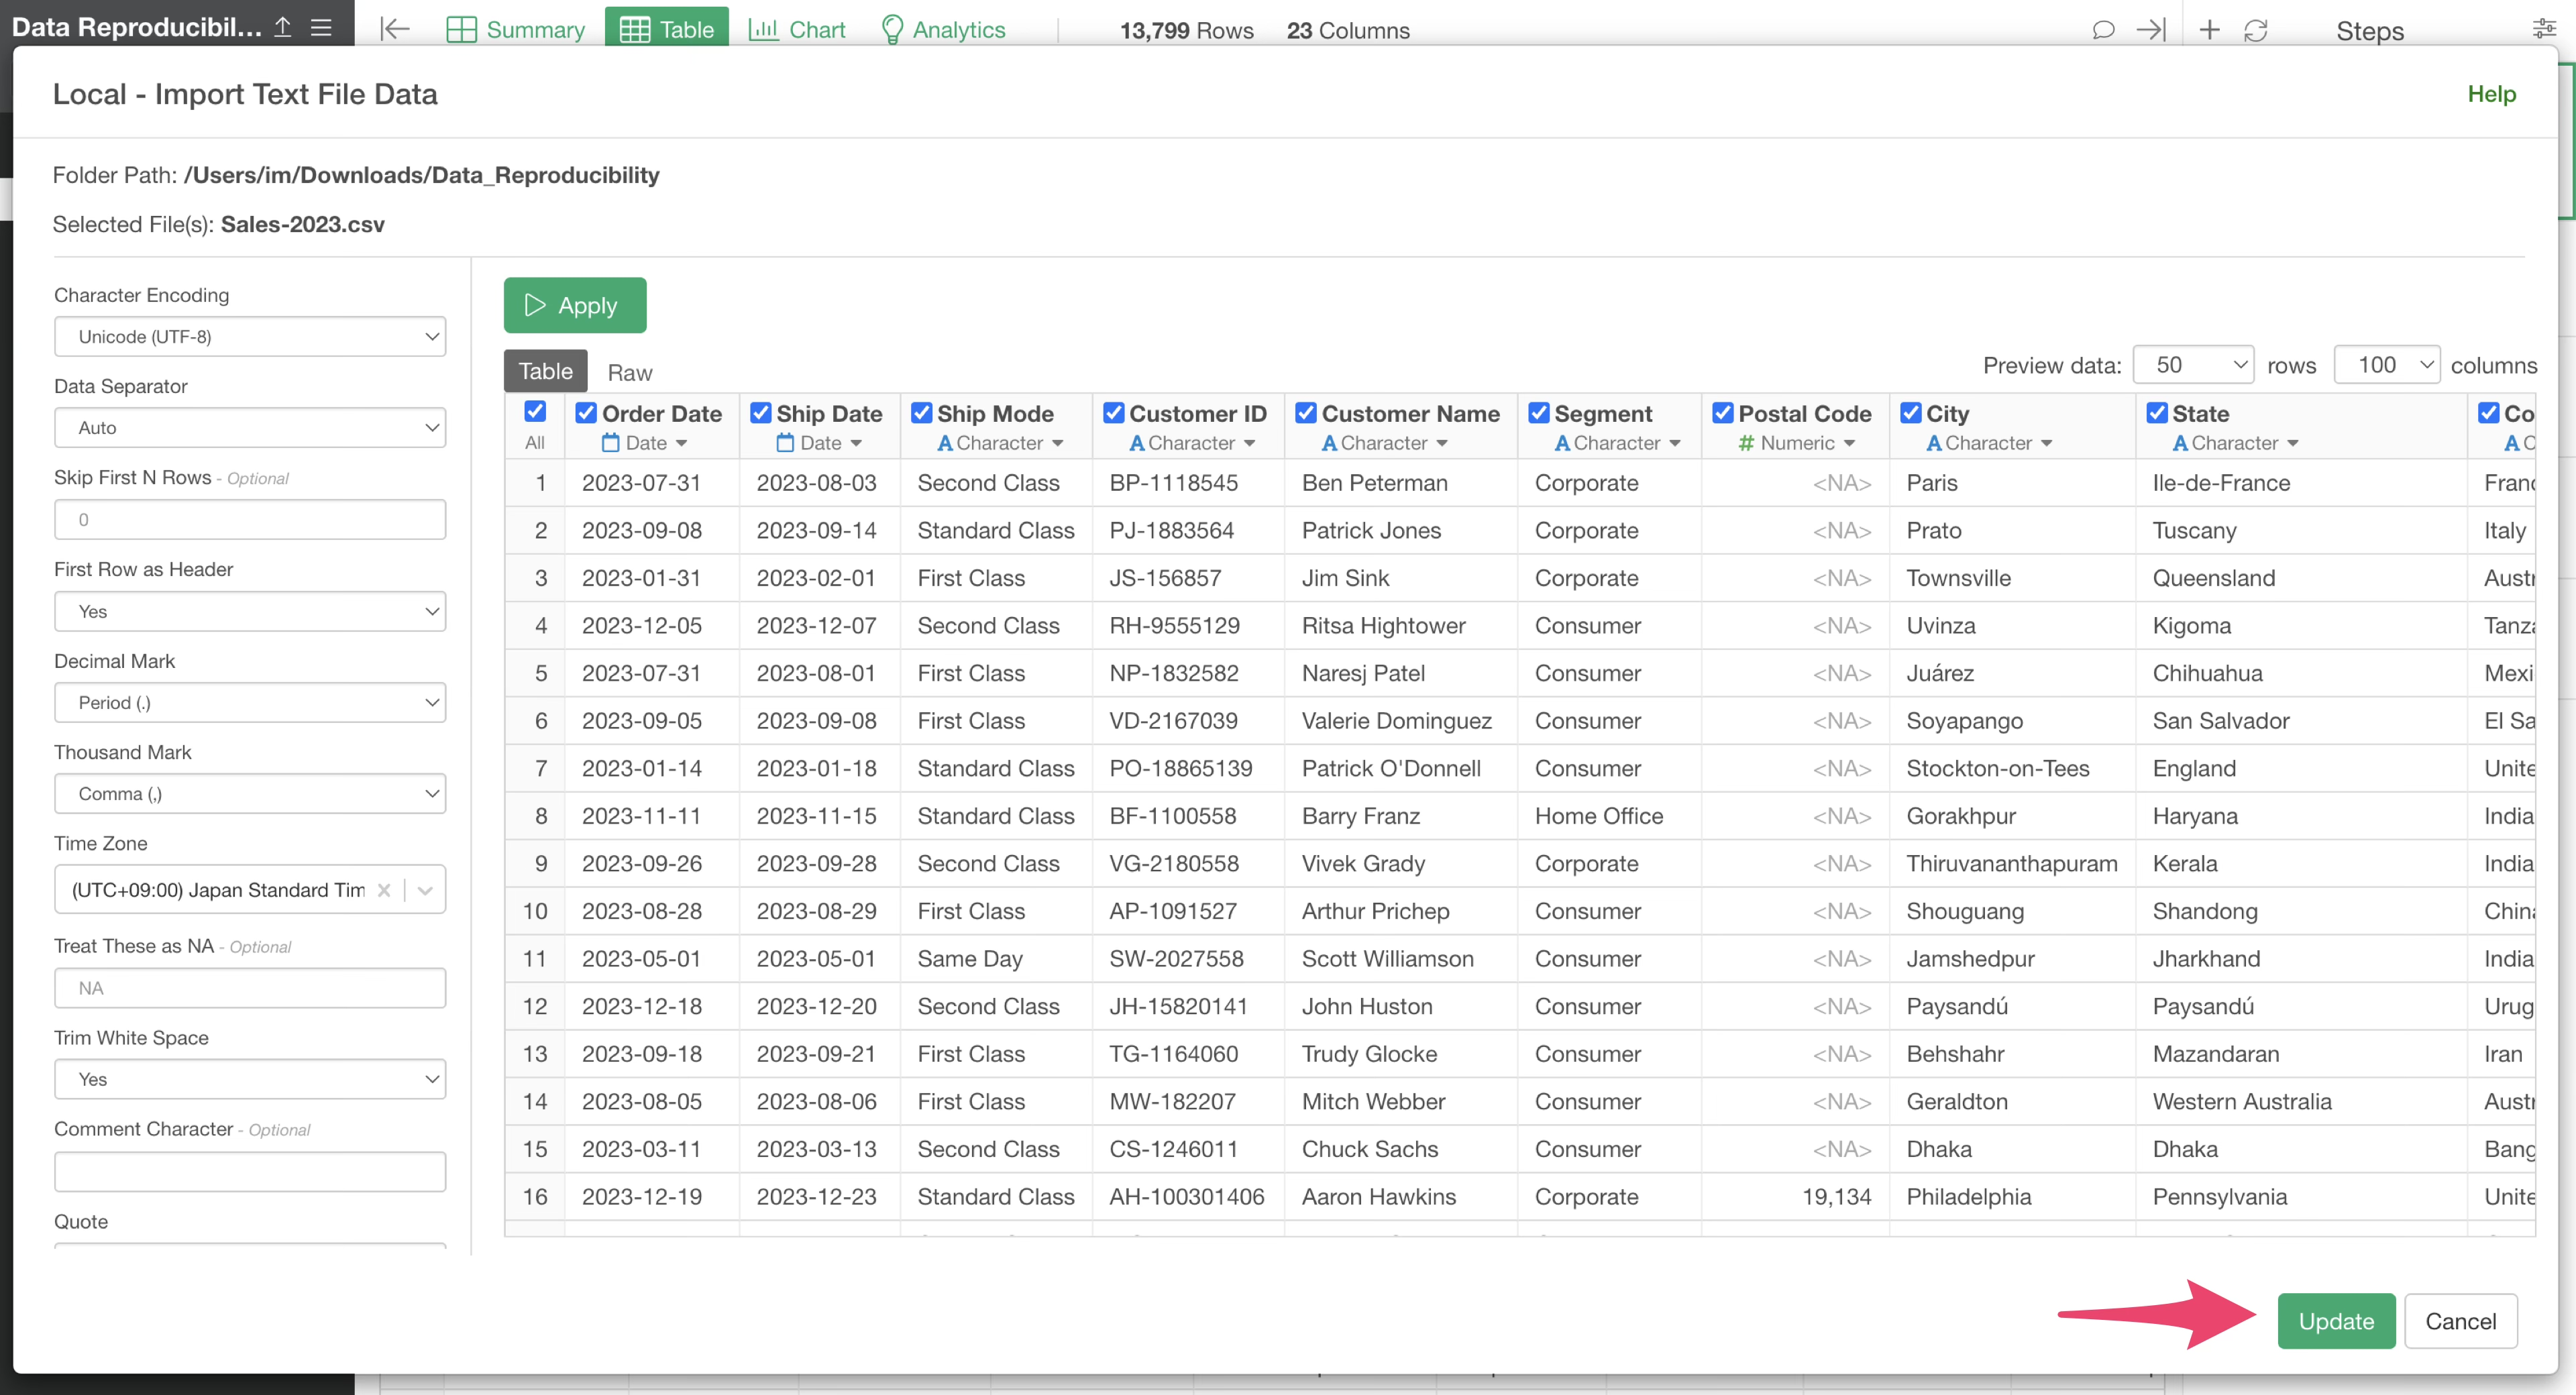
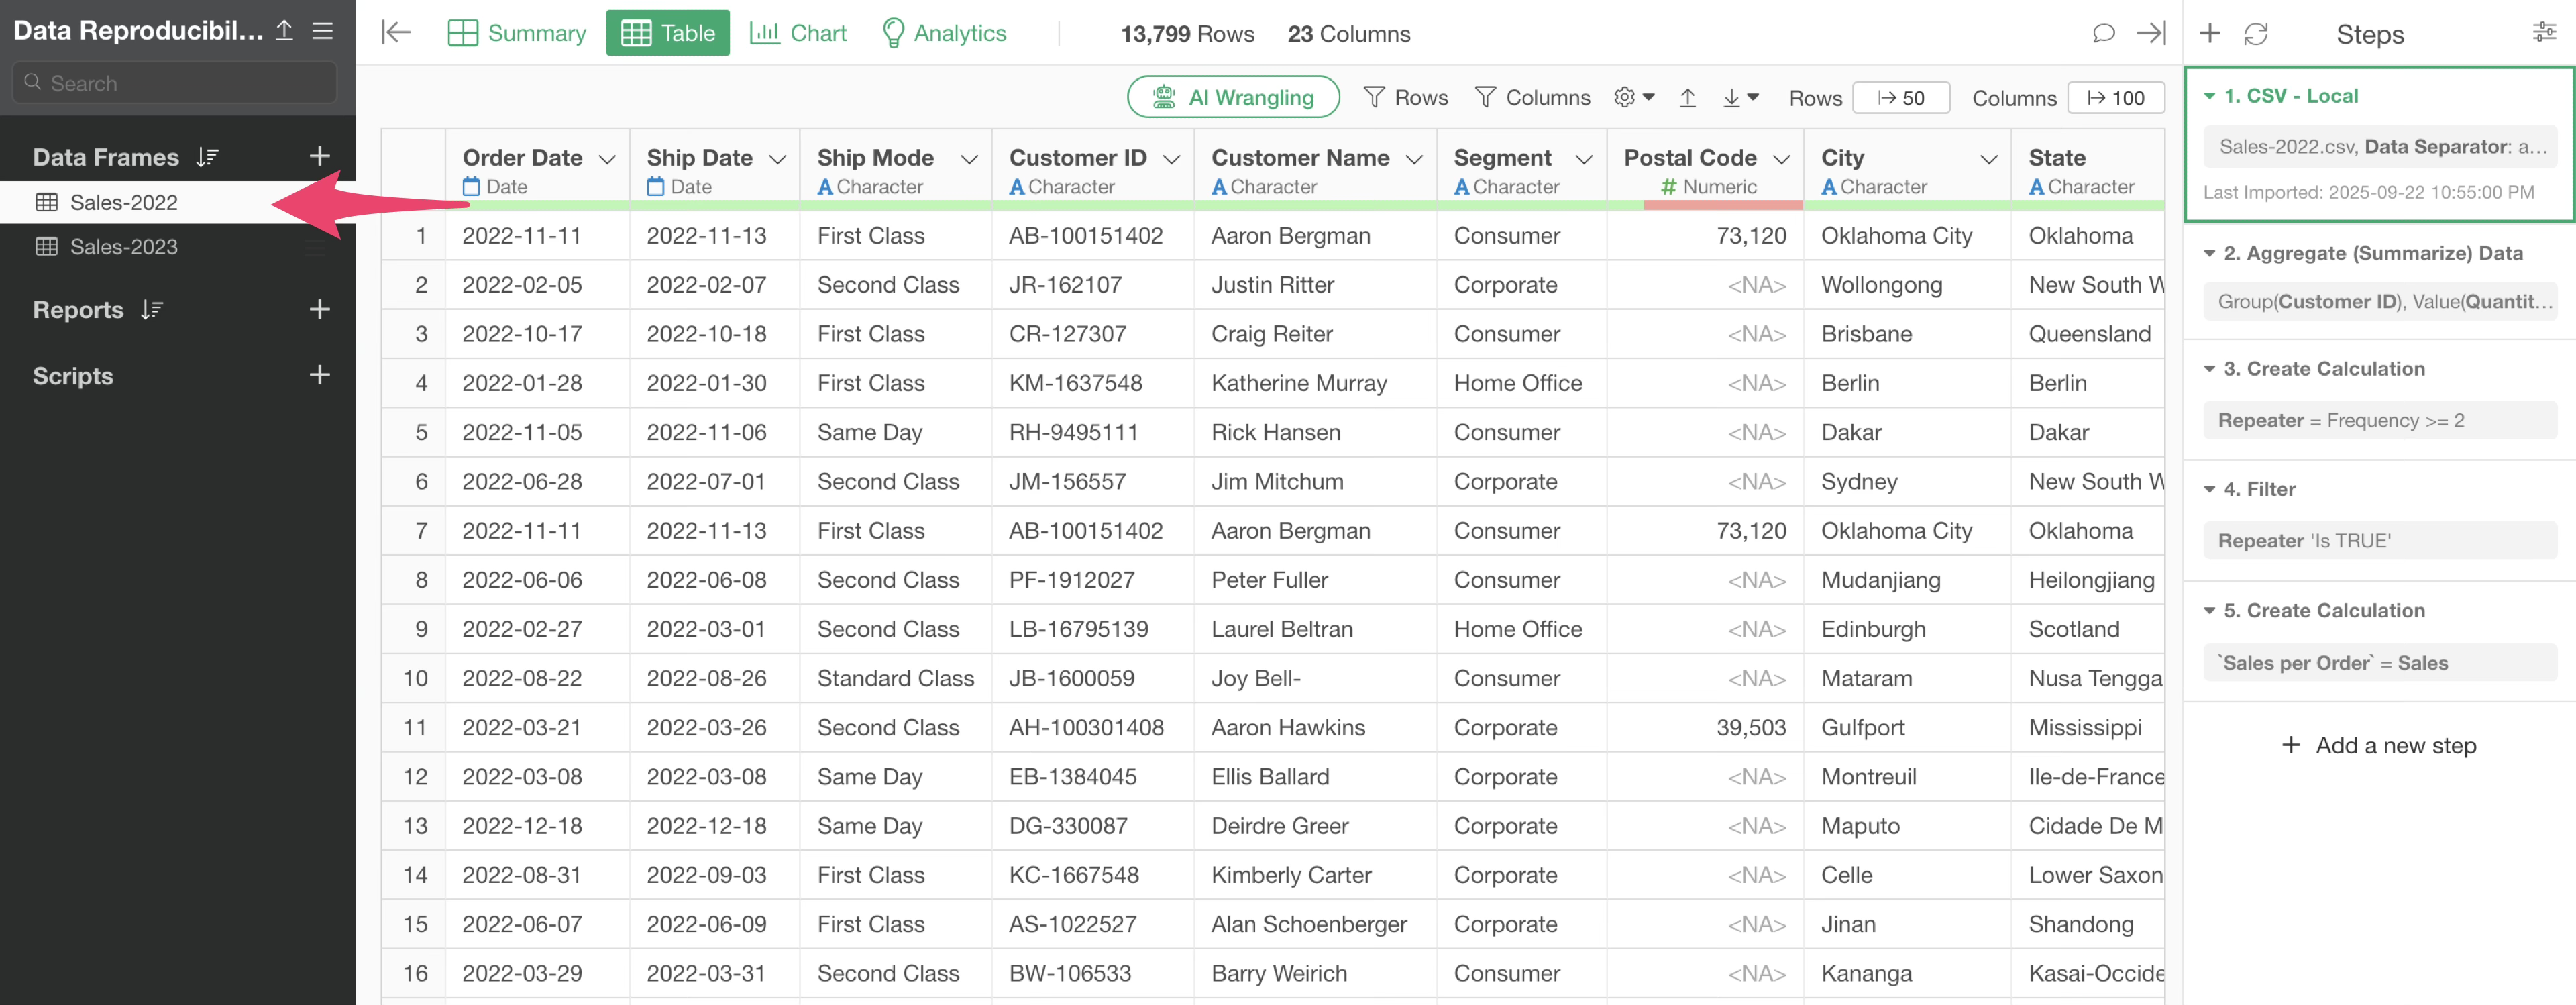
This switches the data source to “Sales-2023” while keeping the data frame unchanged.
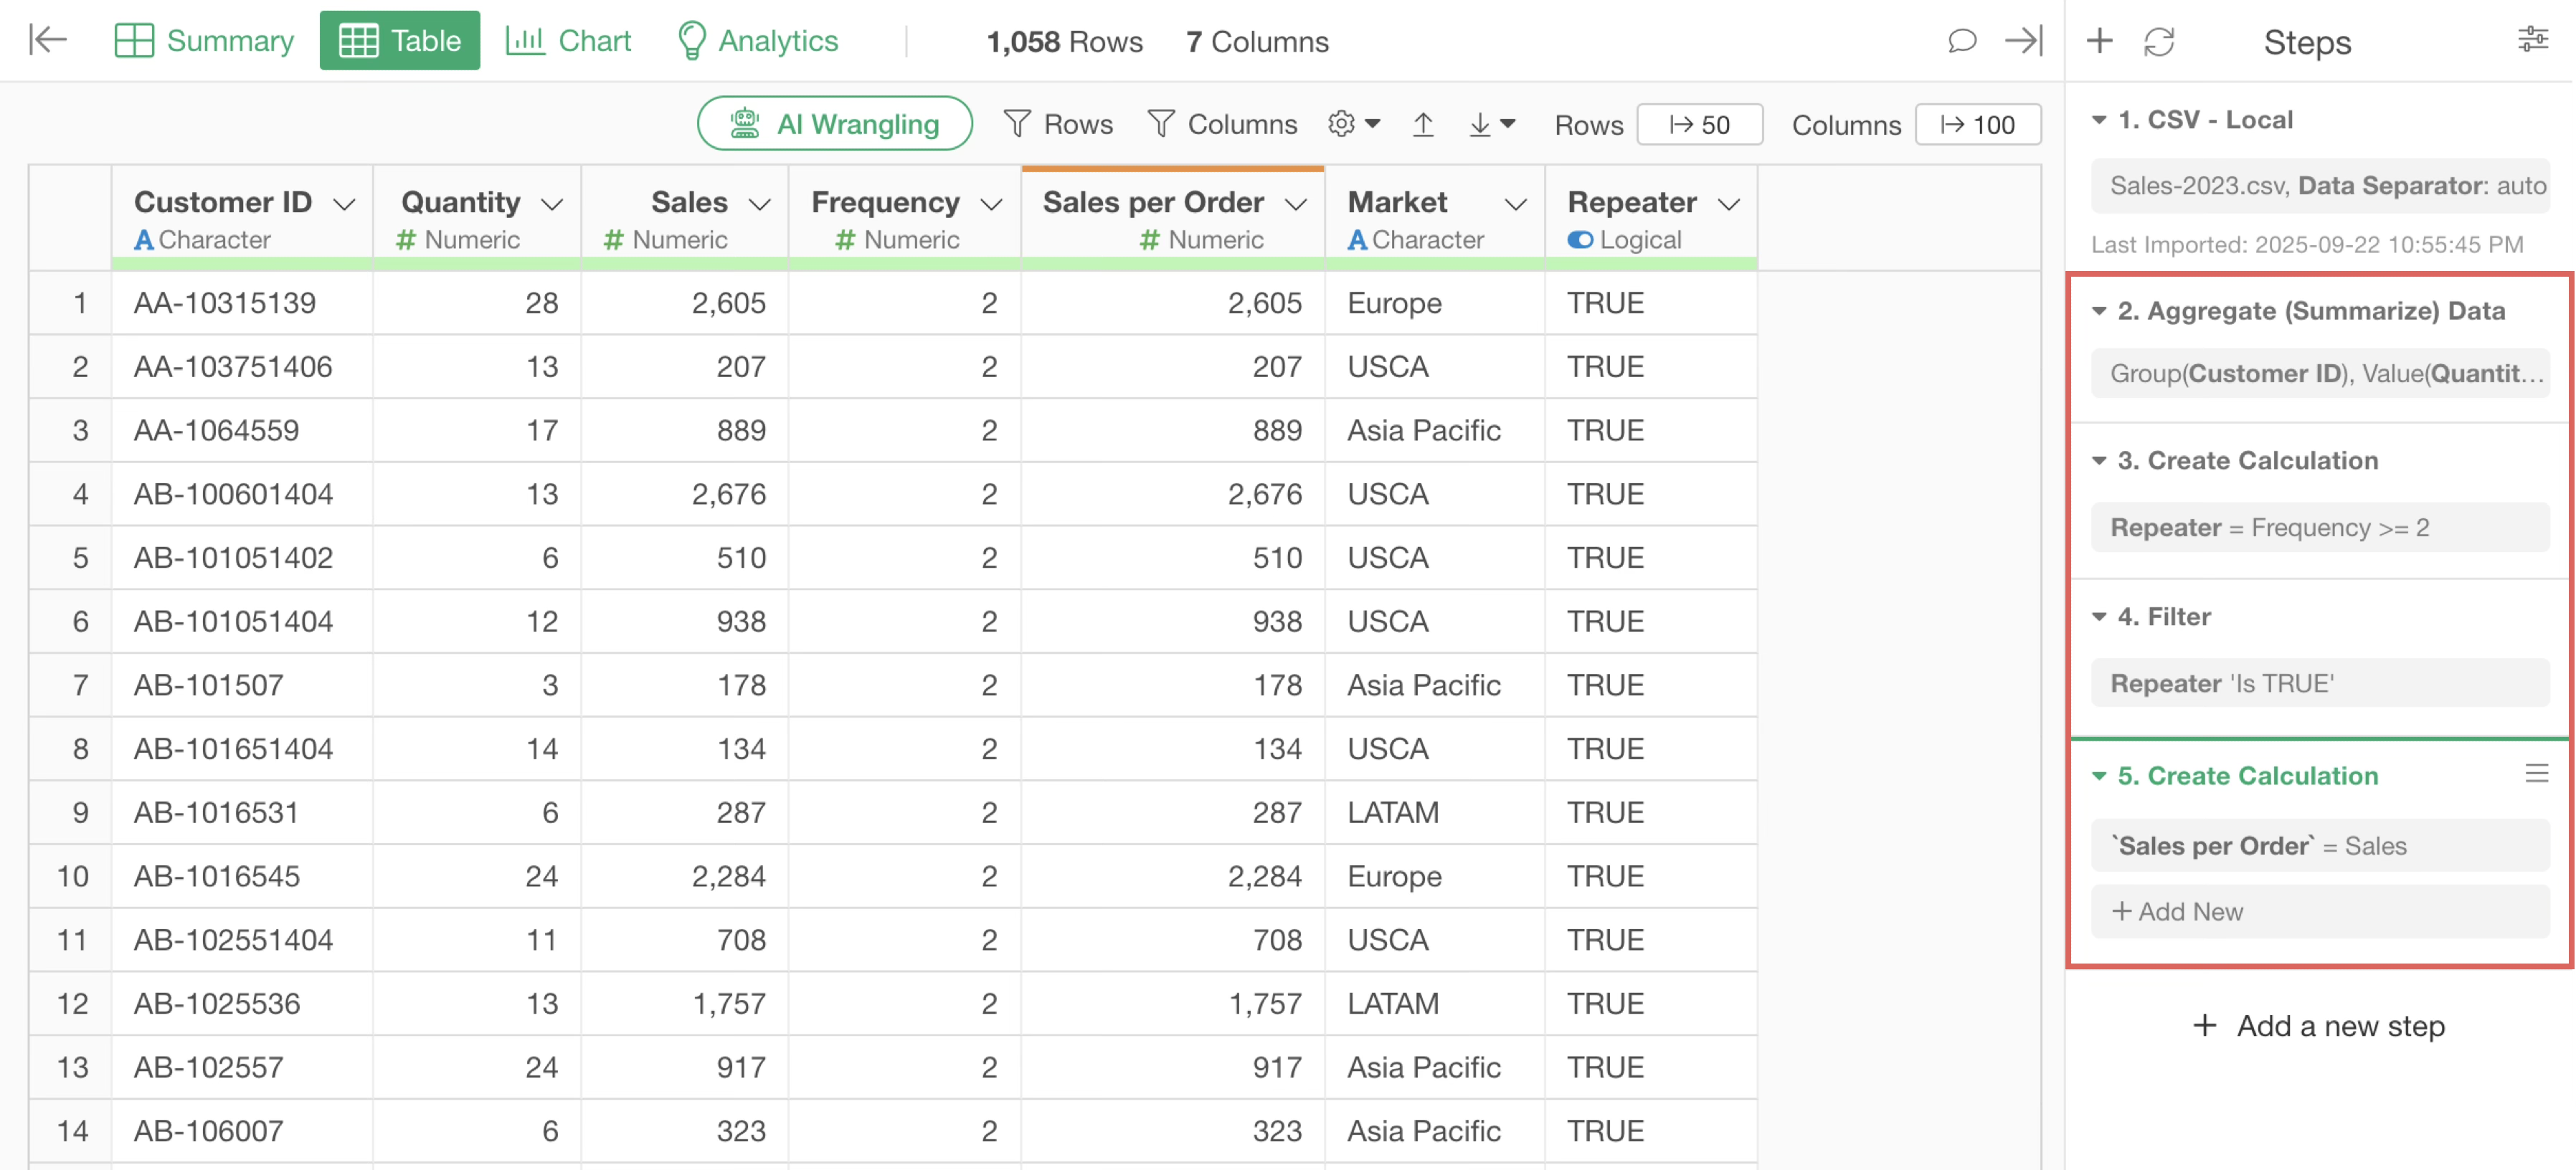
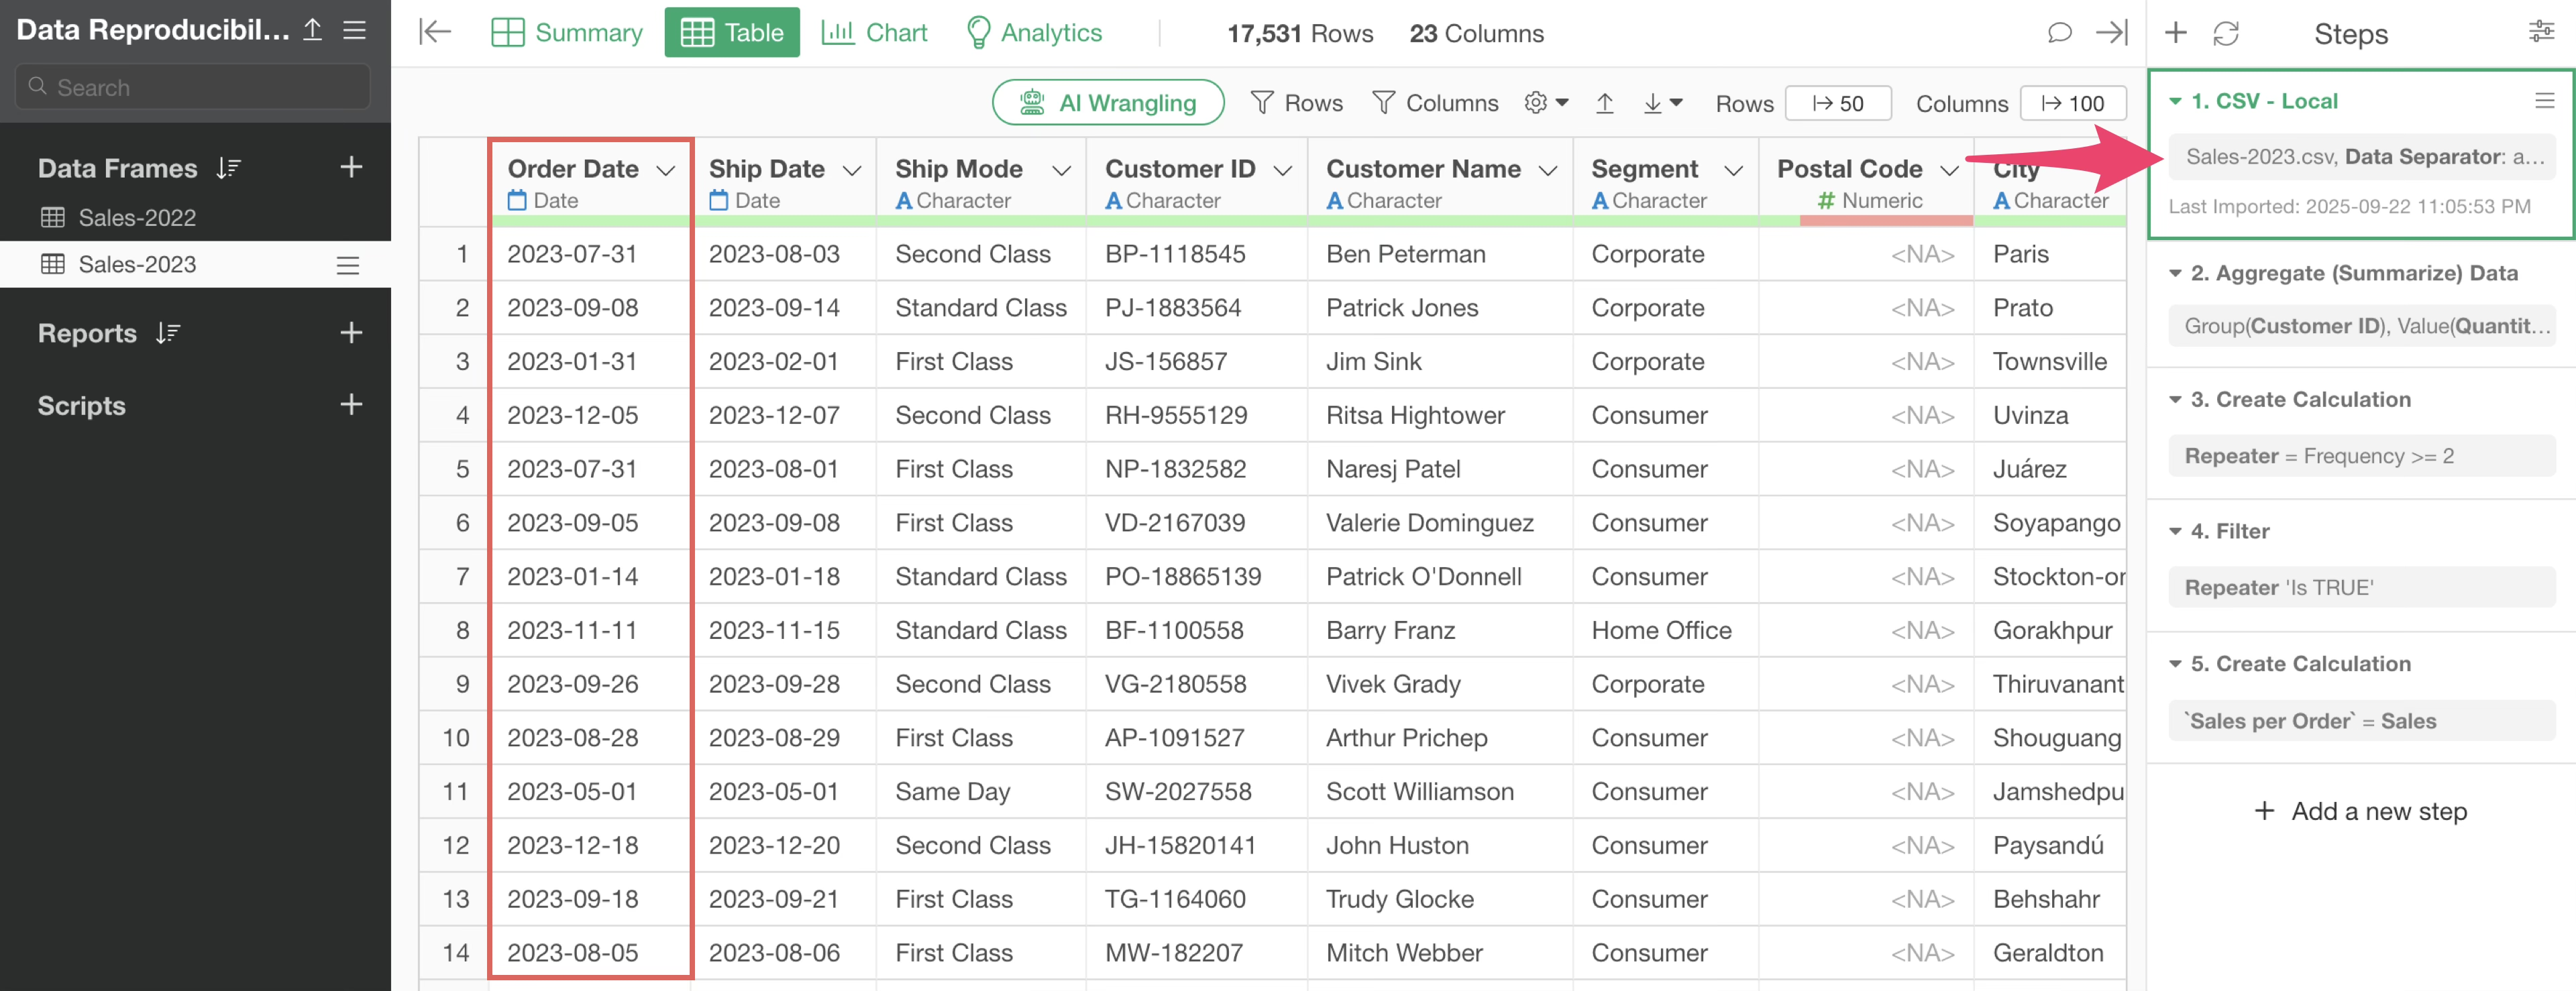
You can see that the data wrangling steps are applied to the updated data source as well.
3. When You Want to Use a Different Data Frame
Sometimes, you might want to keep an existing data frame as is and apply the same step to a new data frame.
You can either apply just the data-wrangling steps to another data frame, or reproduce everything—steps, charts, and analytics.
Let’s explore both methods.
Reproducing Only Data Wrangling Steps
Exploratory allows you to copy steps and paste them into another data frame to execute the same processing.
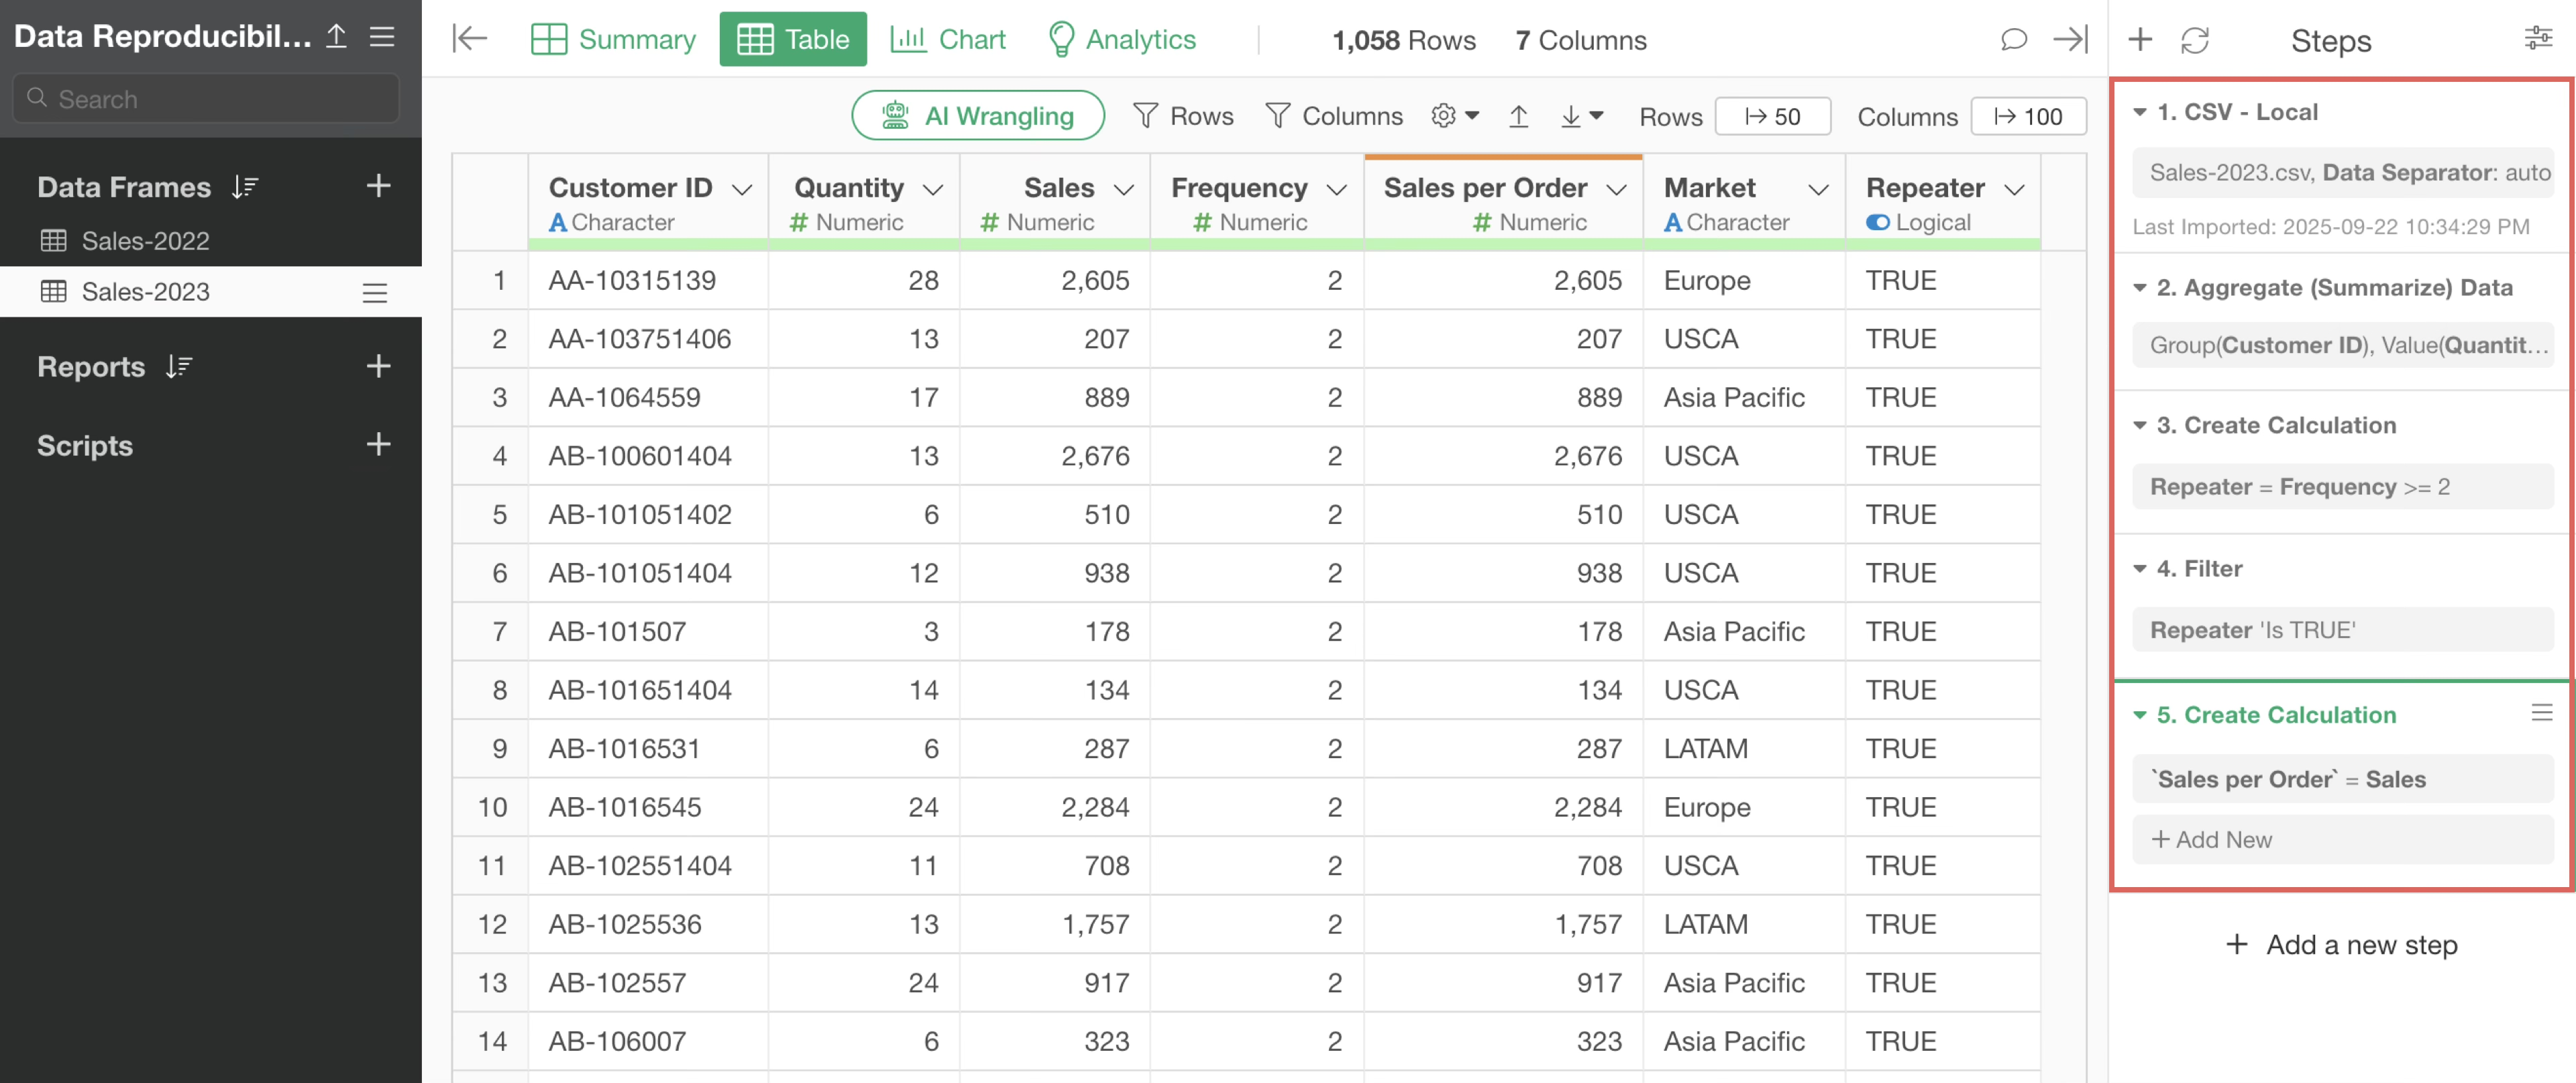
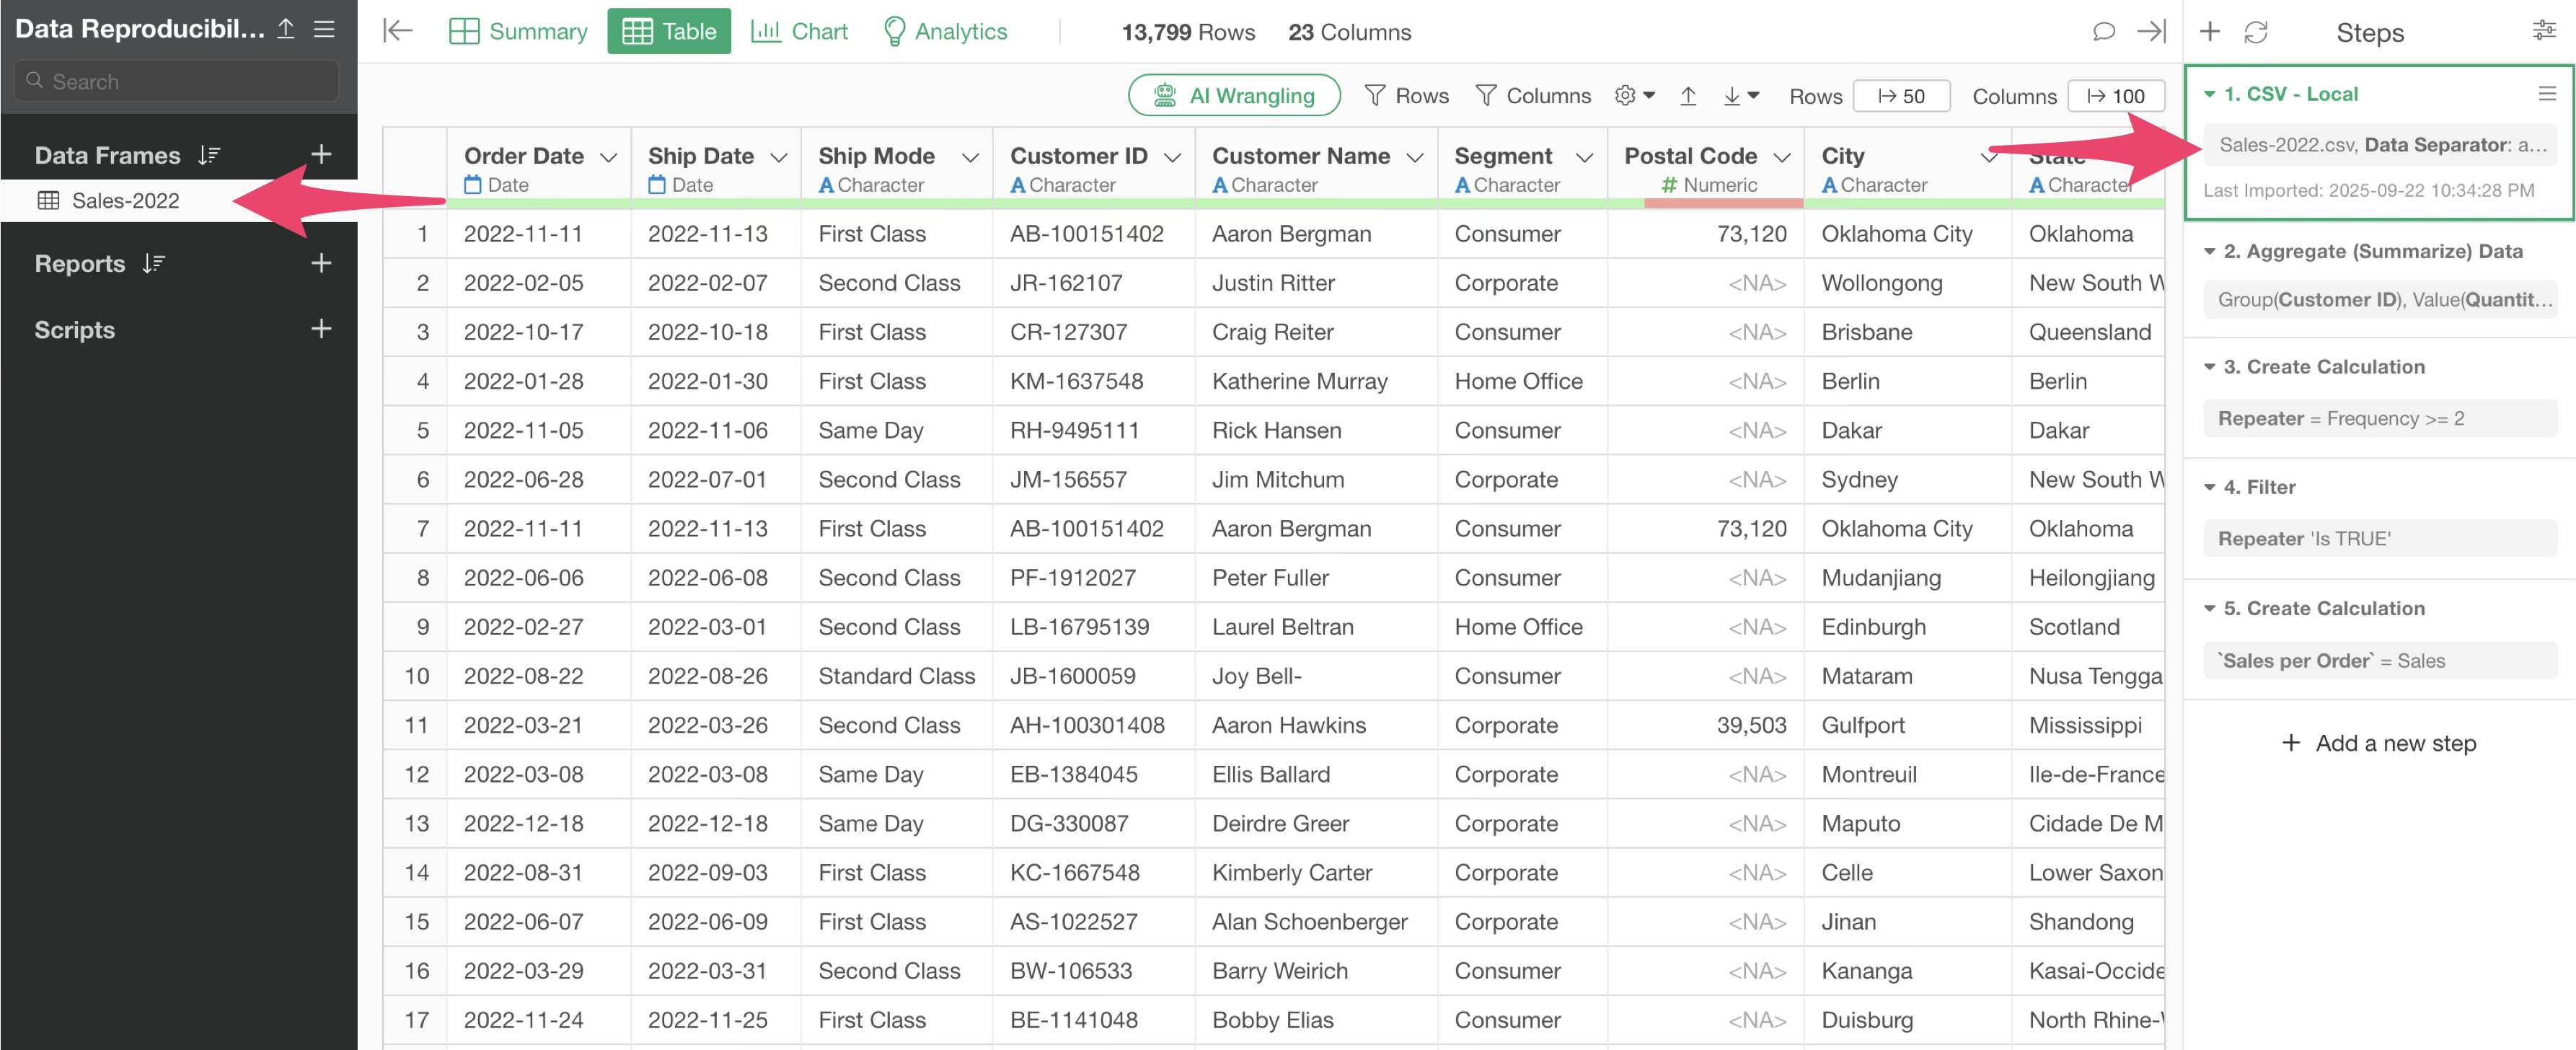
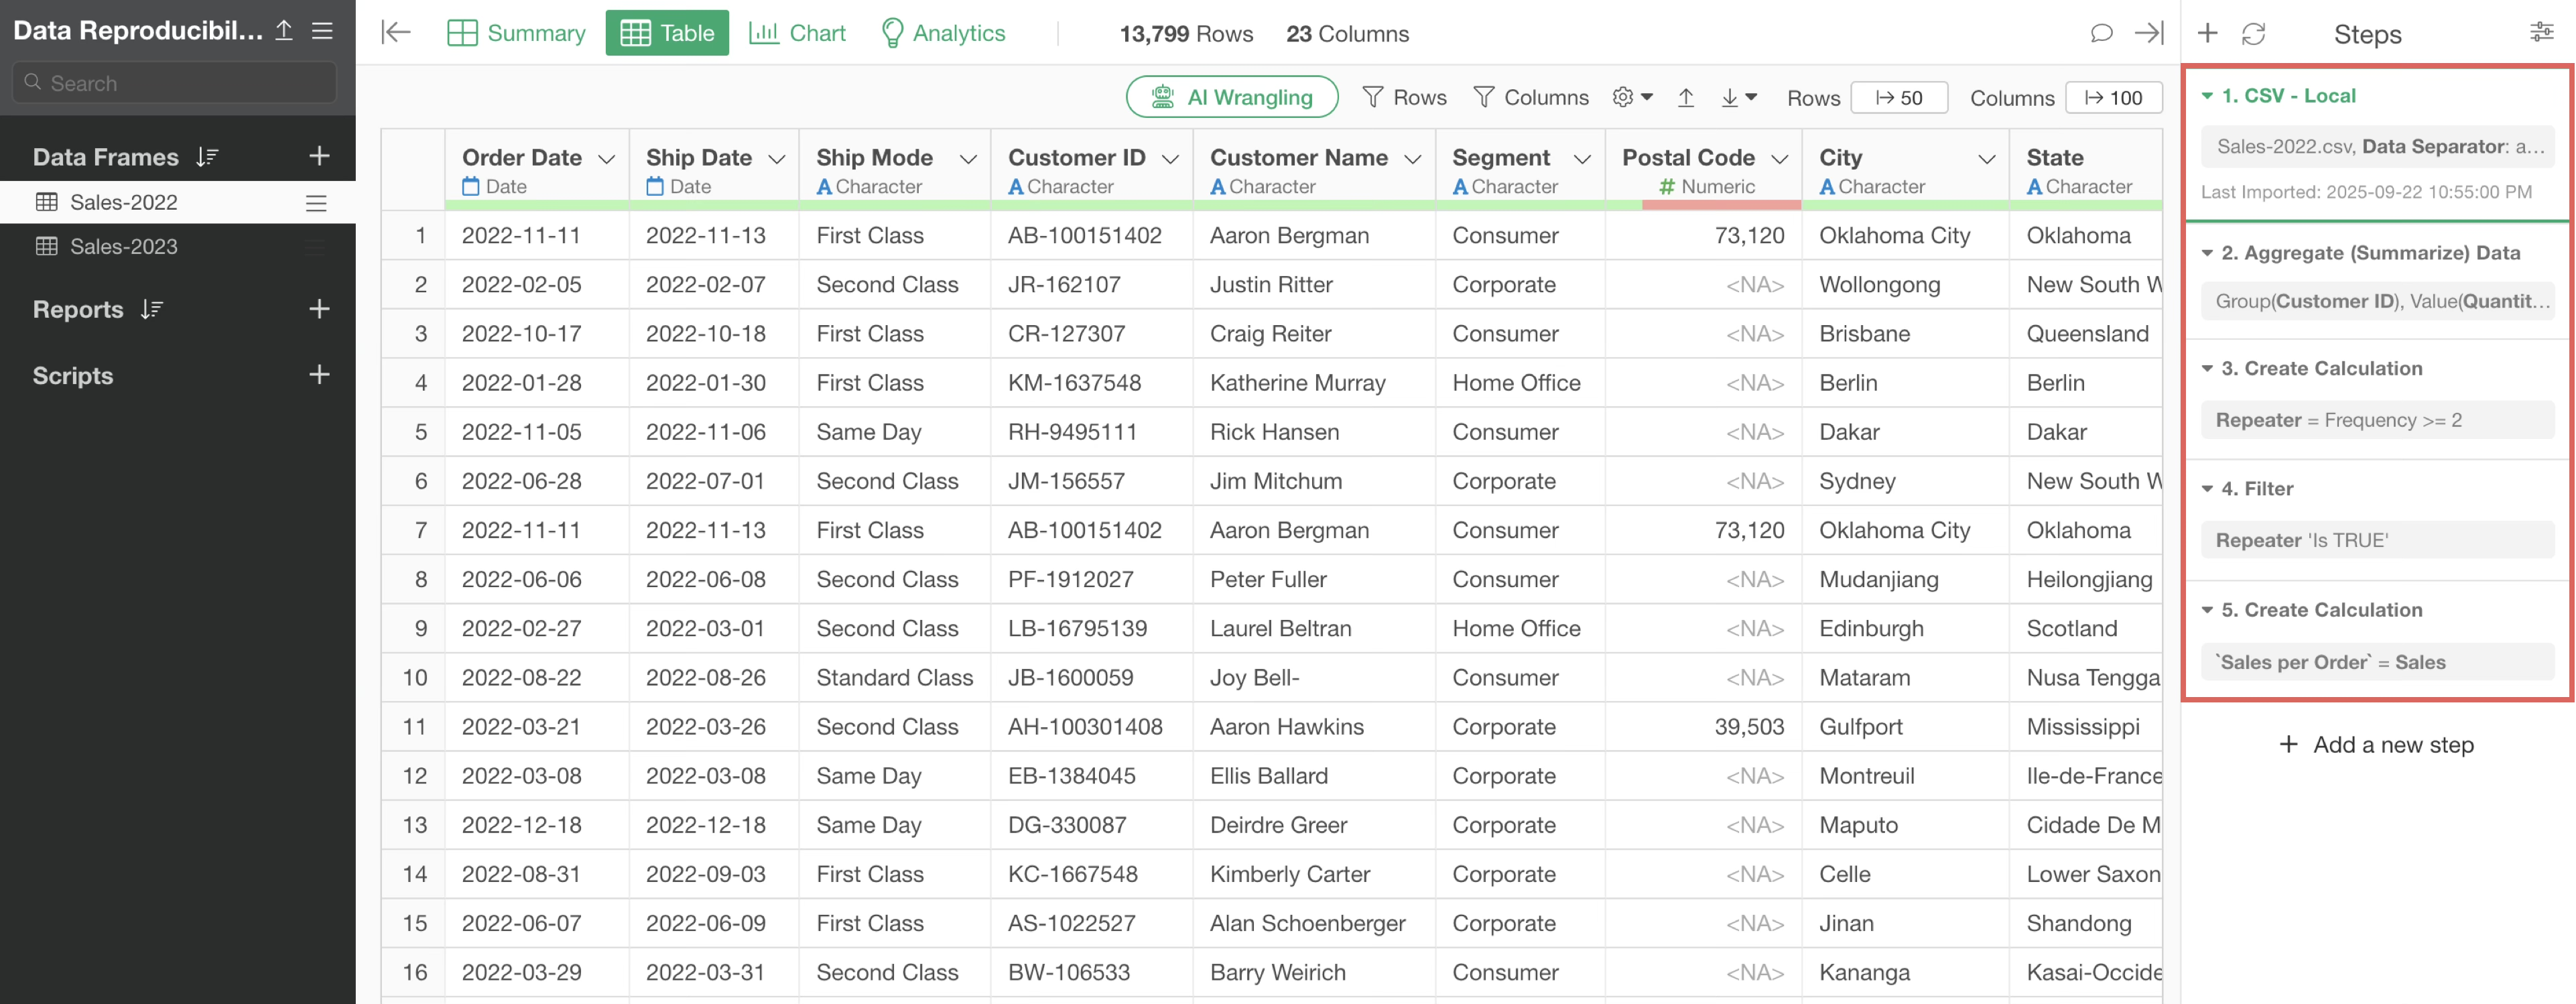
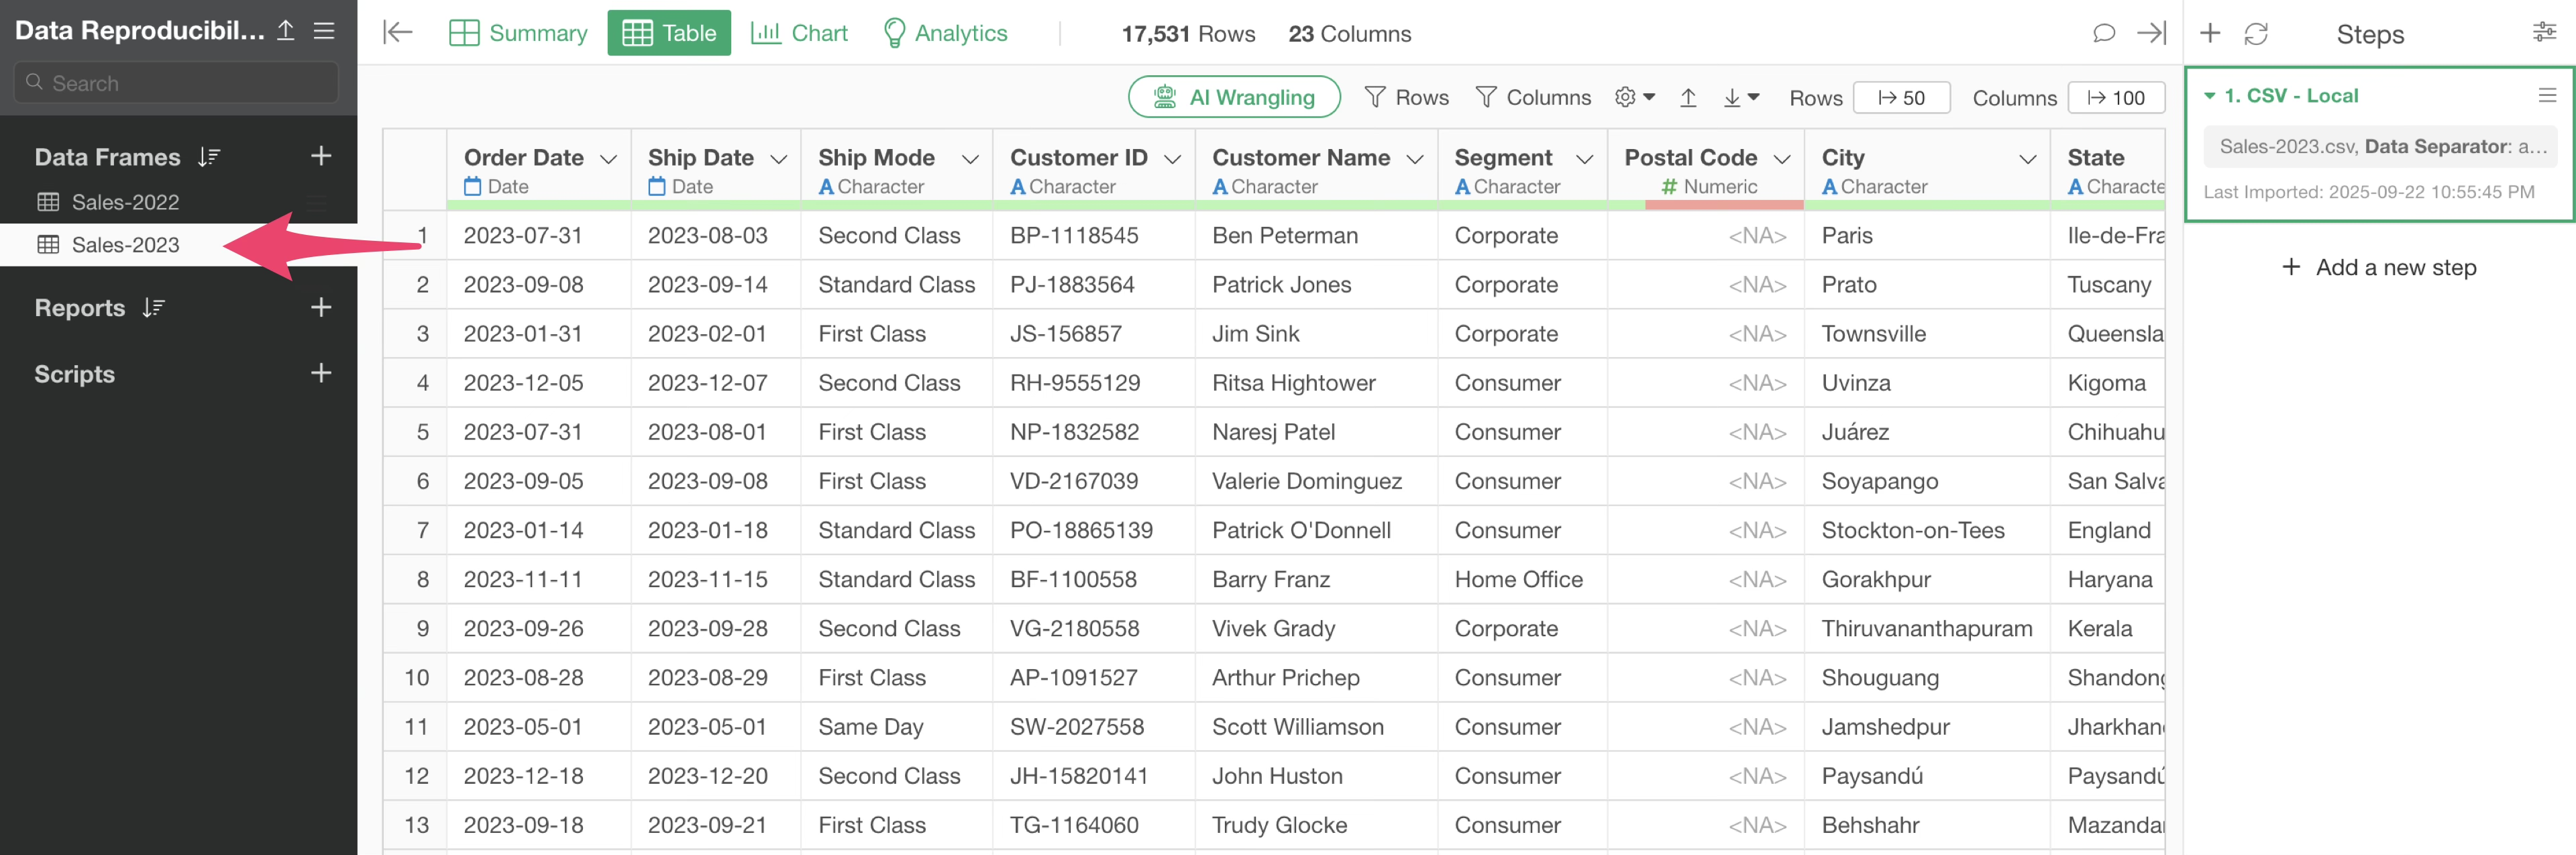
First, open the “Sales-2022” data frame.
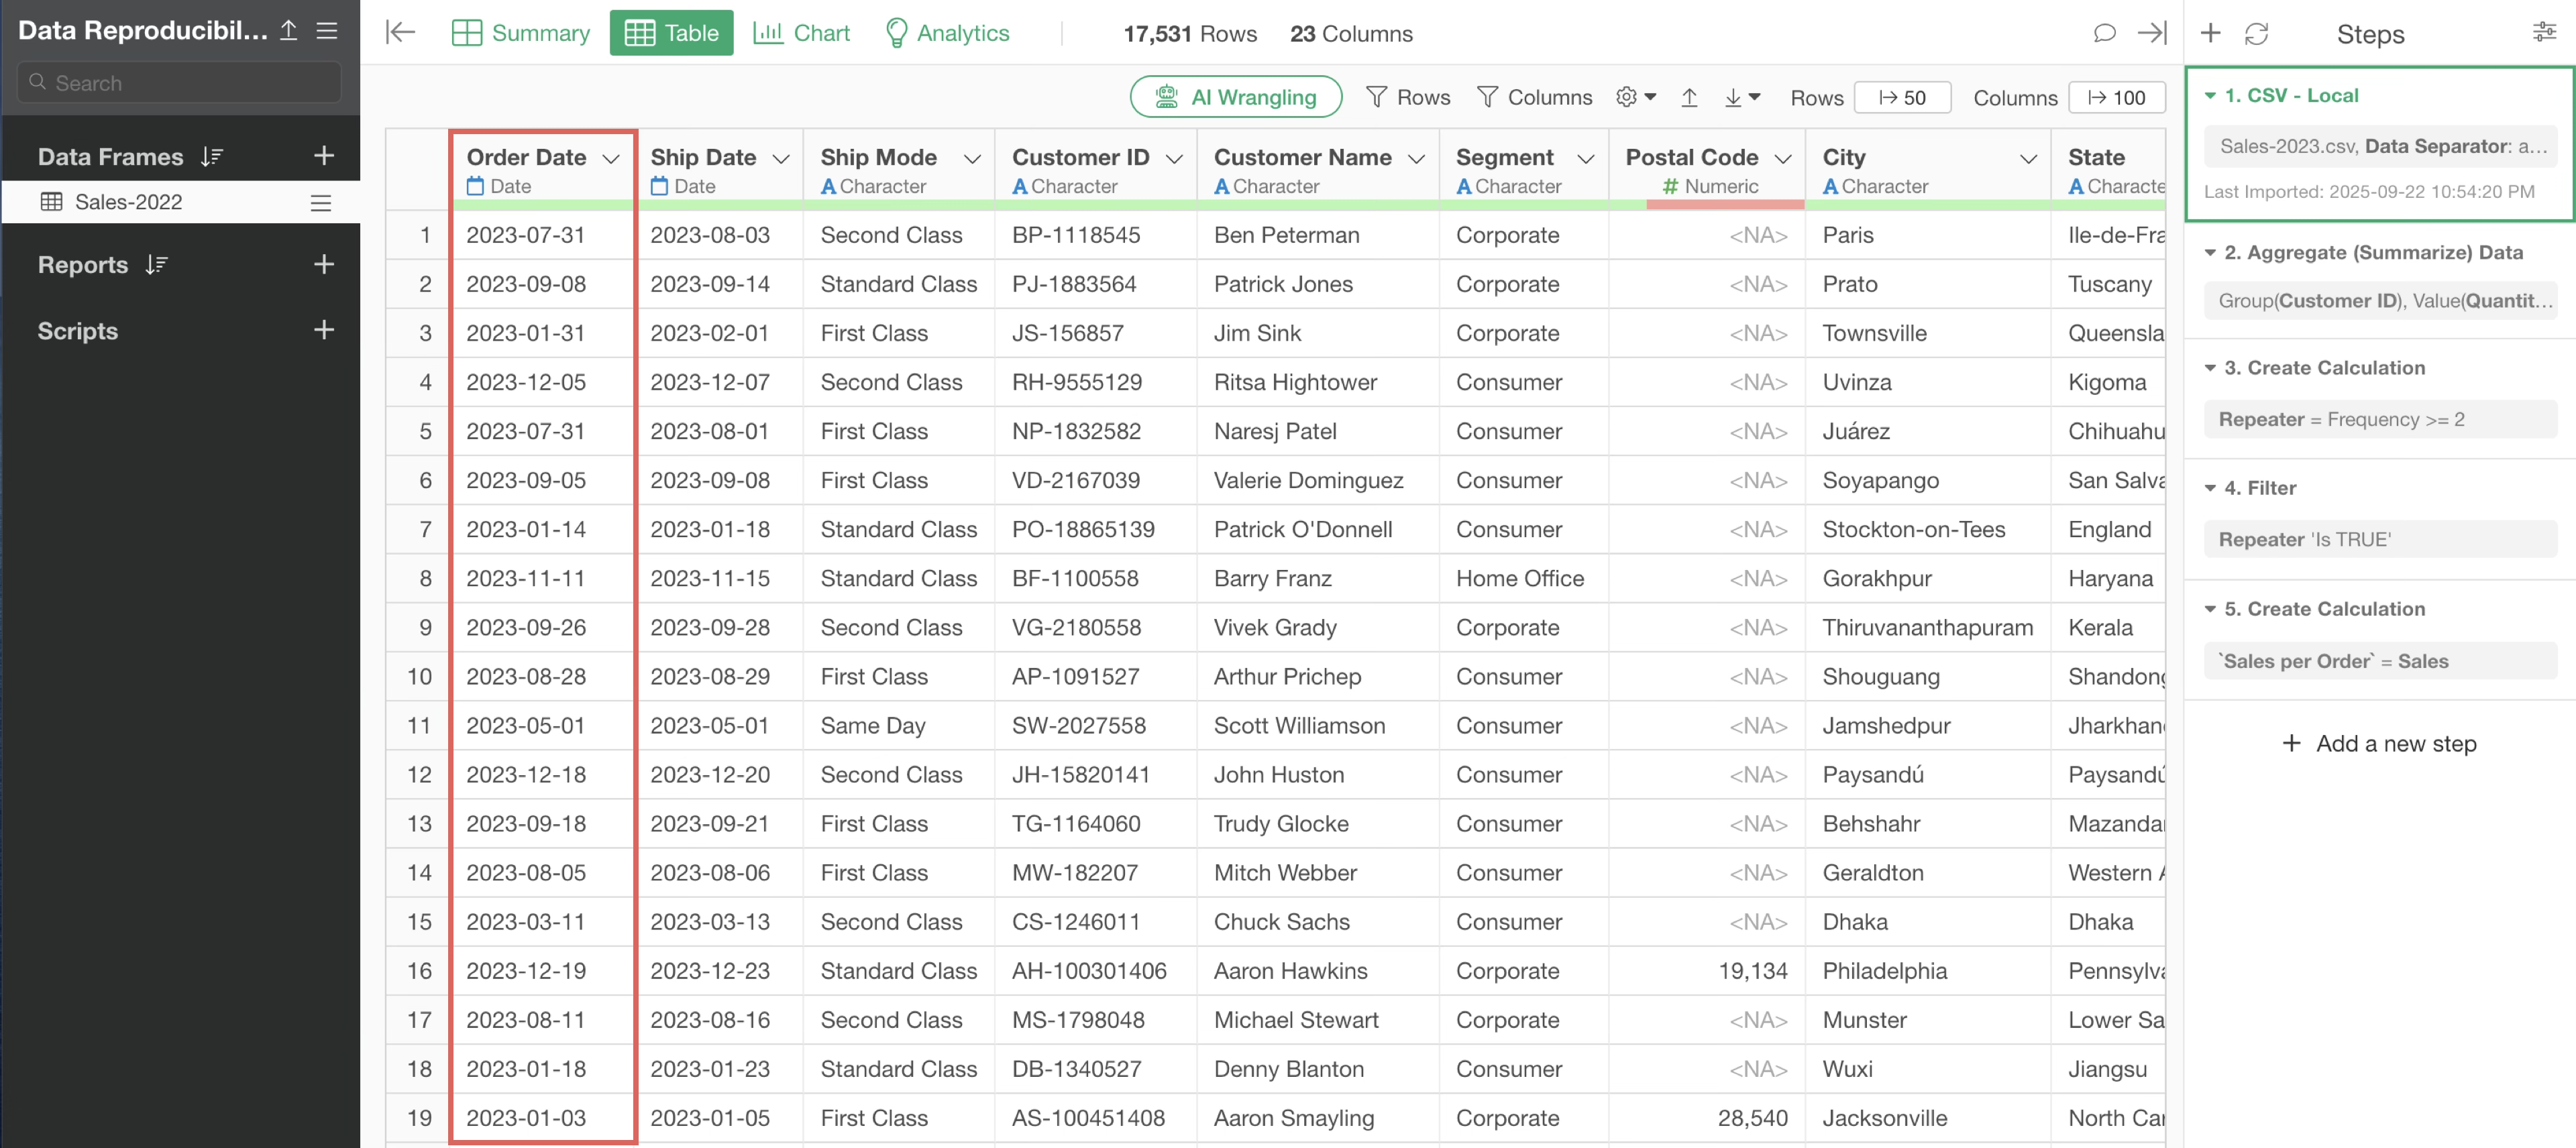
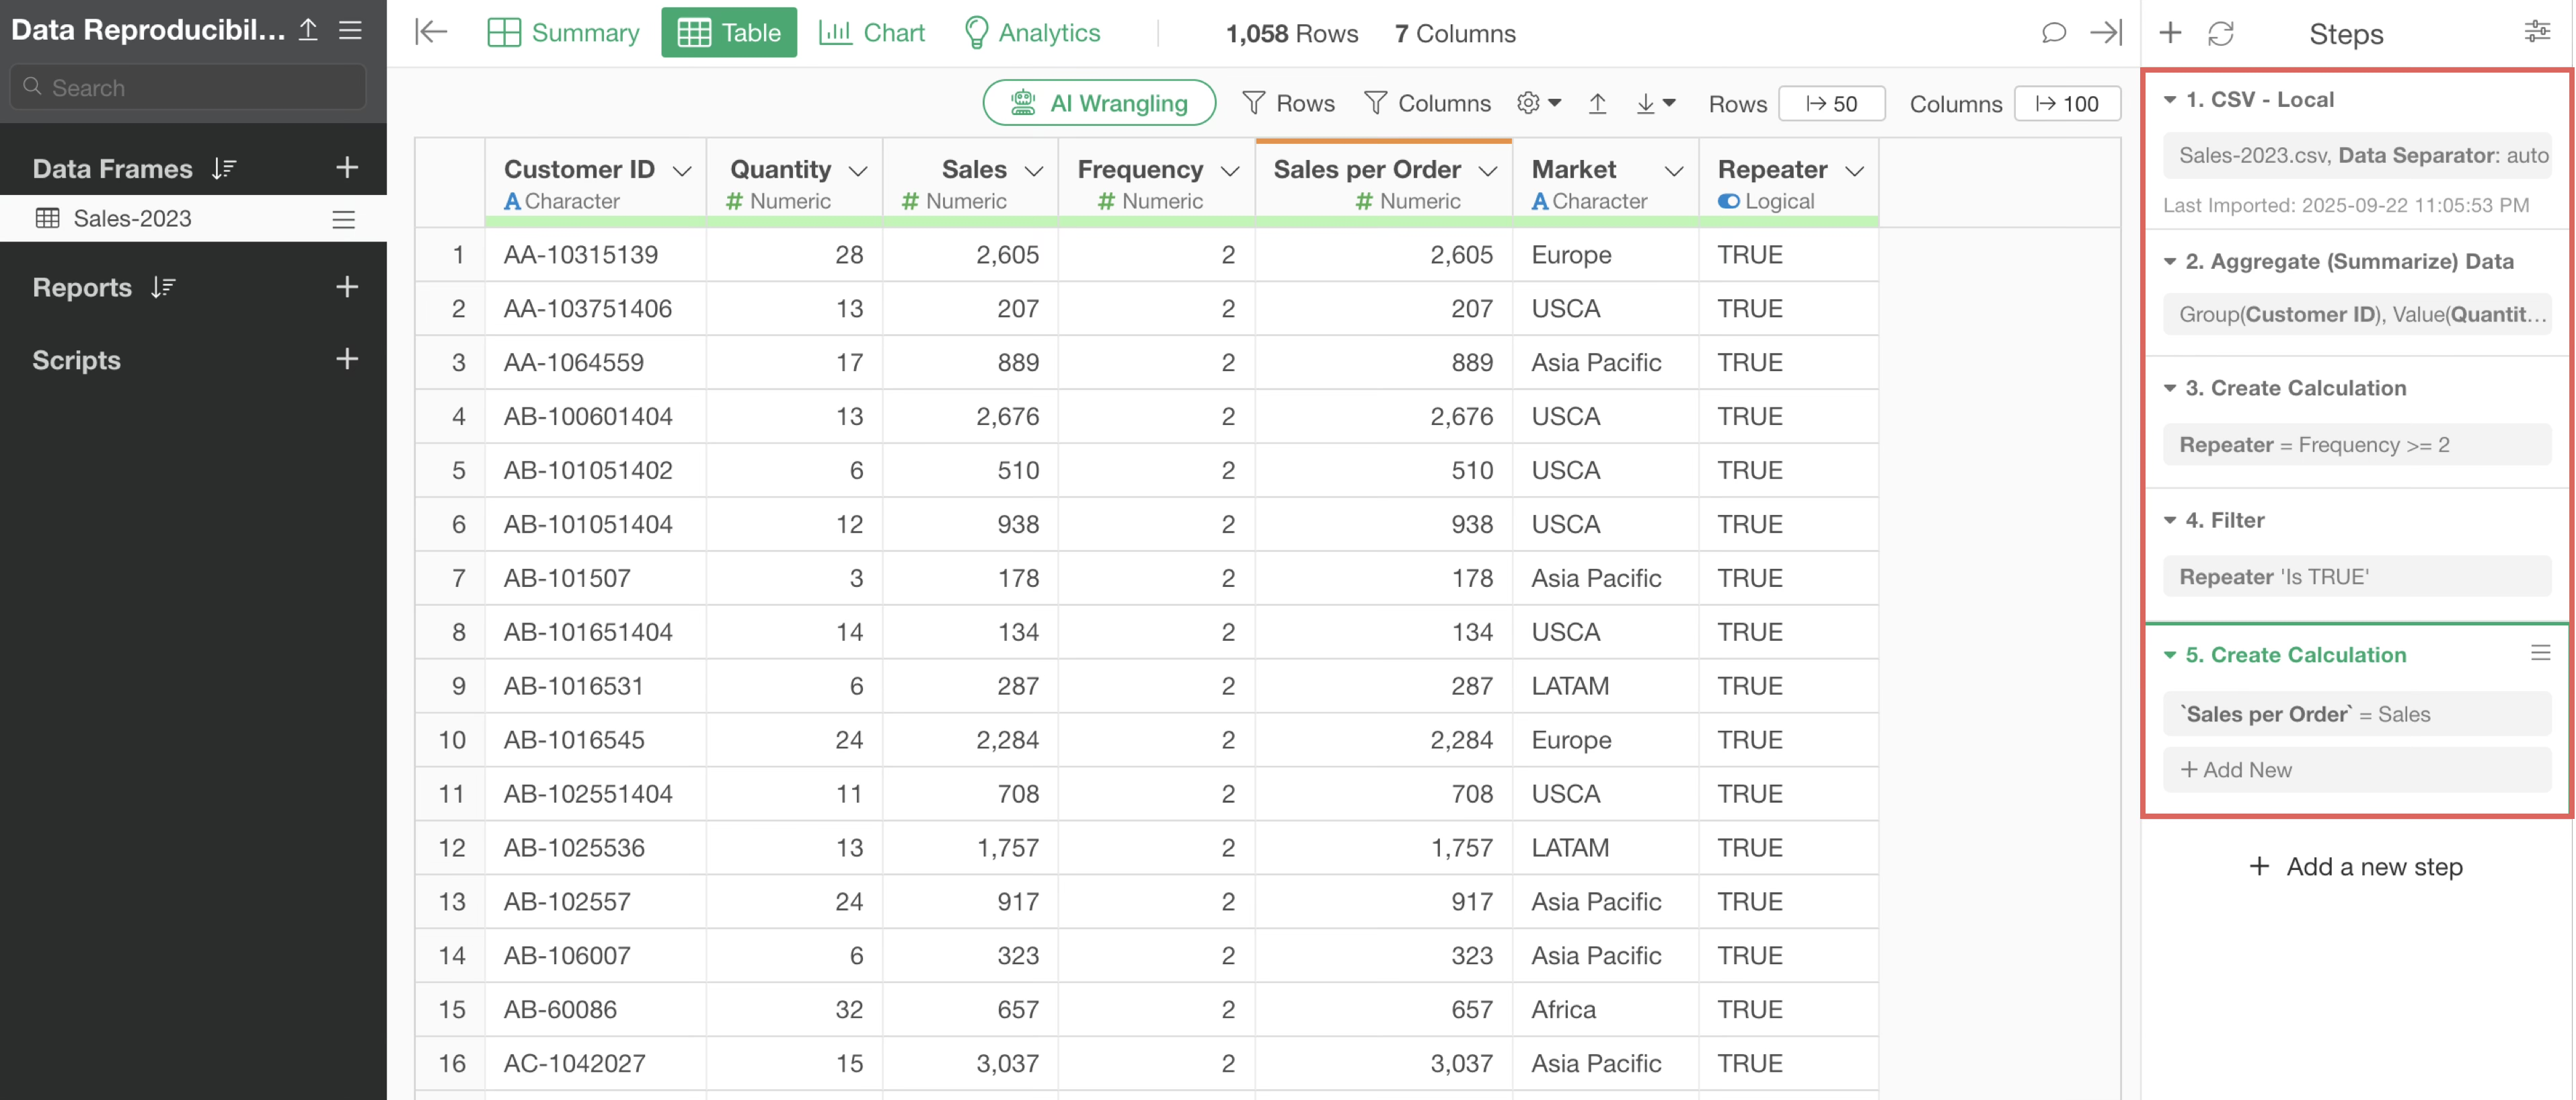
You can see that the “Sales-2022” data frame has several steps.
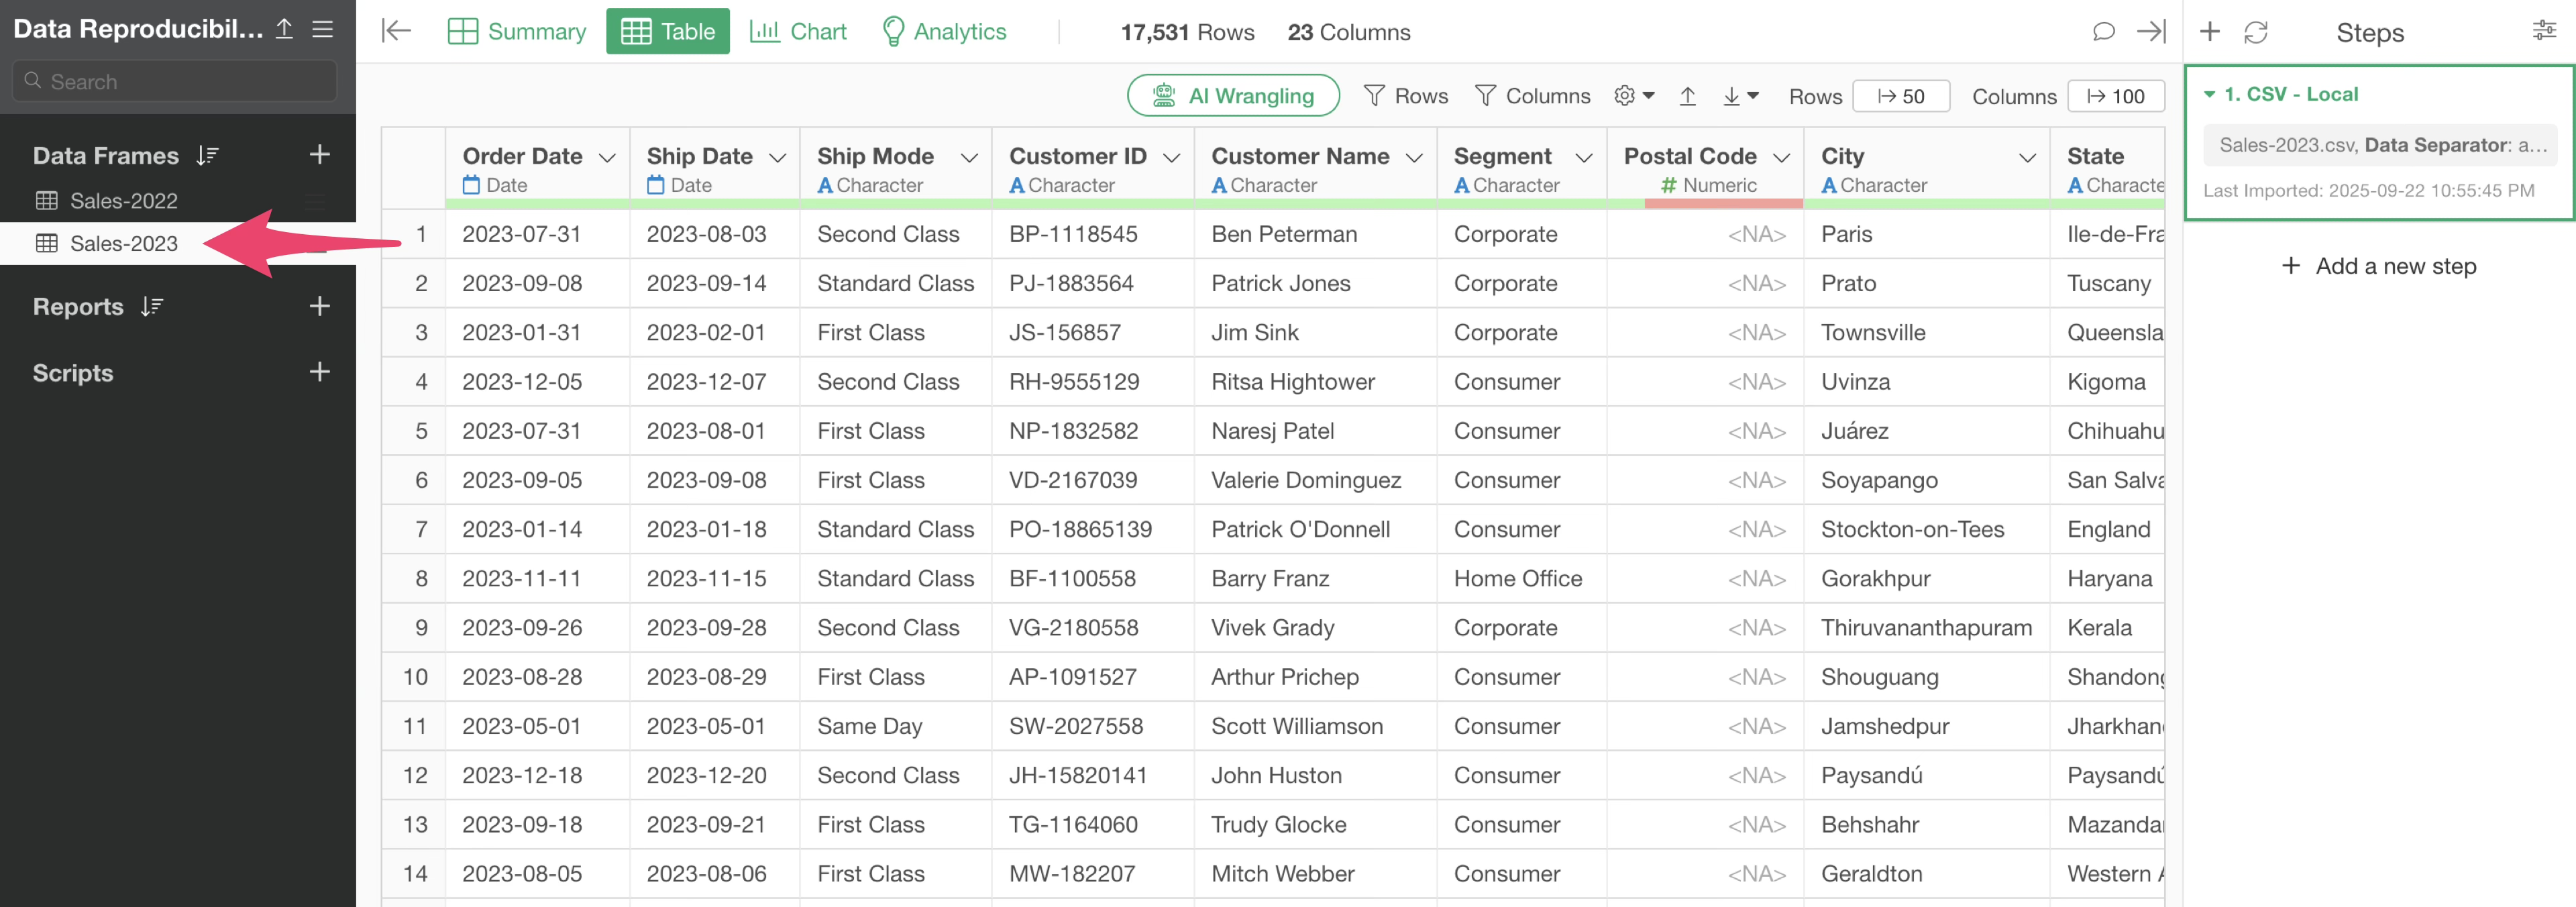
In contrast, the “Sales-2023” data frame only has the import step.
Now, let’s say you want to apply the steps from “Sales-2022” to “Sales-2023.”
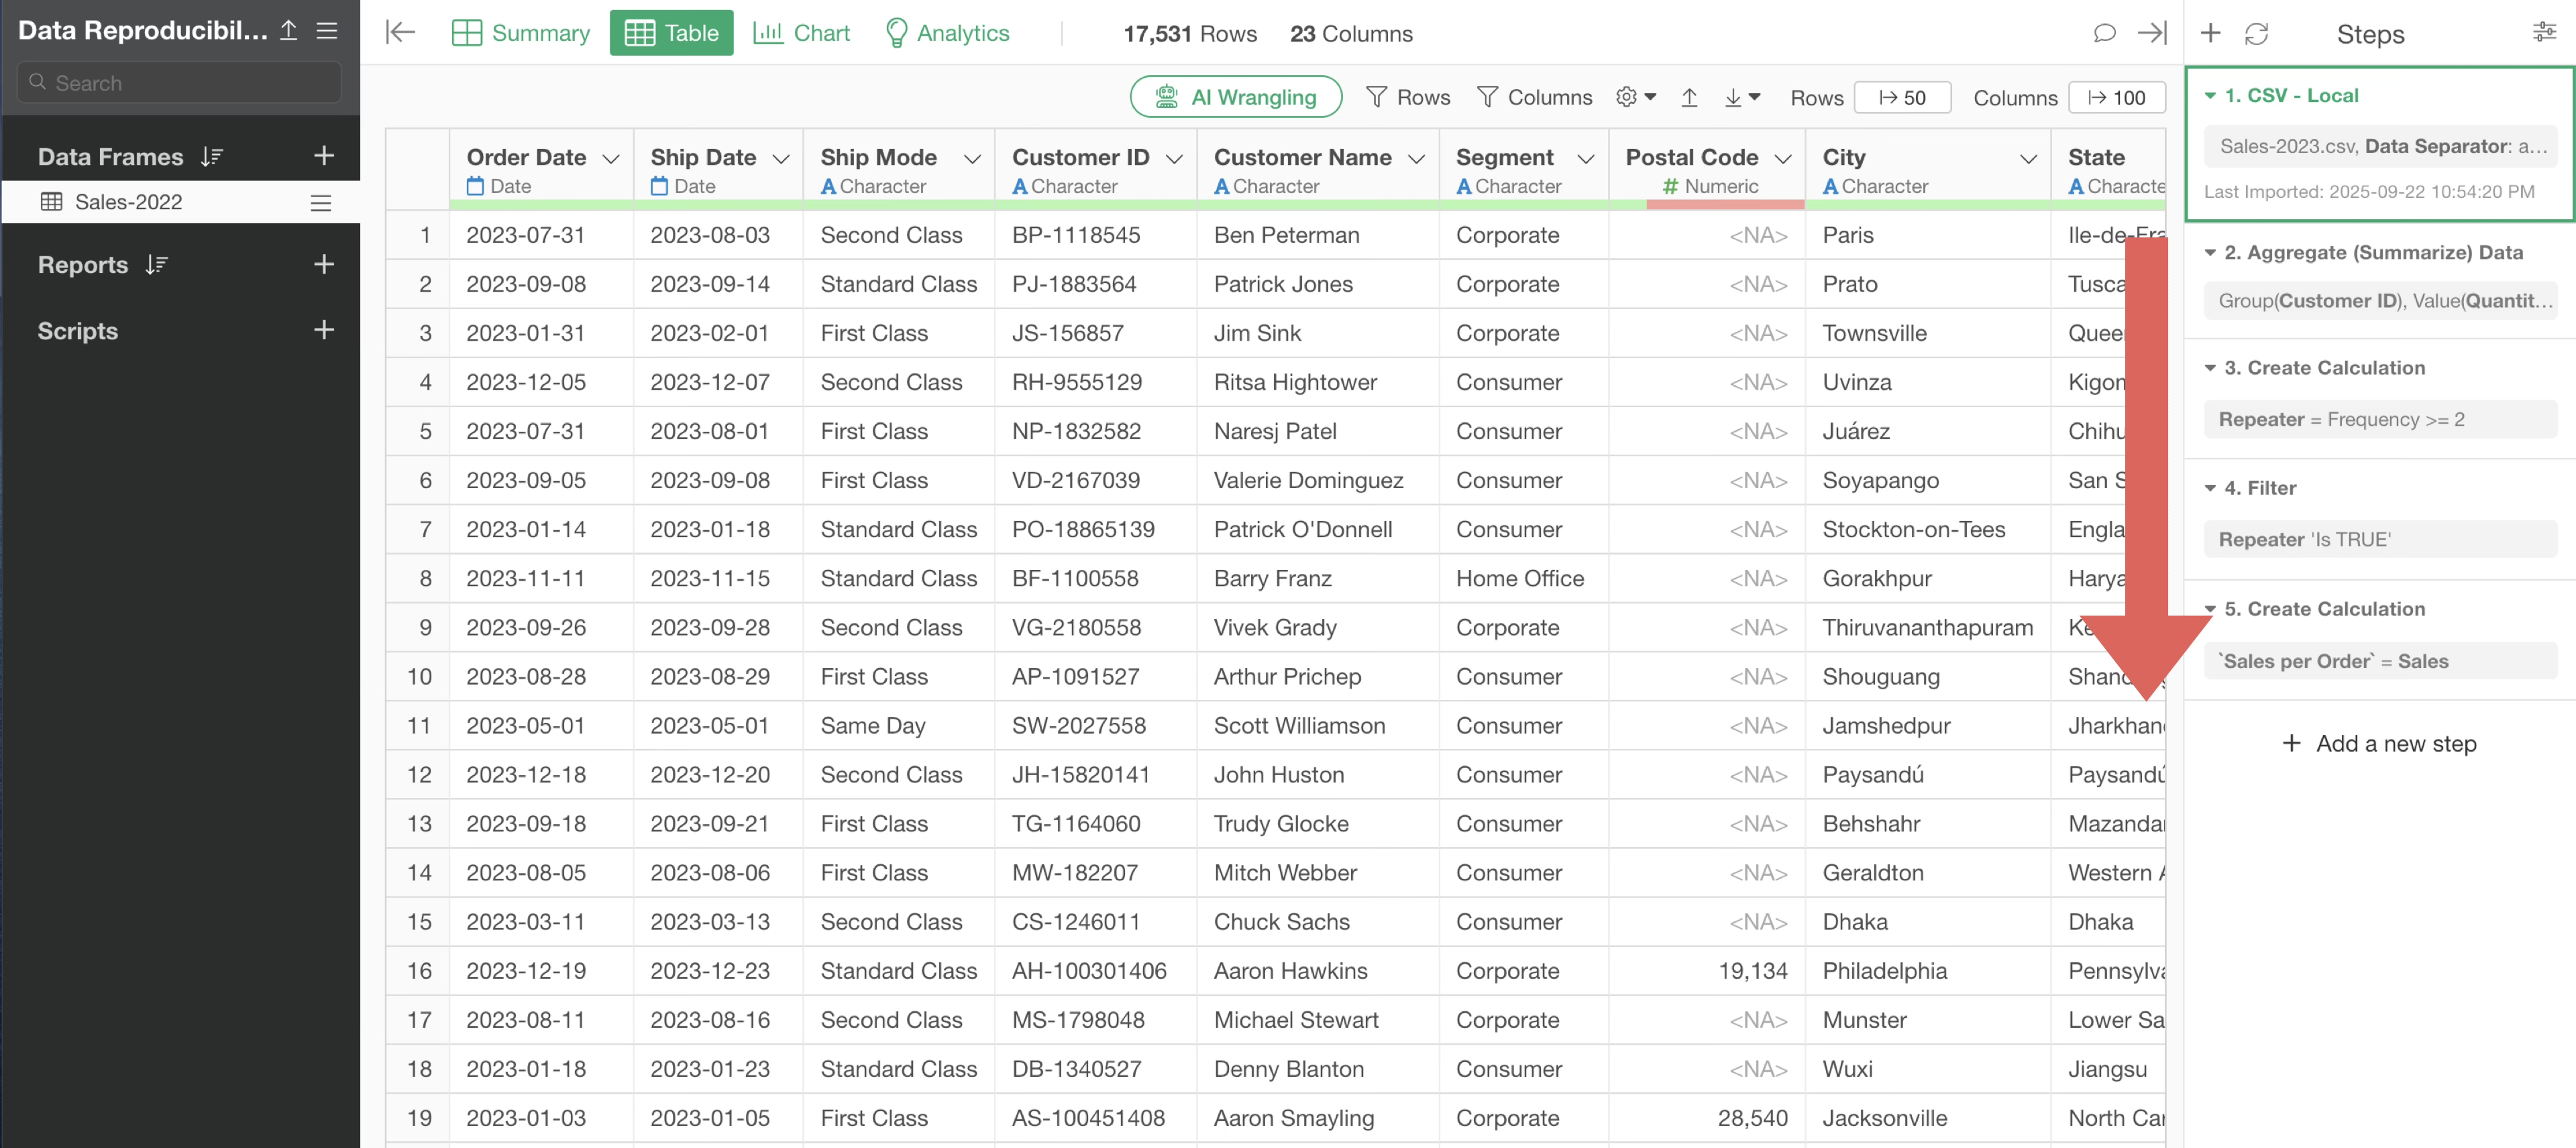
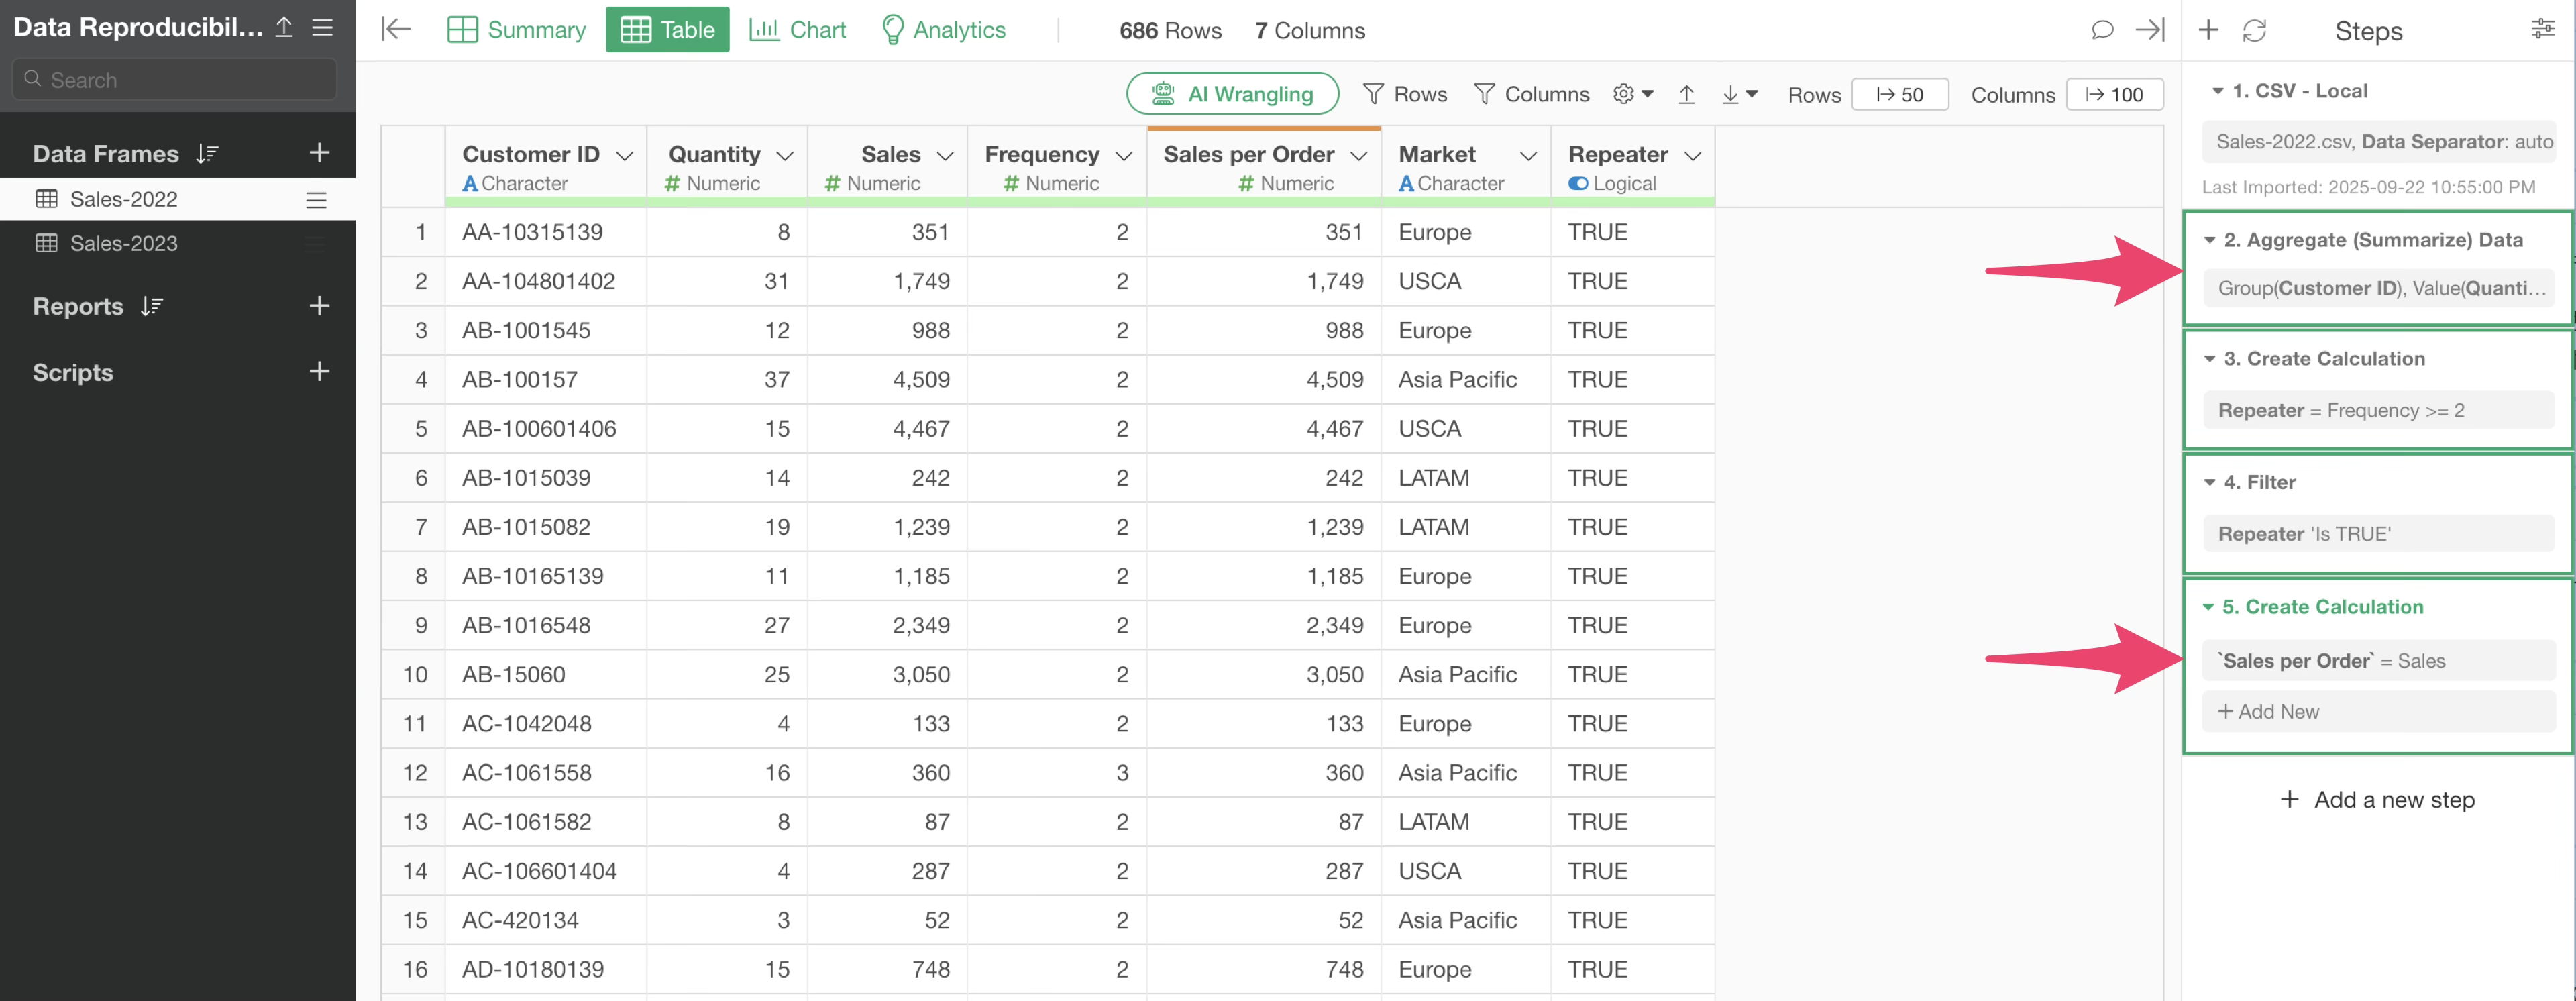
Open the “Sales-2022” data frame and select steps 2 through 5 by holding down the Shift key.
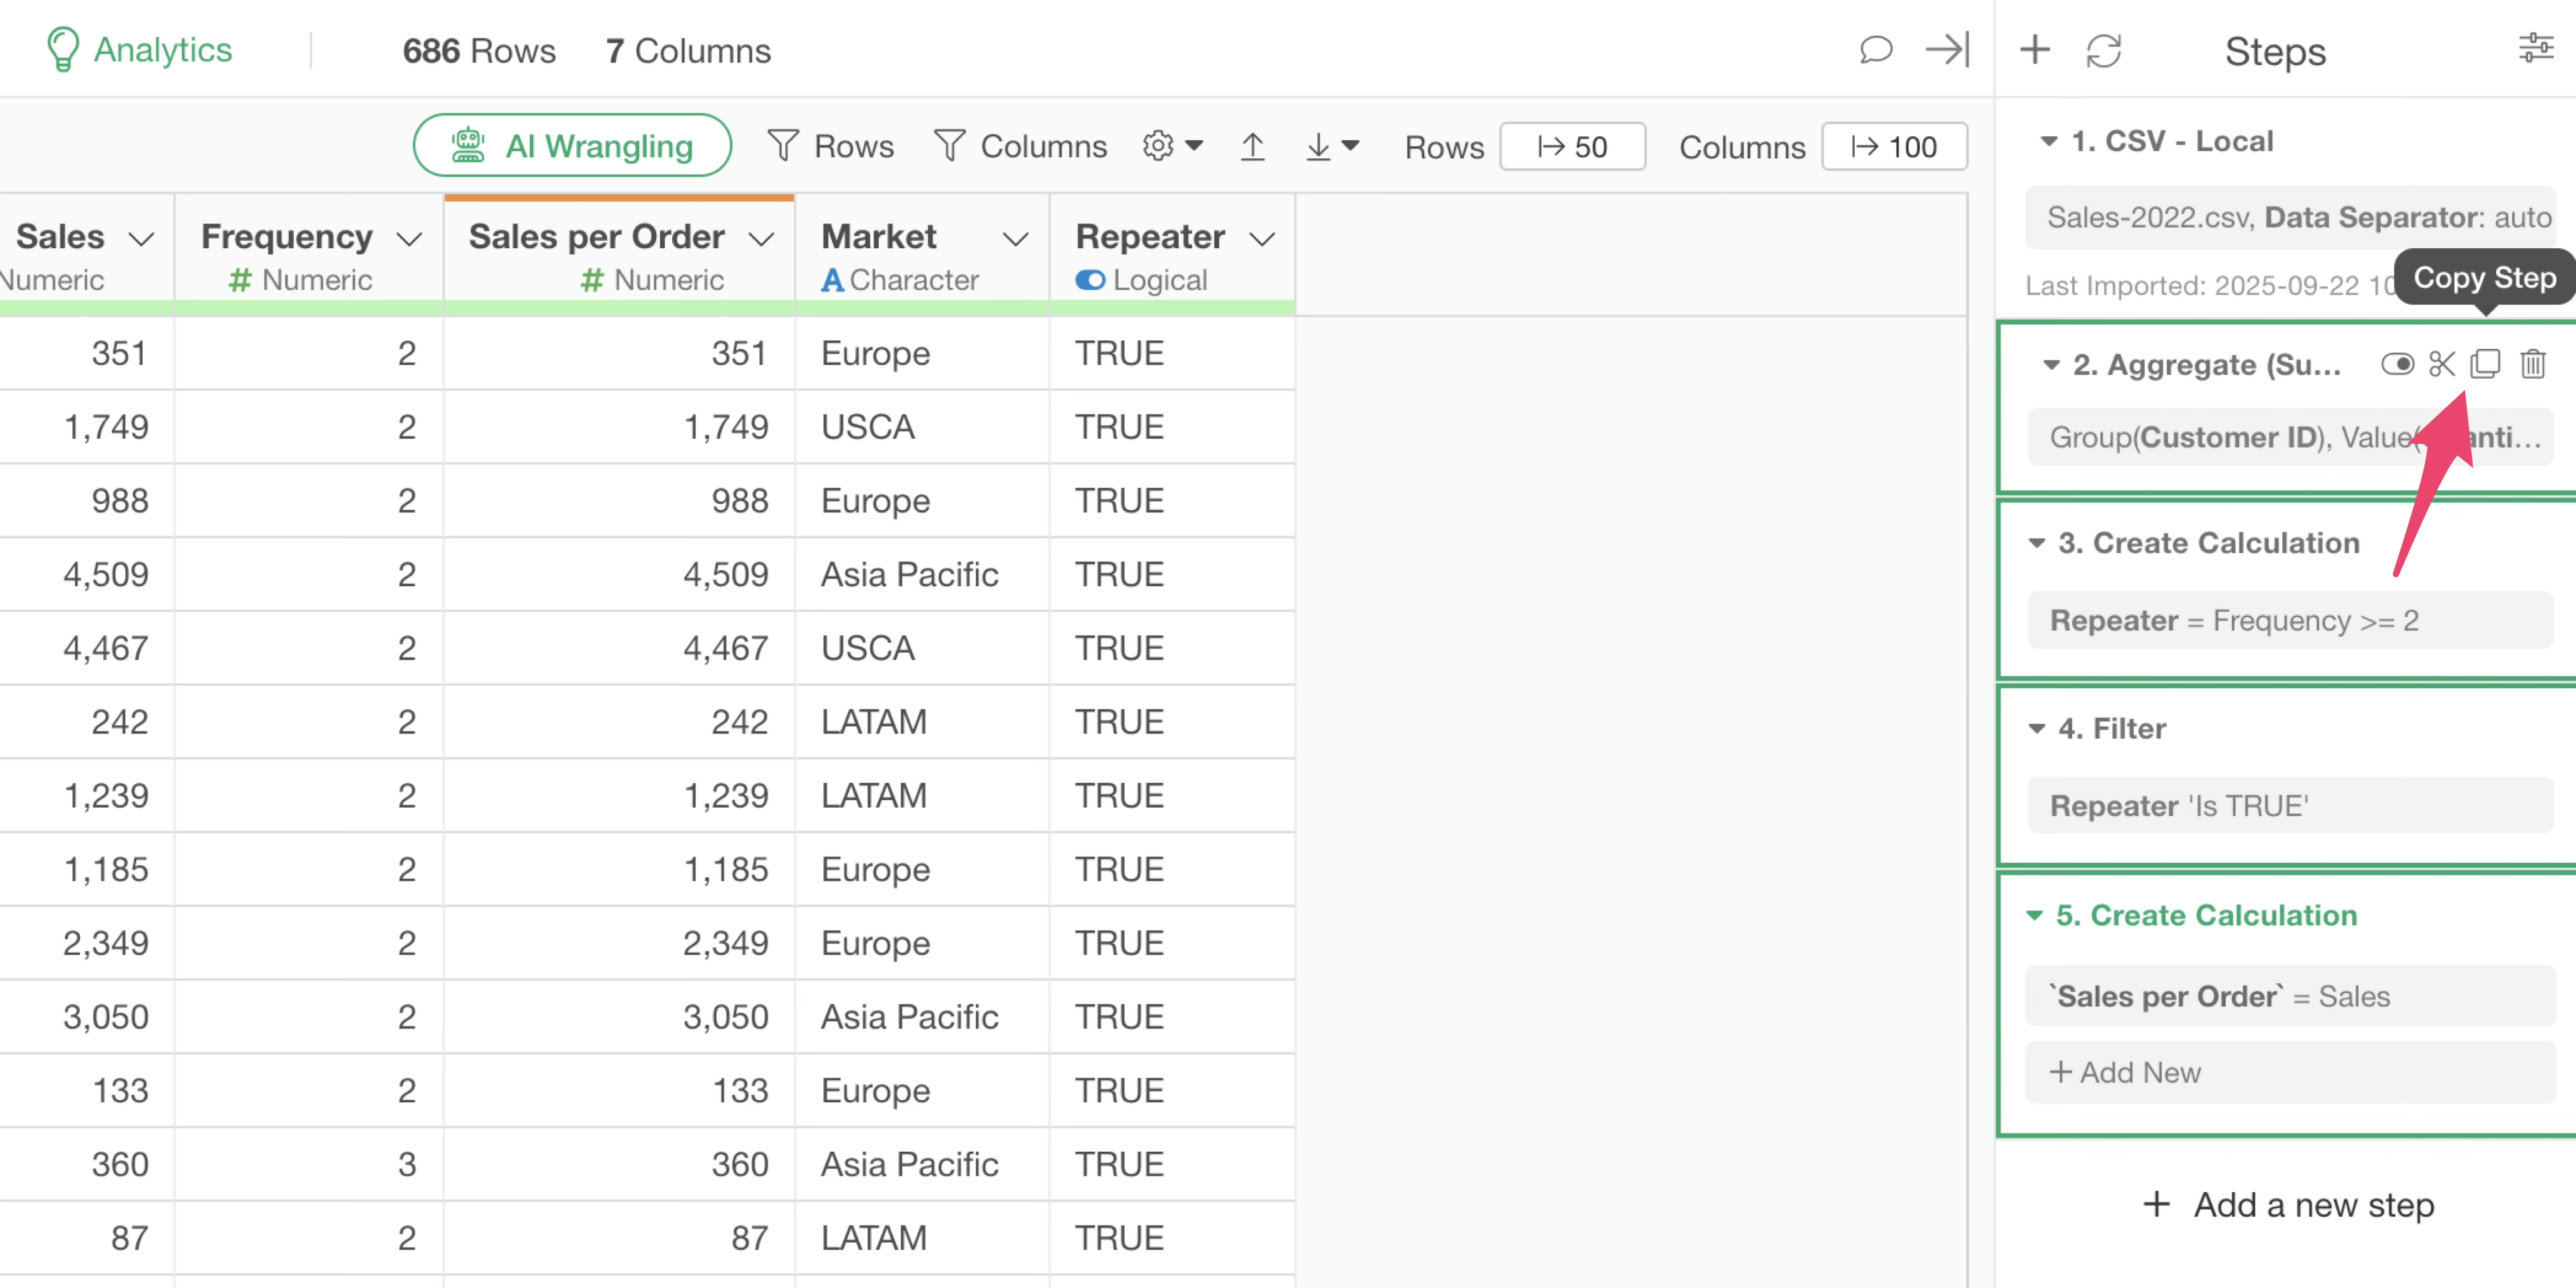
With multiple steps selected, click the “Copy Step” button.
Next, open the “Sales-2023” data frame.
From the step menu, click “Paste Step.”
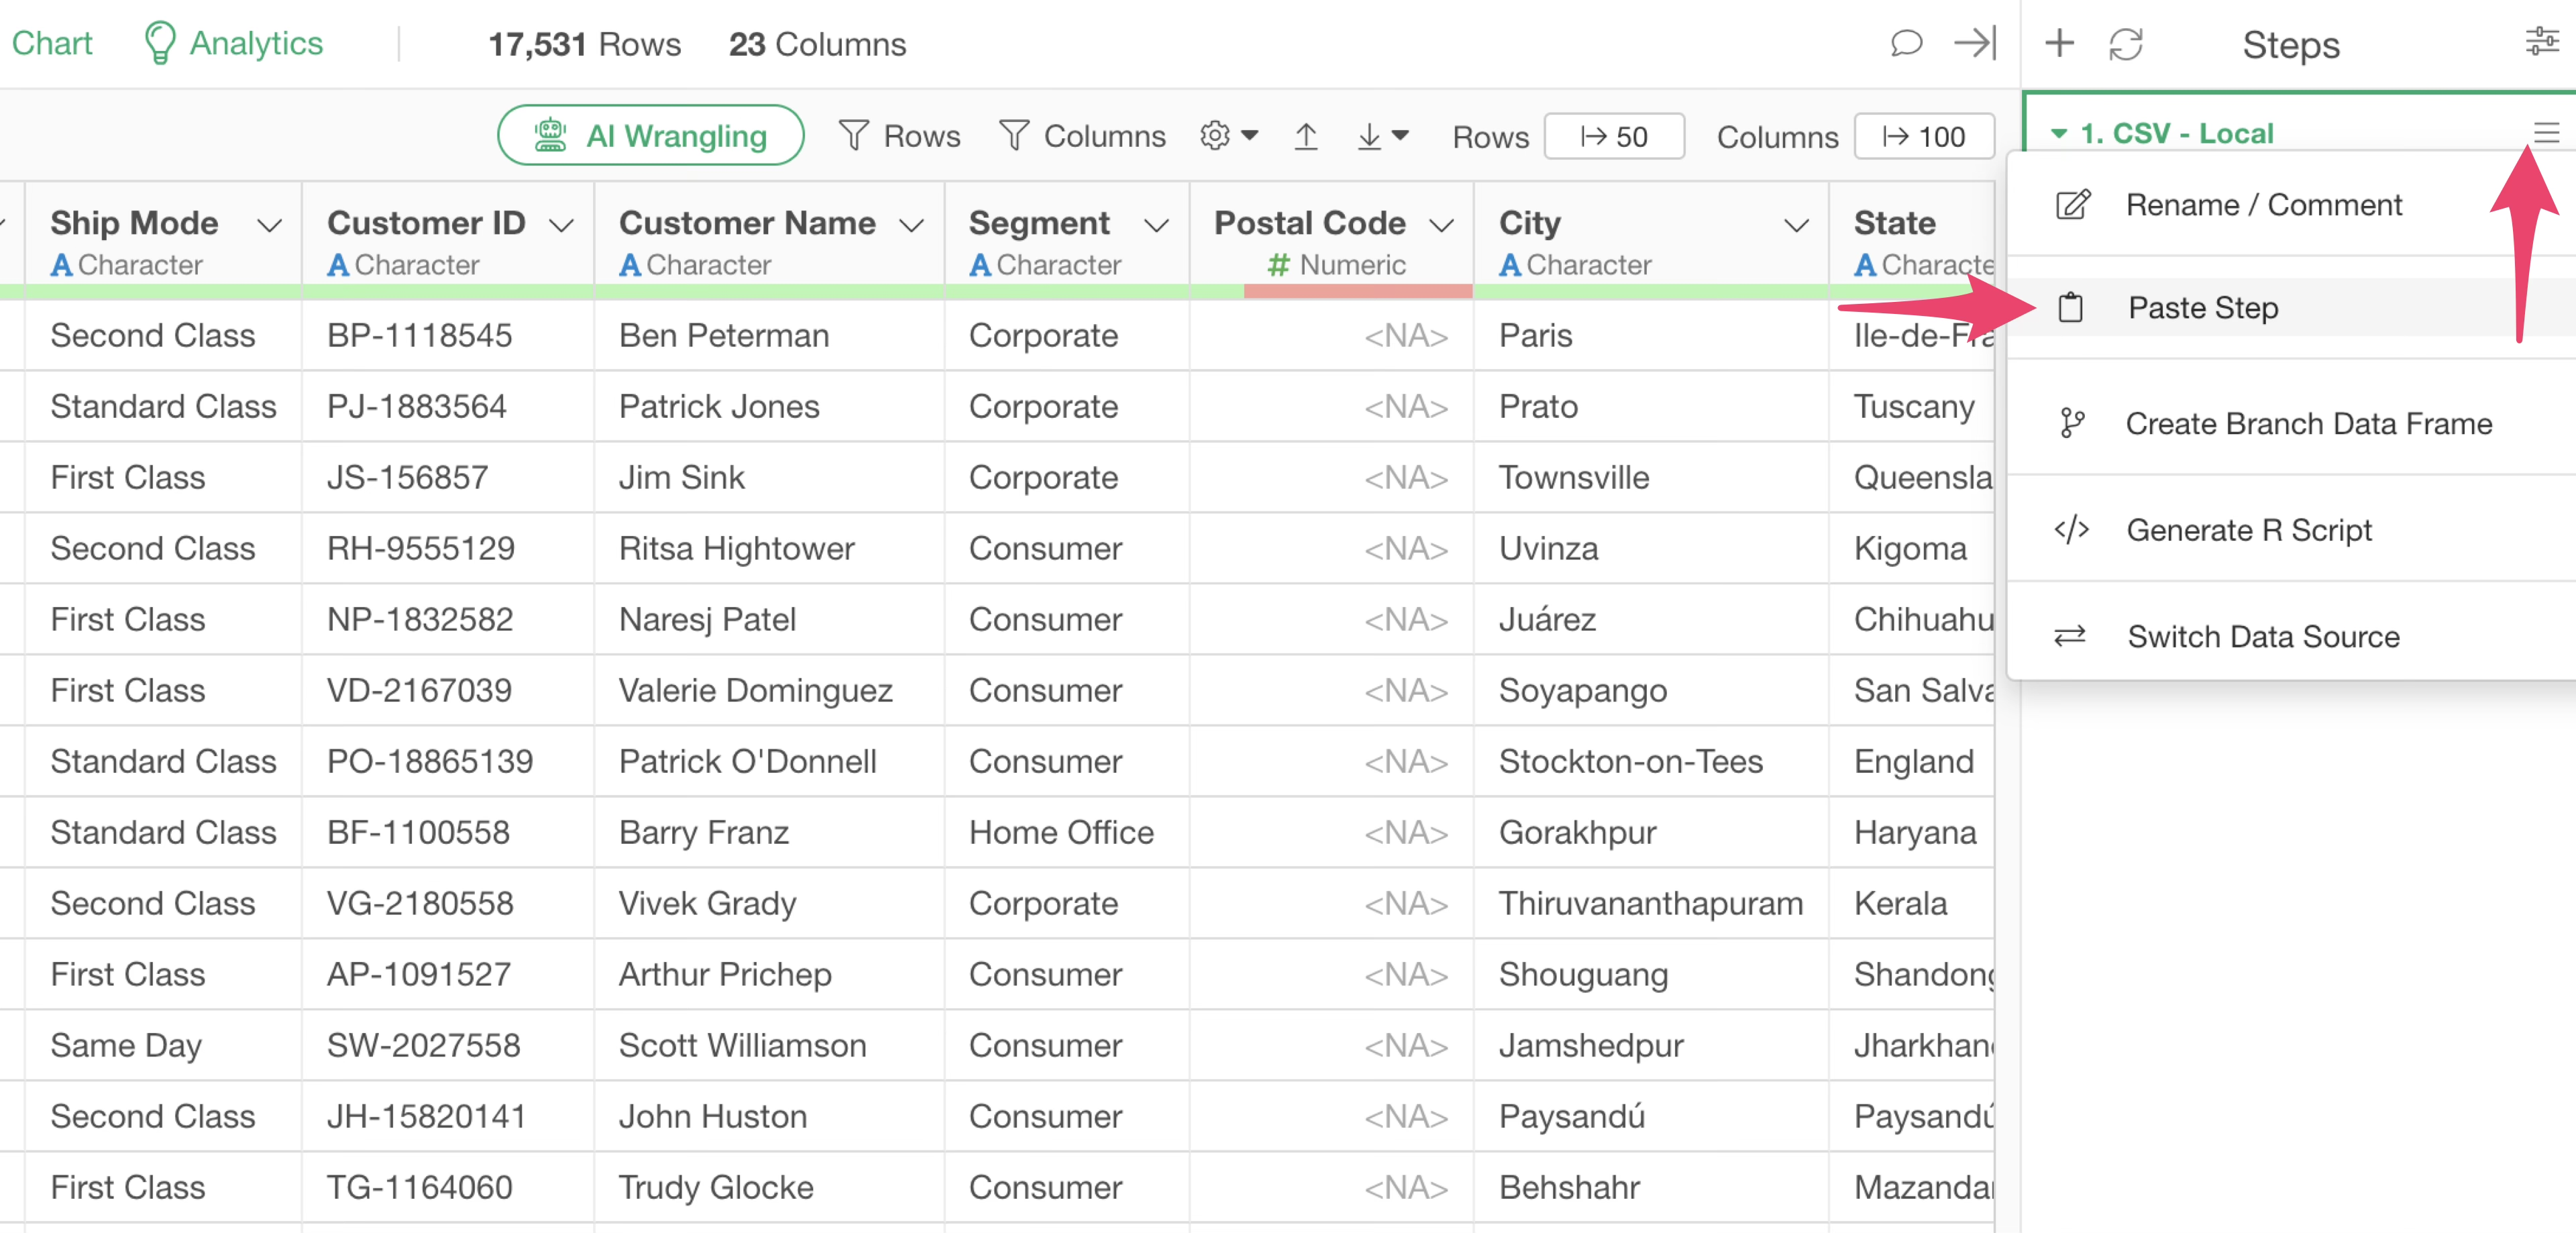
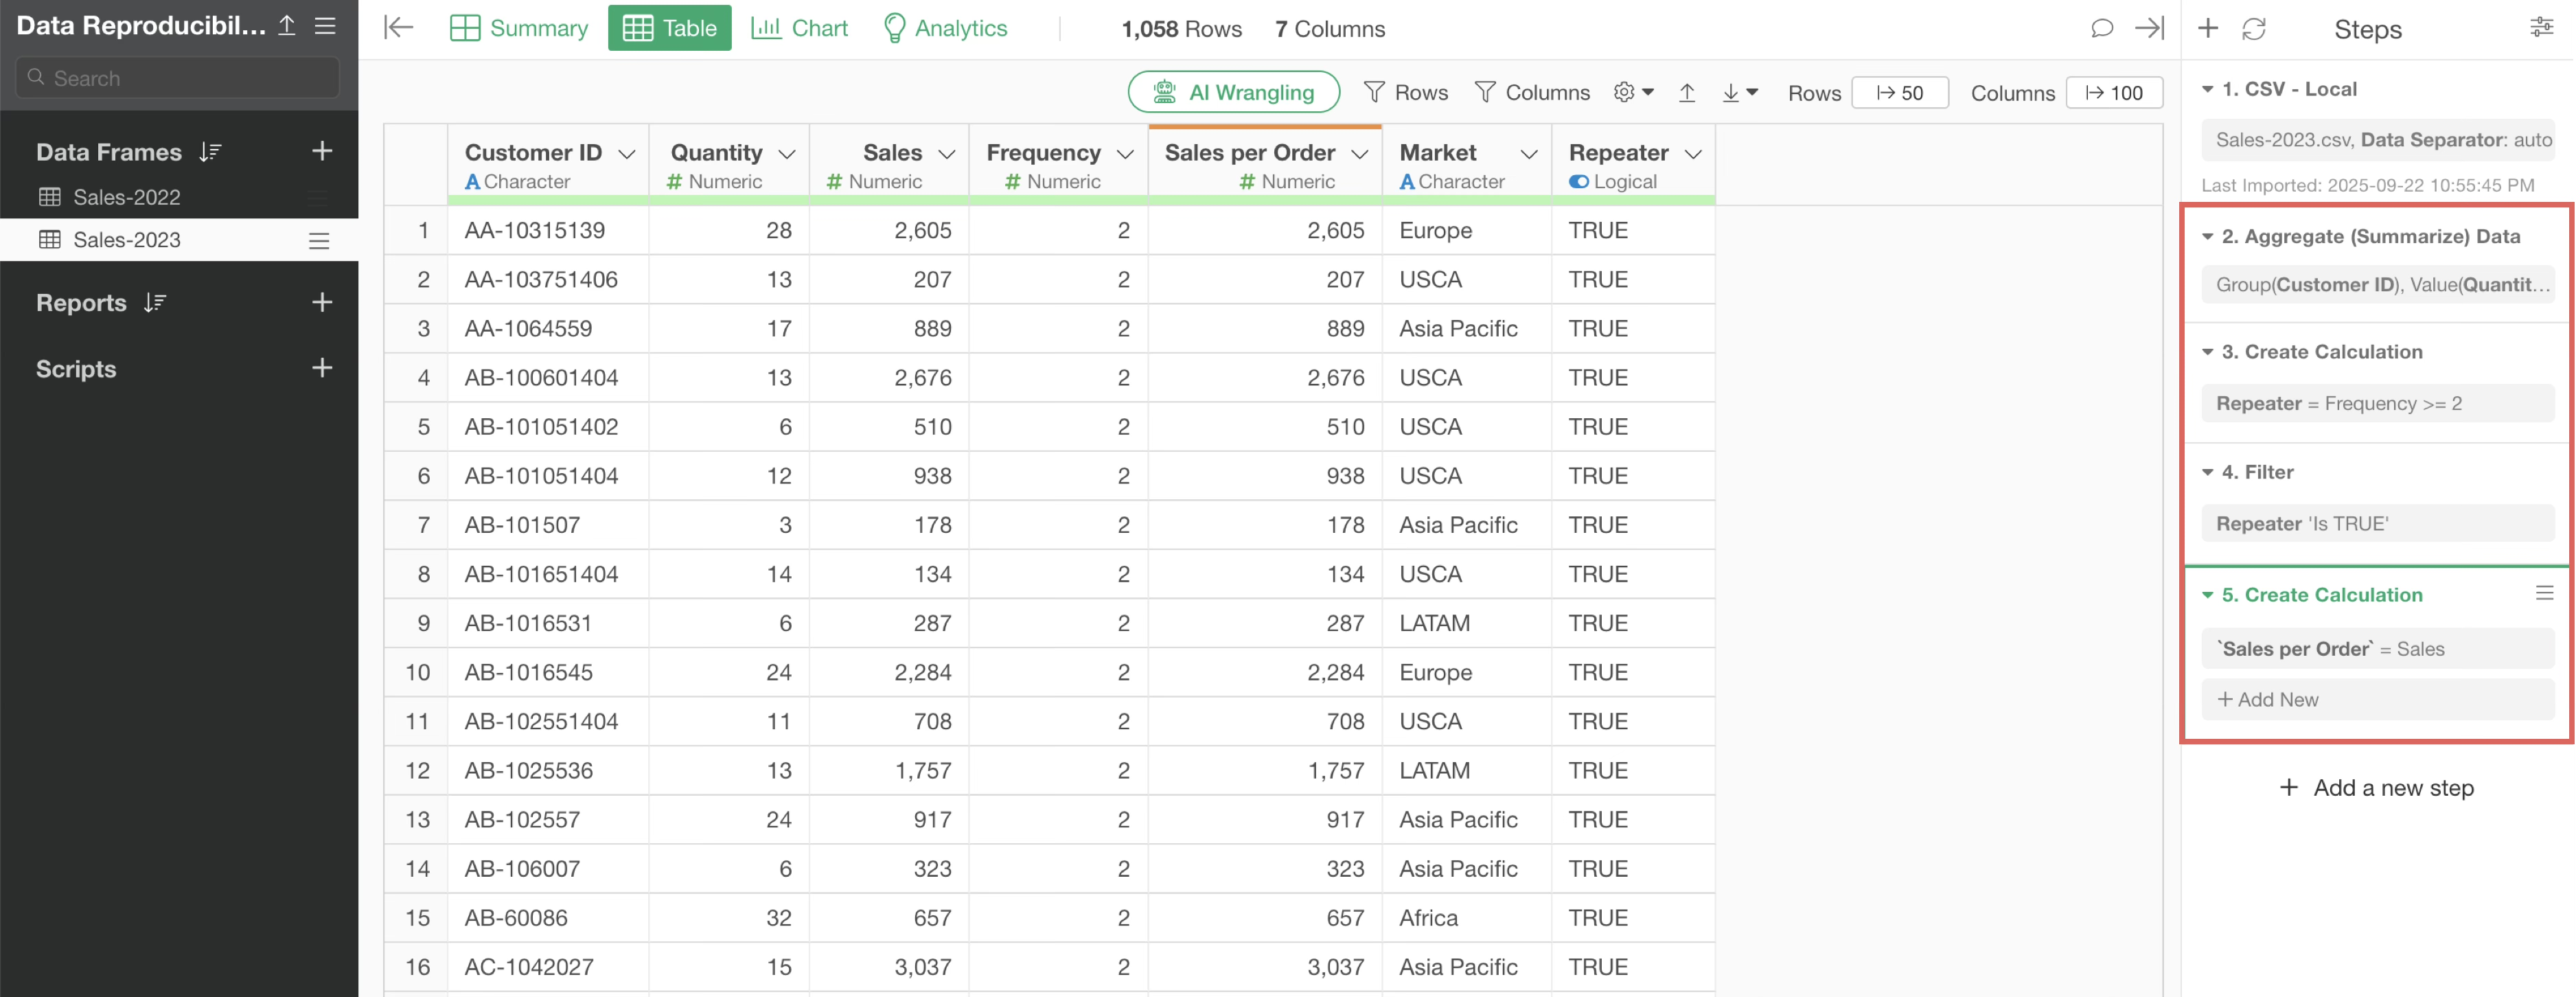
This action pastes the steps into the “Sales-2023” data frame, applying the same processing.
However, this method does not reproduce the charts or analytics created in “Sales-2022.” If you want to reproduce everything, including charts and analytics, follow the method in the next section.
Reproducing an Entire Data Frame’s Processing as a New Data Frame
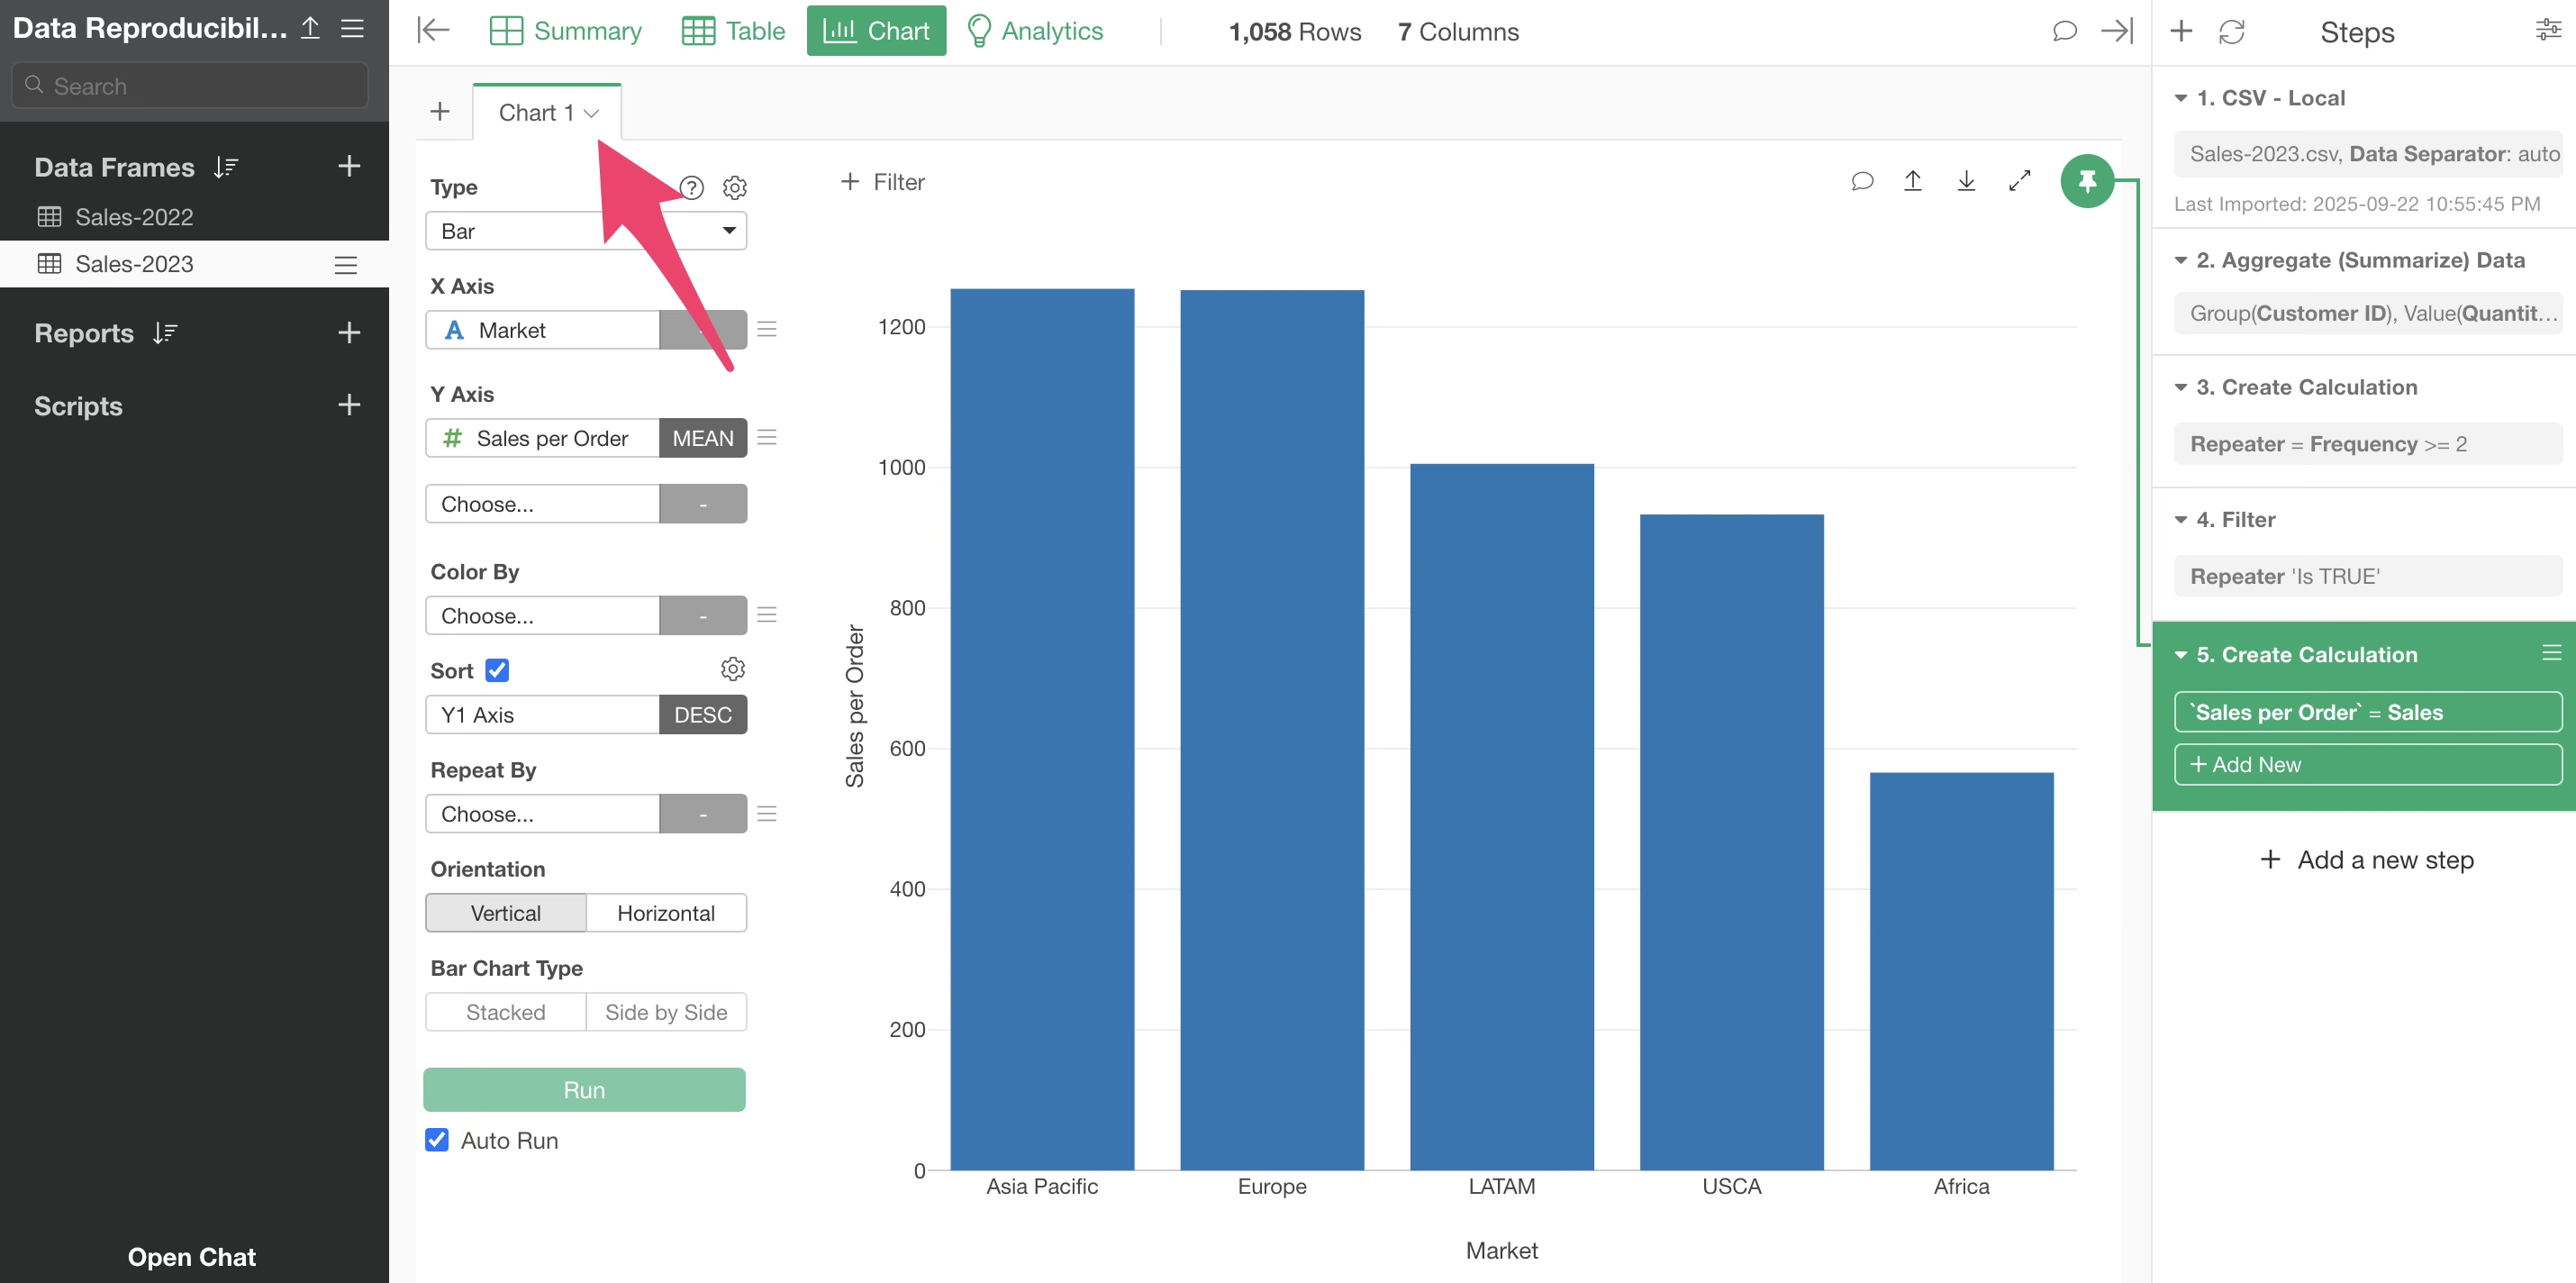
This data frame includes created charts and analytics.
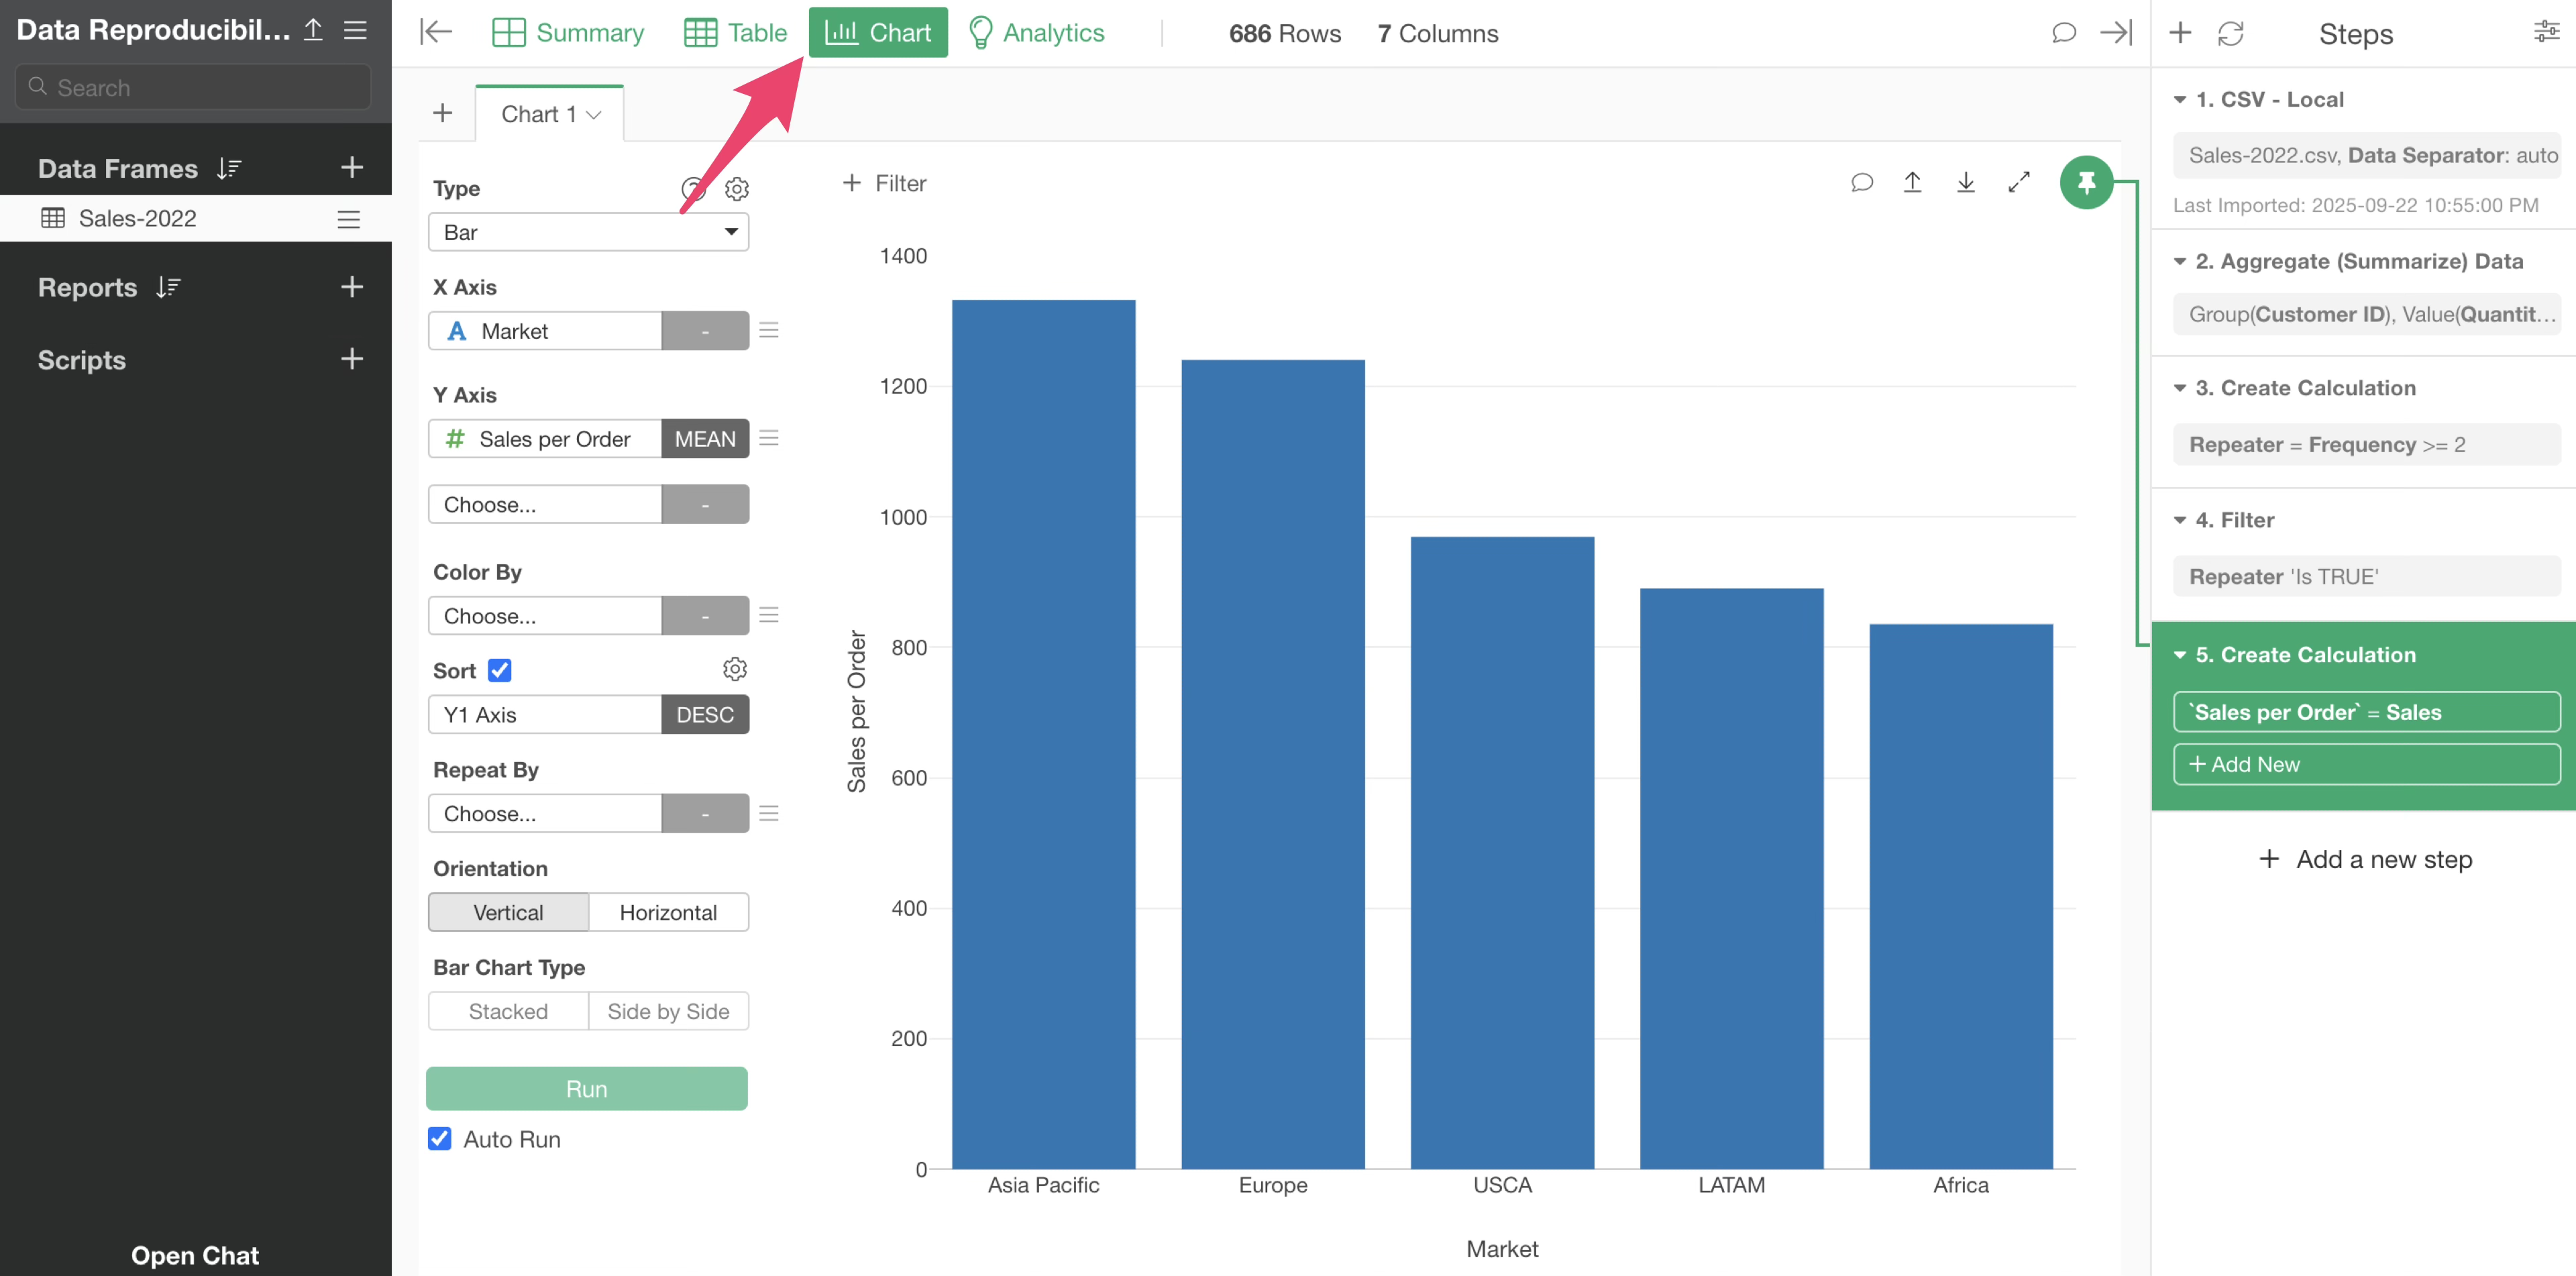
You want to keep this data frame as is and create a new data frame that replicates all the same processing.
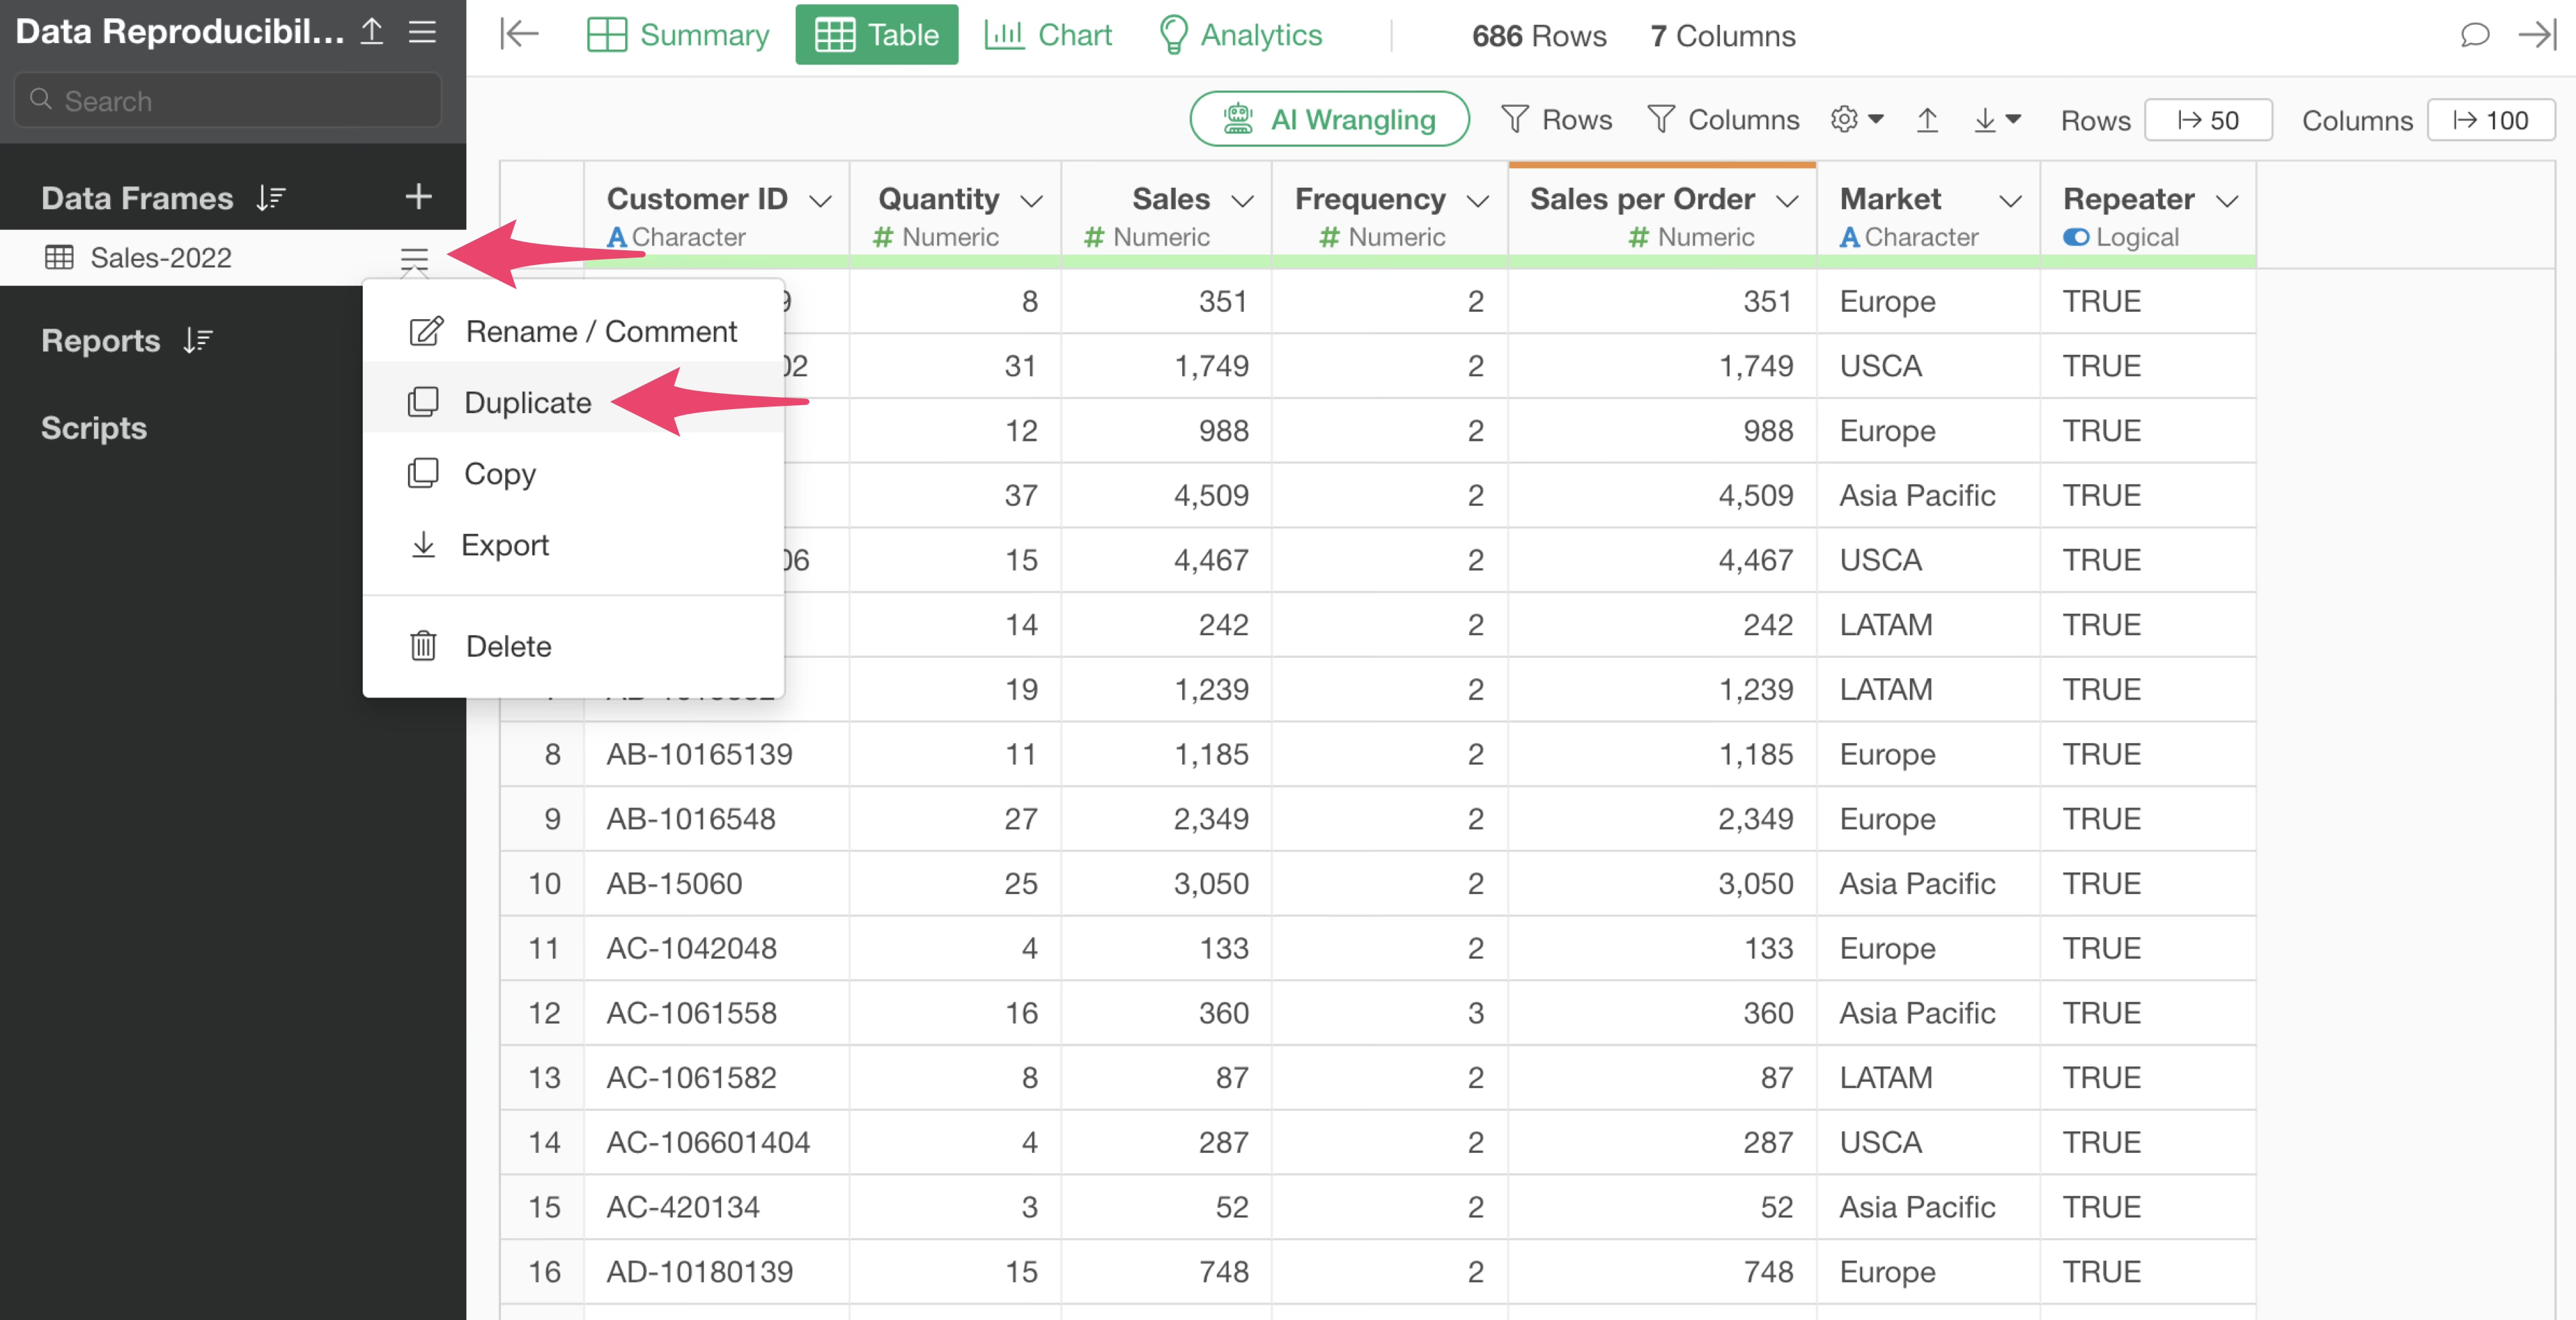
From the data frame menu, select “Duplicate.”
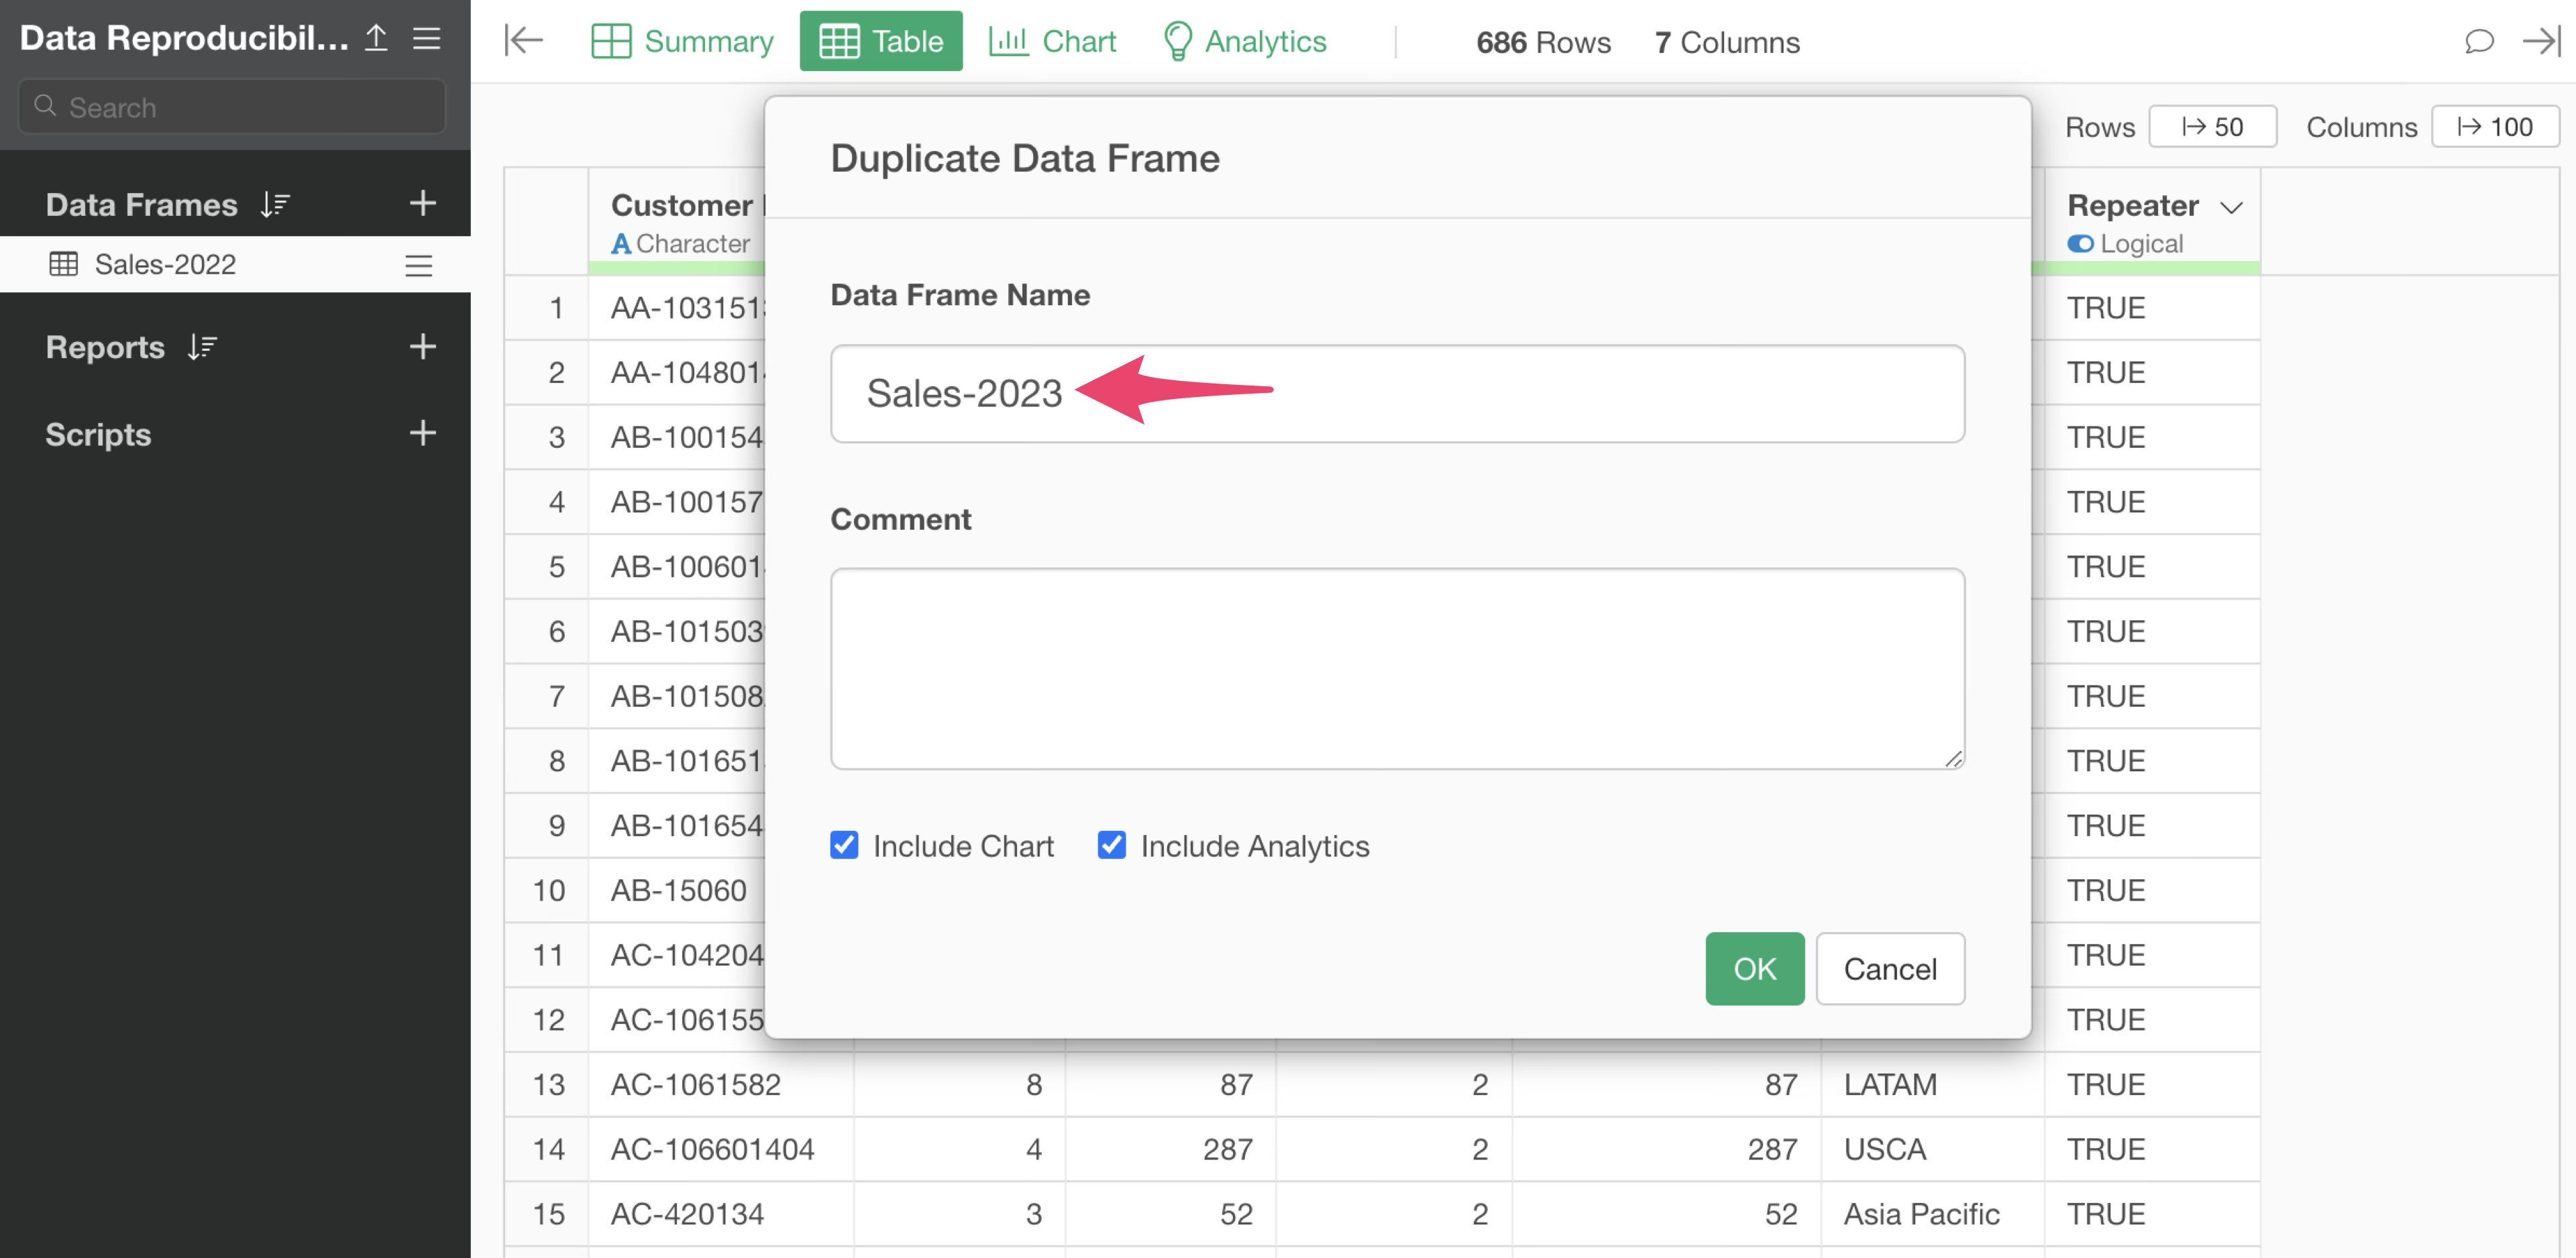
Set the data frame name.
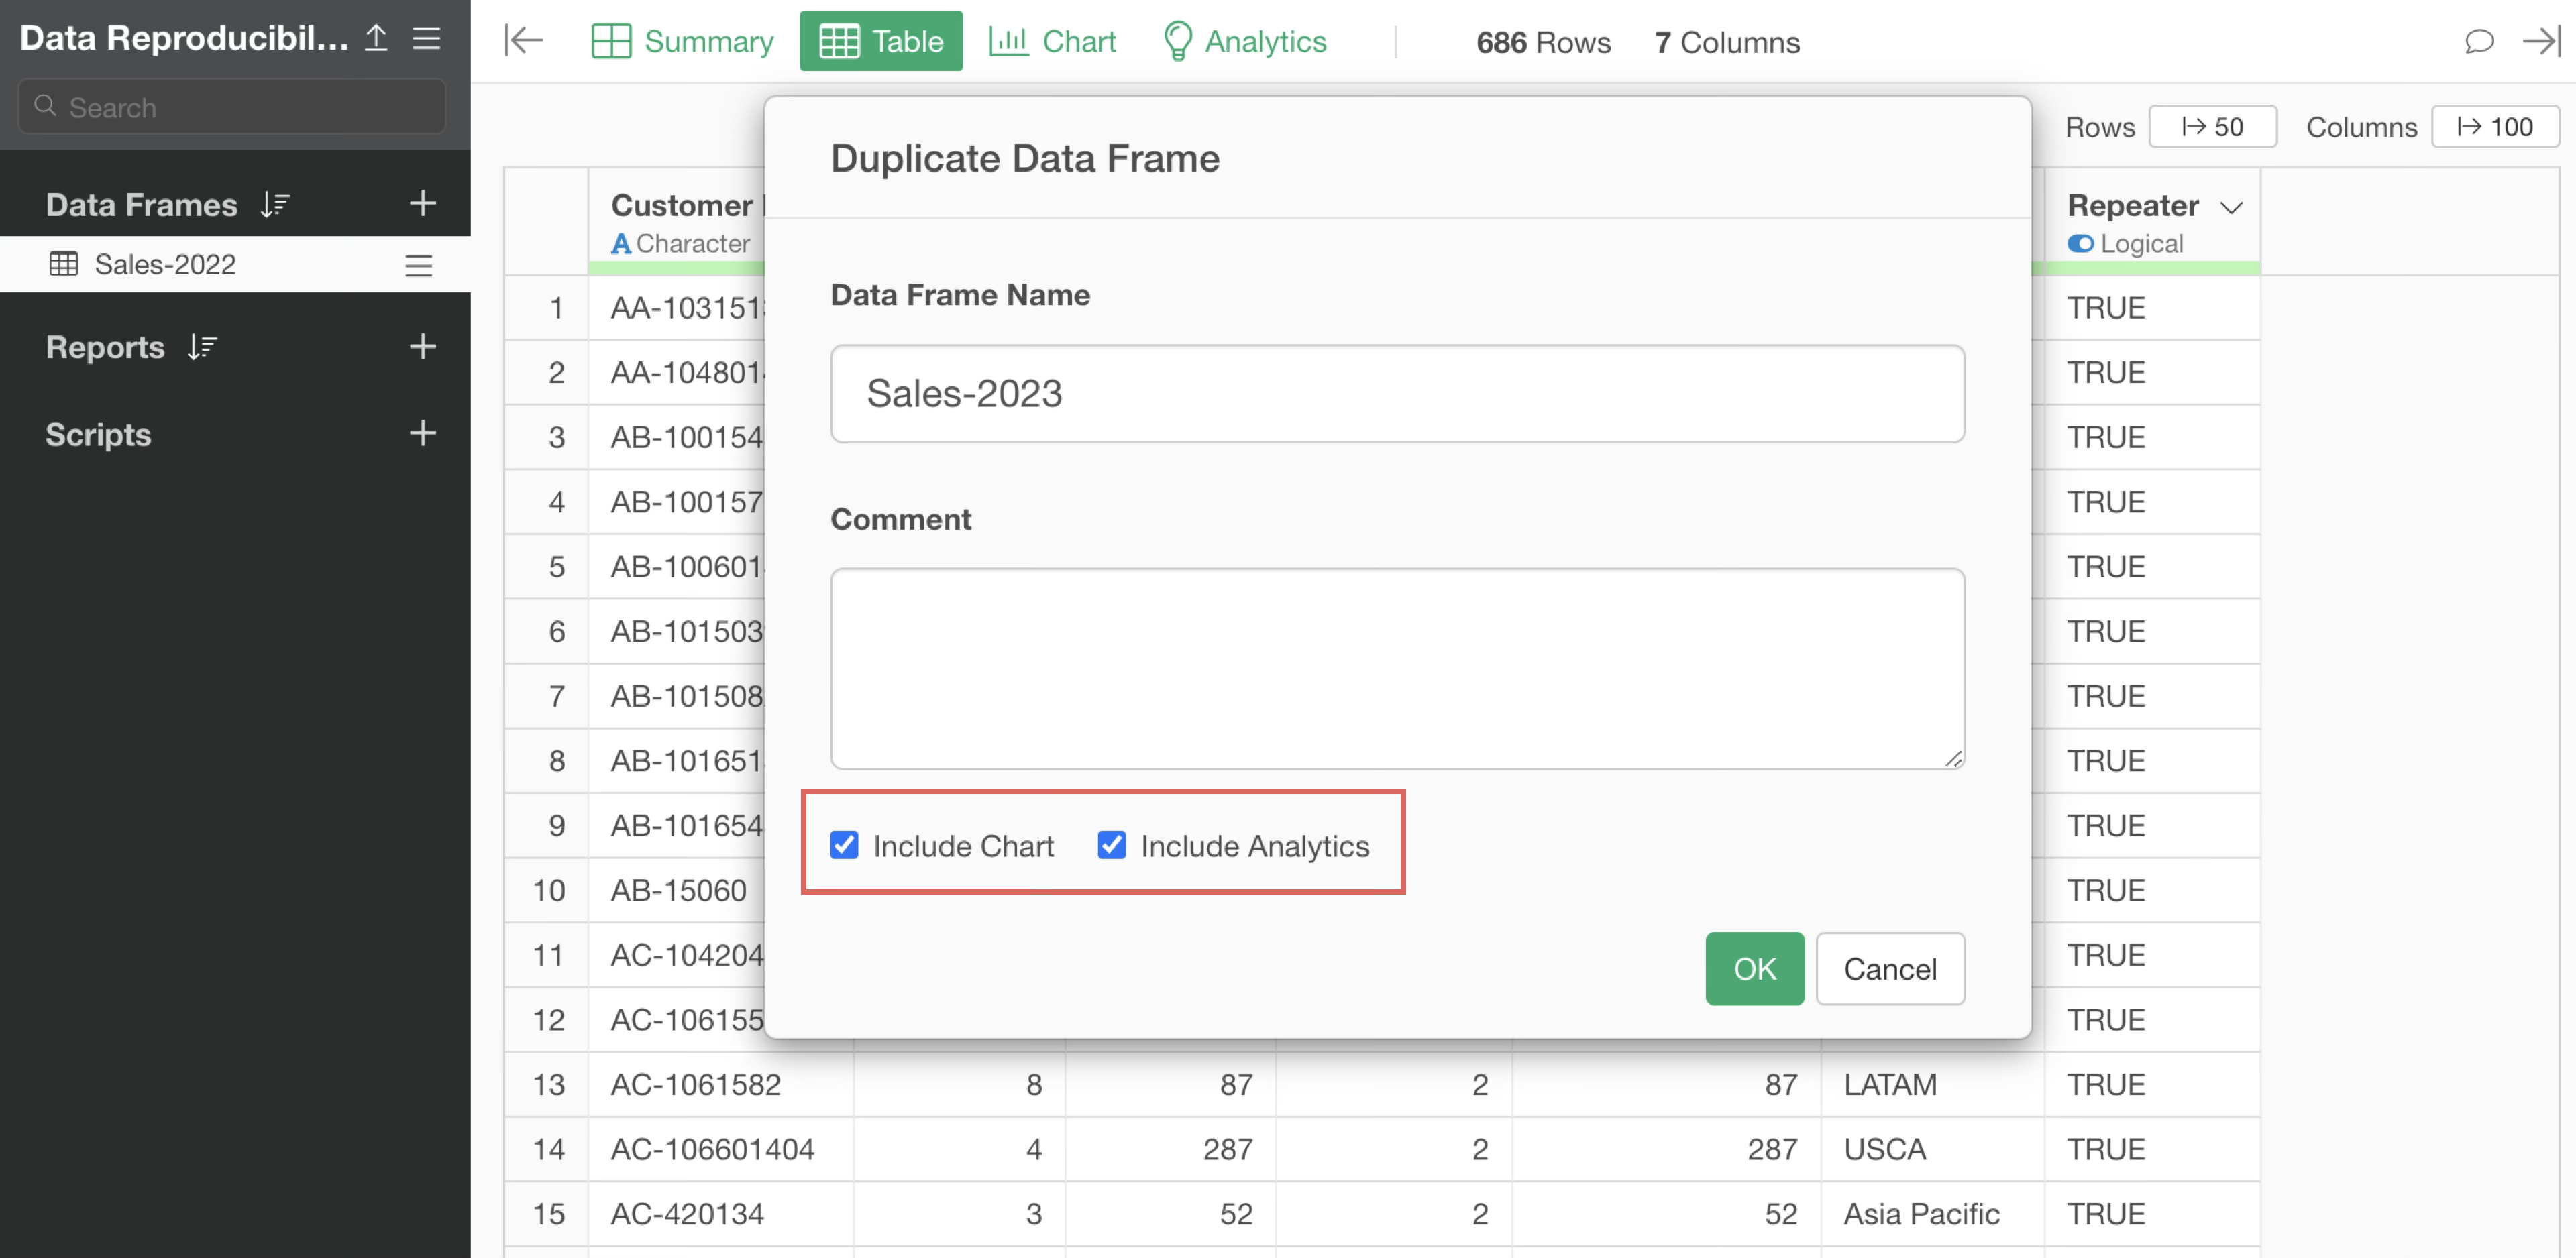
When duplicating, make sure to check “Include Chart” and “Include Analytic.” This ensures that charts and analytics are also reproduced in the duplicated data frame.
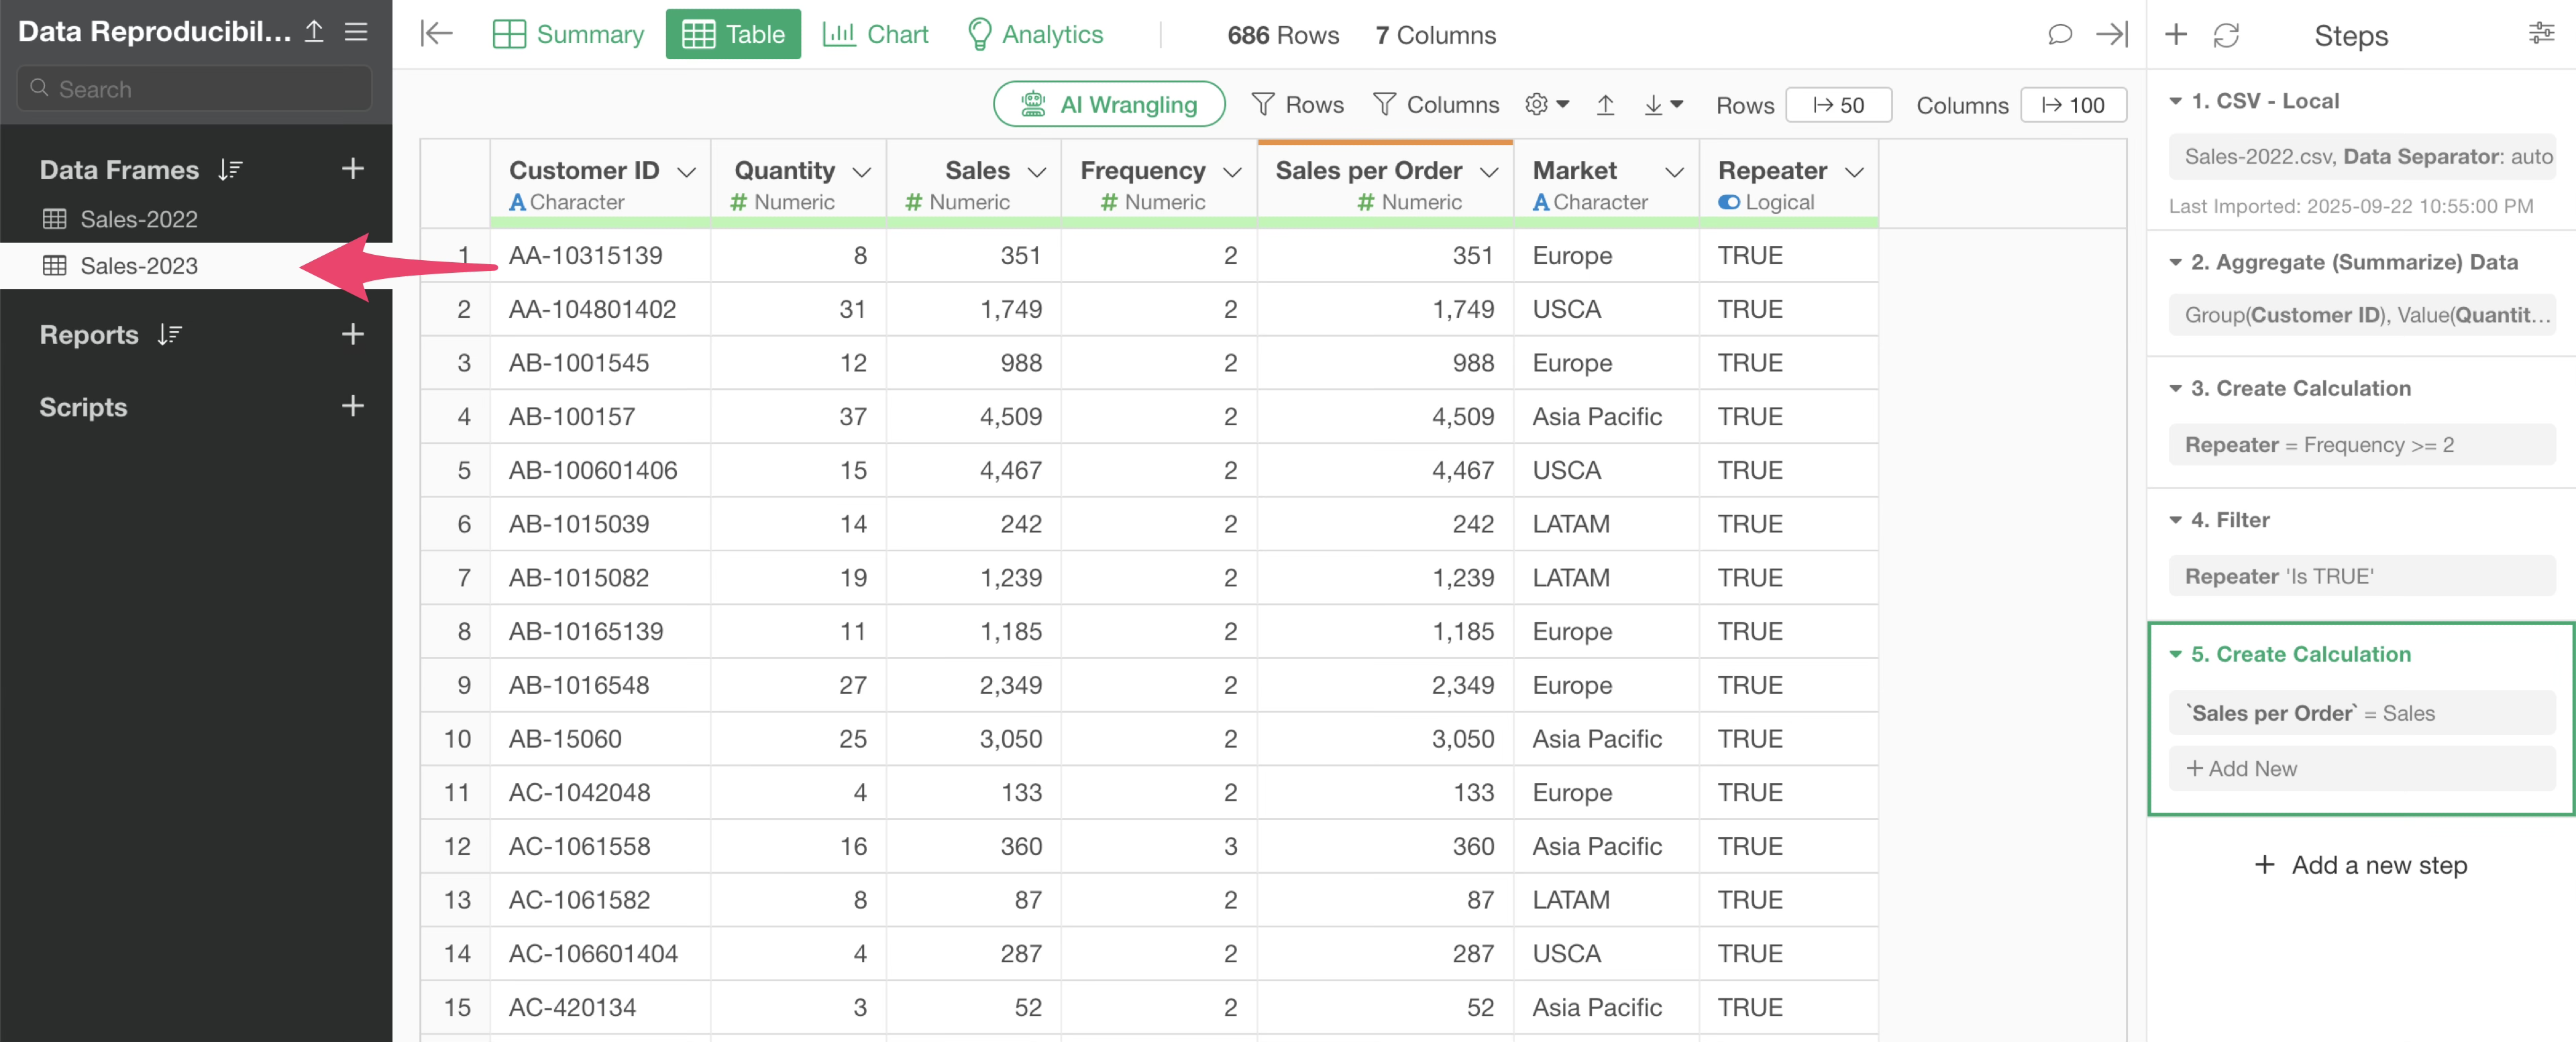
You have successfully duplicated the sales data frame.
Next, follow the same process as in “When You Want to Change the Data Source” to change the data source.
By changing the data source in the duplicated data frame, you can keep the original data frame (e.g., Sales-2022) intact while updating the duplicated data frame with new data (e.g., Sales-2023).
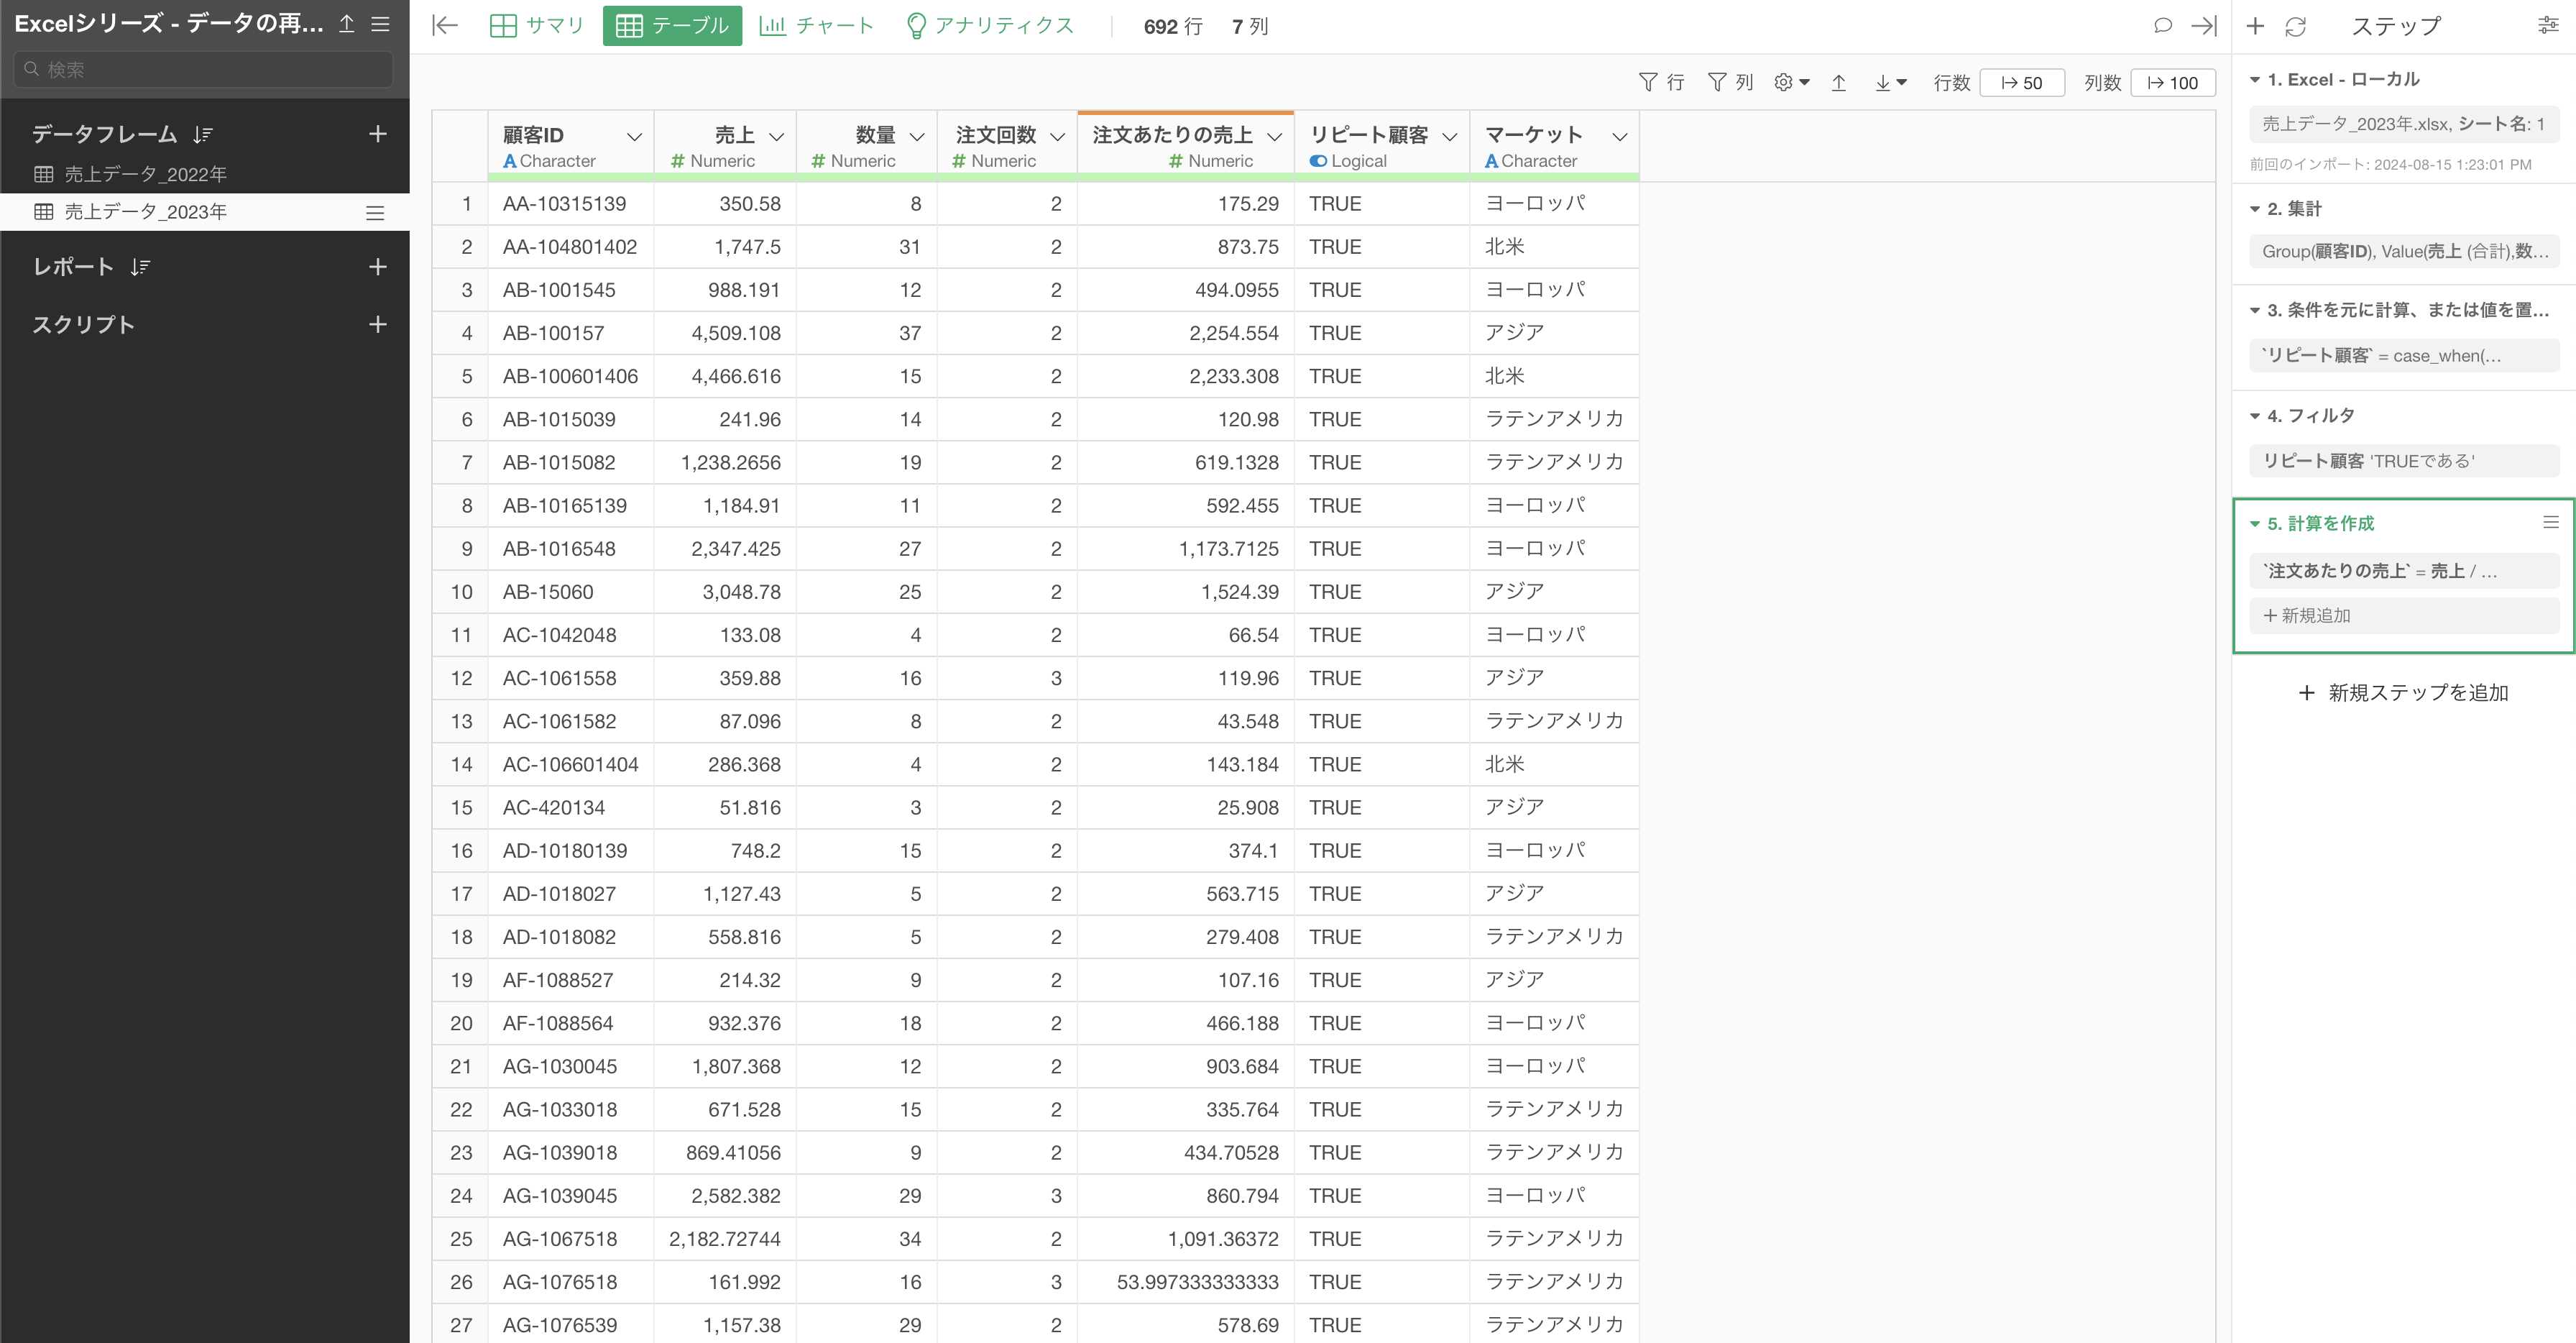
You can confirm that all steps, charts, and analytics are reproduced in the duplicated data frame.
4. When You Want to Share with Others
Suppose you want to share a data frame, including its data processing steps, created charts, and analytics, with others.
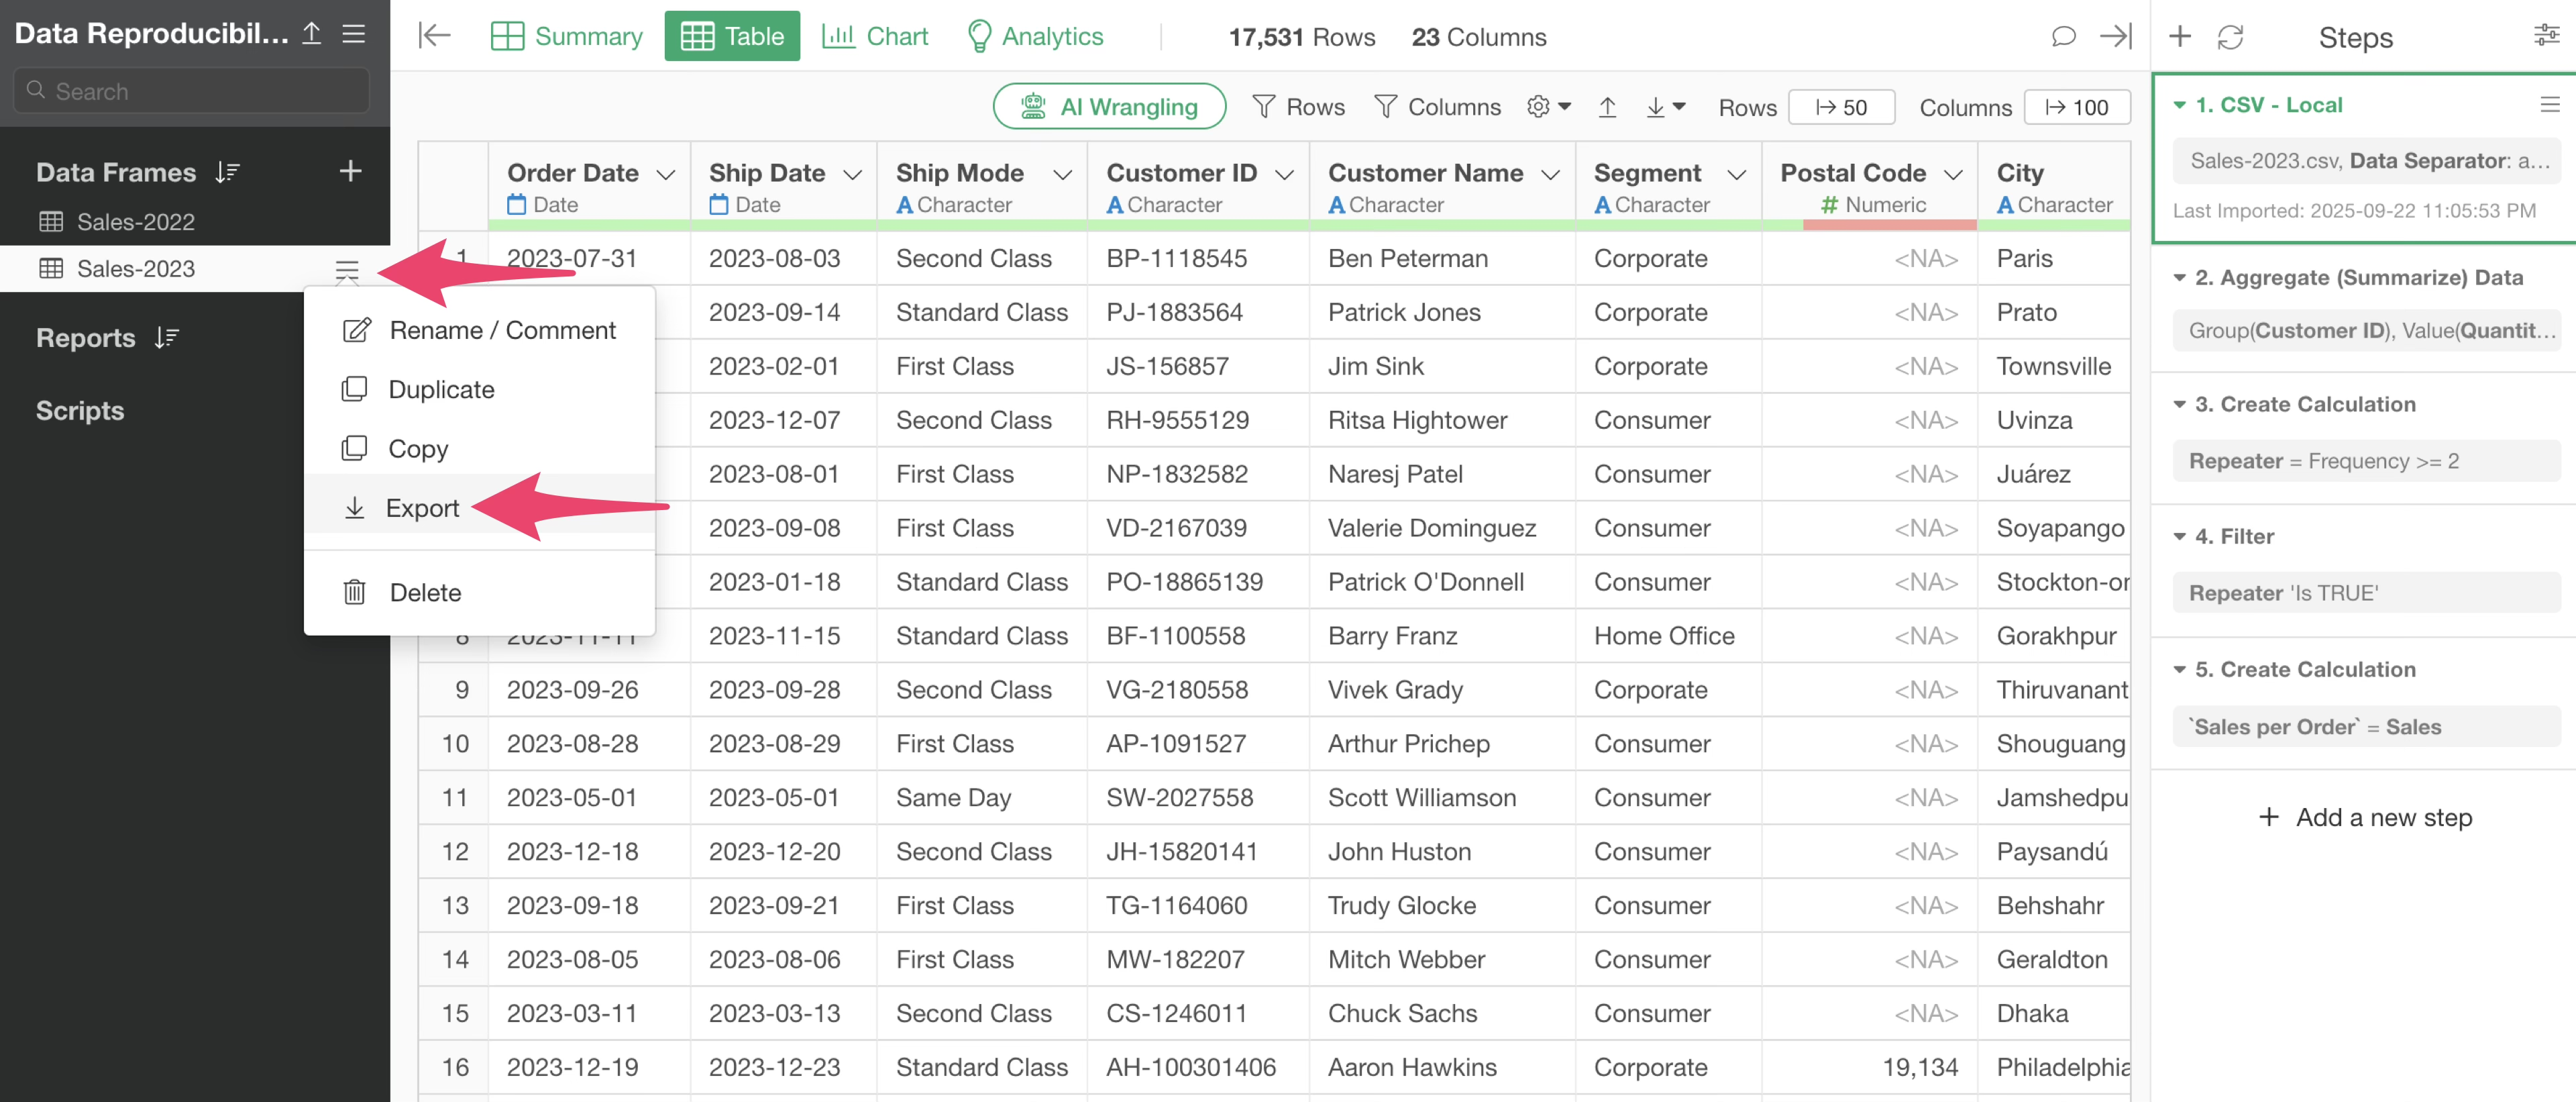
To share an entire data frame, click the “Export” button from the data frame menu to export it as a “.df file.”
Share this data frame file (.df) with others.
The recipient can then import the data frame by dragging and dropping the file onto the project screen.
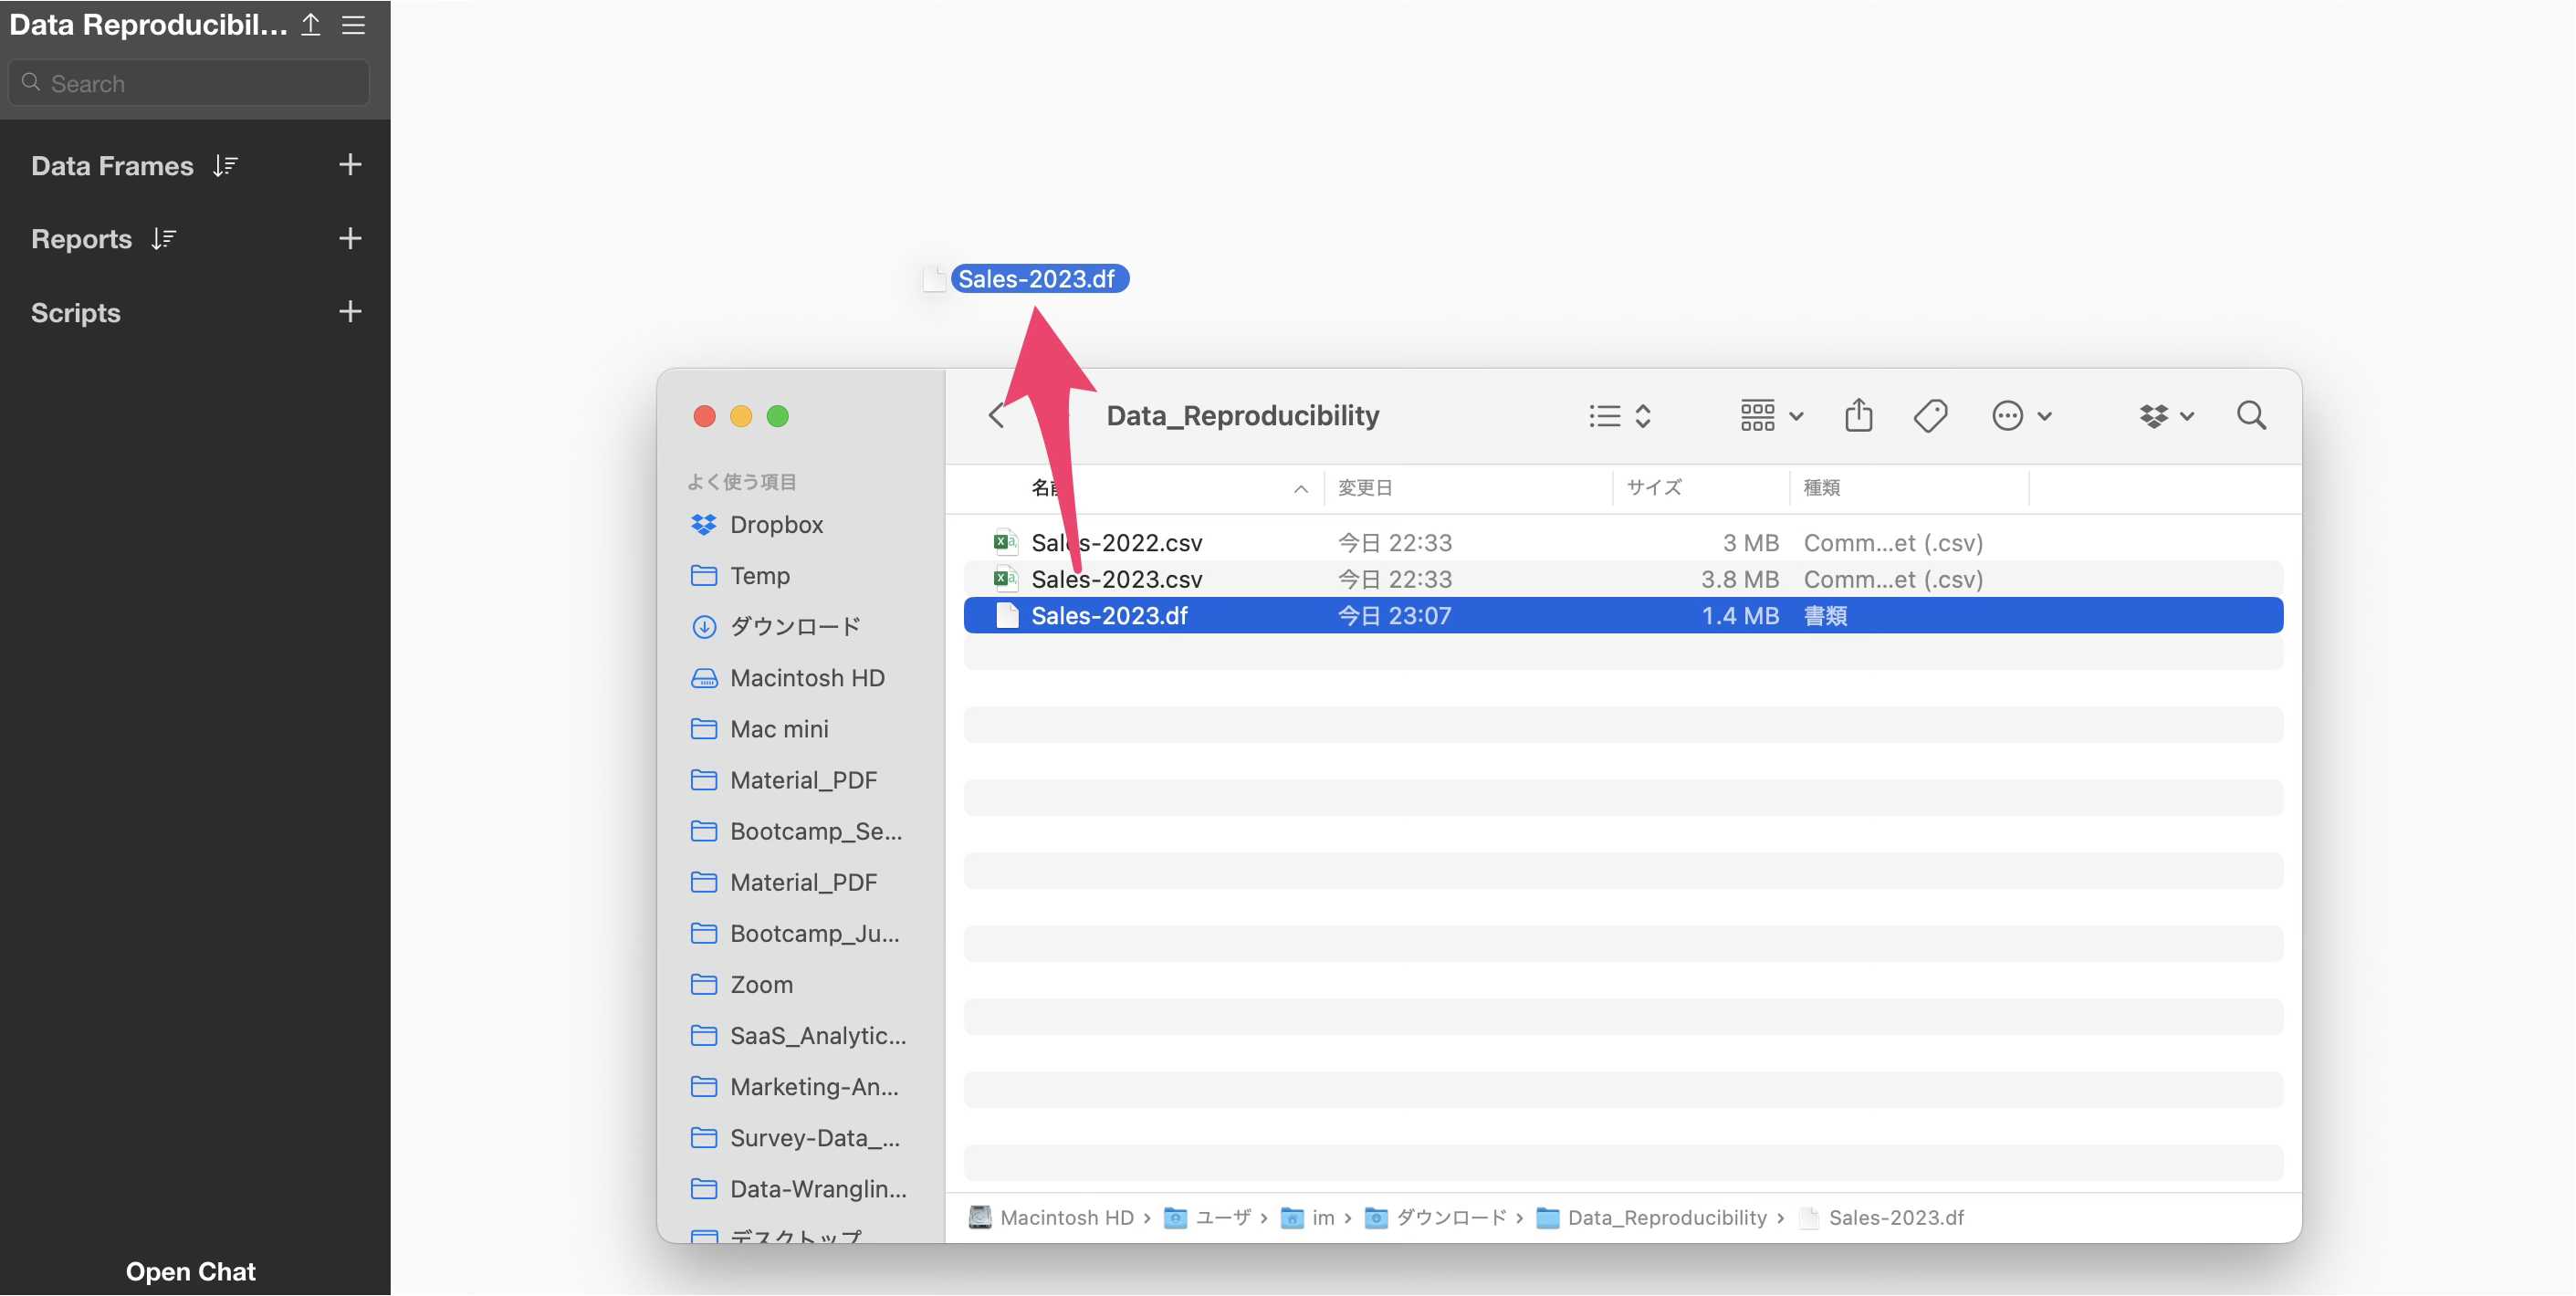
This imports the data, with the data frame fully reproduced.
Naturally, the created charts and analytics are also reproduced.

References
Additional reference is available if you are interested.
- Seminar #94 - Reporting Automation with Exploratory - Link