Data Wrangling Part 4 - Useful Features for Wrangling
This Note is the fourth part of the “Data Wrangling” trial tour designed to help you efficiently experience Exploratory’s data wrangling (processing and formatting) features through hands-on practice, focusing on “Useful Features for Wrangling.”
When wrangling data in Exploratory, the “Step” function records data processing operations, allowing you to apply the same processing to different data frames or re-execute it on new data.
In this part, we’d like you to experience useful features for data wrangling.
This section takes about 20 minutes to complete.
Let’s get started!
1. Importing the Project
We’ve published sample data as a project. You can download the project from here.
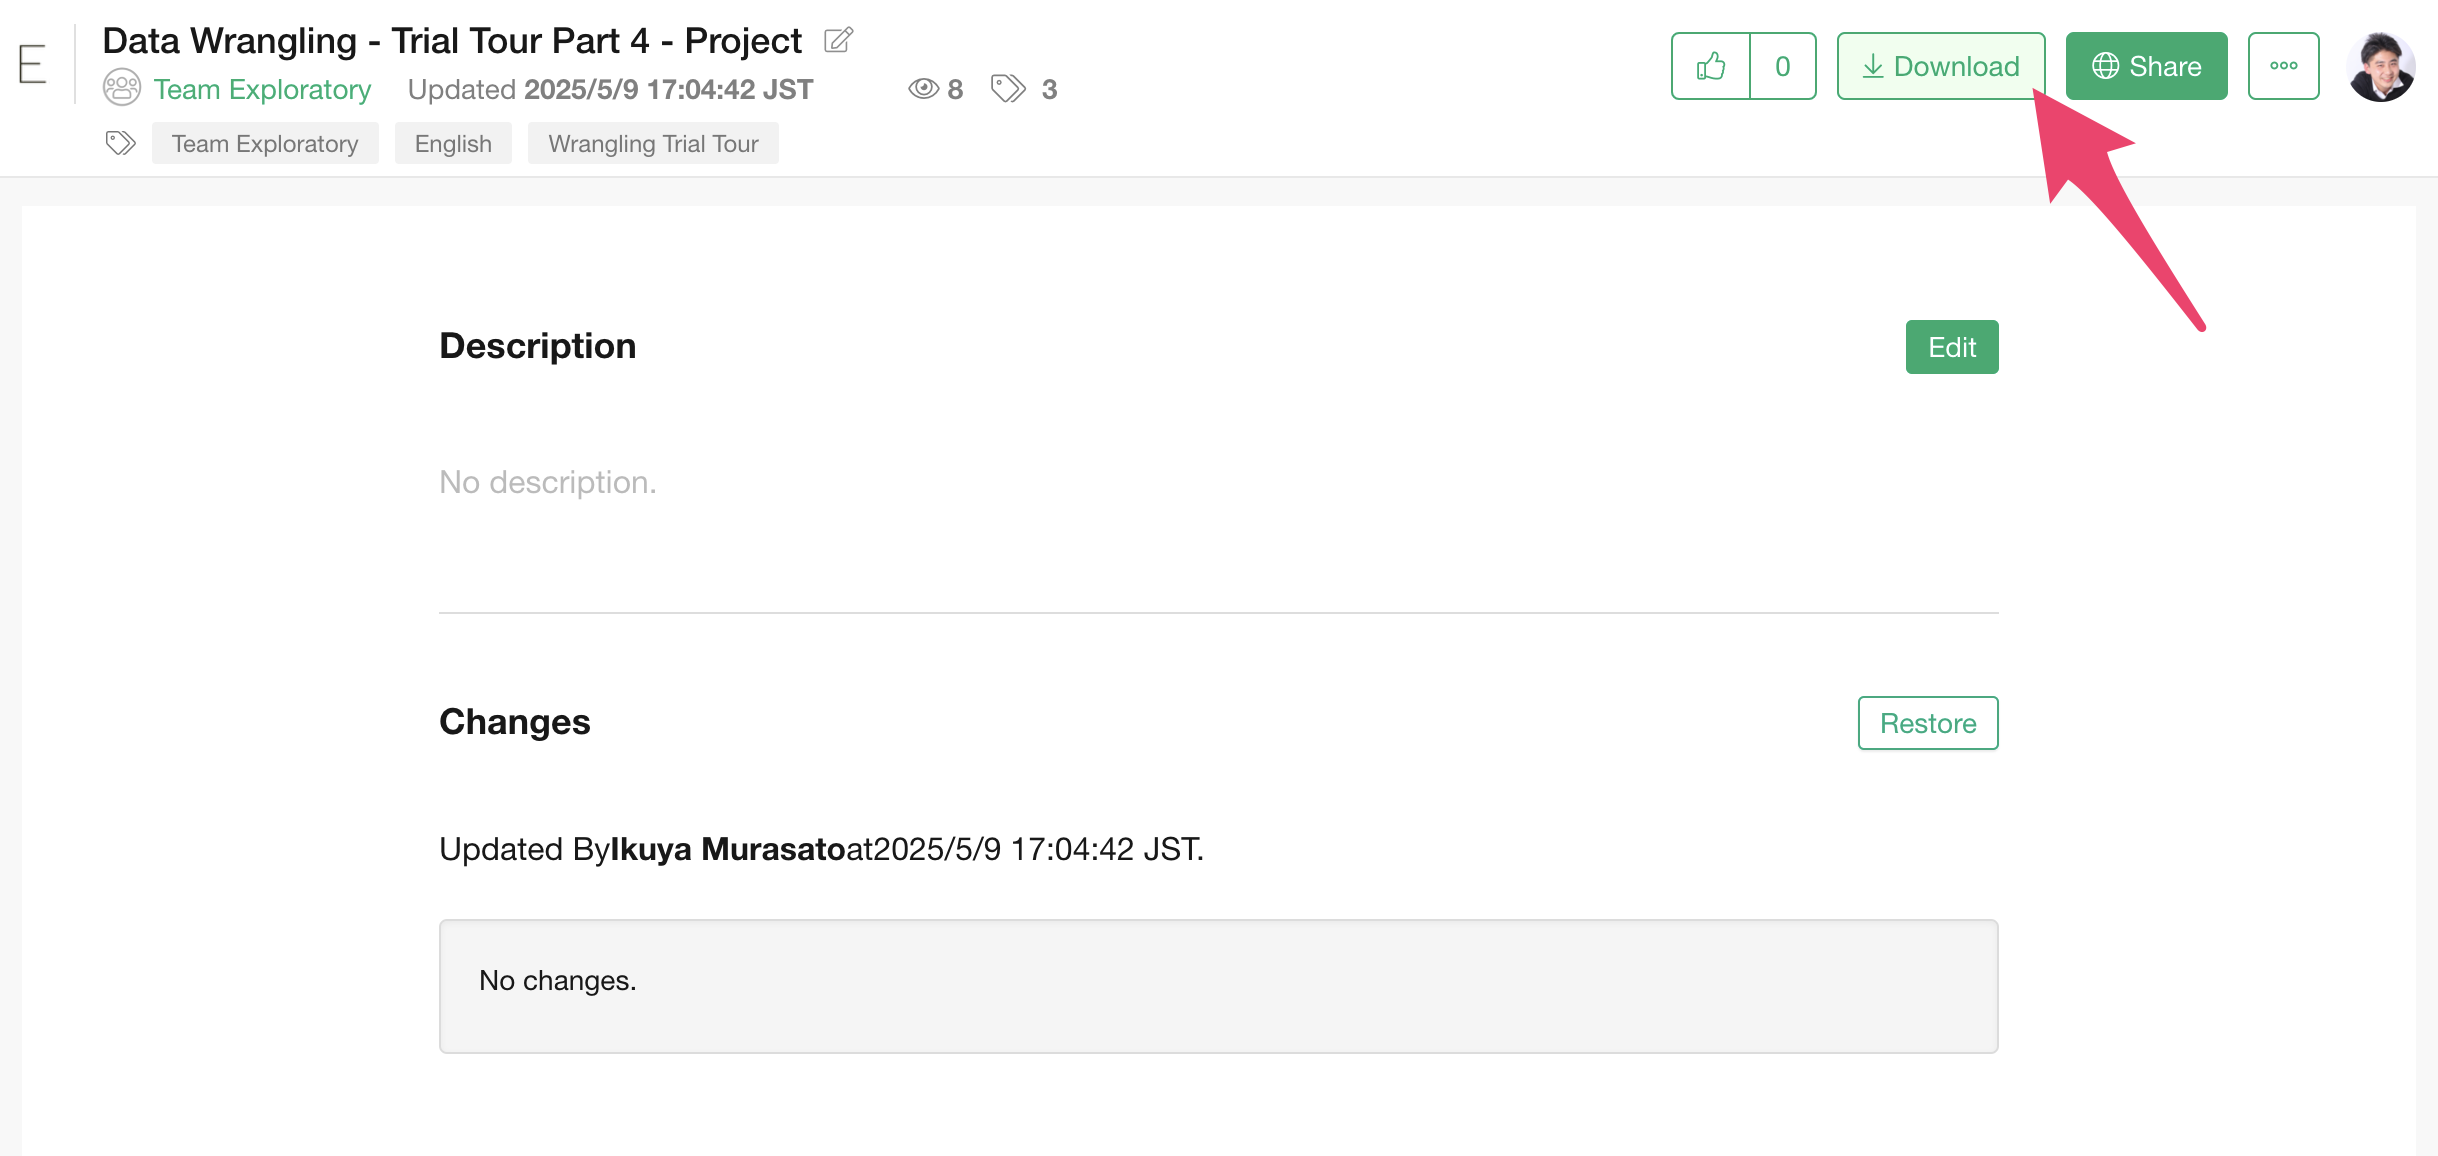
After downloading the data, drag and drop the downloaded project file (.epf) to Exploratory’s project management screen.
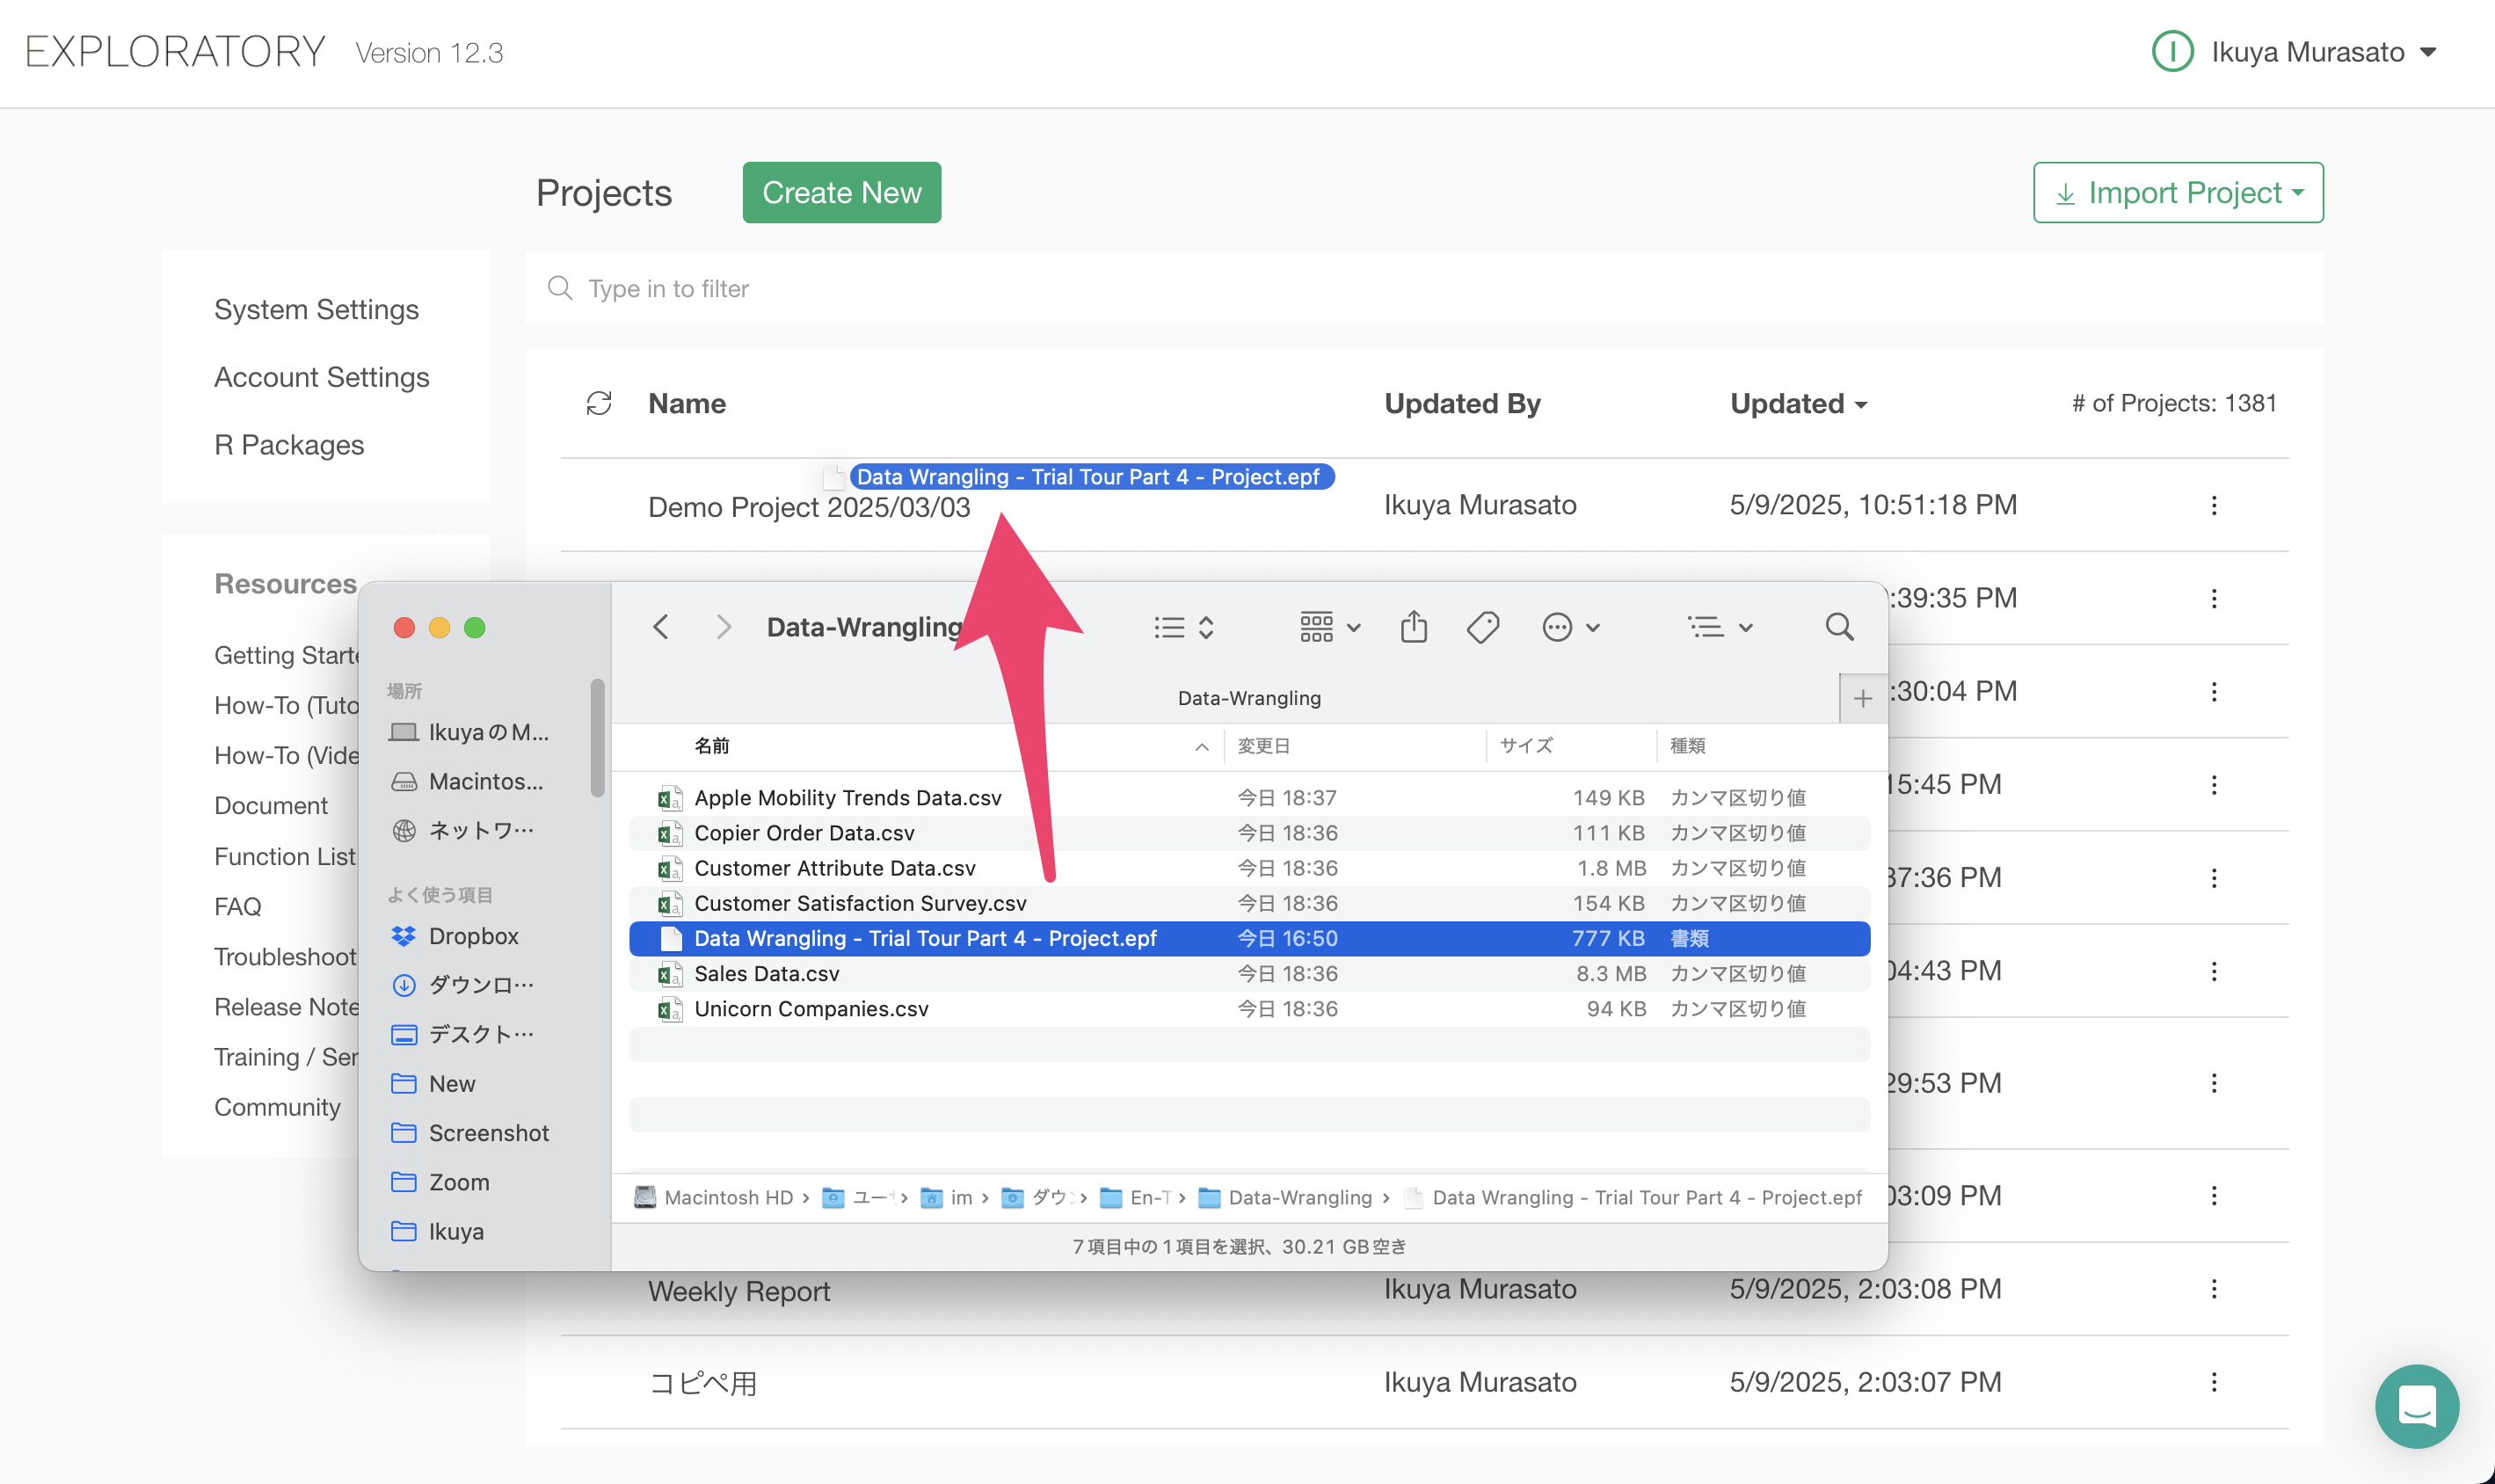
Click on the imported “Data Wrangling - Trial Tour Part 4 - Project” to open it.
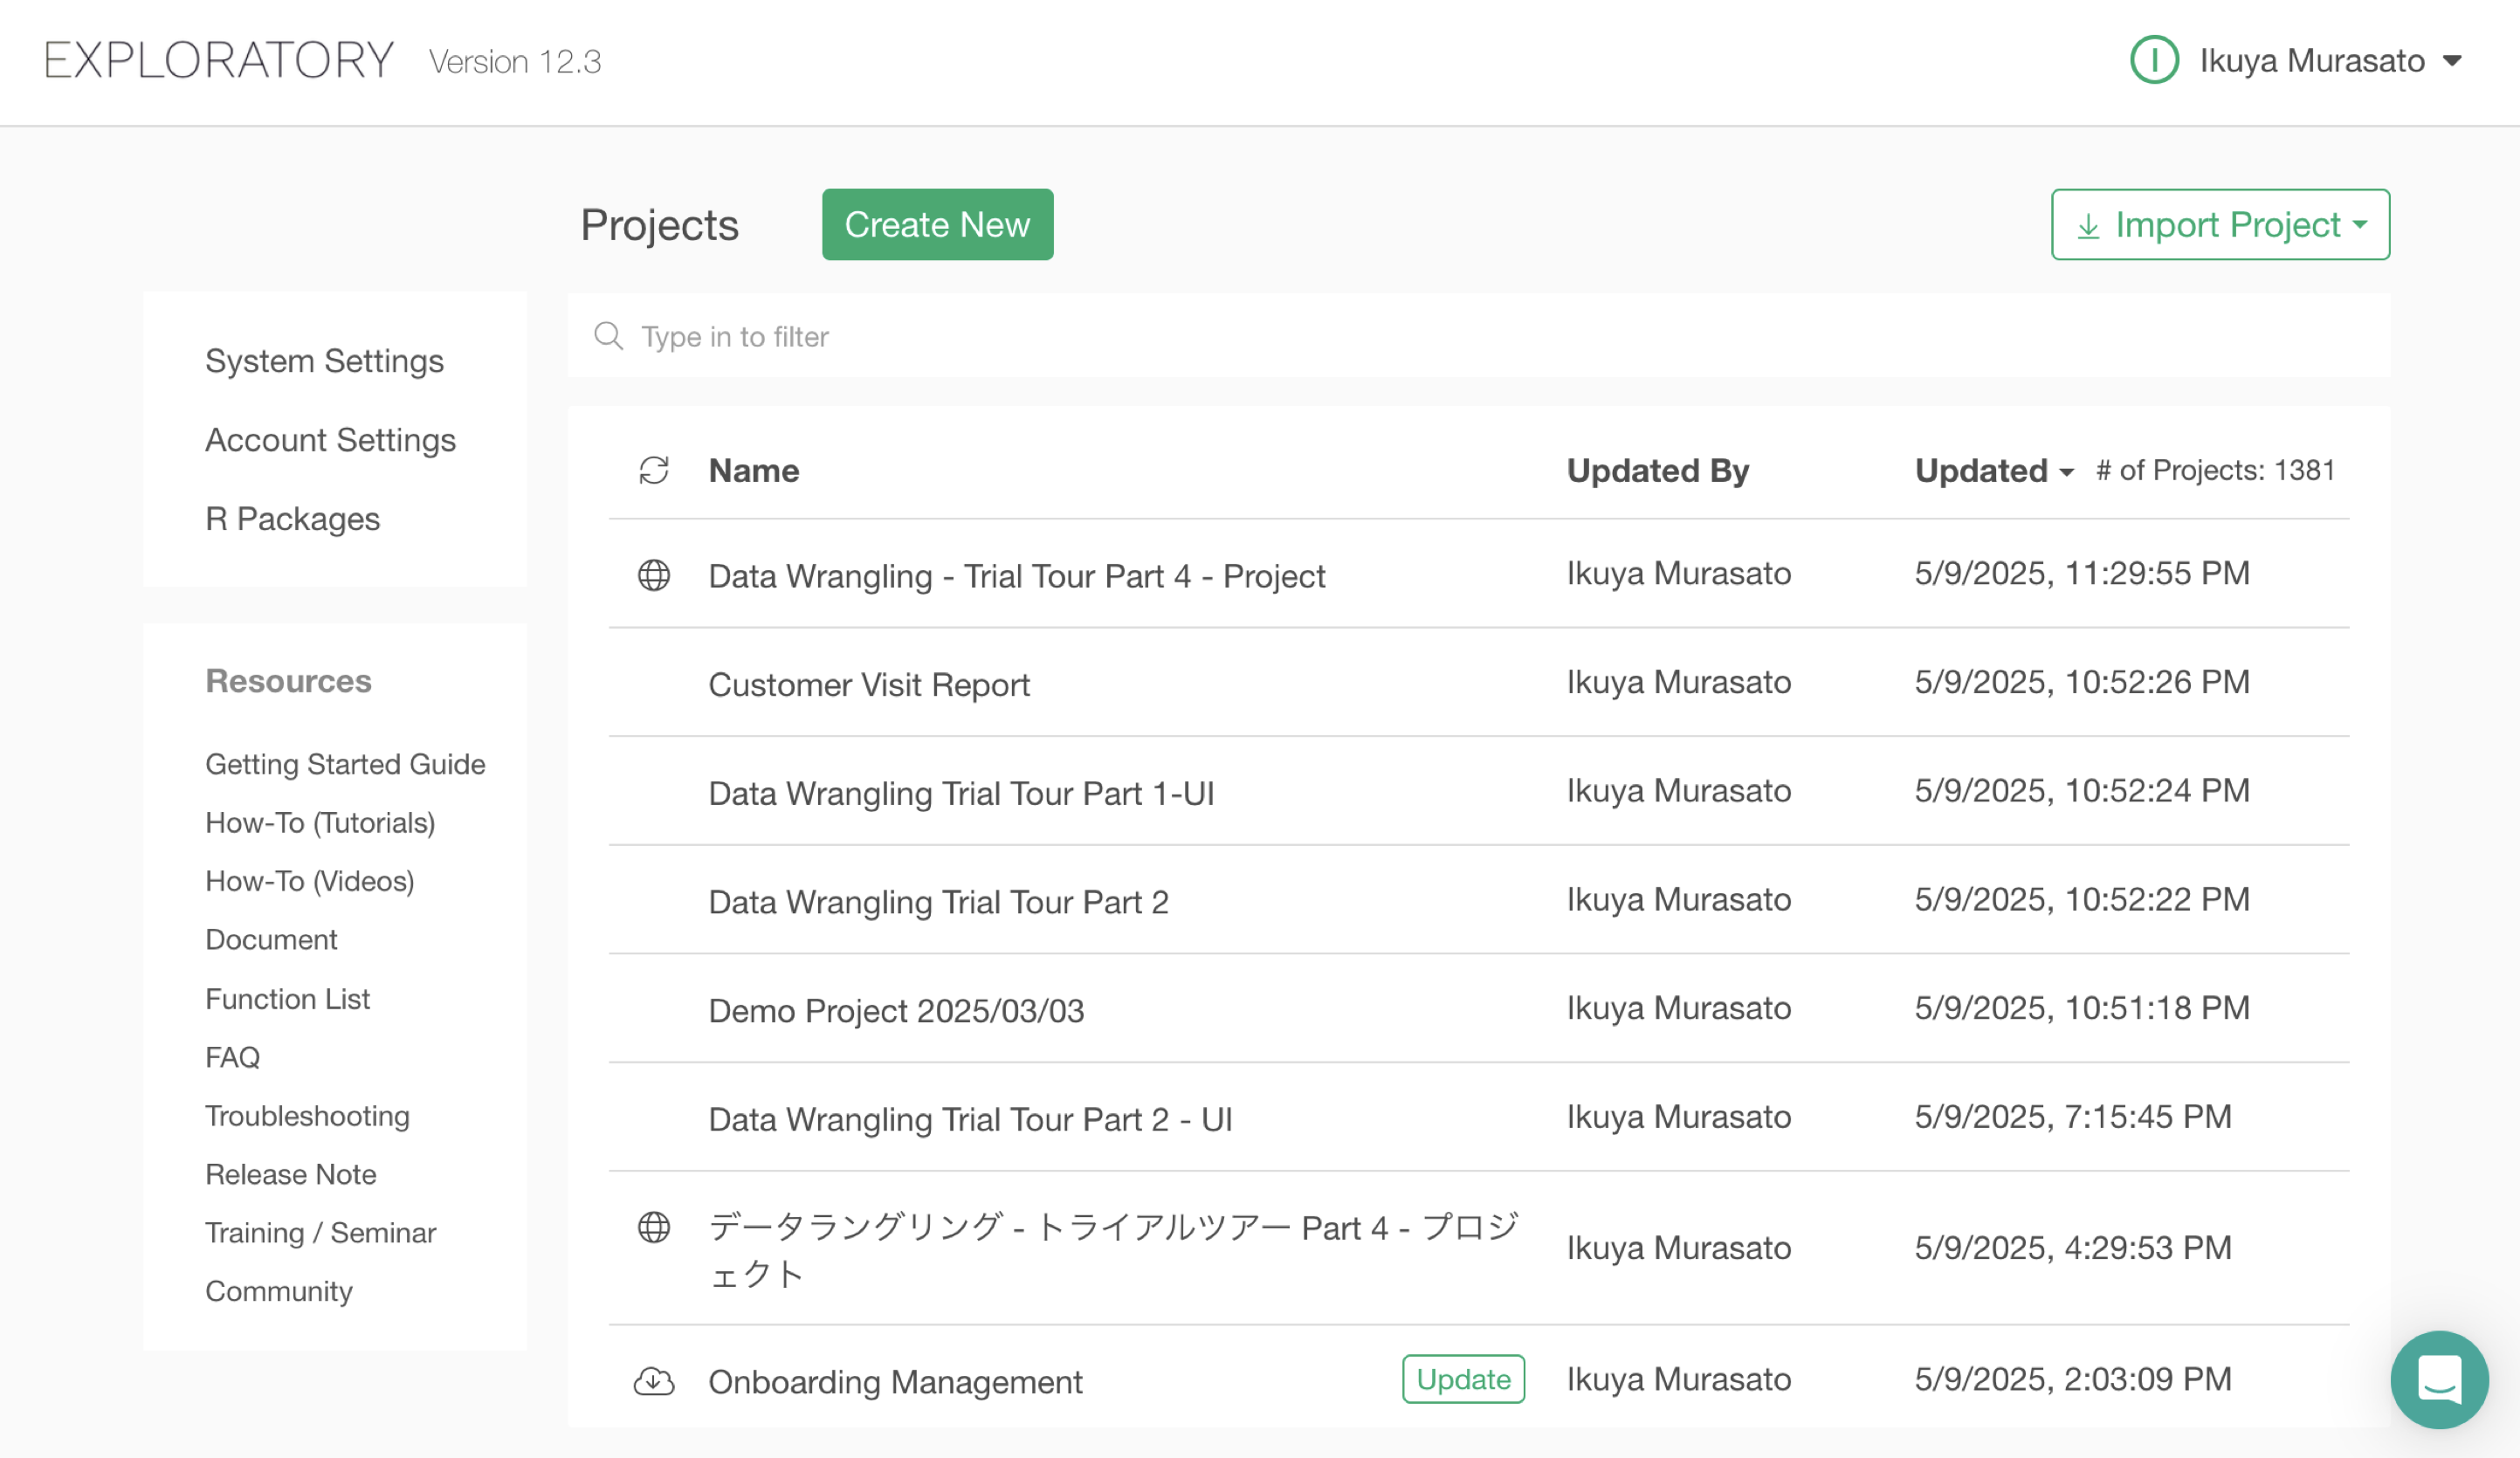
The project contains two data frames: “Sales Data_2022” and “Sales Data_2023”.
2. Copying & Pasting Steps
In Exploratory, you can copy steps and paste them to another data frame to perform the same processing on different data frames.
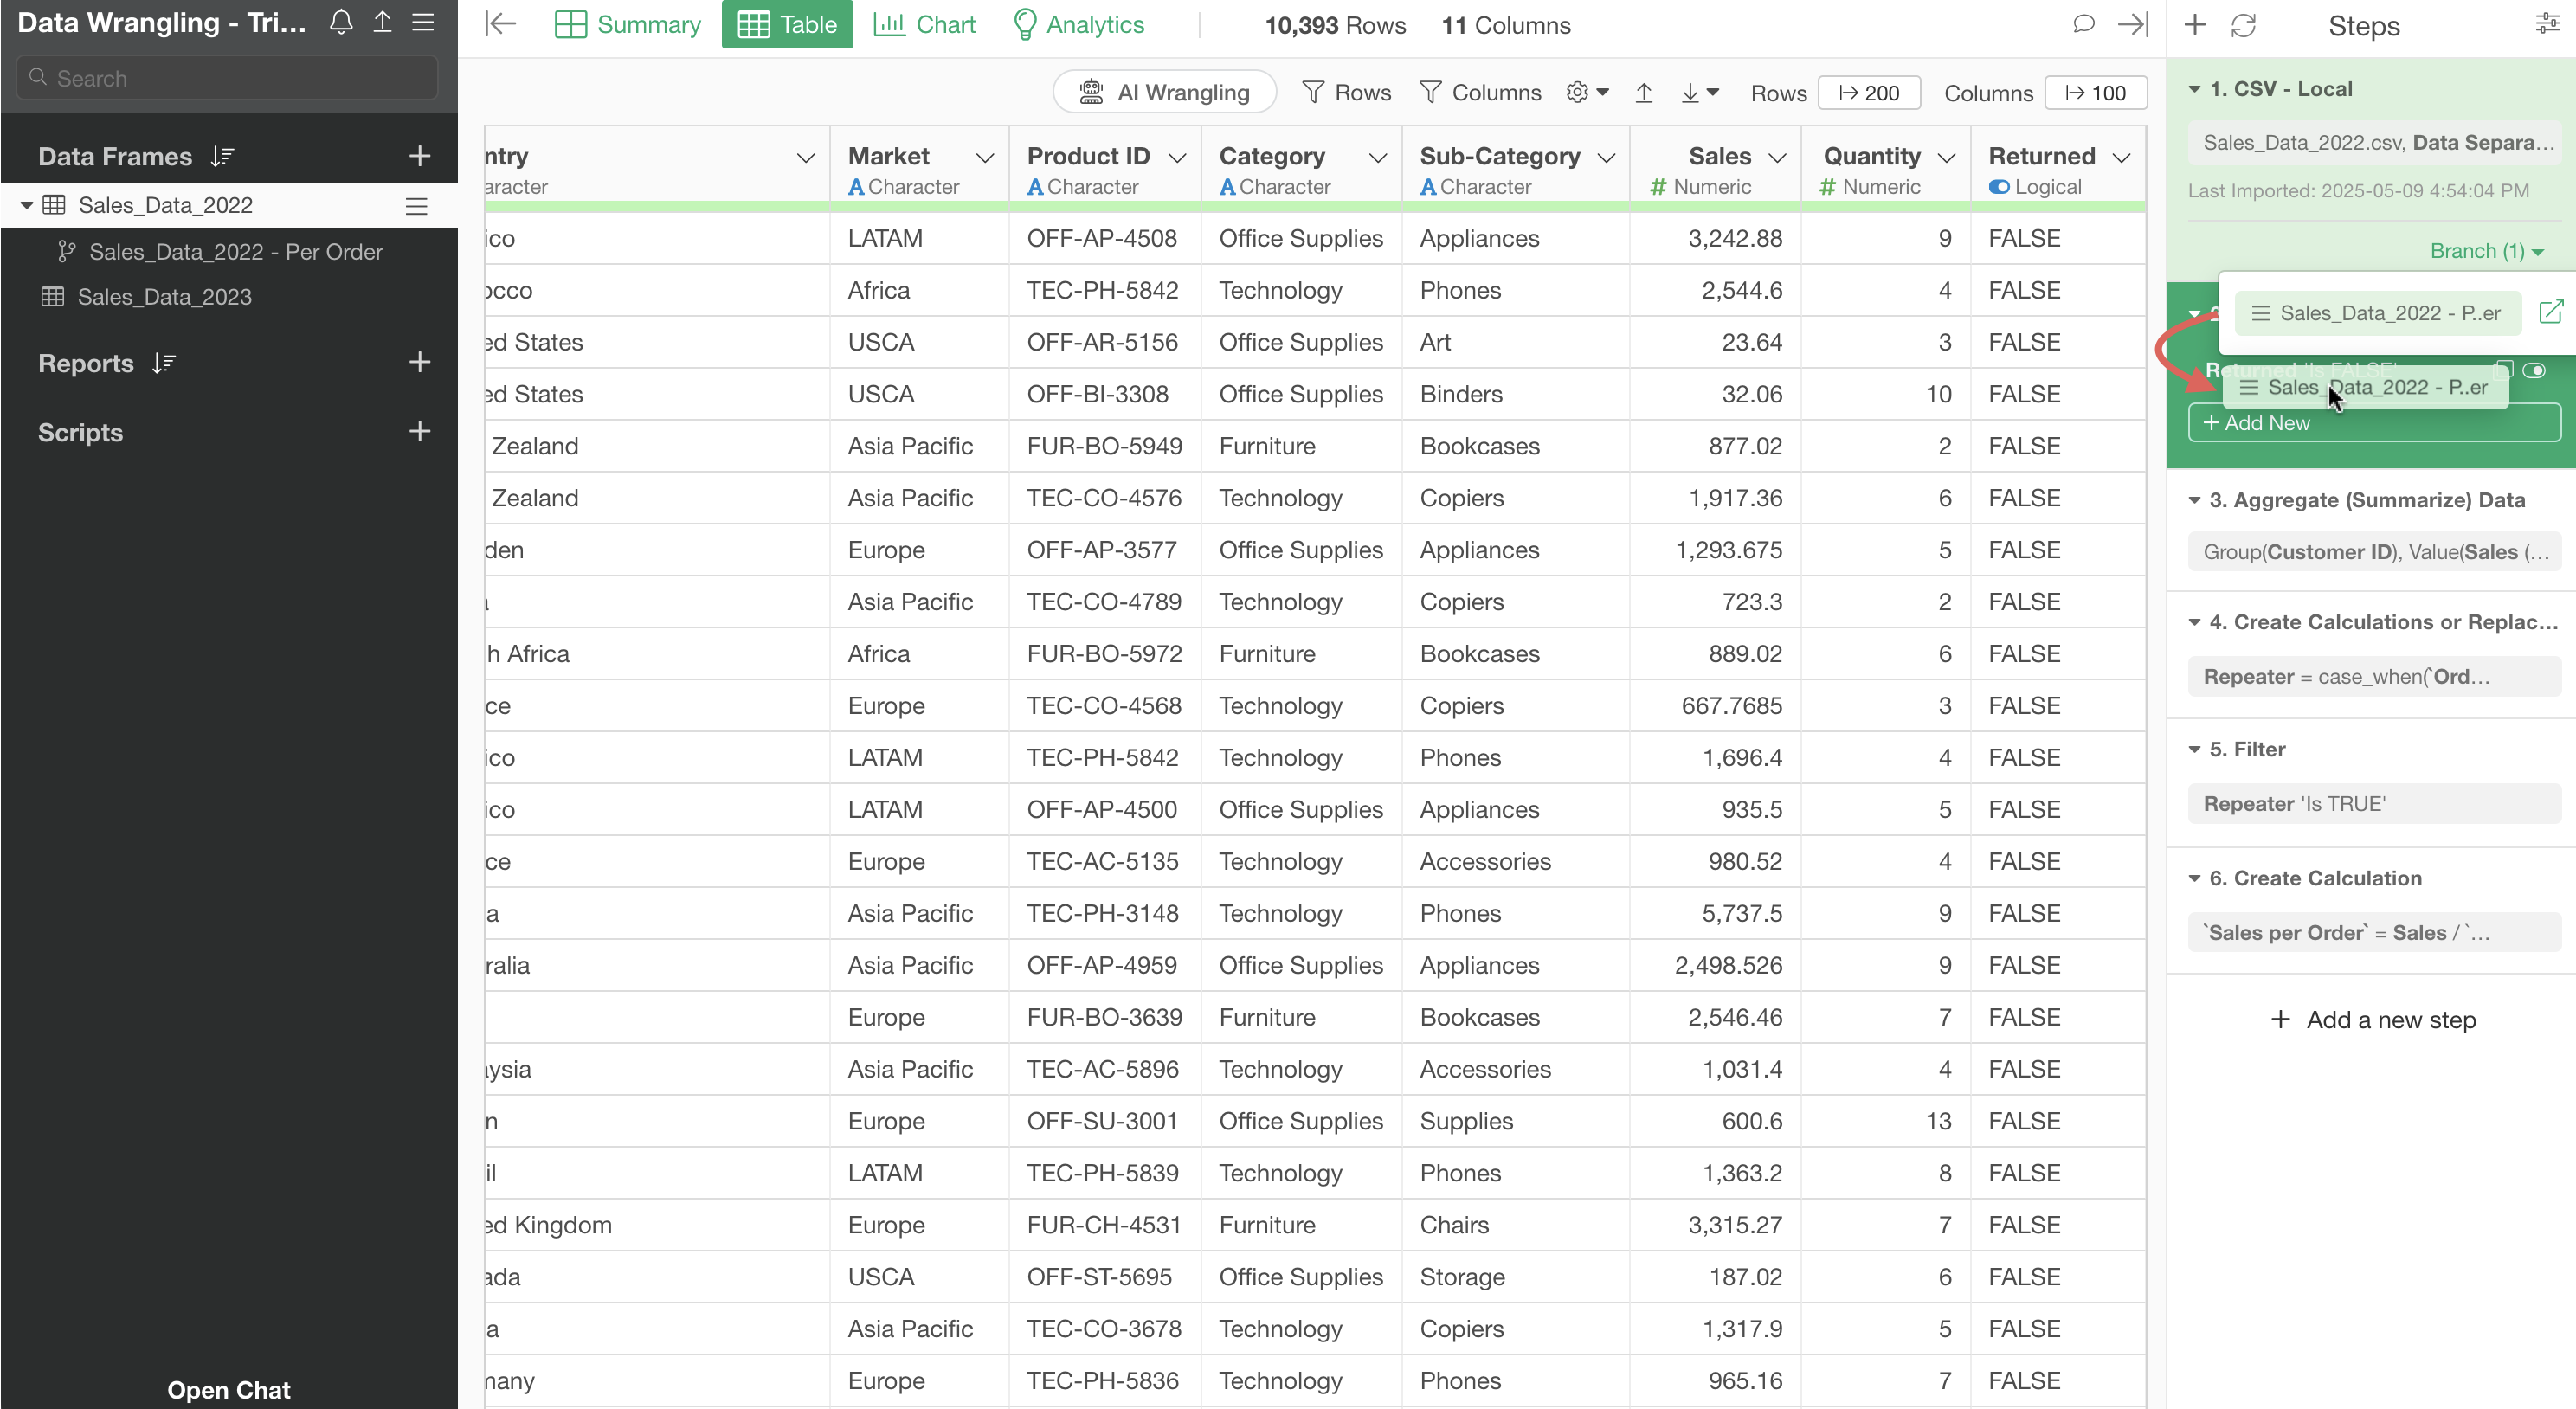
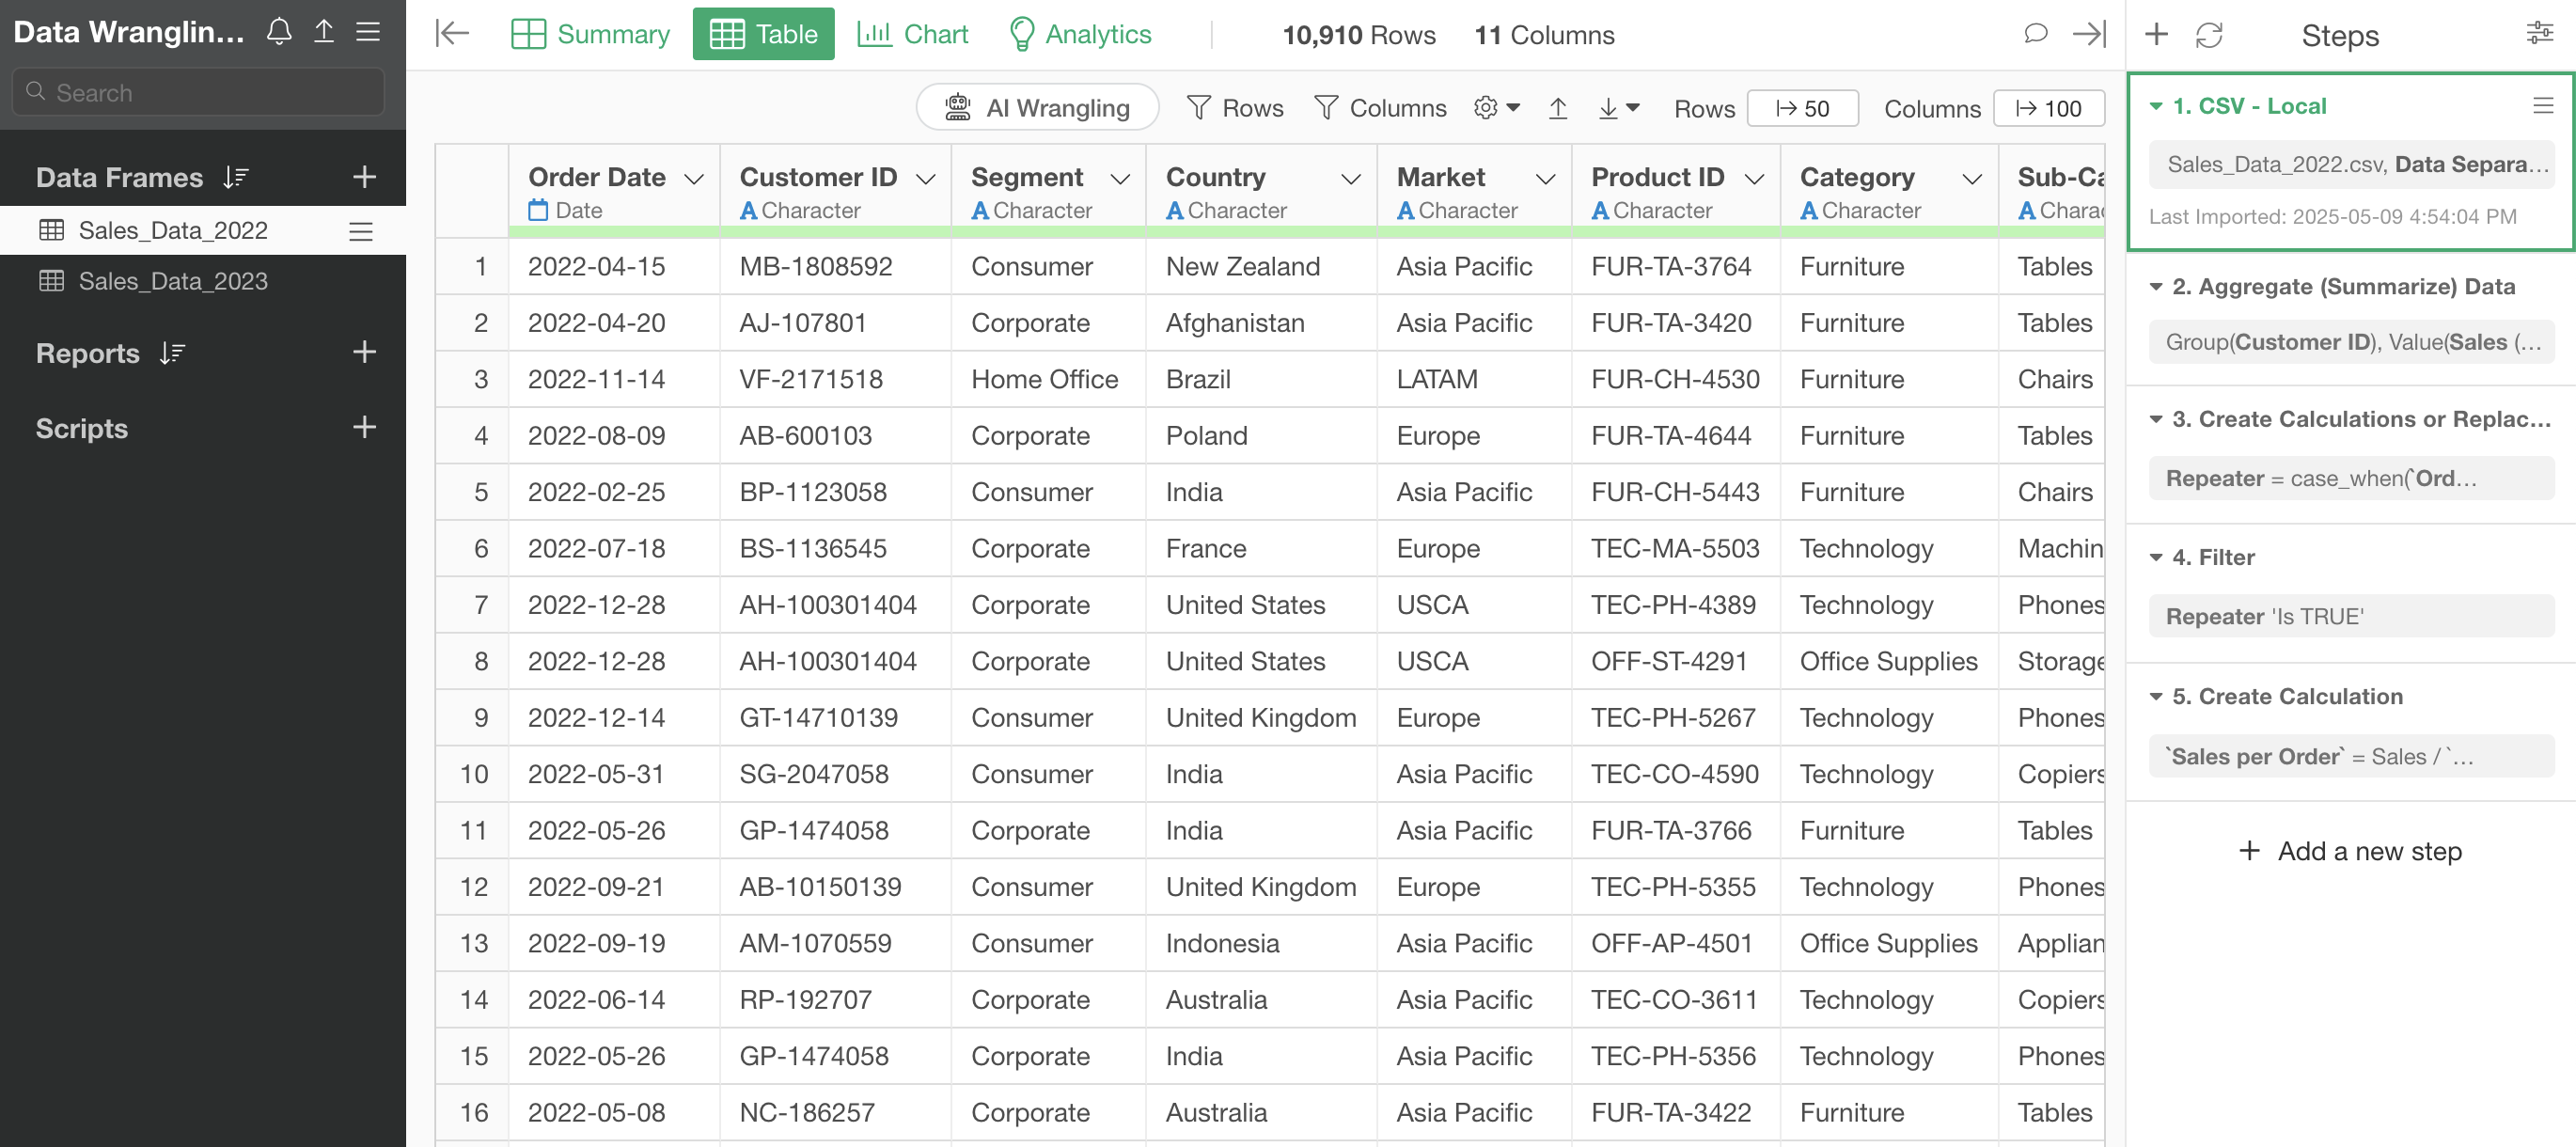
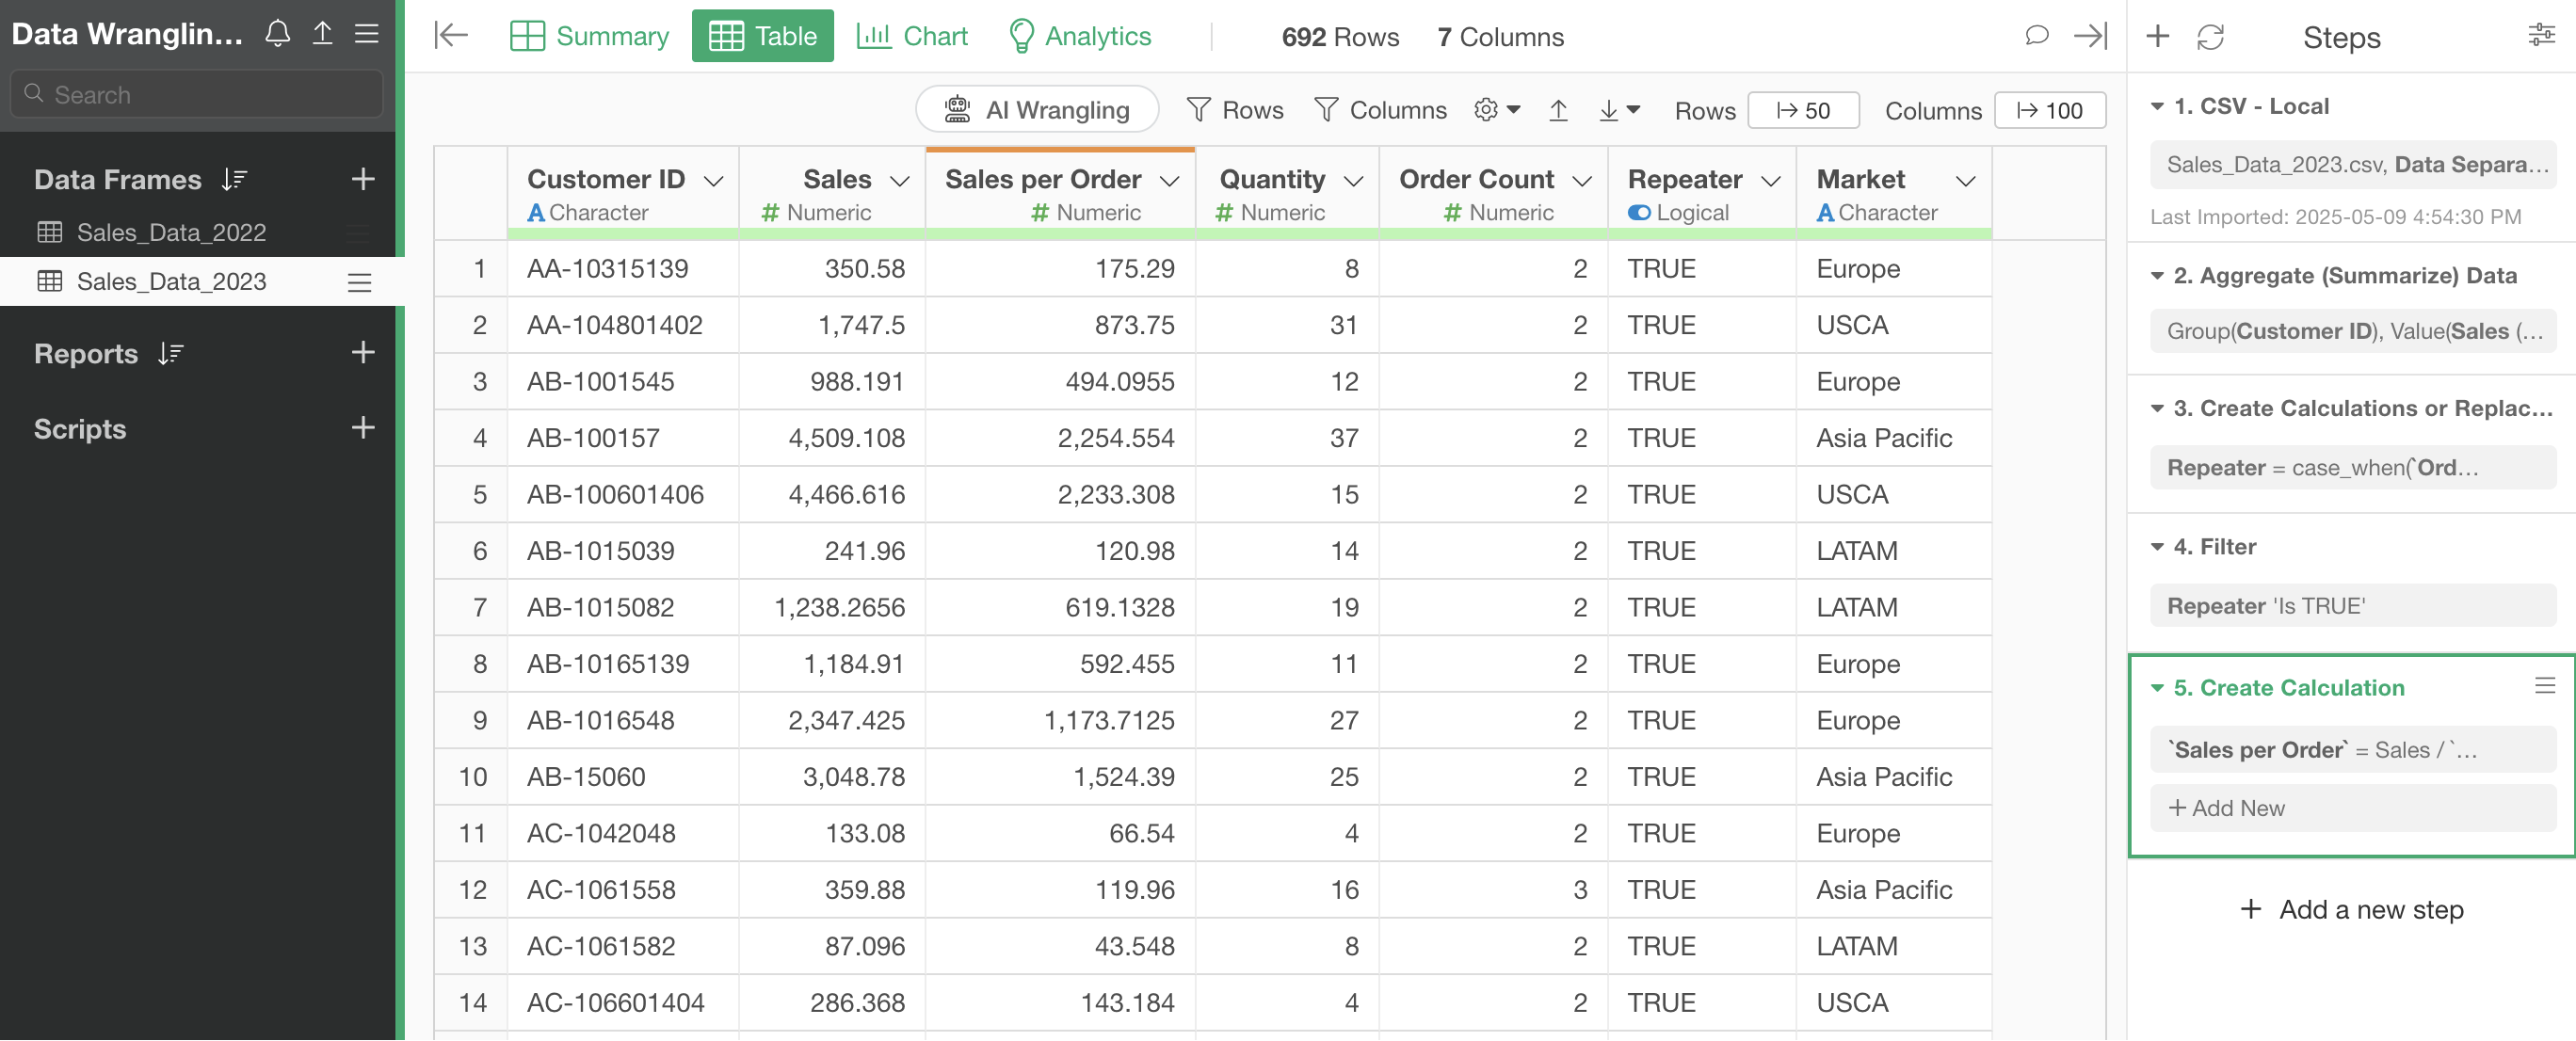
First, open the “Sales Data_2022” data frame.
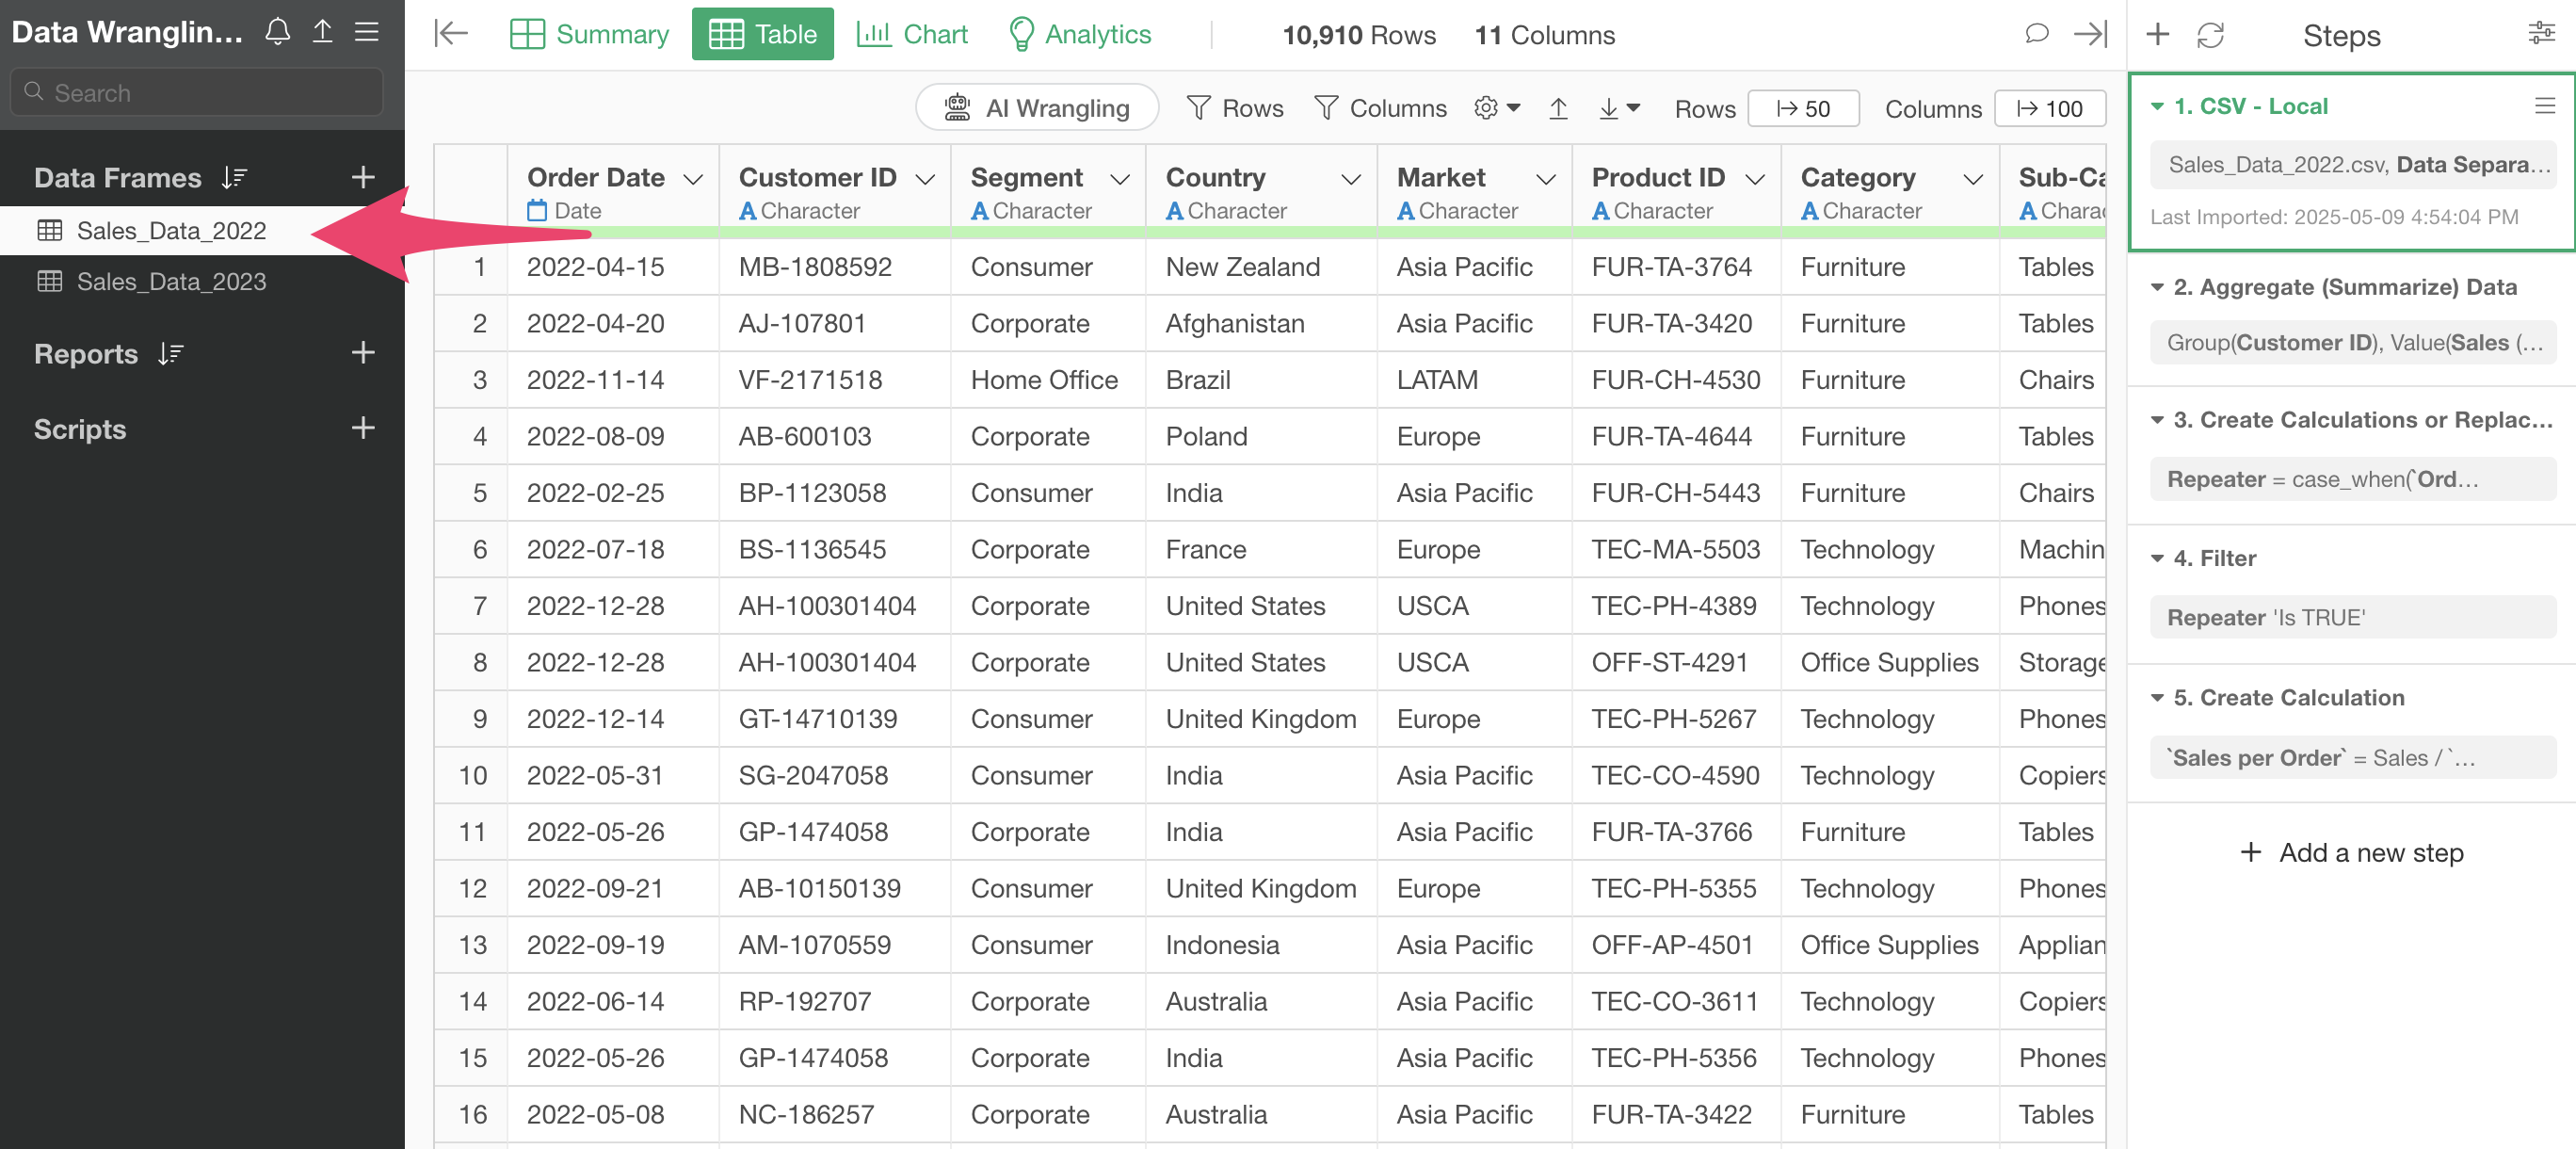
You can see that the “Sales Data_2022” data frame has several steps.
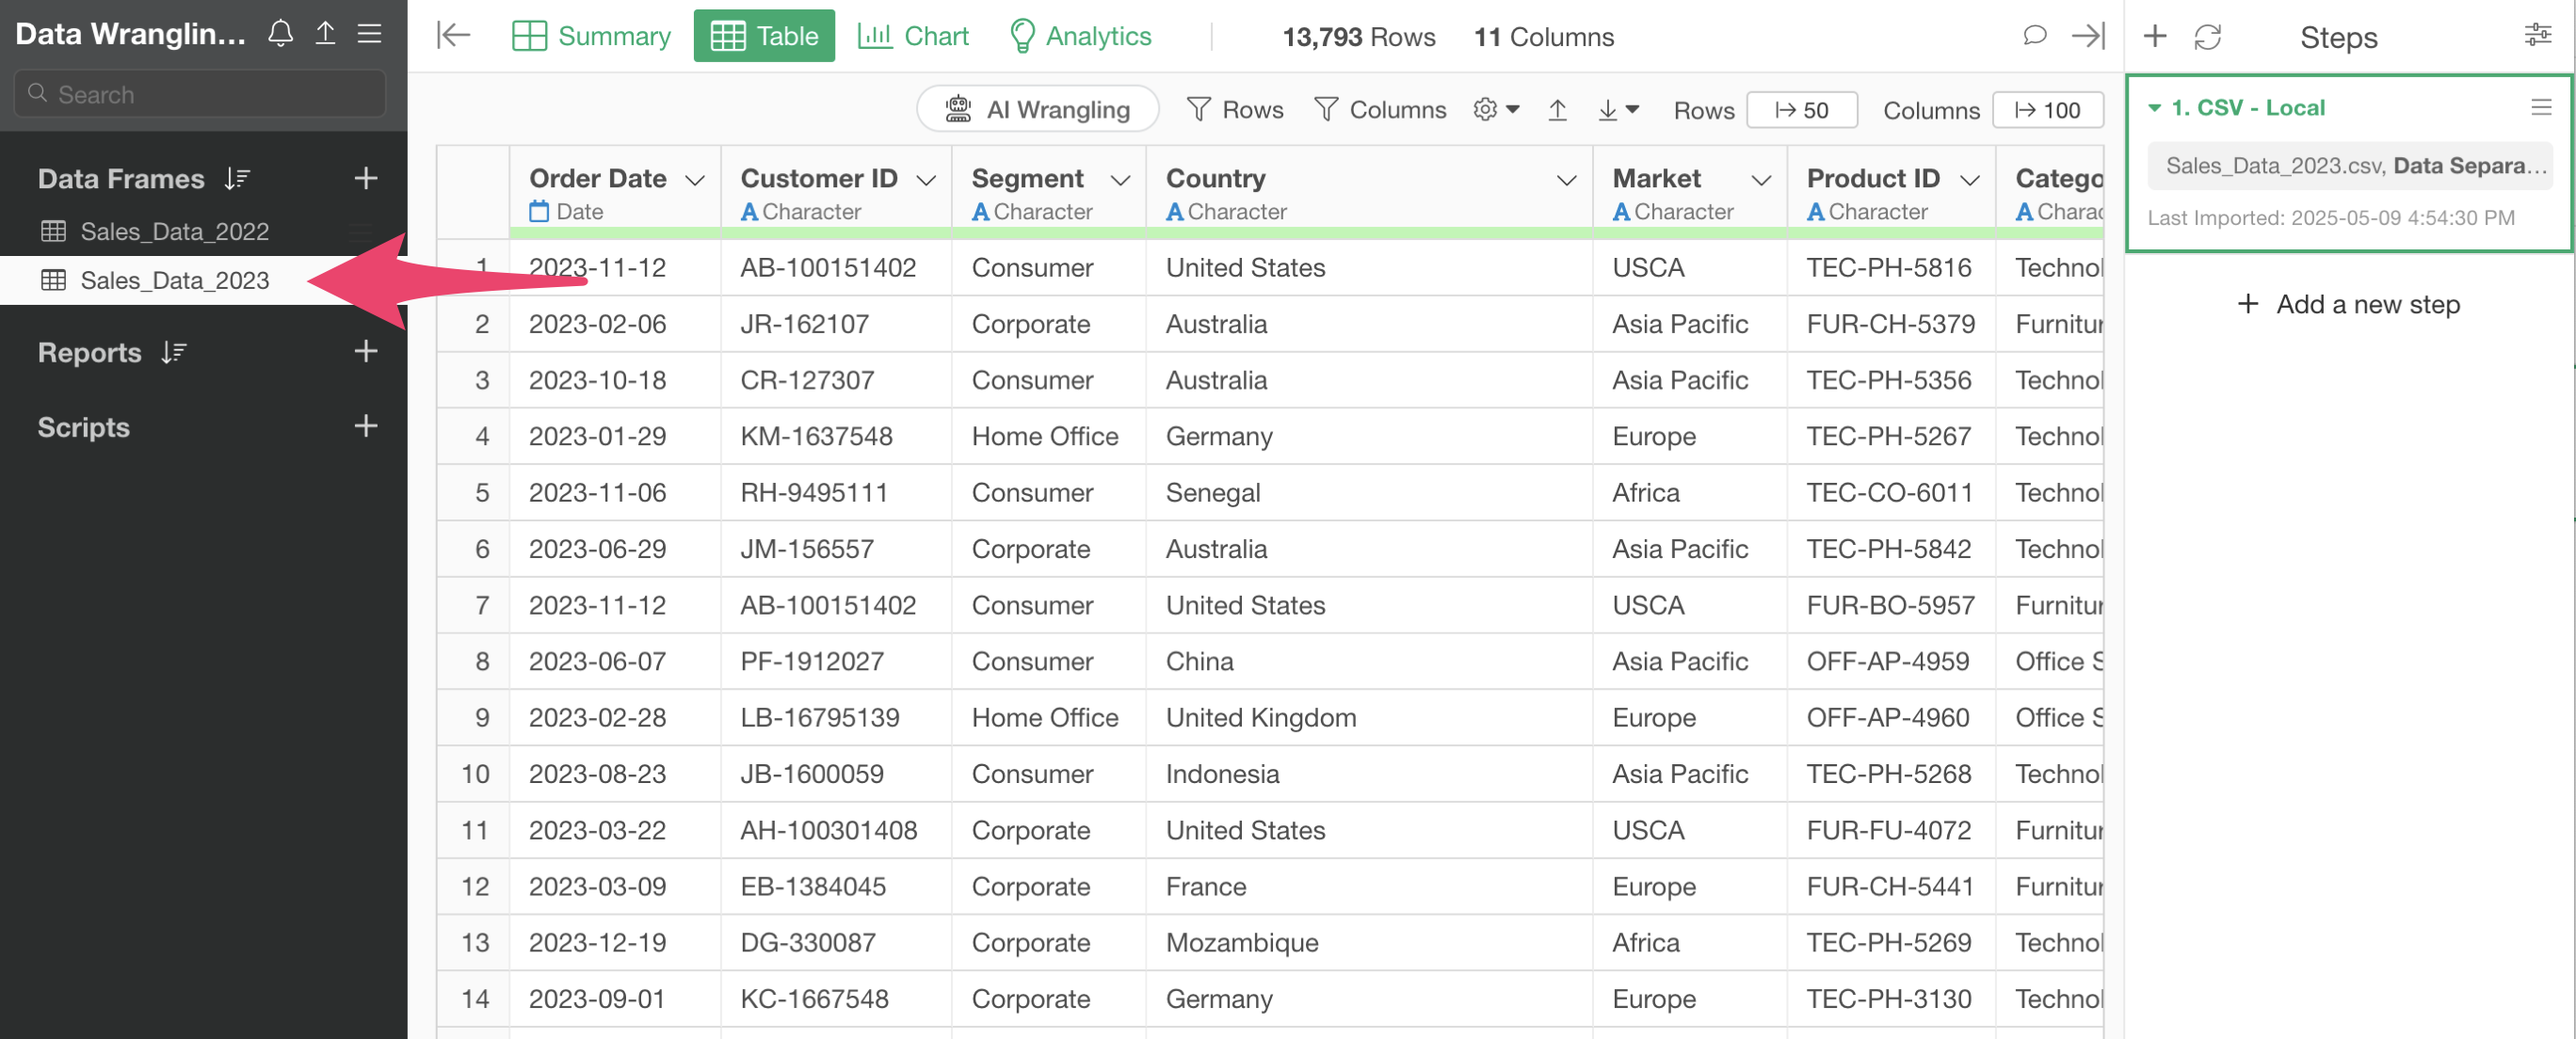
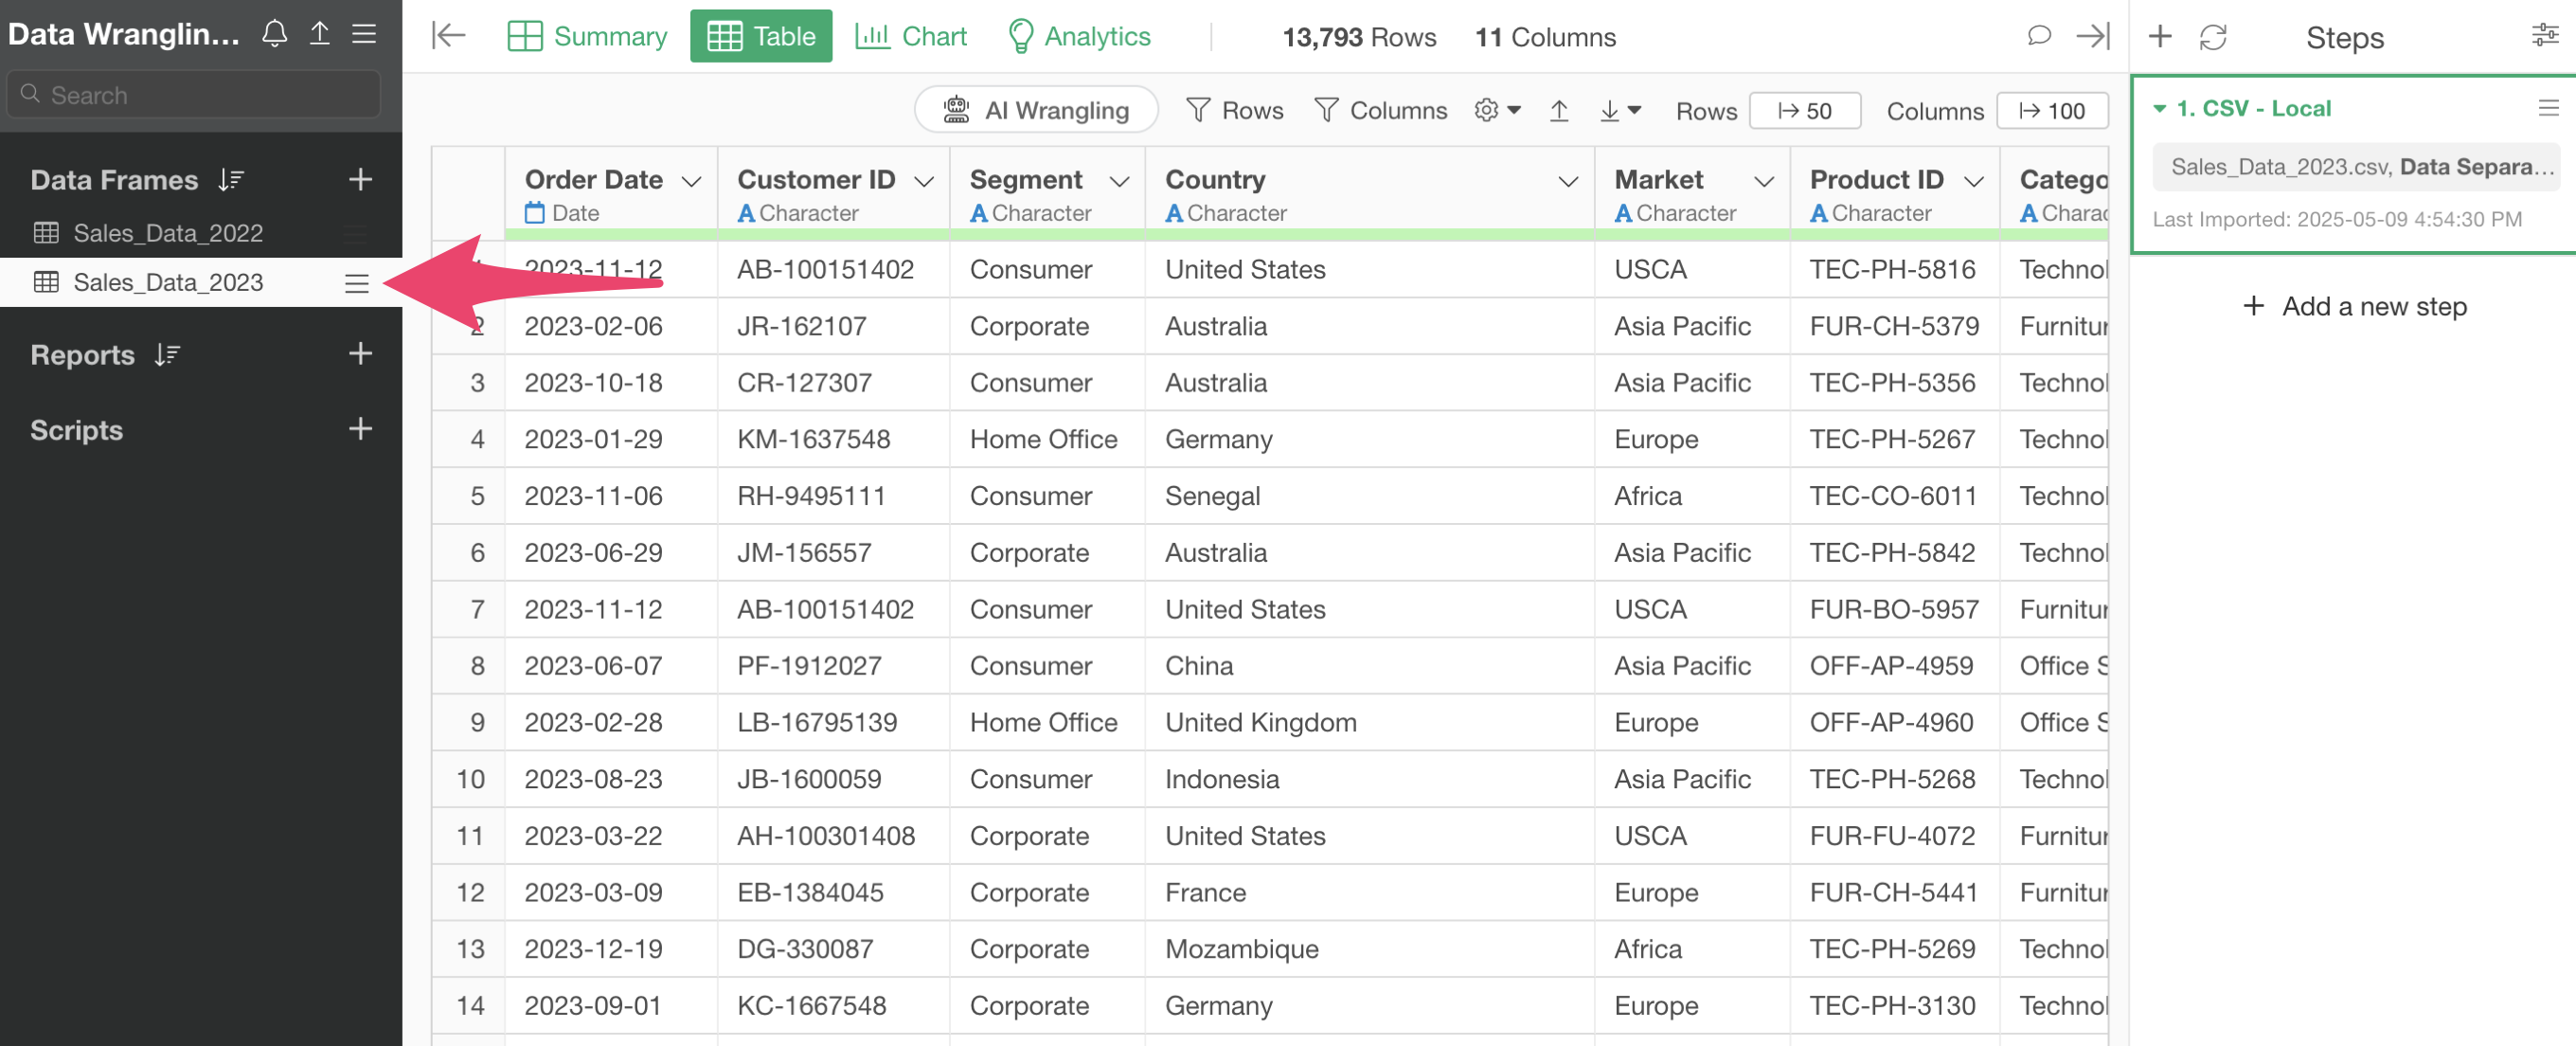
On the other hand, the “Sales Data_2023” data frame only has the import step (Step 1) and no data processing has been performed.
Now, let’s say you want to apply the same steps from “Sales Data_2022” to “Sales Data_2023” as well.
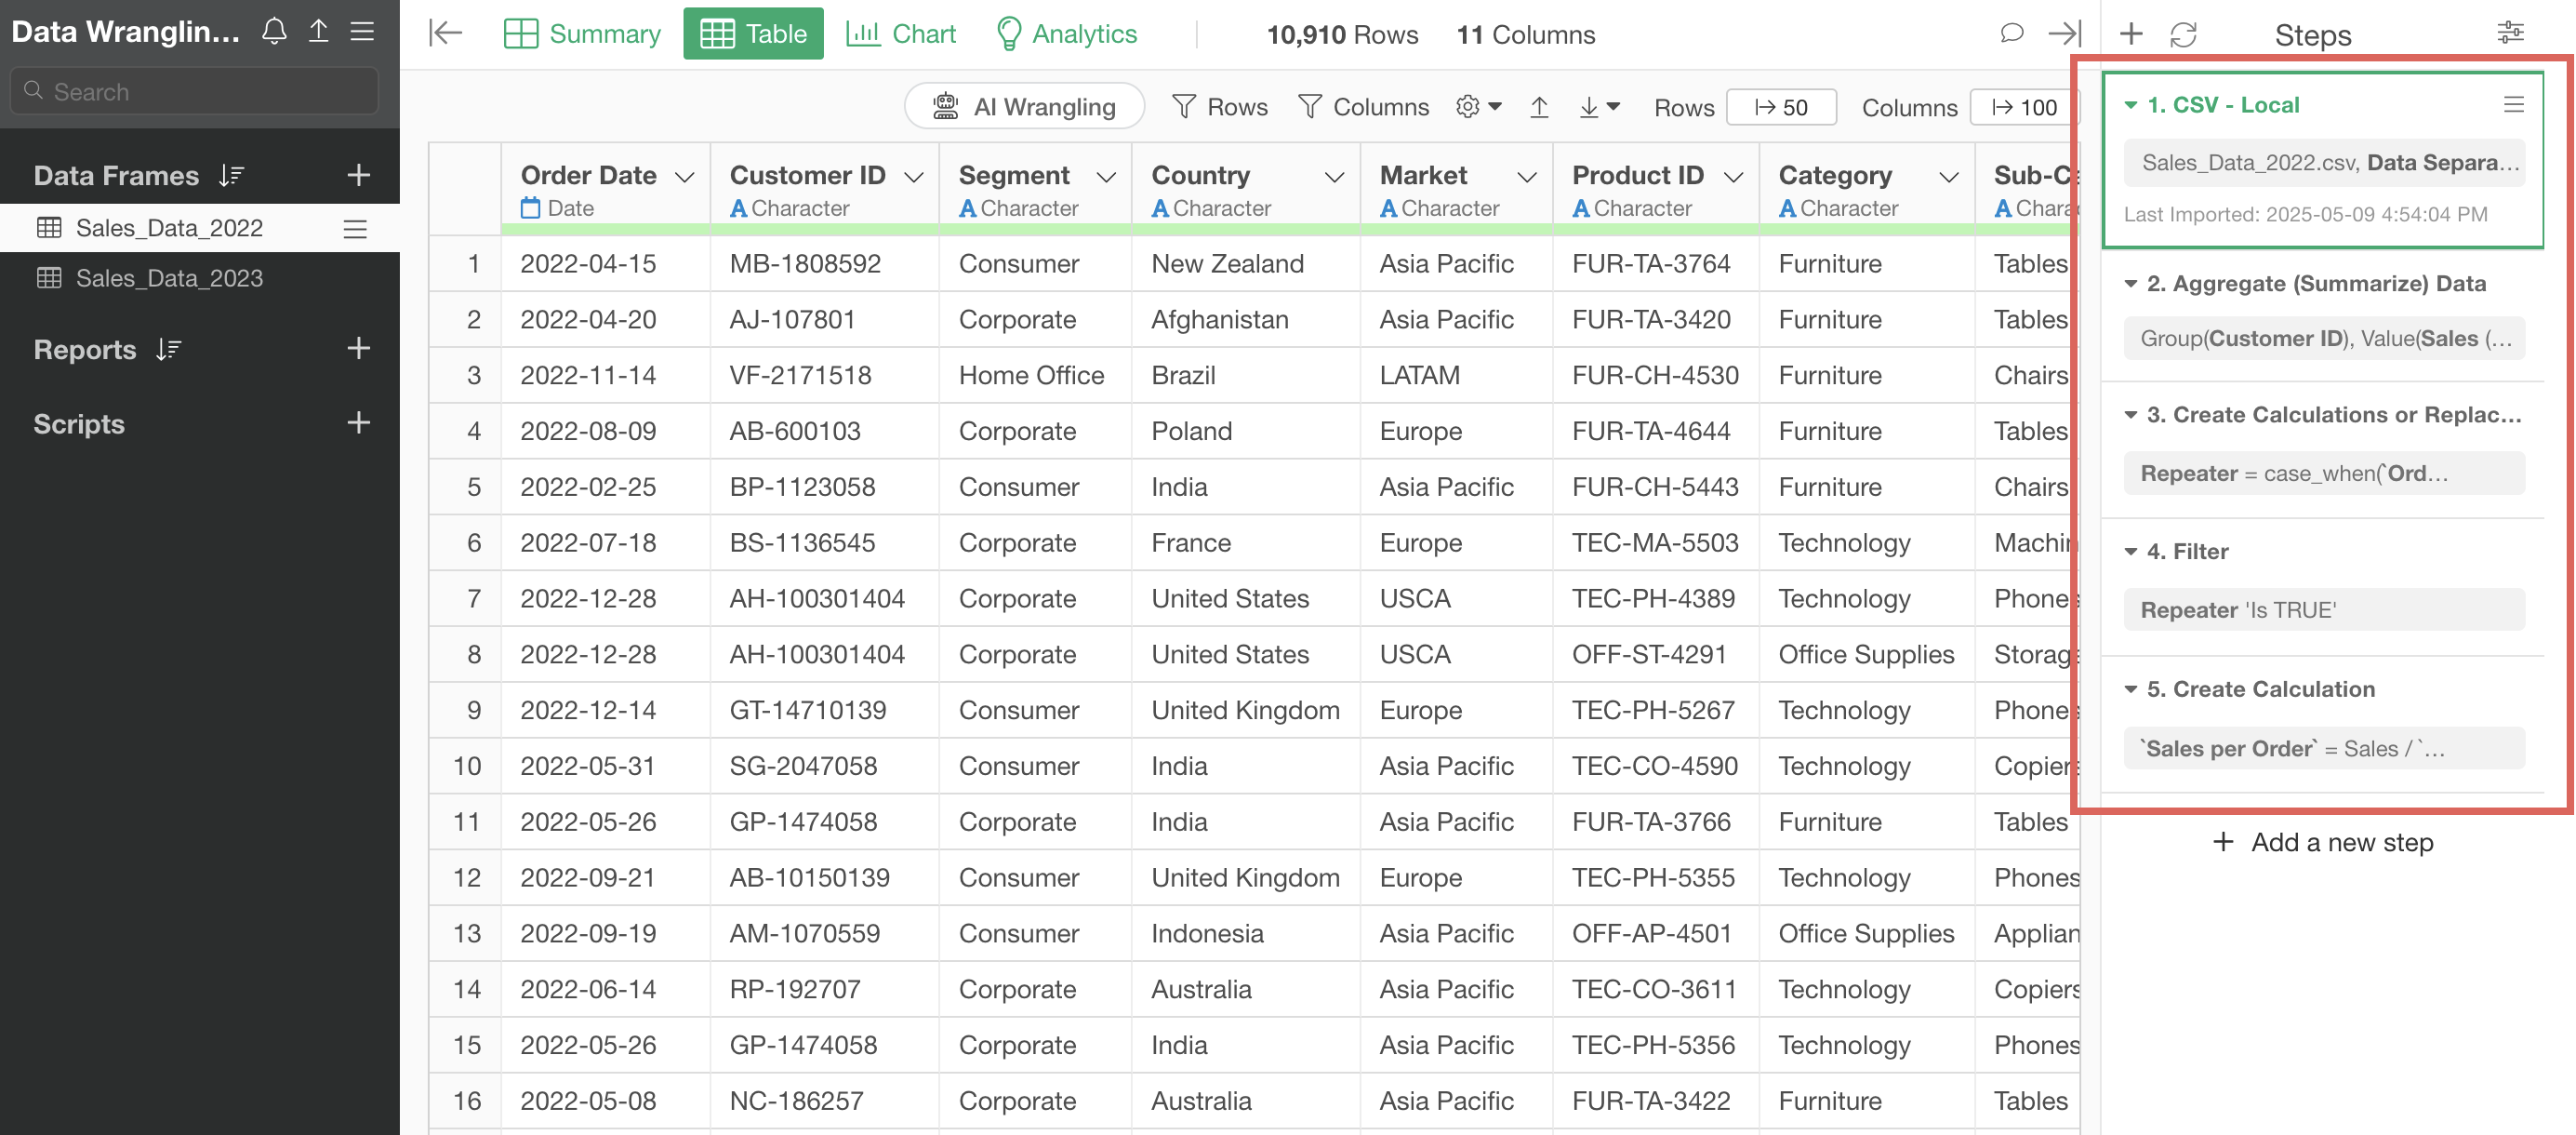
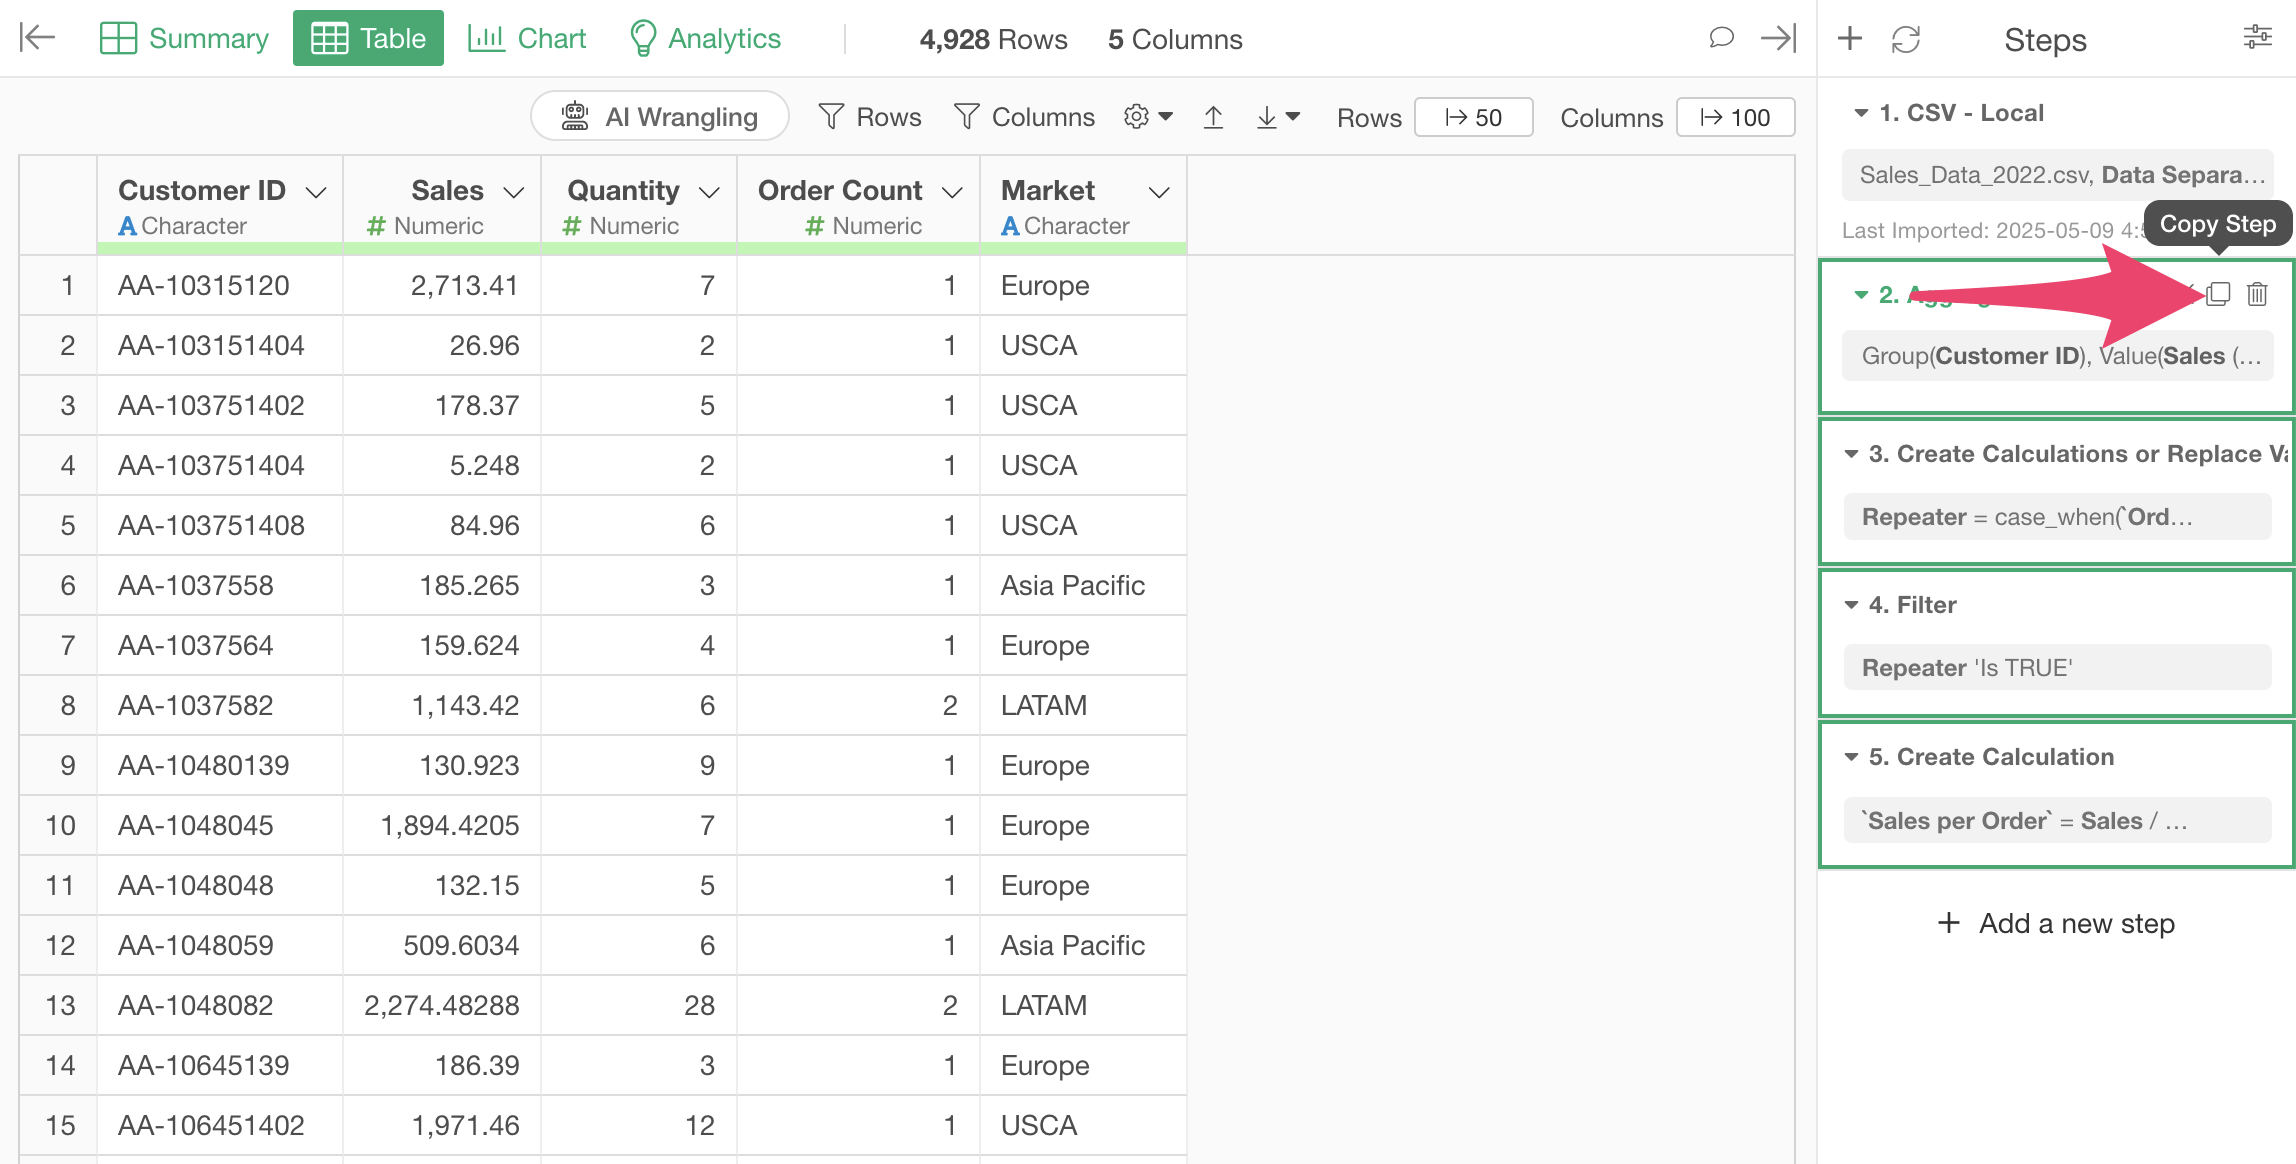
Open the “Sales Data_2022” data frame and select Steps 2 through 5 by holding down the Shift key.
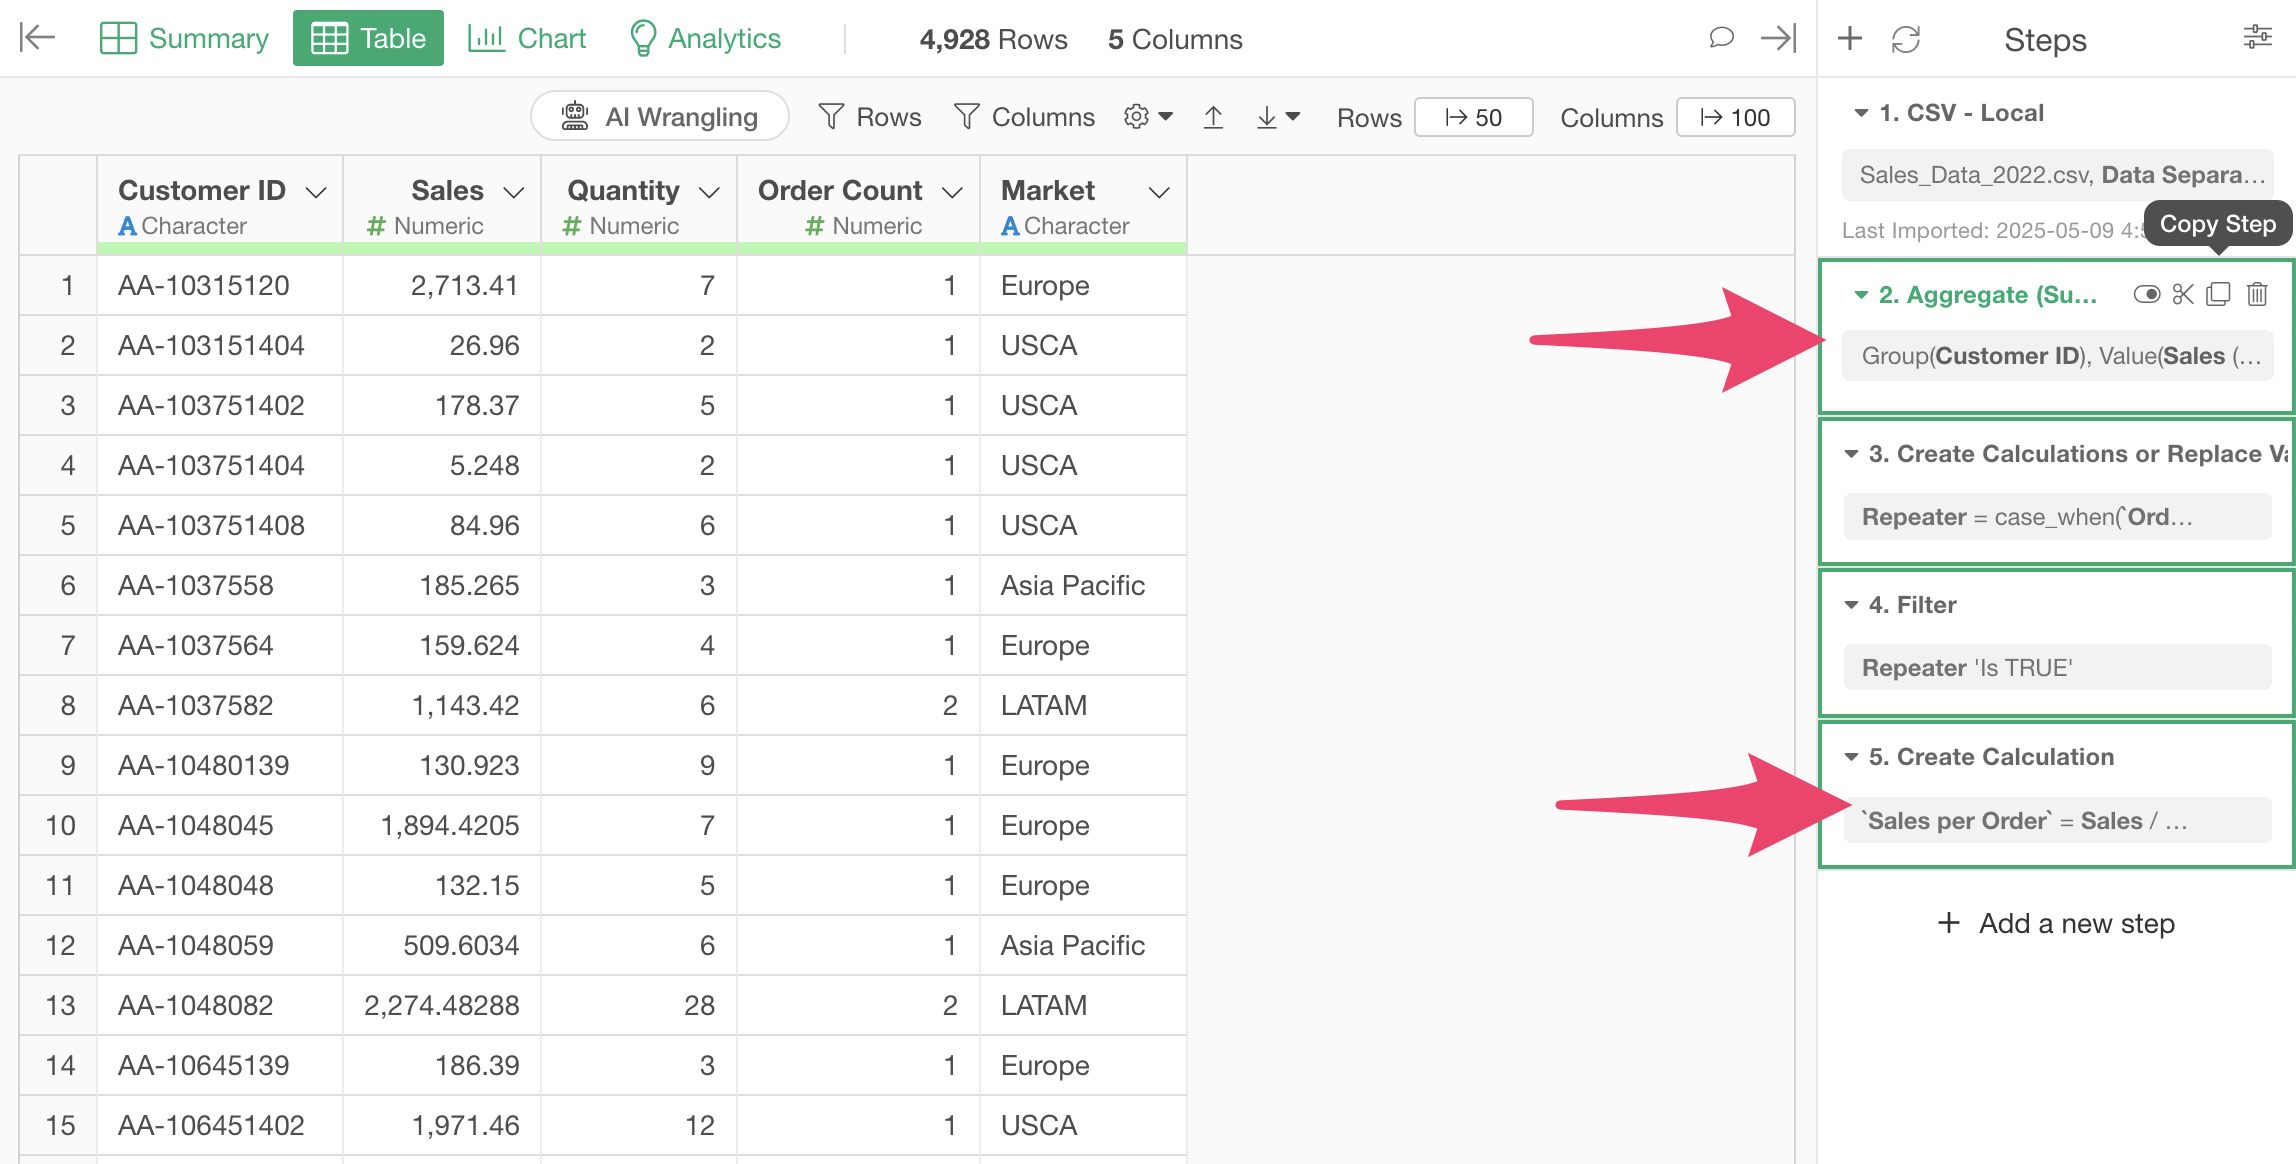
With multiple steps selected, click the “Copy Steps” button.
Next, open the “Sales Data_2023” data frame.
Click “Paste Steps” from the step menu.
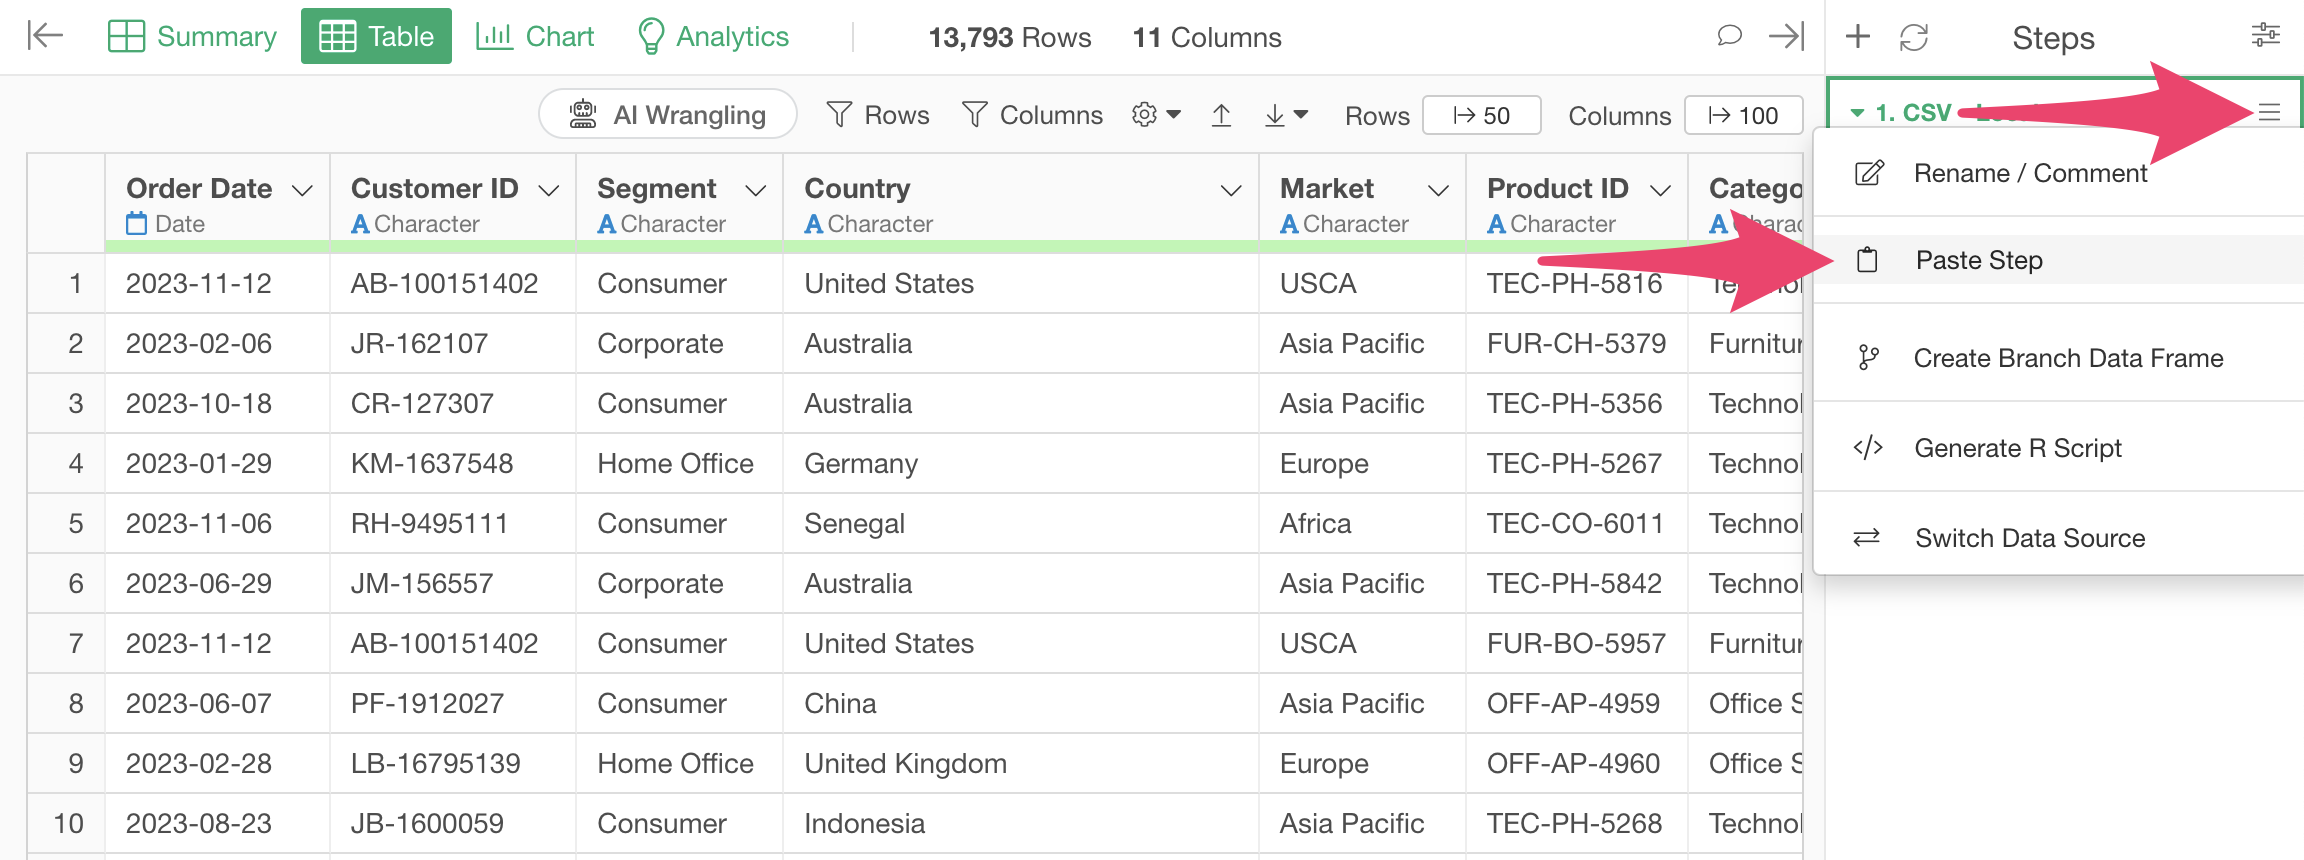
This allows you to paste the steps into the “Sales Data_2023” data frame and perform the same processing.
3. Creating Branches
This data frame is “summarized” in the second step, aggregating the data to one row per customer.
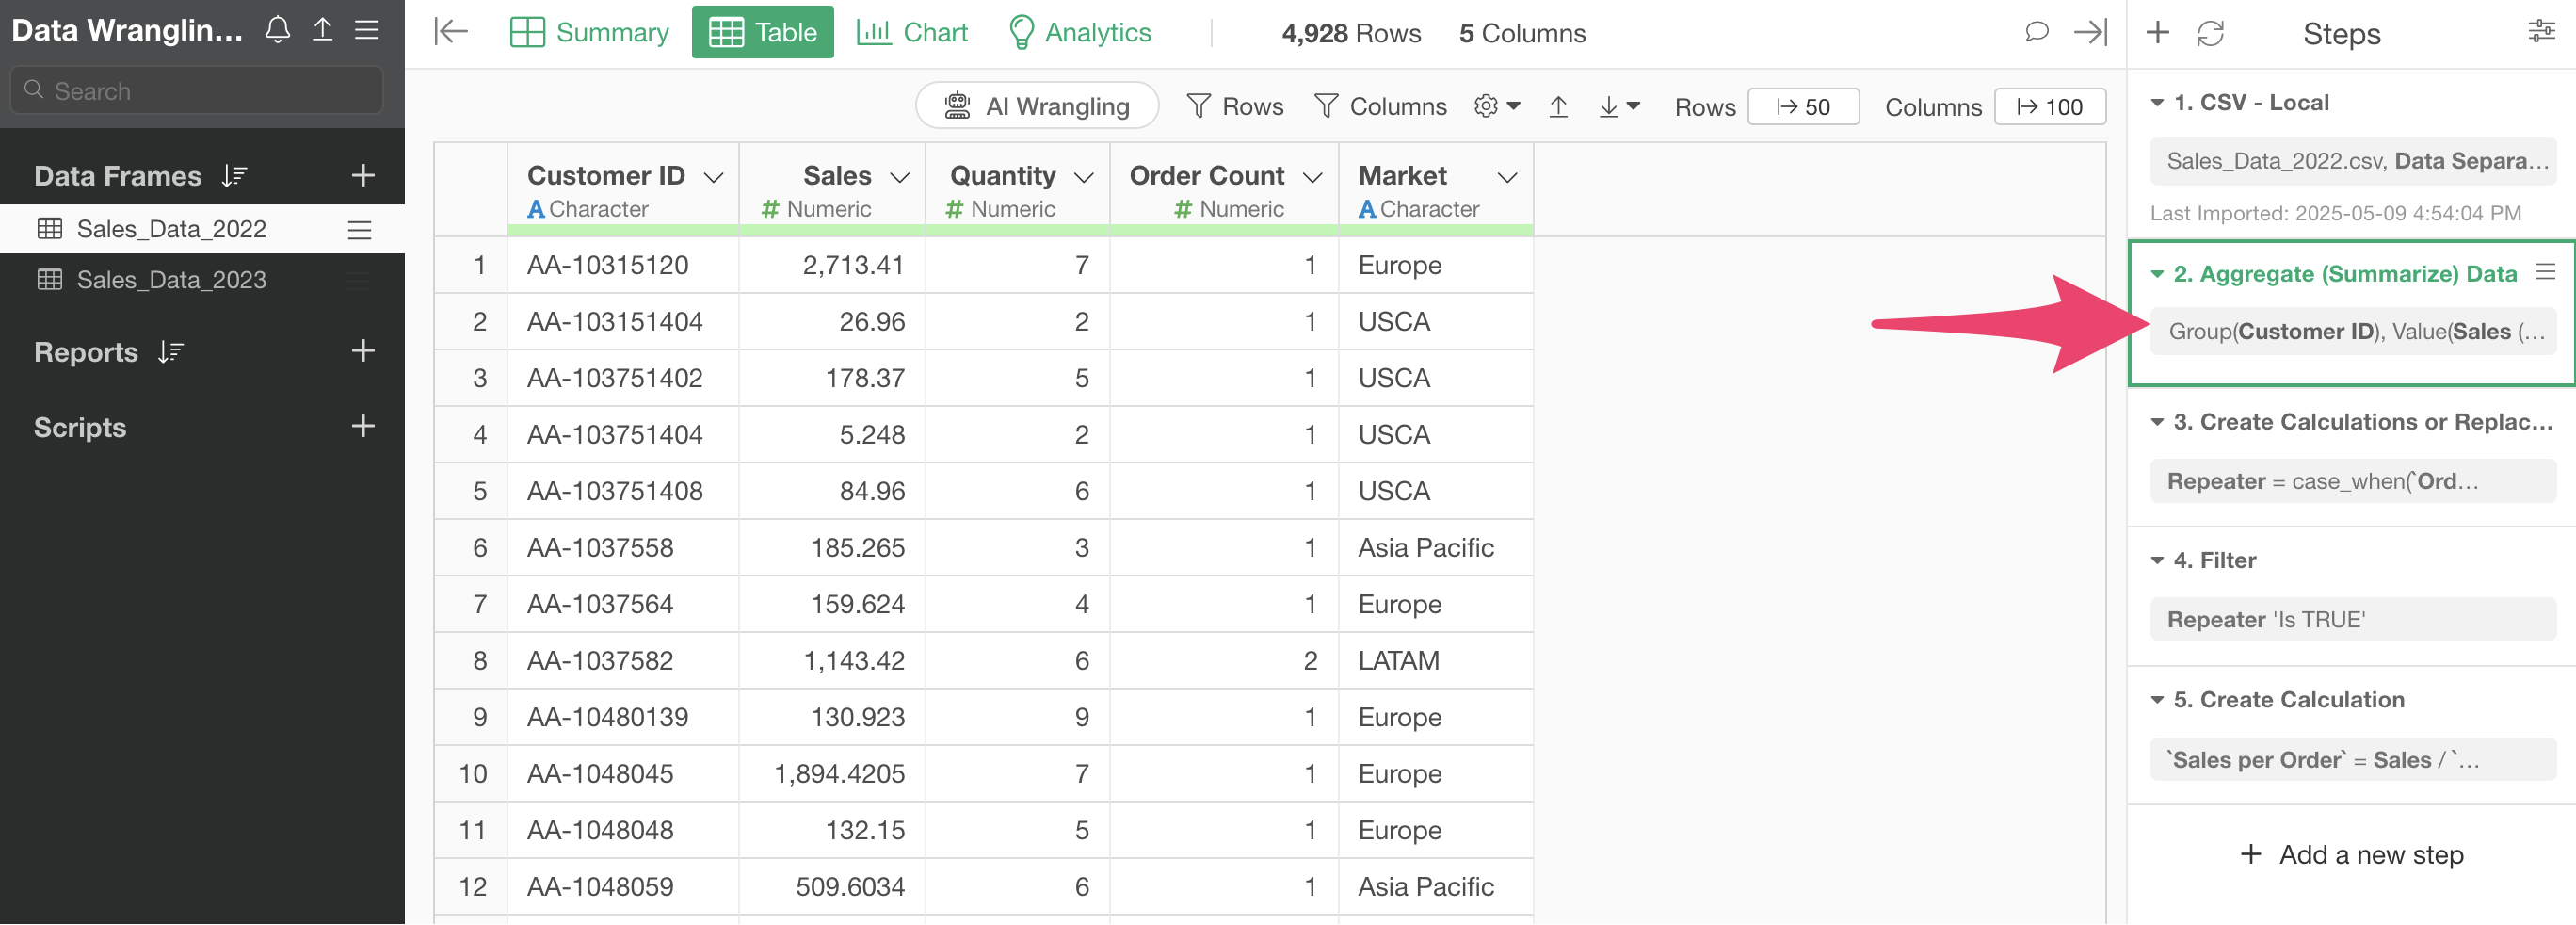
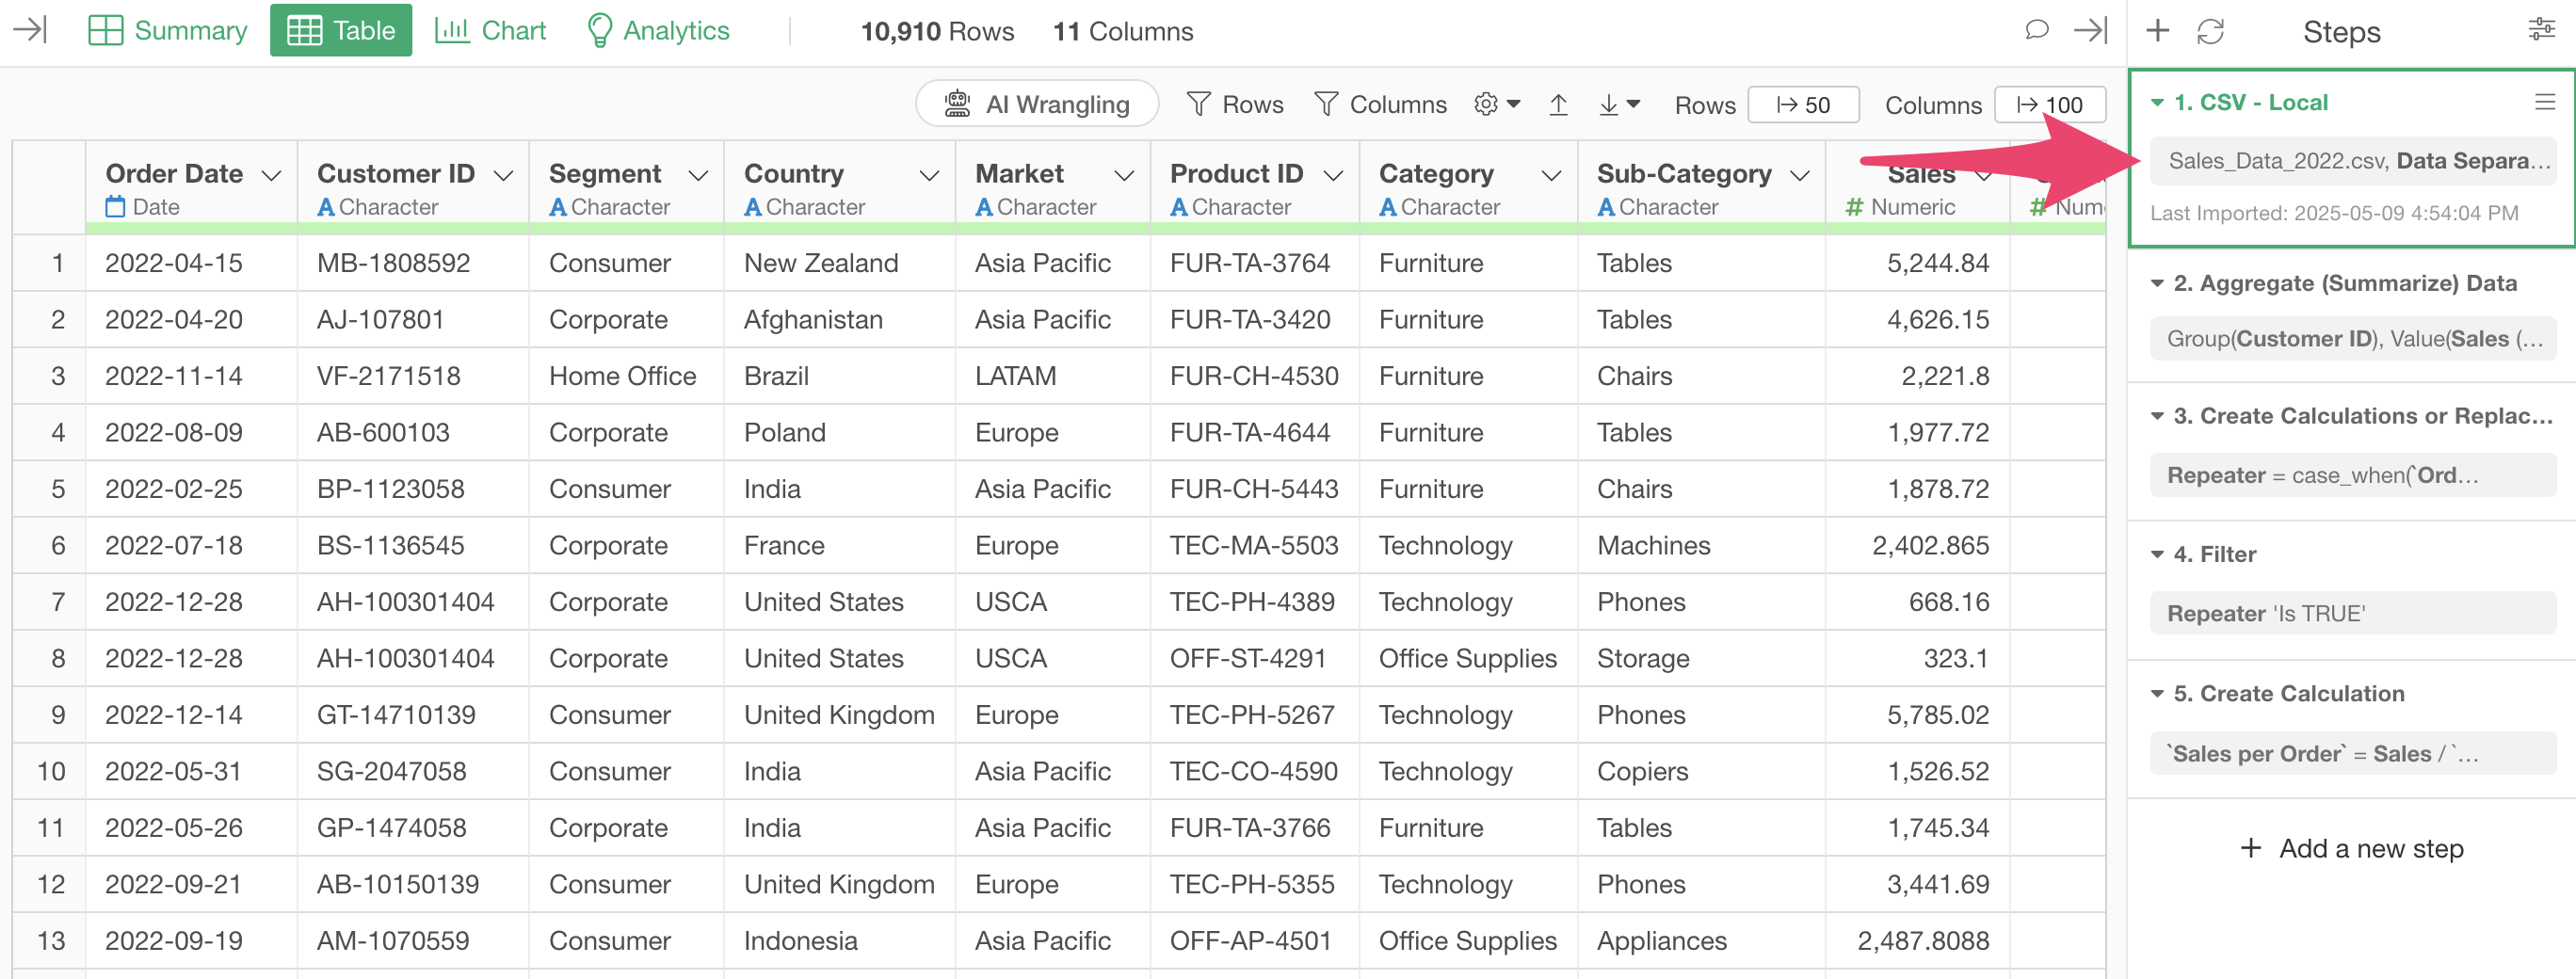
However, when returning to Step 1, the original data has one row per order.
Since we want to use both the one-row-per-customer data and the original data, let’s create a “branch data frame” derived from the main data frame.
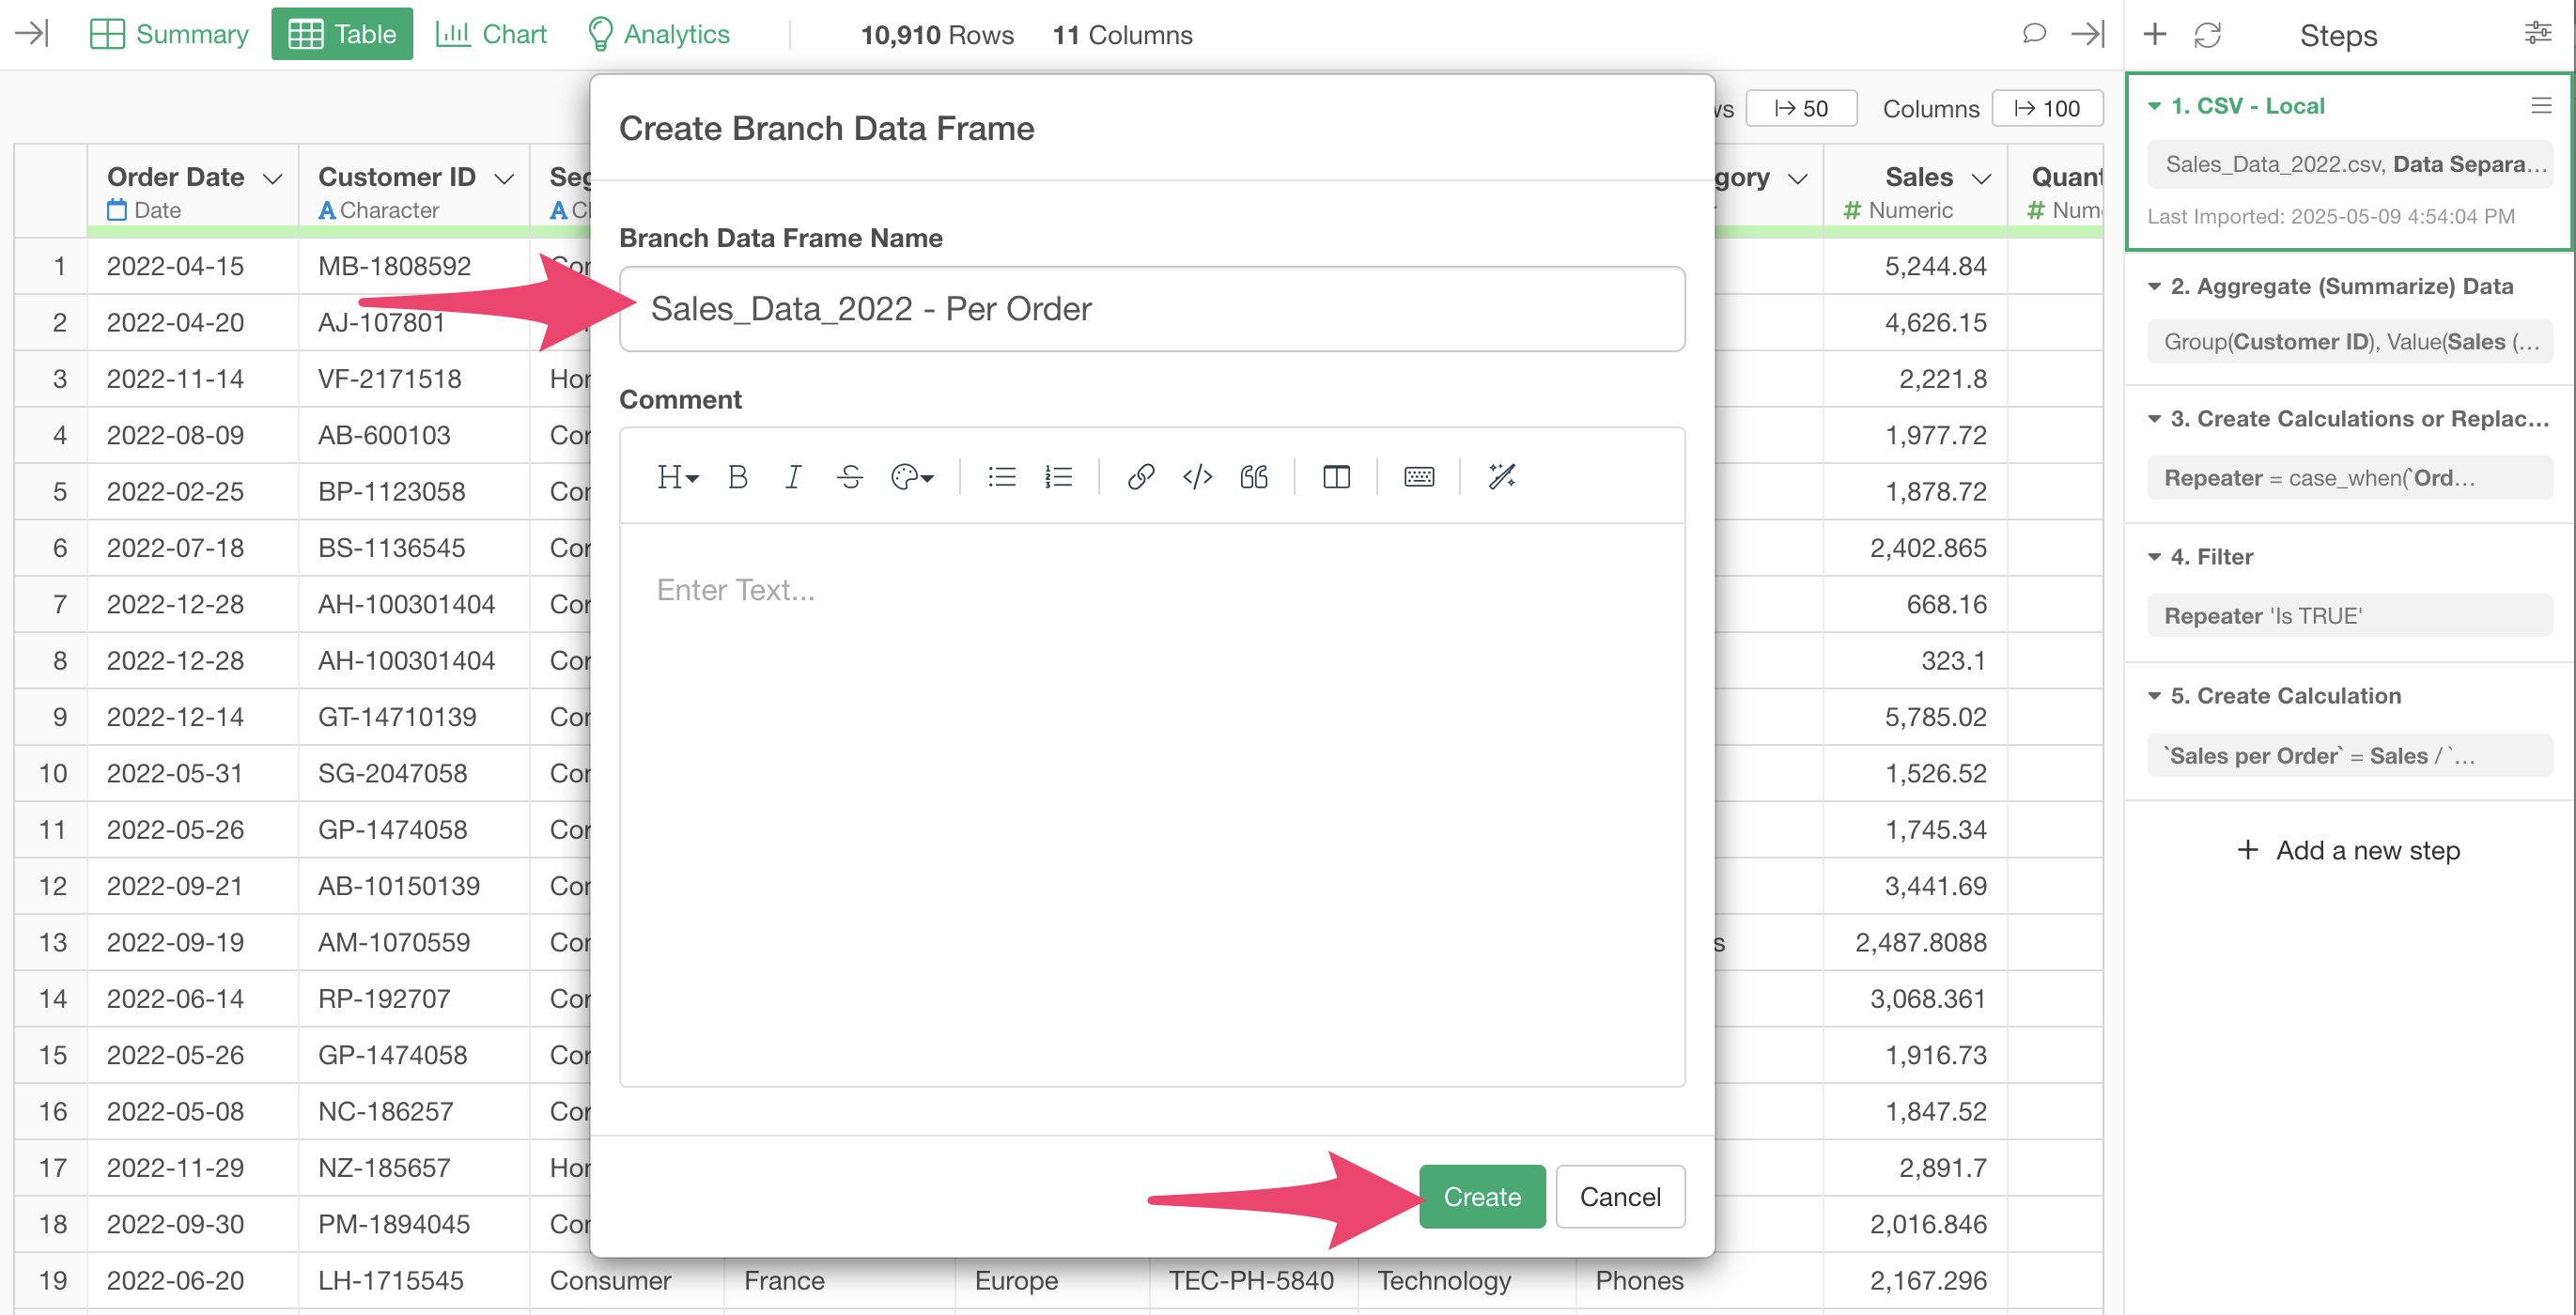
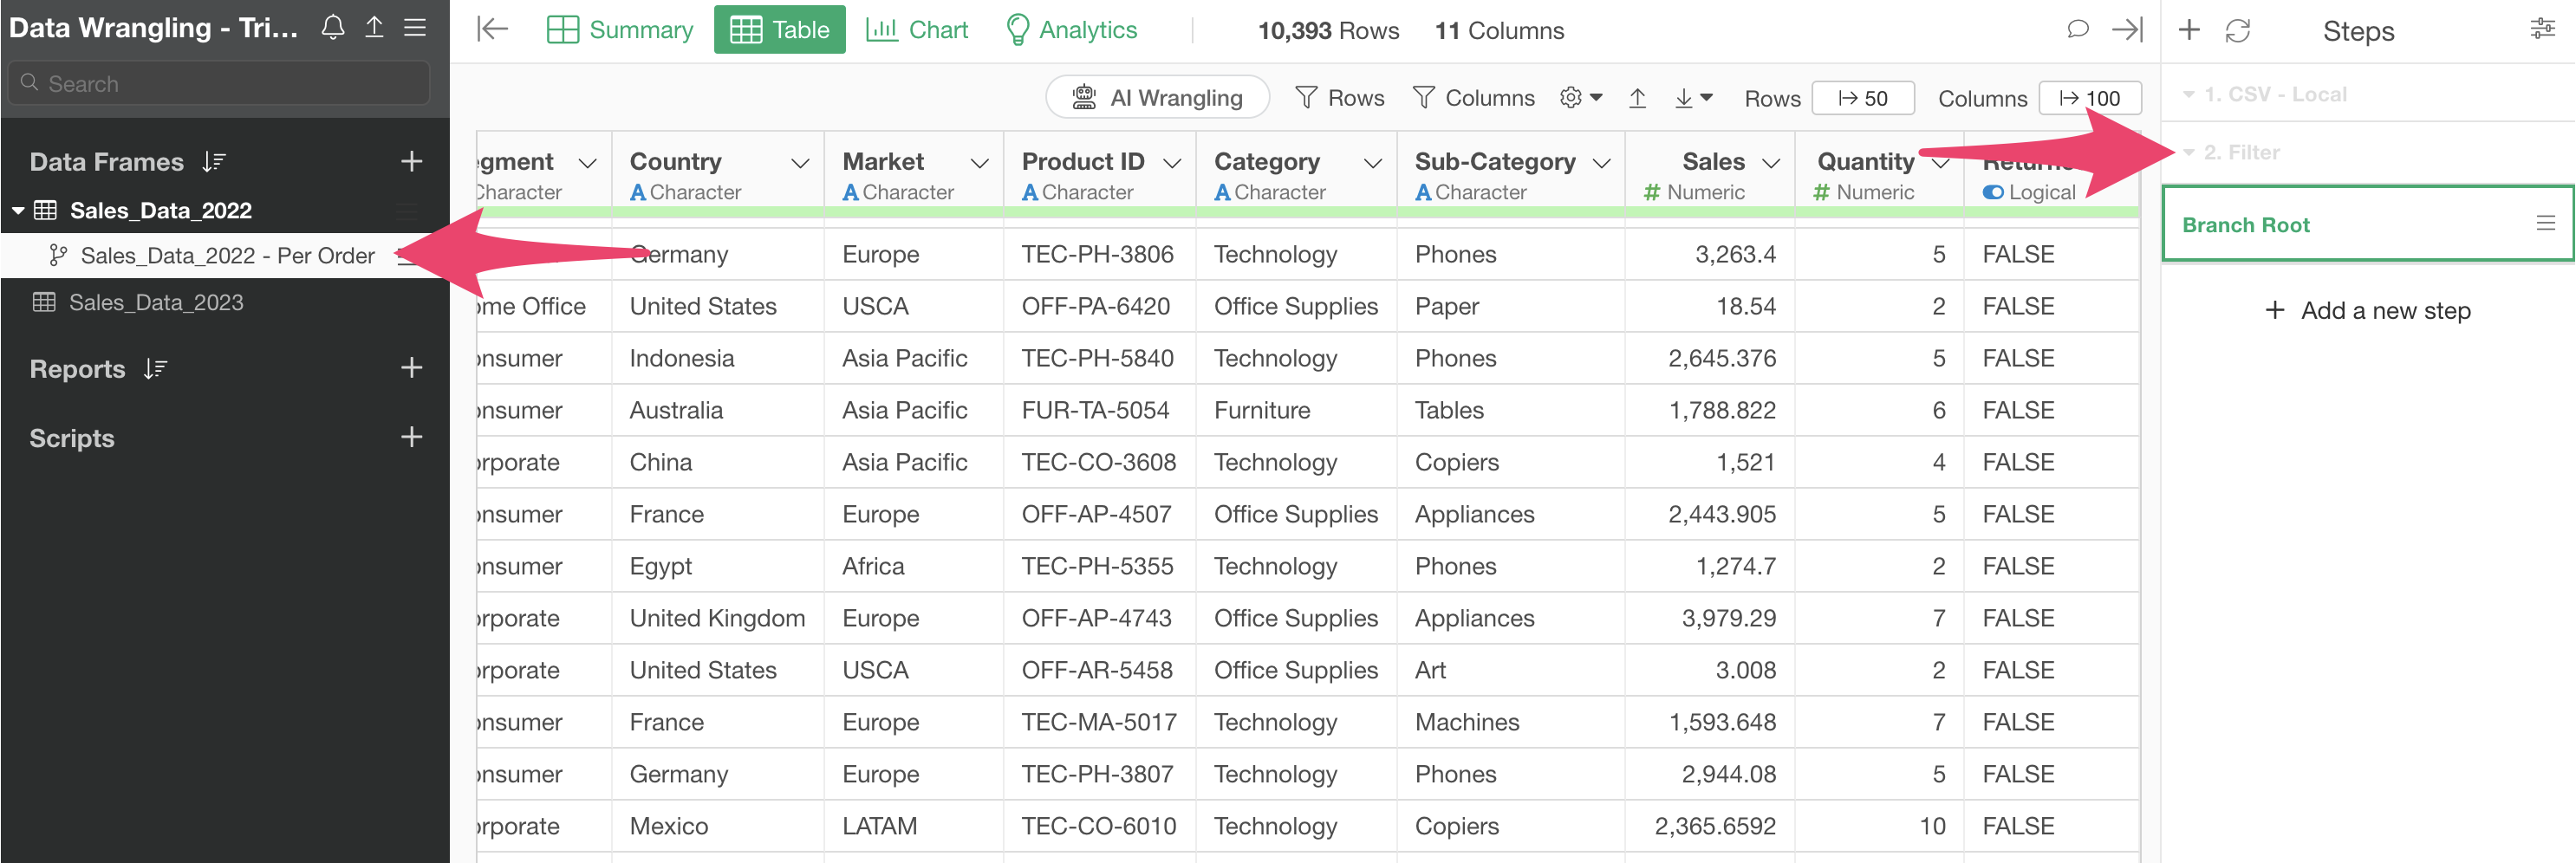
Click the “Create Branch” button from the first step.
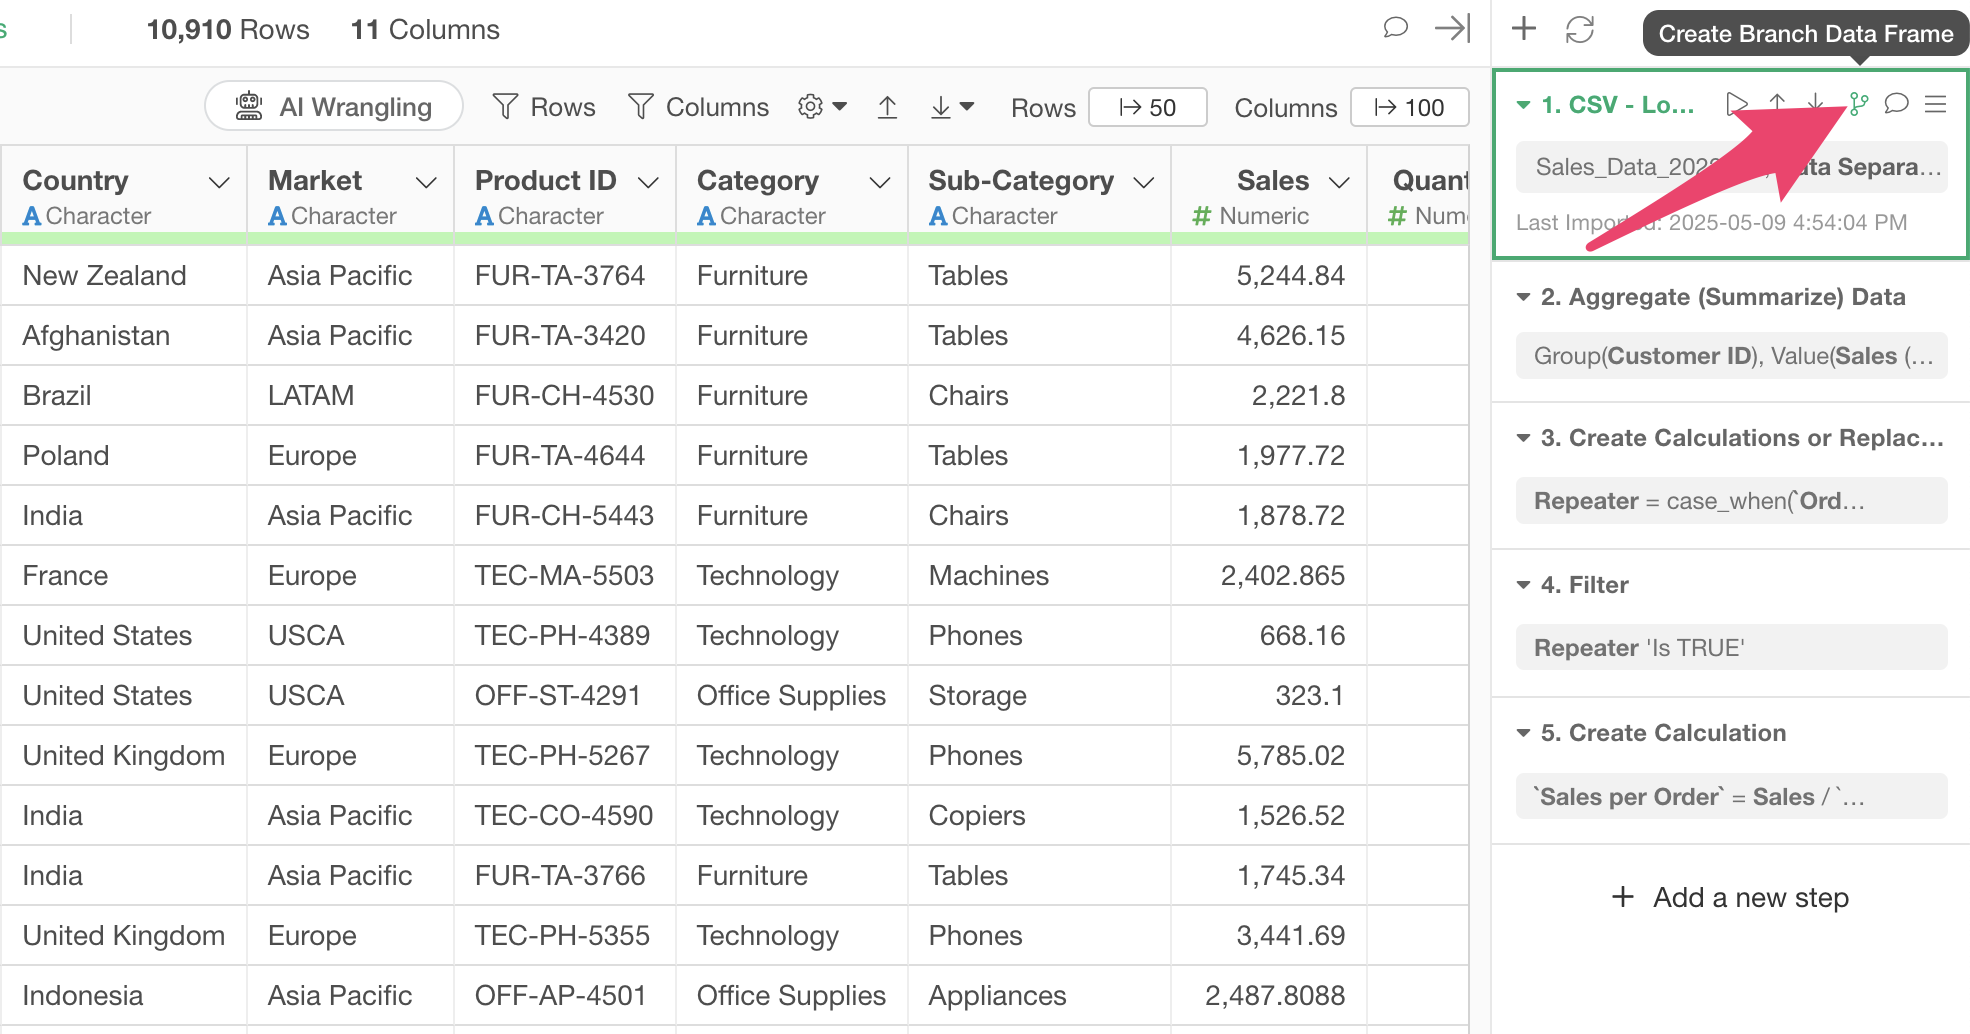
When the Create Branch dialog appears, specify a “Branch Name” and click the create button.
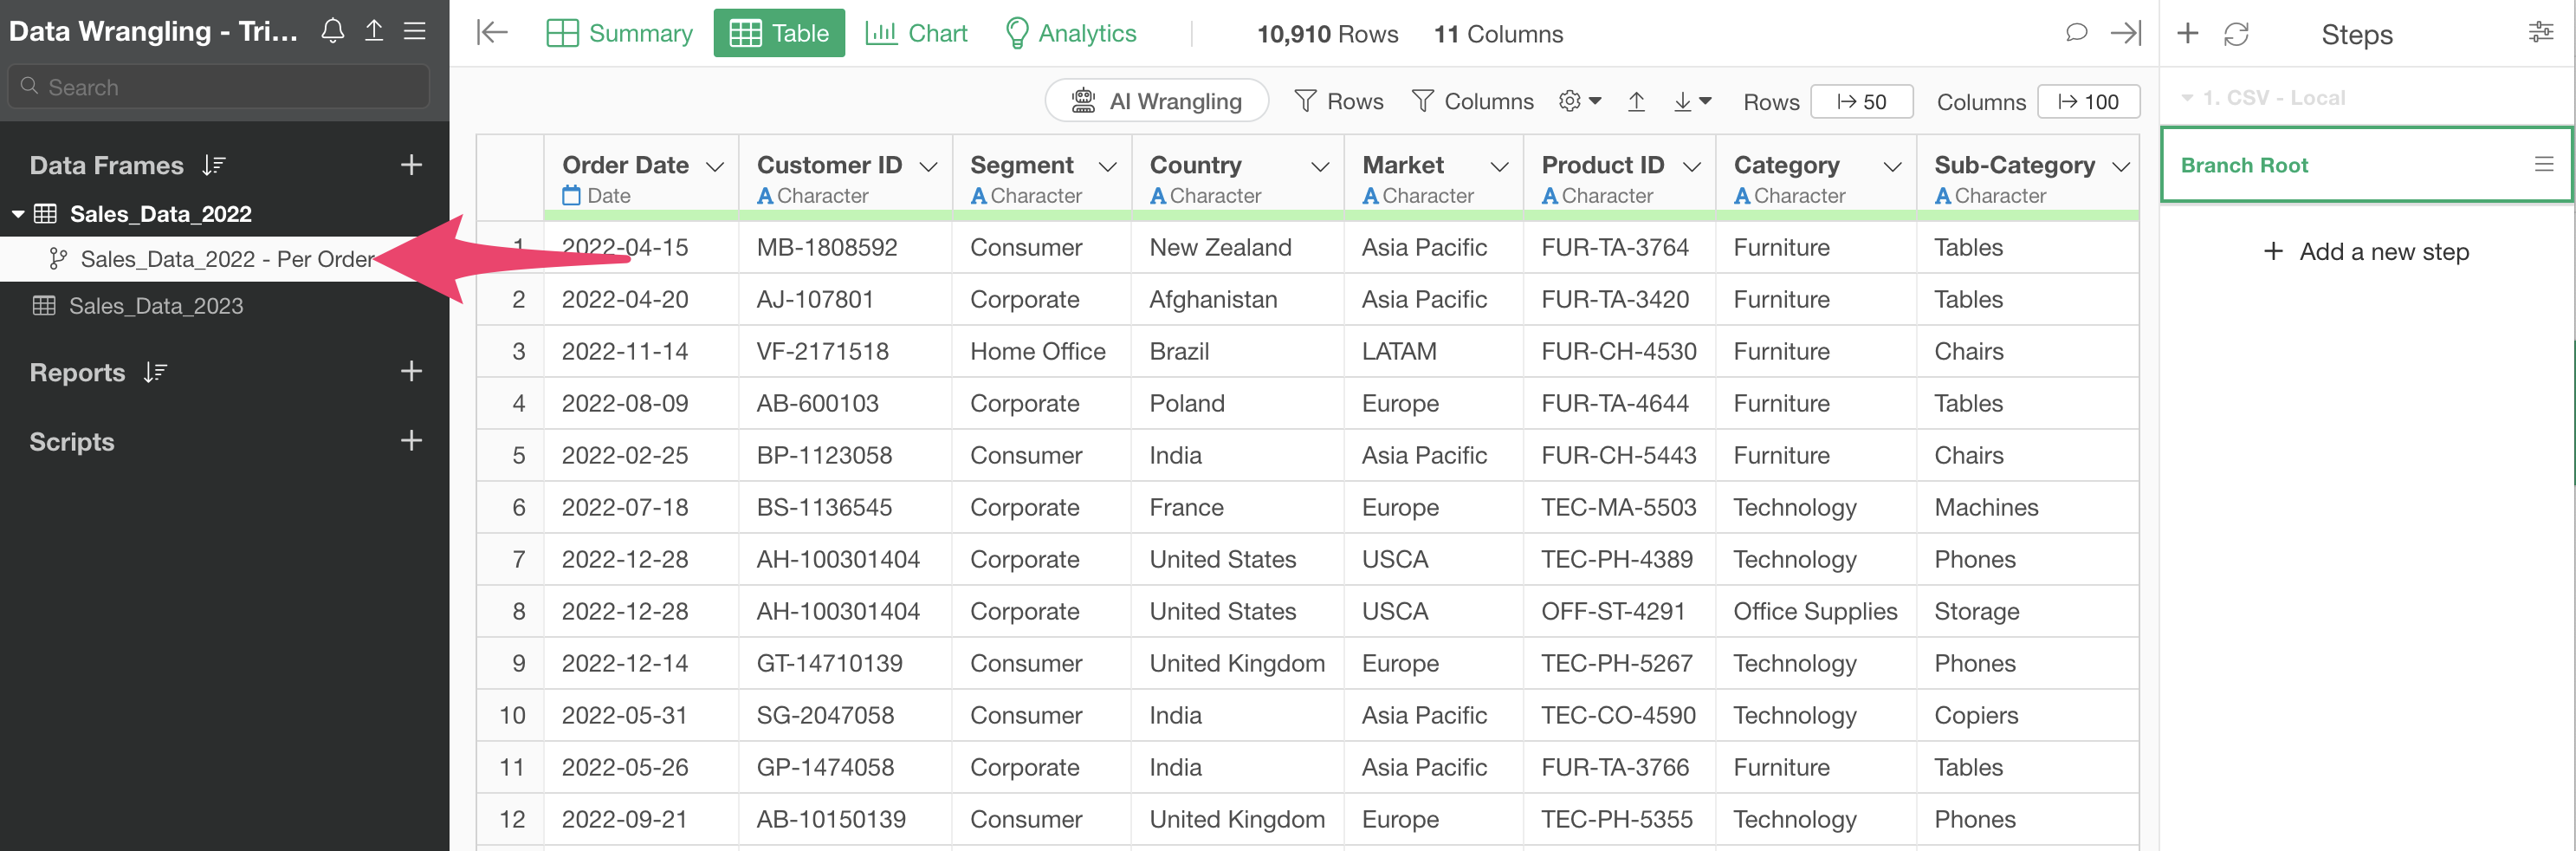
We’ve successfully created a branch data frame derived from the main data frame.
Since we created it from the first step, there are no other processing steps (steps) in this data.
Let’s go back to the main data frame.
This data has a column indicating whether an item was returned, and we want to keep only the data where returns are FALSE (not returned).
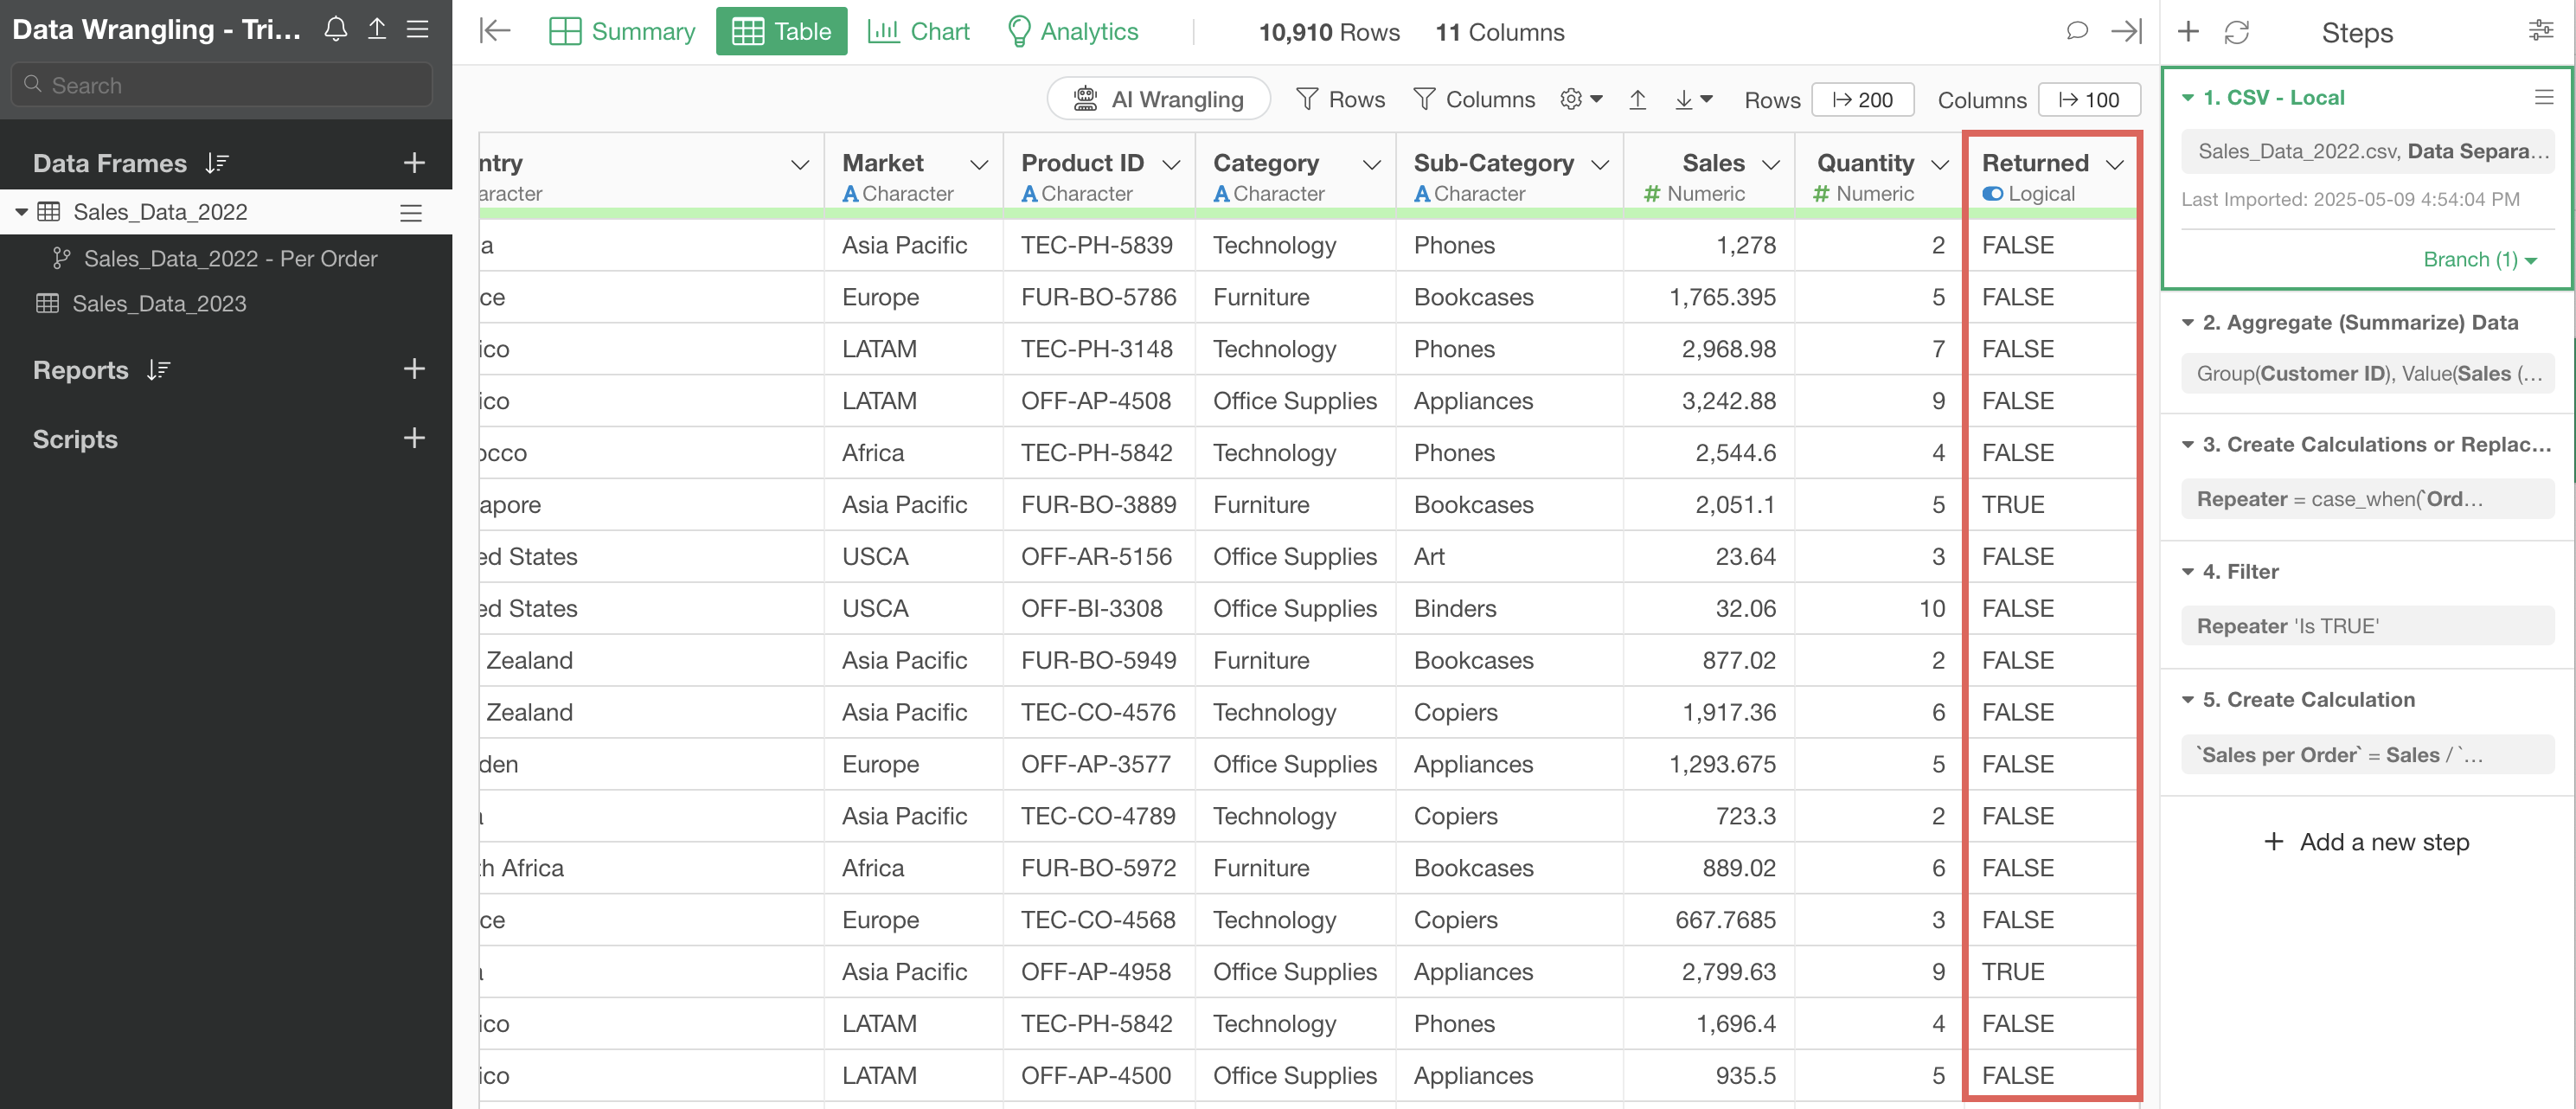
With Step 1 selected, choose “Filter” from the returned column and select “is FALSE” to execute.
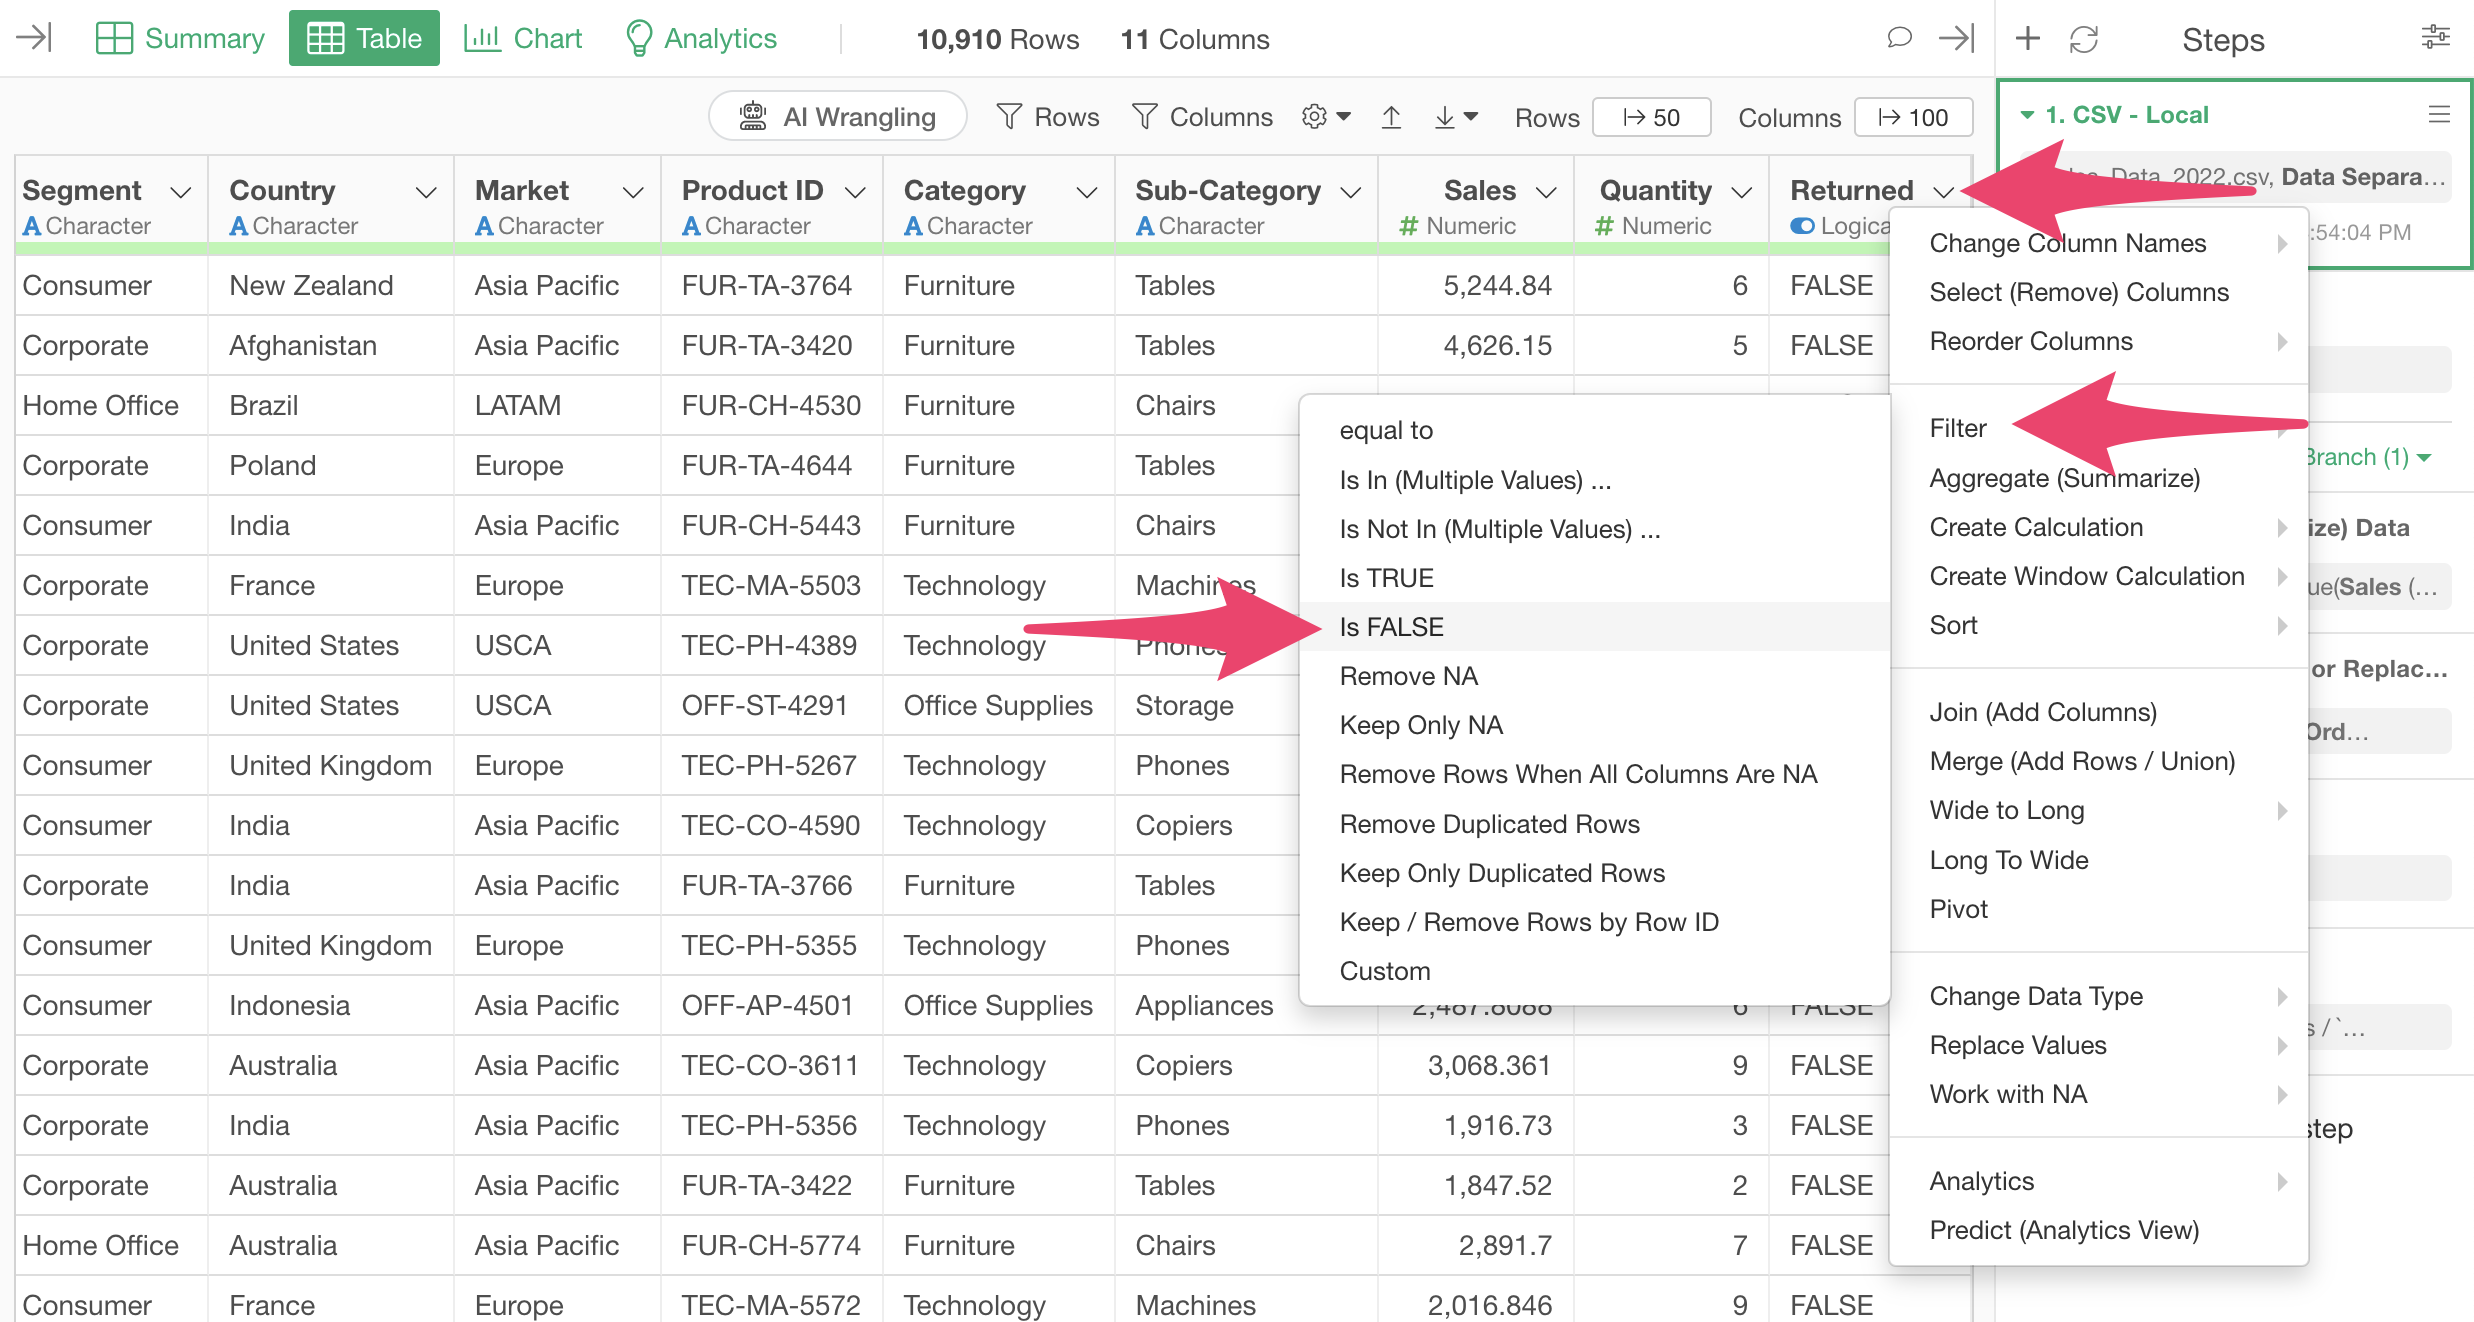
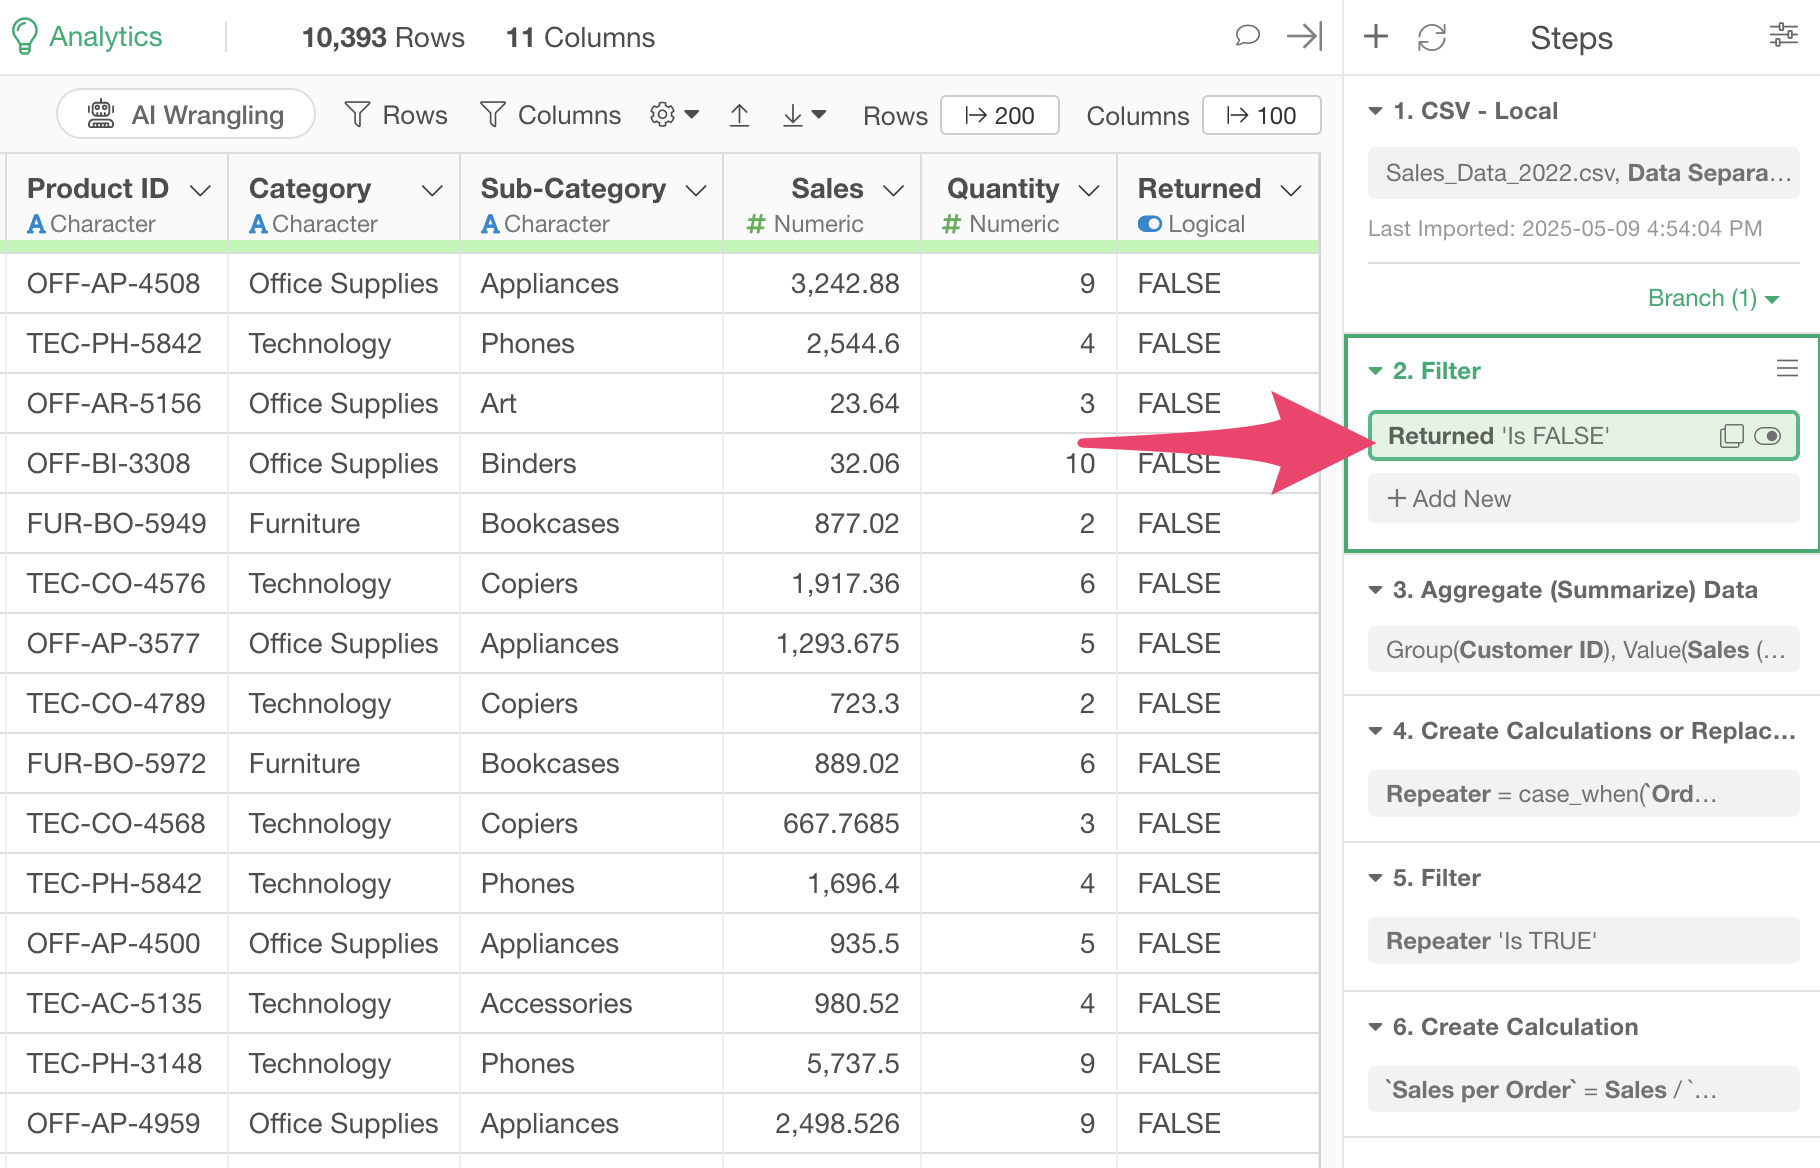
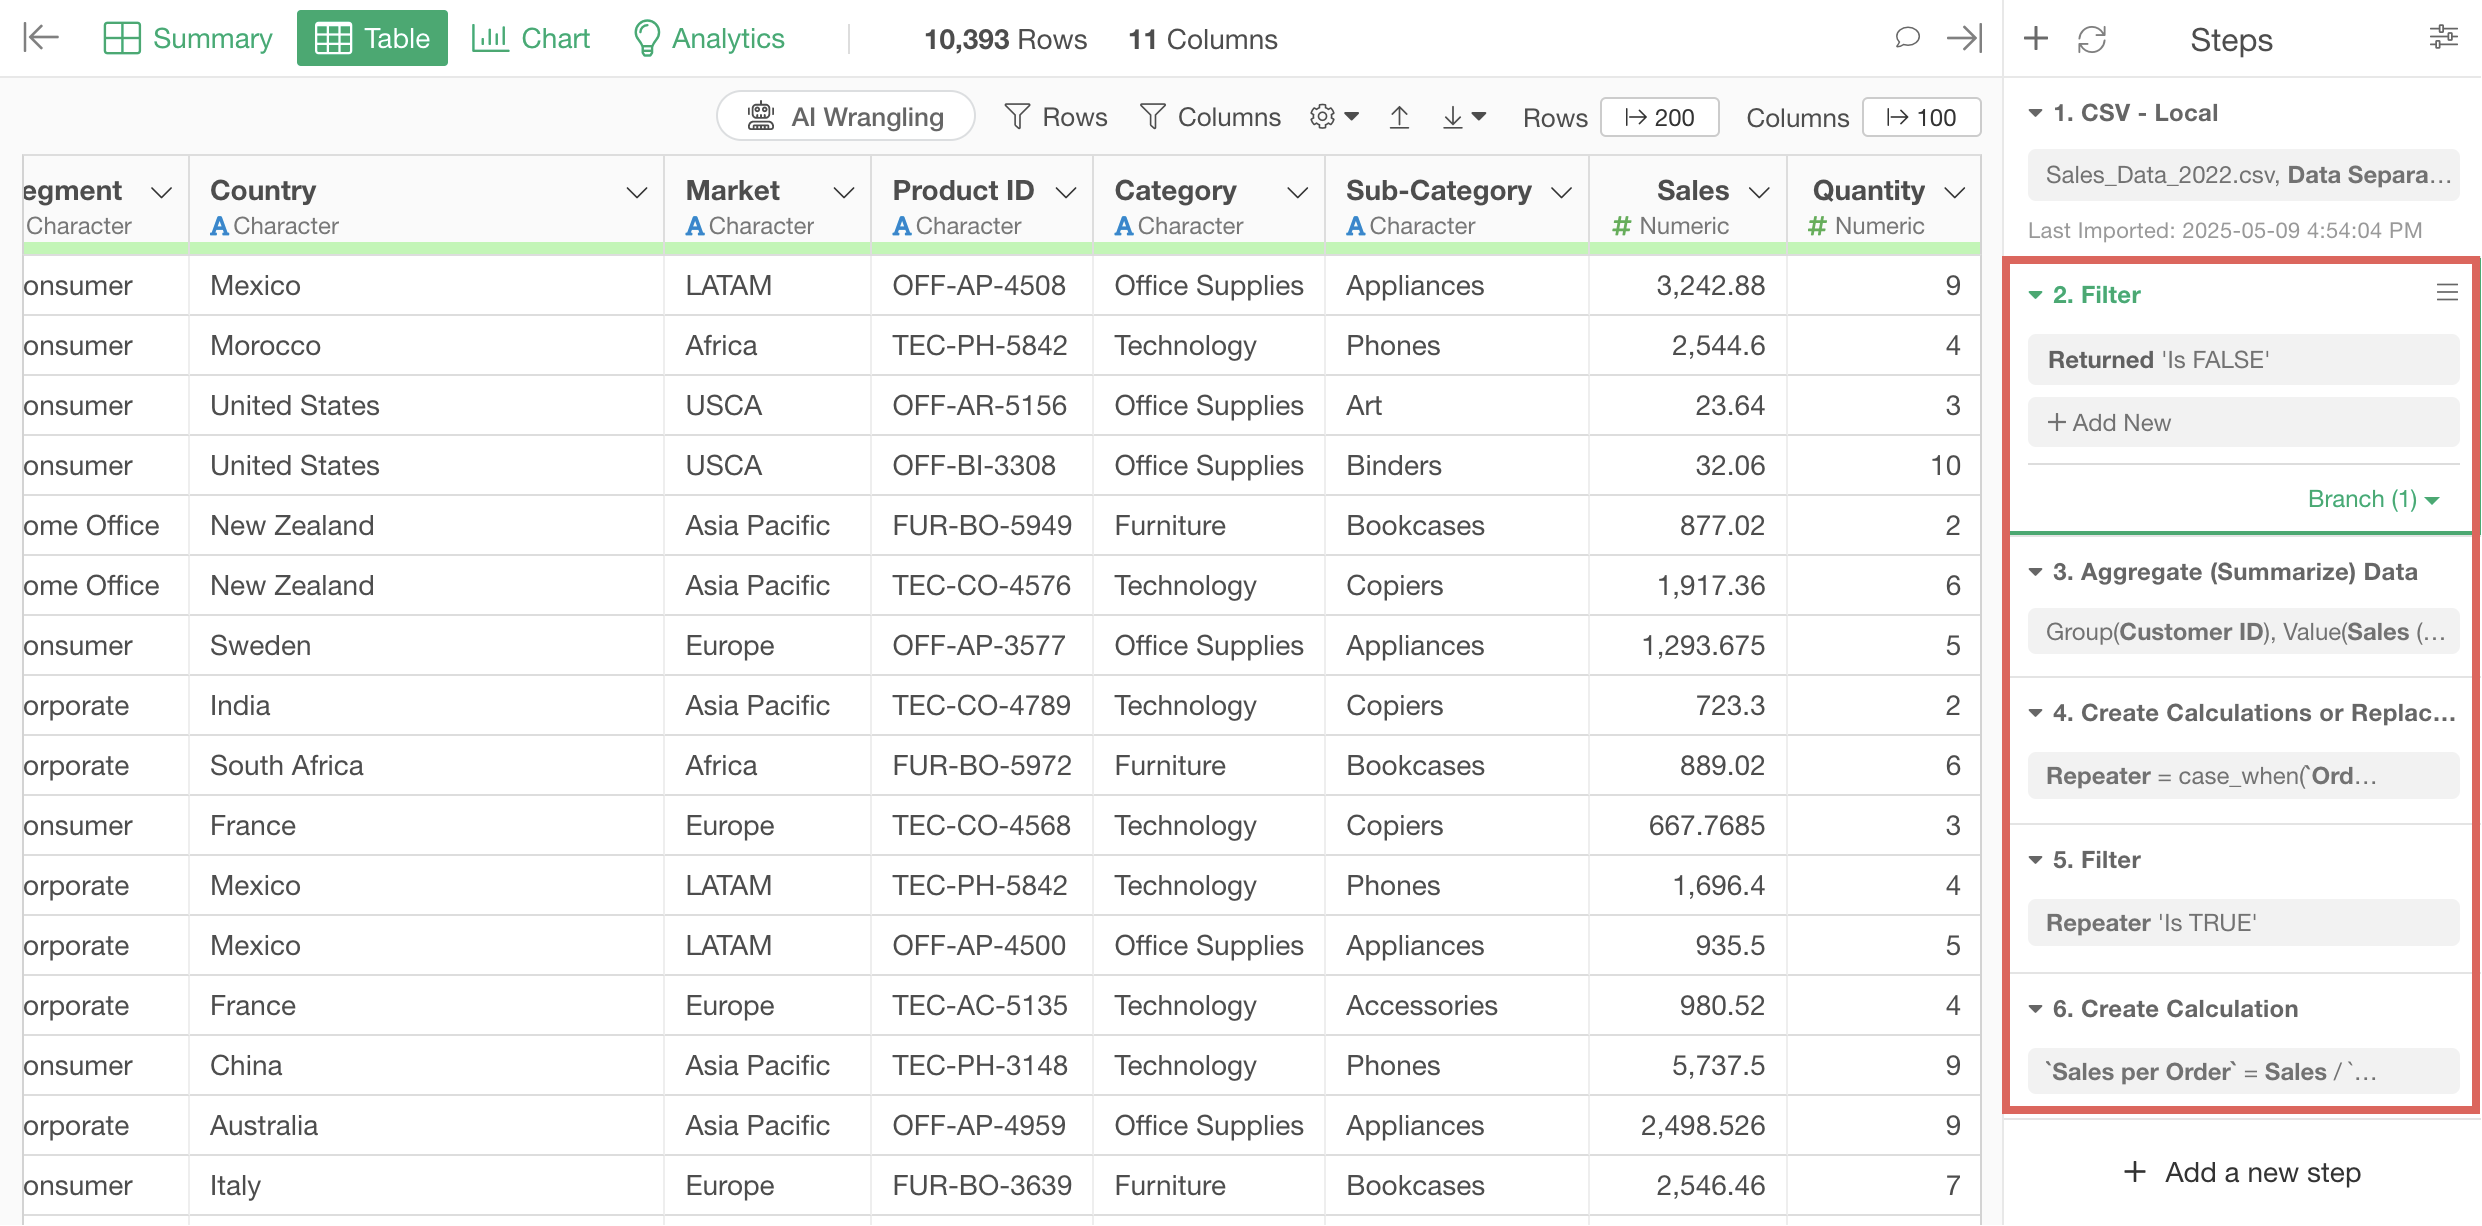
This adds a second step that filters the data frame to show only non-returned items.
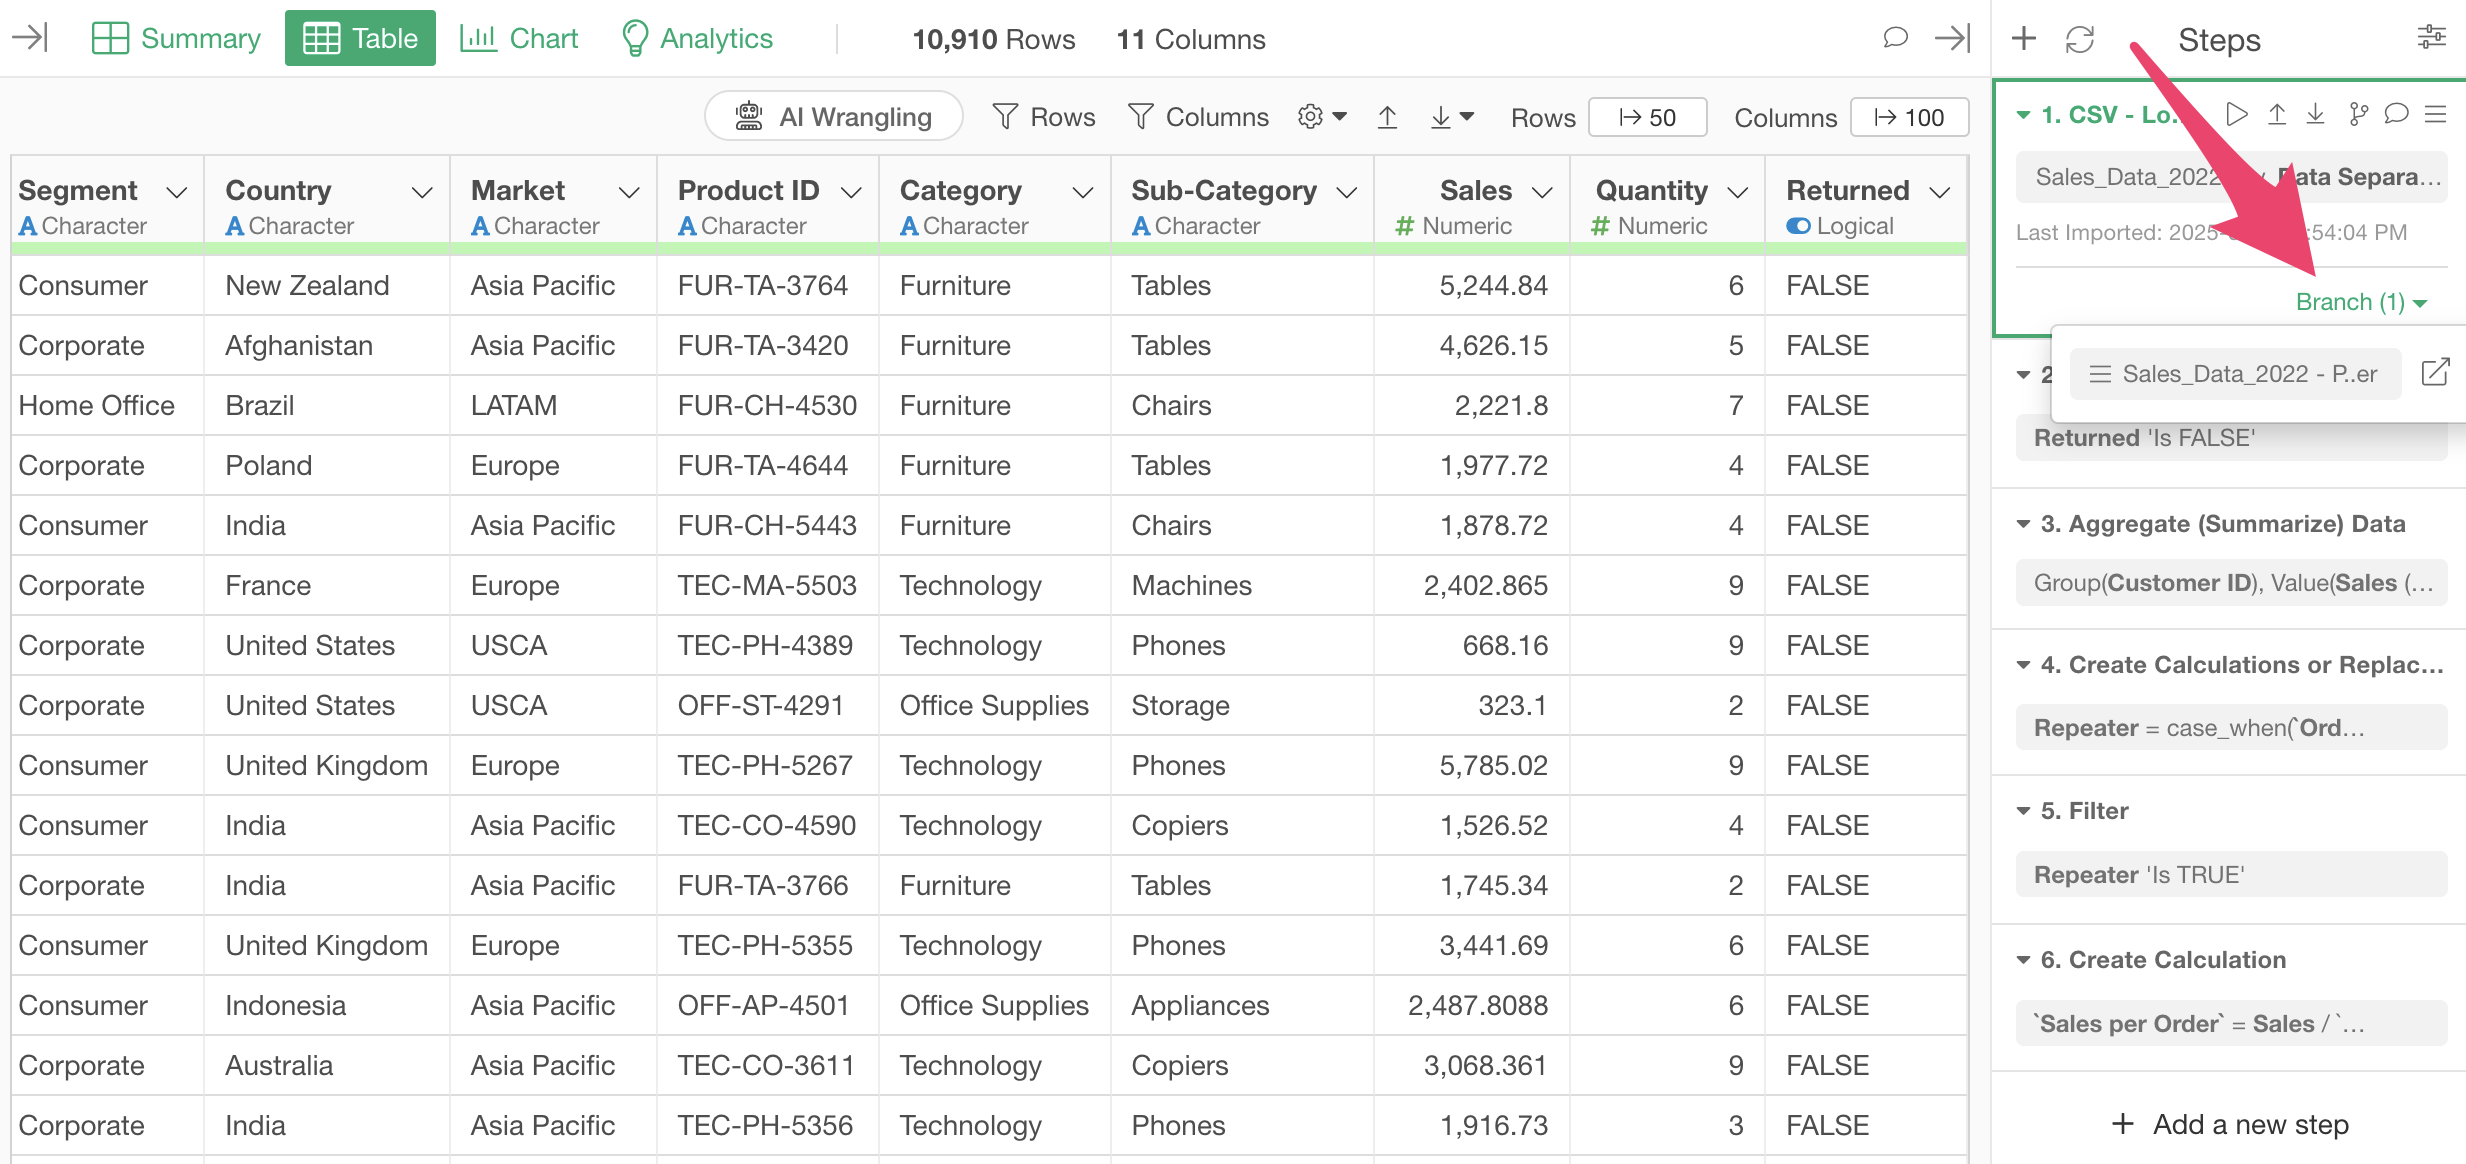
Now we want to reflect this result in the branch data frame we created earlier.
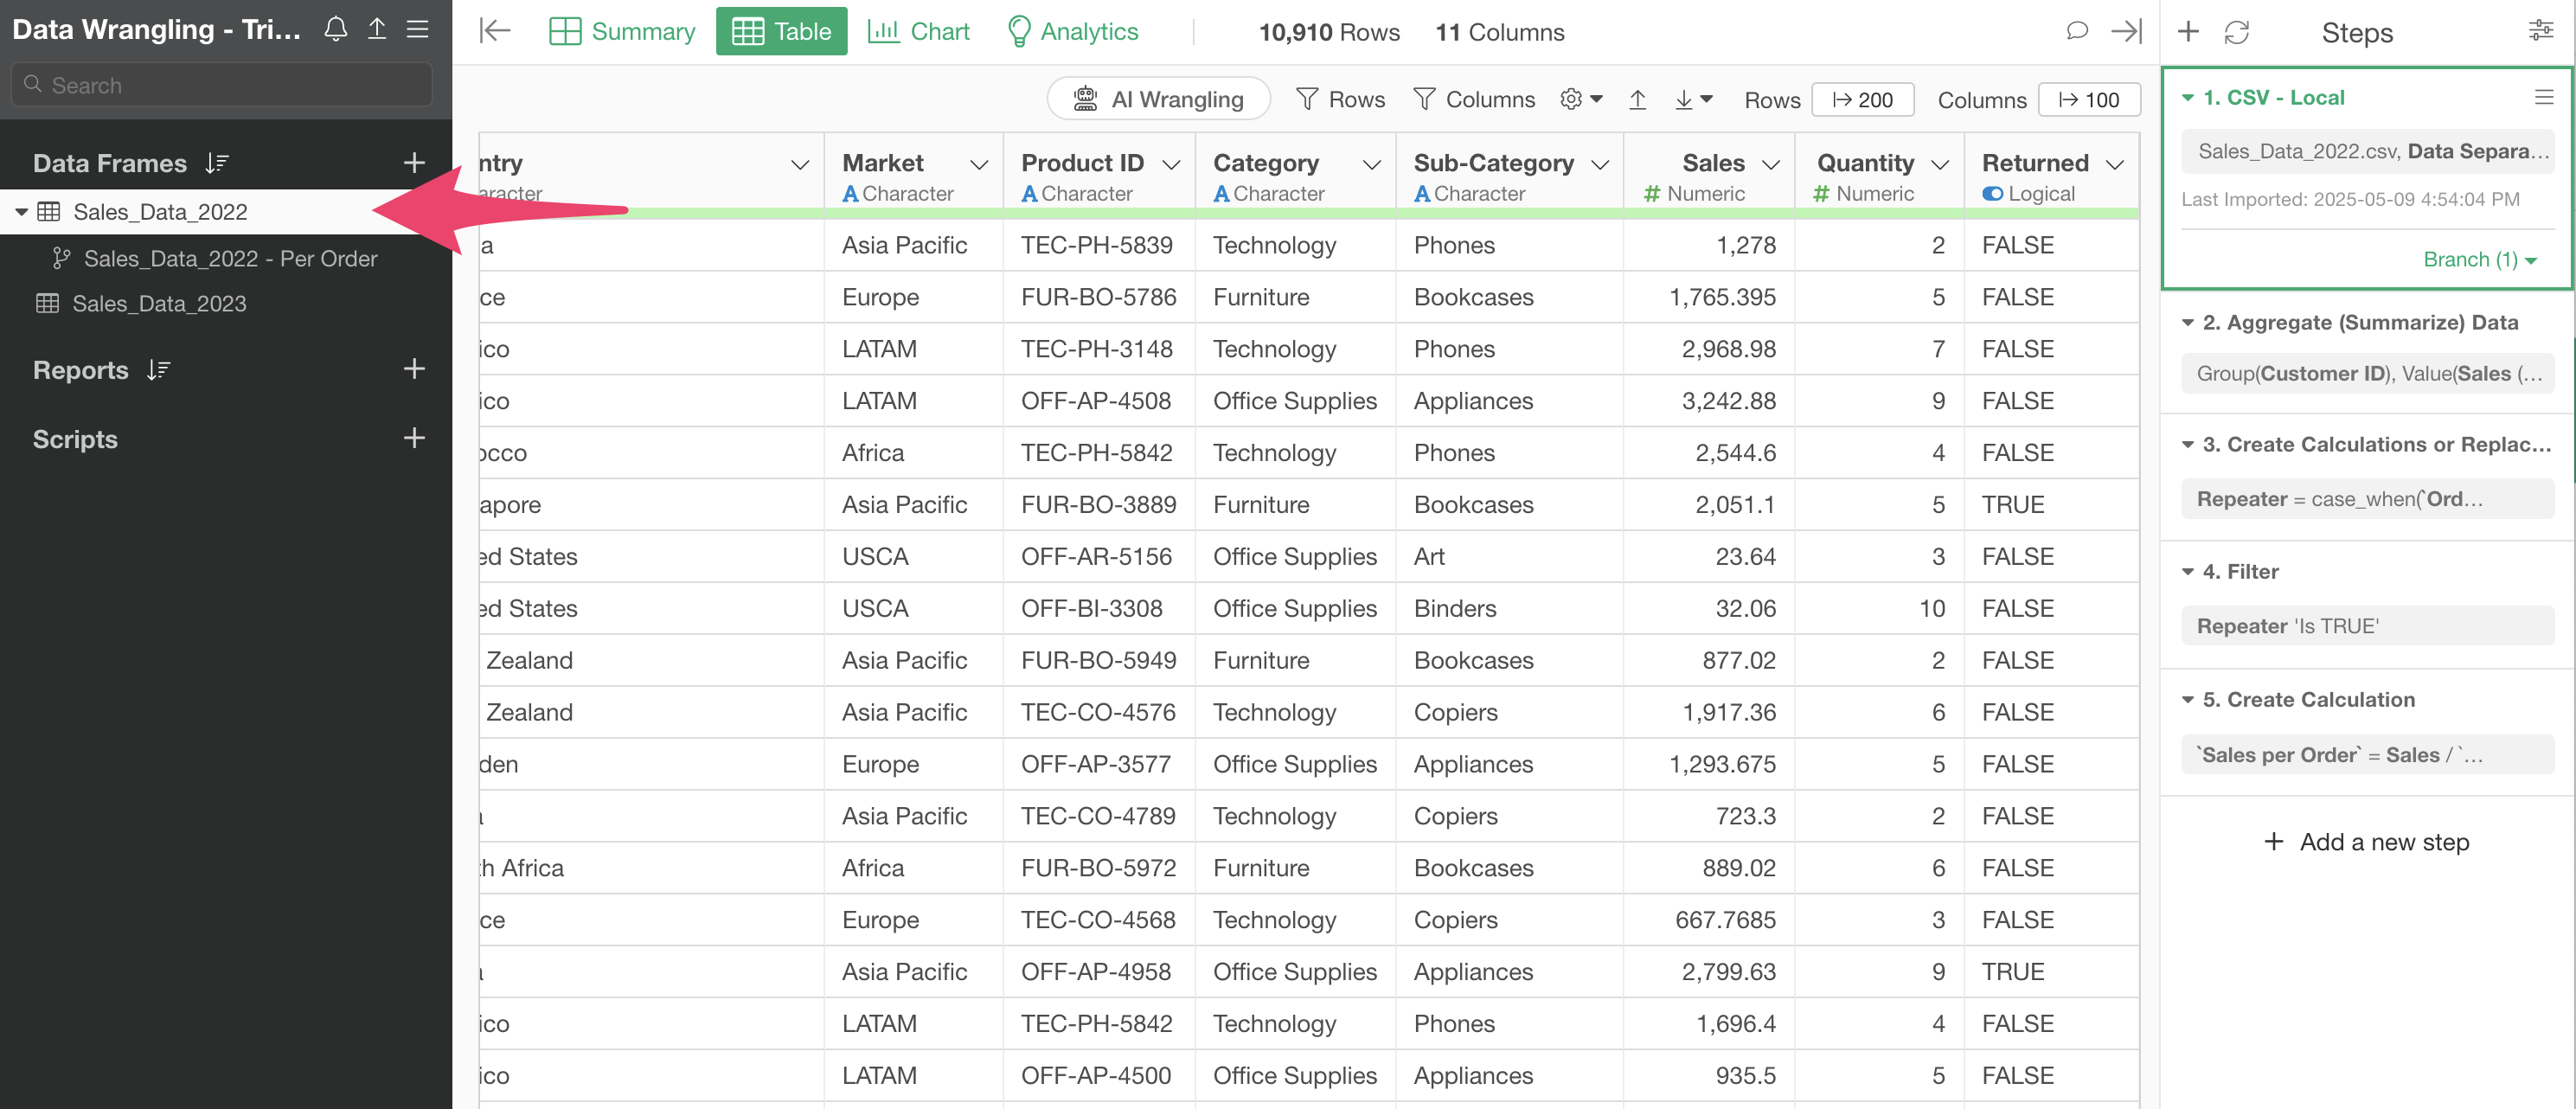
Click on the green text that says “Branch (1)” in Step 1.
Drag and drop the branch data frame creation step to the filter step (Step 2).
This changes the position of the branch creation step to the second step.
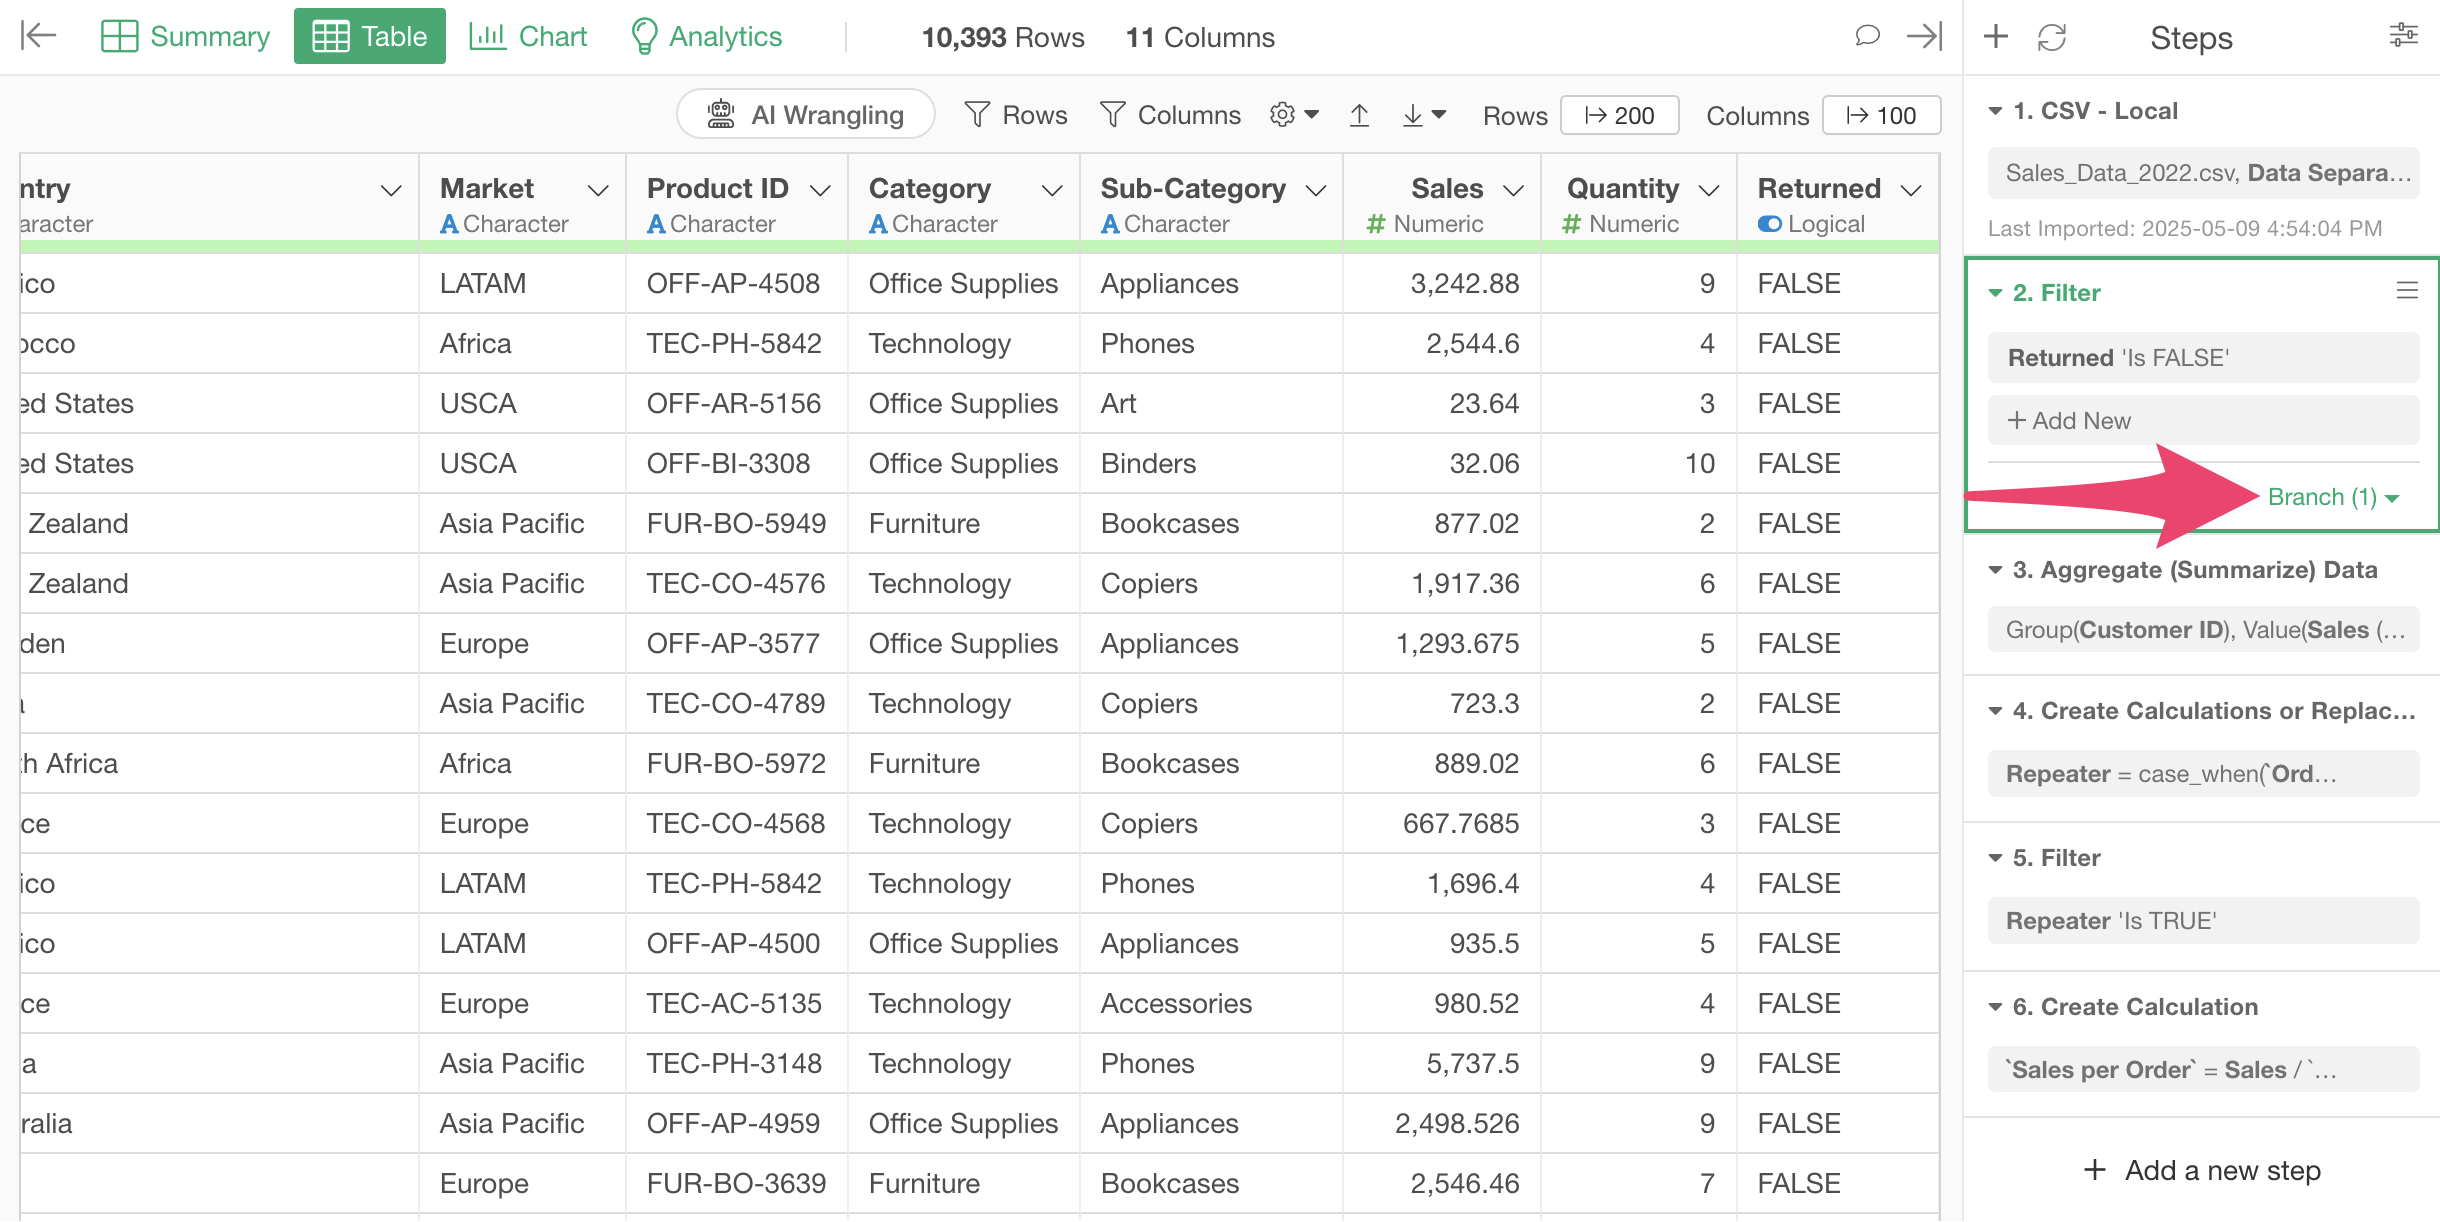
Looking at the branch data frame, you can confirm that the Step 2 processing result, which narrows down to only non-returned orders, is reflected.
4. Data Reproducibility
In Exploratory, data wrangling steps allow you to apply the same processing to updated new data.
For example, suppose you are using CSV data stored locally.
If the latest data has been added to the same CSV file, you don’t need to change the file.
You can click the “Re-import button” to reload the latest data.
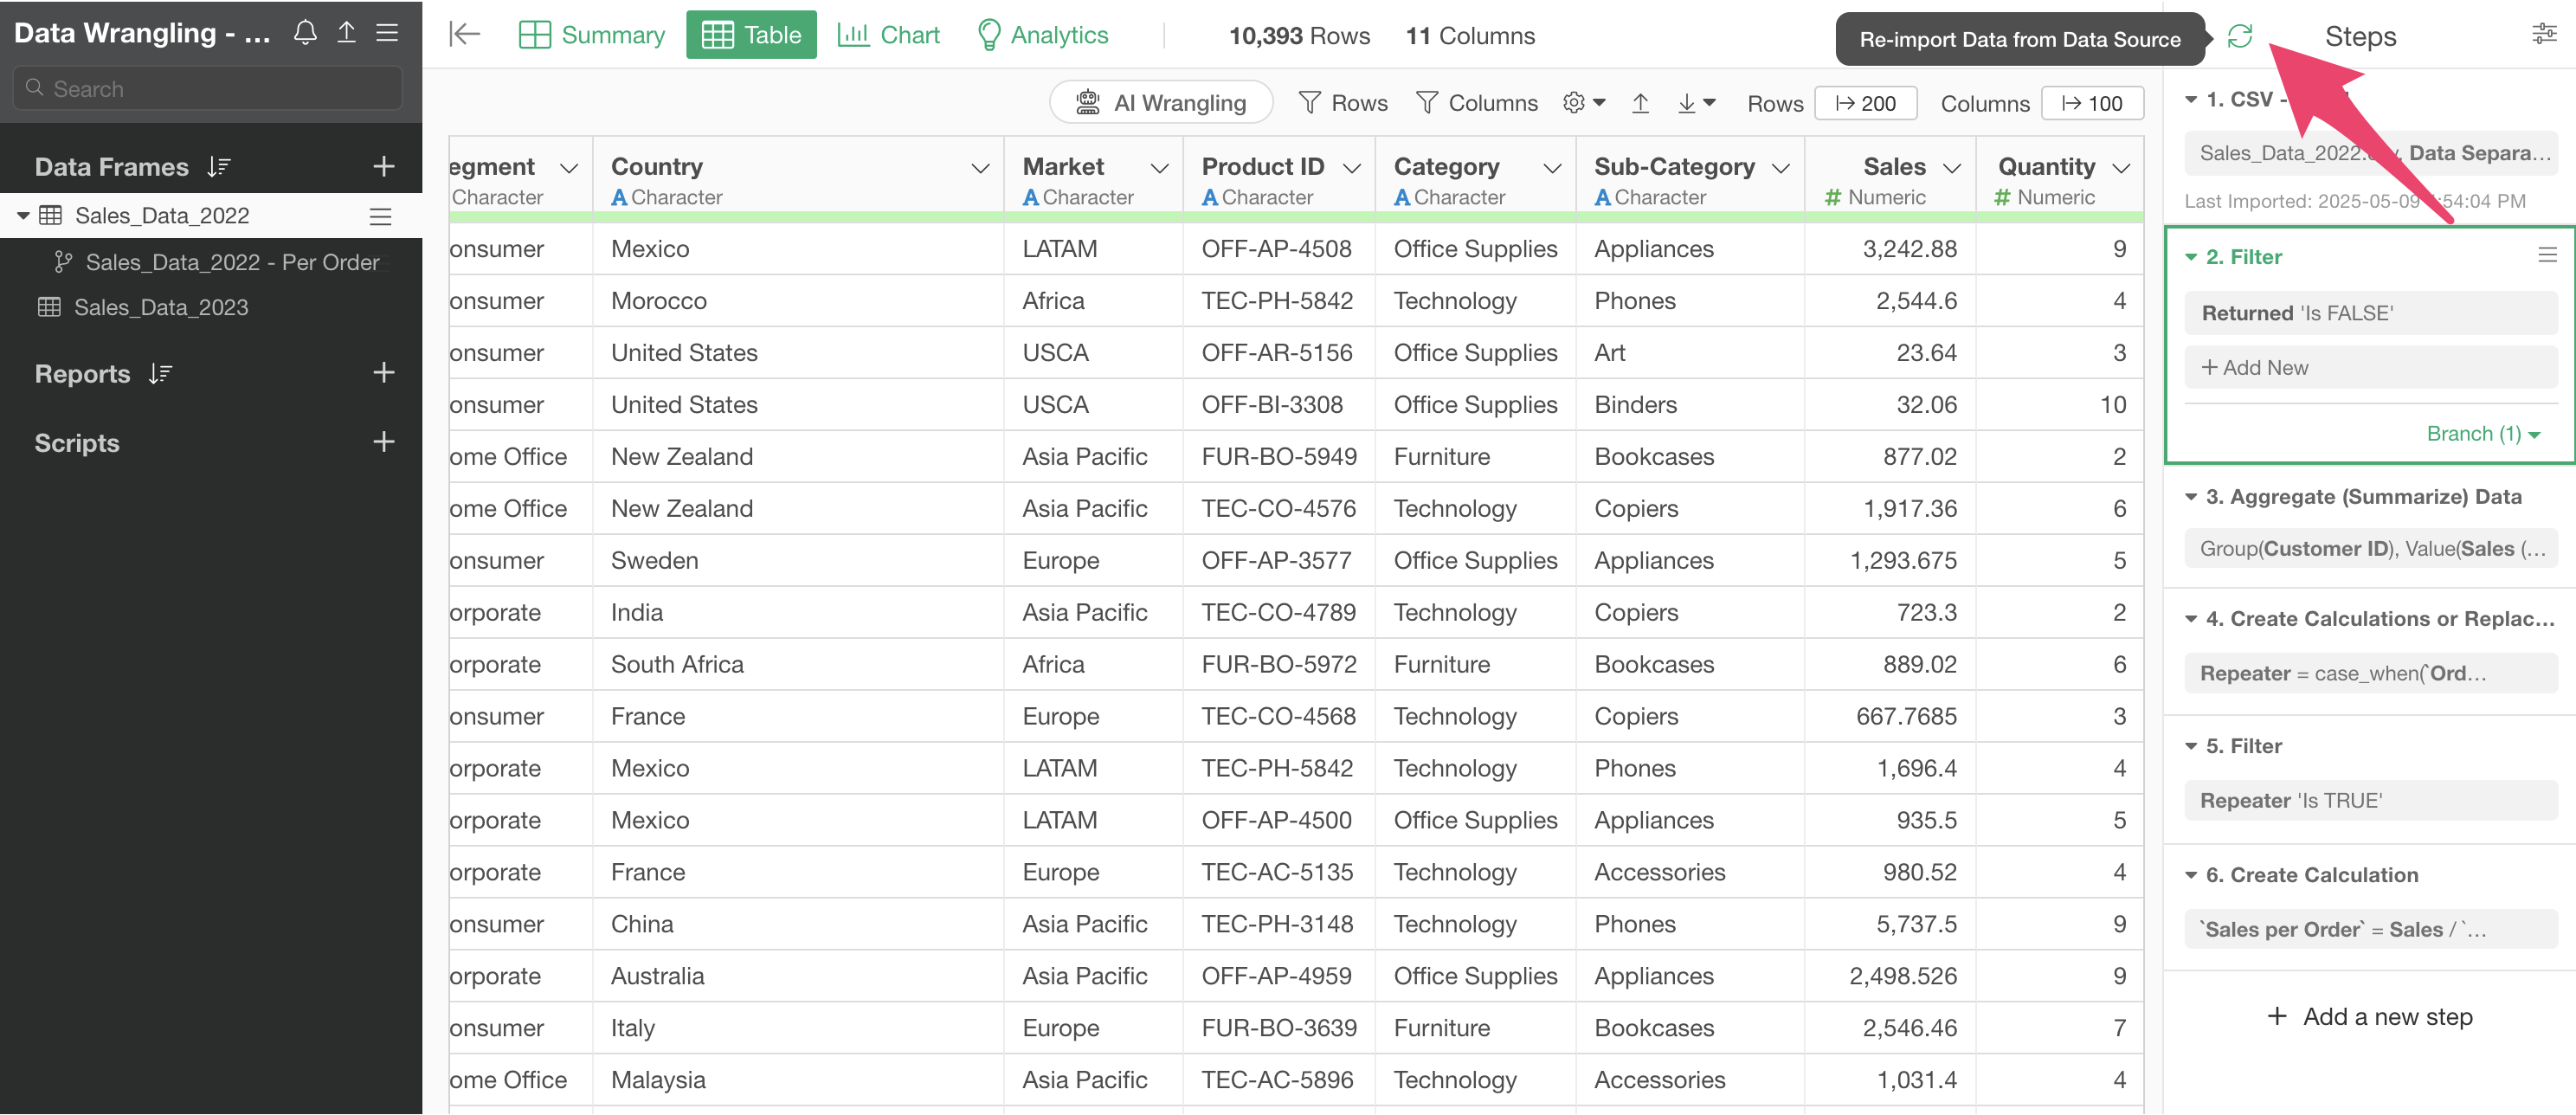
This will re-execute all existing steps on the new data.
Alternatively, you might want to use a different file. In such cases, you can use features like changing the data source to switch only the data source within the same data frame.