Determine Which Customers Are Churning for a Business without Distinct Cancellation Event
With subscription-based services, it is easy to tell or define whether a customer has churned or not. But, for example, for sales at store, there is no clear single moment when a customer leaves the service for good. In such cases, it is not as easy to tell if a customer has churned, and you would need to come up with some rule to define whether a customer has churned or not.
Today, I will introduce how to determine churn of a customer, making use of quantile R function on Exploratory.
Rule to determine a customer’s churn
The rule to define churn is as follows.
Based on the distribution of time intervals between orders from a customer, we can find the length of time within which next order comes in 90% of the cases. This length of time is 90 percentile of the order intervals of this particular customer.
And our definition of churn is, when the time passed since the last order of a customer is above his/her 90 percentile of order intervals.
Sample Data - Order Data
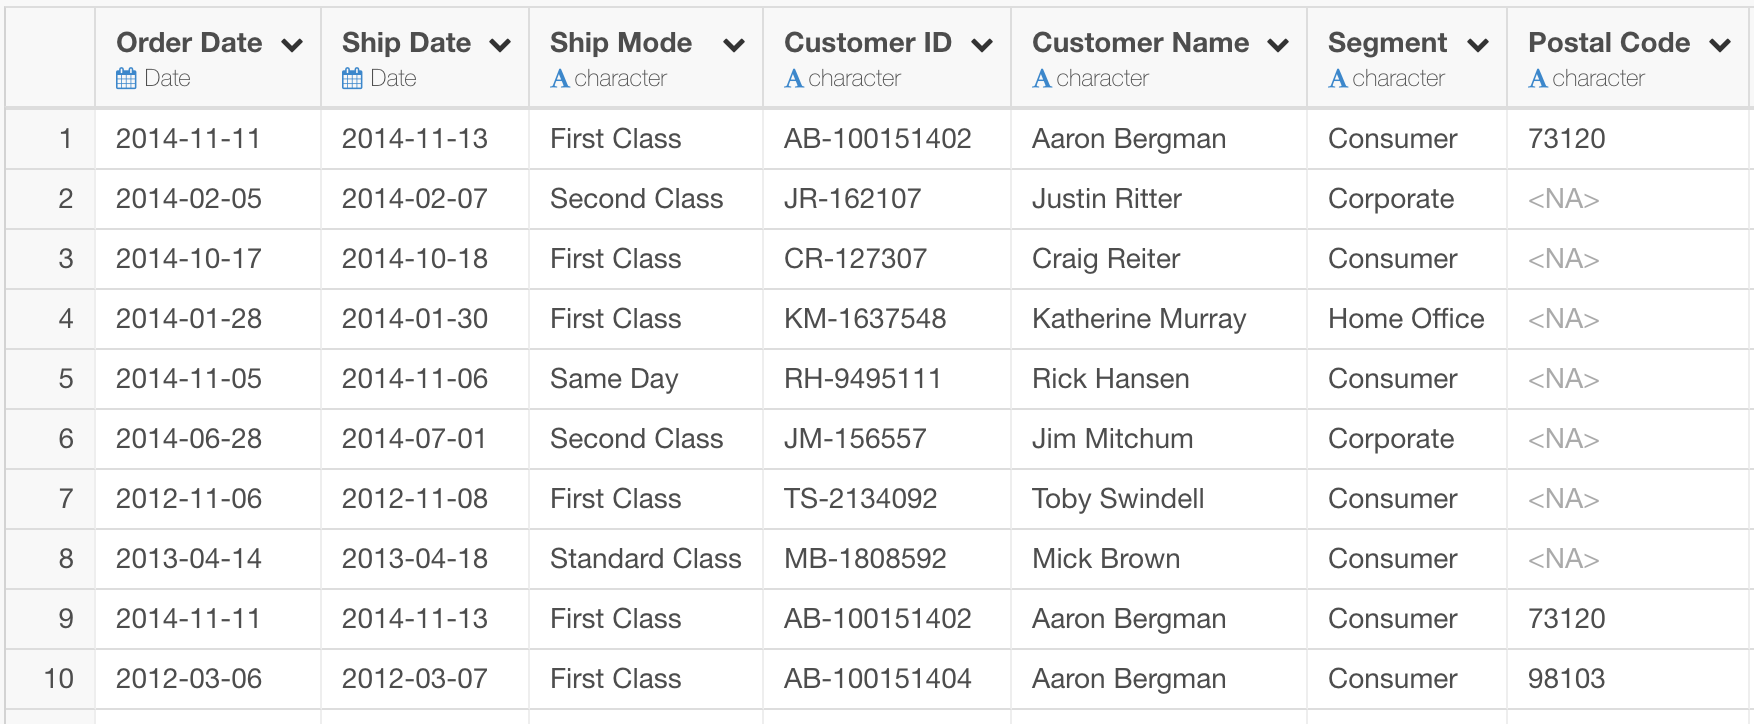
The order data we use today looks like following. One row represents an order, and each row has Order Date and Custome ID for the order.
Keeping the latest date in the data
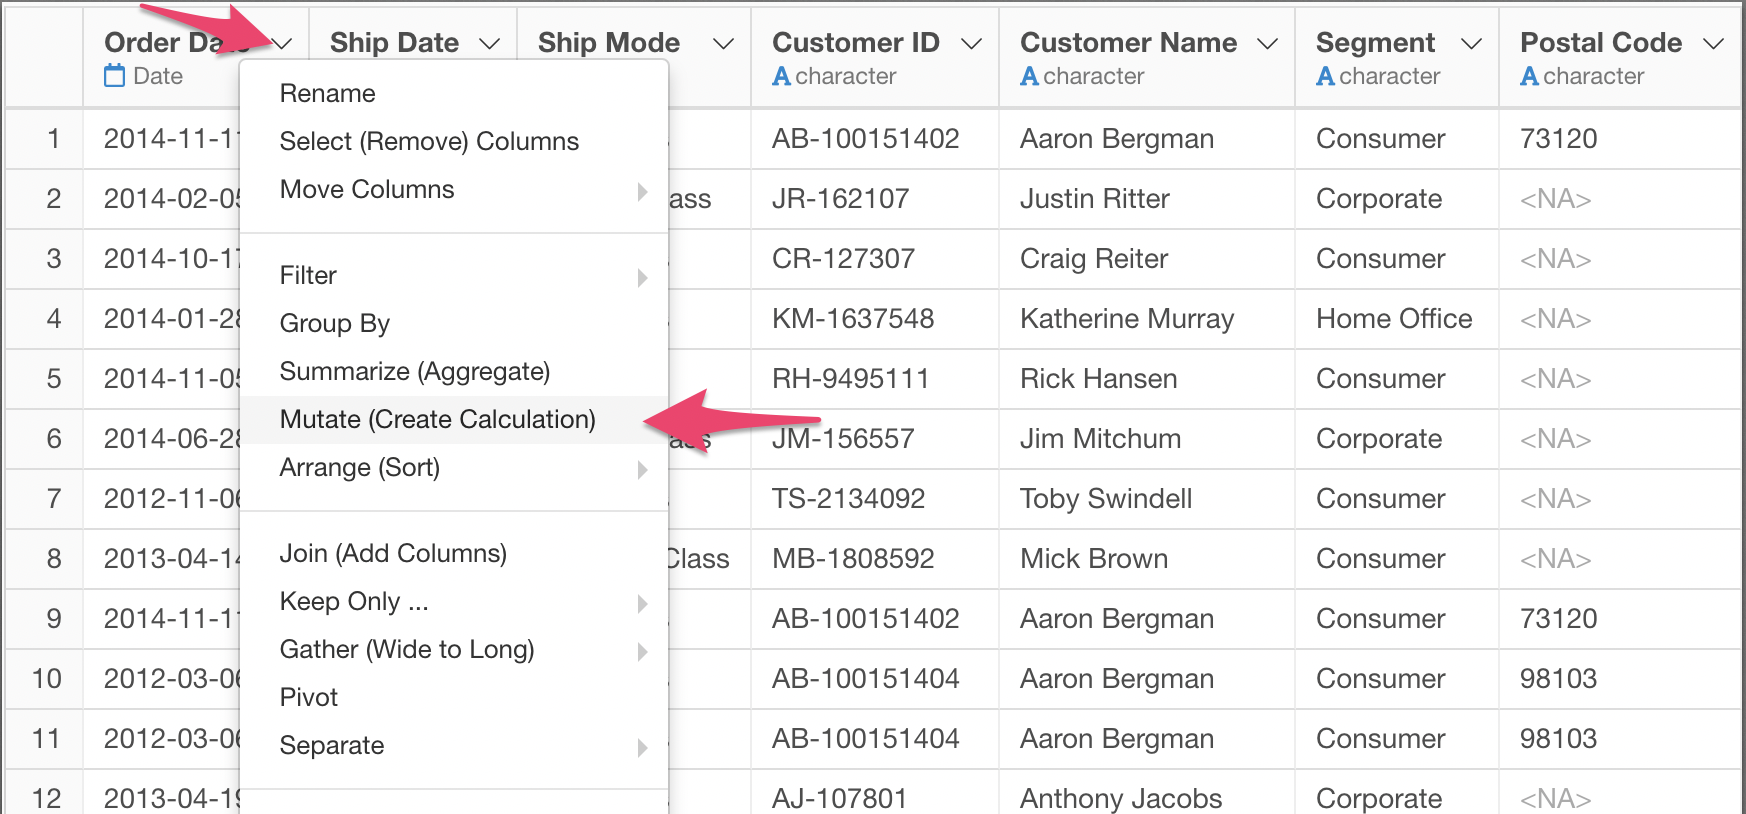
Because we are going to calculate the days since the last order of each customer, we need to keep the latest date that appears in this data, and we will consider it the current date of this data.
Follow the menu like the screenshot below.
Let’s name this new column last_day_in_data.
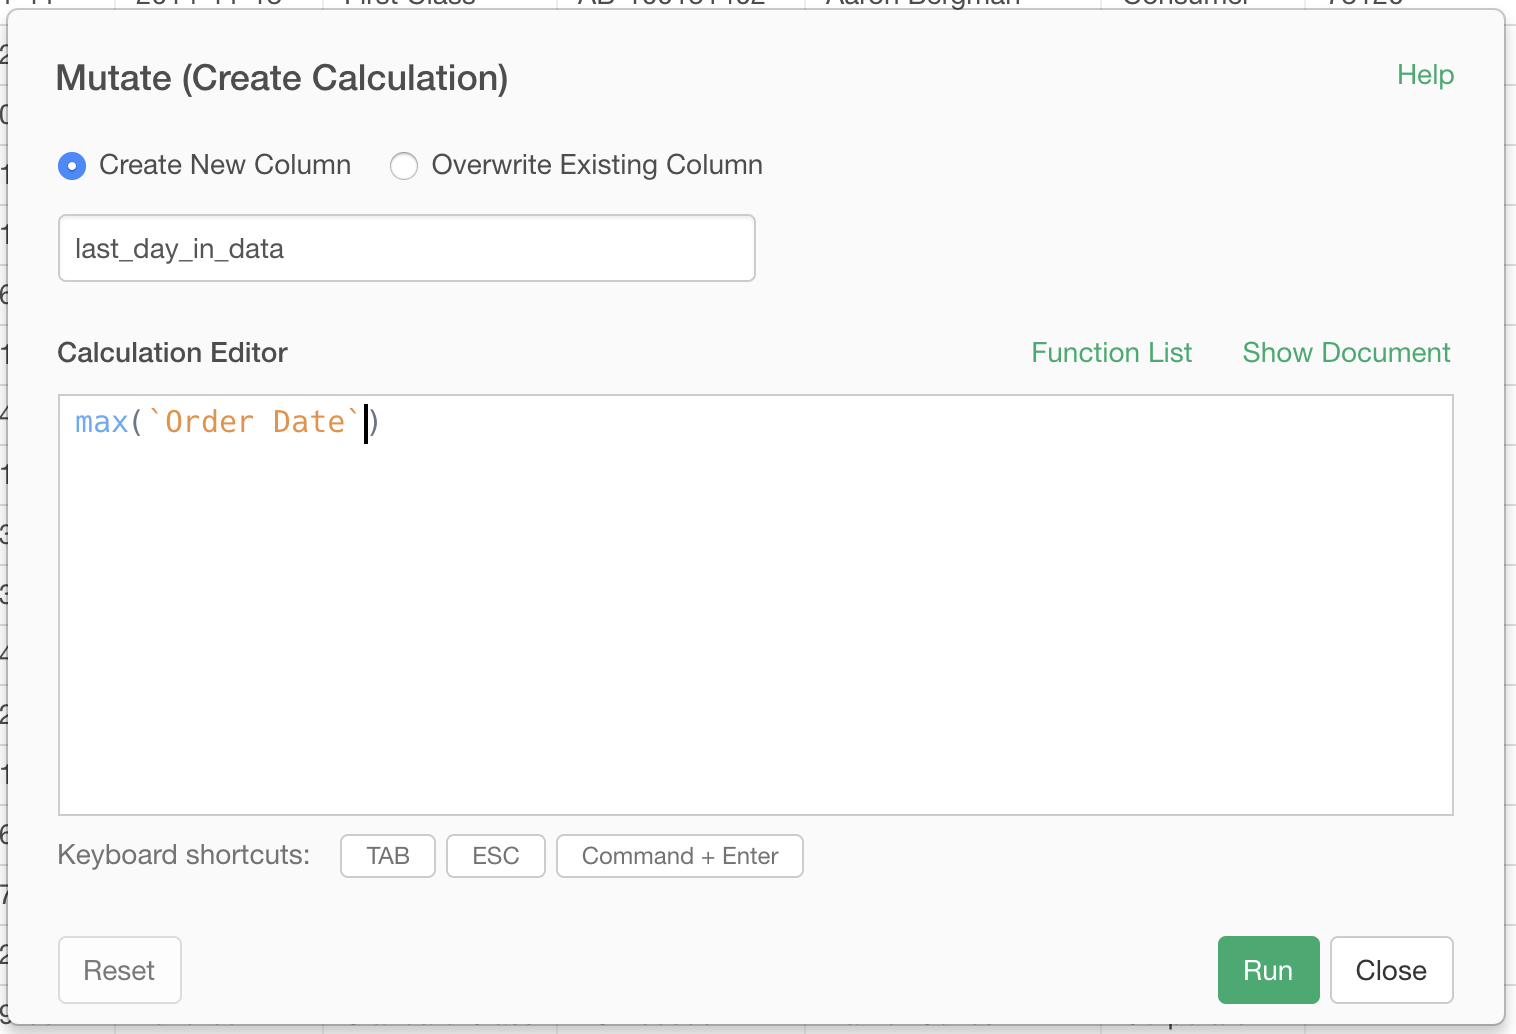
2015-12-31 apparently is the last day in this data. This same value is set for all the rows. 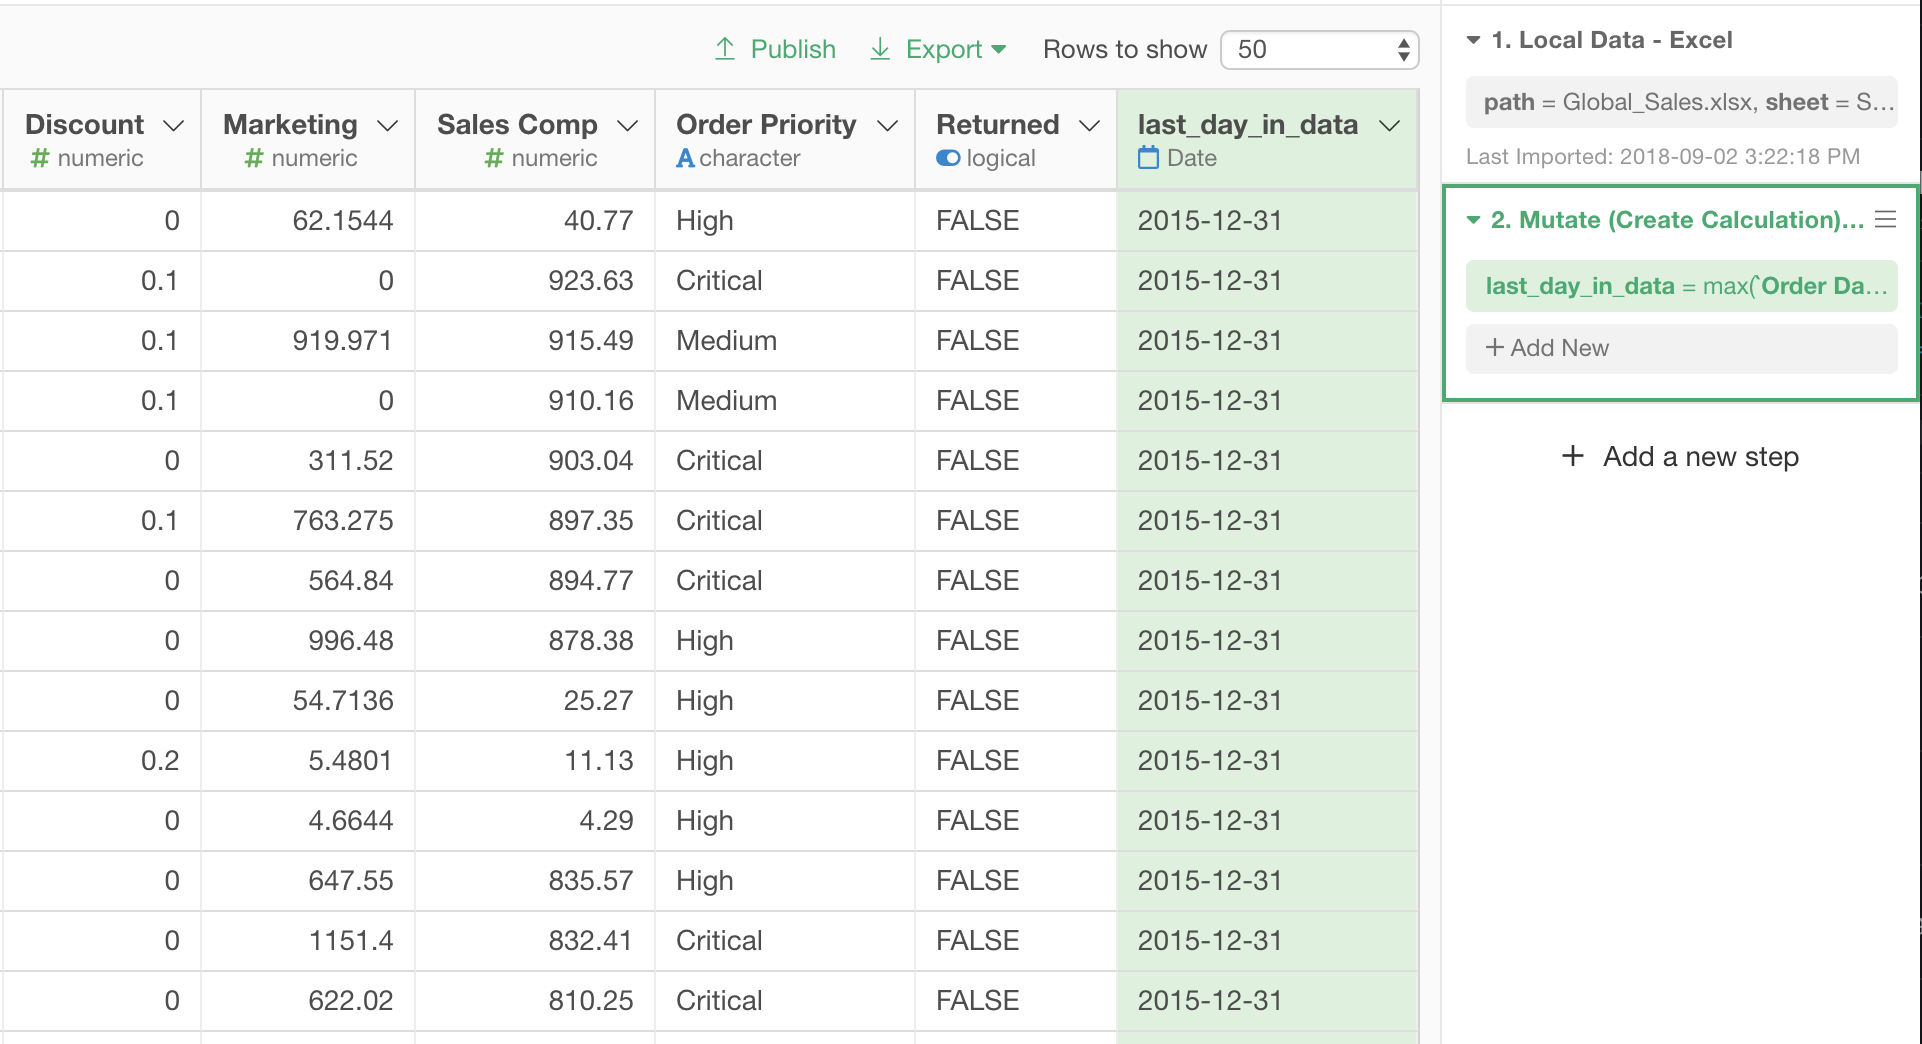
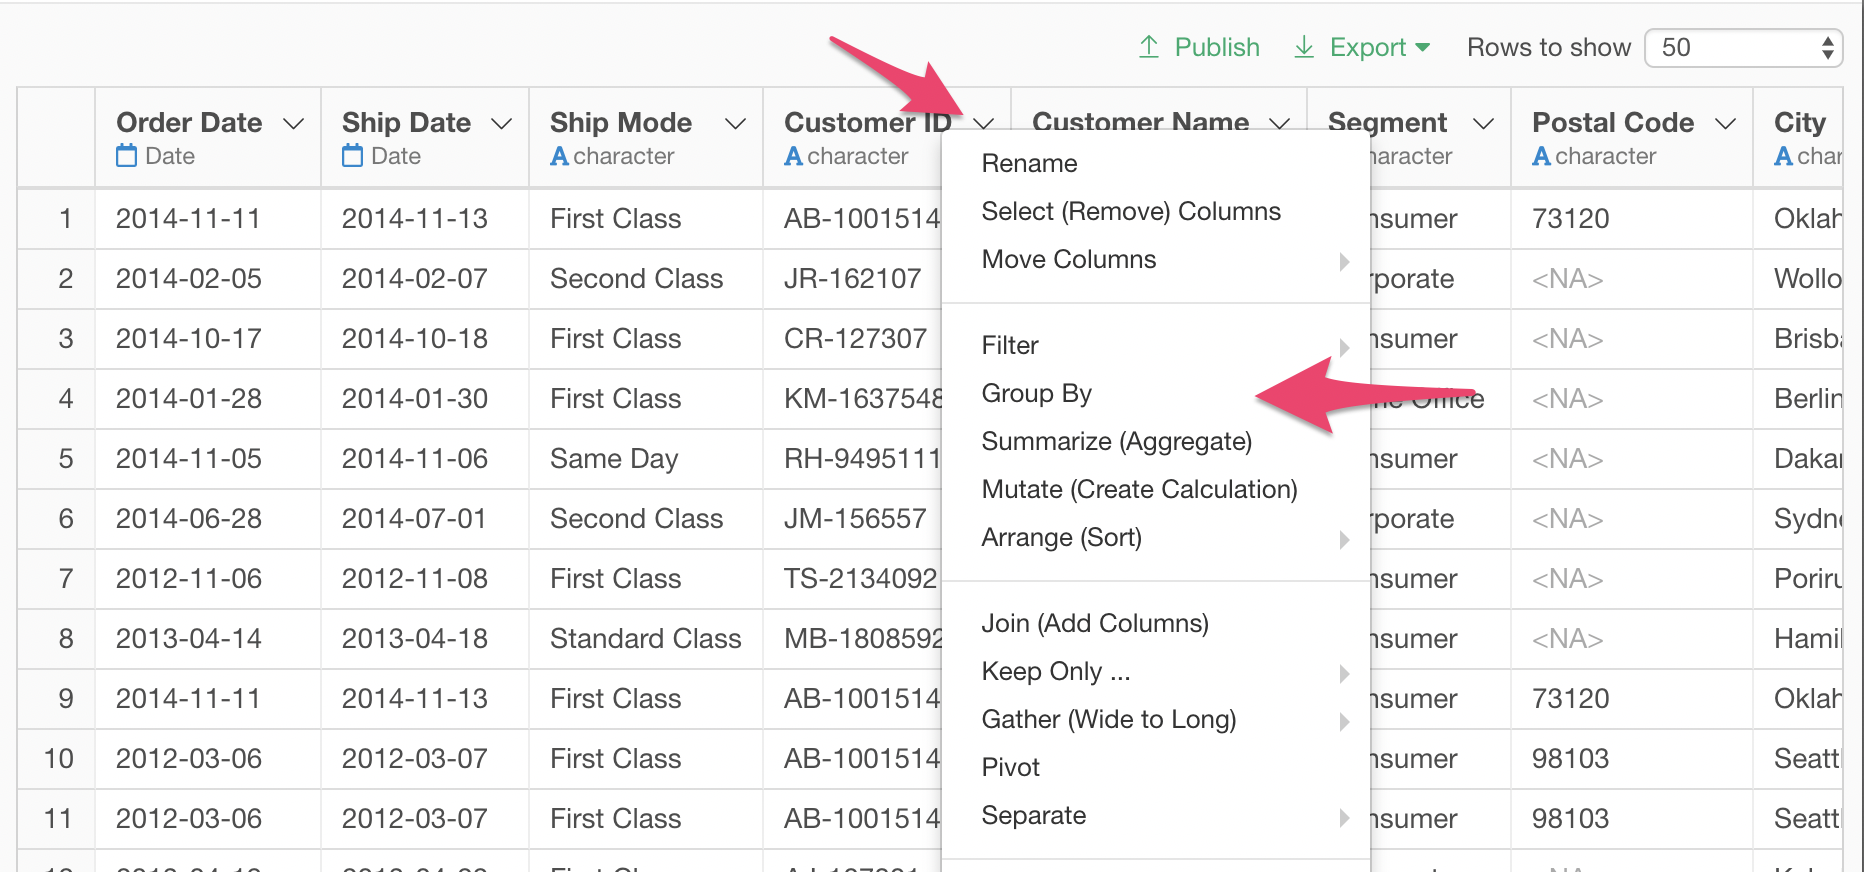
Group the data by Customer ID
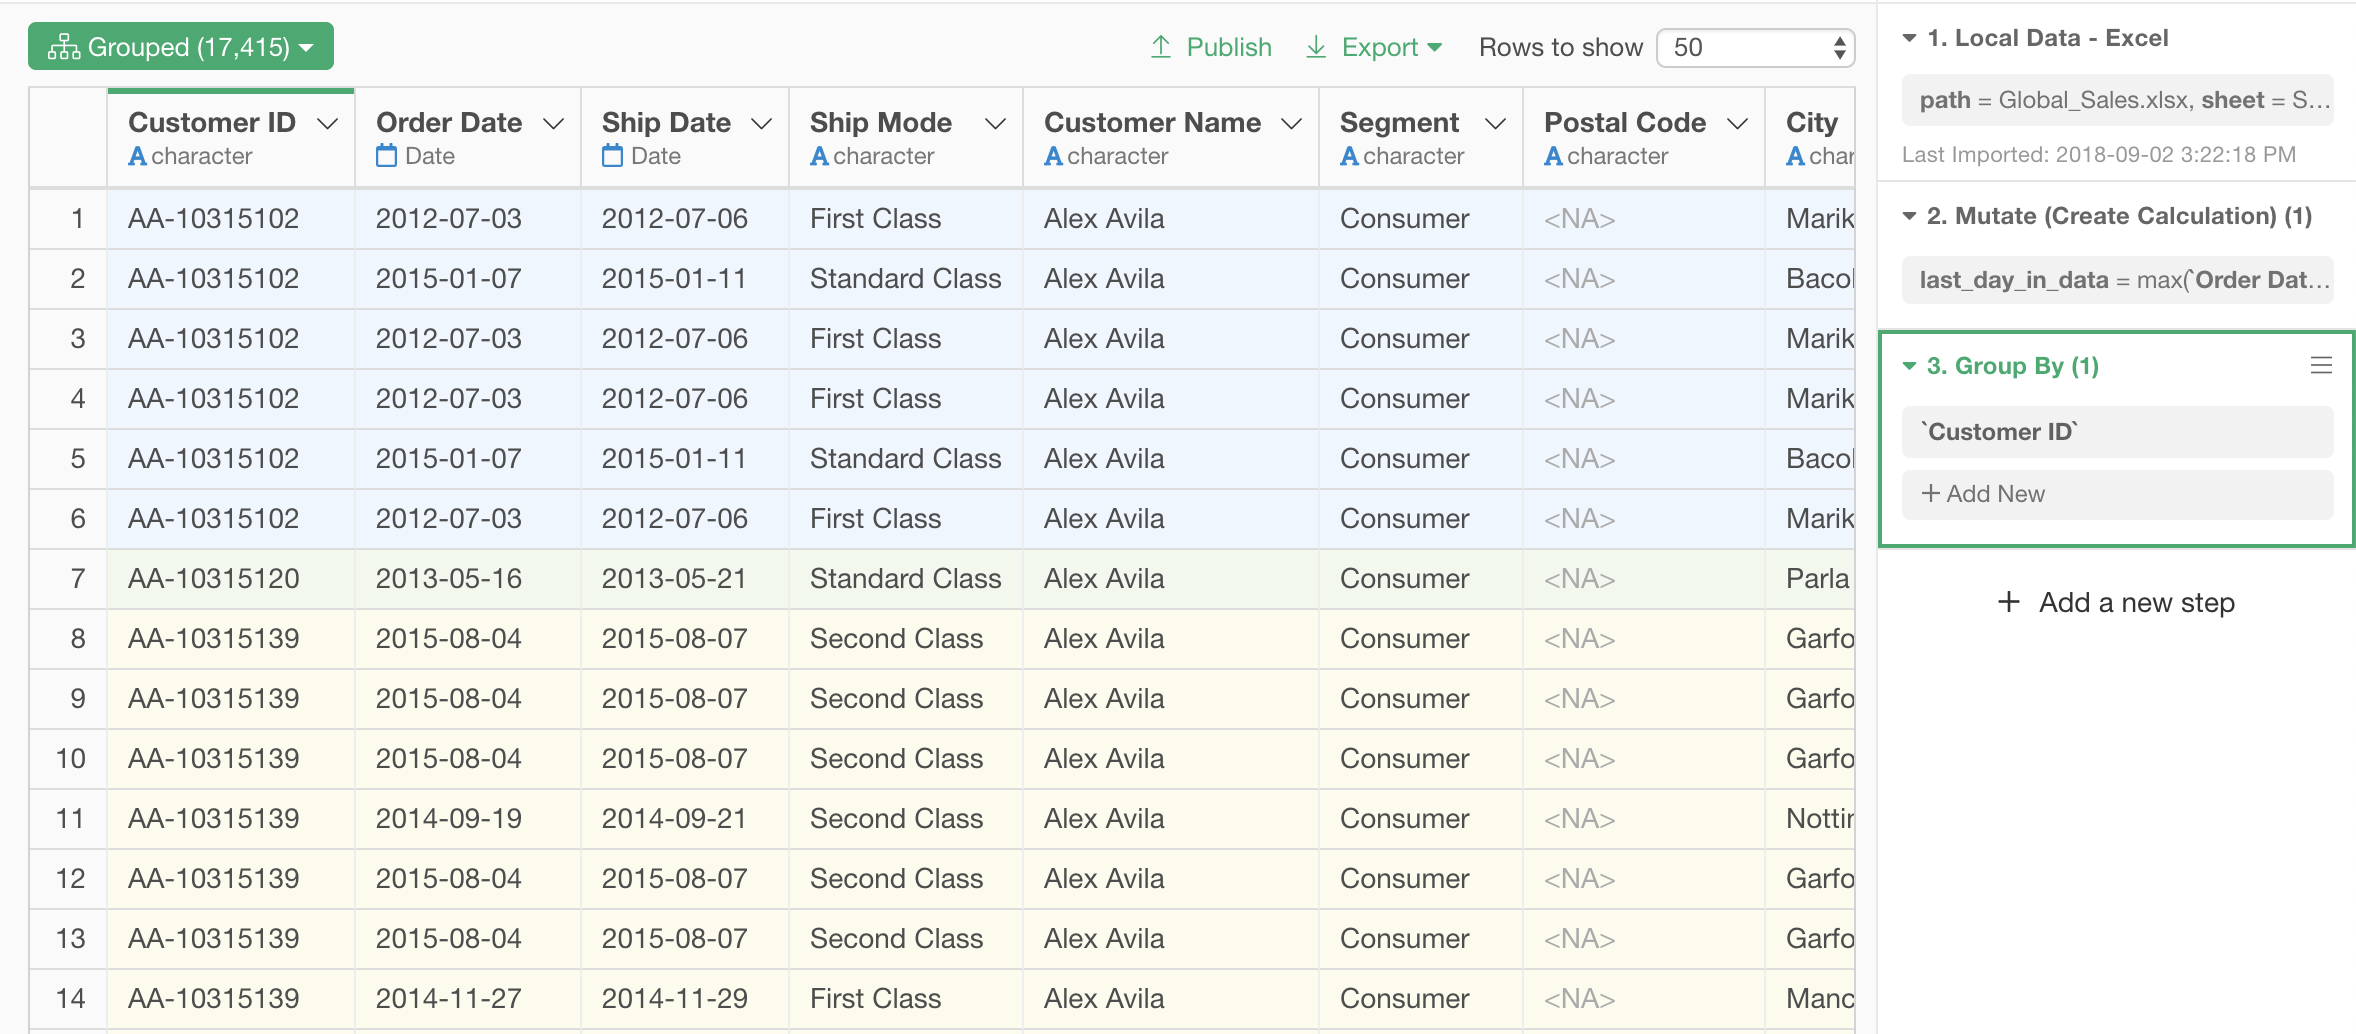
Since we are interested in analyzing each customer, let’s group the rows by Customer ID.
Note that the rows are now colored for each customer ID.
Cleaning Data by Filtering
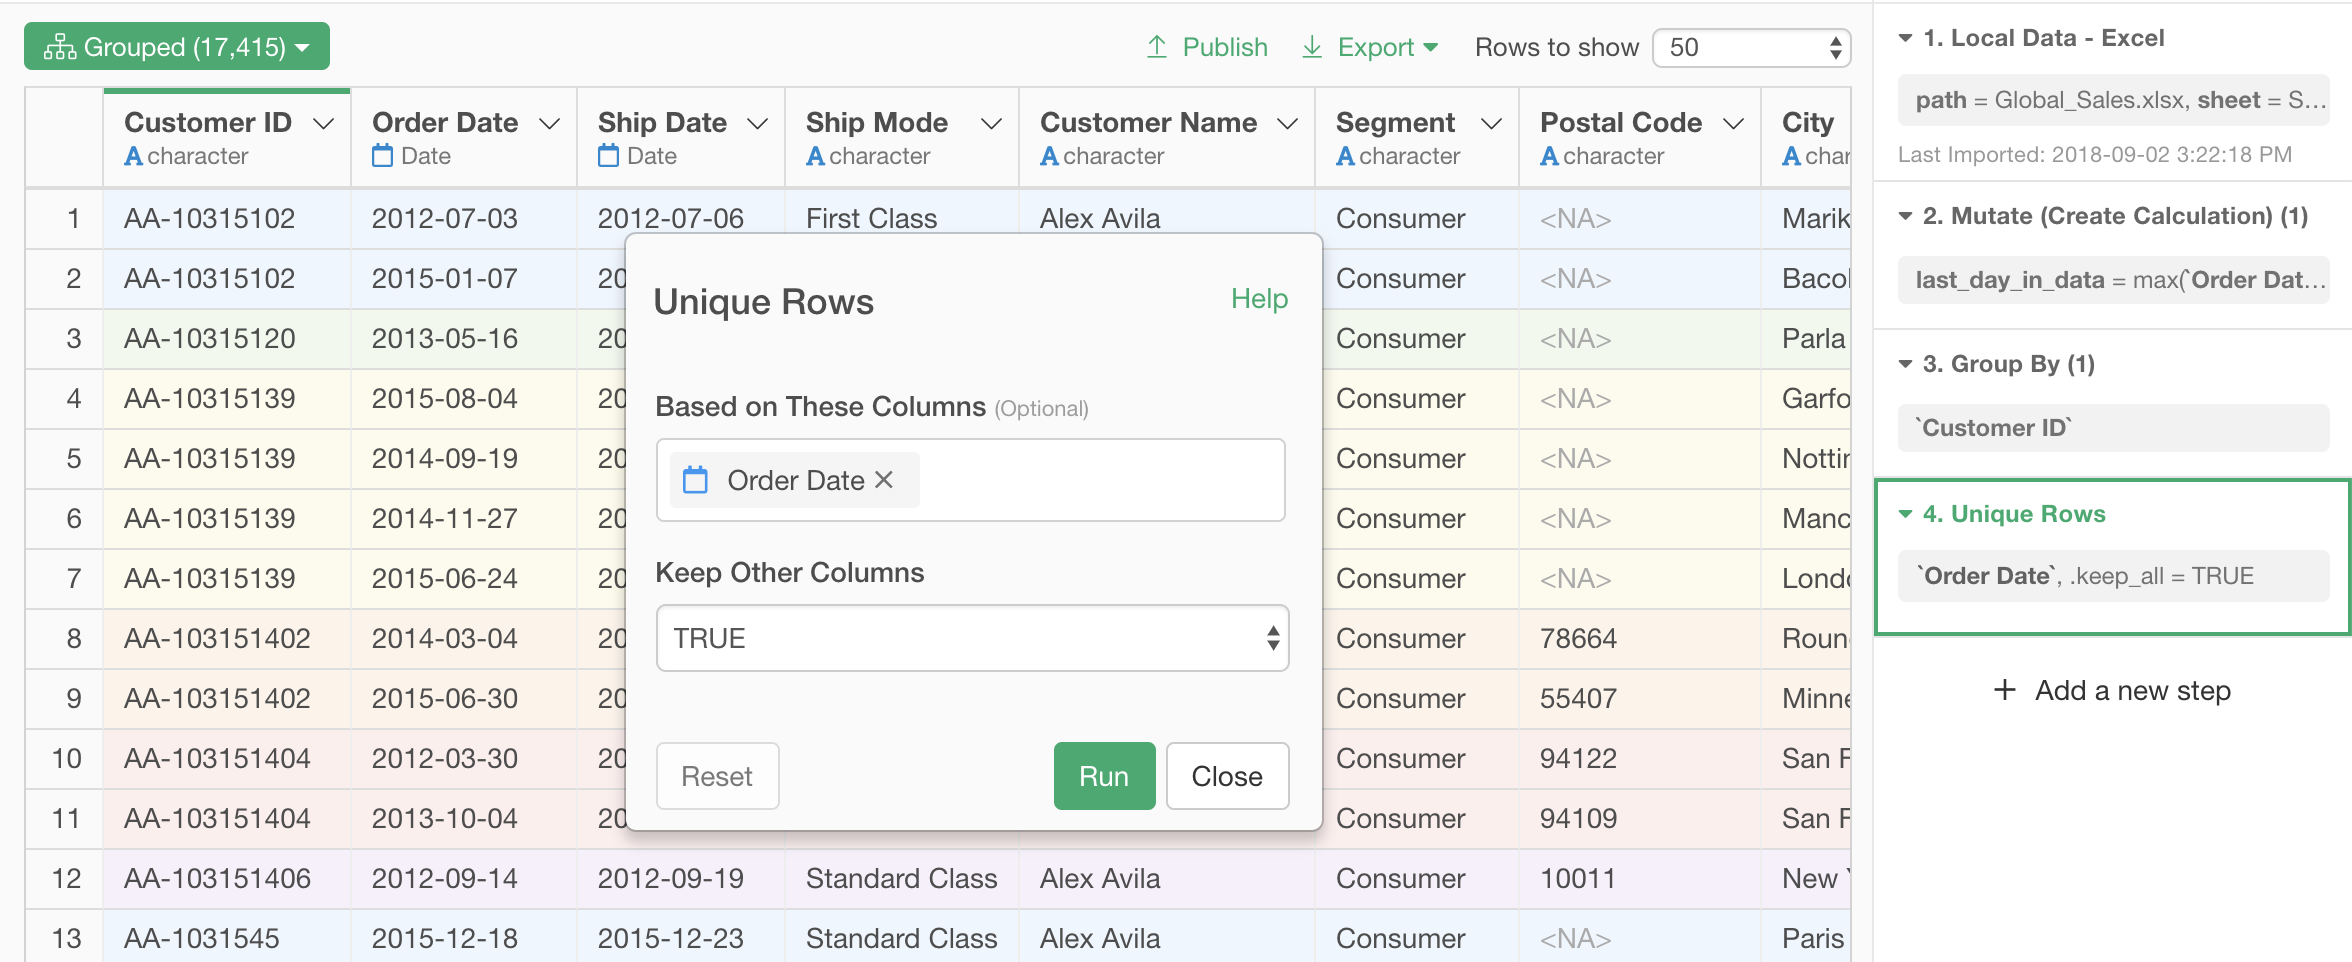
Filter out multiple orders in one day
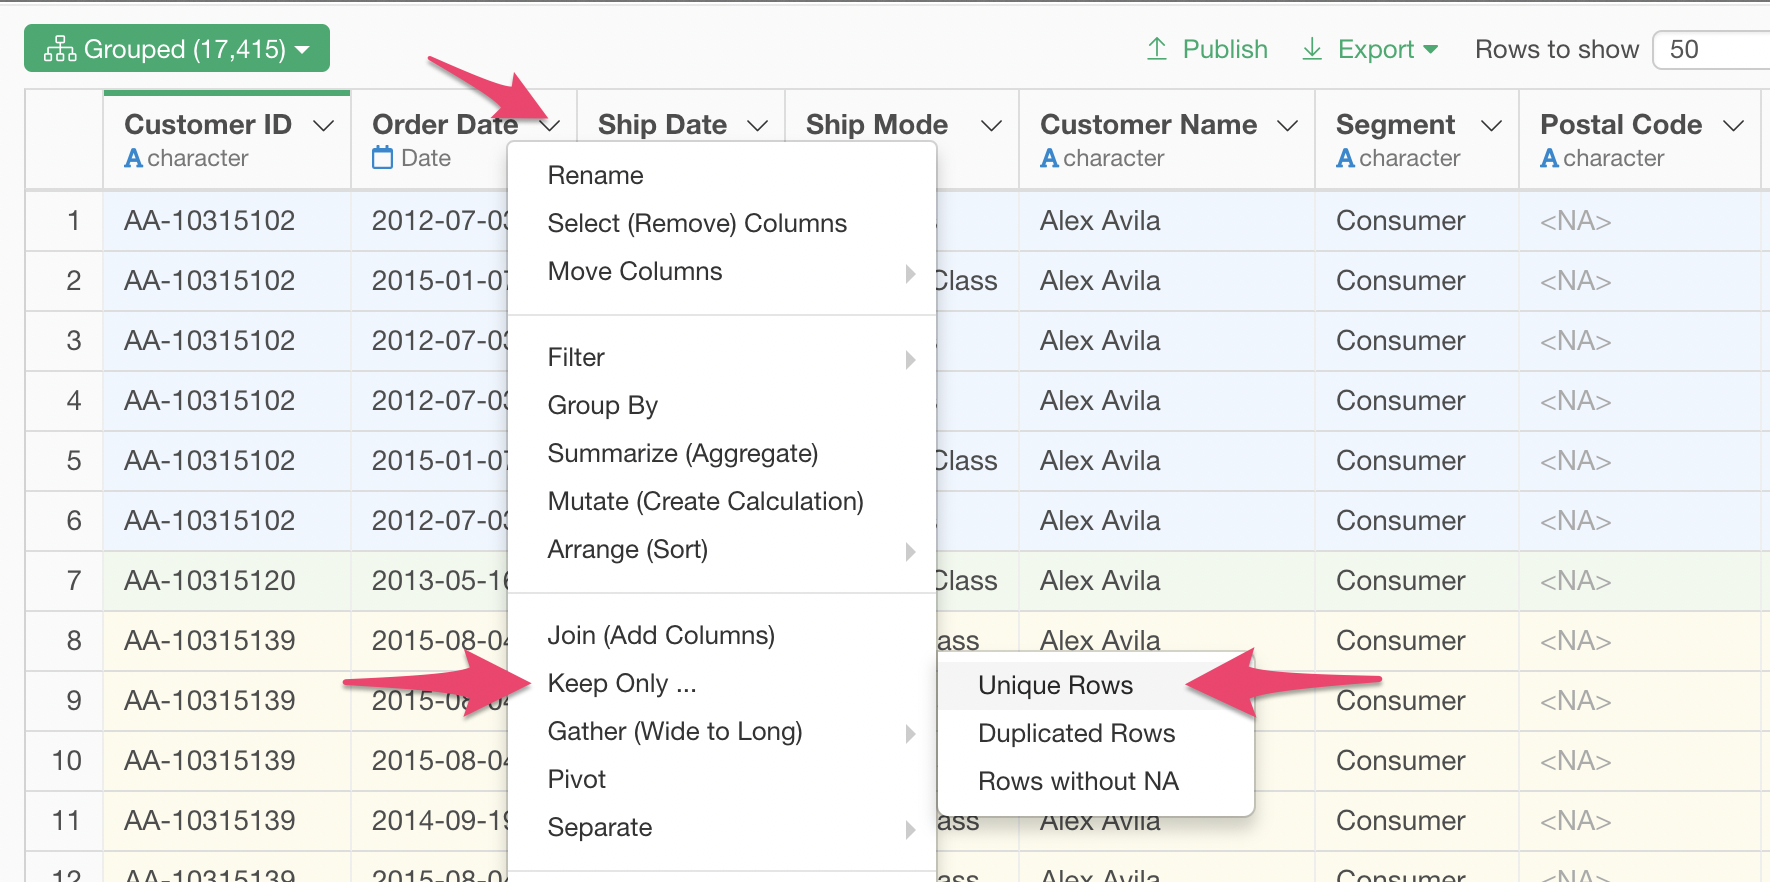
There are cases where one customer made multiple orders in a same day.
This will get in our way when we will calculate the intervals between past orders by the customer. Let’s keep only one order for a customer for one day, and remove other orders from the customer on the same day.
Remove Customers with Fewer than 5 Past Orders
We are going to look into the distribution of intervals between orders from each customer, but if there are too few orders for a customer, we won’t be able to tell much about the distribution of order intervals for the customer.
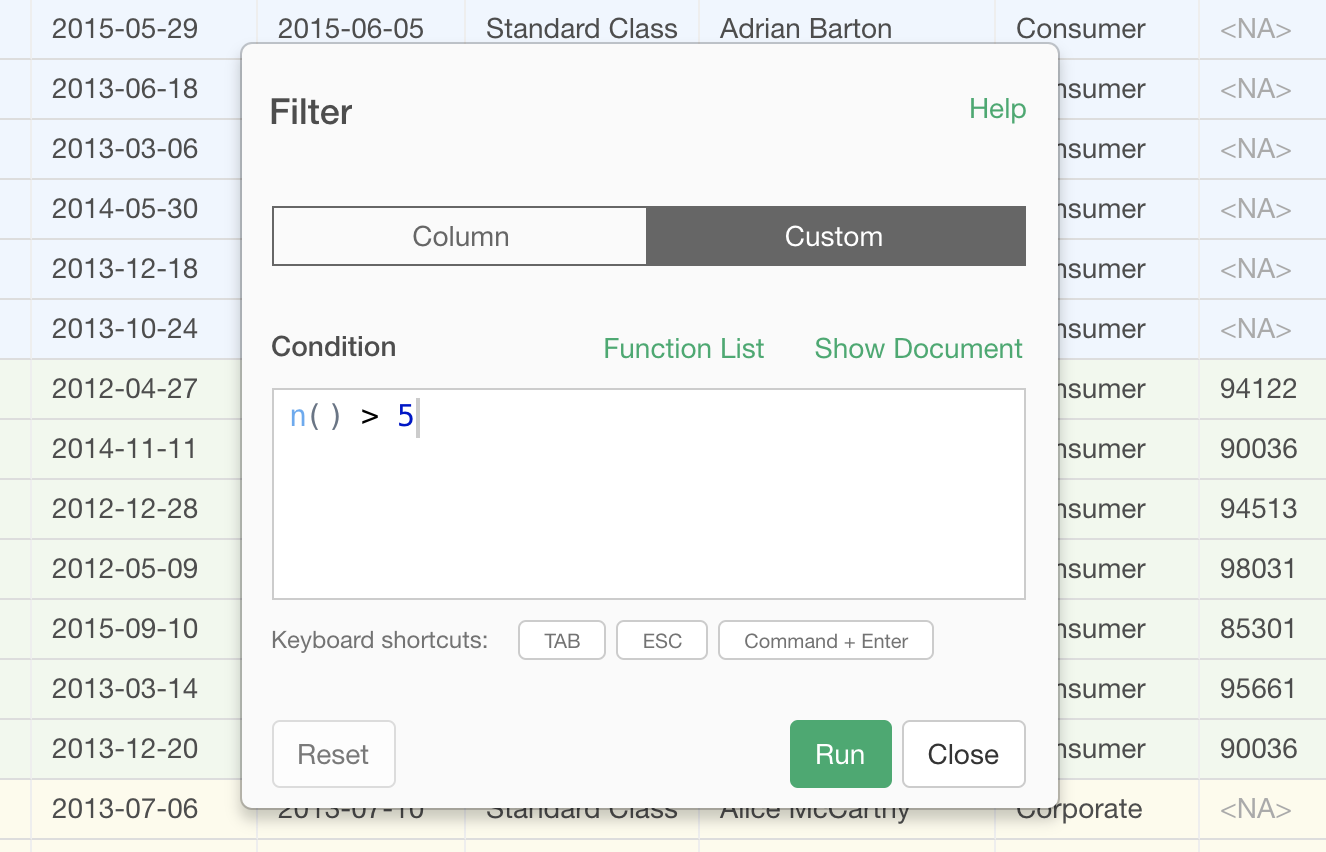
Let’s remove customers with less than 5 past orders, and target our analysis only for the customers with more orders than that.
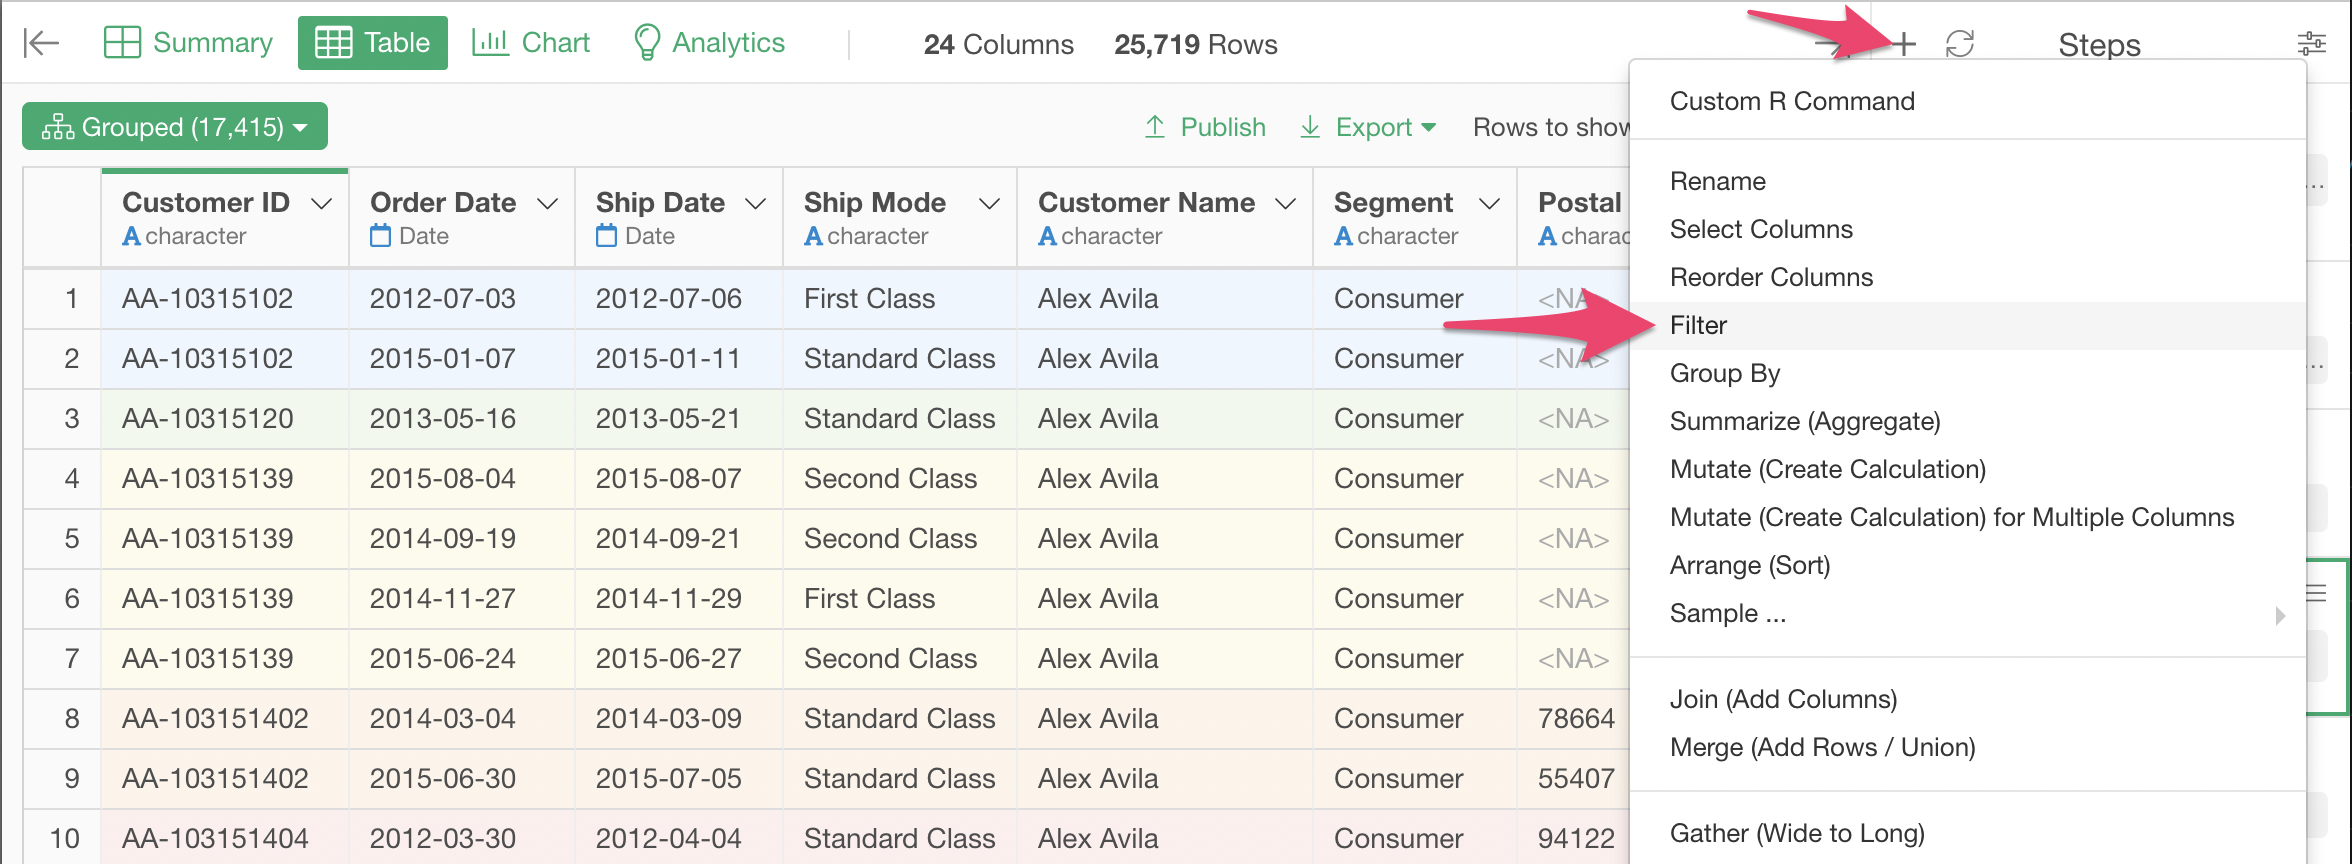
Select the Custtom tab on the Filter dialog, and type in n() > 5 as the condition.
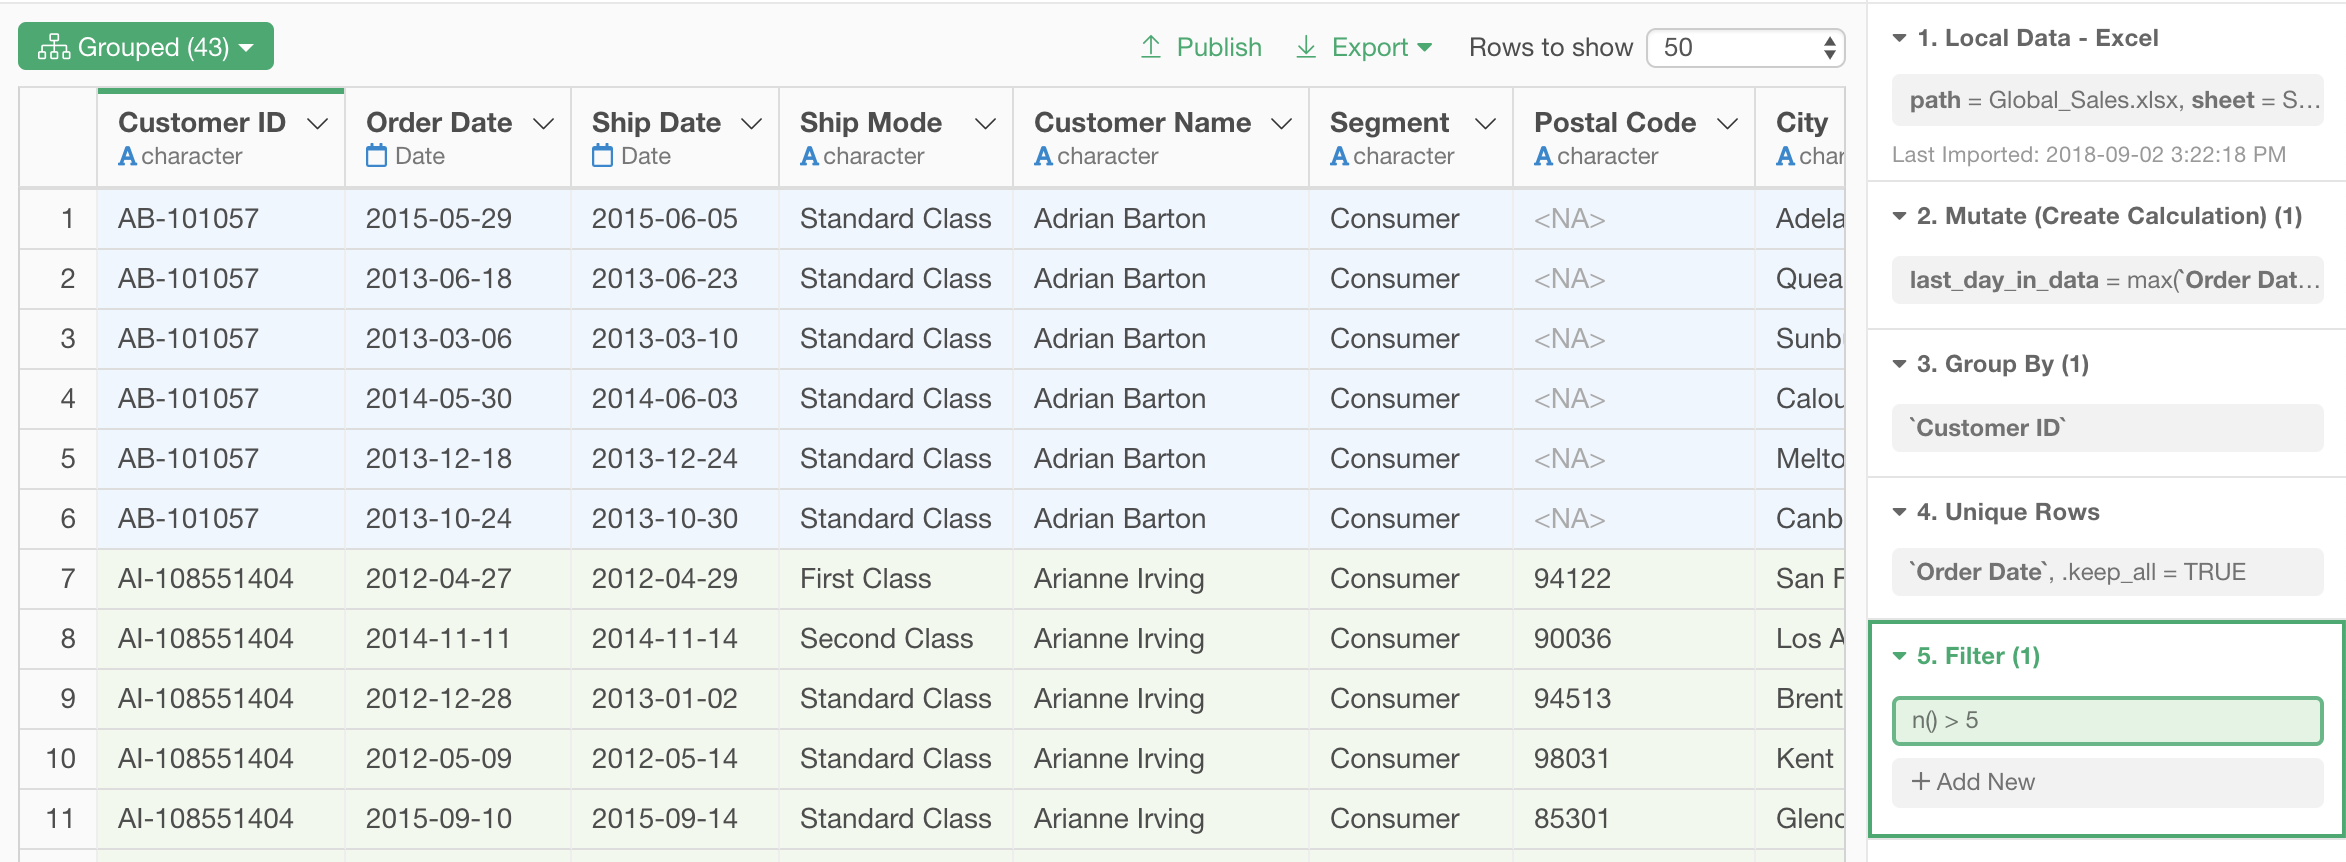
Now we are left with only customers with 5 or more past orders.
Calculating Order Intervals for Each Customers
Now, we can start calculating order intervals for each customers.
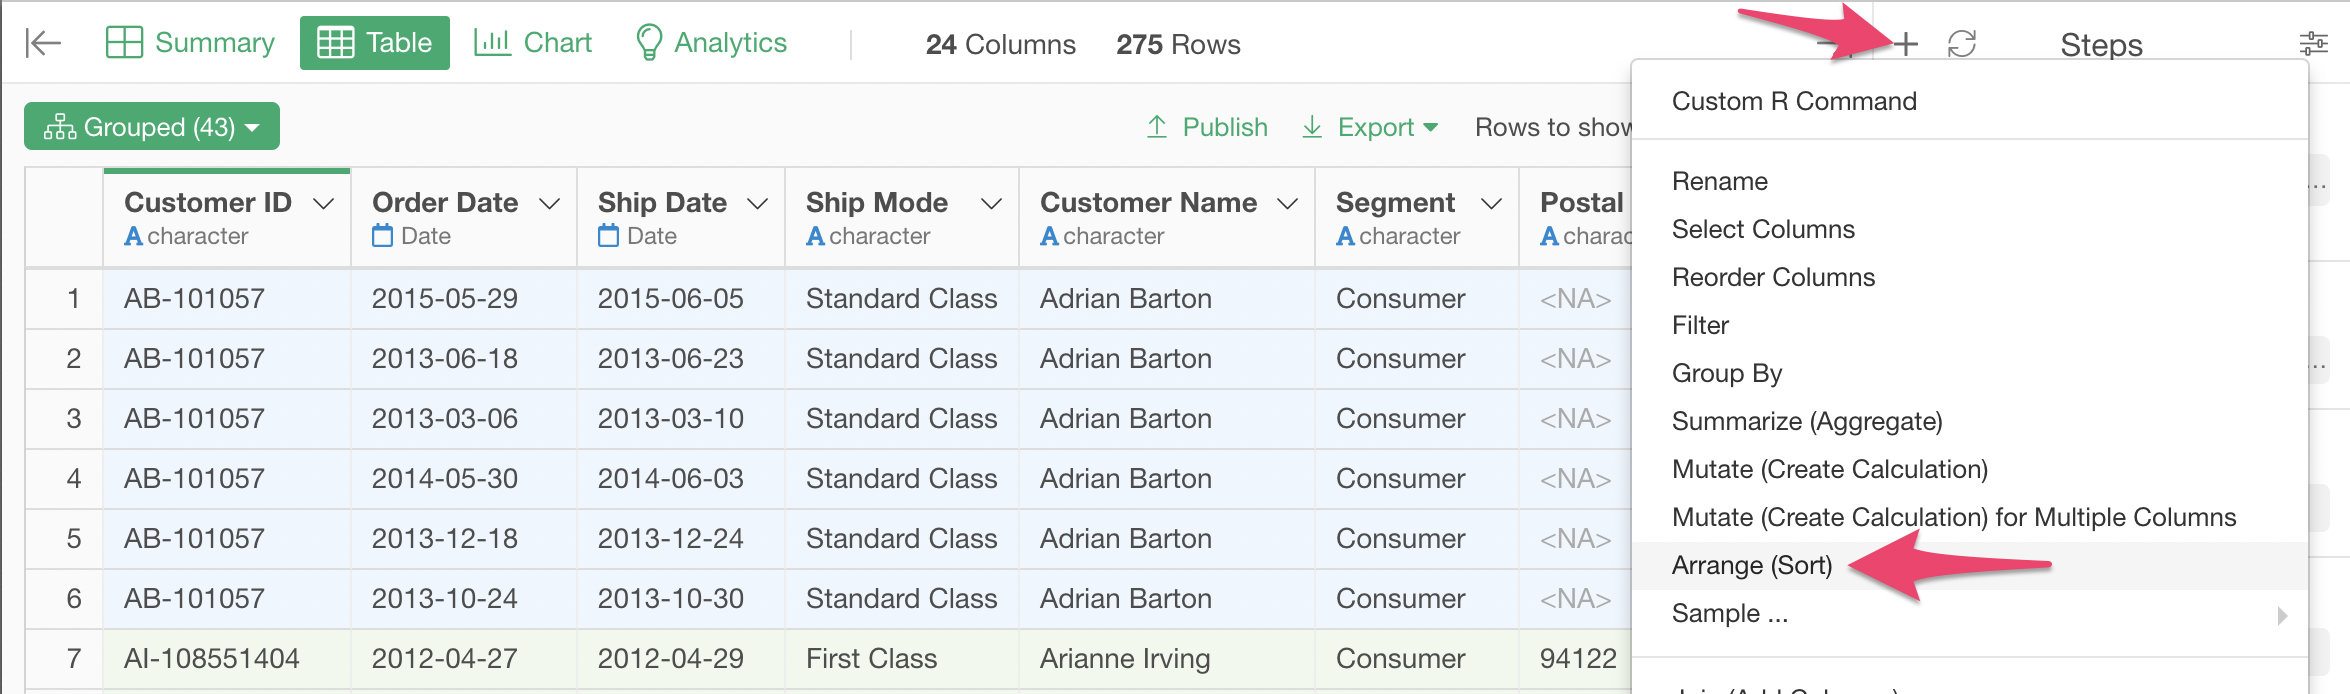
Sort the Order Data by Order Date
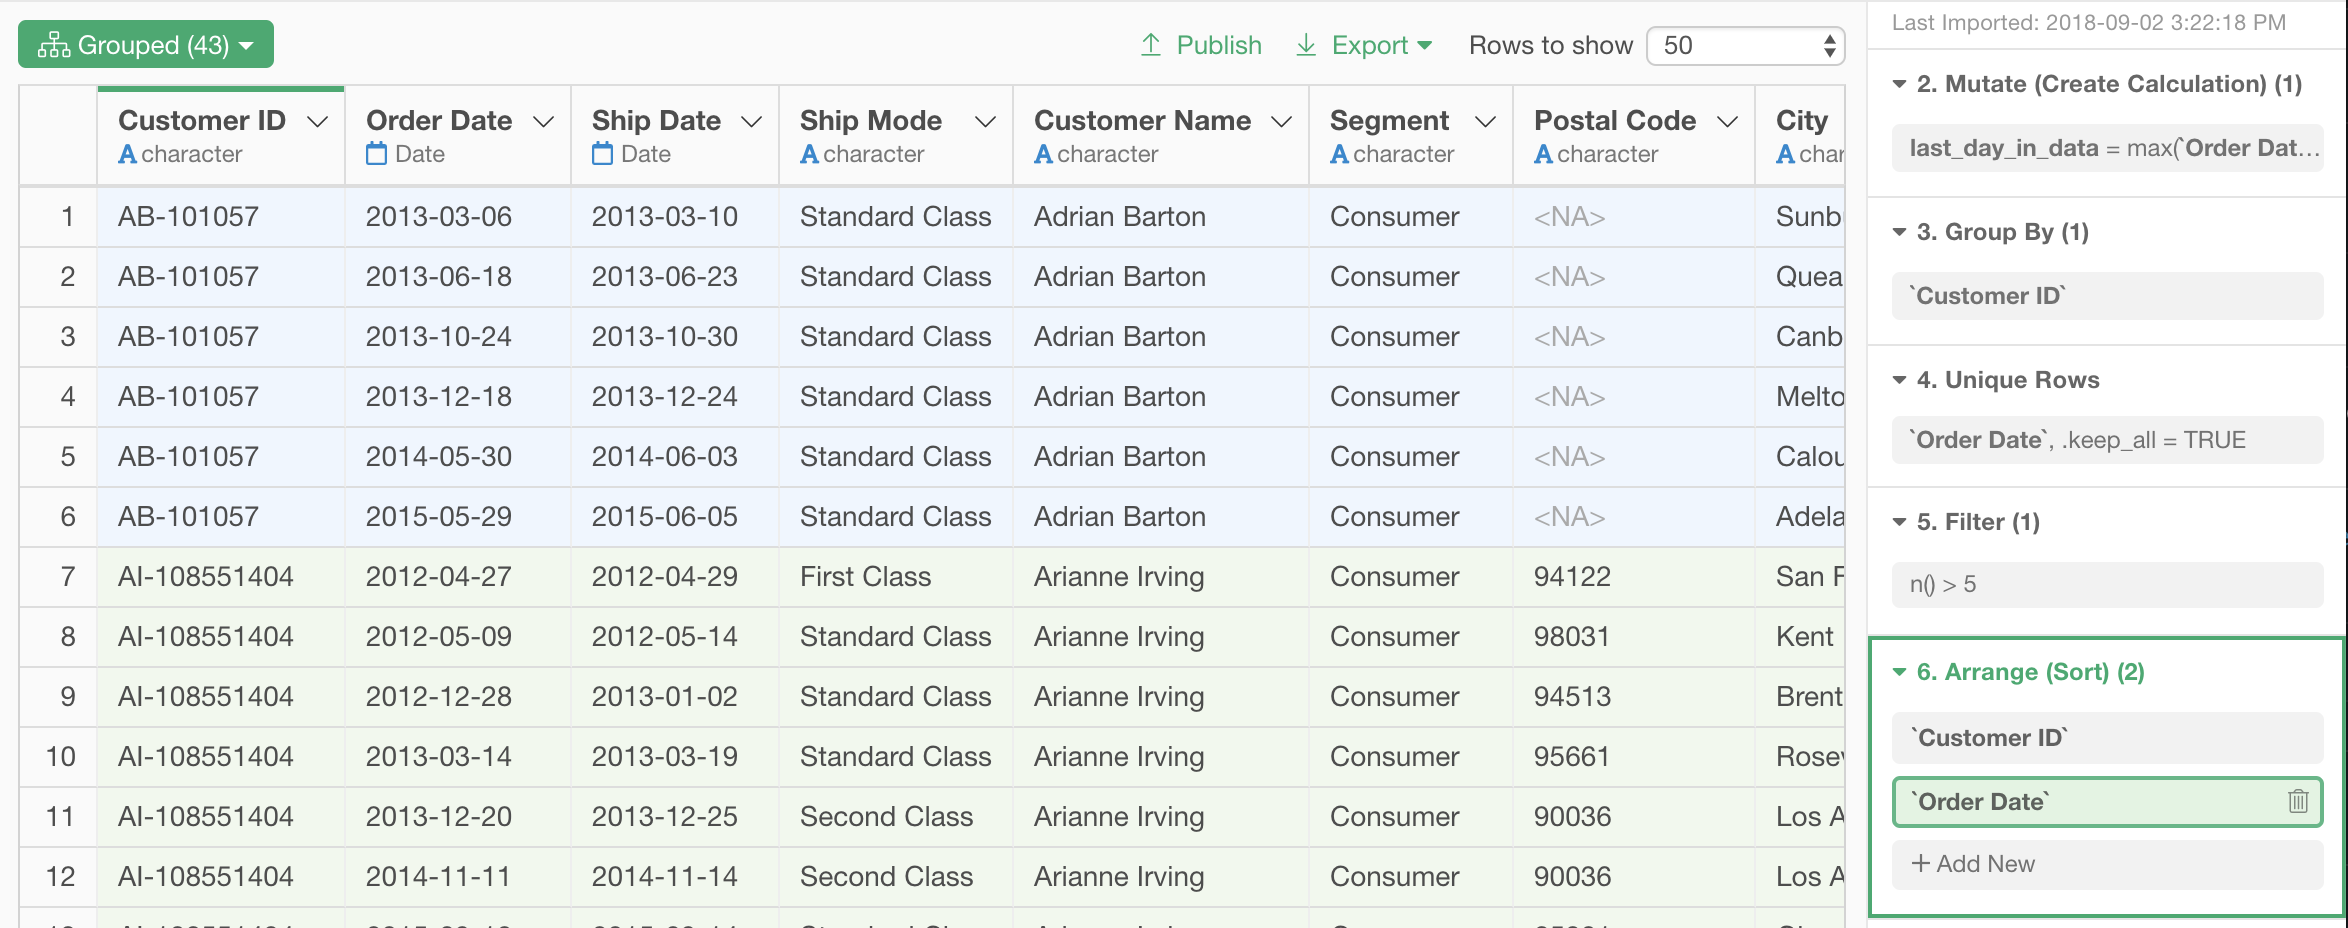
First, let’s sort the order data by order date, from older orders to newer orders, within each customer.
Select Arrange (Sort) from the step menu.
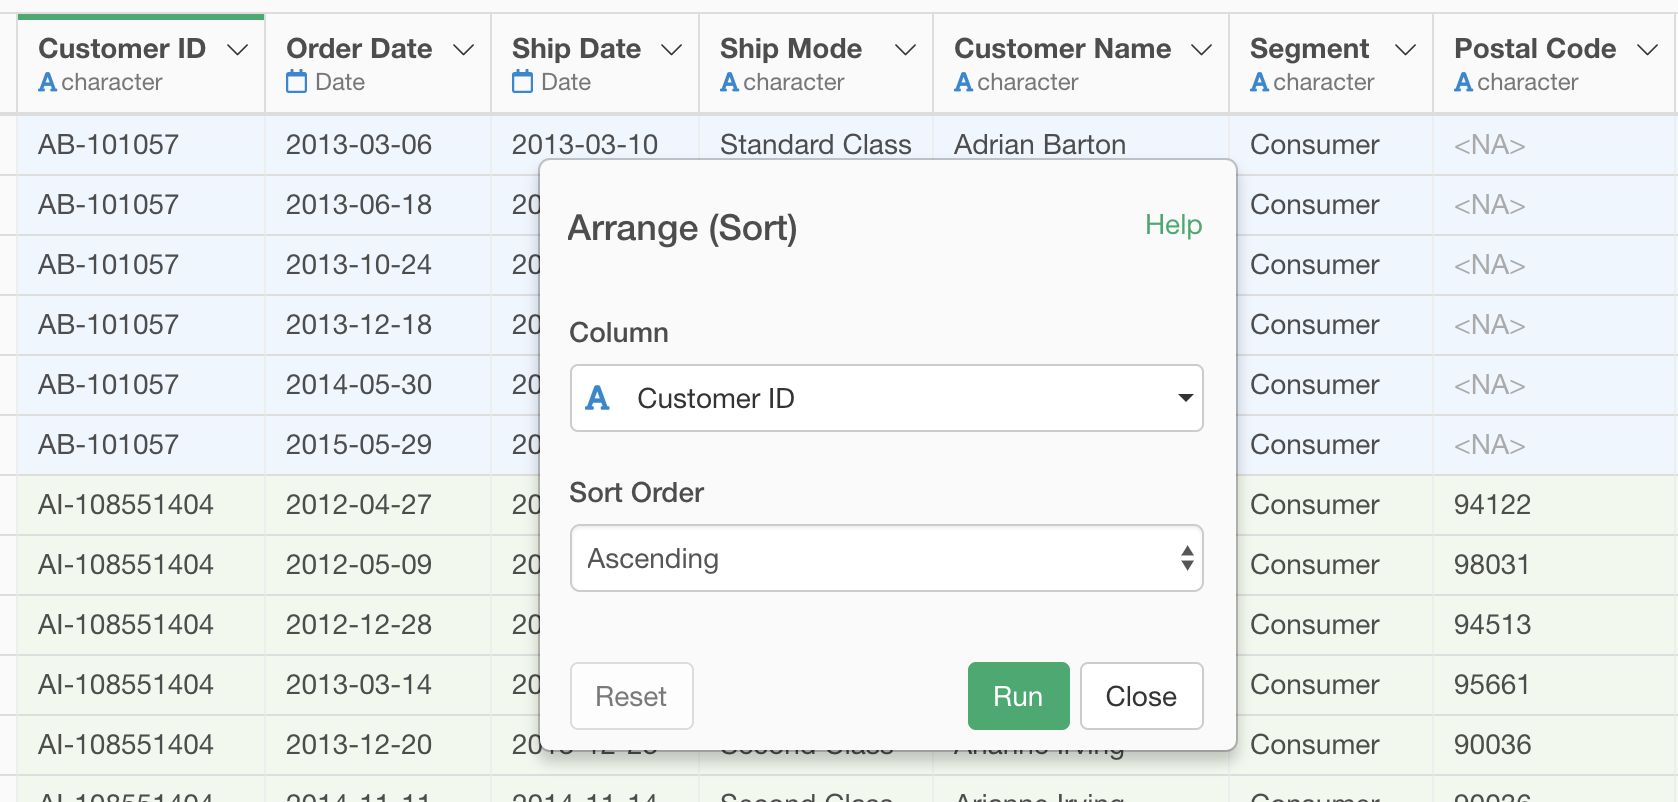
If we sorted just by Order Date, the entire data would be sorted by Order Date, ignoring Customer ID. To avoid that, let’s first select Customer ID as the first column for the sort.
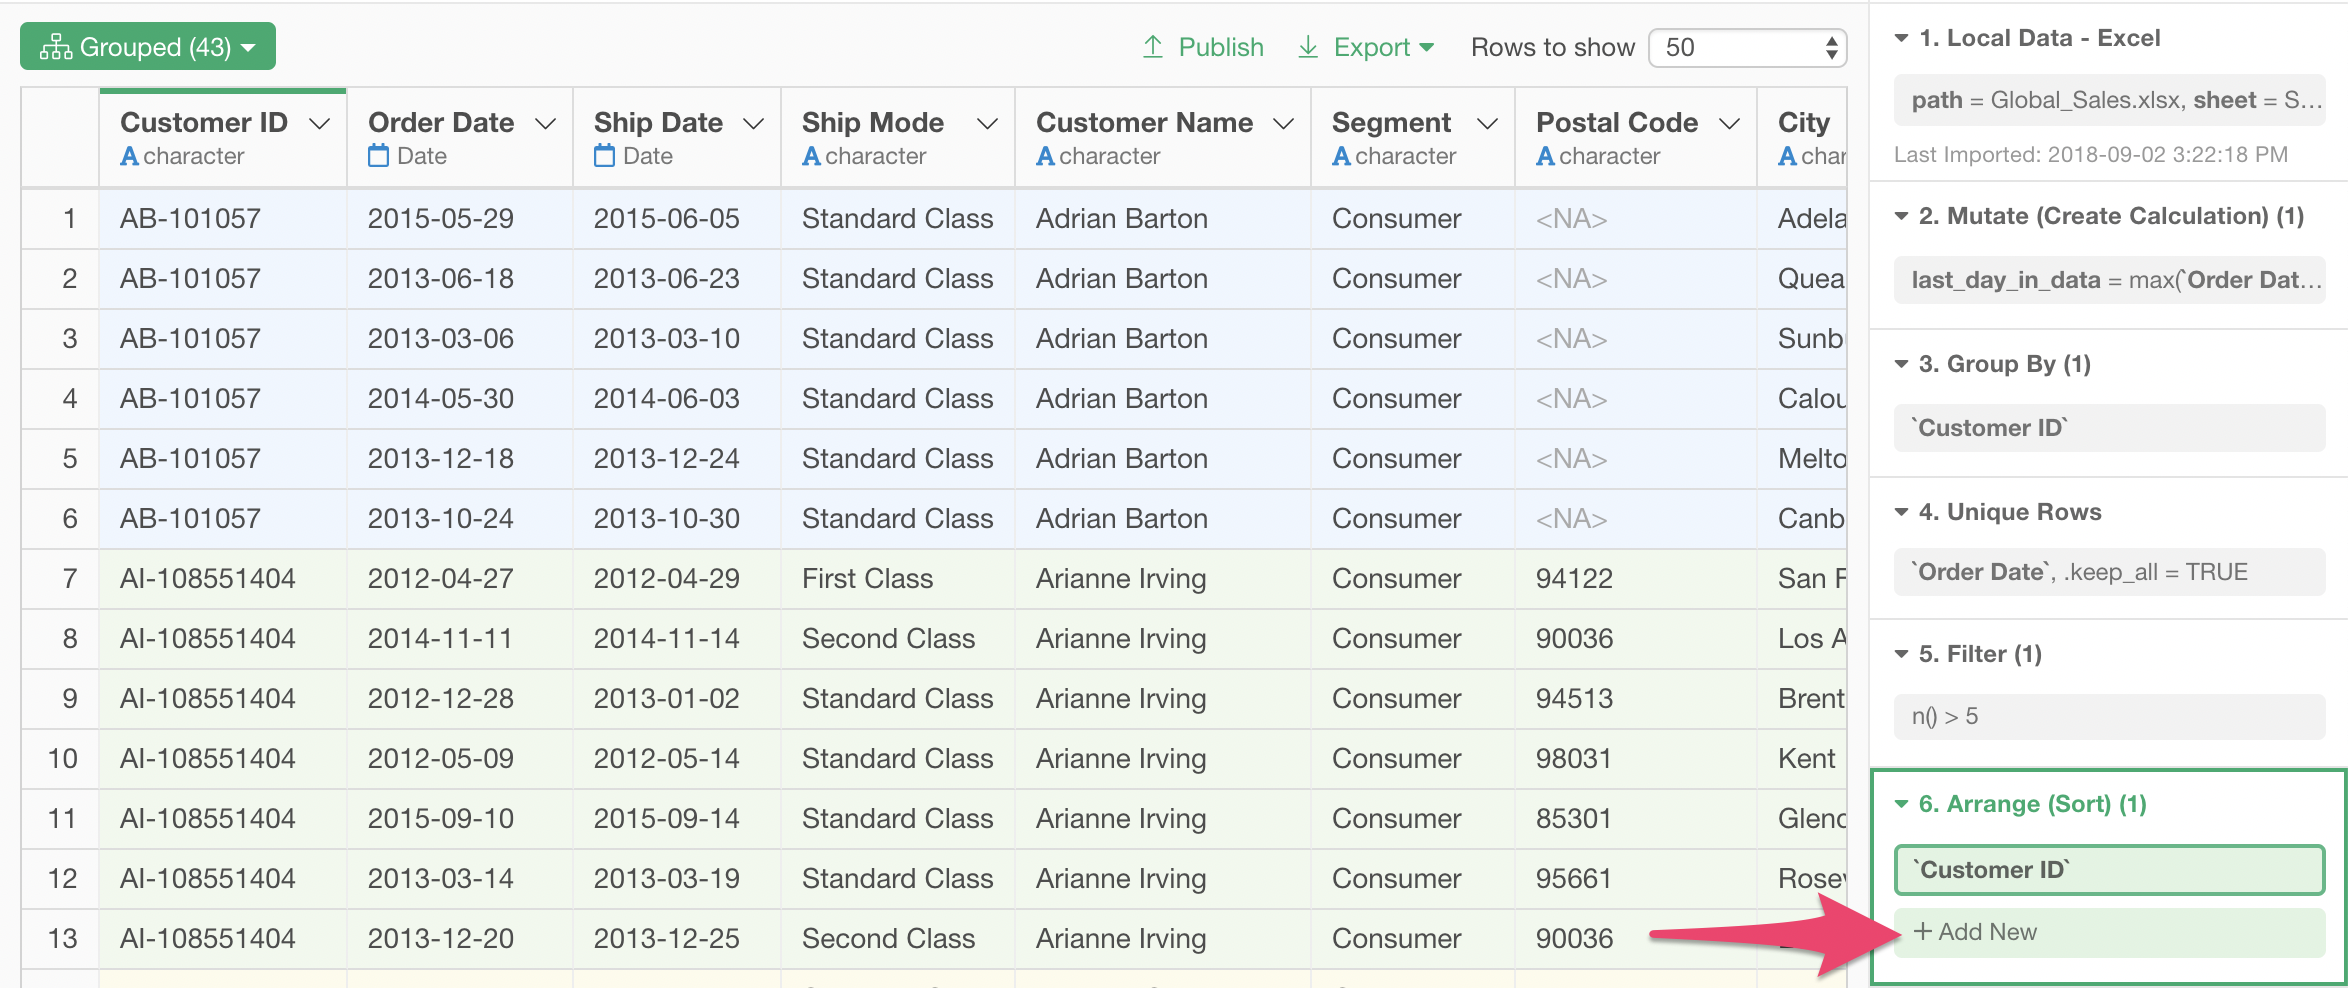
Then click Add New token, to add Order Date as the second column for the sort.
Select Order Date as the second column for the Arrange (Sort) step.
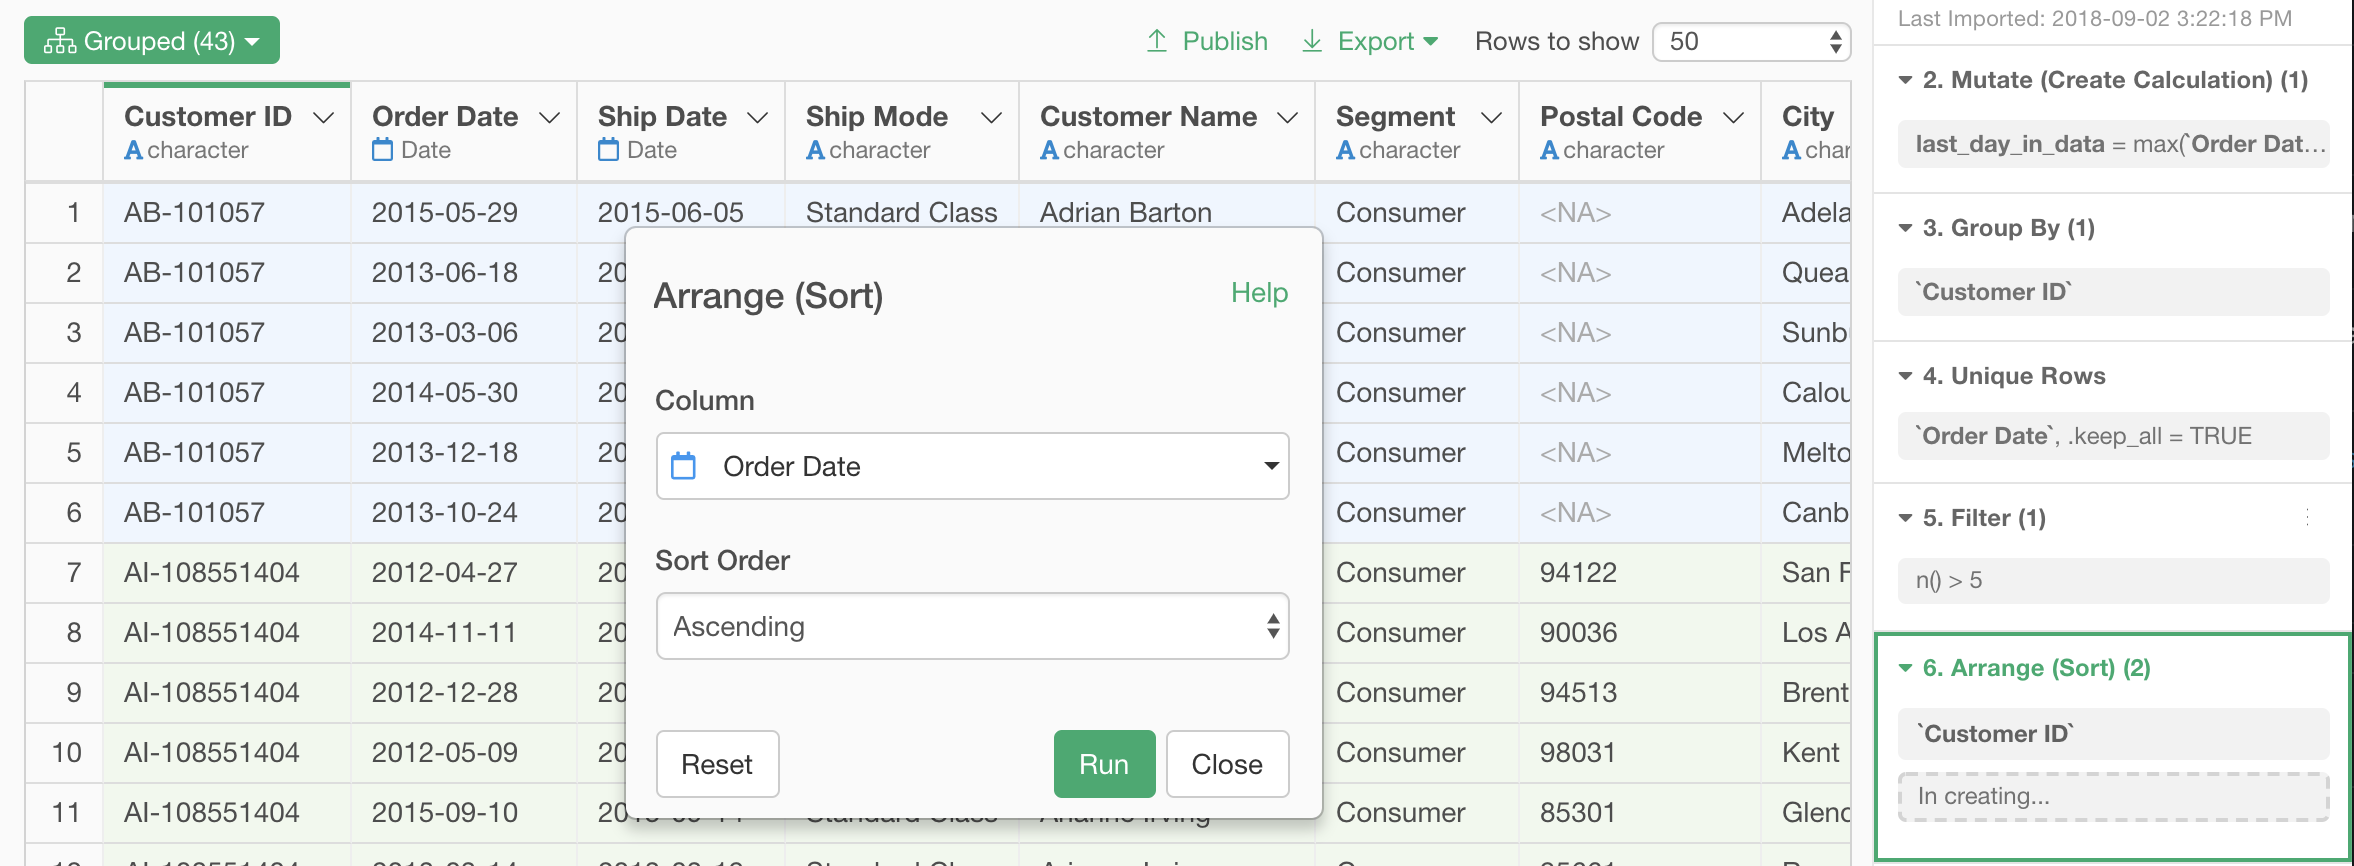
The order data is now sorted by order date, within each customer.
Calculate Order Intervals of Each Customer with lag function
At this point, we can calculate intervals between orders for each customer, just by looking at differences of Order Date values between rows.
That can be achieved by lag function. Let’s calculate the days since the previous order by typing in this expression in a mutate step.
`Order Date` - lag(`Order Date`)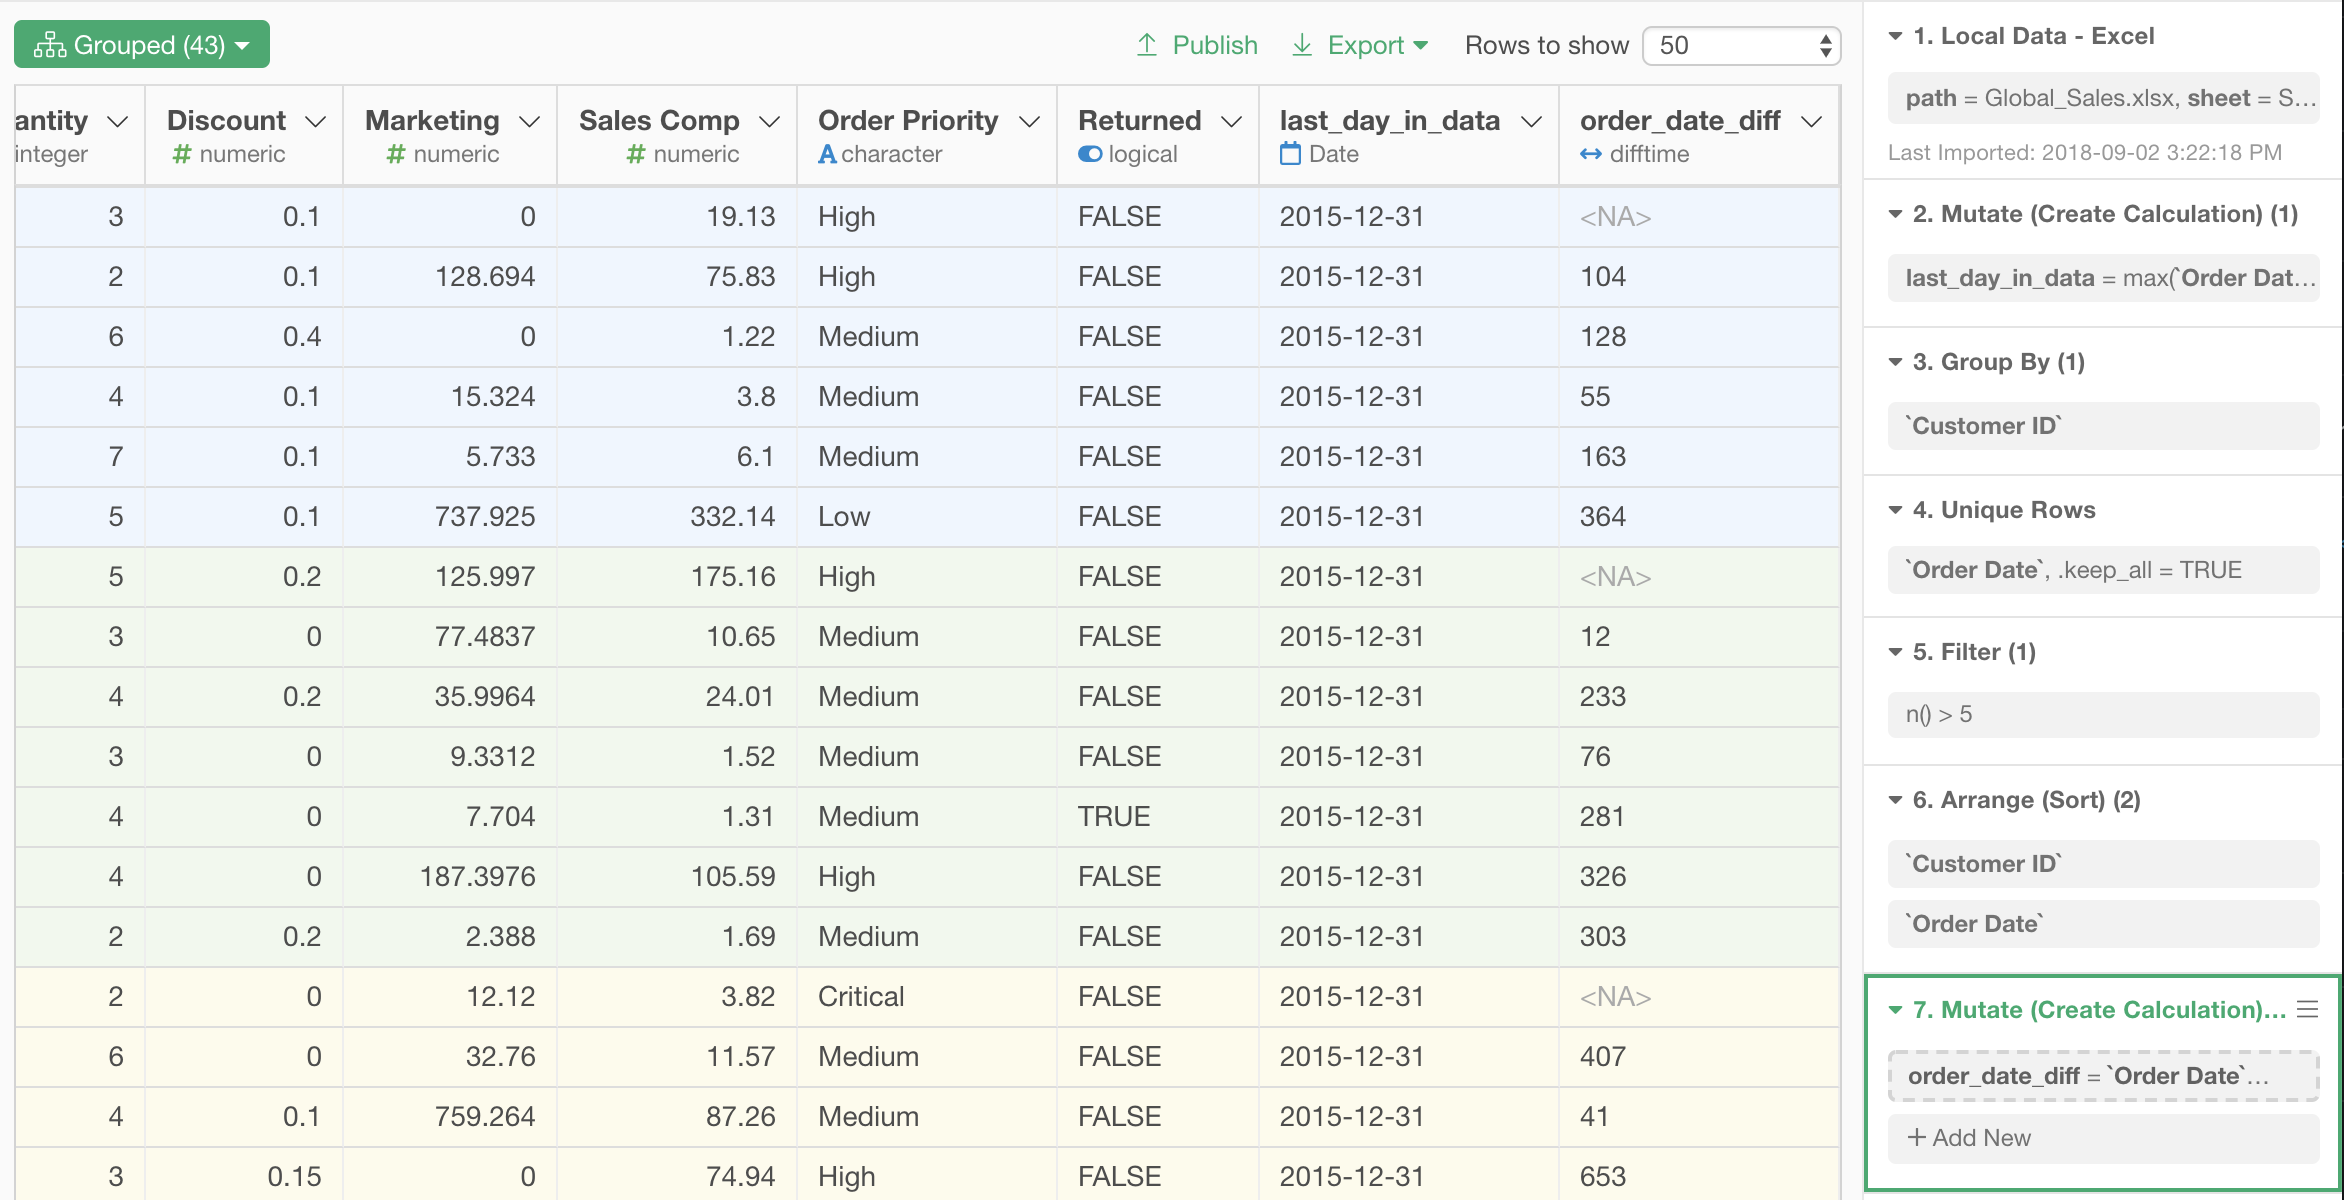
Remove Rows with Order Intervals of NAs
You might have noticed that there are some rows with NAs on order_date_diff column. This happens for the first order of a customer, because there is no previous order for the first order, and it is impossible to calculate order_date_diff for those rows. Let’s remove these rows with a filter step.
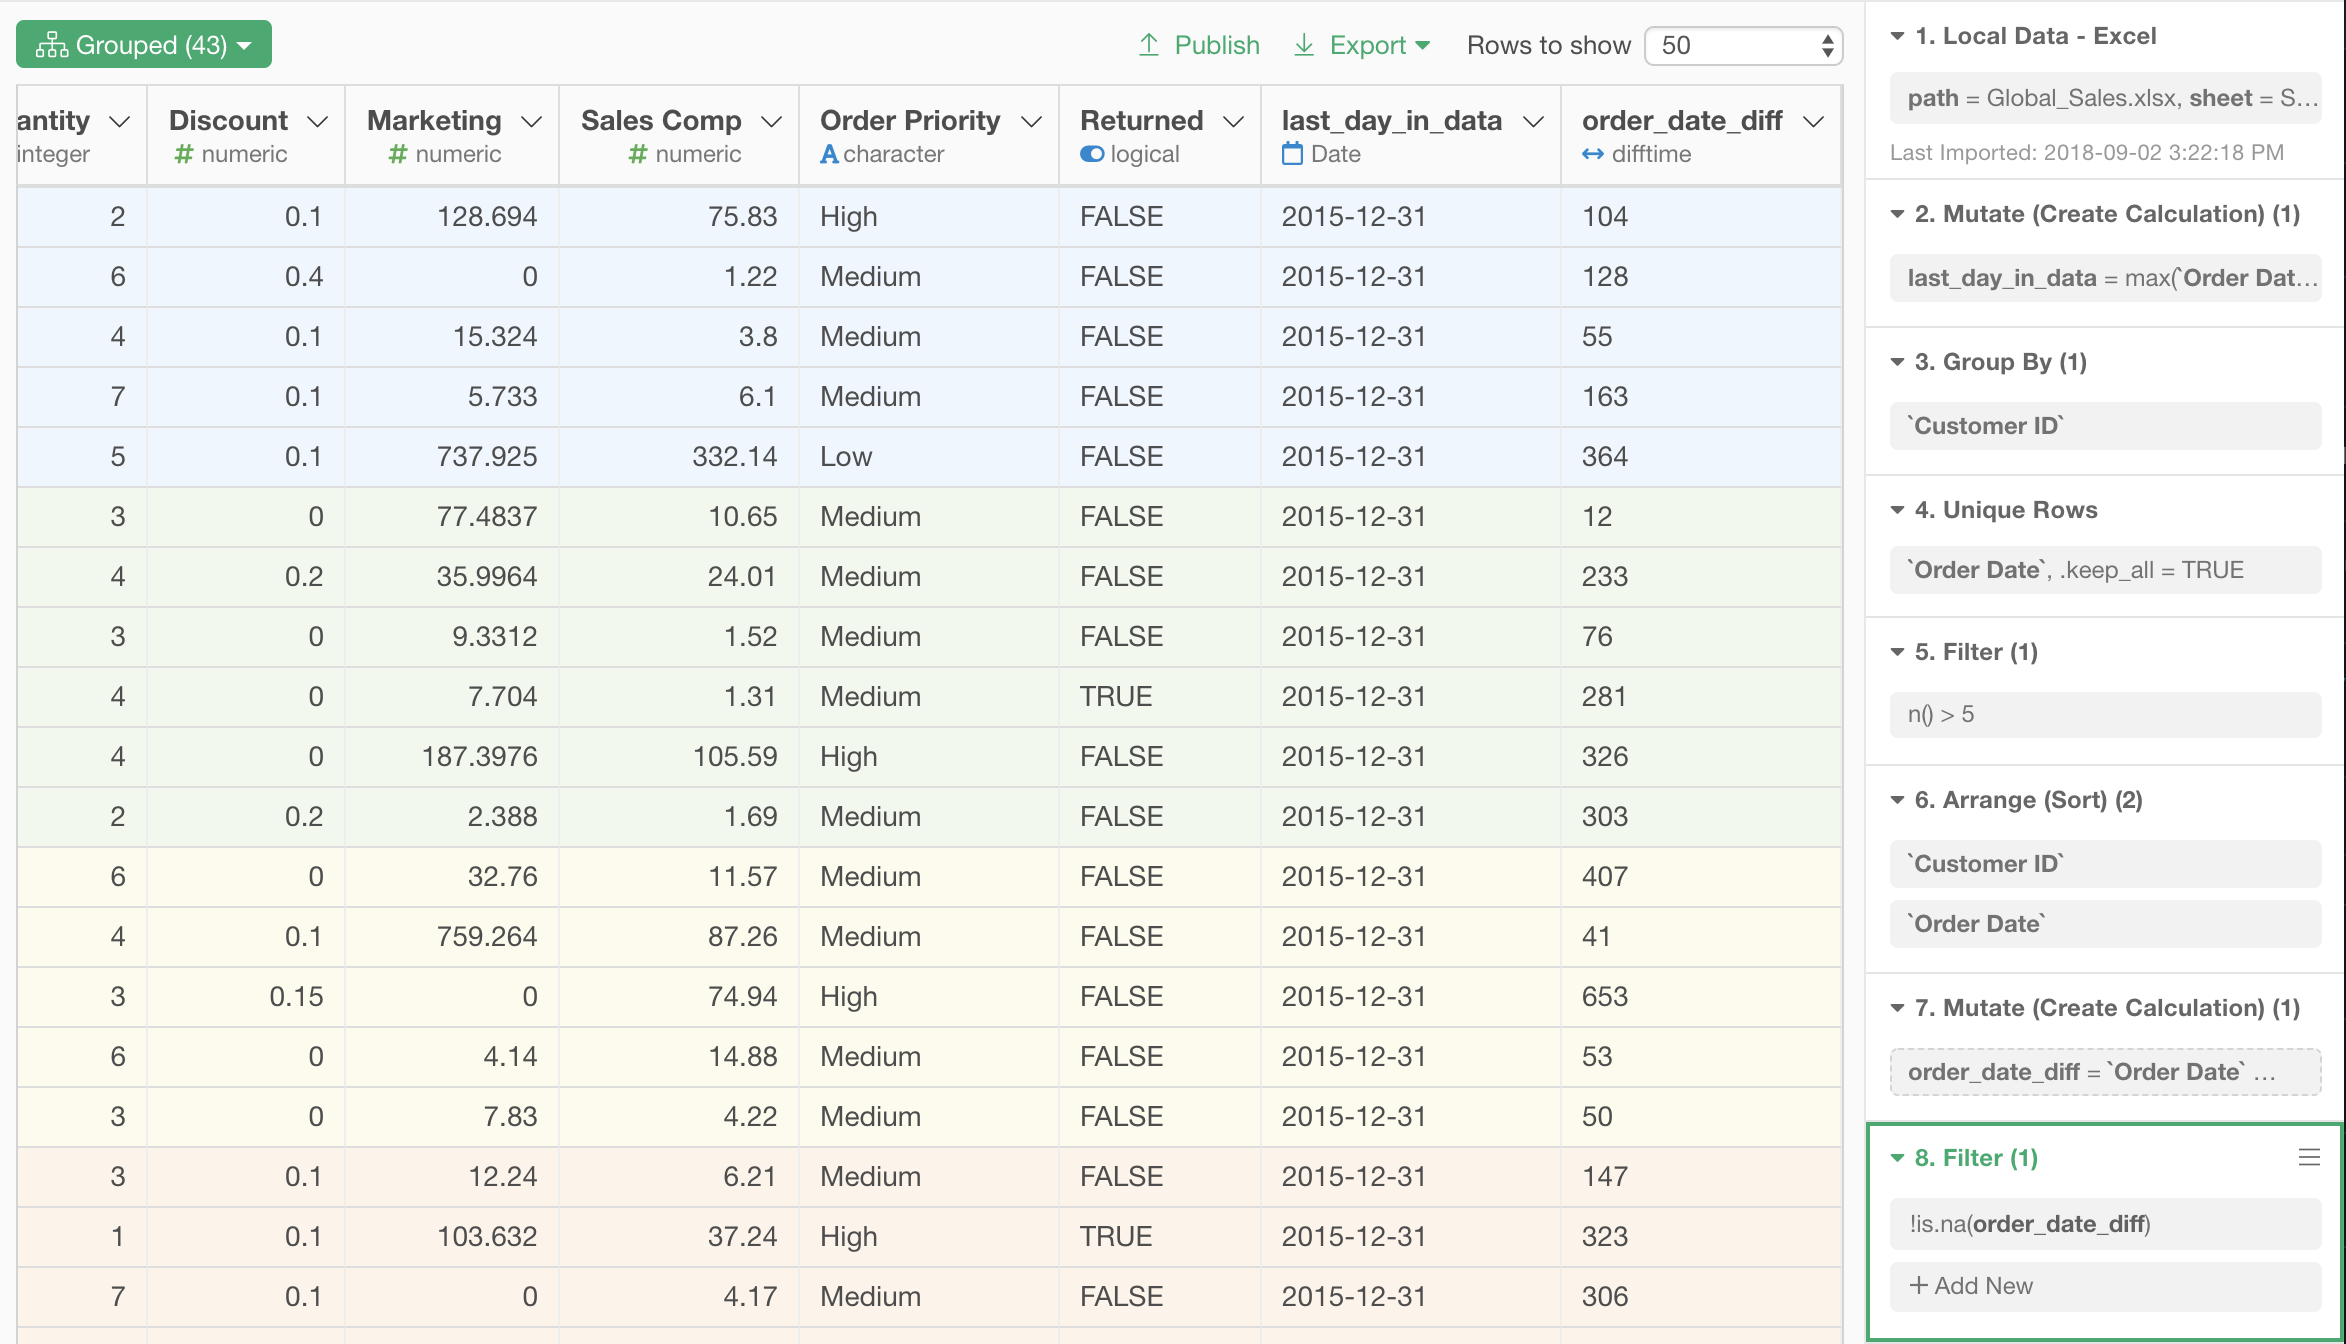
Now we have order interval data for each customer.
Calculate 90 Percentile of Order Intervals for Each Customer
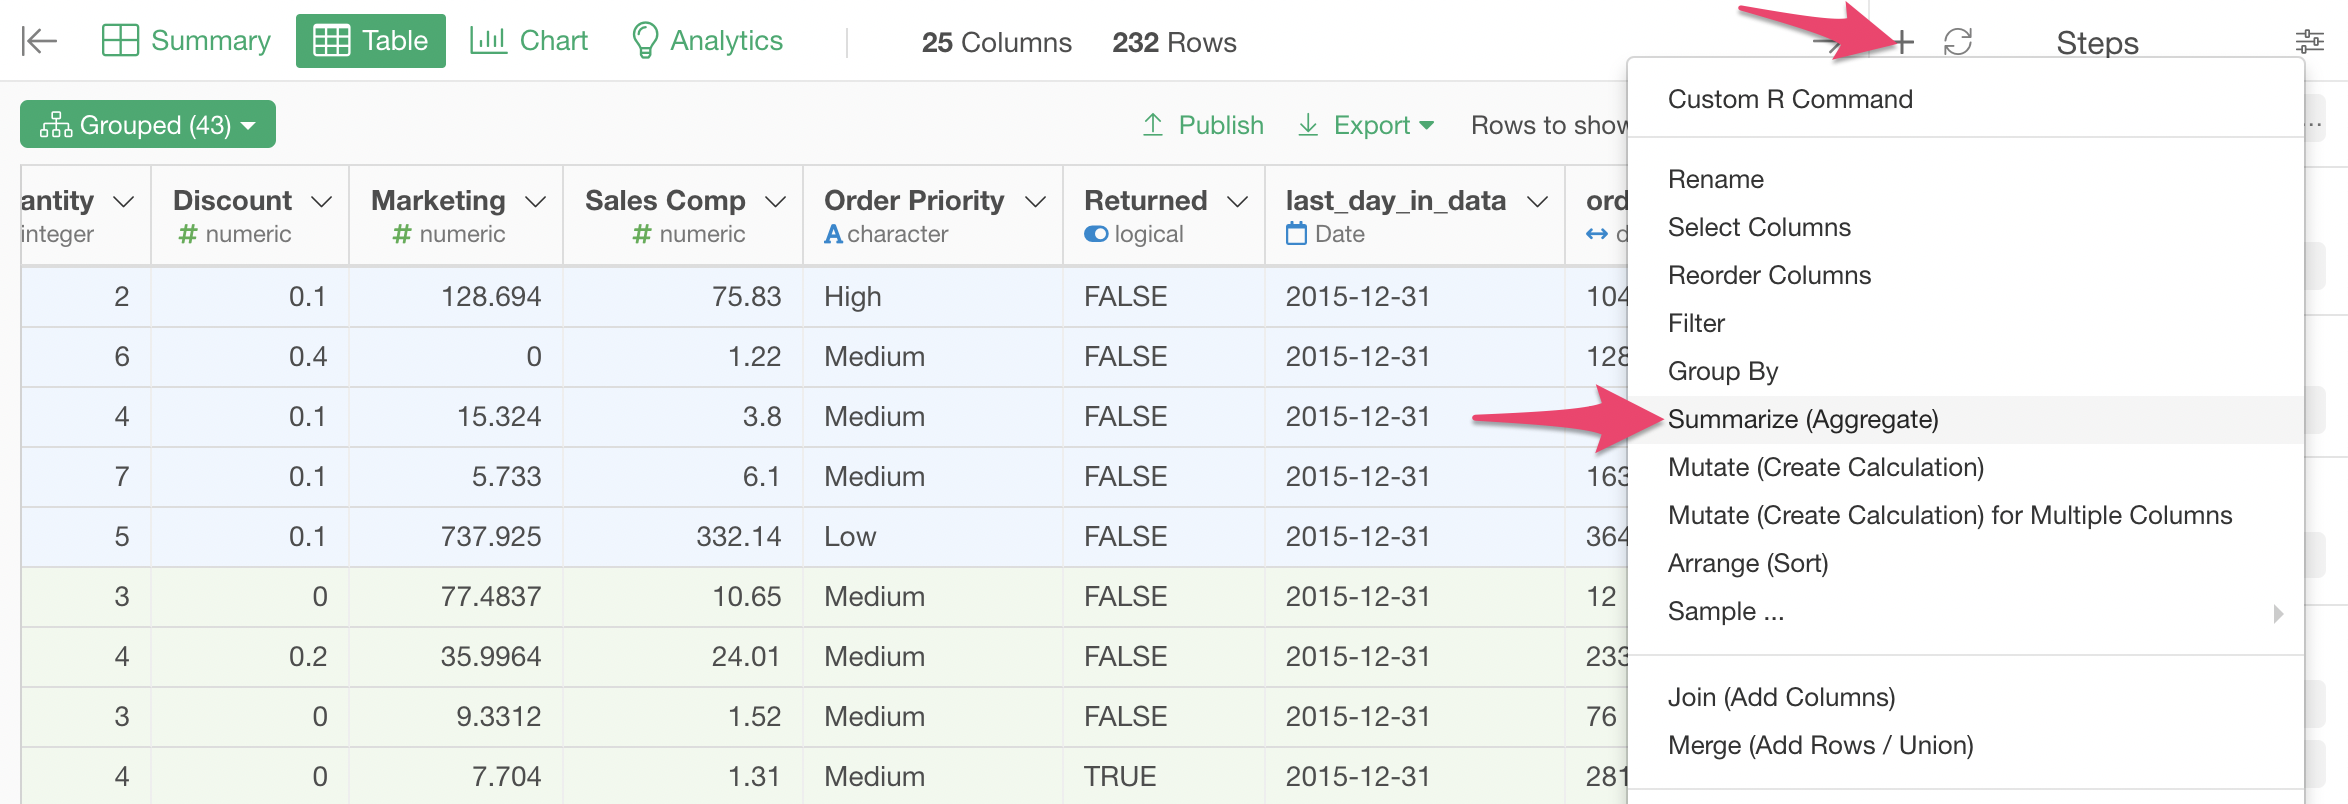
Now, we are finally ready to calculate 90 percentile of each customer’s order interval, which we were to use as the criteria of churn!
We are going to use quantile function as a custom aggregation function of a Summarize step to do this. Follow the menu like the screenshot to open Summarize step dialog.
Select (Custom) as Value. Set “percentile_90” as the name of the newly created column to hold the result, and type in the following expression in the text area.
quantile(order_date_diff, 0.9)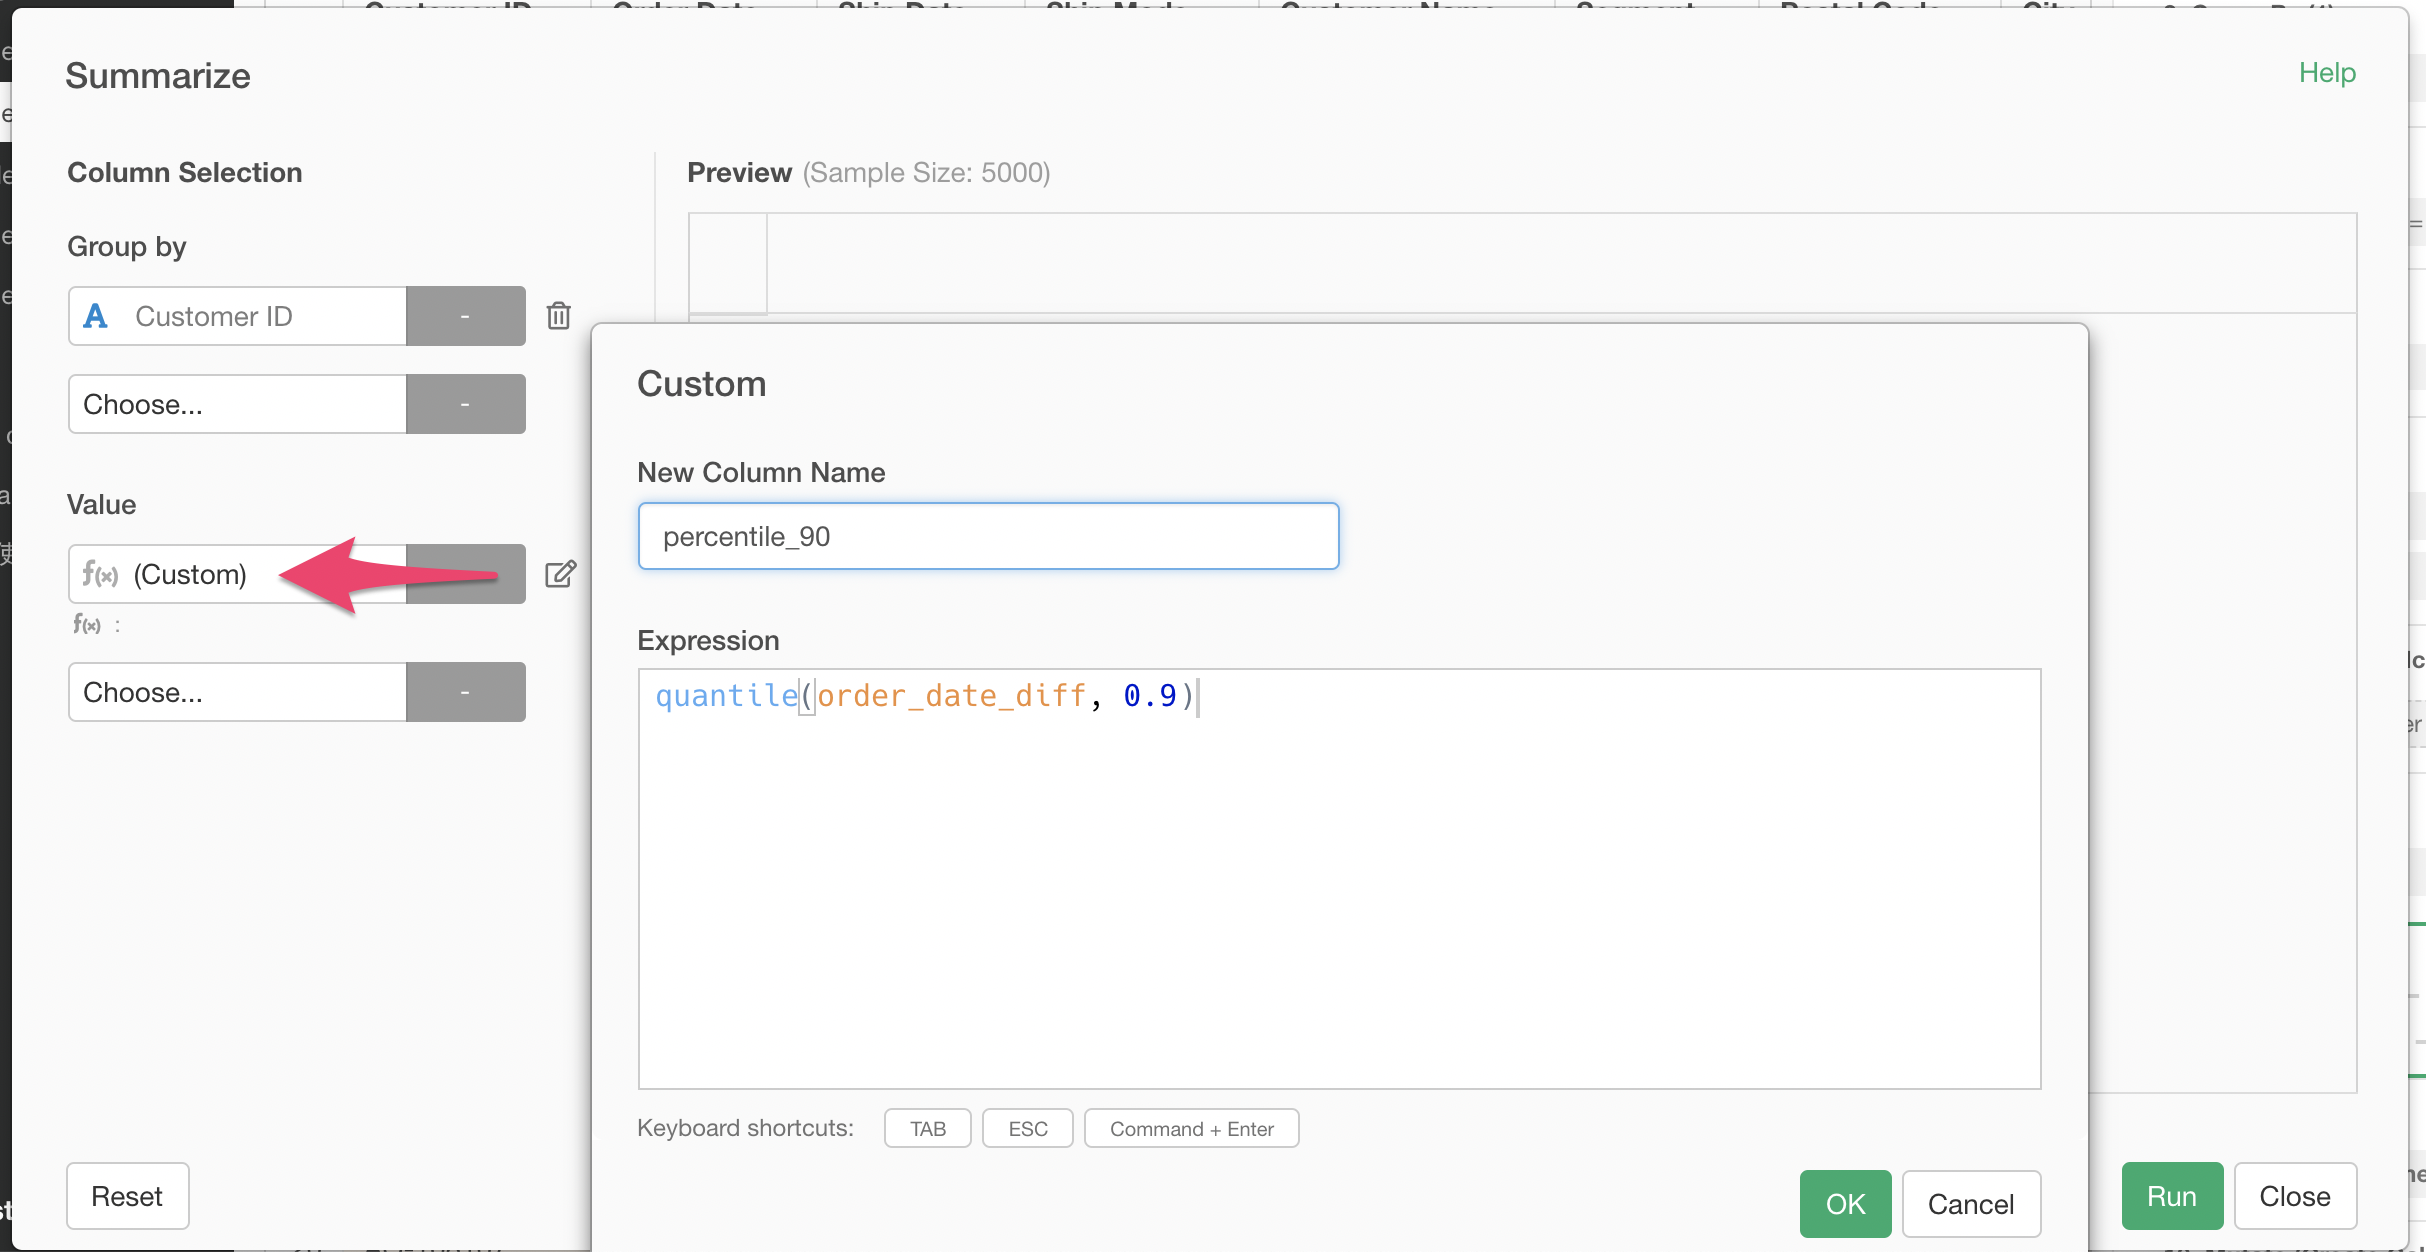
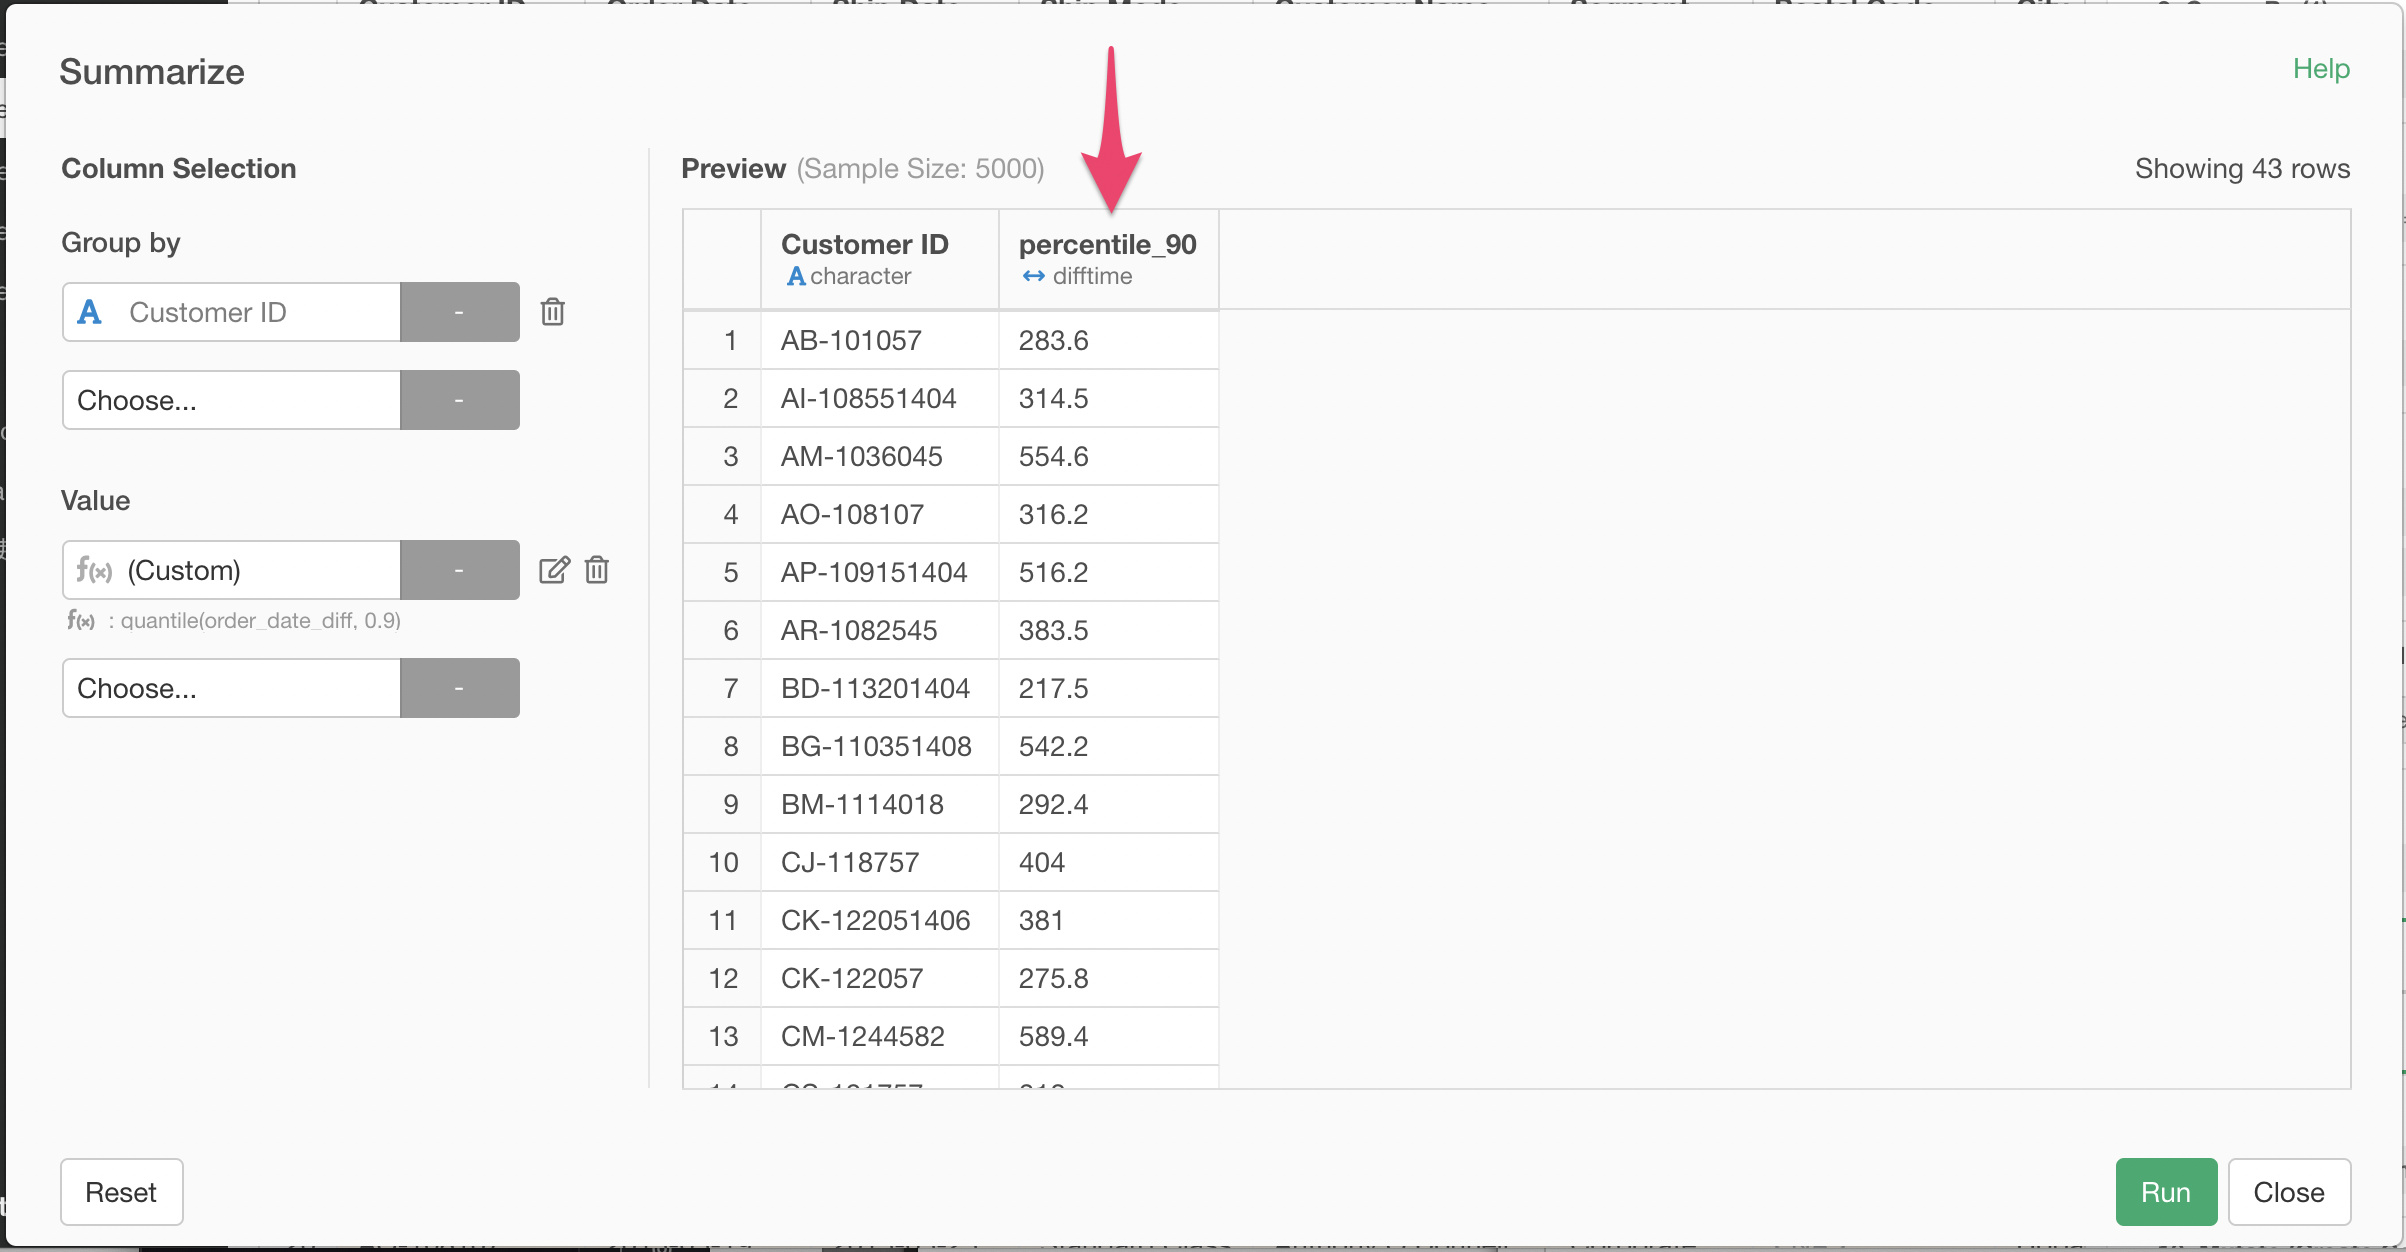
Because of the effect of grouping on Customer ID, this gives us 90 percentile of order intervals for each customer.
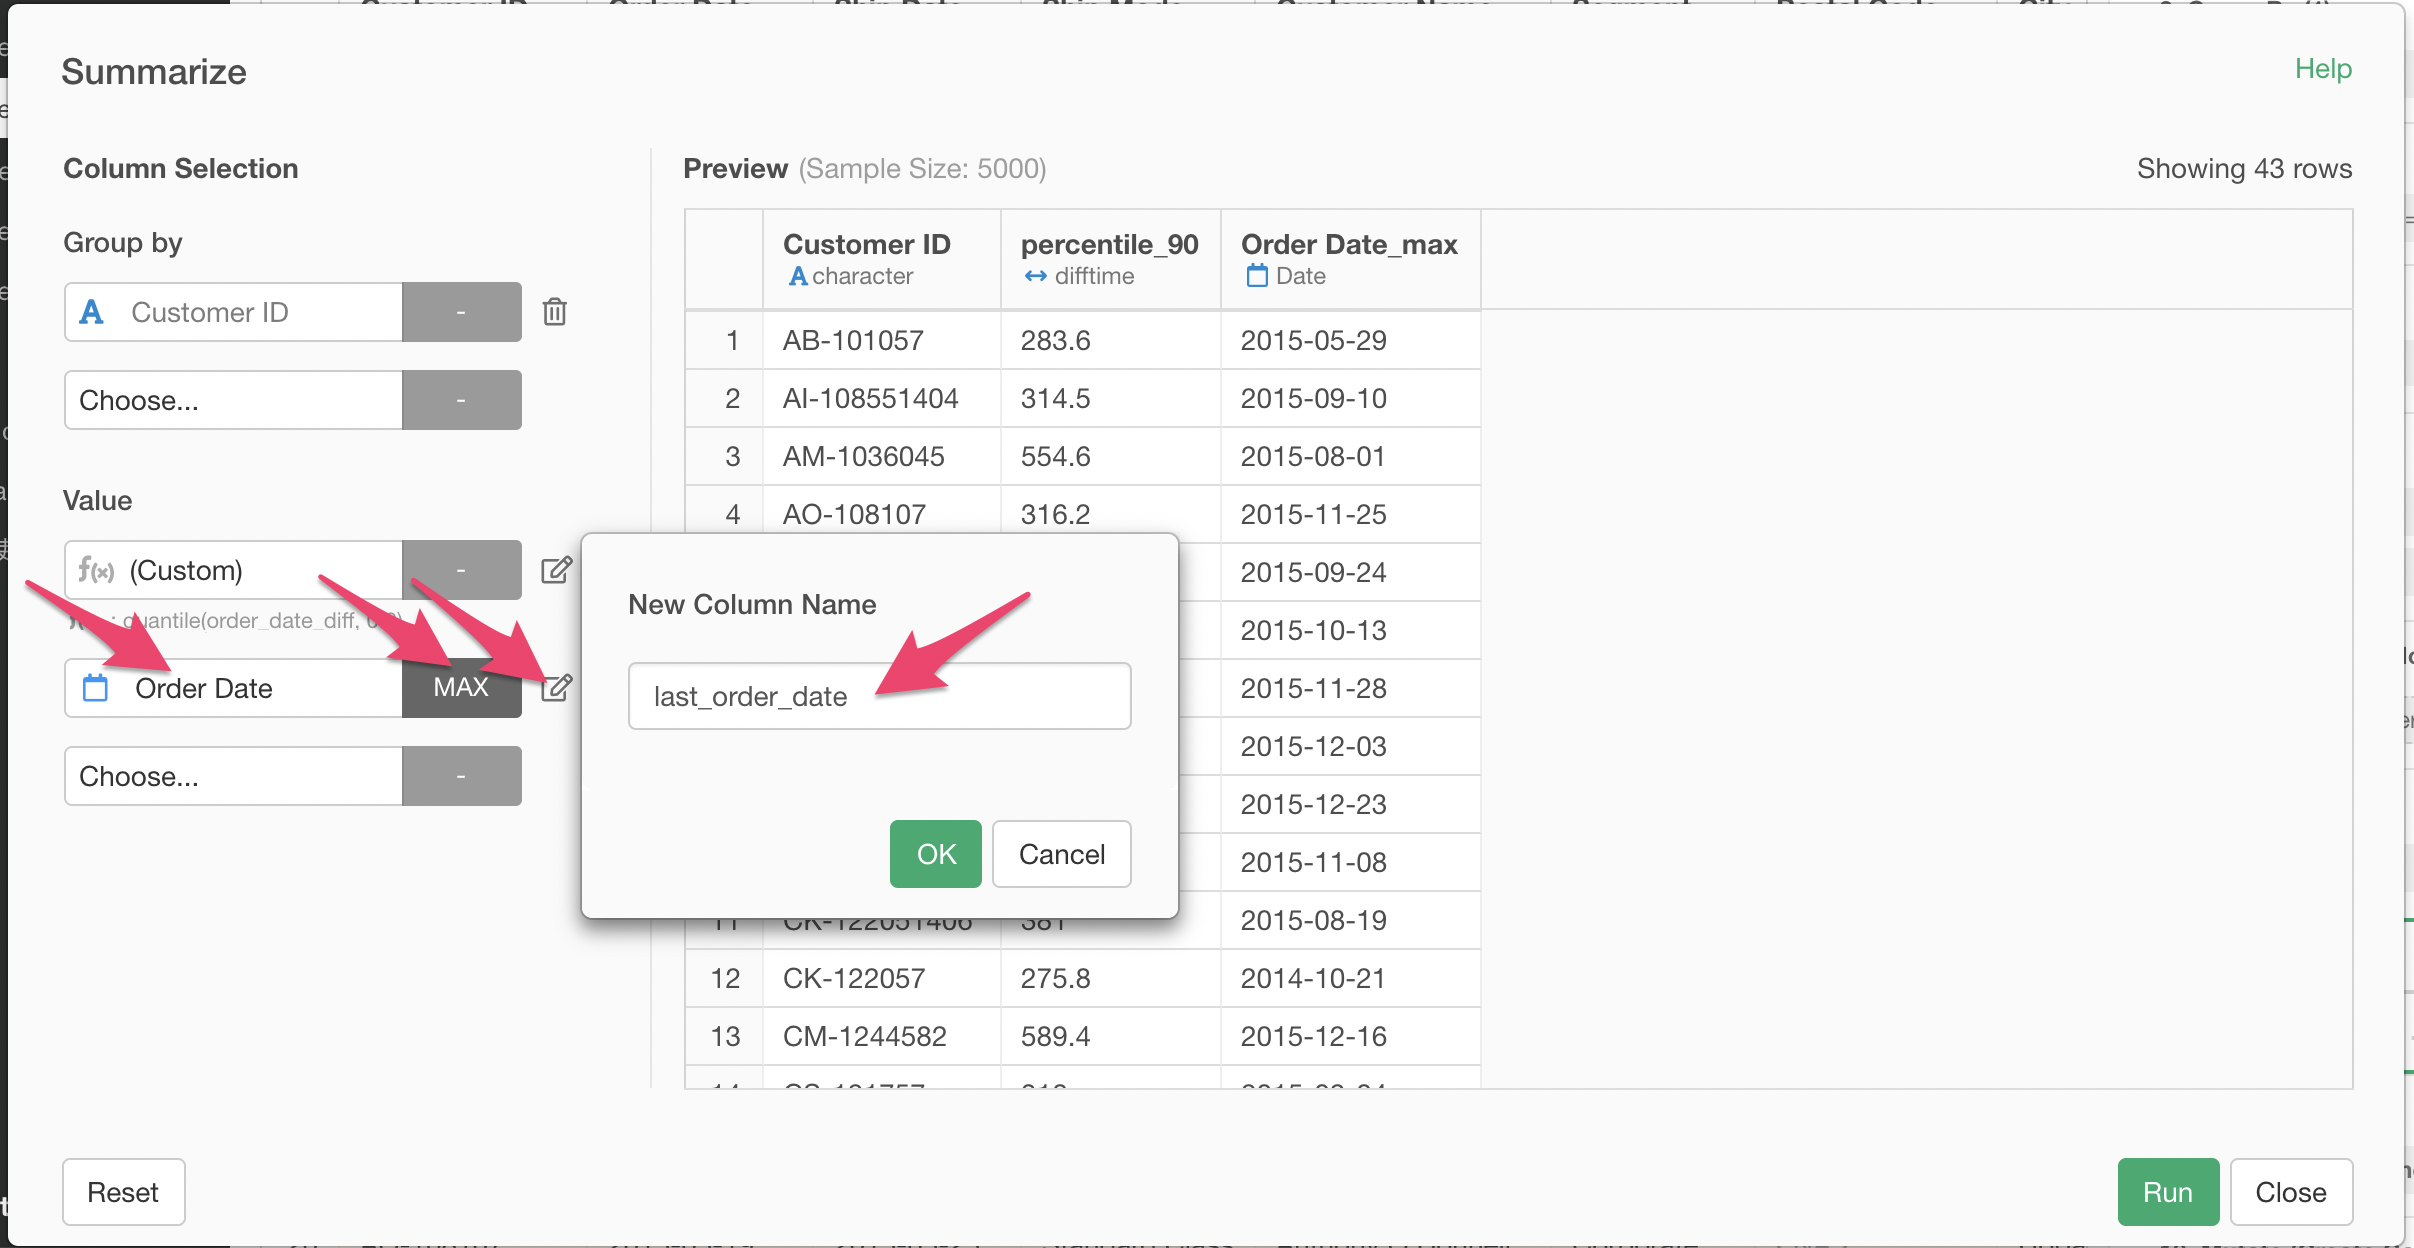
Keep the Last Order Date of Each Customer
Let’s keep the last order date of each customer in the result of this summarize step.
In the same Summarize step dialog, add Order Date column to the list of Values, and select Max (Last Date). Click the pencil icon and set the new column name to “last_order_date”.
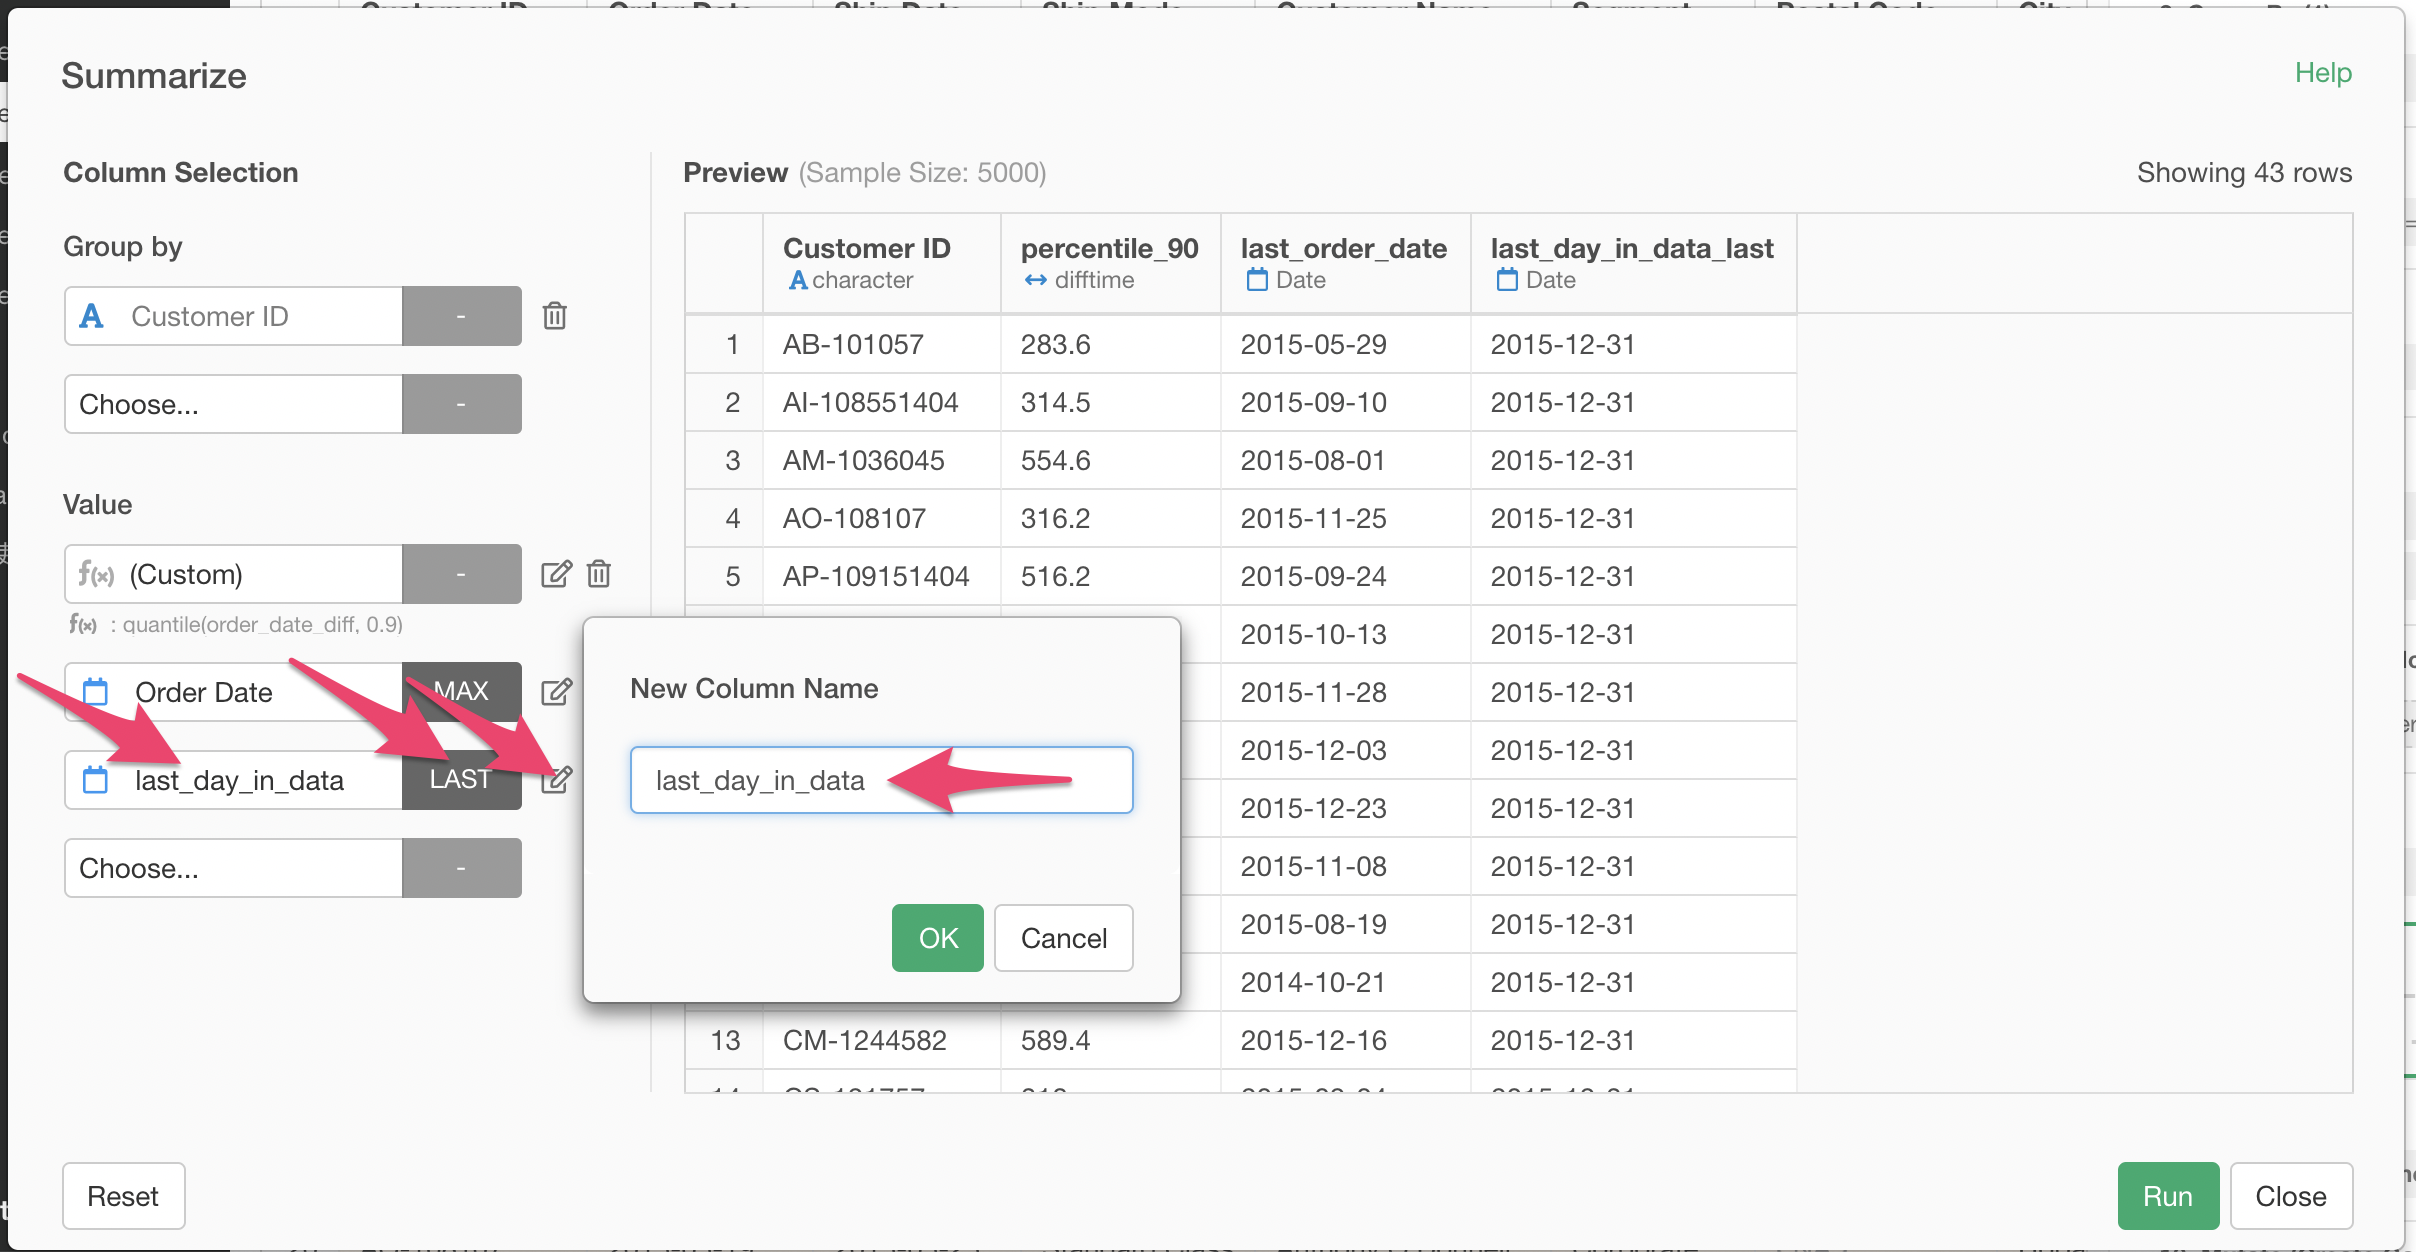
Keep the Last Date in the Entire Data
We also need to keep the last date in the entire data in the result of the summarize step, to be able to calculate the days since the last order for each customer later.
Again in the same Summarize step, select last_day_in_data column. Here, we just want to keep having the value as is in the resulting data, but we still need to specify an aggregate function. So, select Last (Last Row) as the aggregate function. Also, set the new column name to the original column name last_day_in_data, as opposed to the suggested default name, last_day_in_data_last.
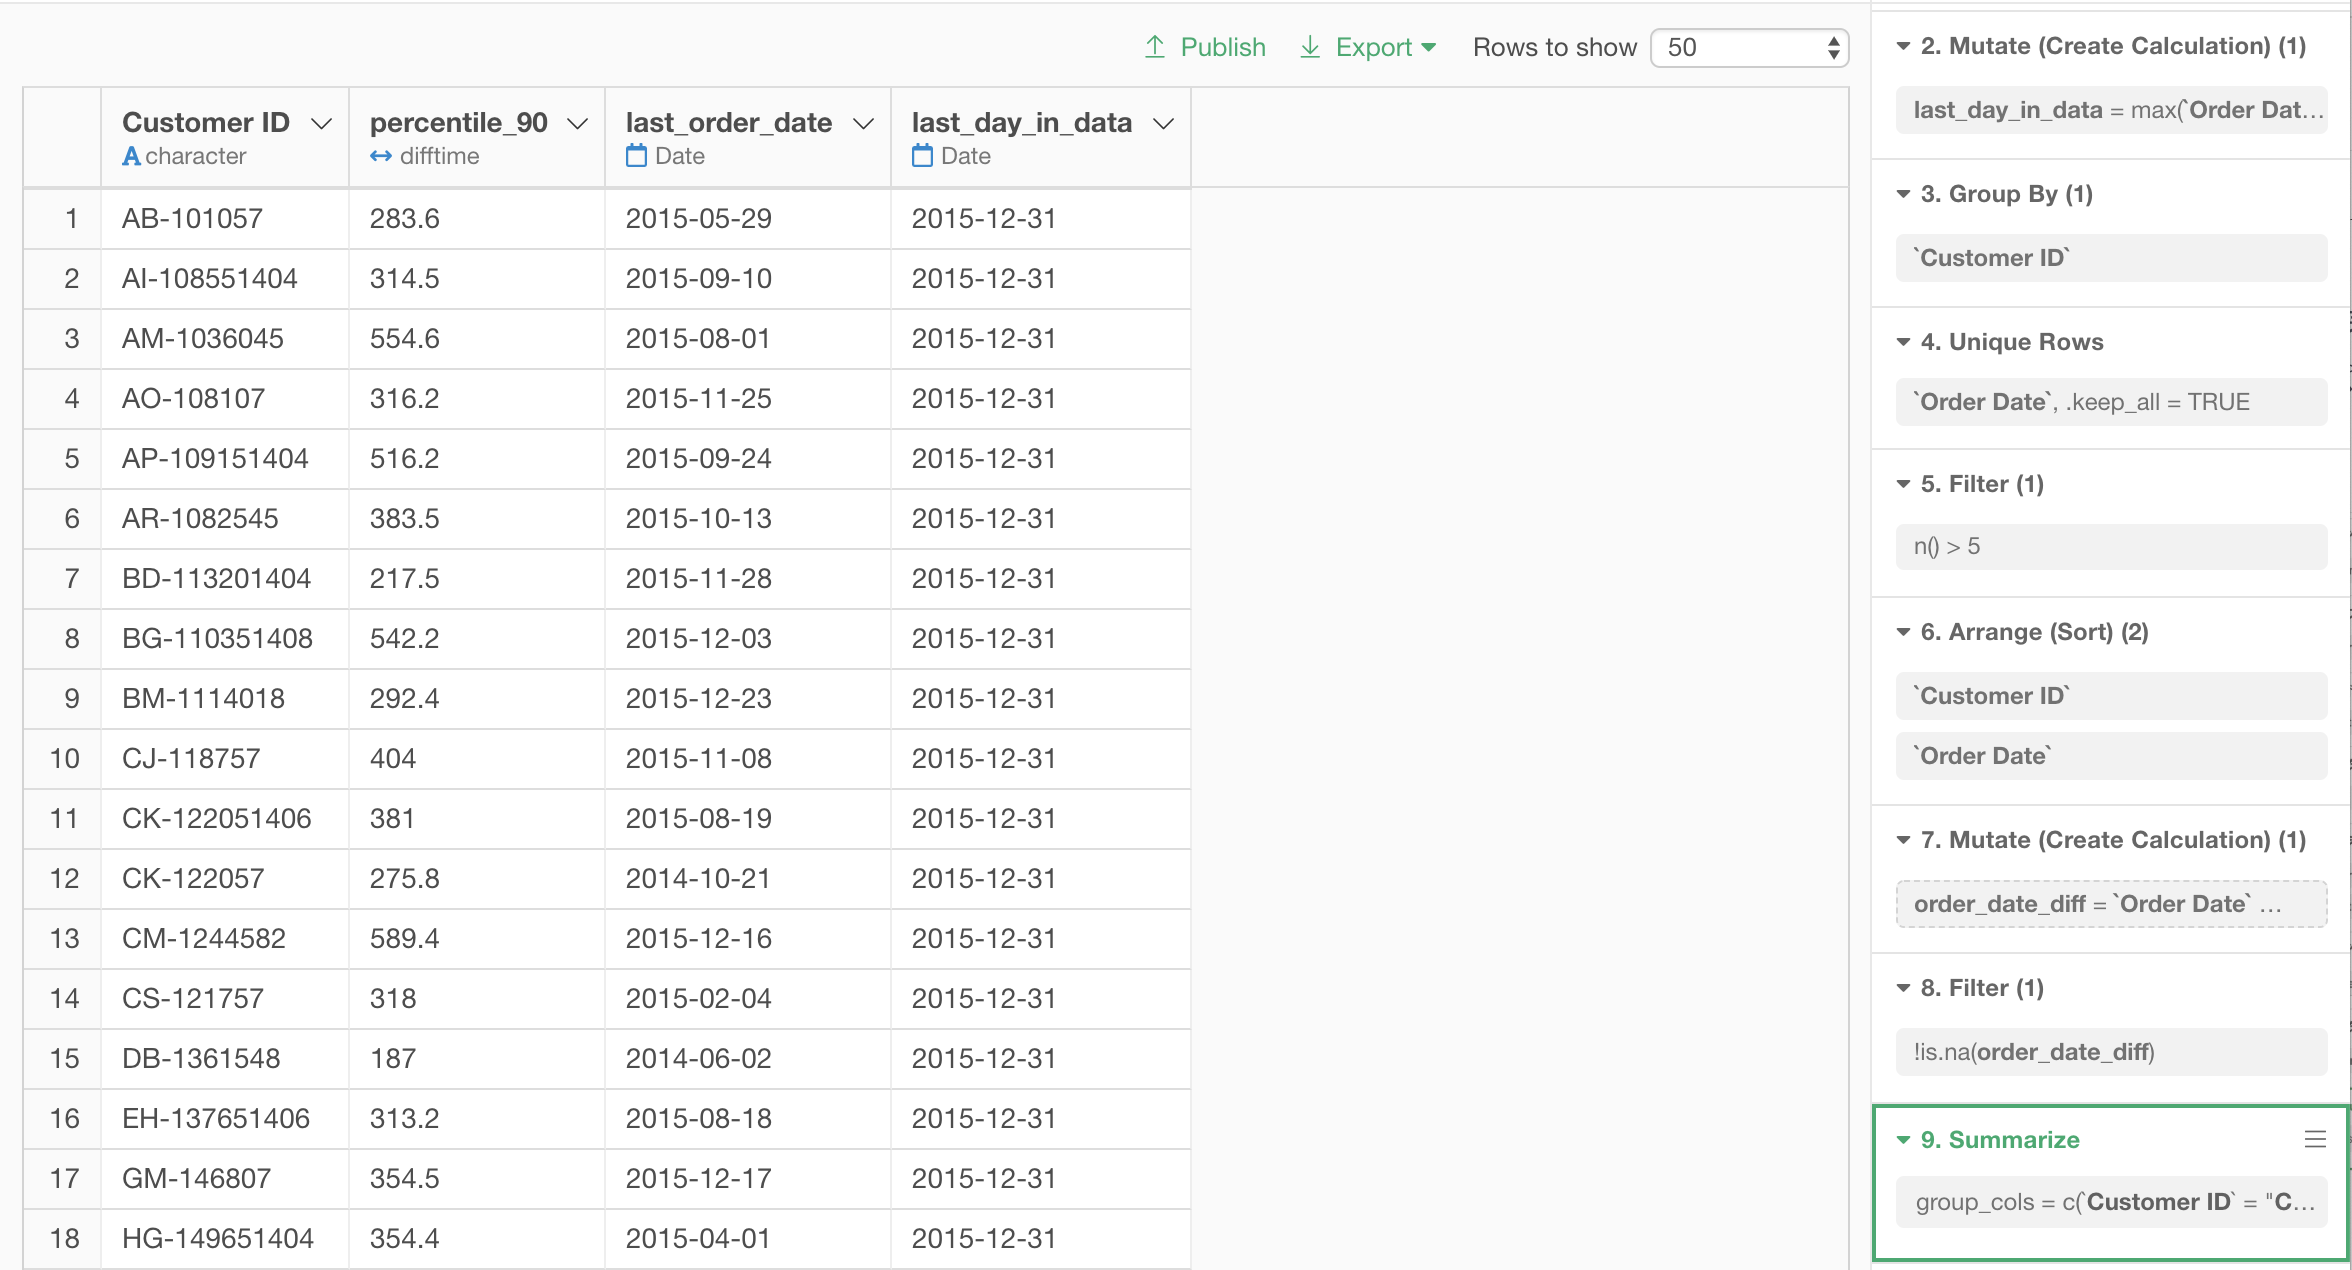
Now, after the summarize step, one row in our data represents one customer. For each customer, we have 90 percentile of order intervals, last order date, and the last day in the entire data, which is same regardless of the customer.
Calculate Days since the Last Order of Each Customer
Calculate the days from the last order of each customer to the last day of the data.
Type in the following expression to the mutate dialog.
last_day_in_data - last_order_date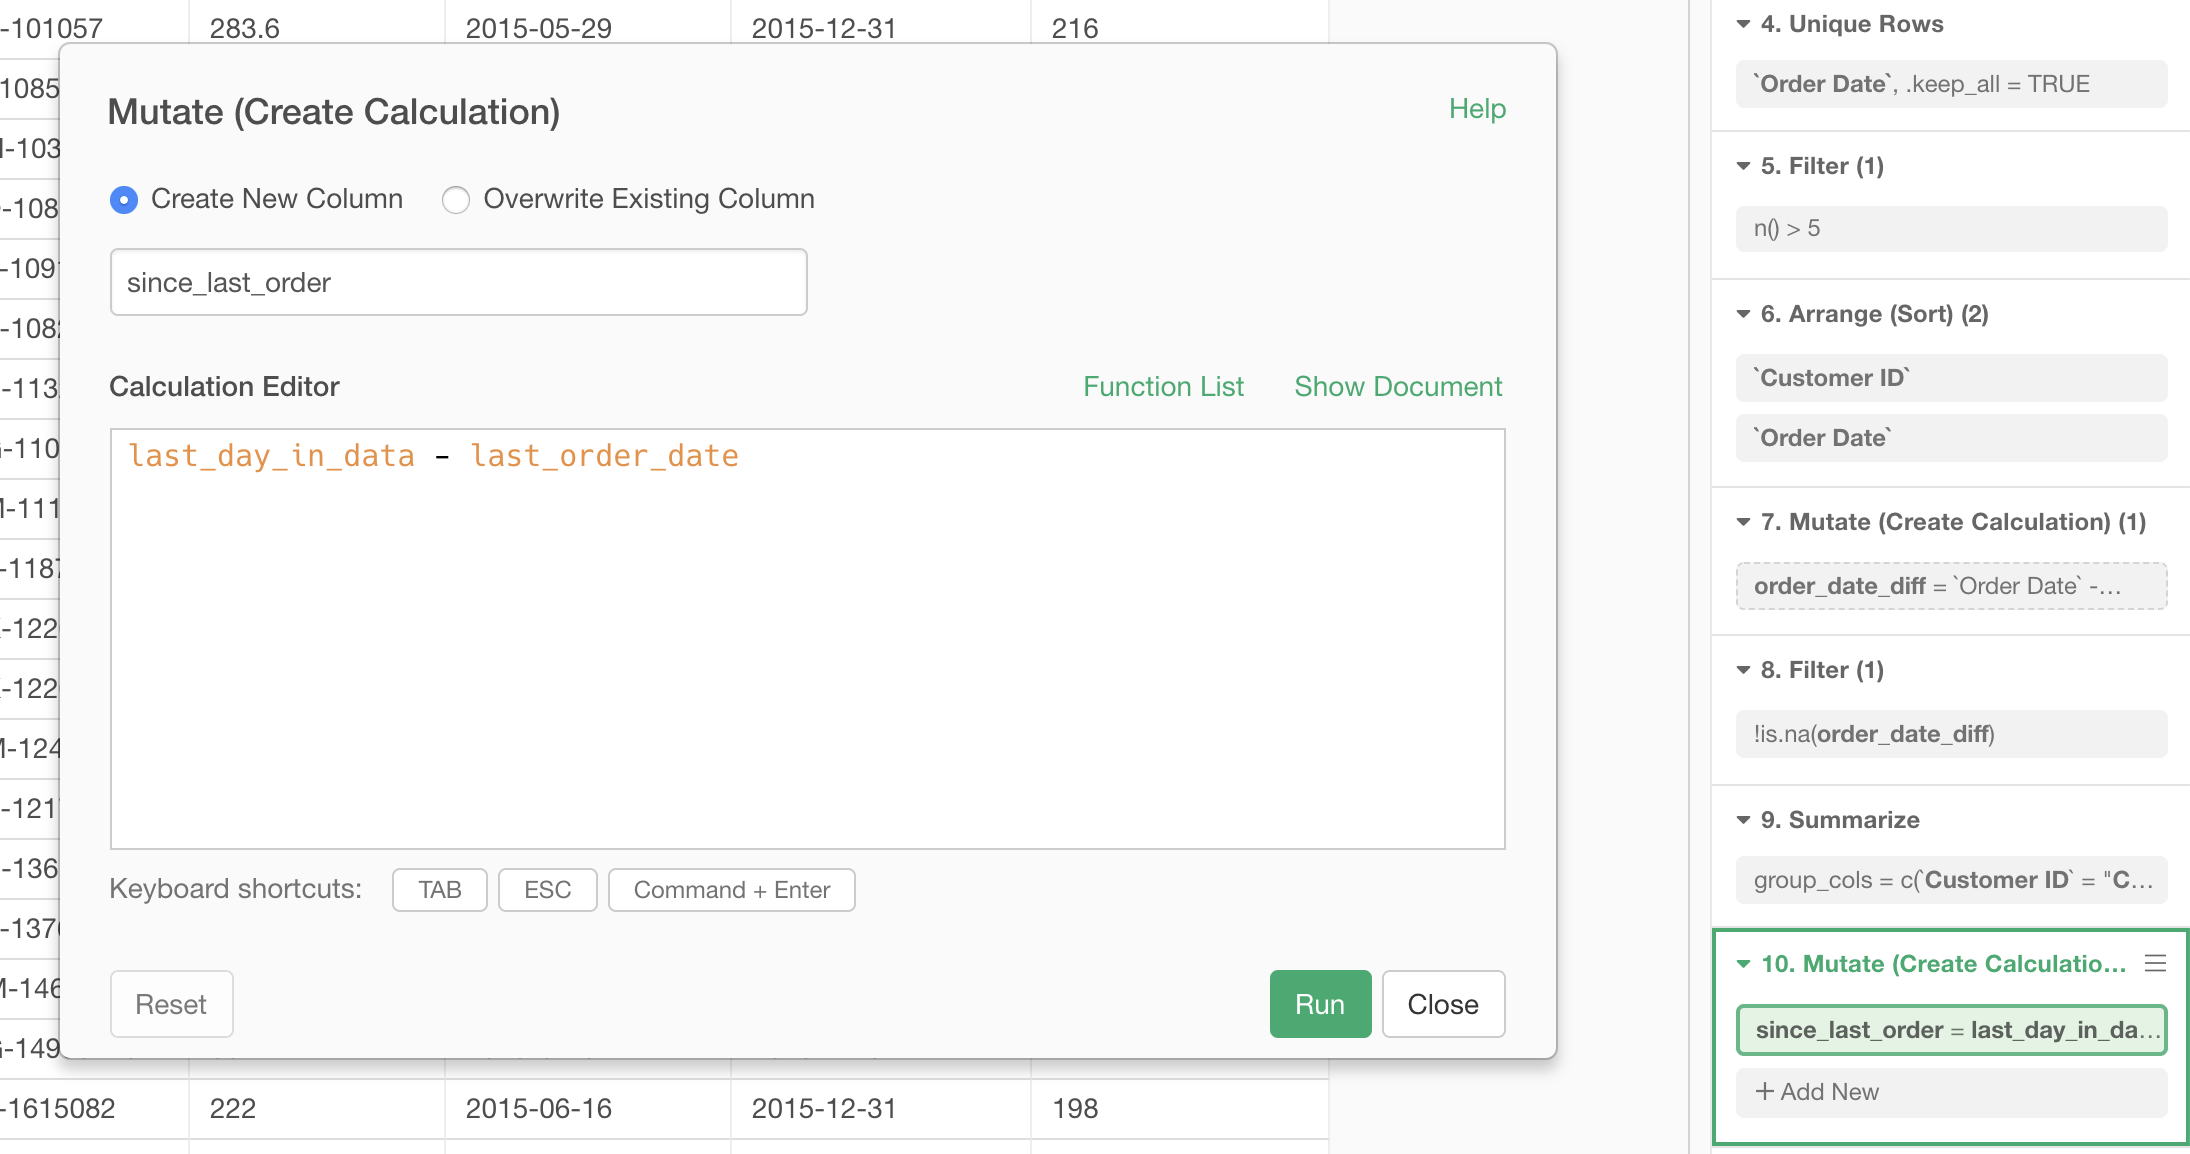
Determine the Churn of Each Customer Based on 90 Percentile of Order Interval
Compare the days since a customer’s last order with 90 percentile of his/her order intervals to determine if he/she is in the state of possible churn.
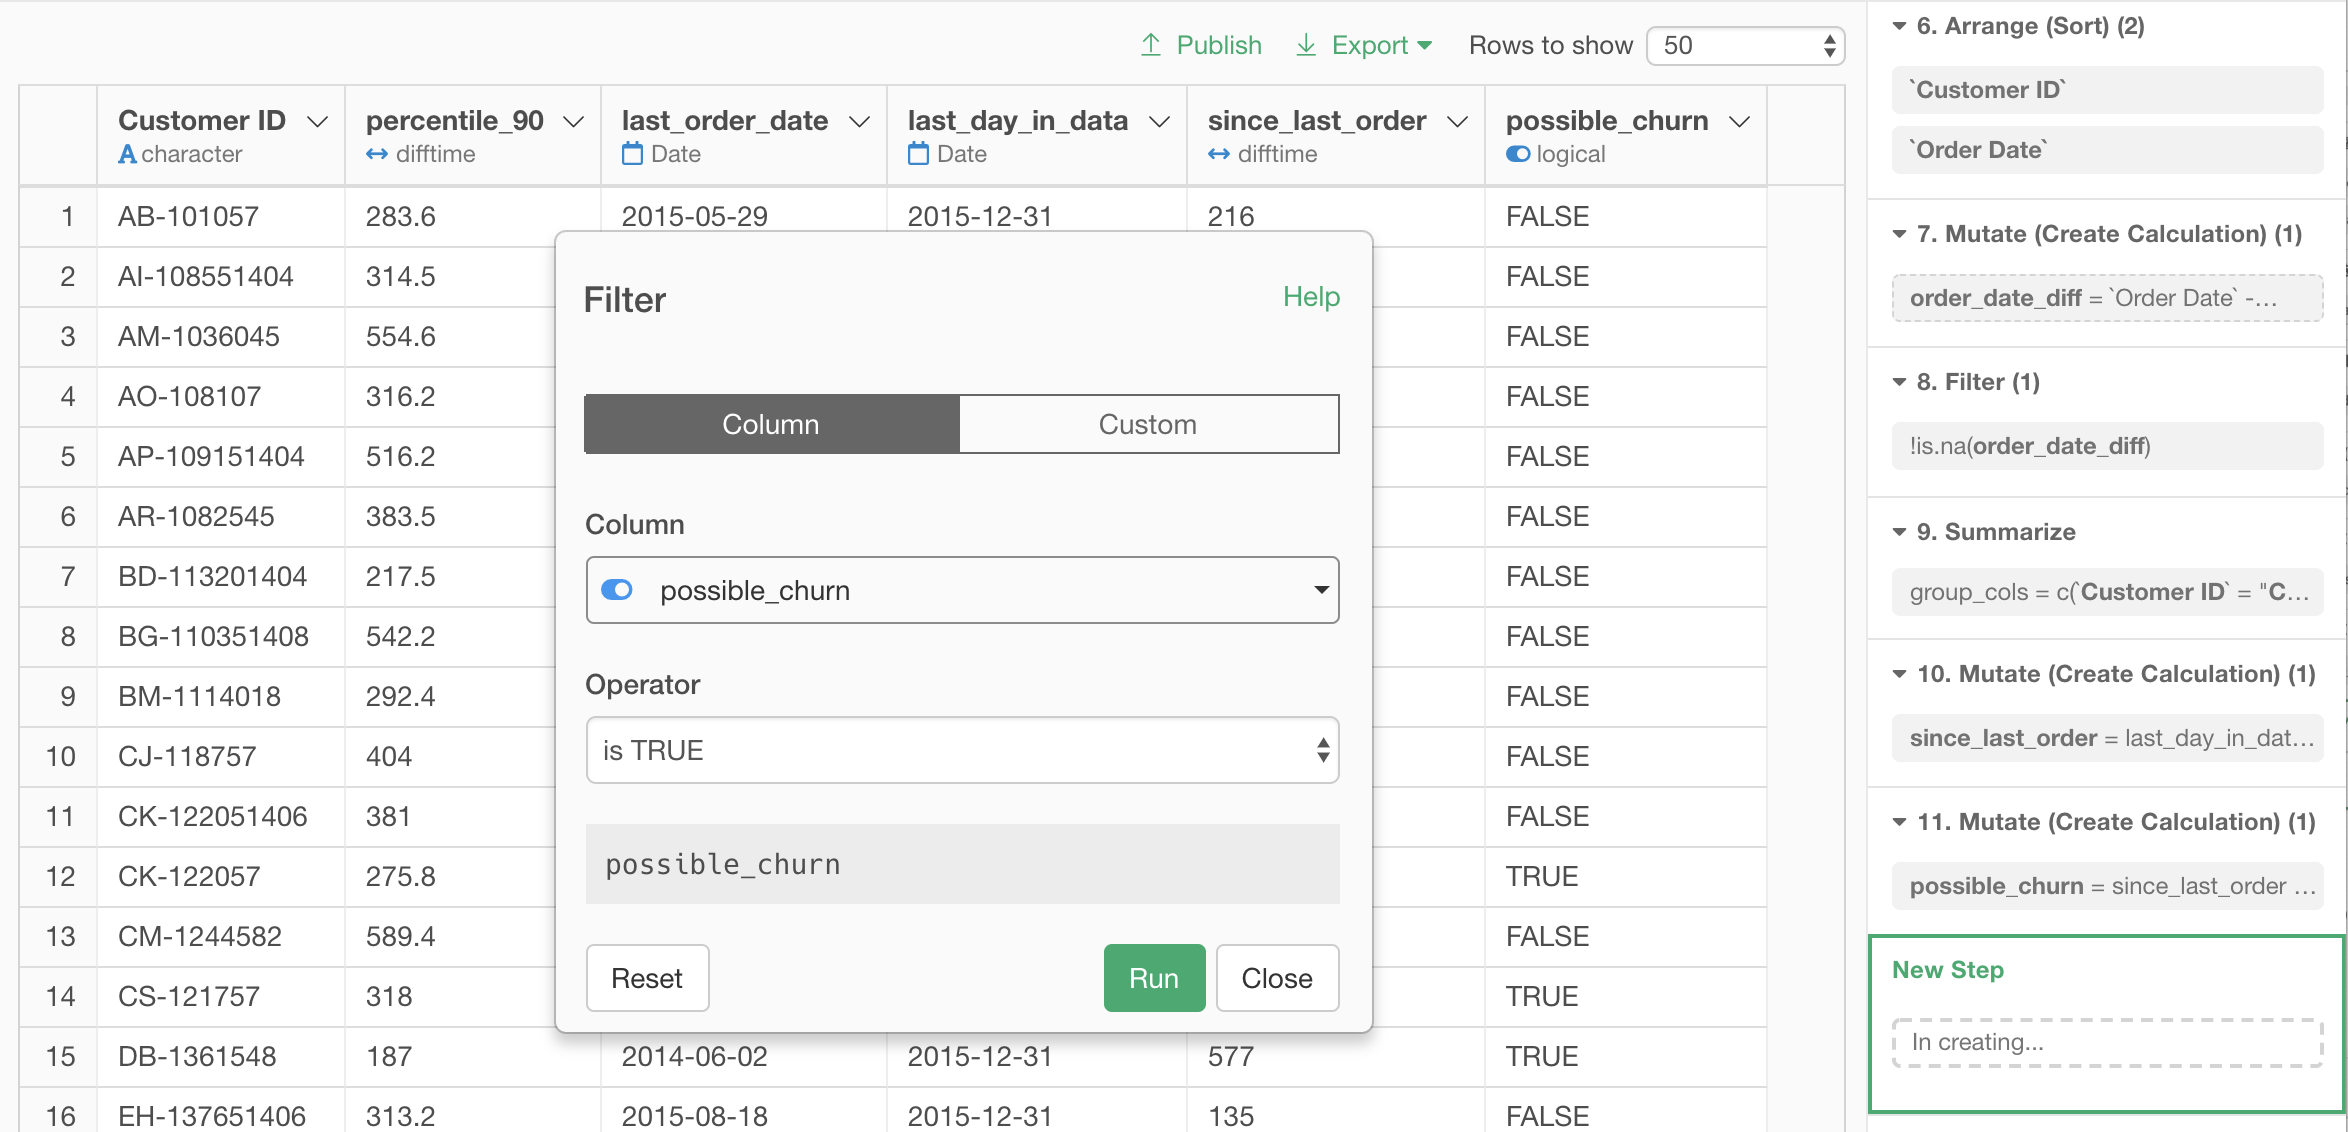
Type in the following expression to the text area of mutate dialog, and set the name of the new column possible_churn.
since_last_order > percentile_90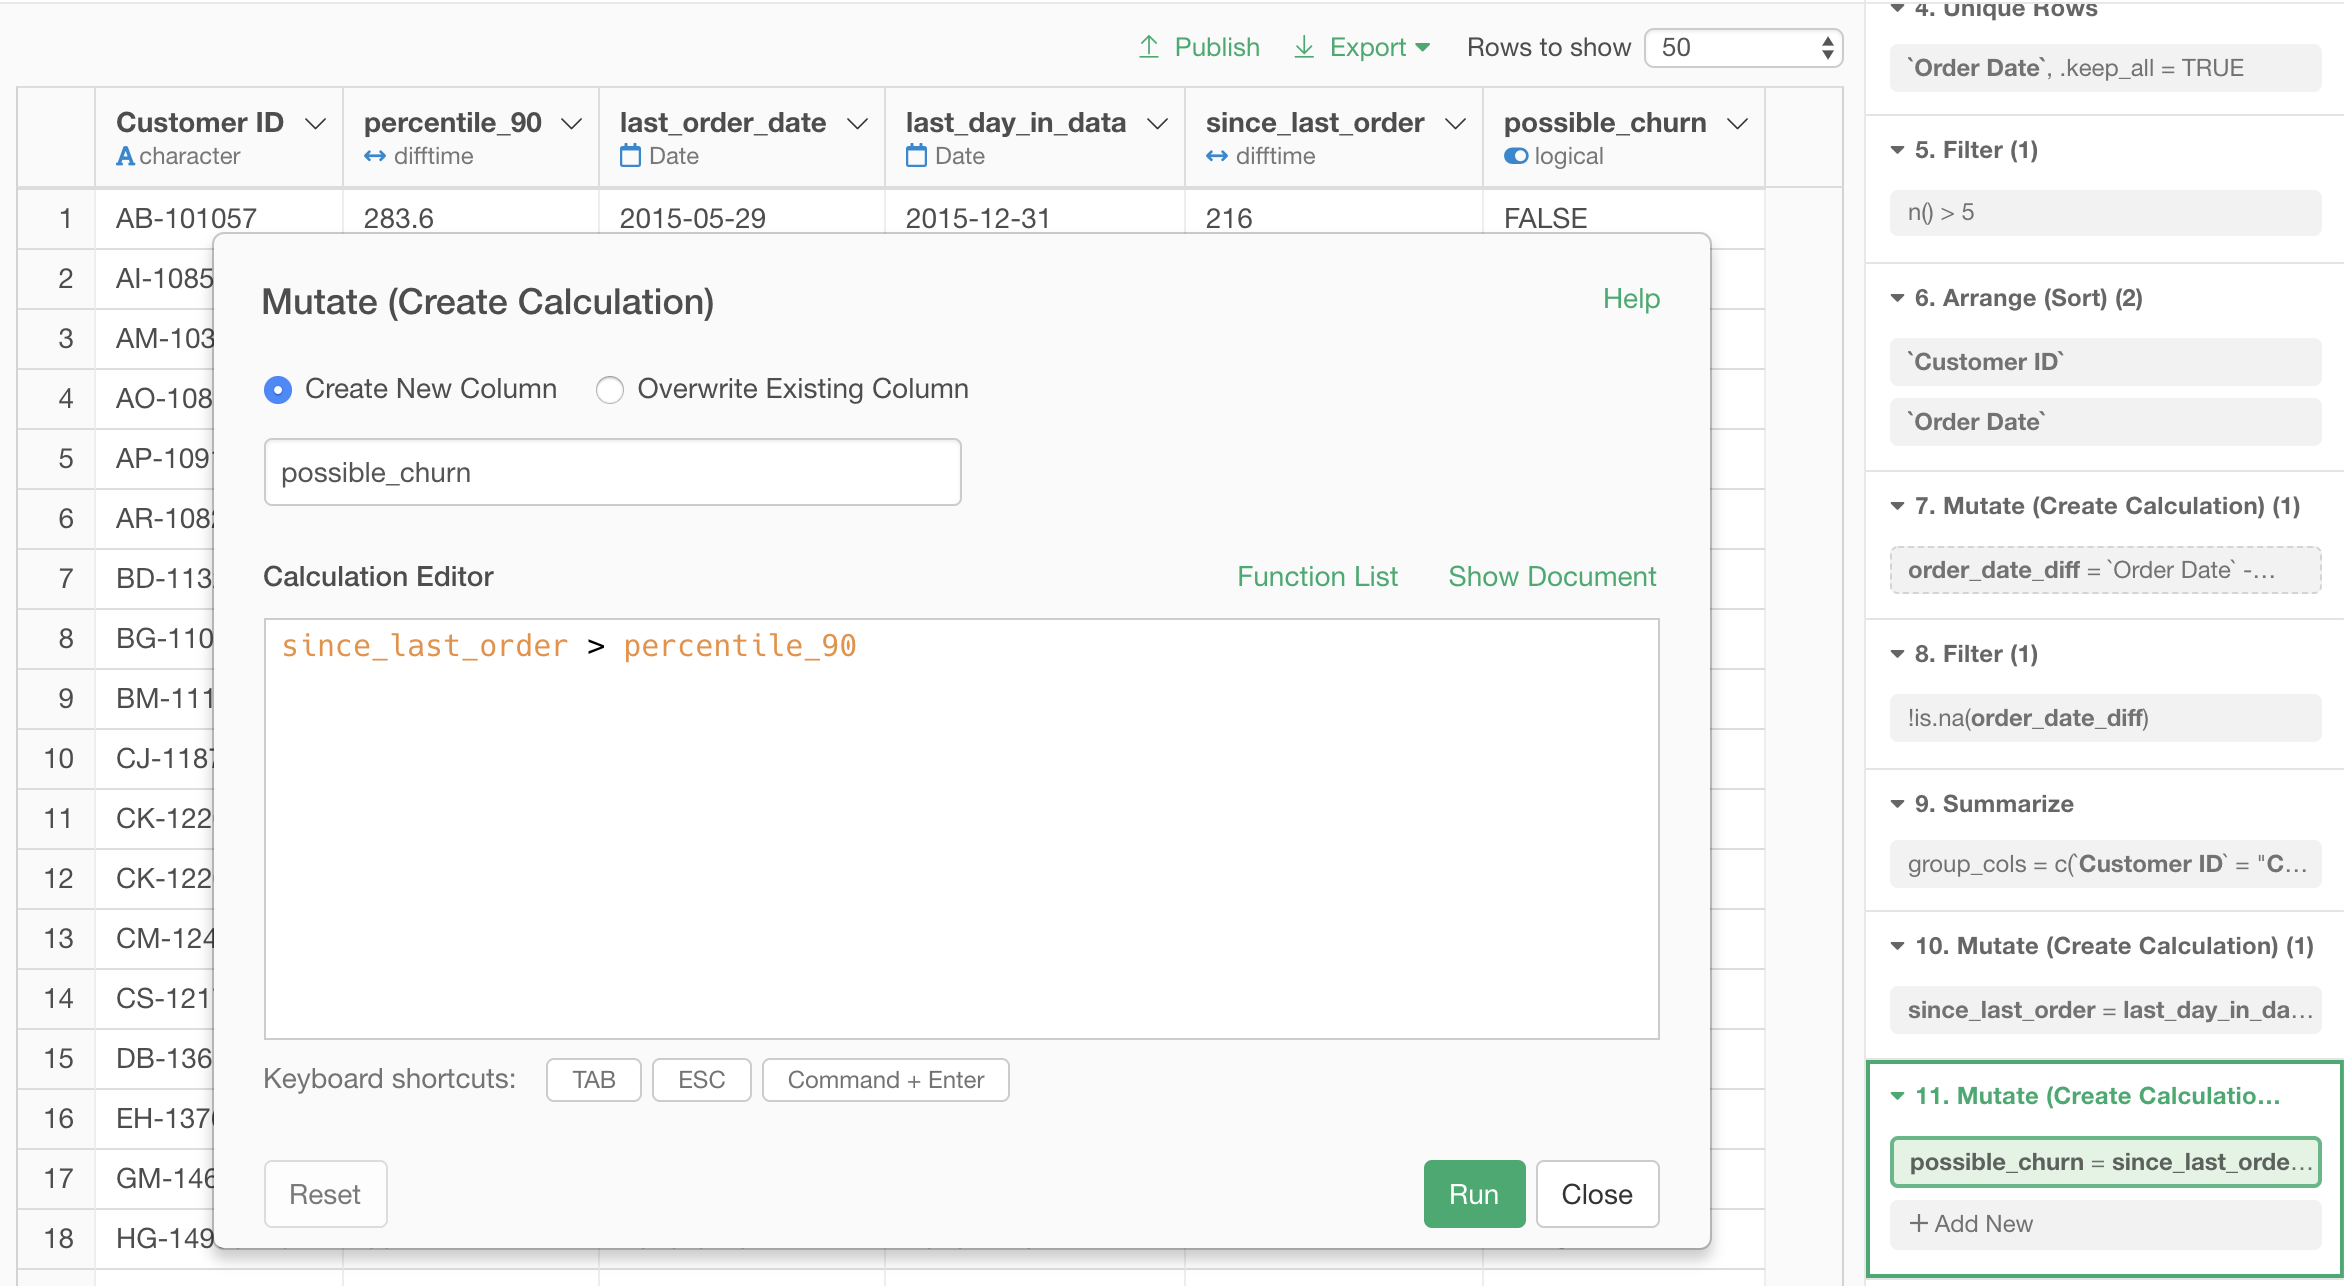
Finally, we got the decision of churn for each customer! If possible_churn is TRUE, the customer has not ordered for a period longer than his/her 90 percentile order interval, which deems him/her to be in the state of possible churn, according to our rule.
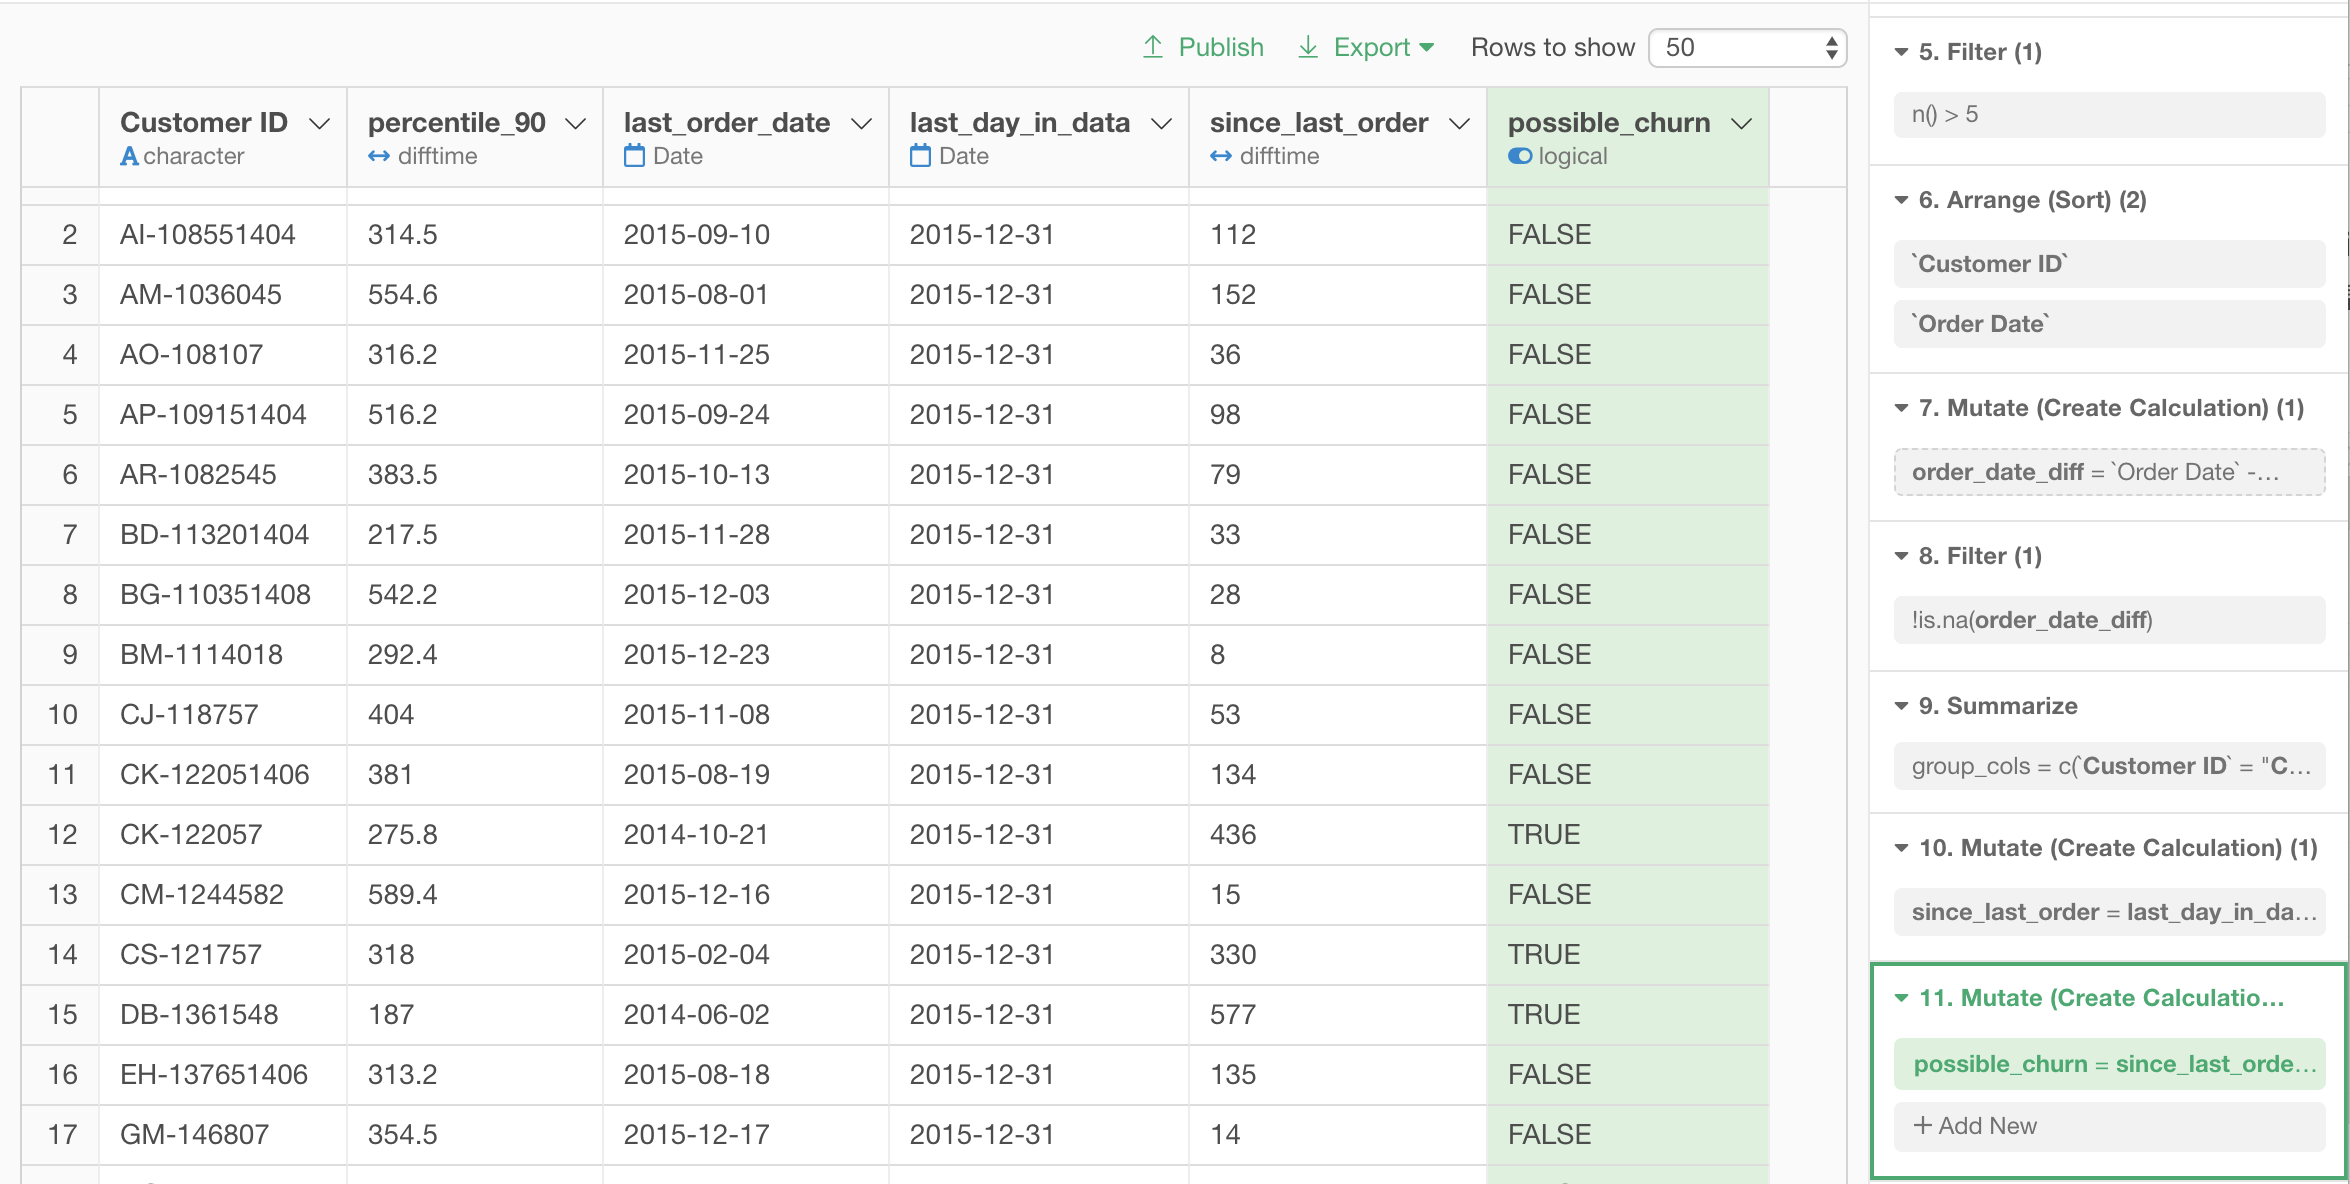
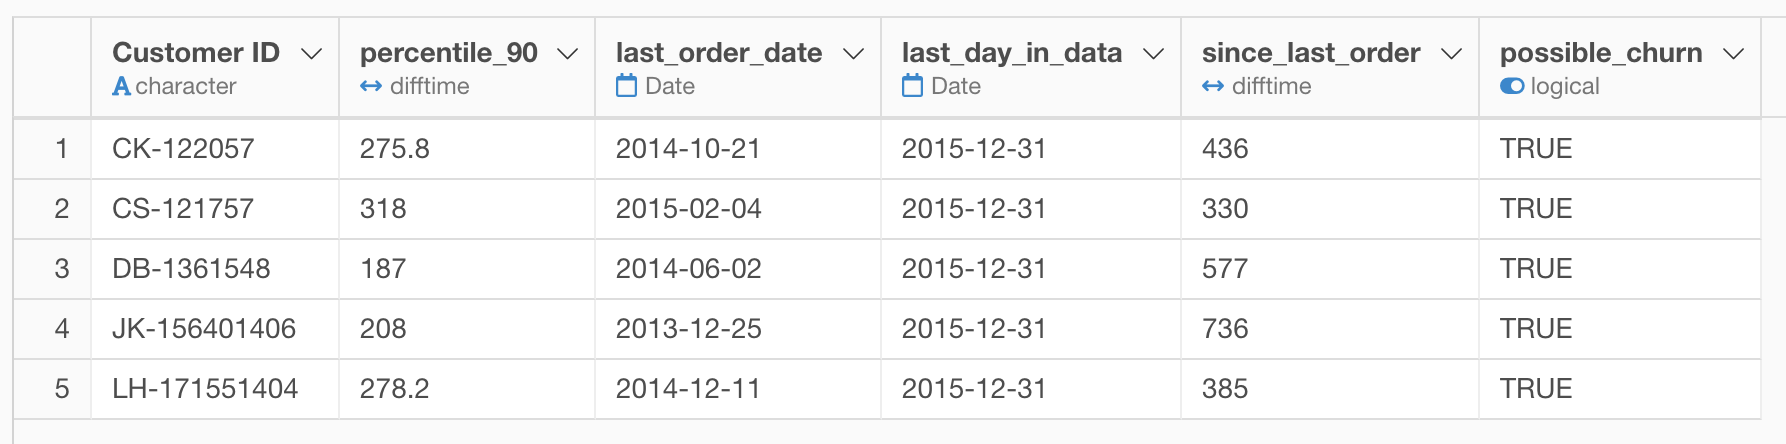
Let’s keep only the customers with TRUE possible_churn by a filter step.
We got the list of customers in the state of possible churn.
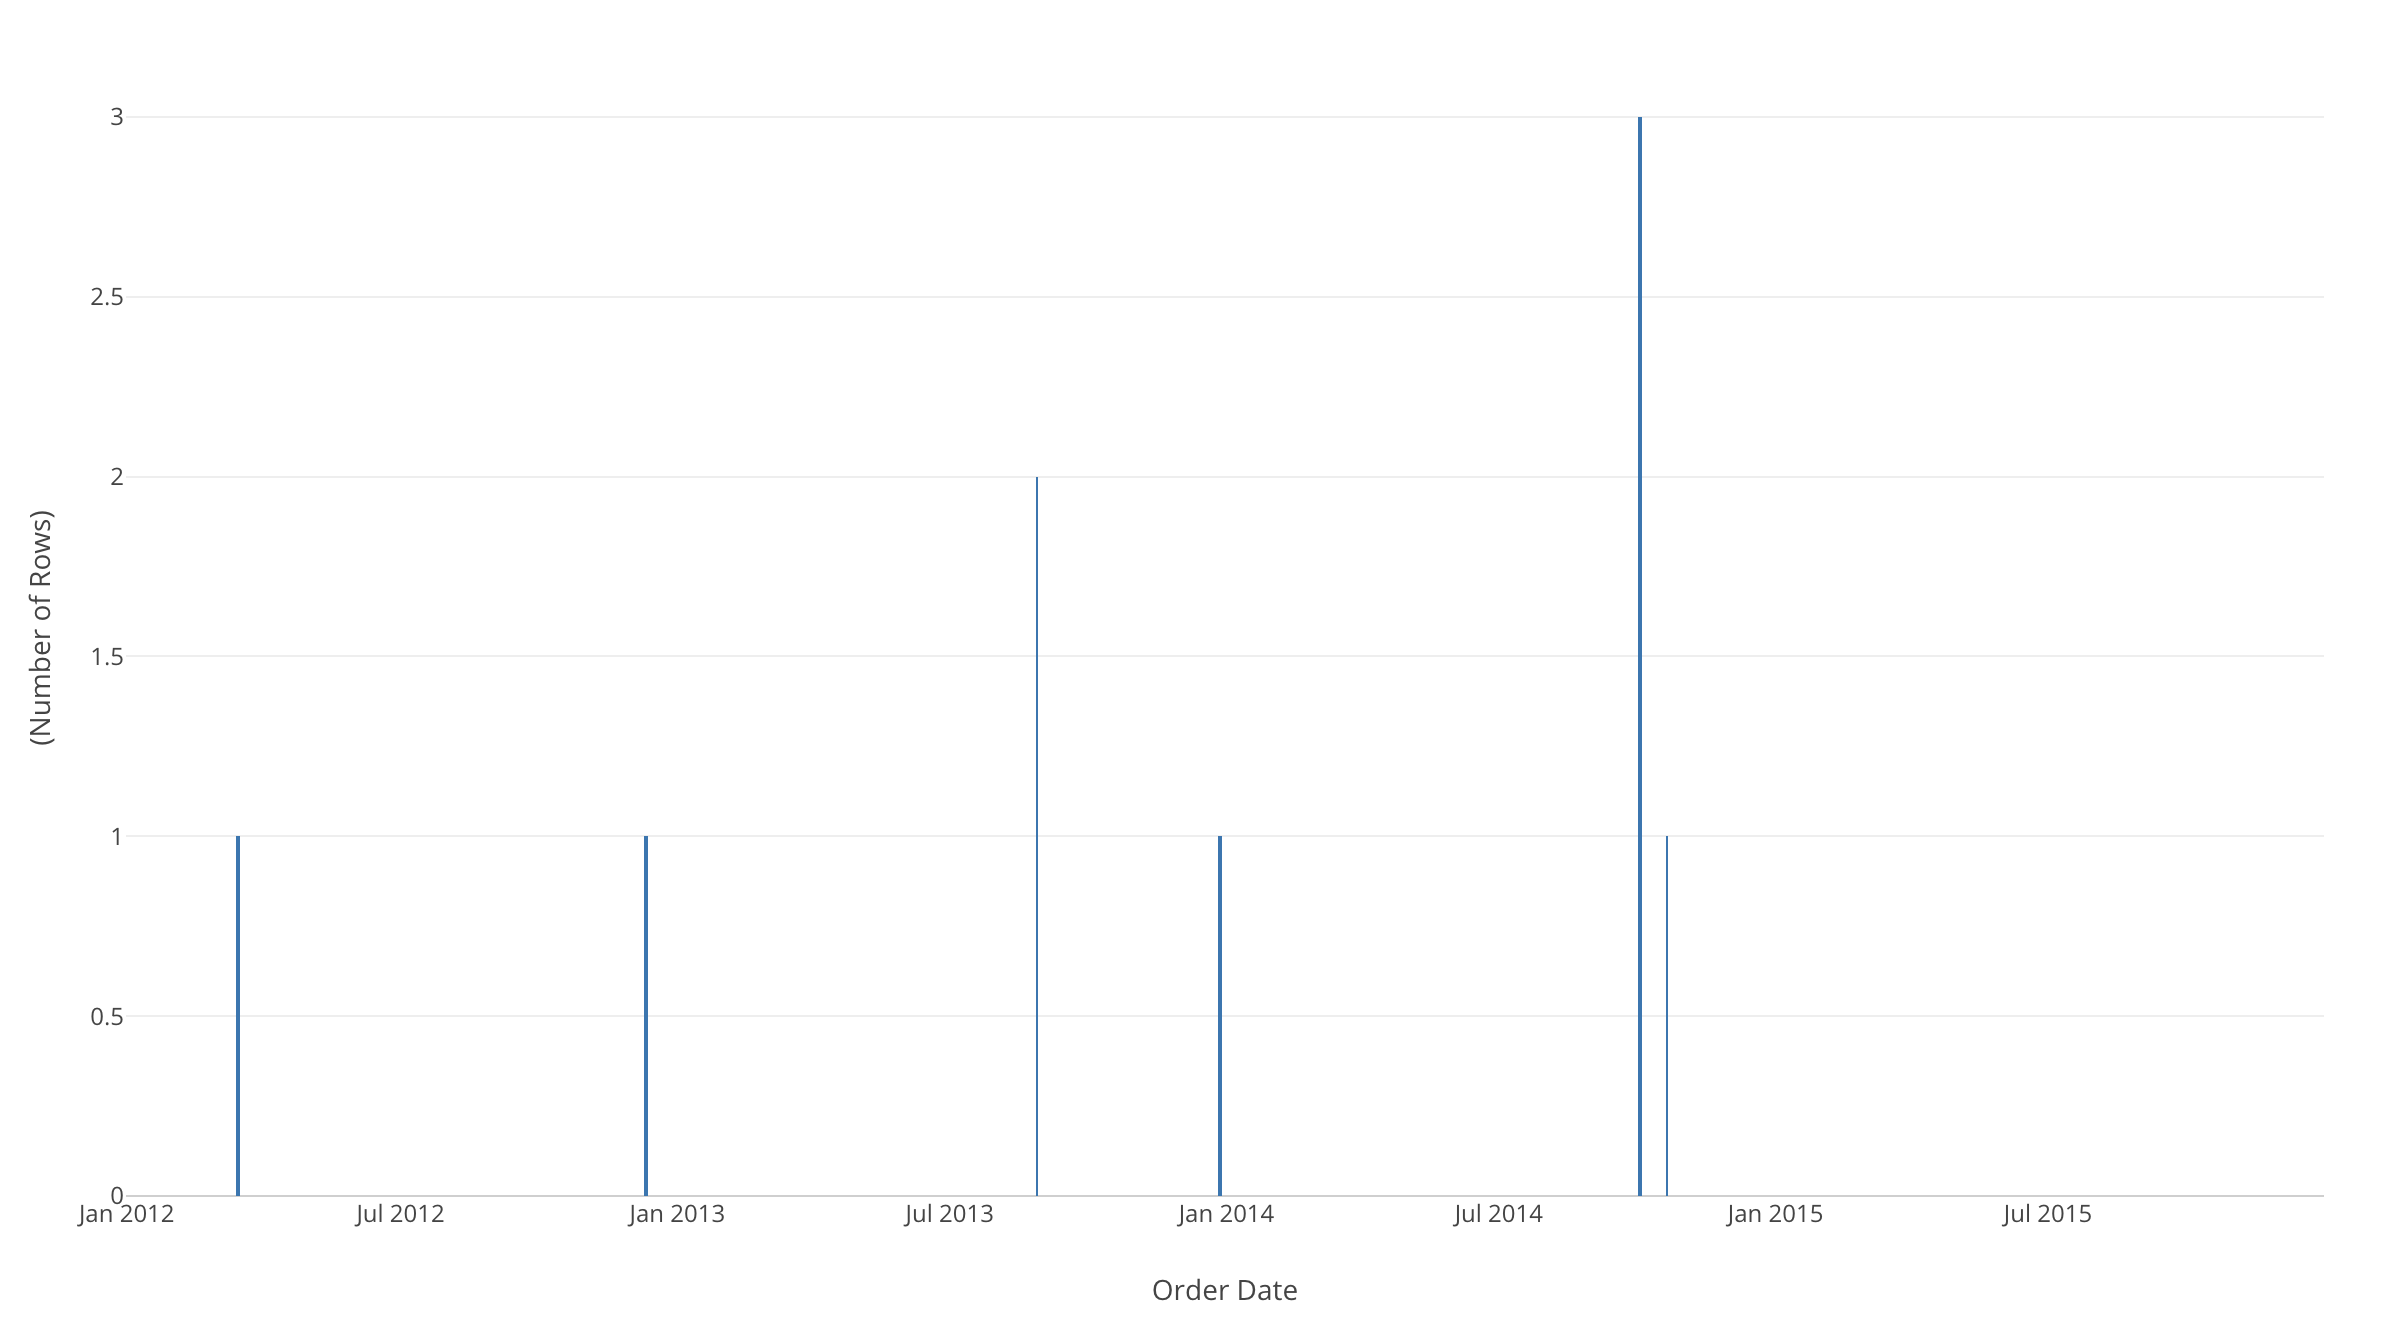
If we create a bar chart of order history of the customer with Customer ID CK-122057, which appeared in our possible churn list, we can actually see that he/she has not been ordered for a while, given how often he/she had been ordering.