How to Aggregate Values from Multiple Numeric Columns and Add as a New Column
If you want to aggregate values from multiple numeric columns (e.g.,
sum or average) row by row and add the result as a new column, you can
achieve this by using the summarize_row function within the
“Create Calculation” step.
This function supports not only sums and averages but also the following aggregation functions:
- sum: Sum
- mean: Average
- median: Median
- mode: Mode
- max: Maximum
- min: Minimum
This time, we will use customer satisfaction survey data.
Each row represents data for one respondent, and the columns contain responses to a 5-point rating scale survey.
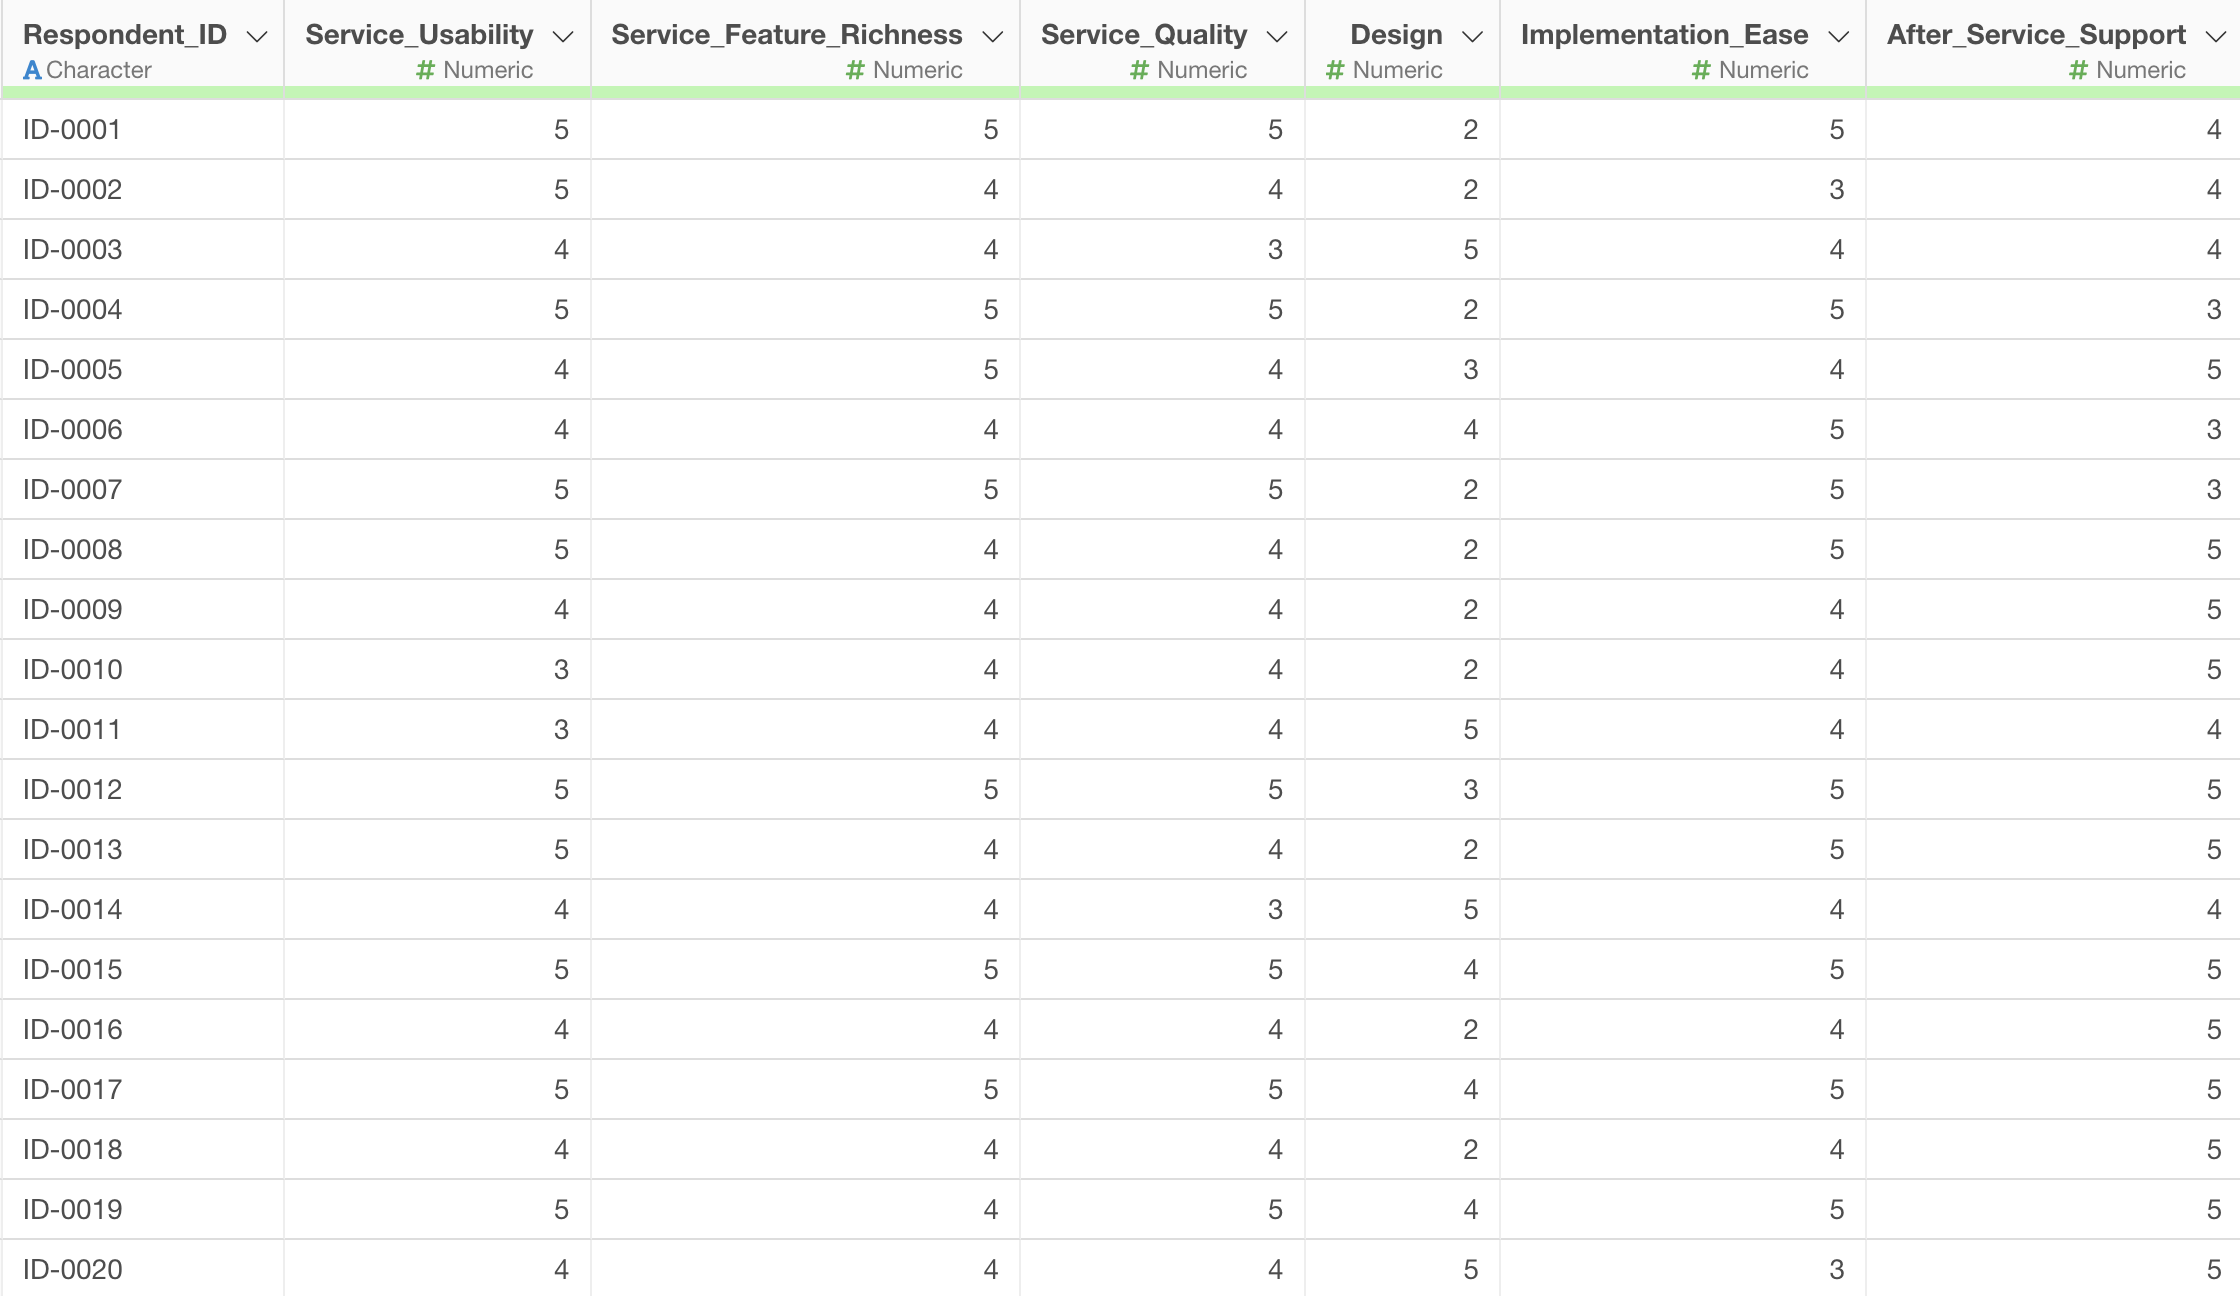
What we want to do is calculate the average response to the survey questions for each respondent, that is, row by row.
From the column header menu, select “Standard” under “Create Calculation”.

The “Create Calculation” dialog will appear, so delete the contents of the calculation editor.
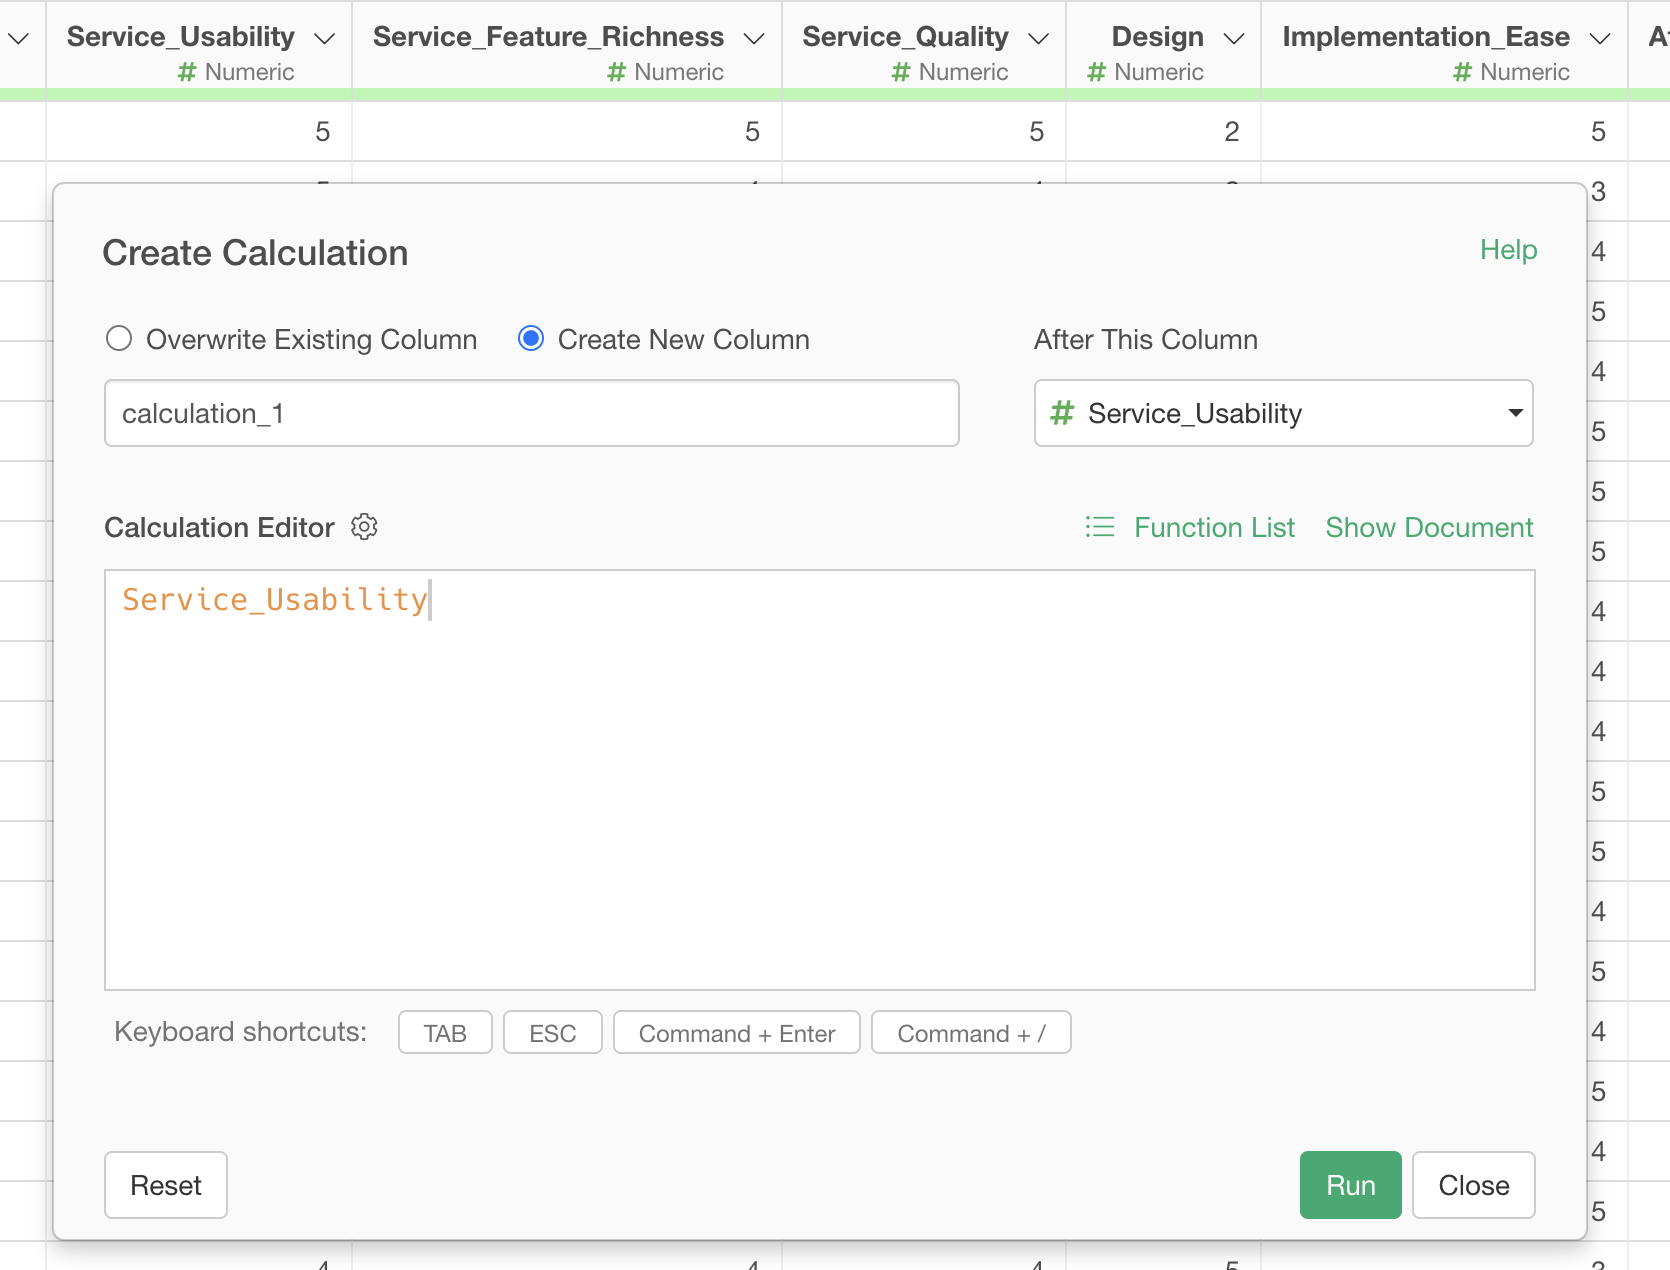
Next, use the summarize_row function as shown below.
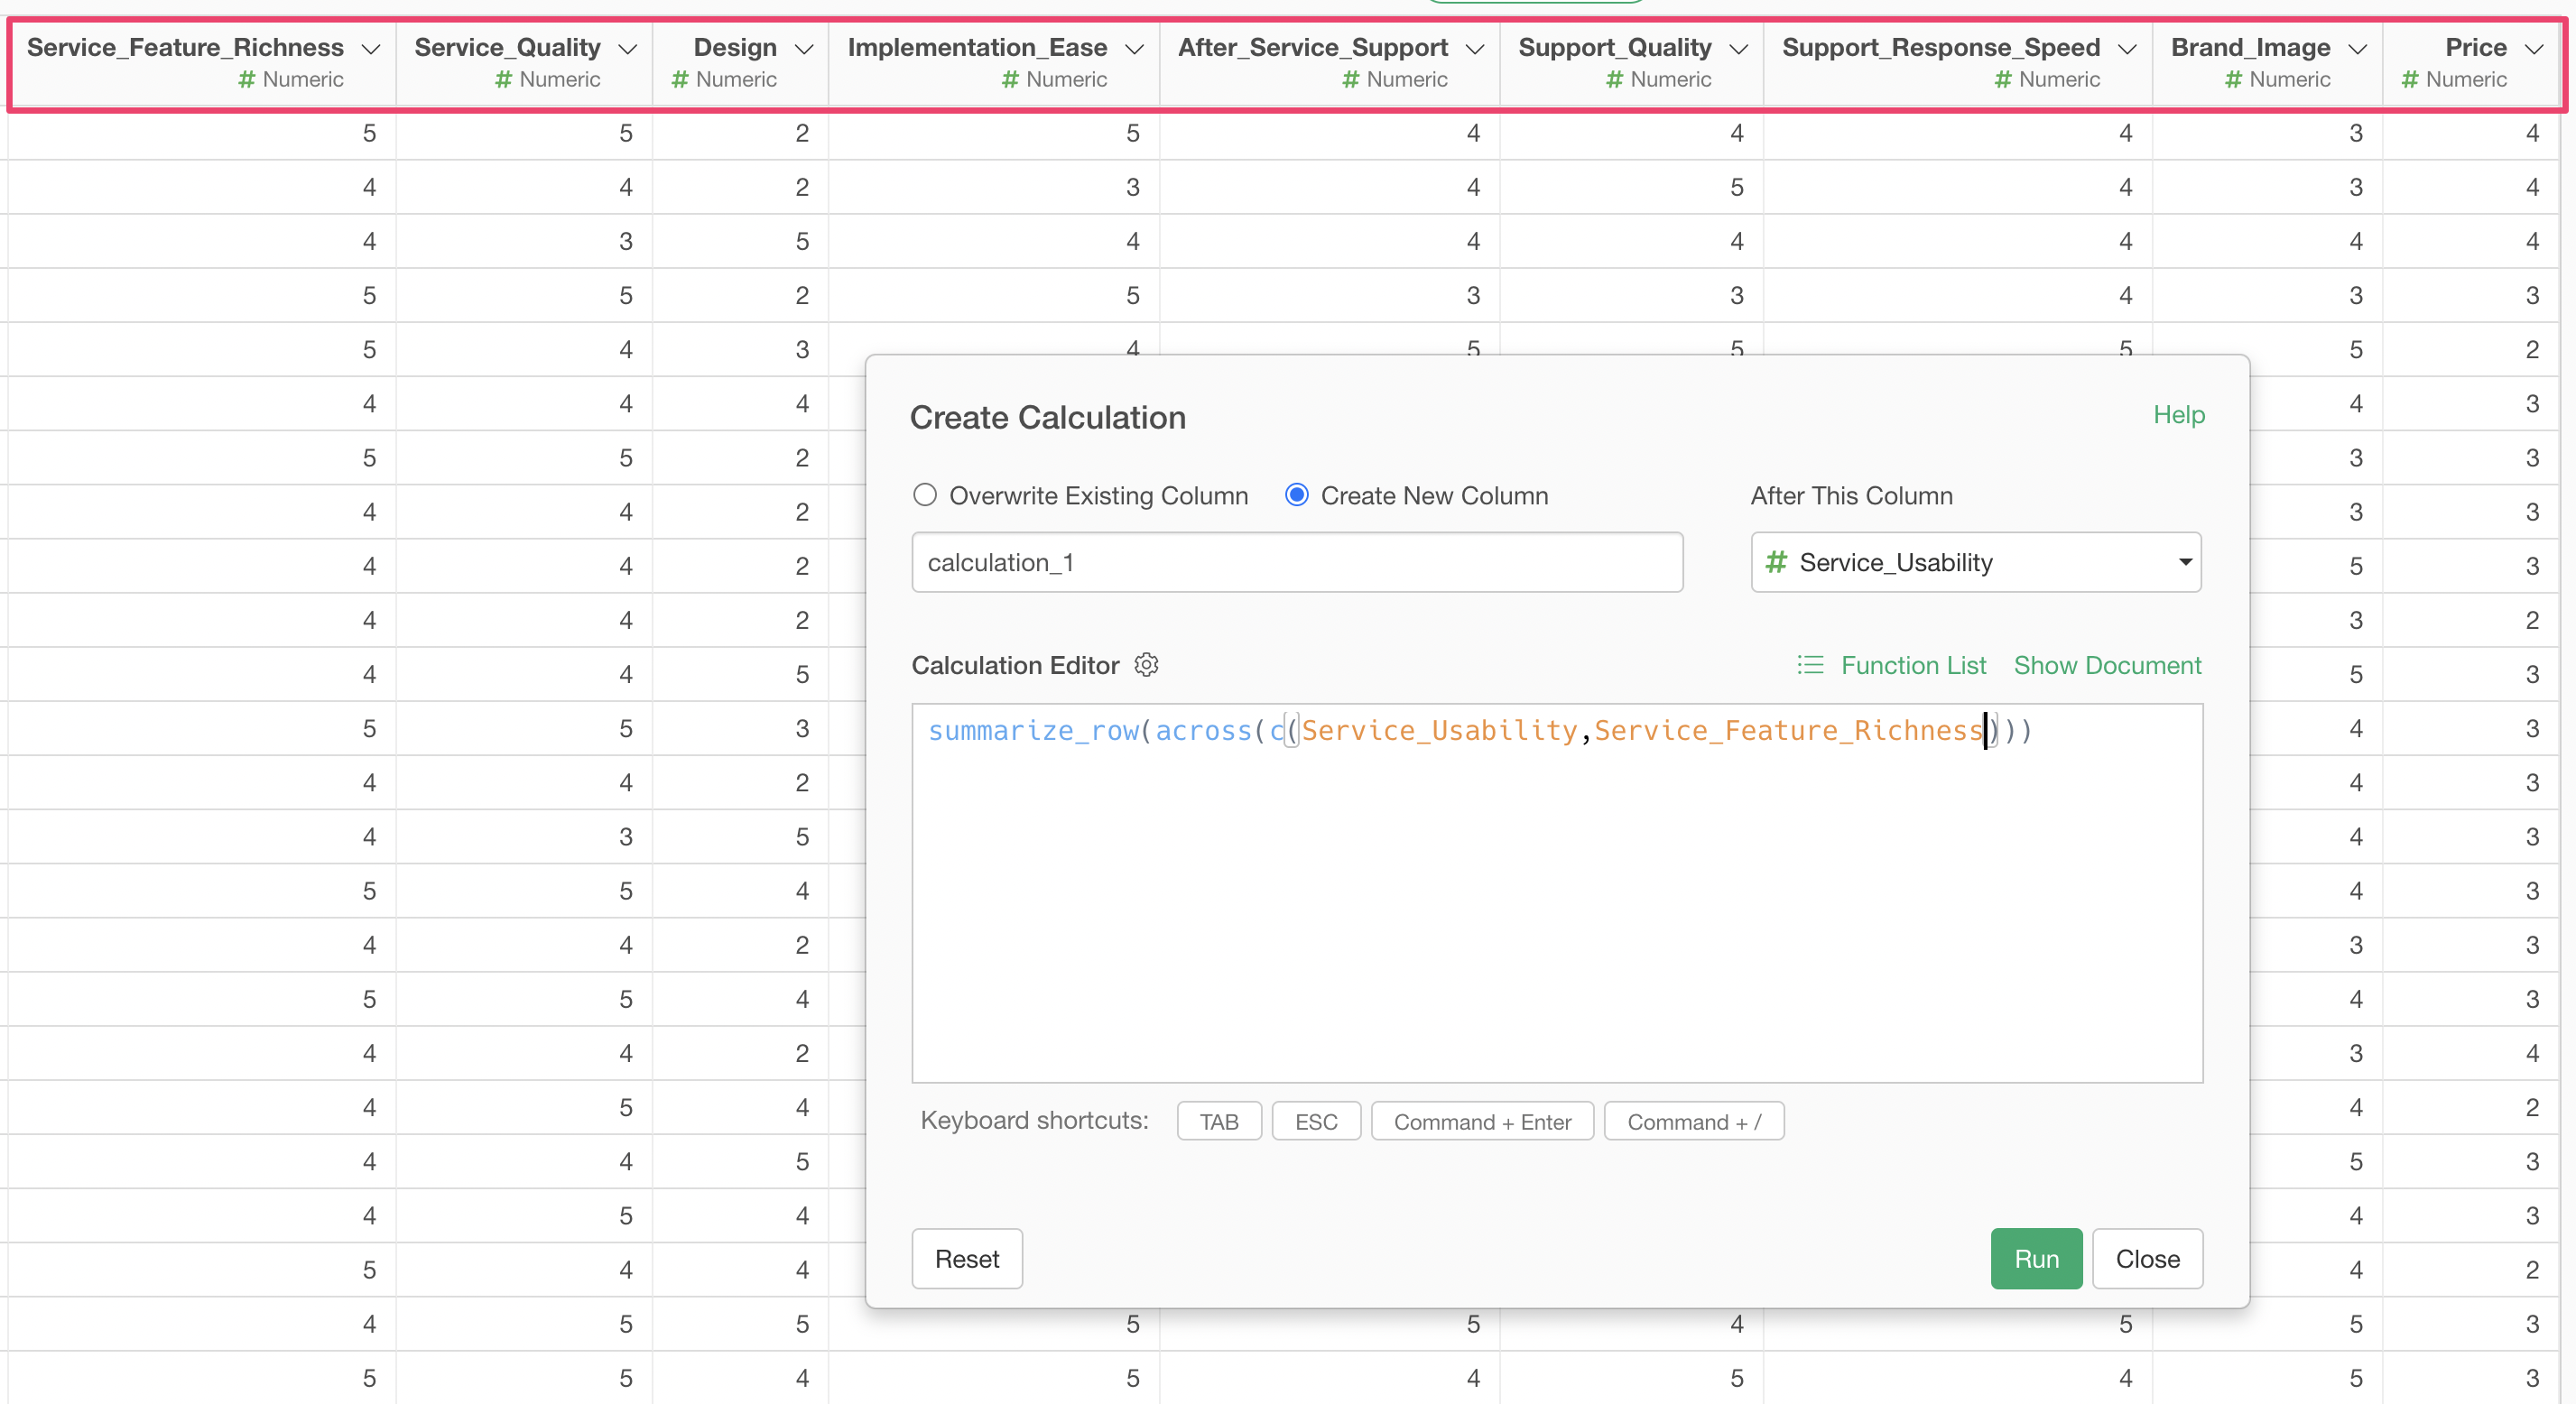
You can specify columns by using the c function inside
the across function, and columns can be specified one by
one, separated by commas (,).
summarize_row(across(c(Service_Usability,Service_Feature_Richness)))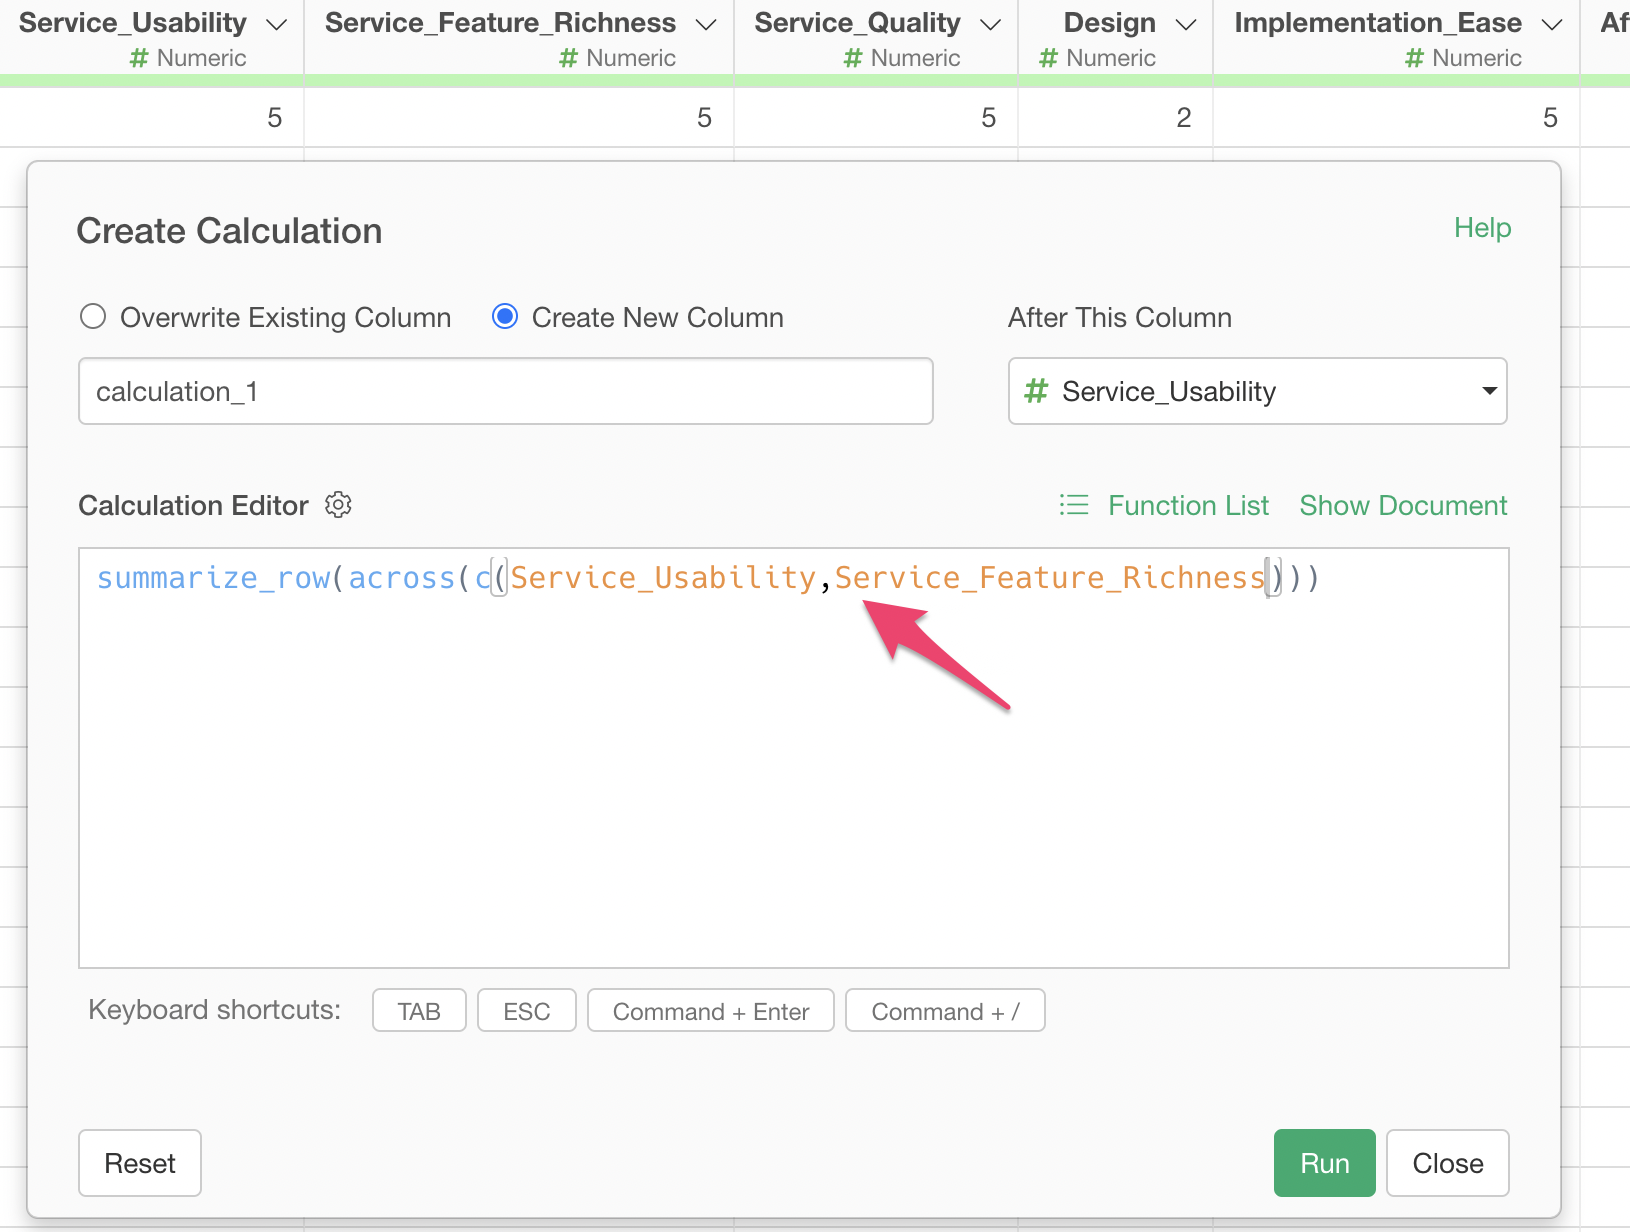
However, since there are 10 columns for survey responses this time, specifying each column individually would be a tedious task.
Therefore, you can specify a range of columns within the
c function using a colon (:) as shown below. This time, we
are specifying columns from “Service_Usability” to “Price”.
summarize_row(across(c(Service_Usability:Price)))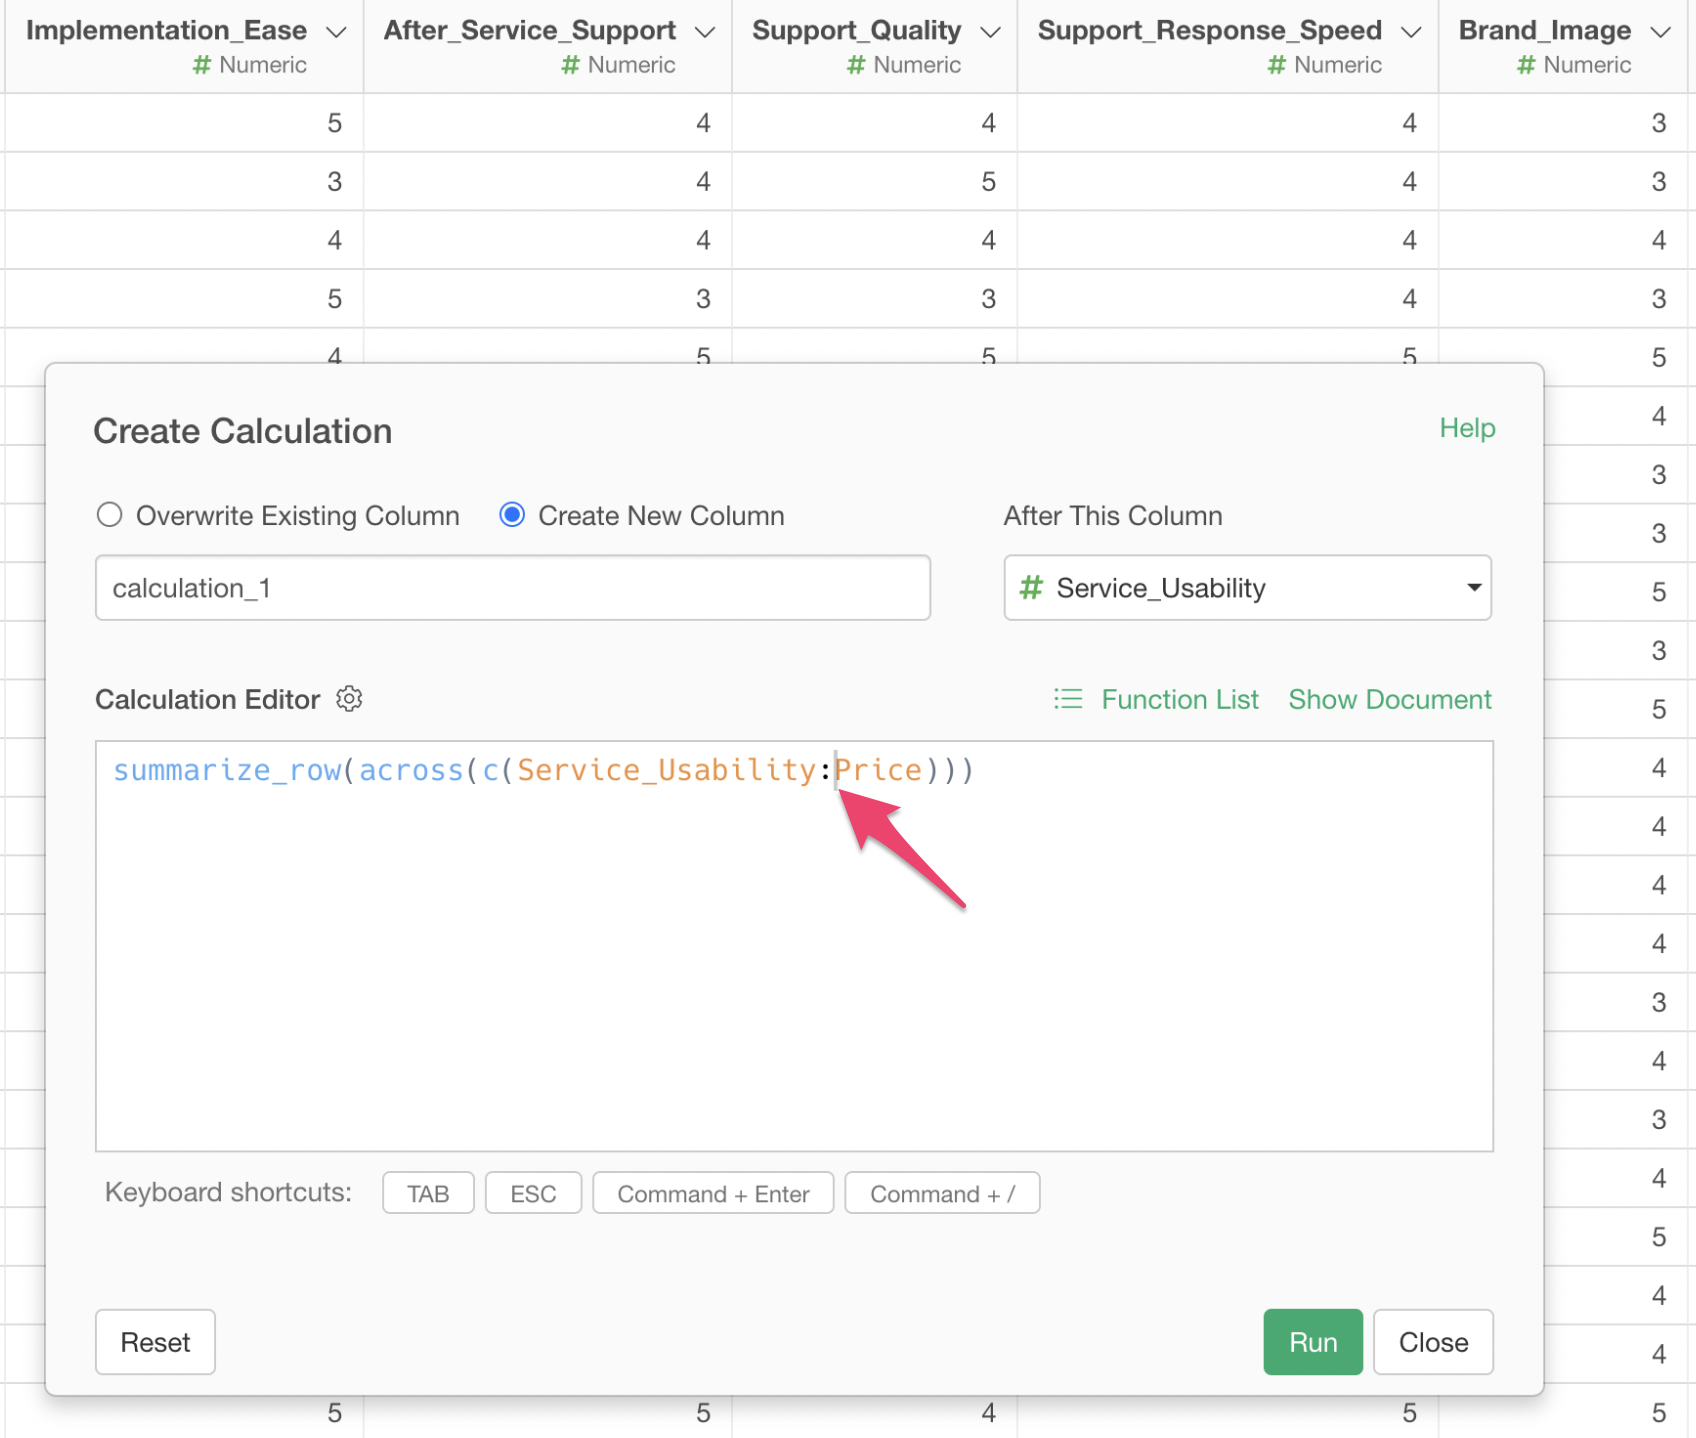
Once the columns are specified, you then specify the aggregation
function for those columns. For the average, you would use the
mean function.
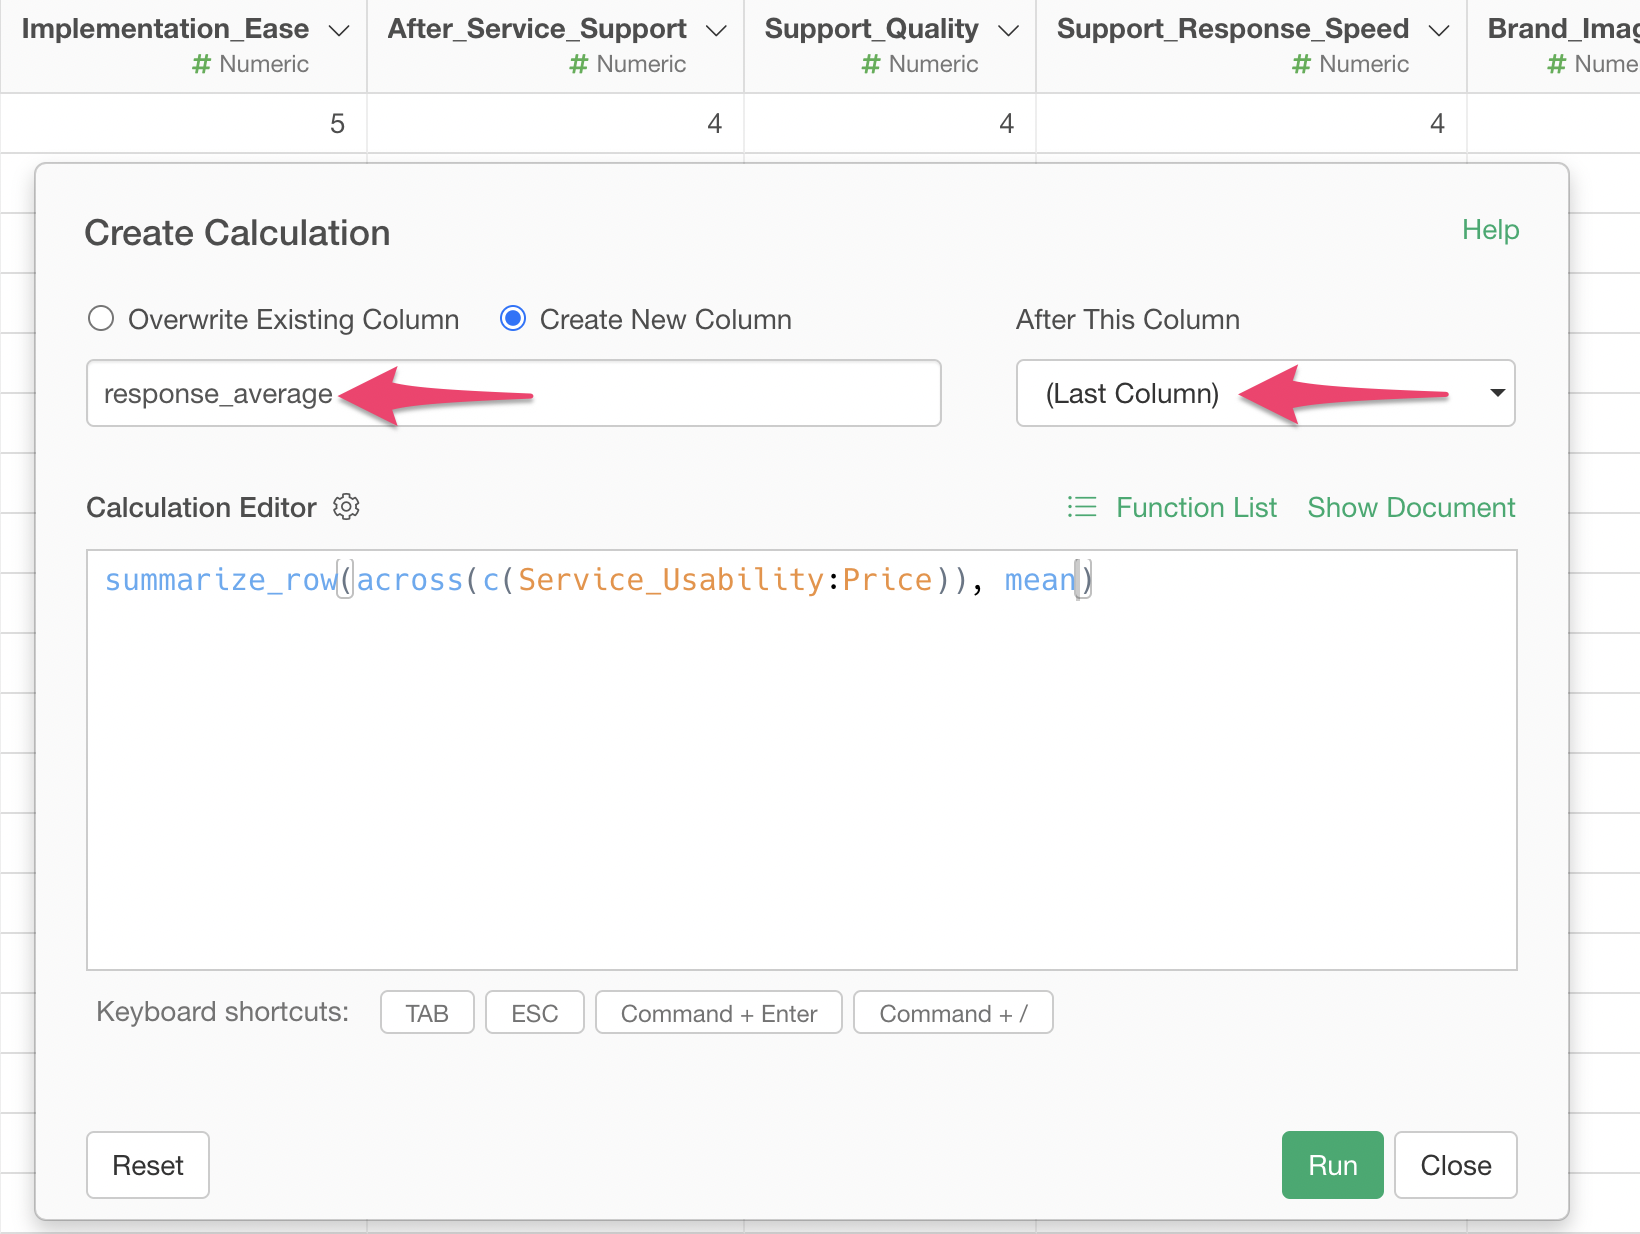
summarize_row(across(c(Service_Usability:Price)), mean)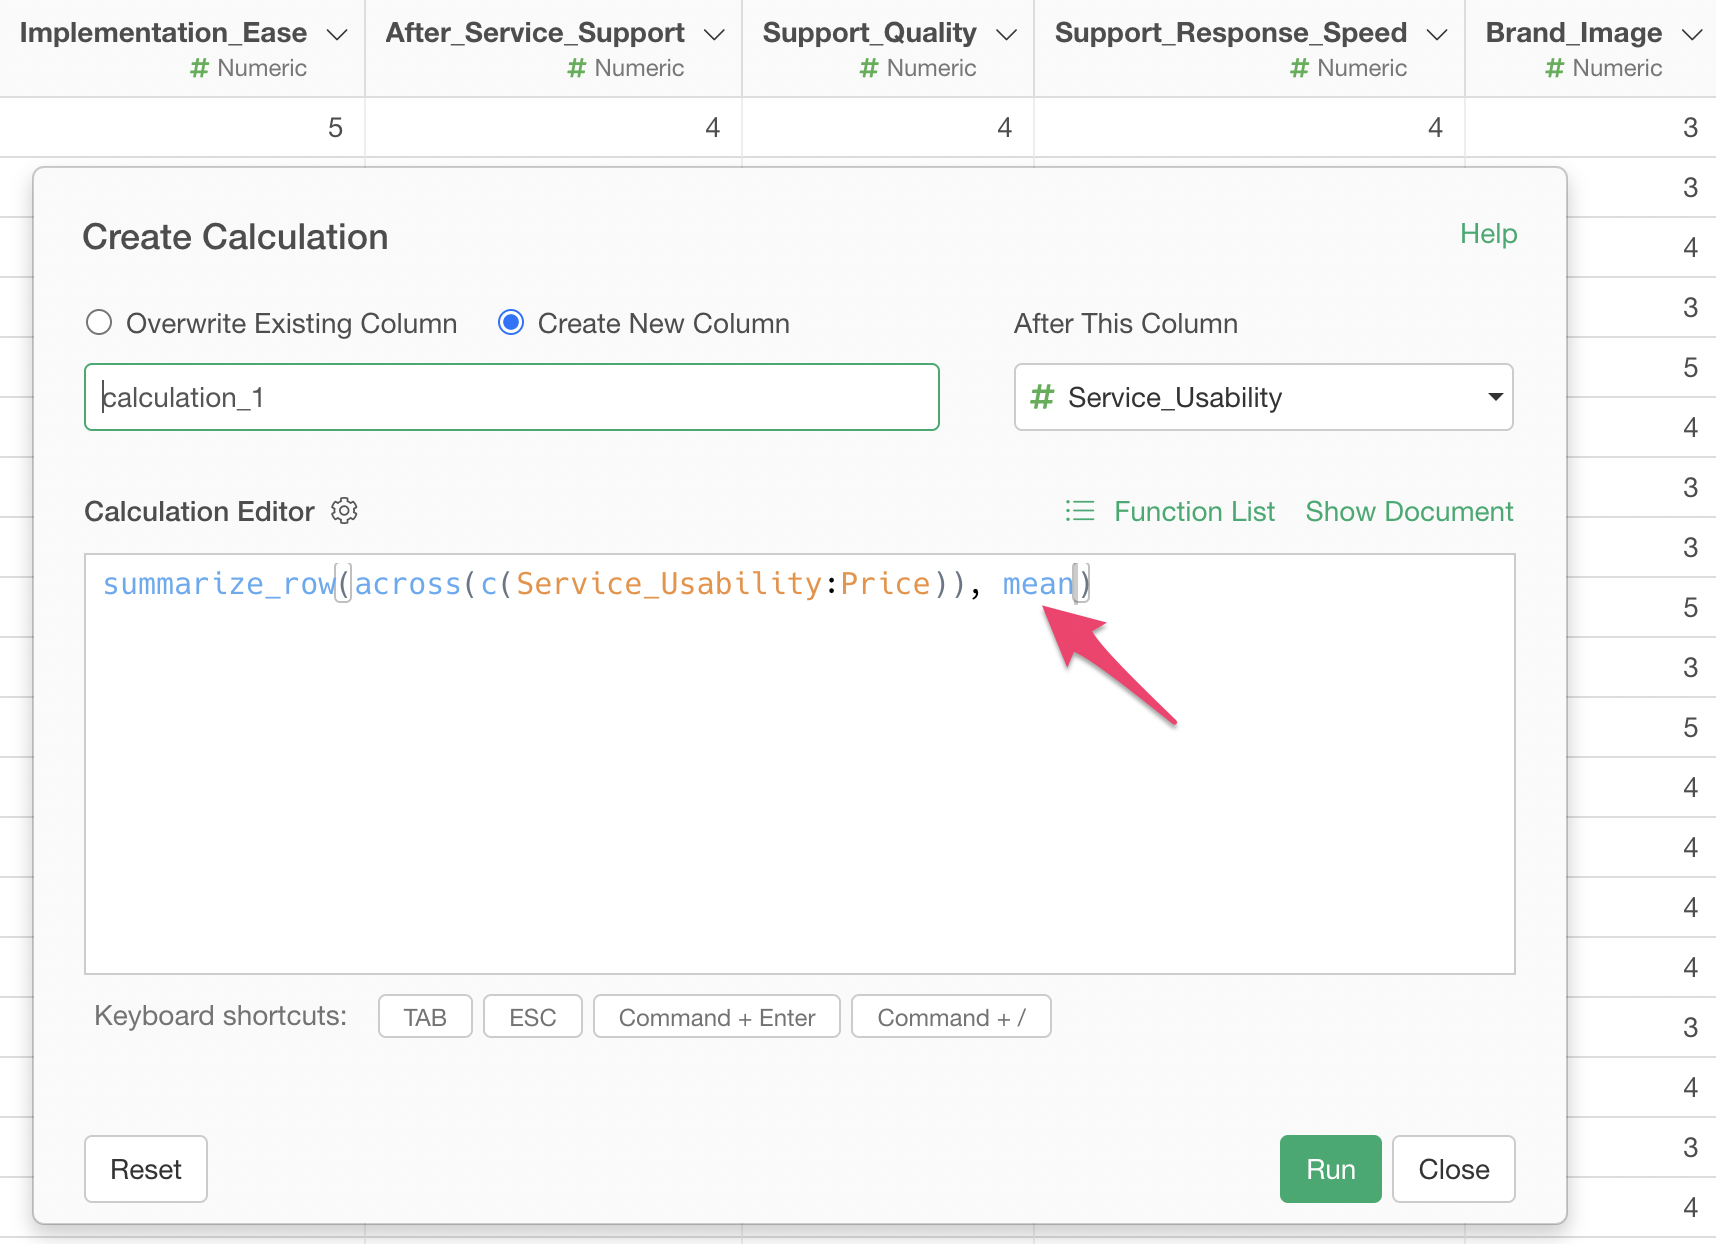
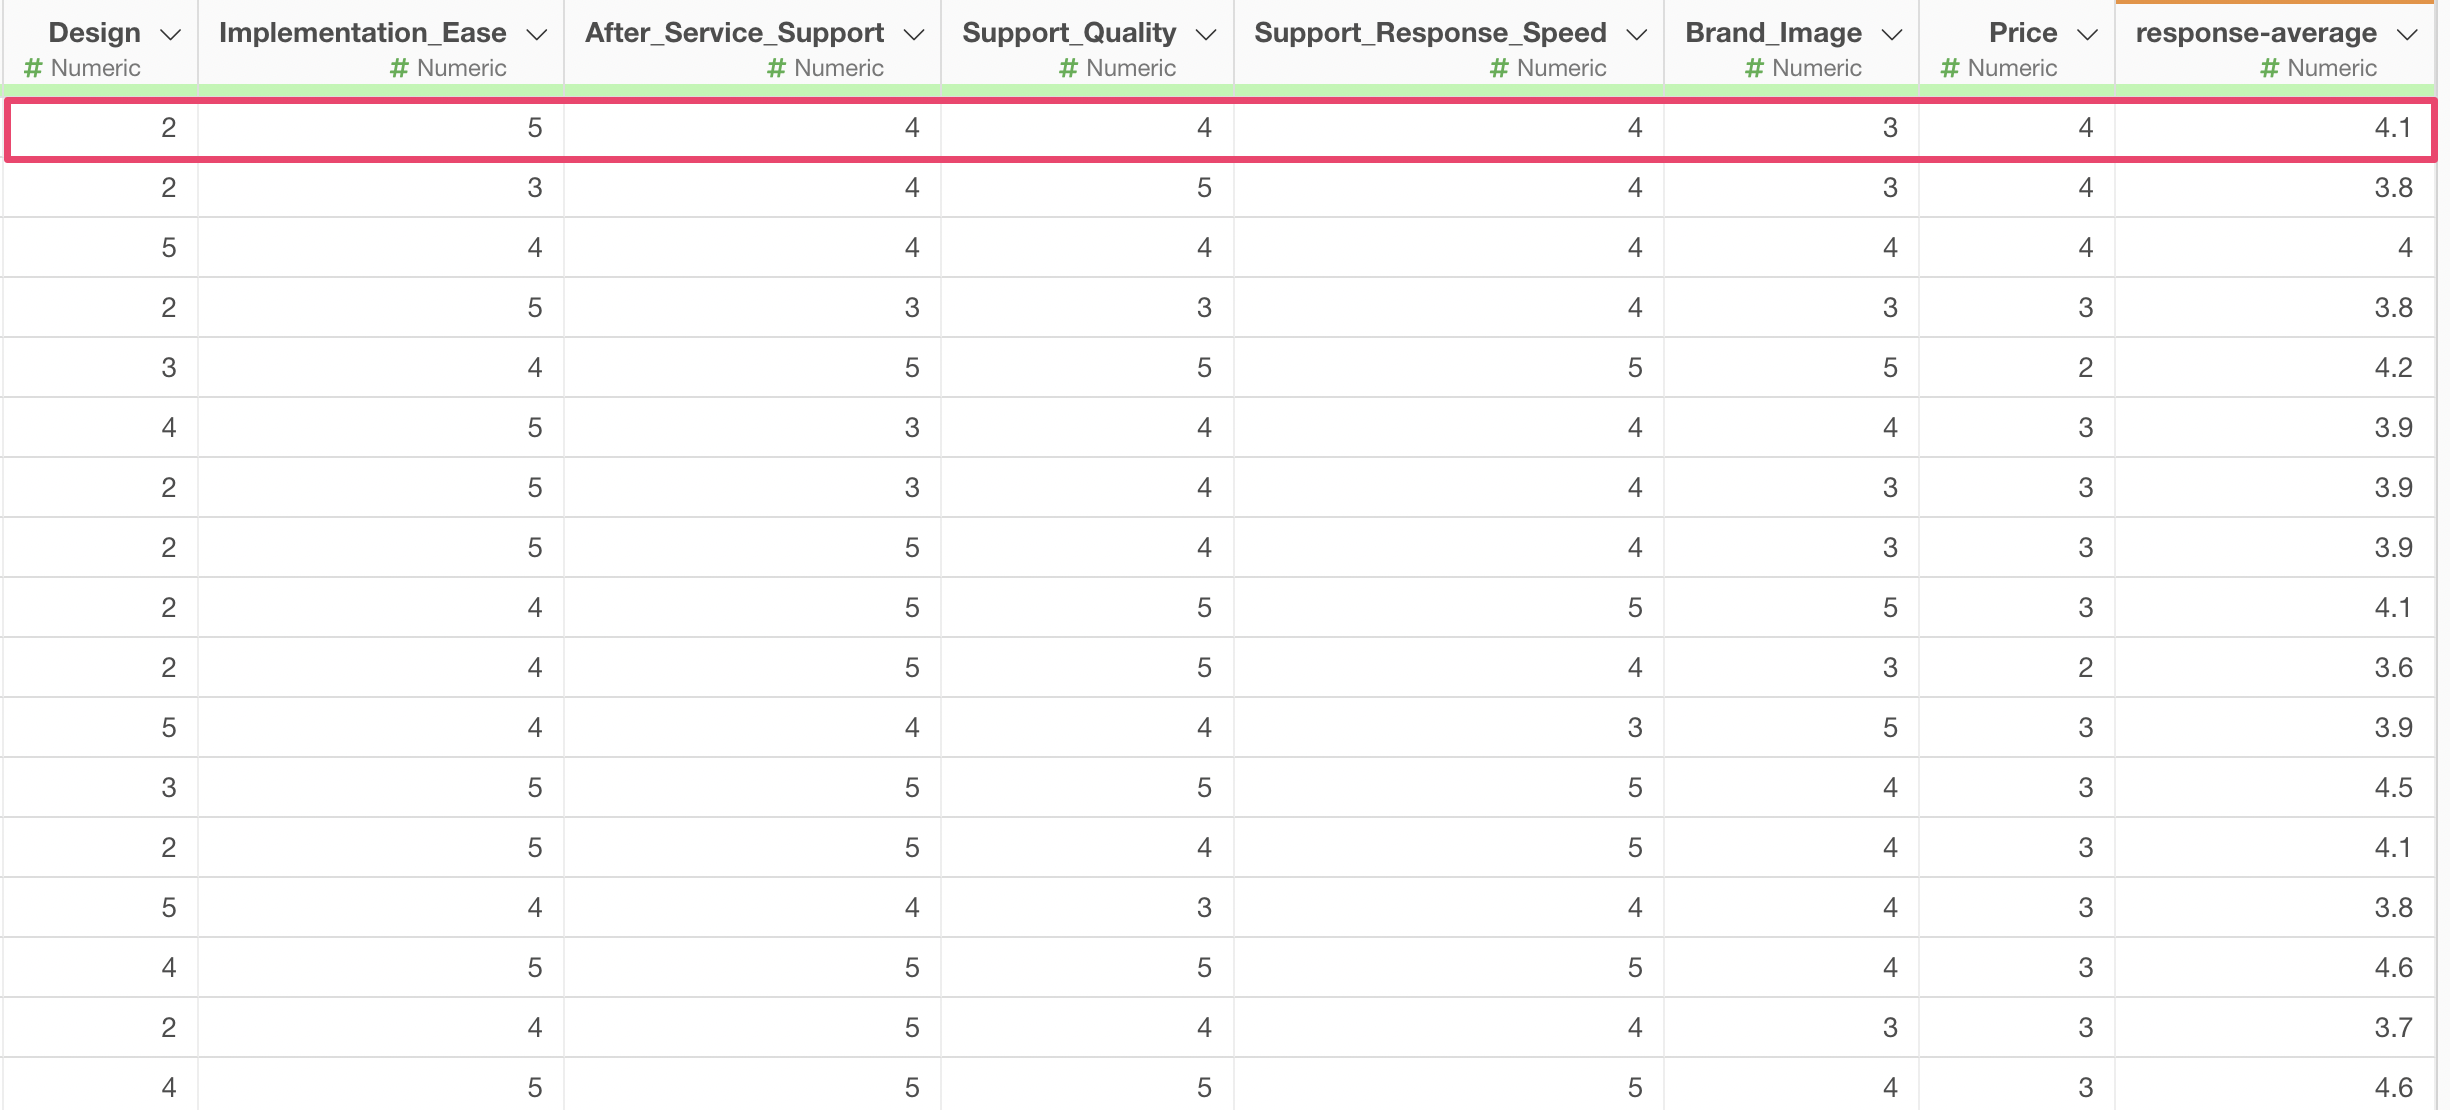
Check “Create New Column”, set the column name to “Average Response”, and select “Last Column” for where to create this column, then execute.
This allows us to calculate the average response to the survey questions for each respondent (row by row).
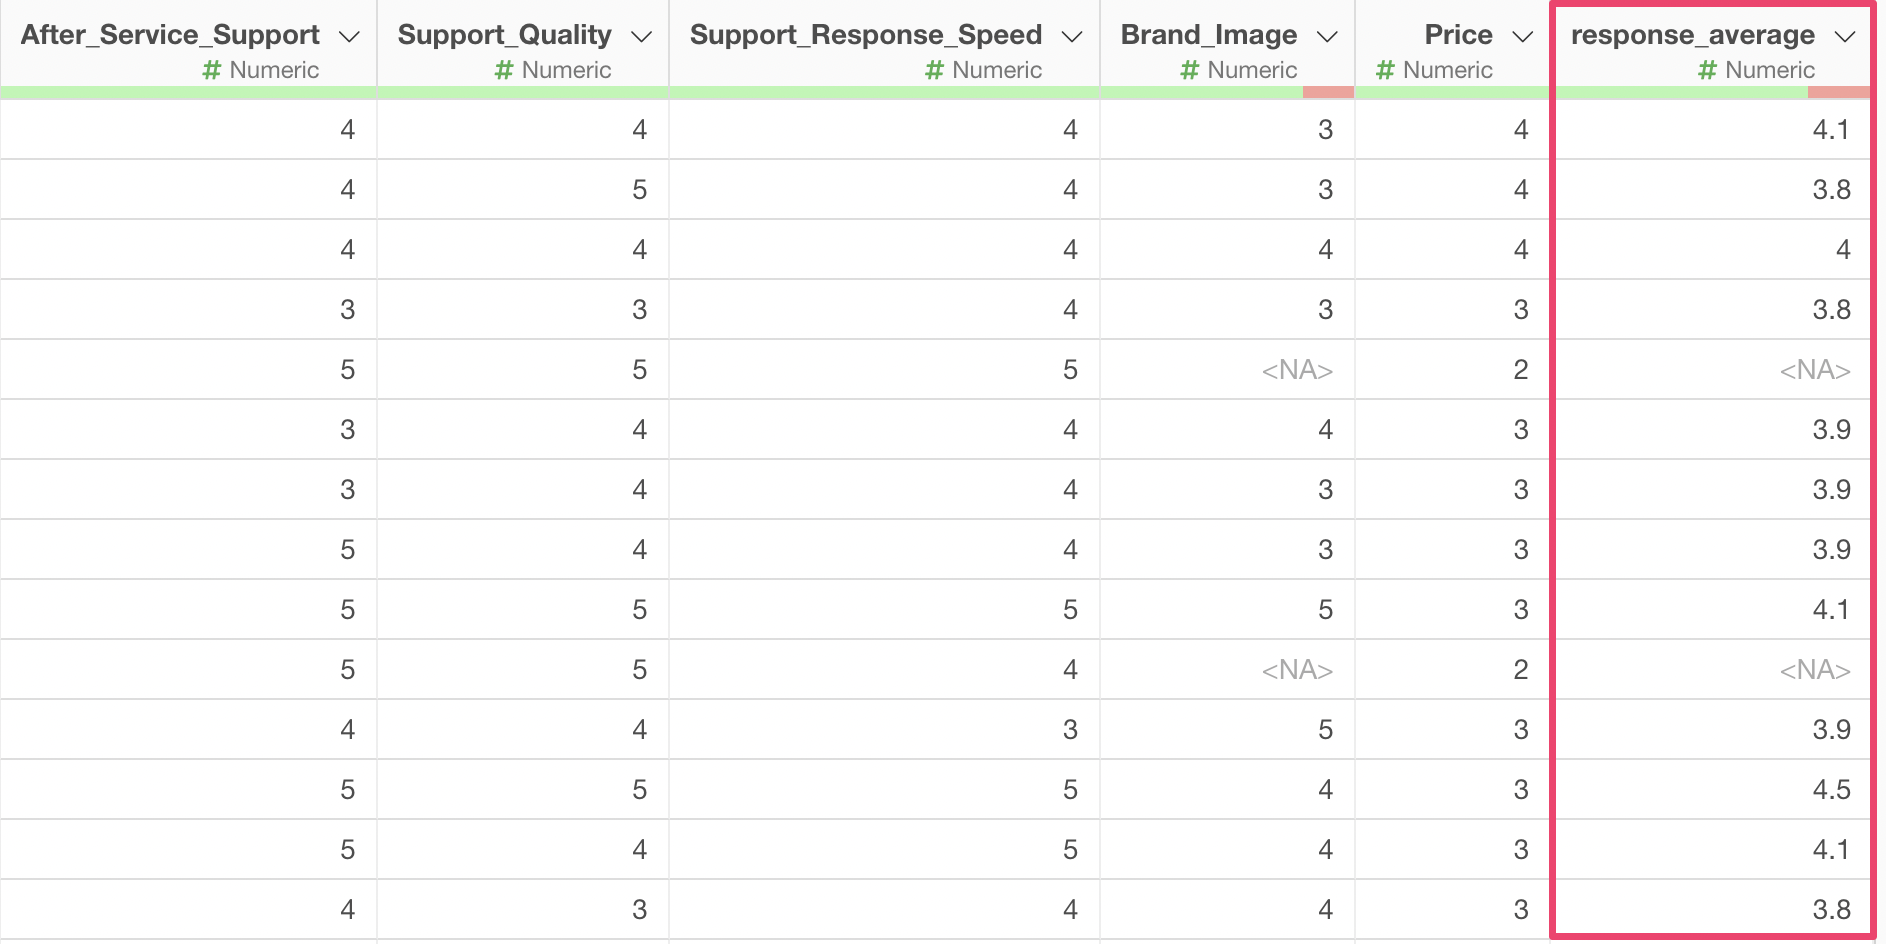
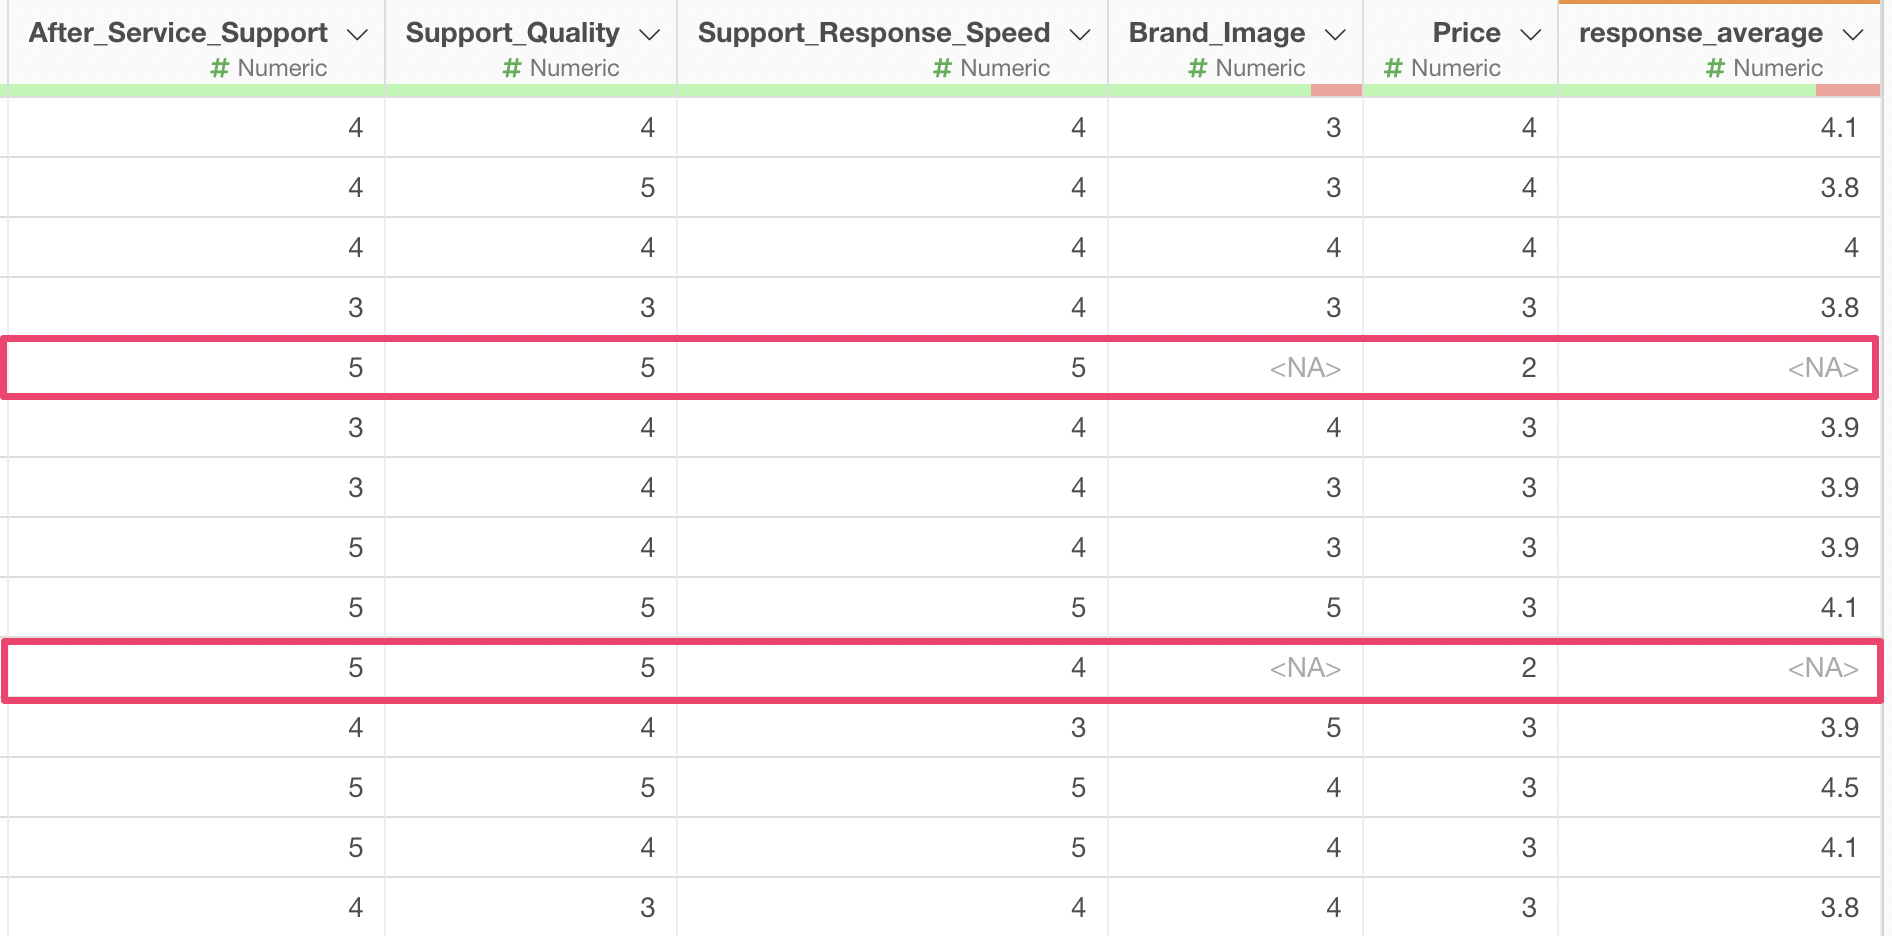
However, some values are missing (NA). The reason for this is that if even one missing value exists in the columns from “Service Usability” to “Support Response Speed” that are being calculated, the calculation result will also be returned as a missing value.
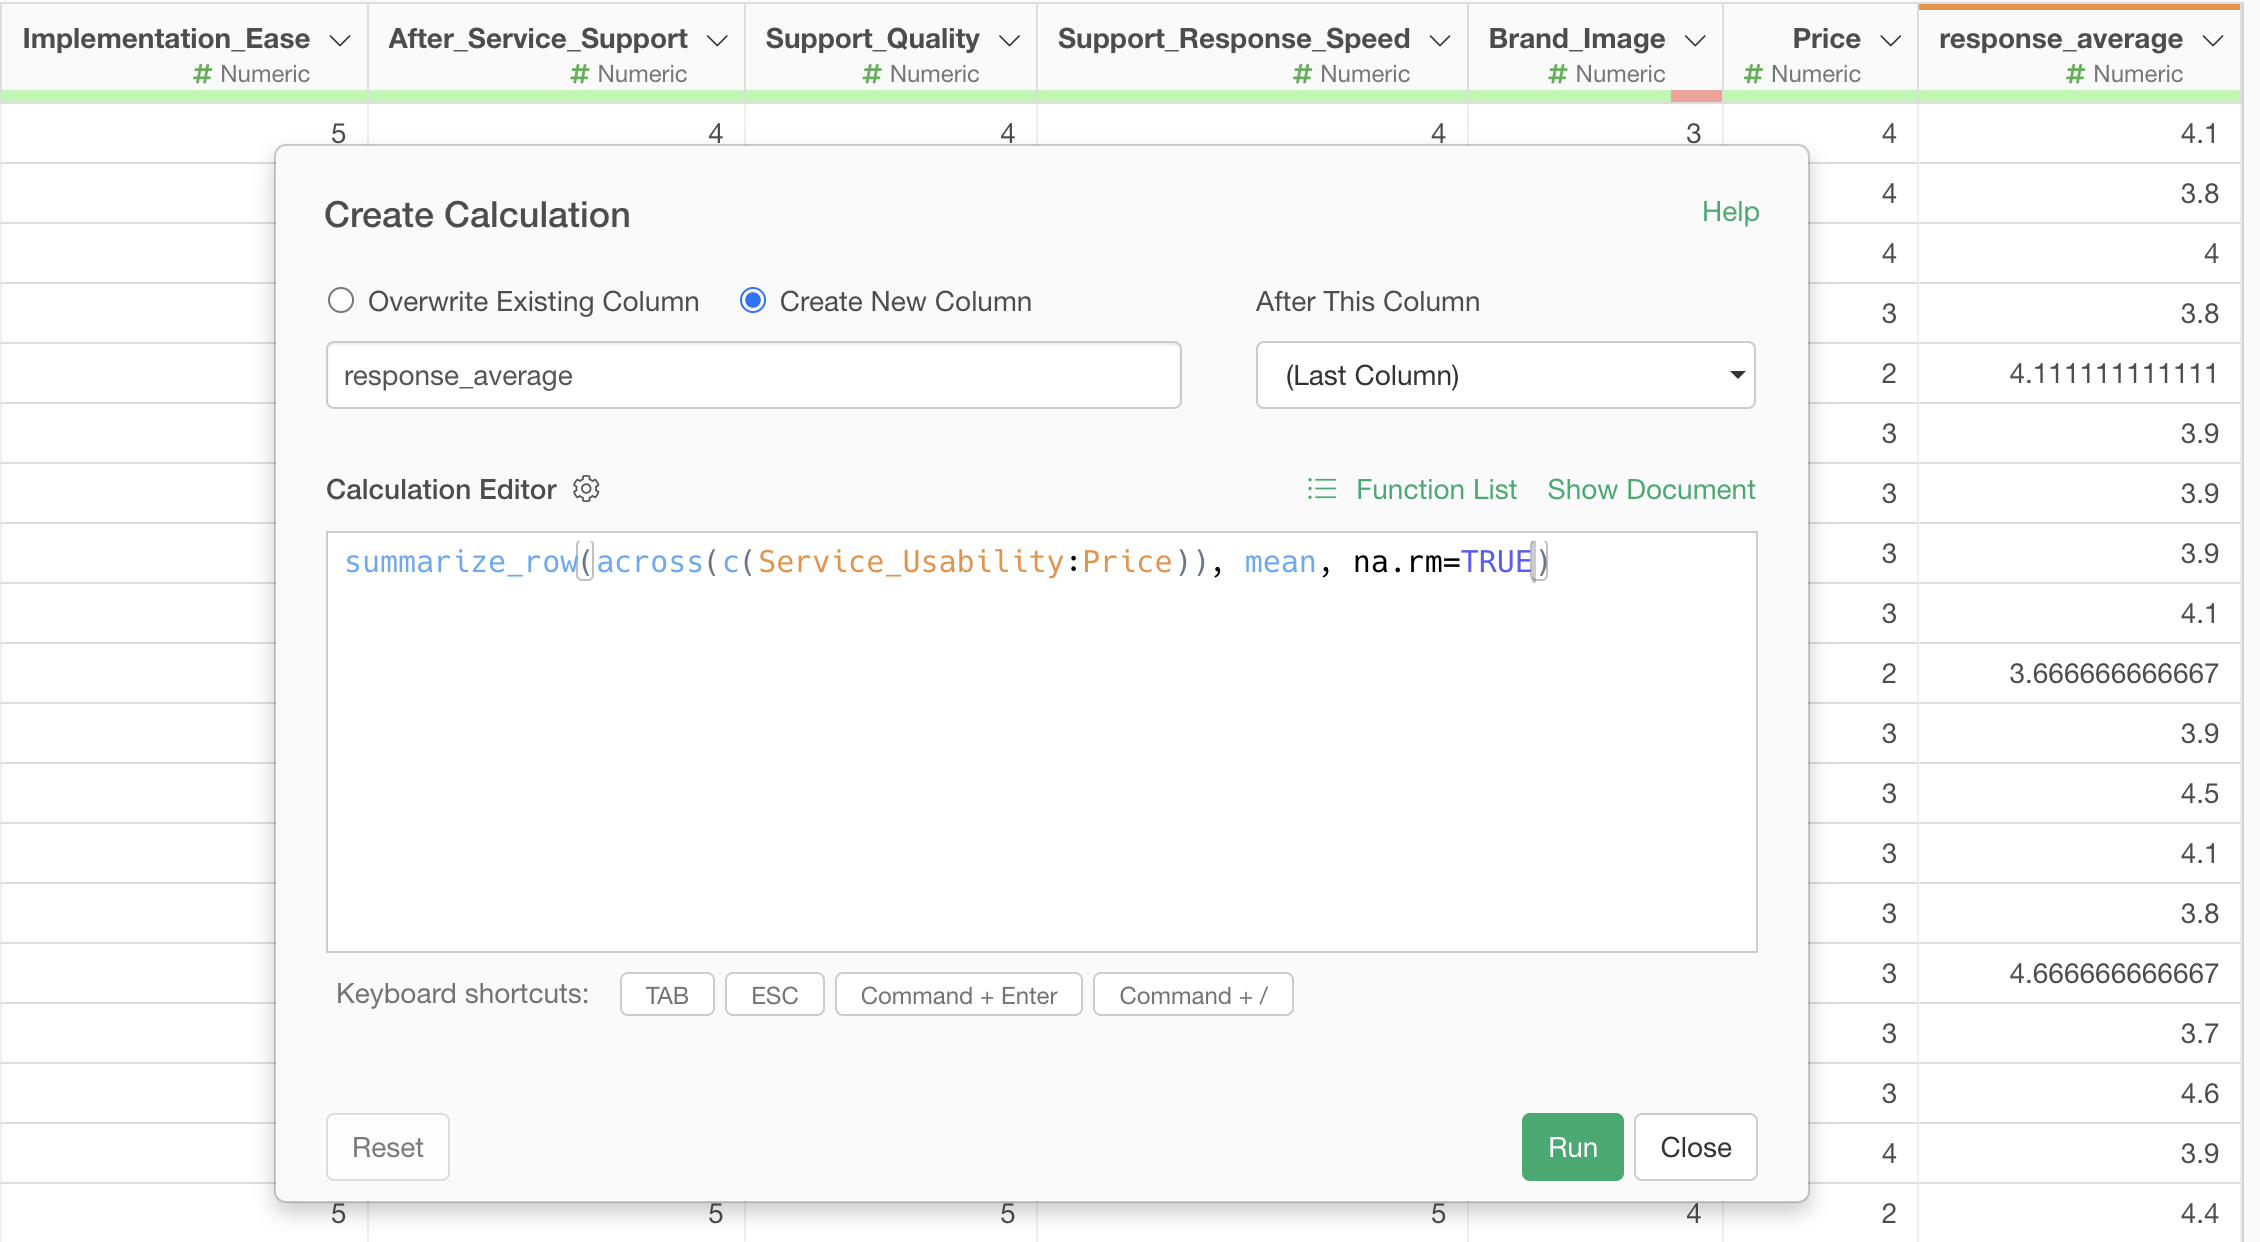
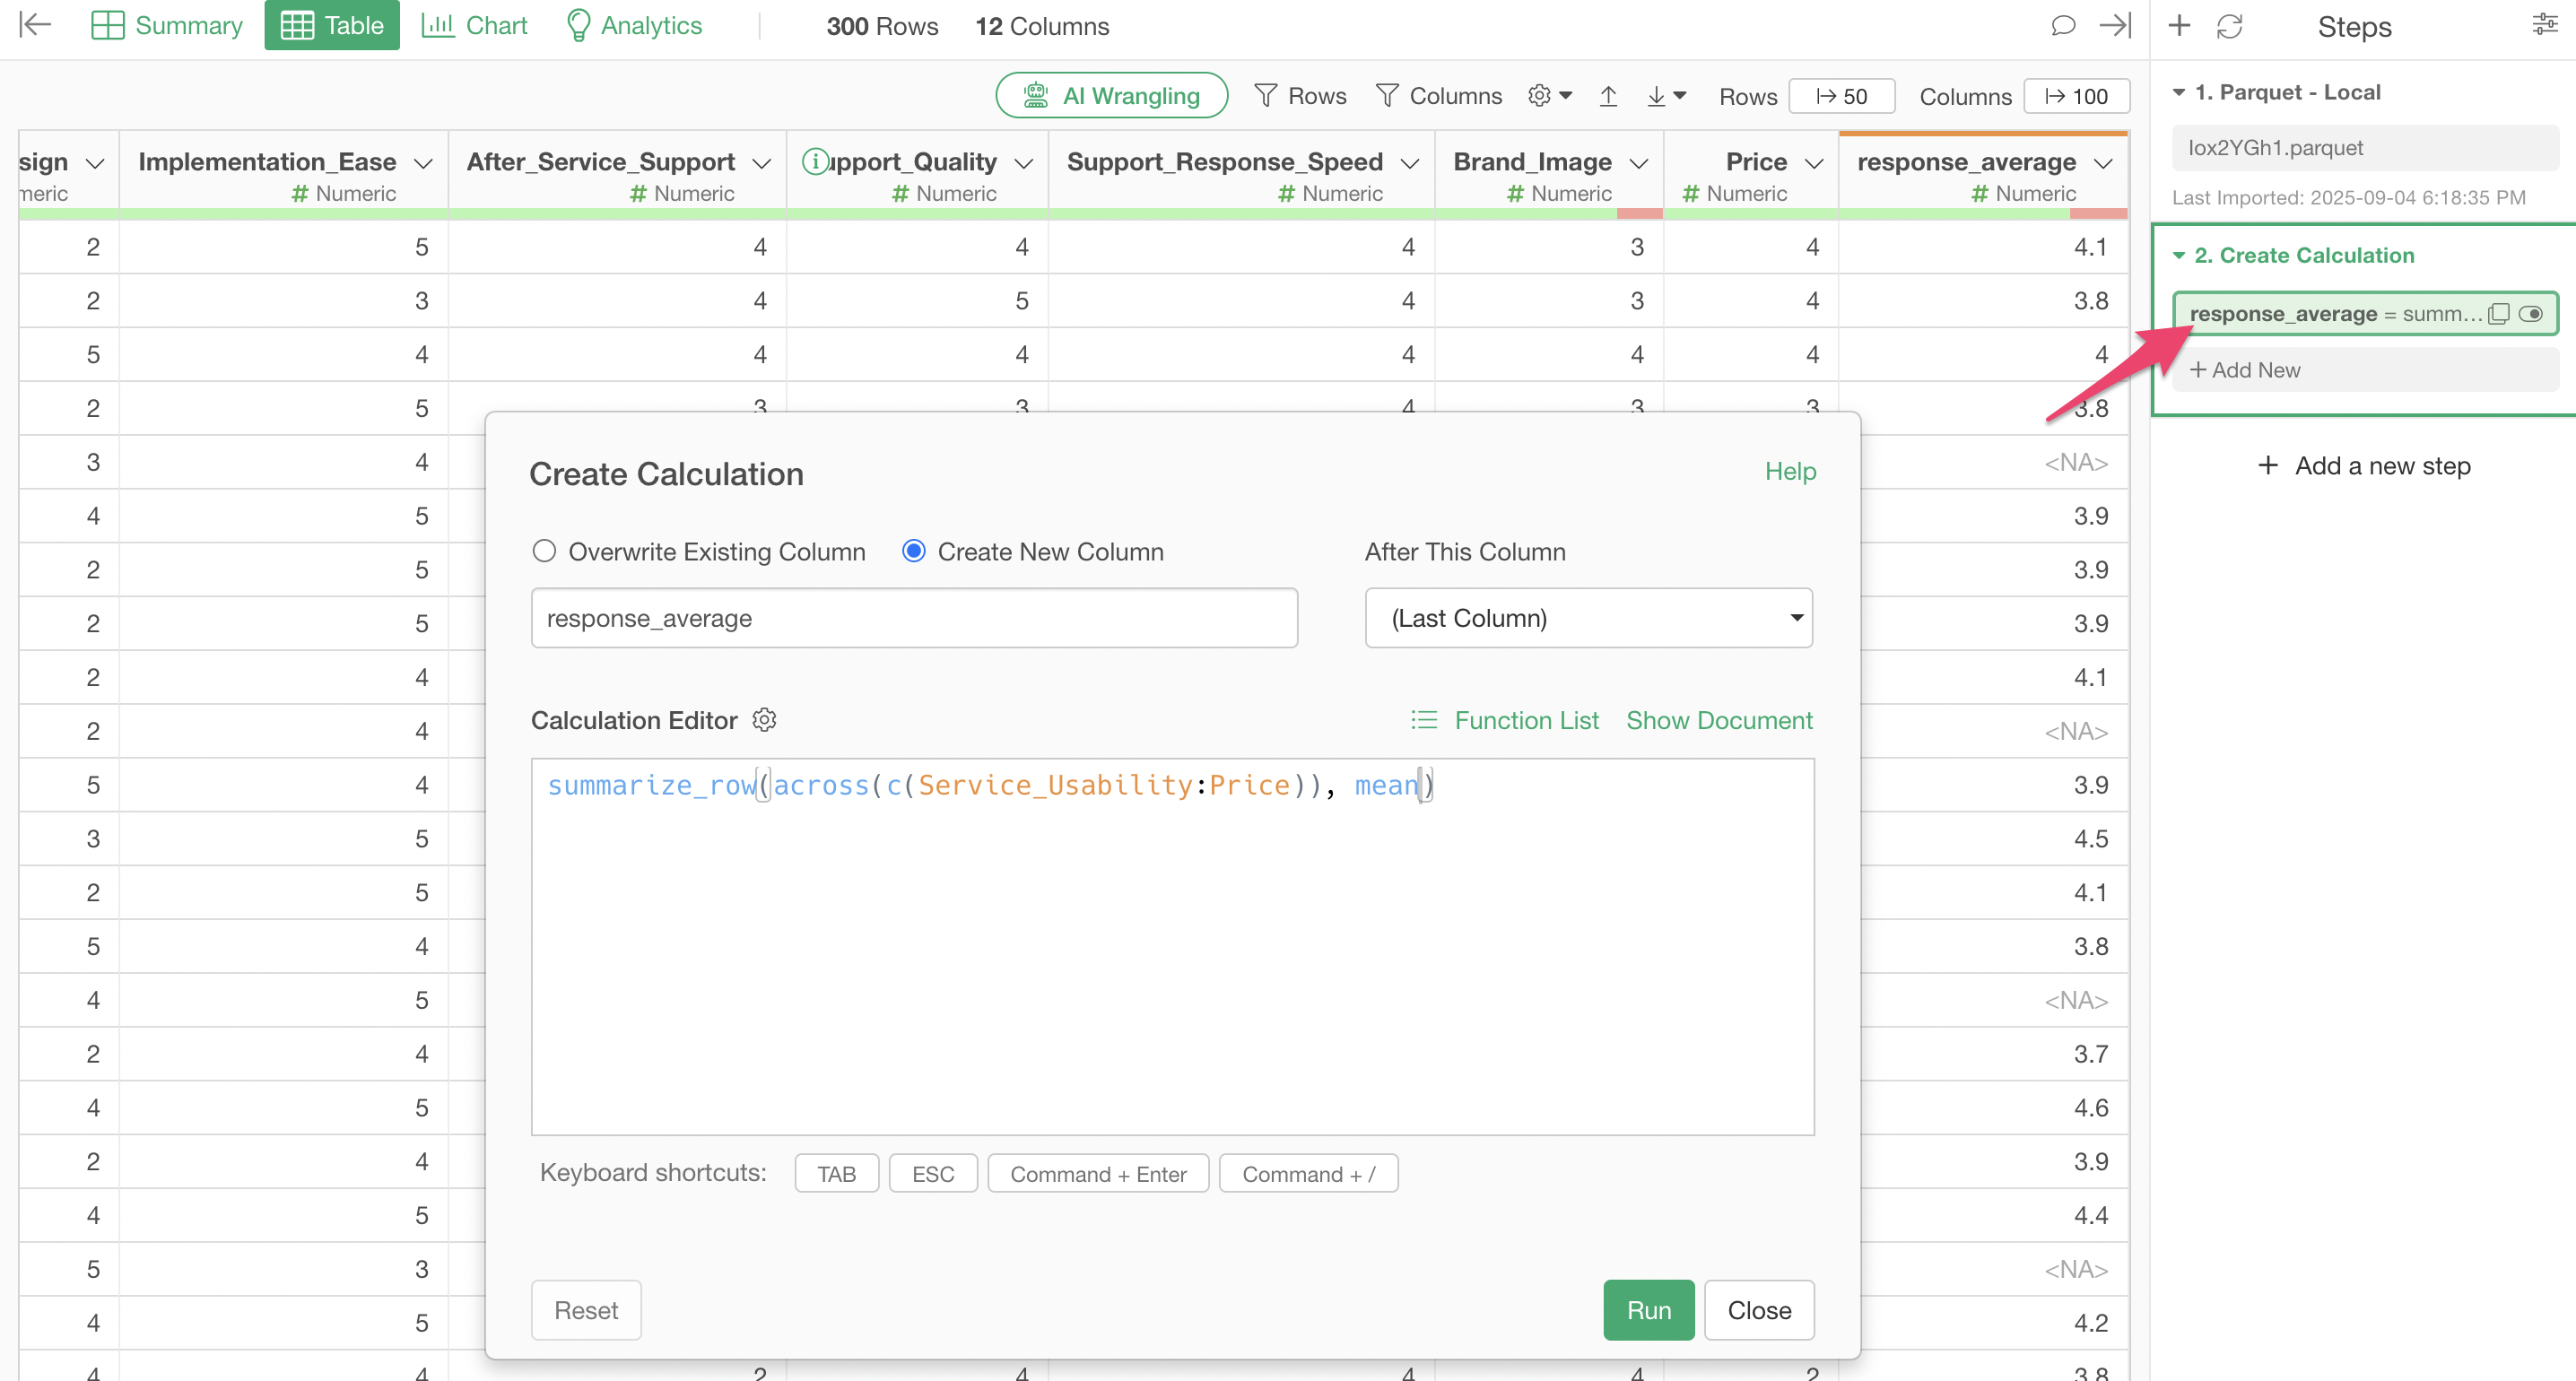
Therefore, click on the token in the “Create Calculation” step to modify the calculation formula.
Add na.rm = TRUE as the last argument to the
summarize_row function.
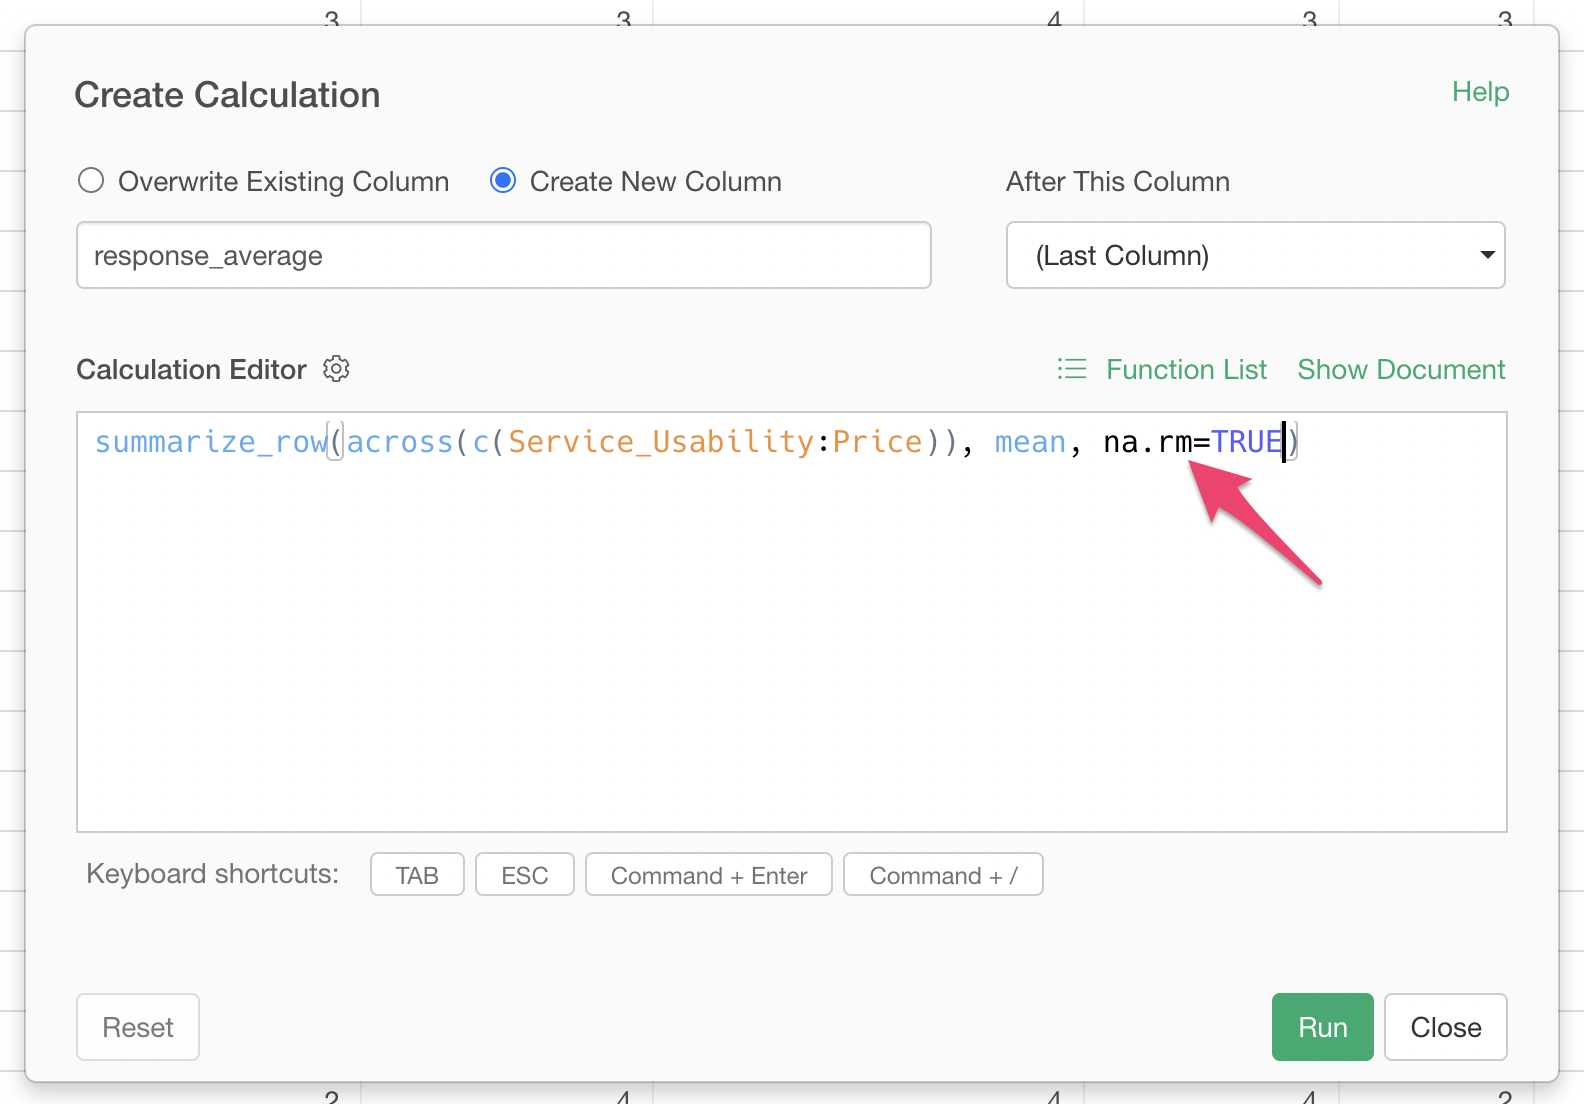
This argument ensures that even if there are missing values in the columns being calculated, the calculation will proceed after removing those missing values.
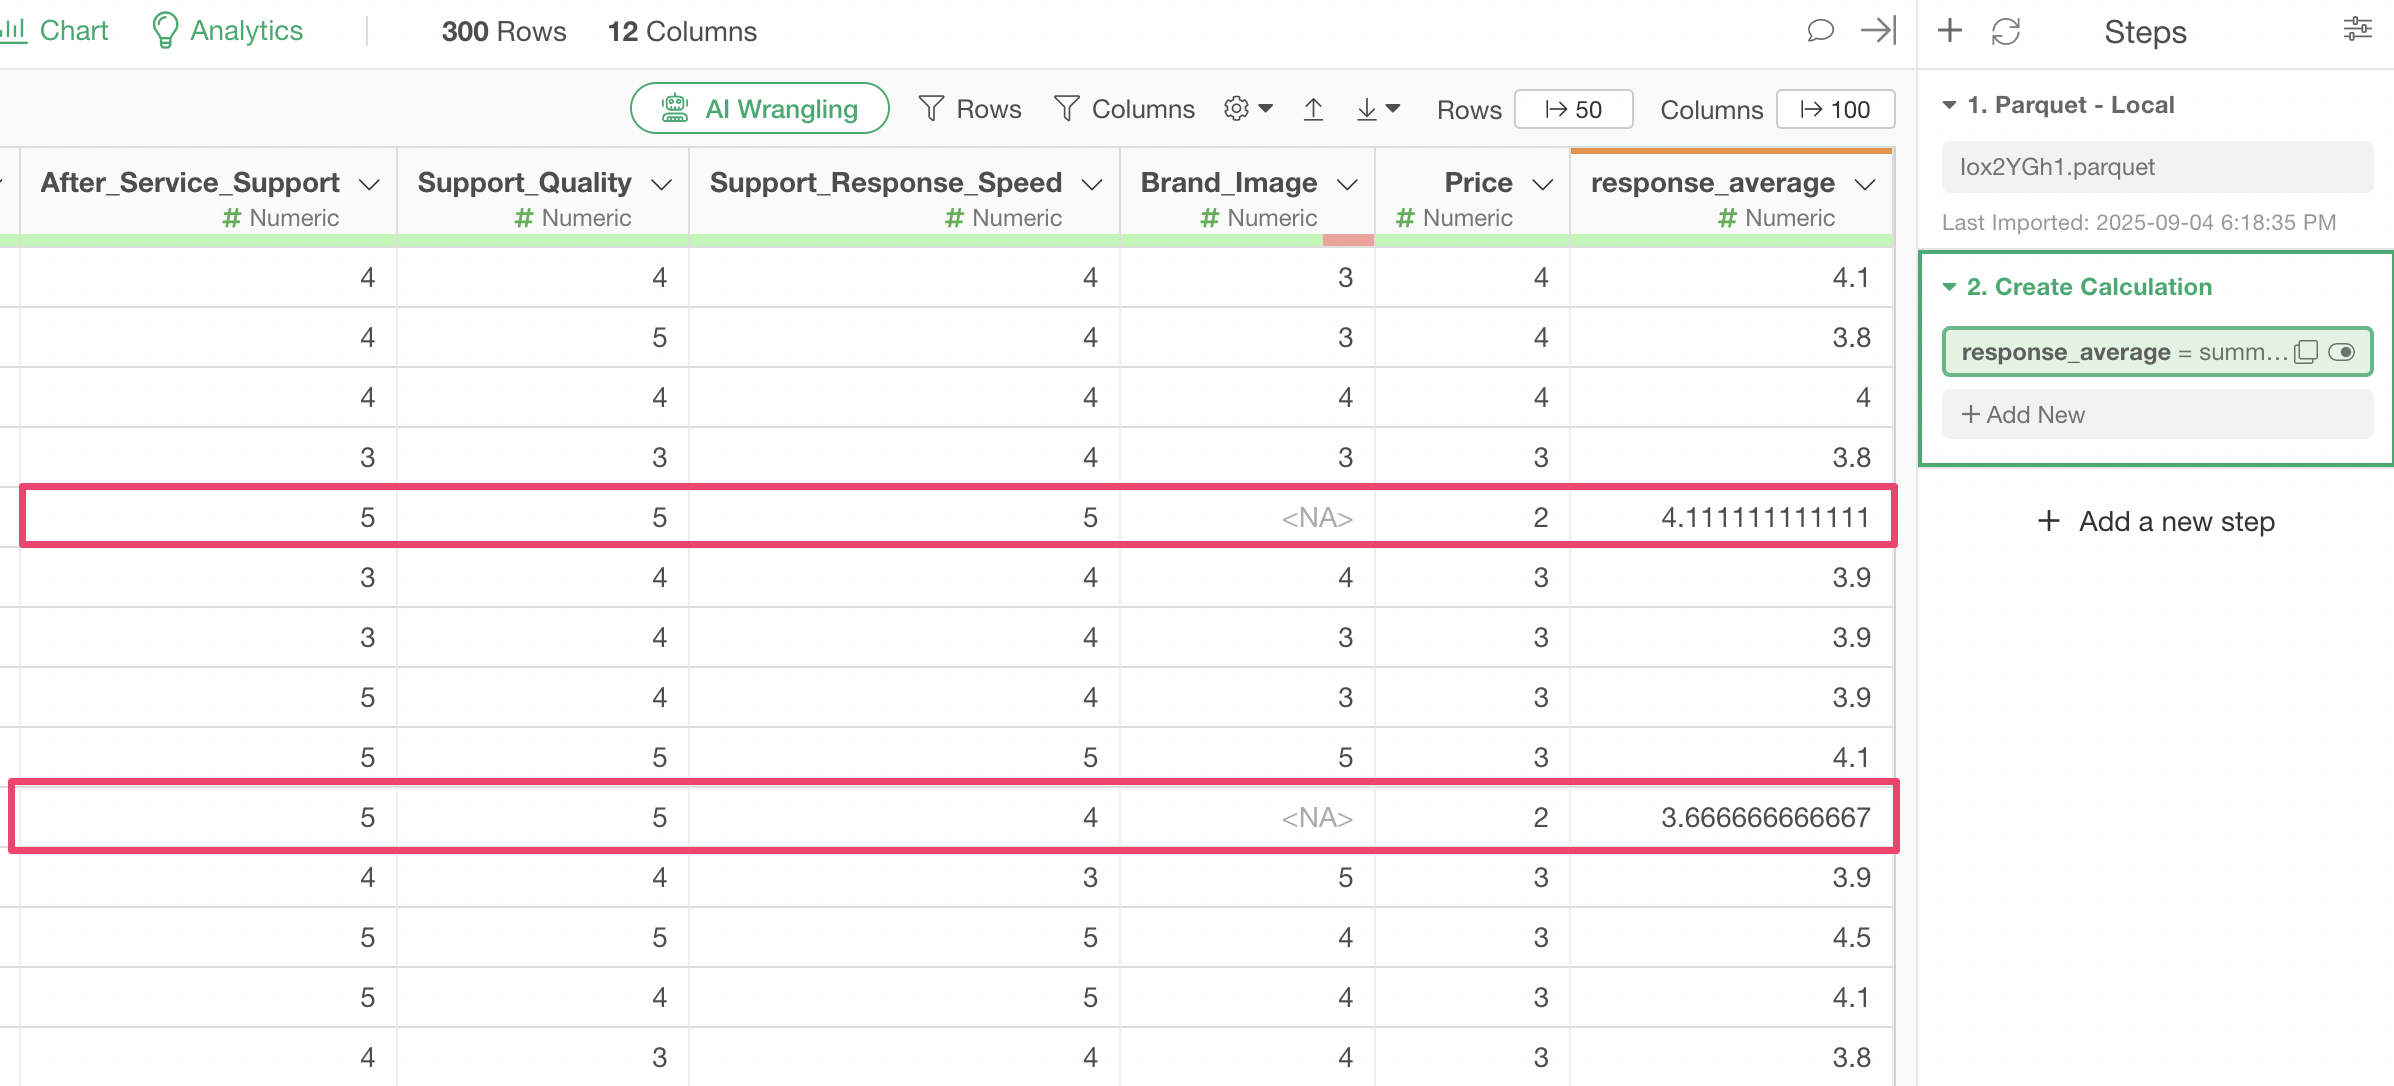
By executing this, you can see that the average response value is calculated even if there are missing values in the target columns.
As introduced this time, if you want to calculate aggregated values
row by row, try using the summarize_row function!