How to Calculate Weighted Means and Proportions Based on Propensity Weights
When aggregating and analyzing survey data, each respondent may be assigned a propensity weight, which indicates how well that individual represents the overall population.
For datasets with such weights, using weighted summaries instead of simple means or proportions provides a more accurate reflection of population trends.
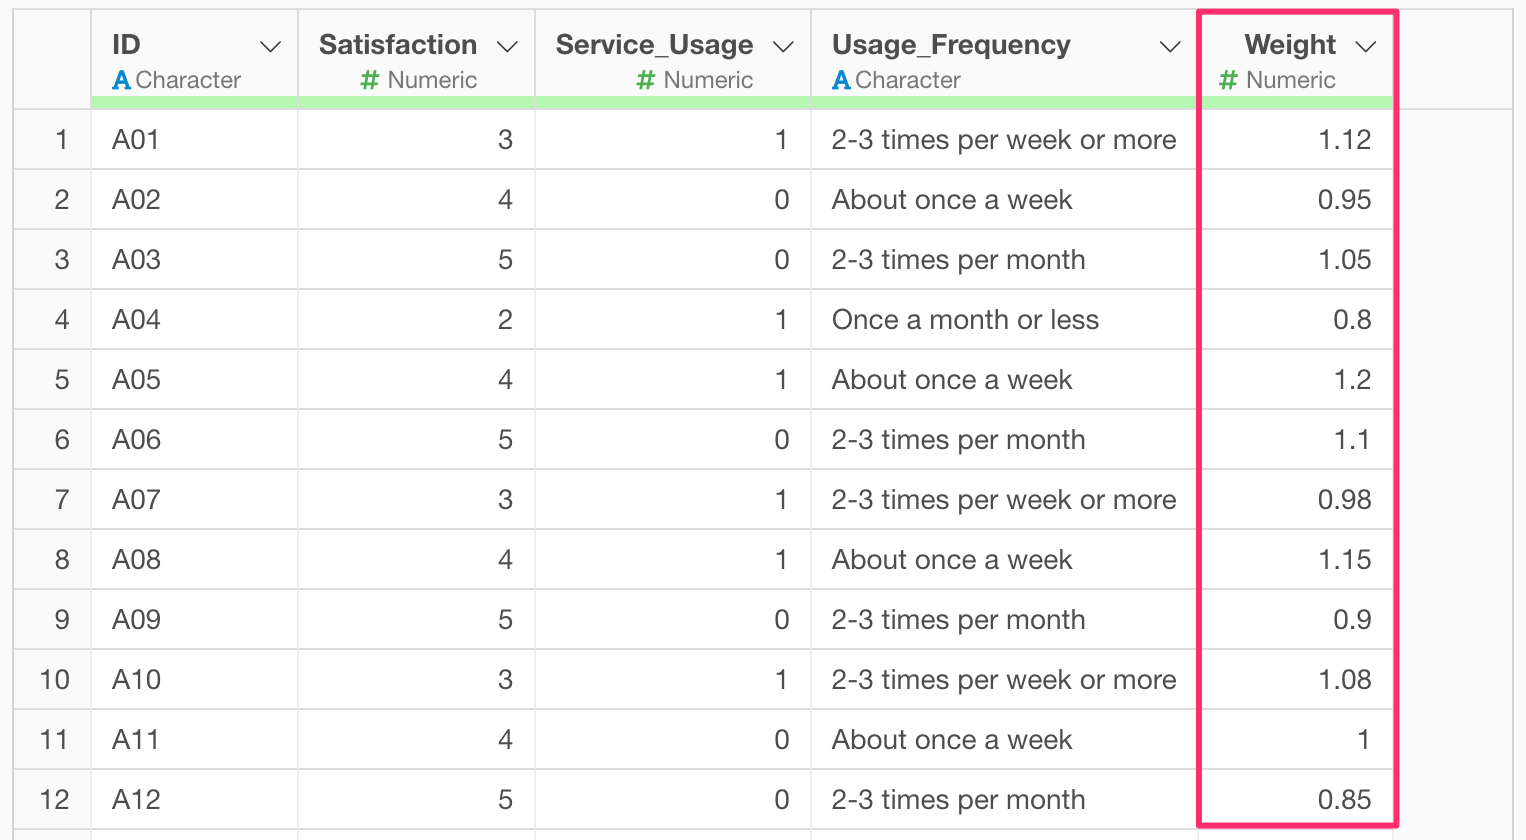
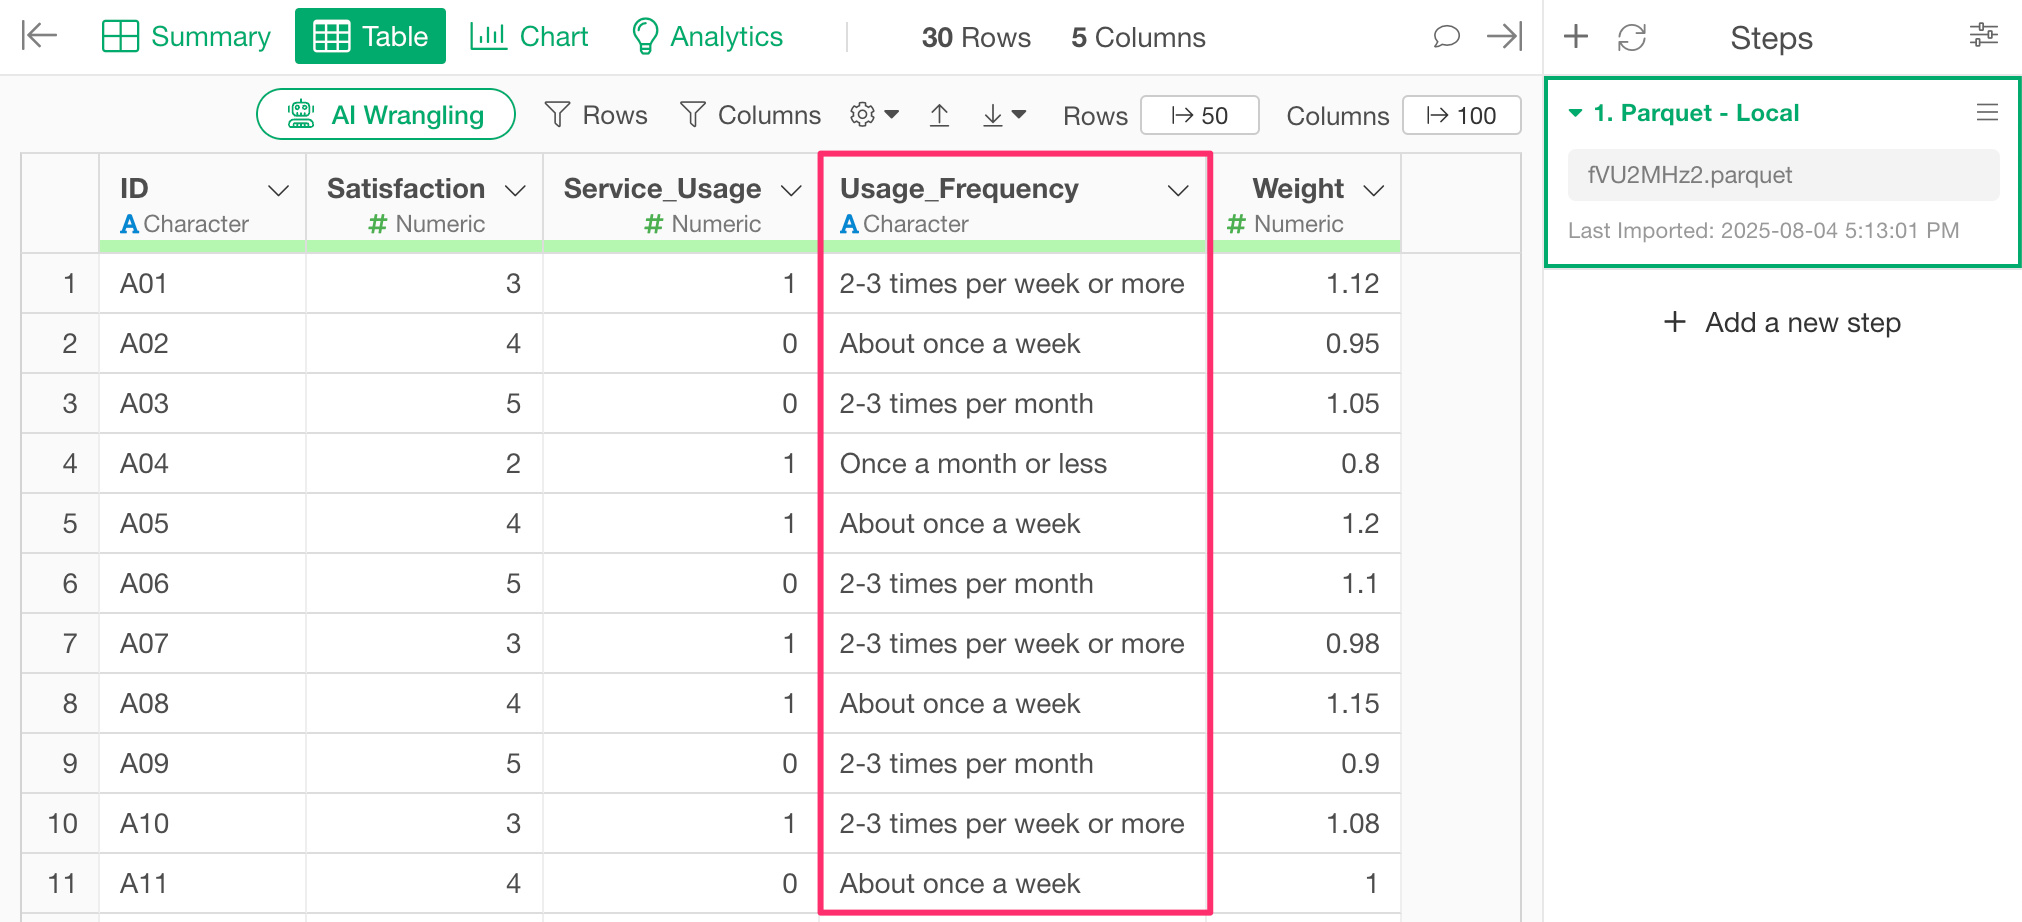
This note demonstrates how to calculate weighted means and proportions using survey data, where each row represents a single respondent with the propensity weight.
How to Calculate Weighted Means
Here we use the “Satisfaction” column as an example to compute a weighted mean.
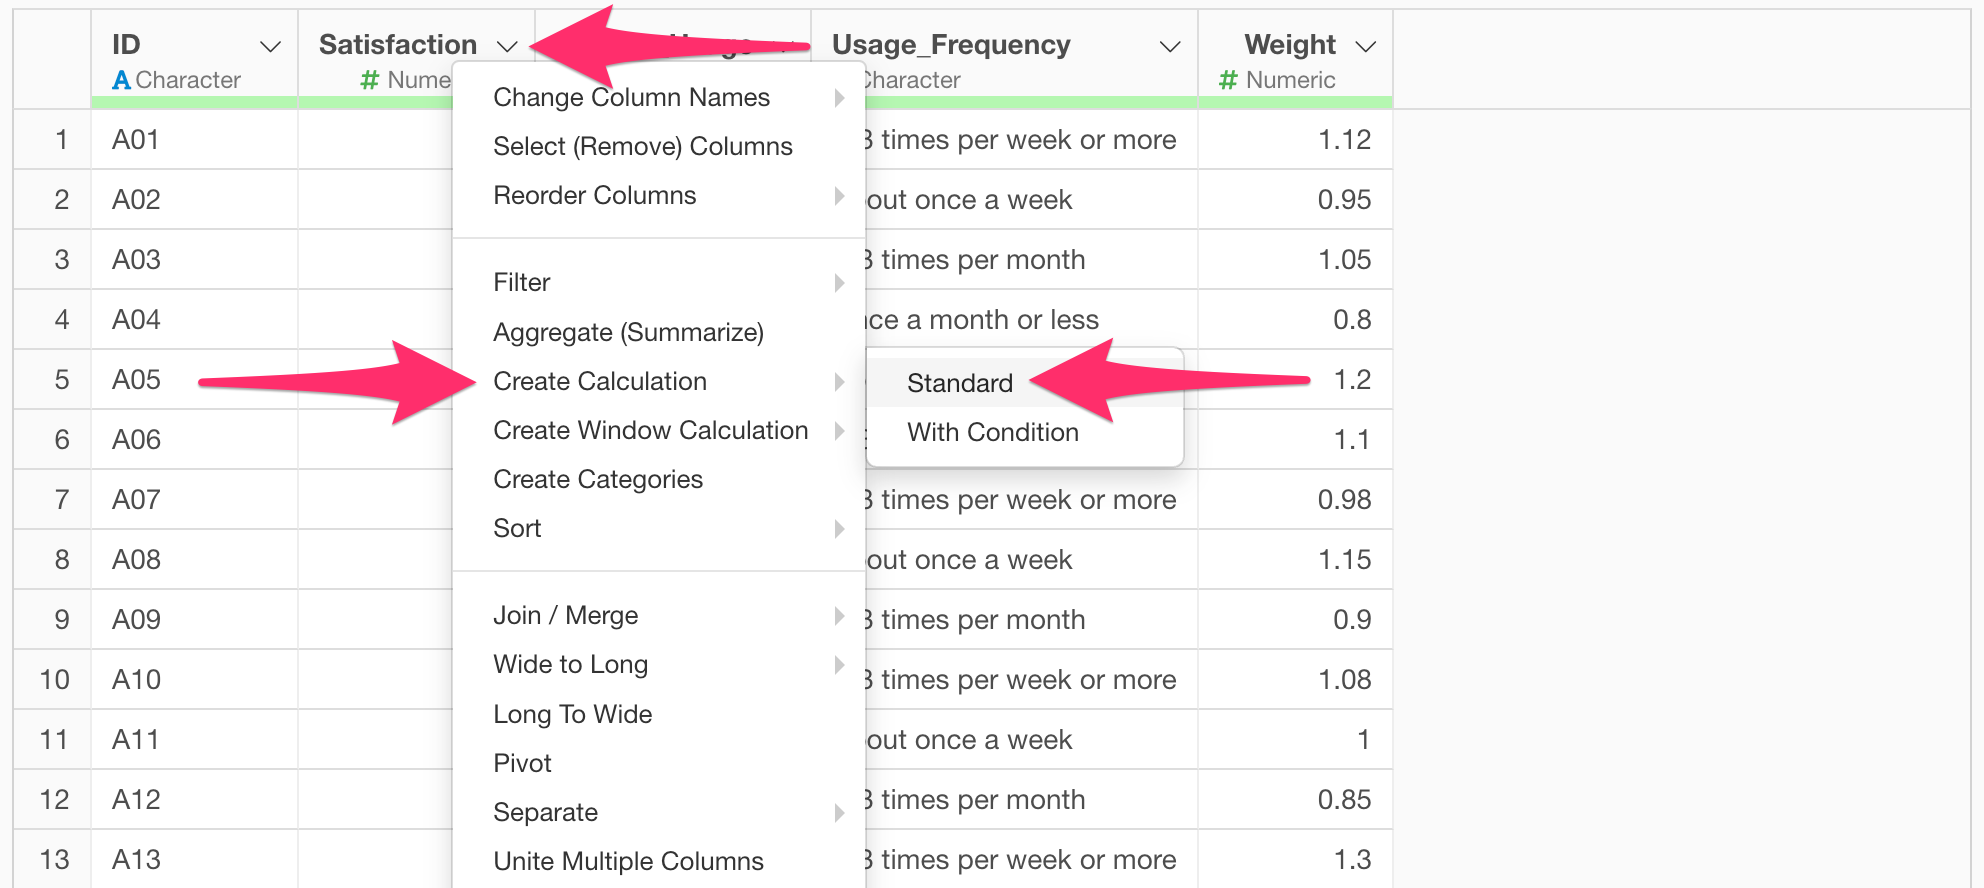
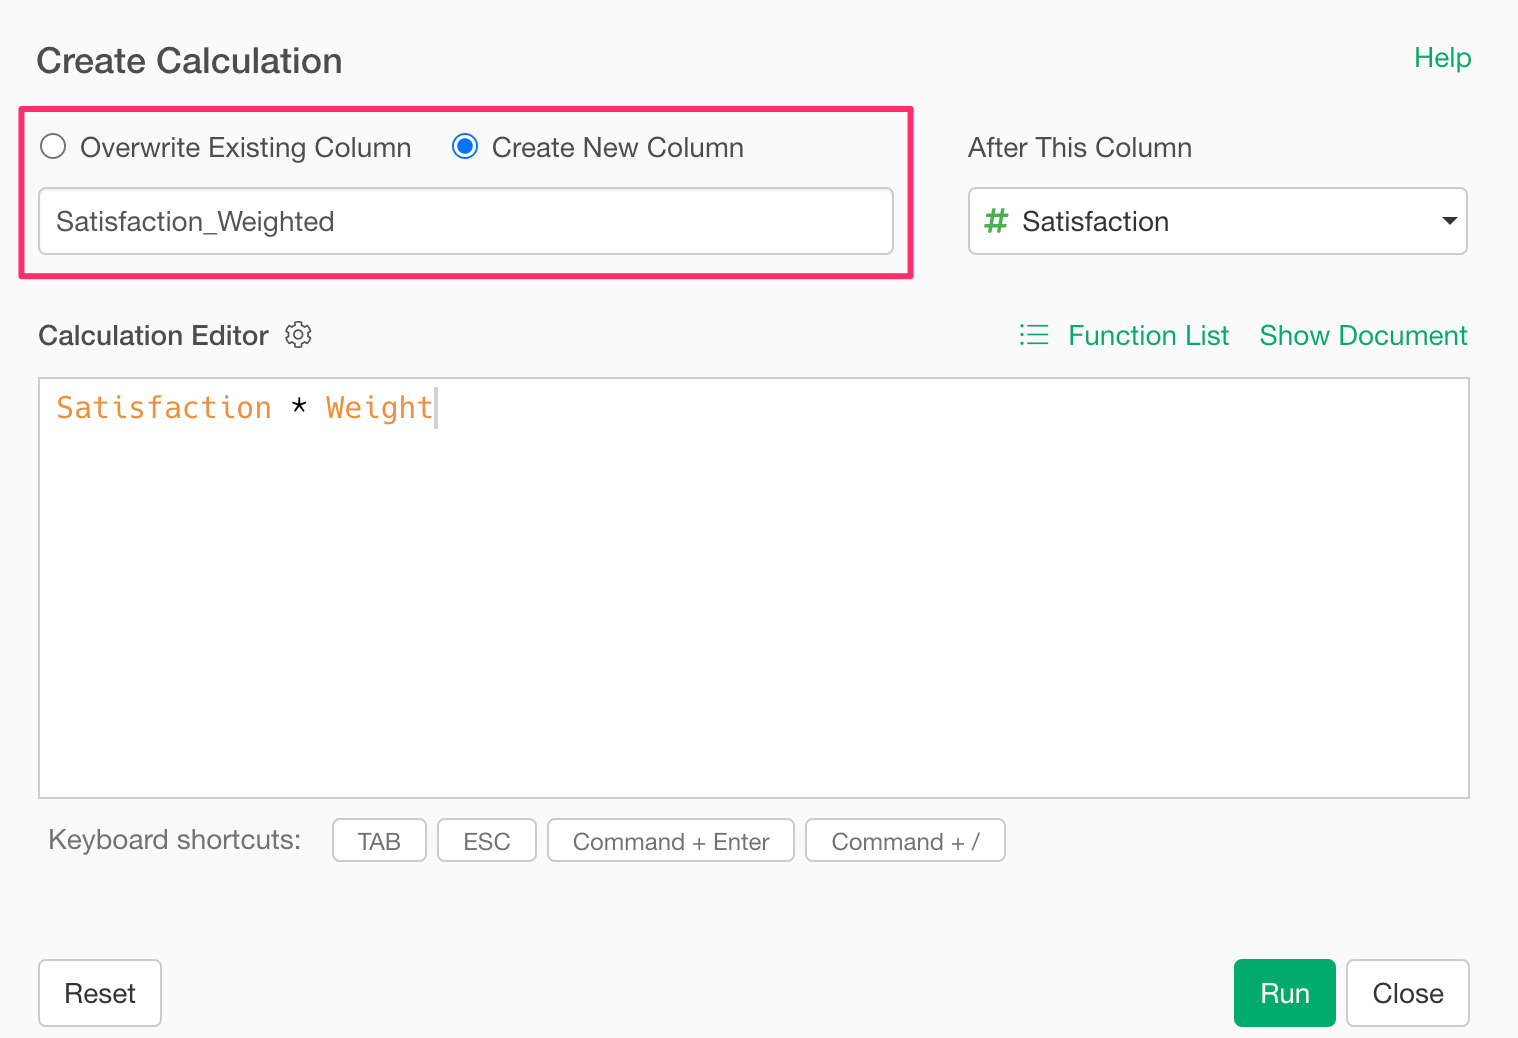
First, create a new column that multiplies the Satisfaction score by the Weight.
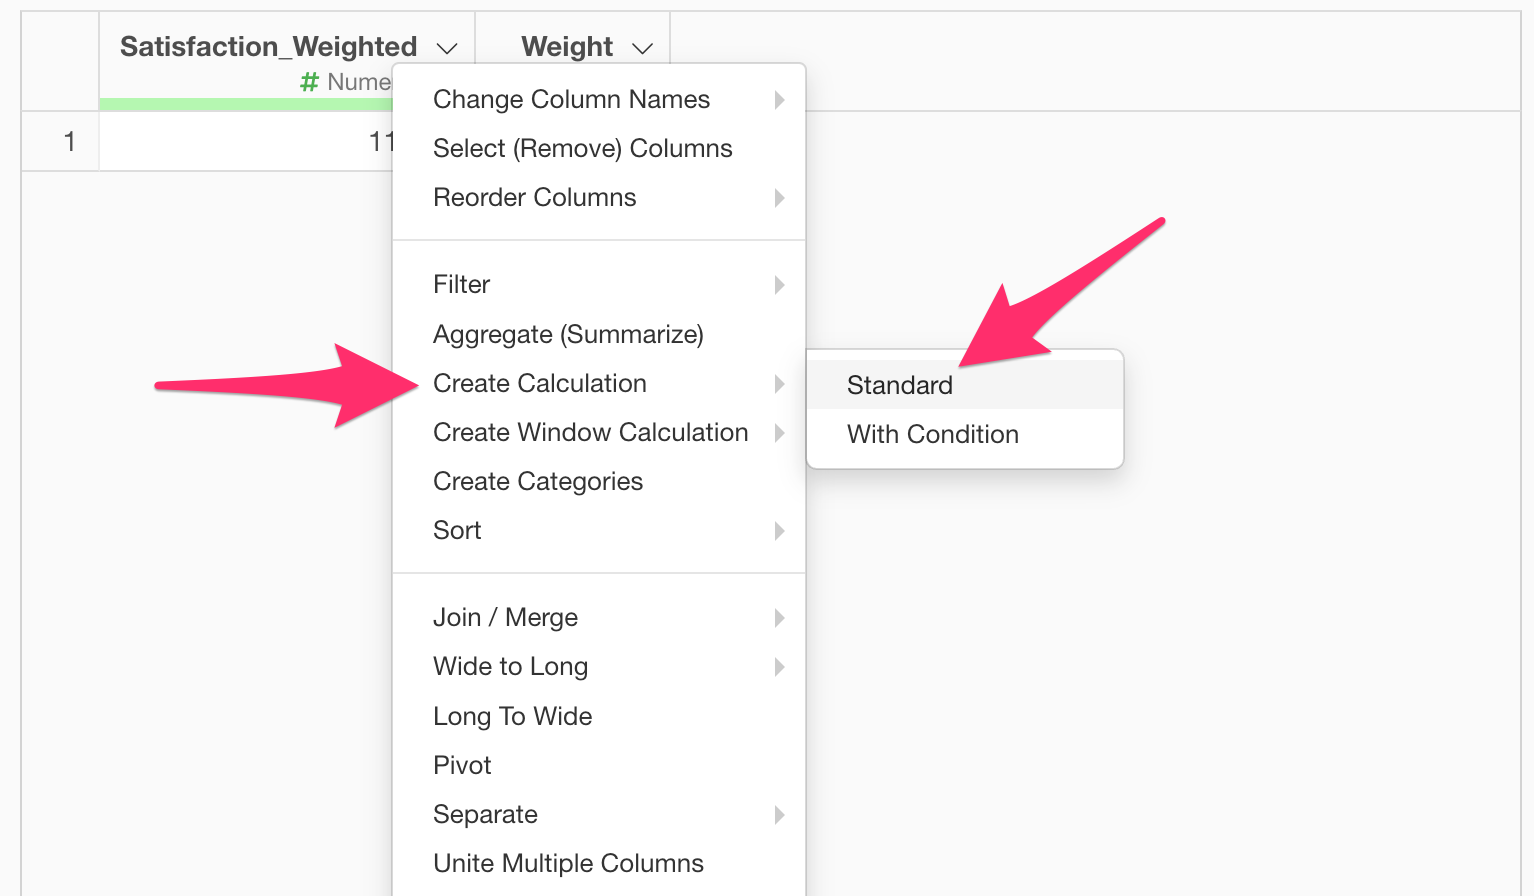
Click on the “Satisfaction” column header, then choose “Create Calculation” and “Standard.”
In the calculation dialog, enter the following formula:
Satisfaction * Weight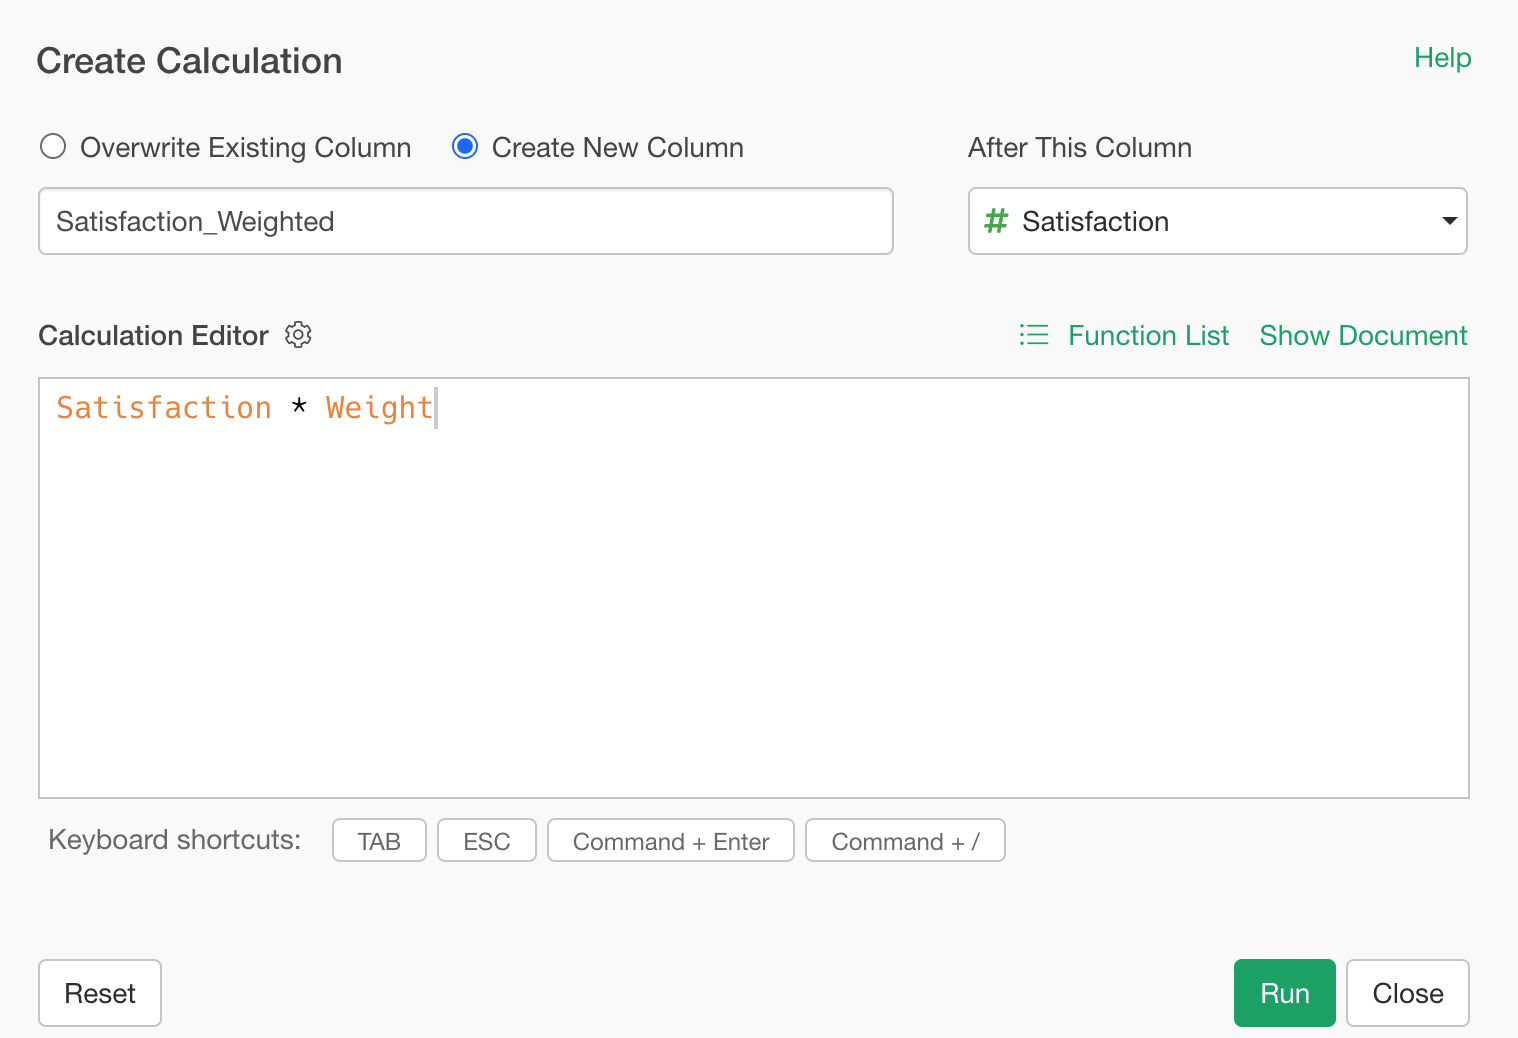
Ensure “Create new column” is checked, and name the column “Satisfaction_Weighted” and click the “Run” button.
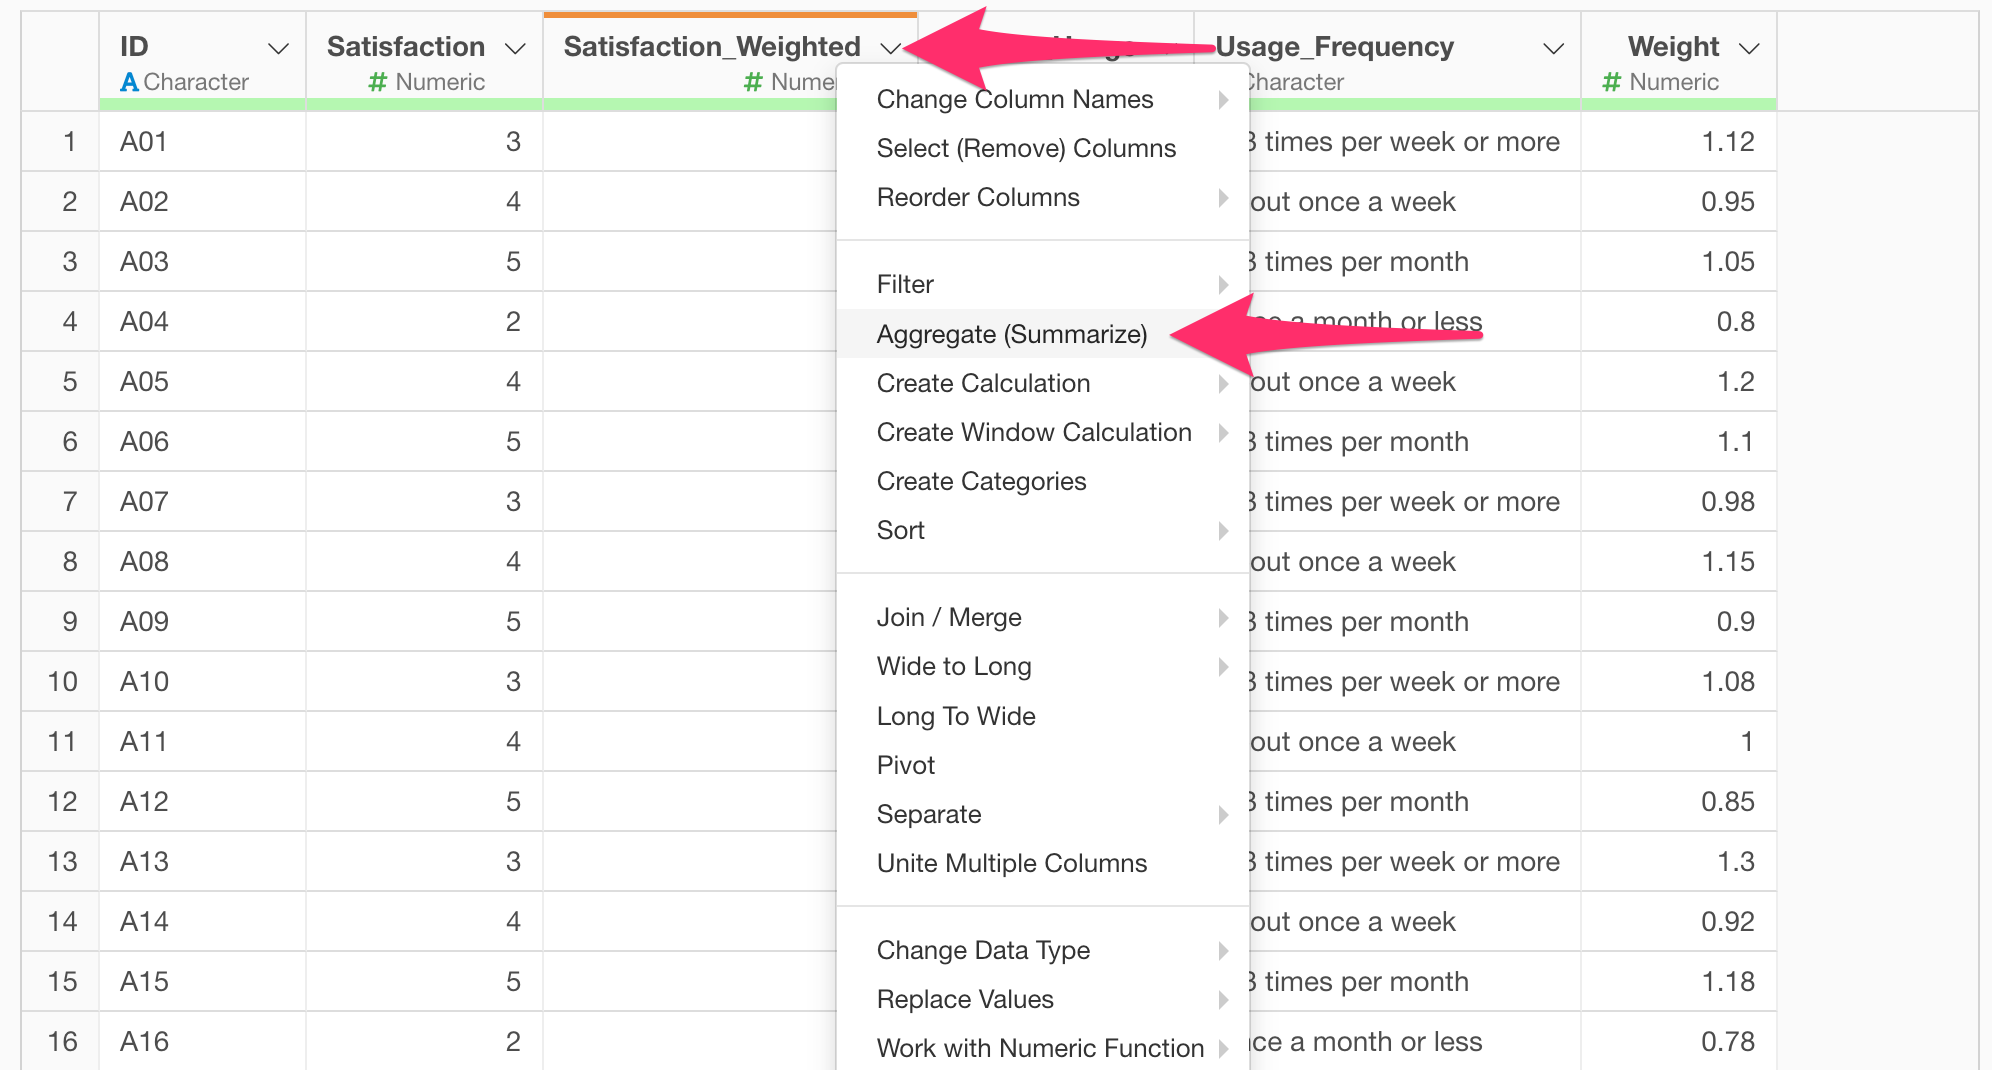
Next, sum the values of both the “Satisfaction_Weighted” and “Weight” columns. From the “Satisfaction_Weighted” header menu, choose “Aggregate(Summarize)”.
In the summarize dialog, select “Satisfaction_Weighted” and “Weight” as values, and use the “SUM” function for both.
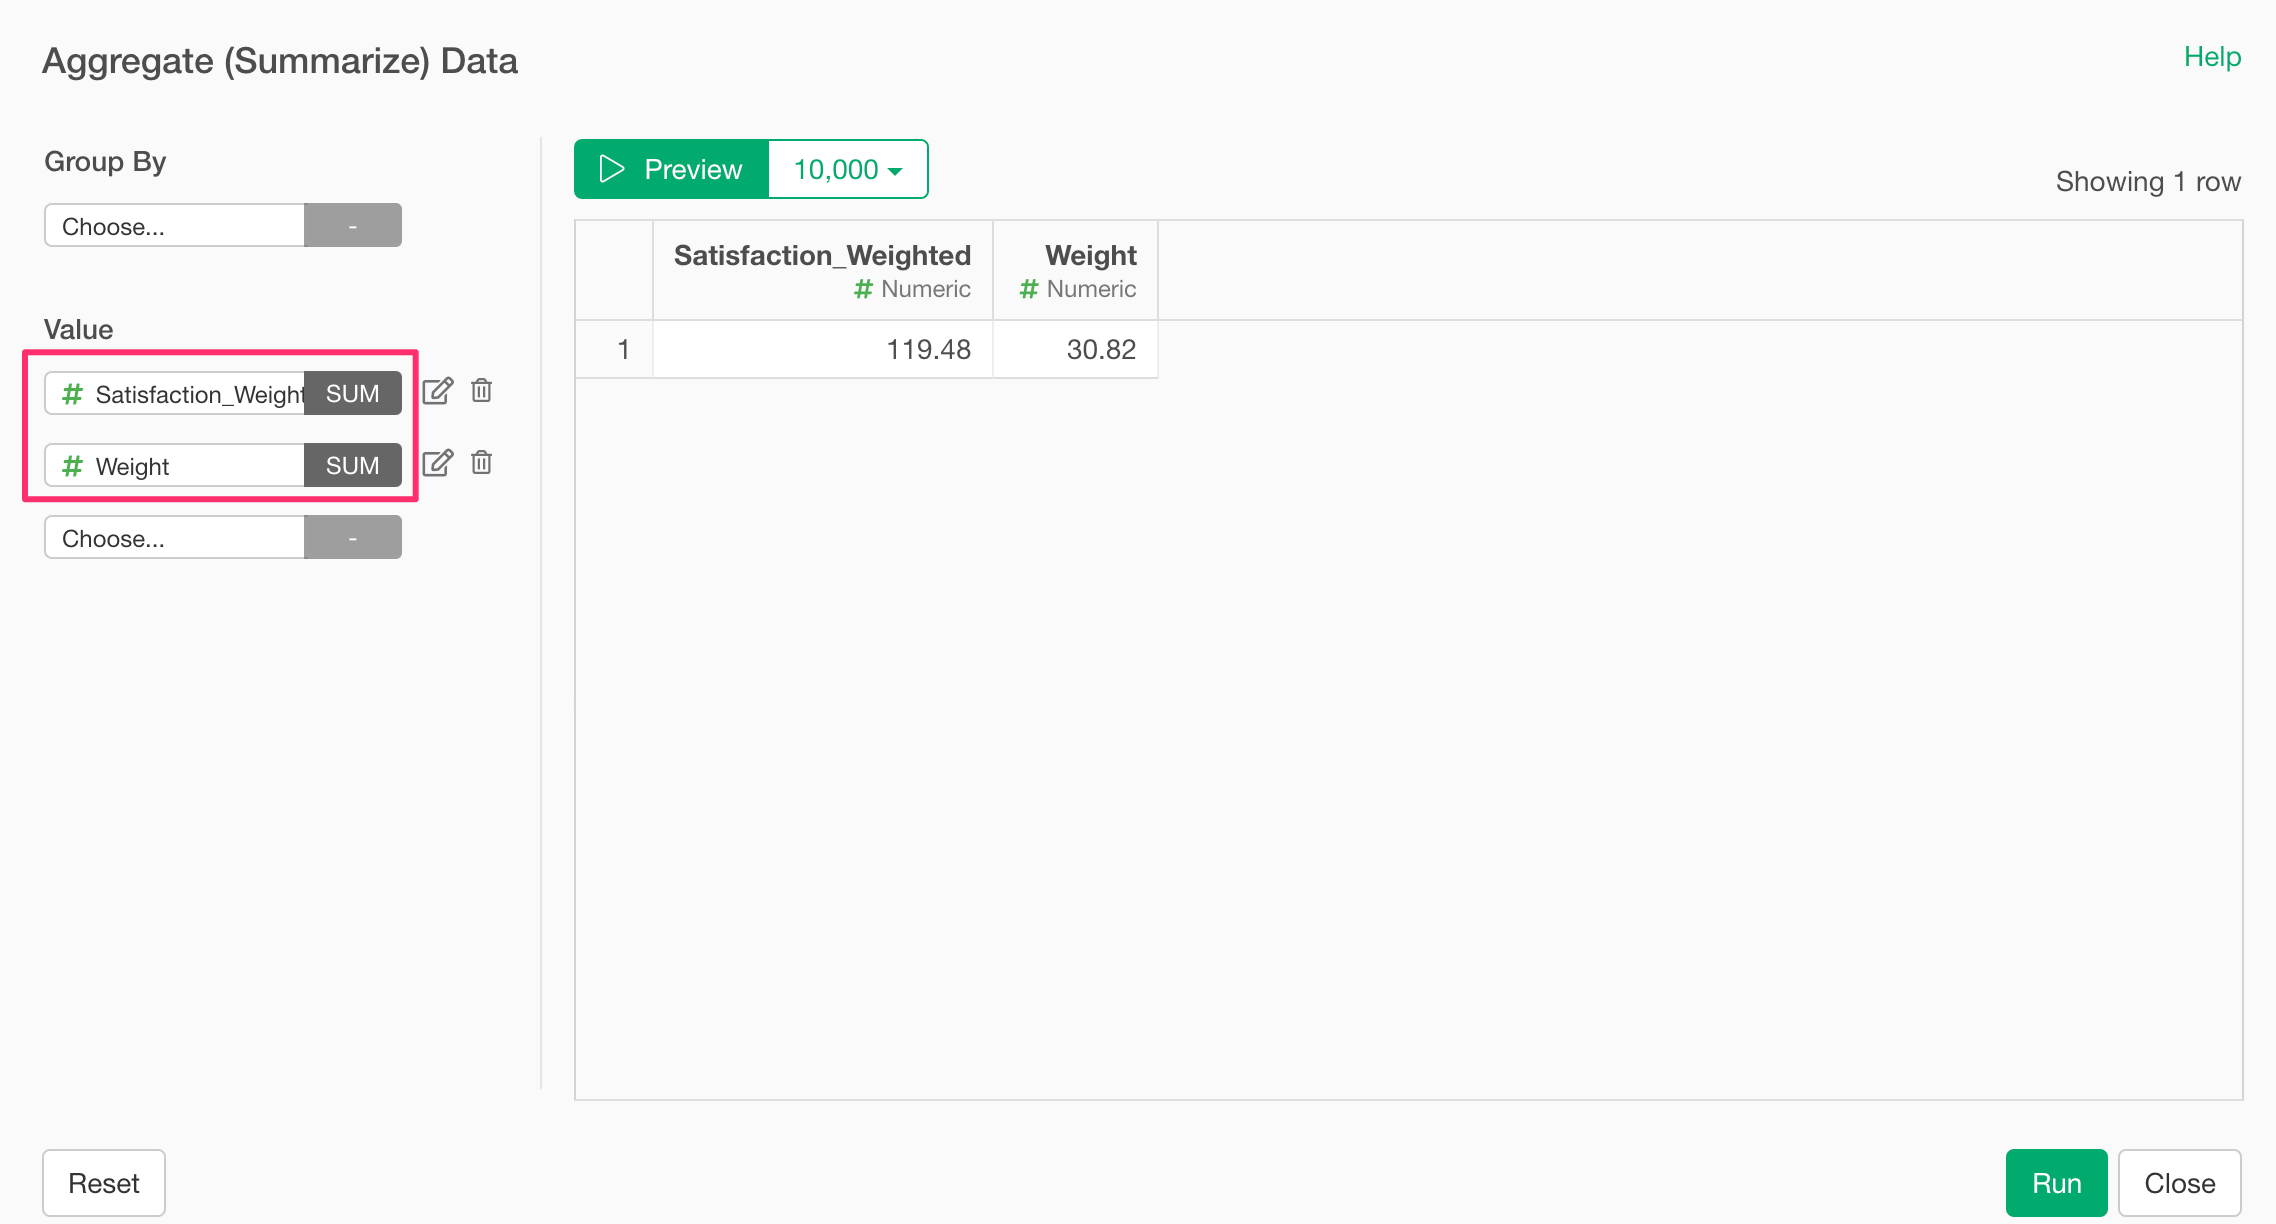
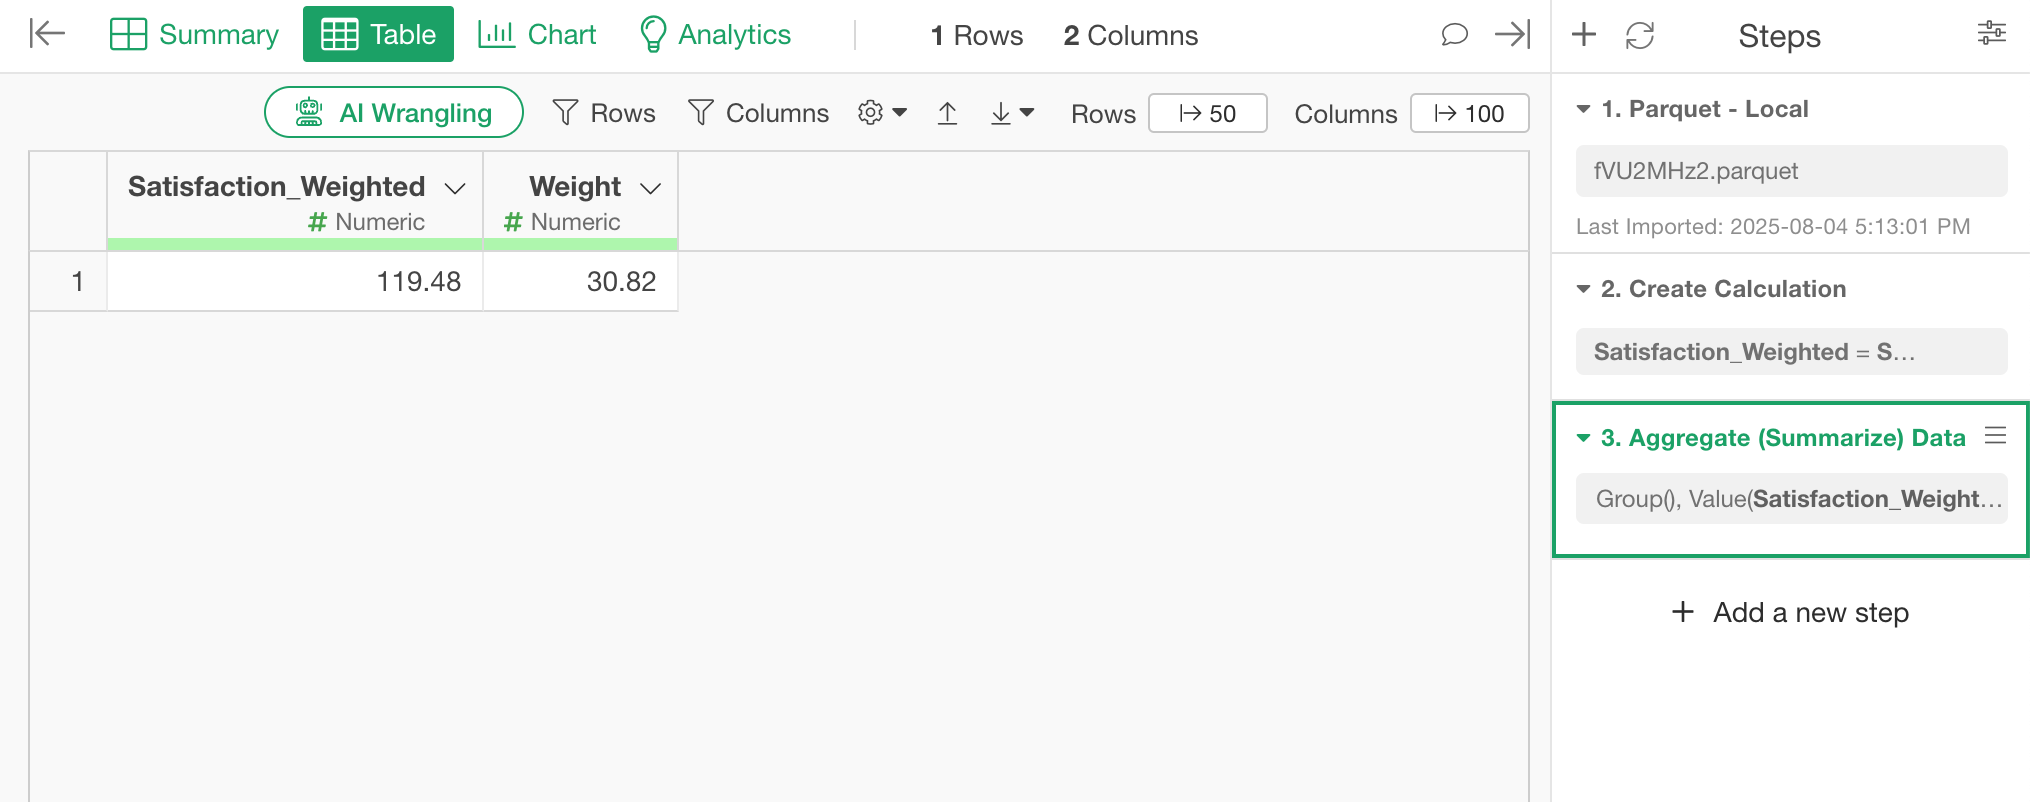
Verify the totals in the preview and click run button.
You now have the total of weighted satisfaction scores and the total weights.
 Finally,
use these totals to calculate the weighted mean:
Finally,
use these totals to calculate the weighted mean:
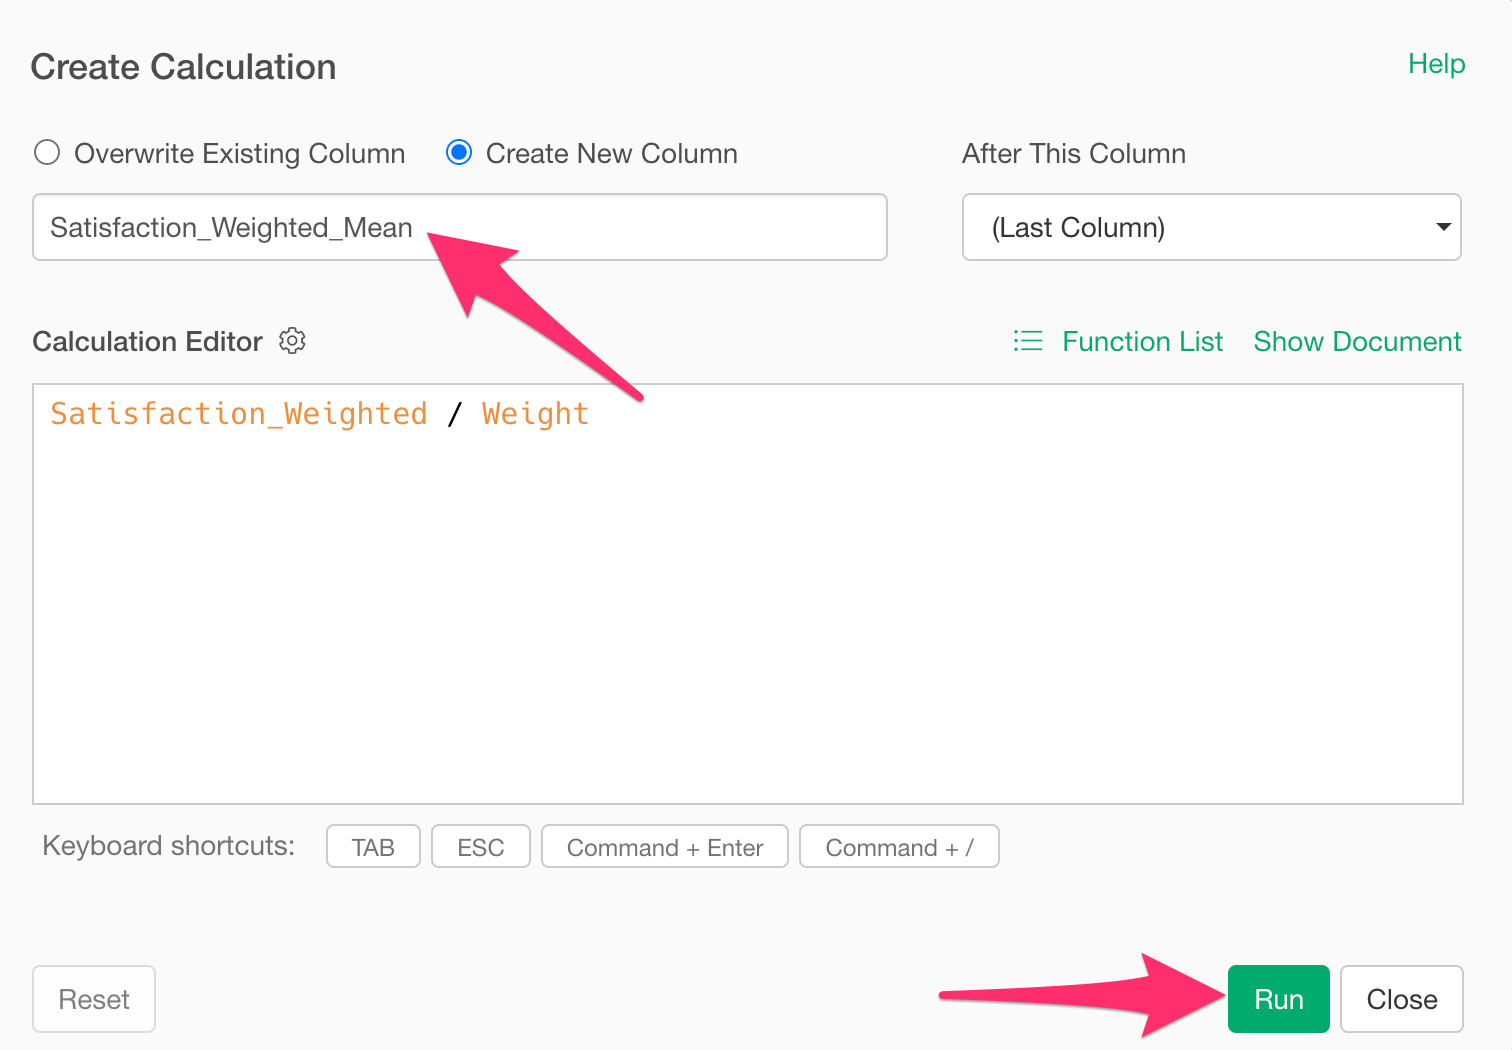
Again, select “Create Calculation”, “Standard”.
Enter the formula as follows:
Satisfaction_Weighted / Weight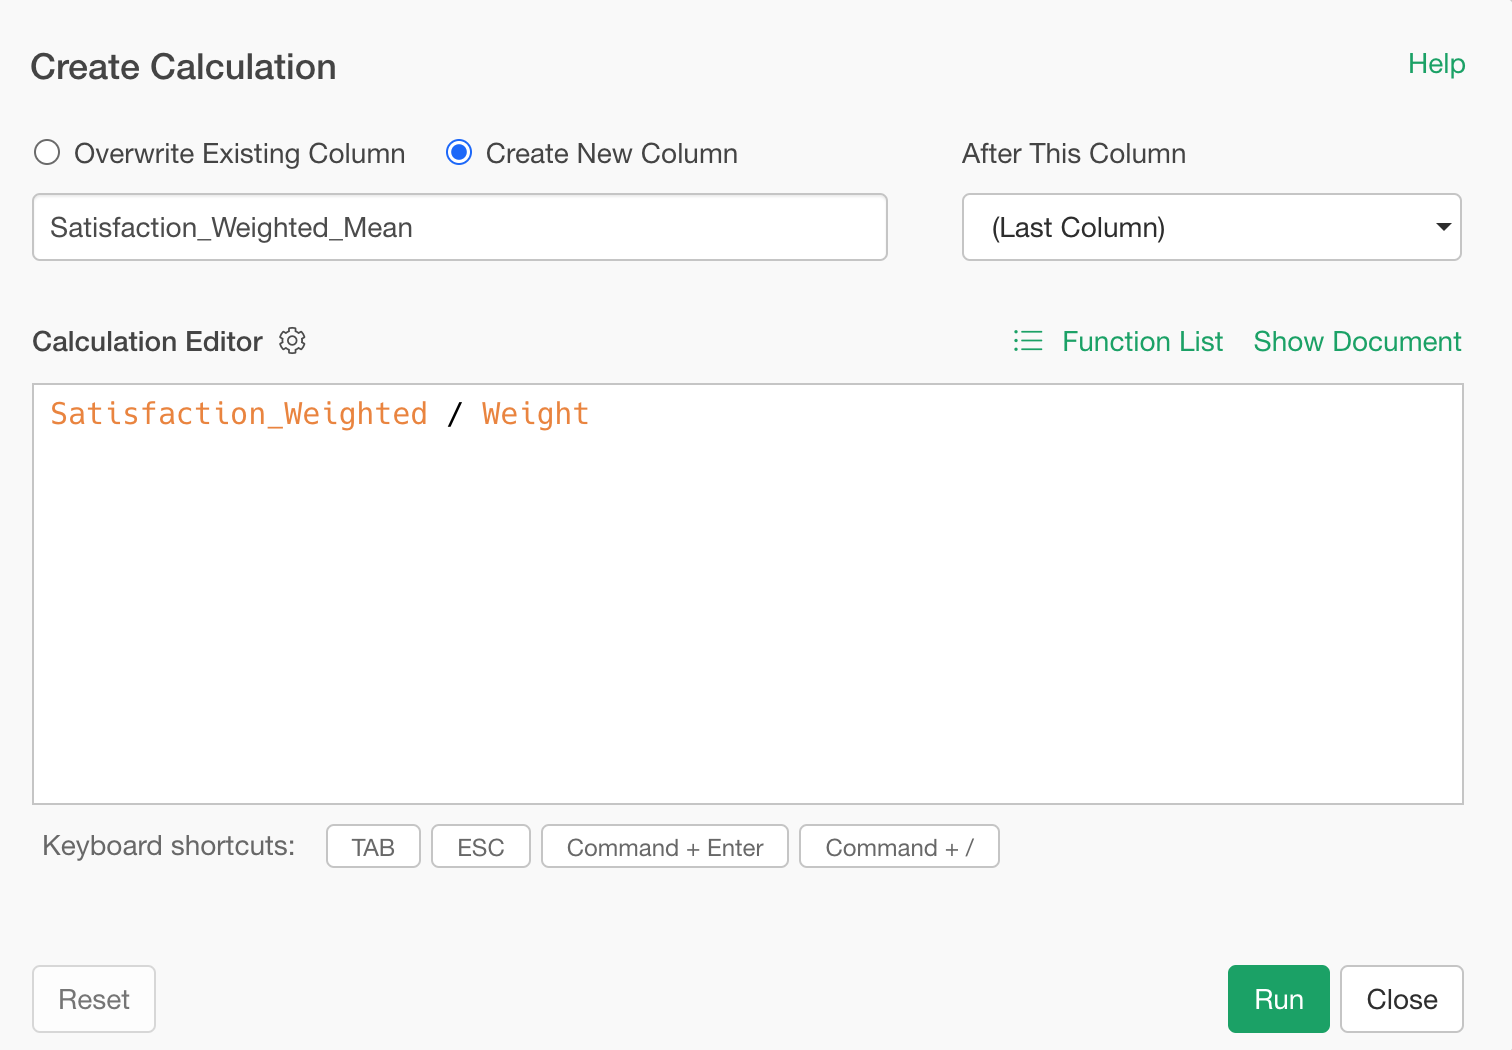
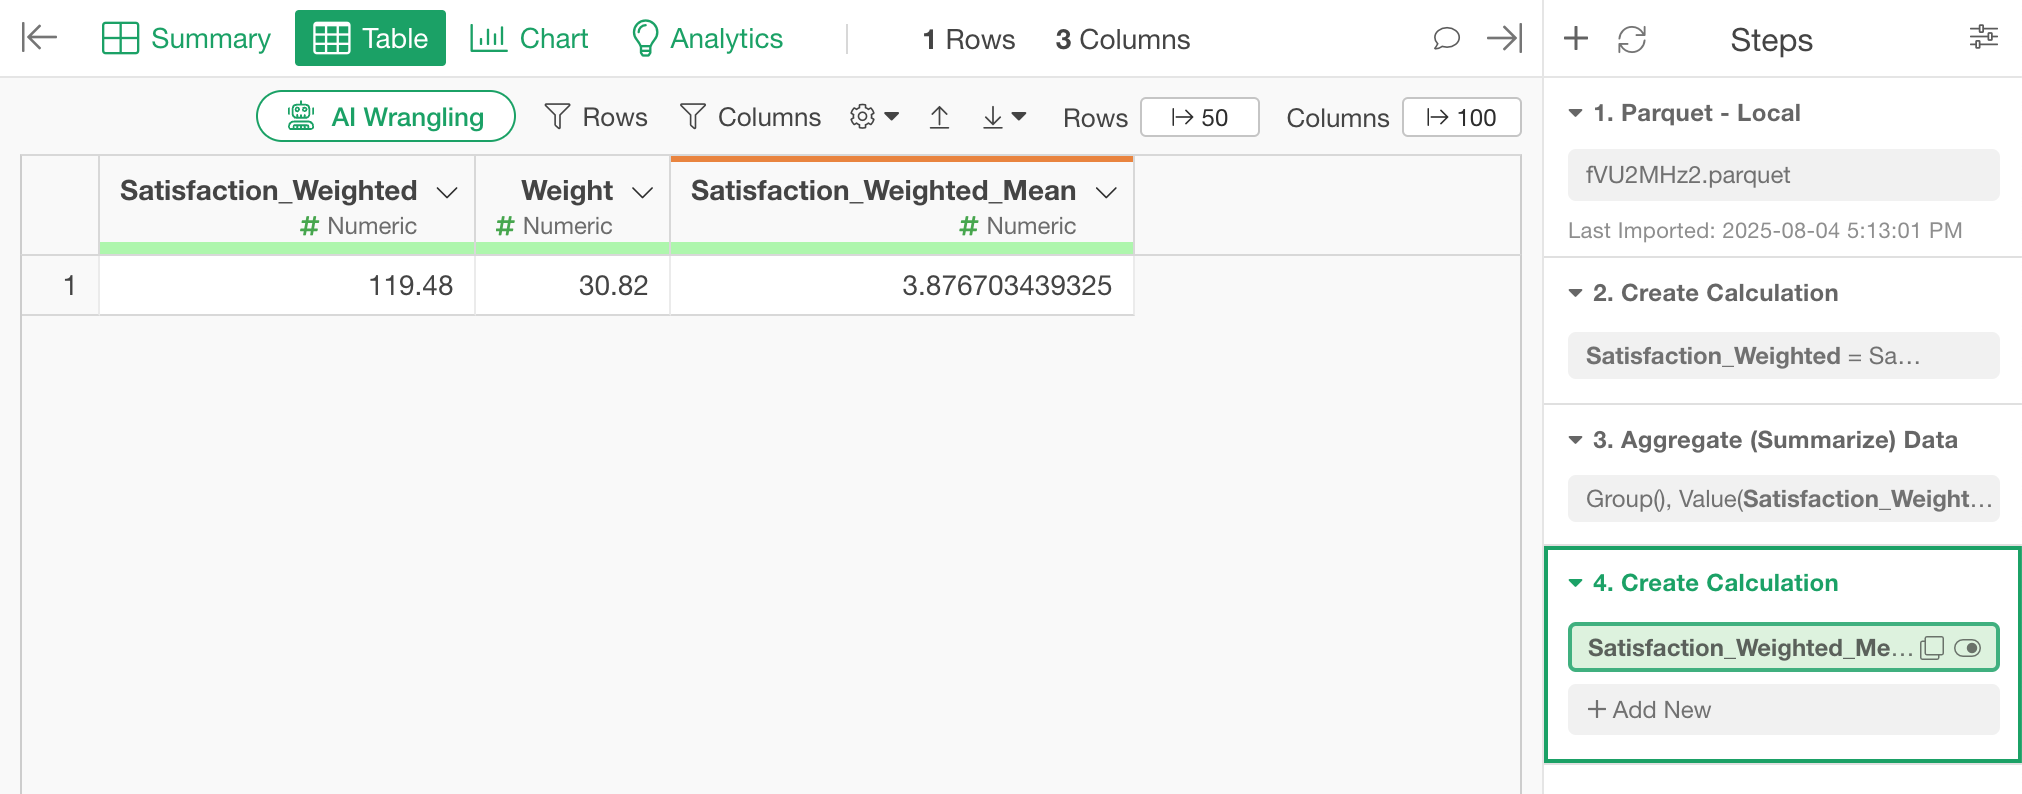
Set the column name to “Satisfaction_Weighted_Mean” and click run.
This gives you the population-weighted mean satisfaction score.
How to Calculate Weighted Proportions for Binary Data
Next, we’ll compute the weighted proportion for binary data (e.g., “Service_Usage”).
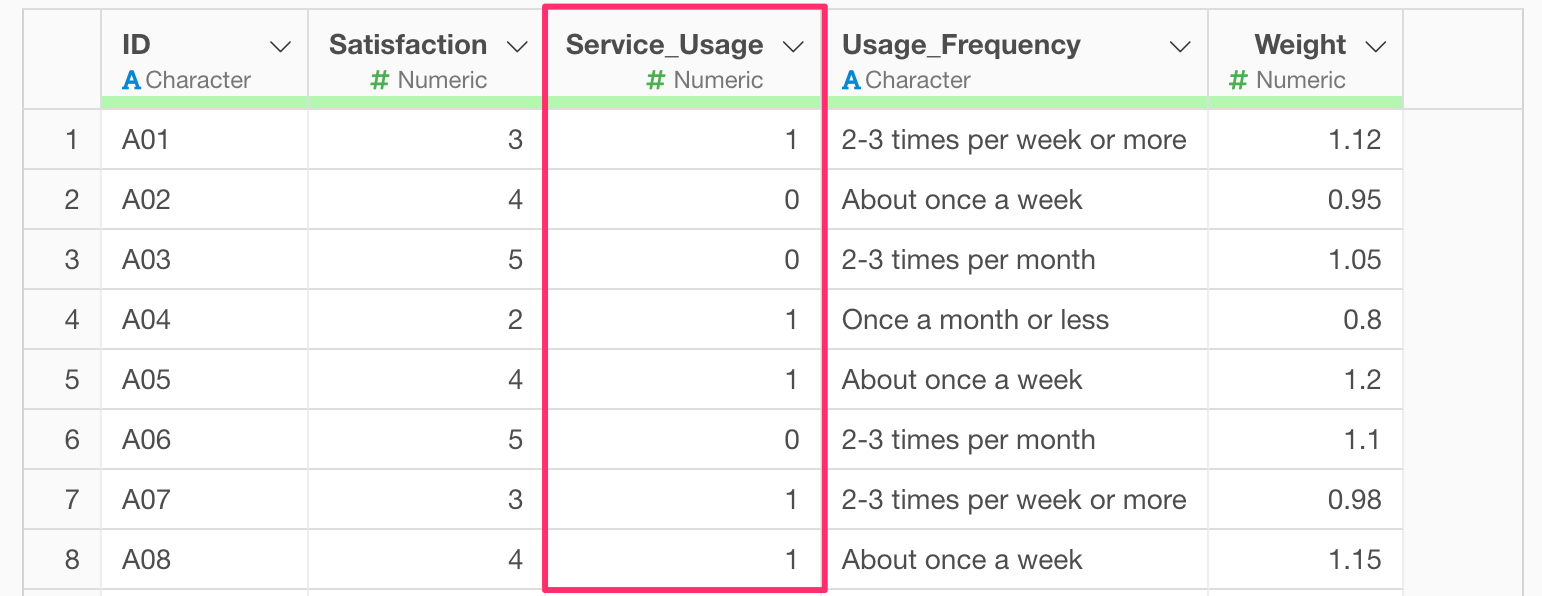
First, create a column by multiplying the “Service_Usage” column by the Weight.
From the “Service_Usage” header menu, select “Create Calculation”.
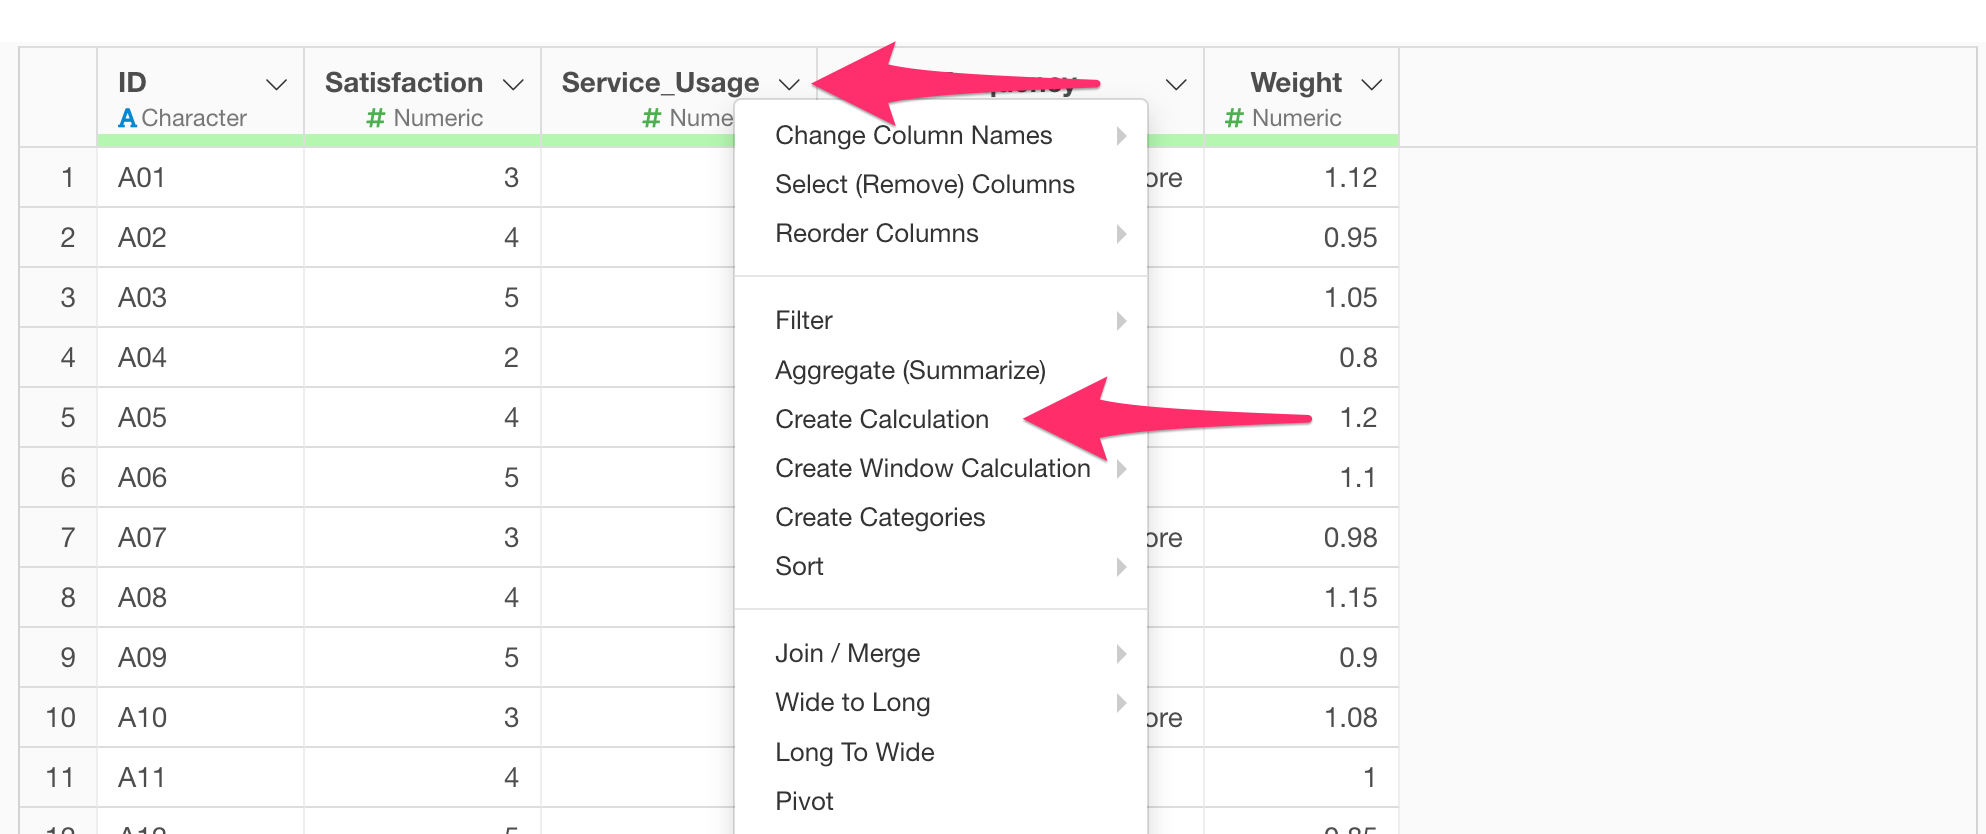
This works the same even if your data is logical (TRUE/FALSE), so proceed regardless of the format.
In the create calculation dialog, enter:
Service_Usage * Weight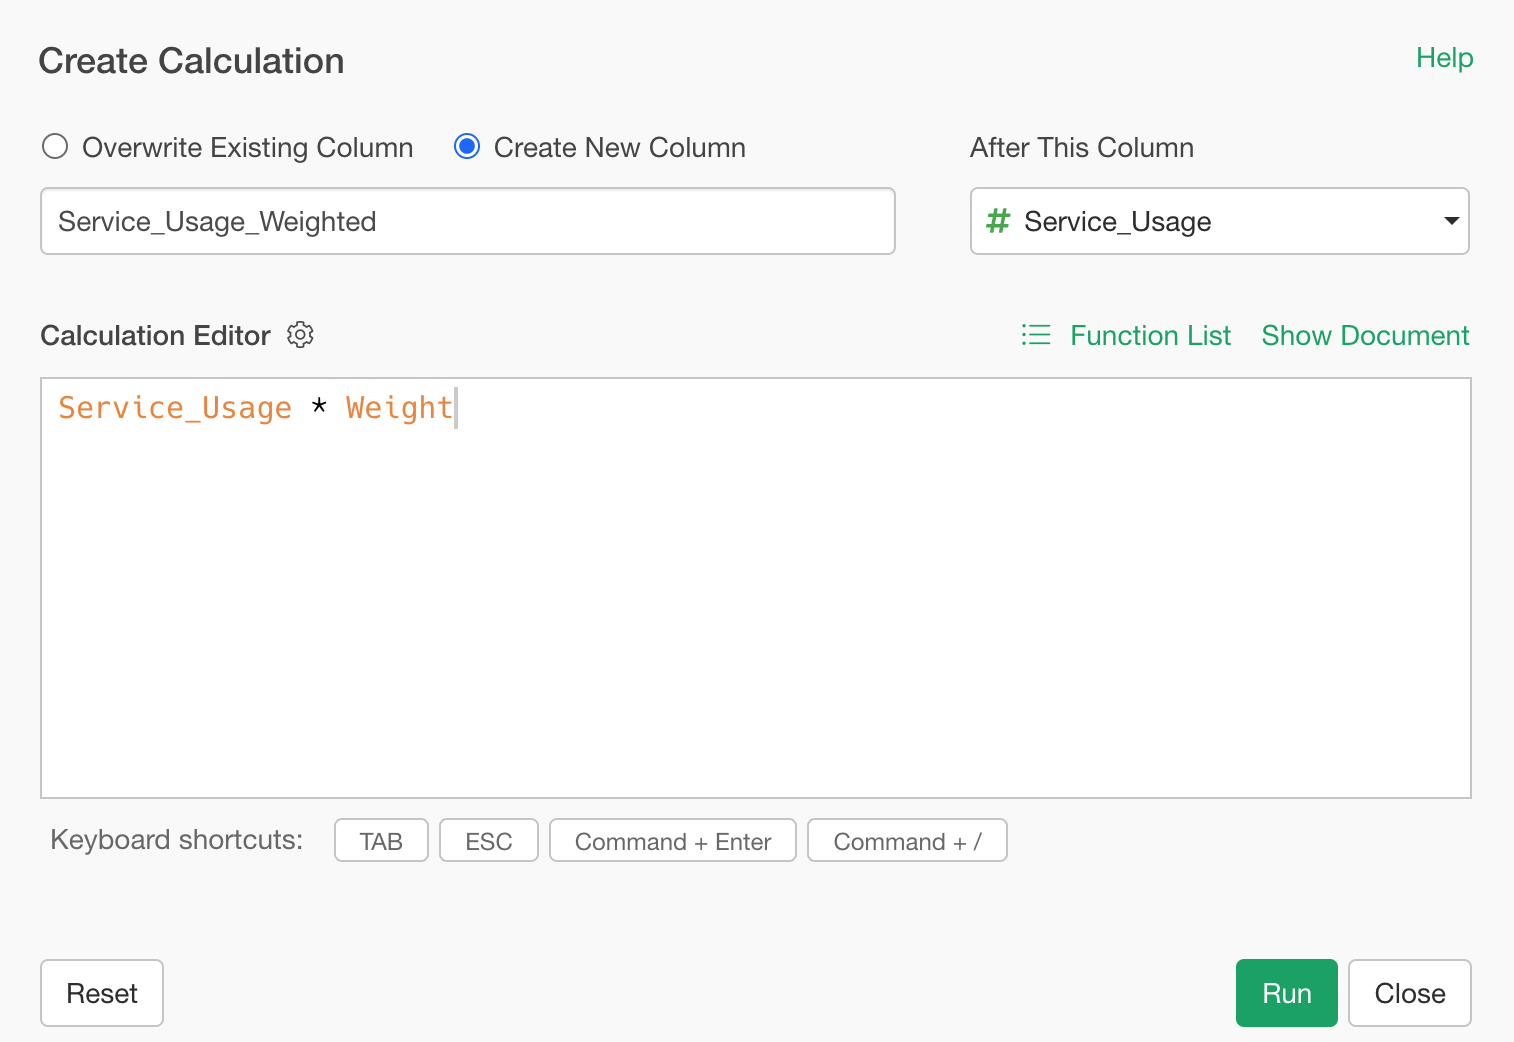
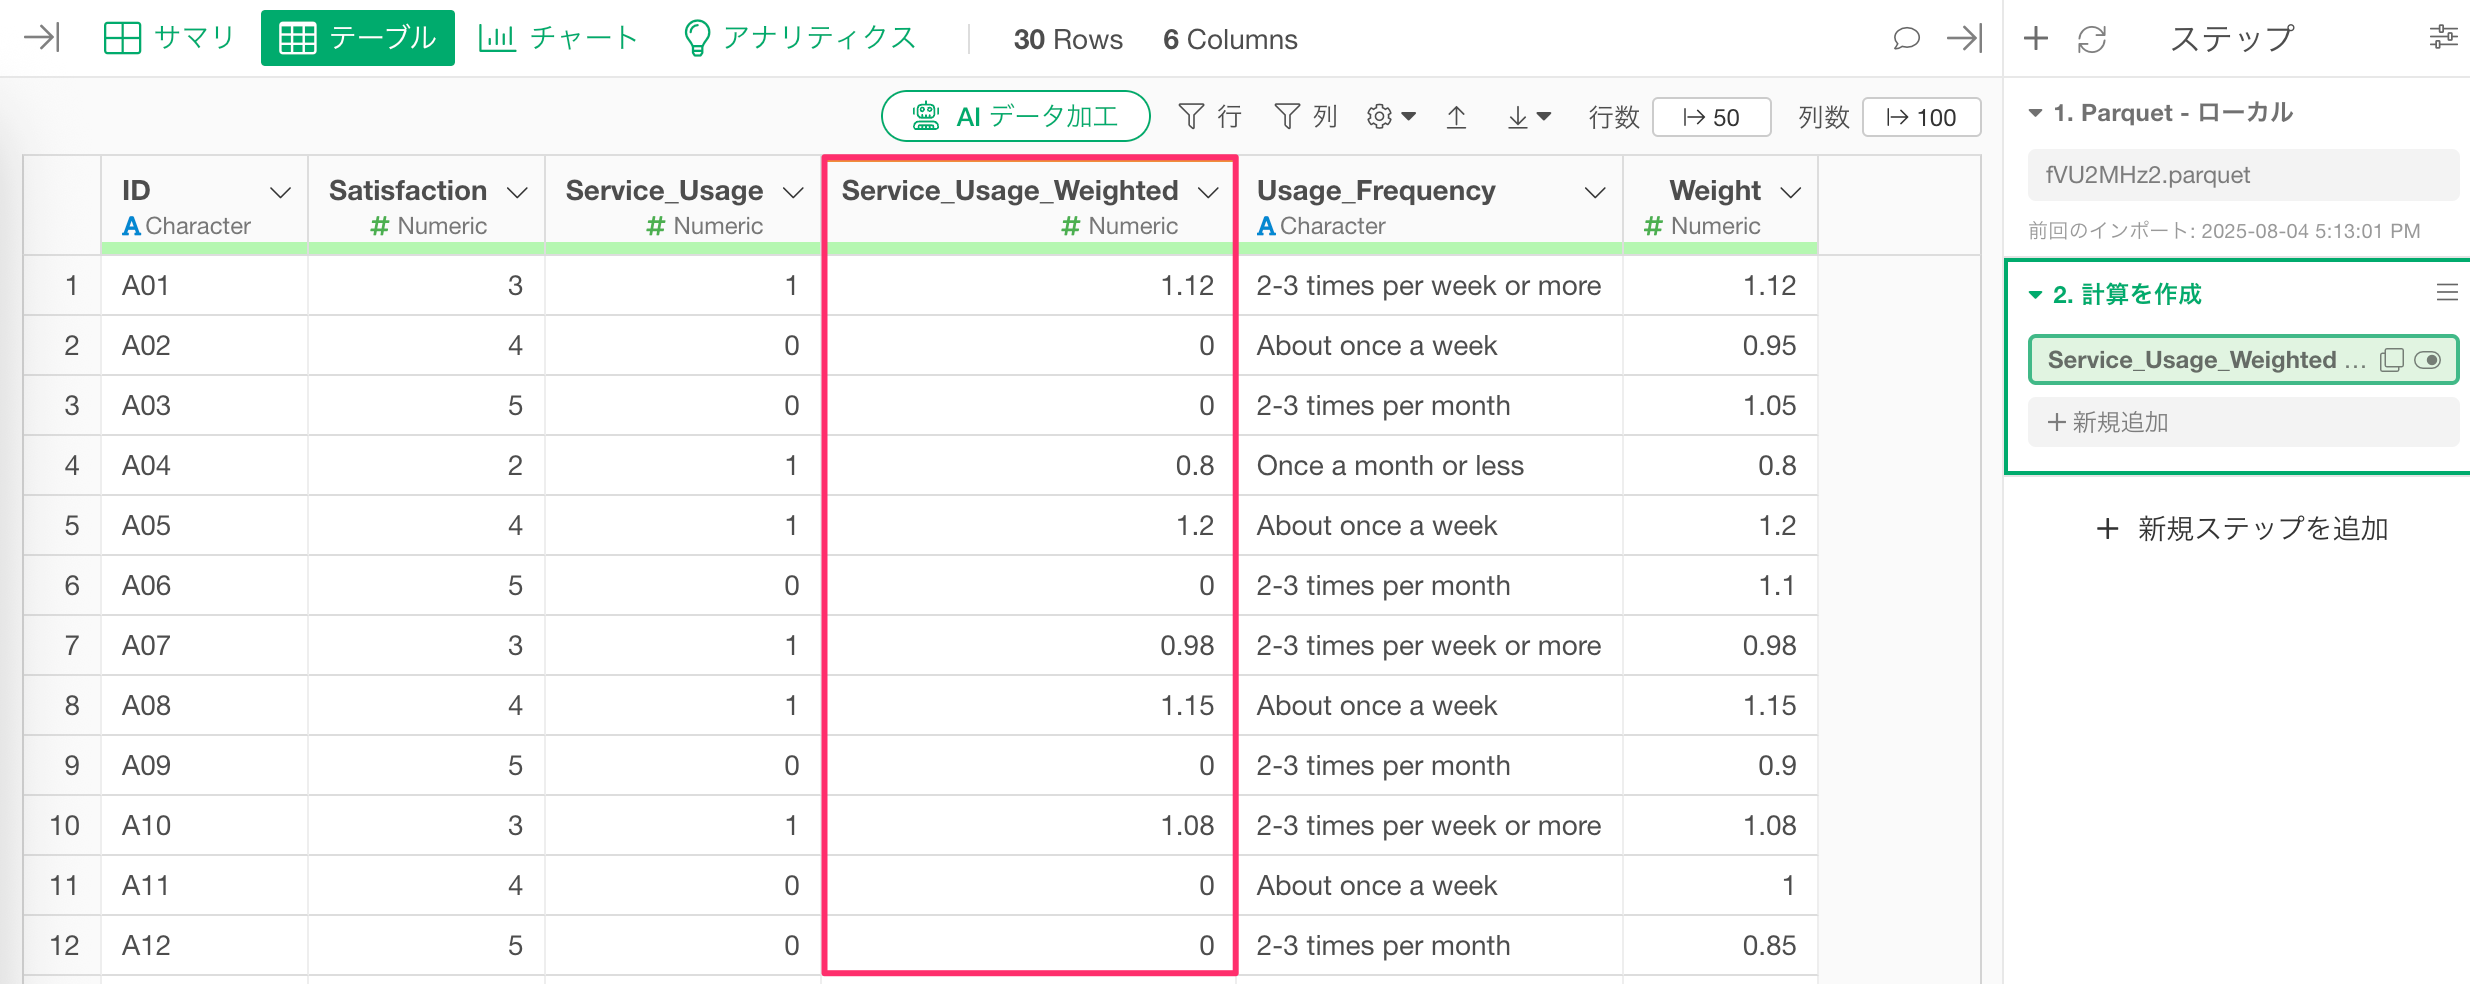
Name the column “Service_Usage_Weighted” and specify placement after “Service_Usage”, then click run.
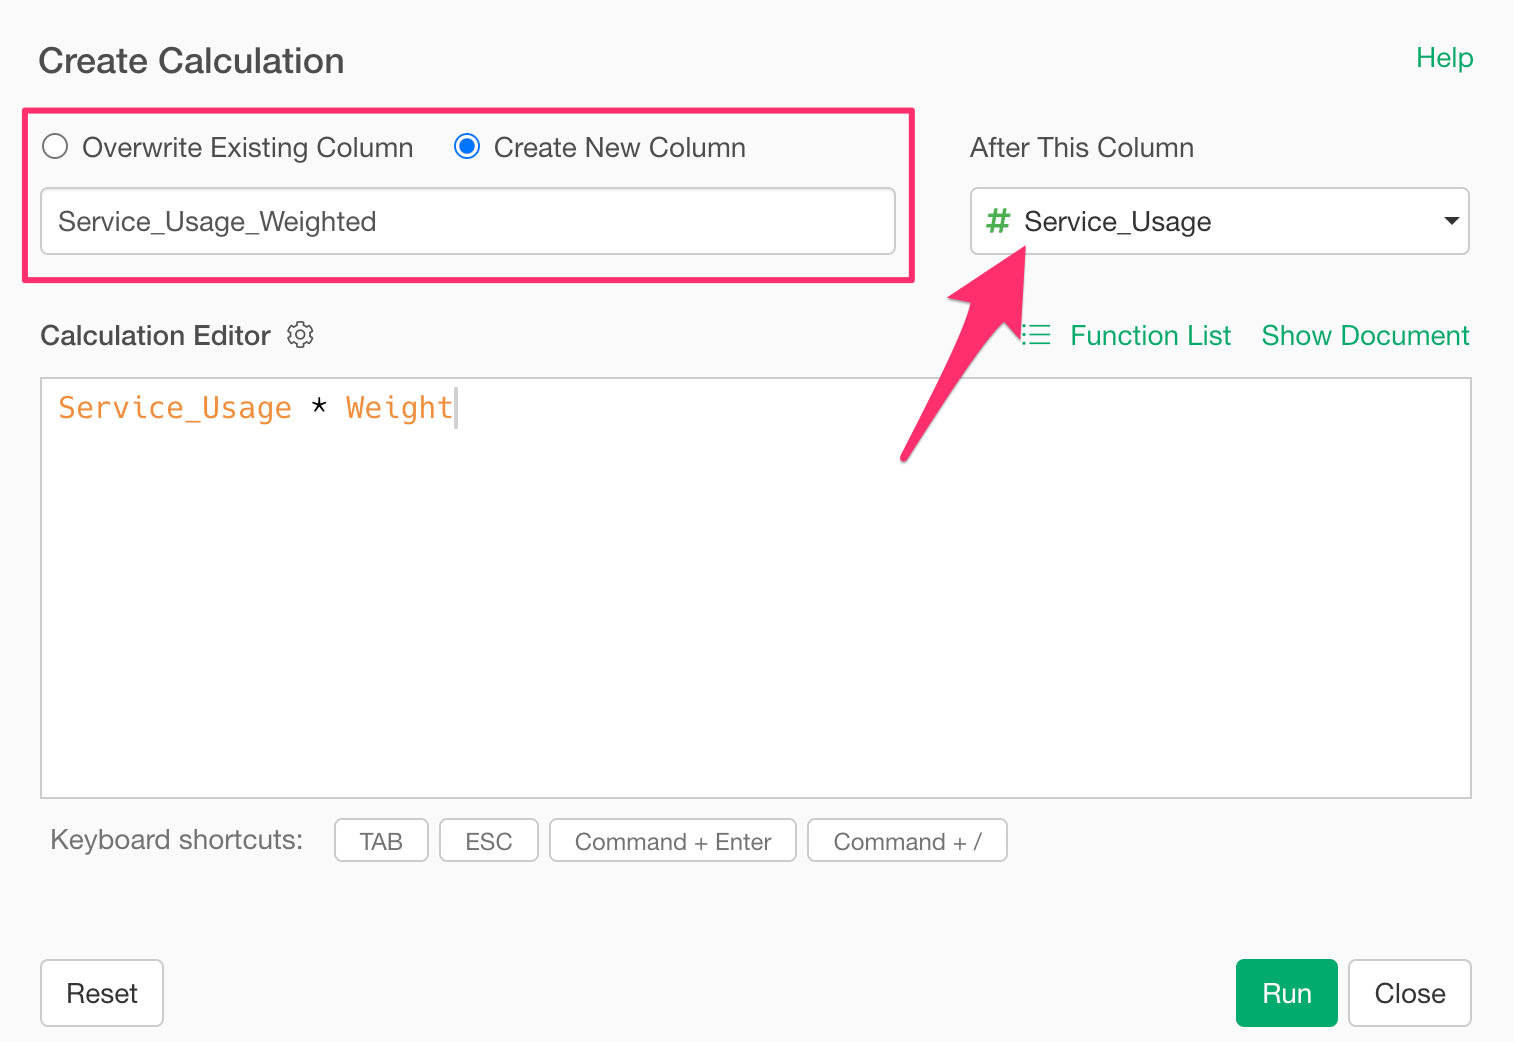
Each row now has a weighted service usage value.
Next, sum the values of both the “Service_Usage_Weighted” and “Weight” columns.
From the “Satisfaction_Usage” header menu, choose “Aggreagate(Summarize)”.
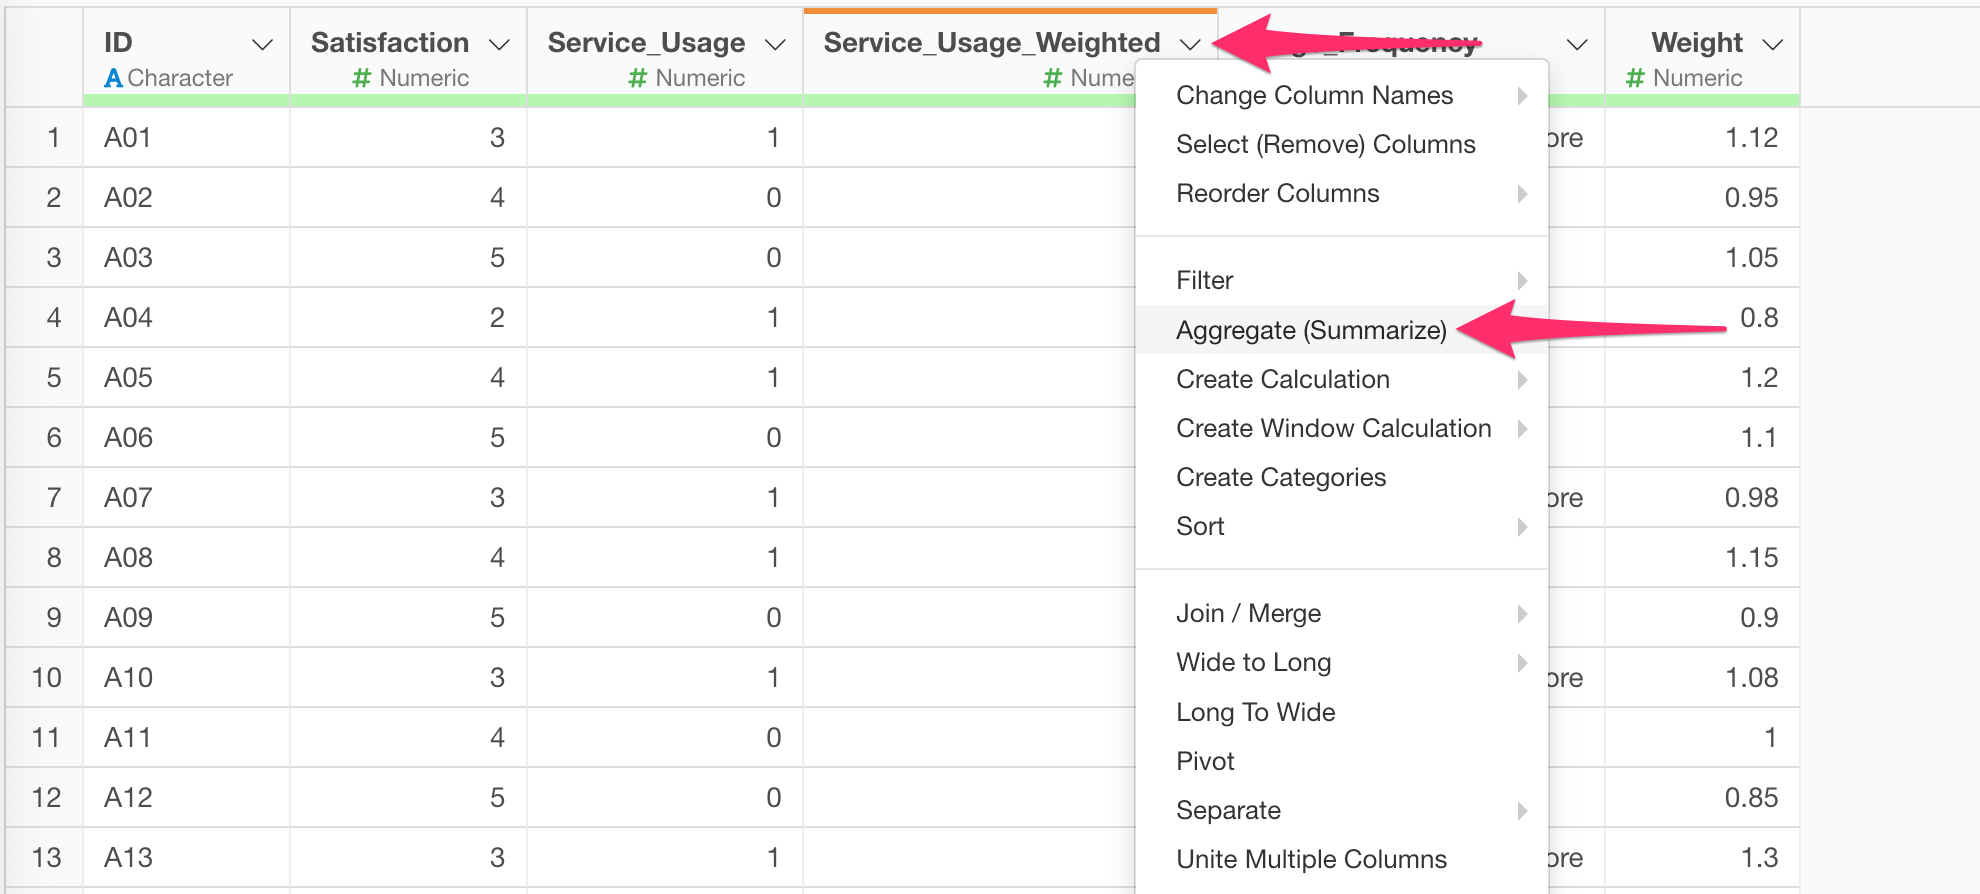
Select “Service_Usage_Weighted” and “Weight” as value in the dialog, set the function to SUM, preview, then run.

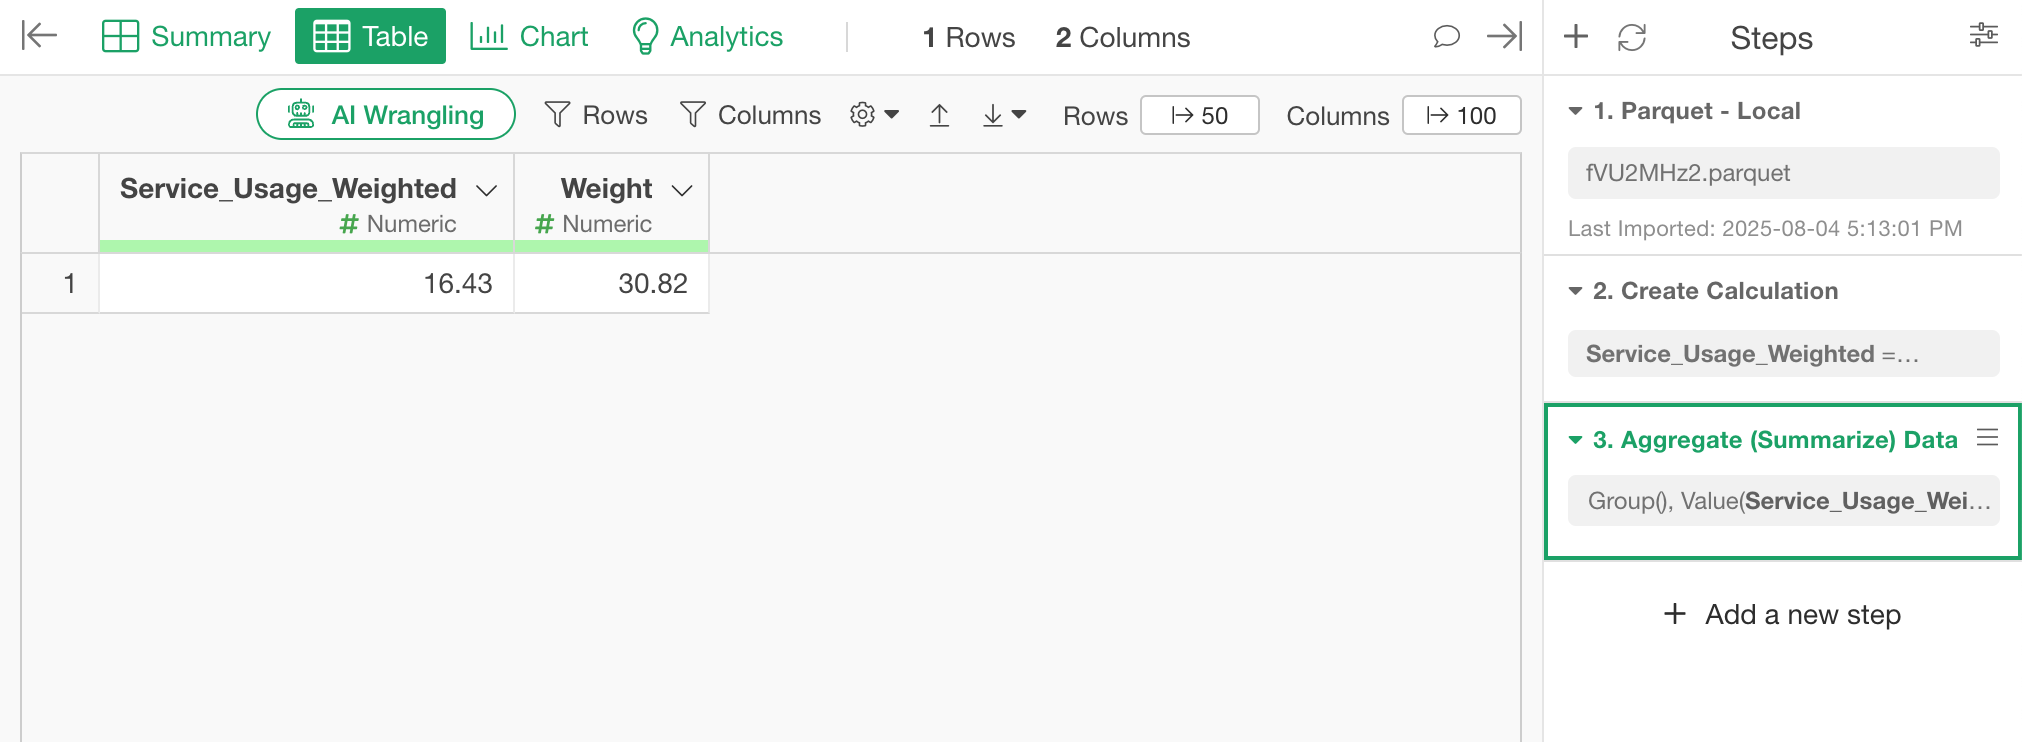
You now have totals for both weighted service usage and weights.
Finally, from the “Service_Usage_Weighted” header menu, choose “Create Calculation.”
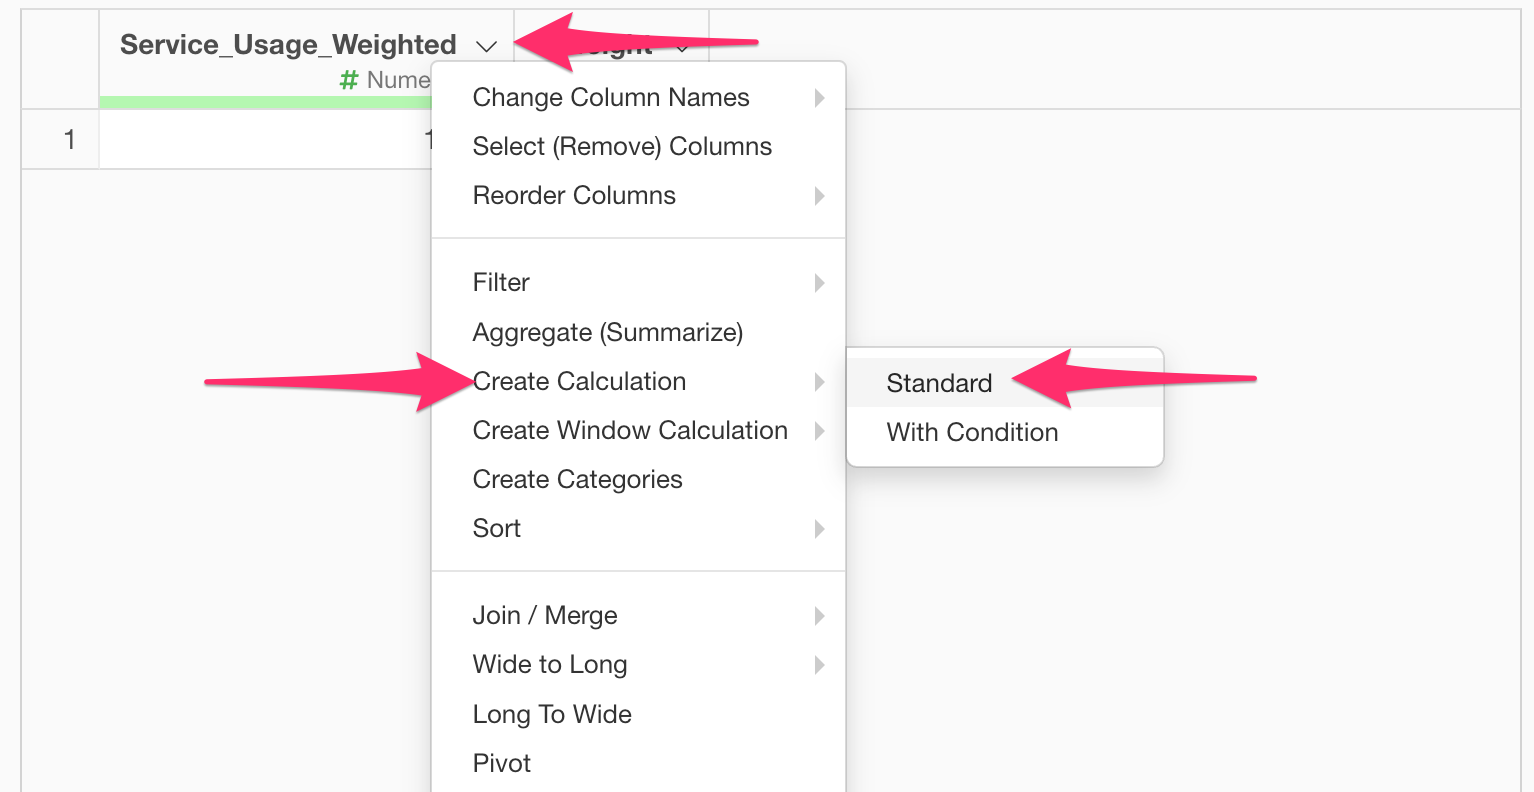
Enter following calculation in the dialog:
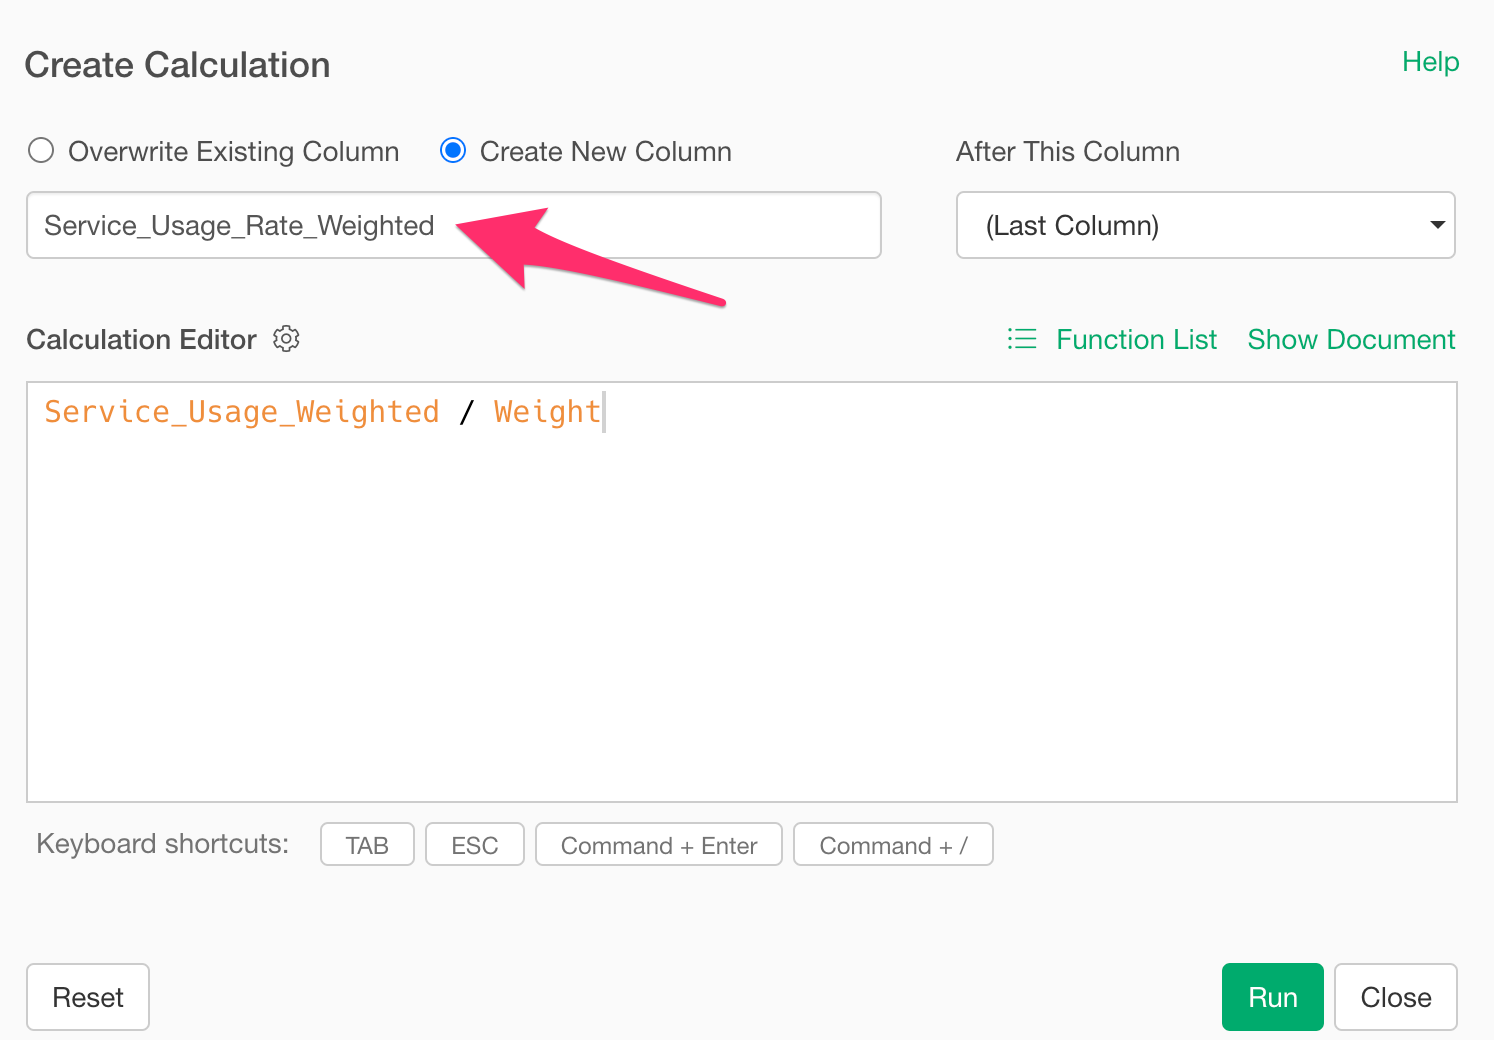
Service_Usage_Weighted / Weight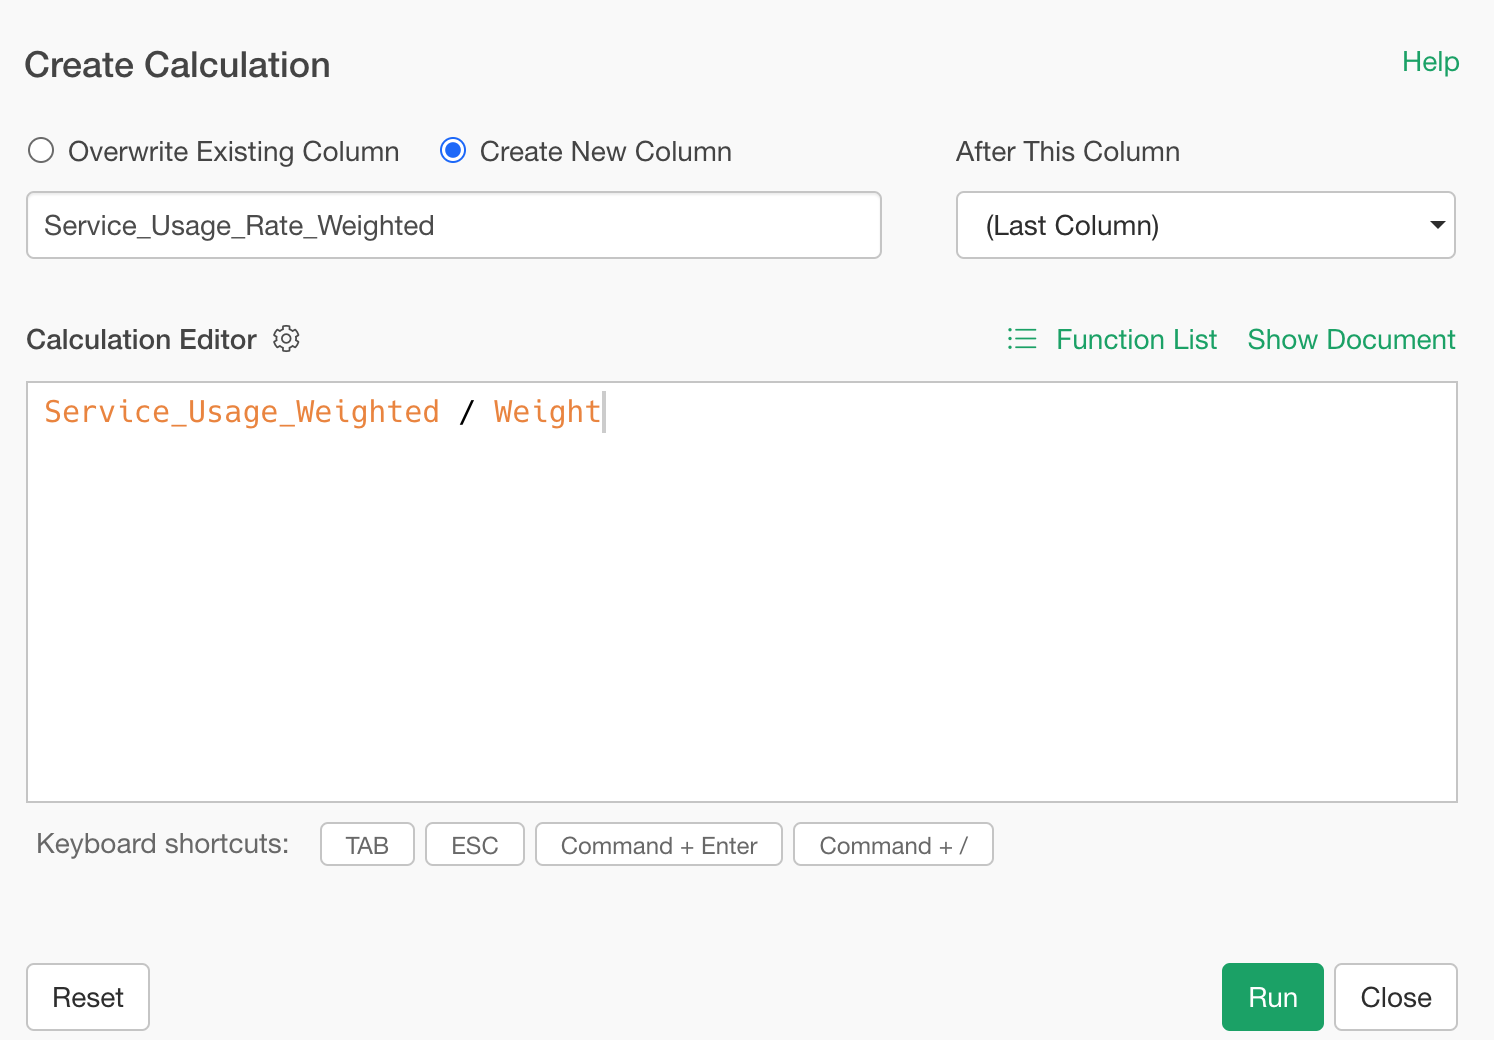
Name the column “Service_Usage_Rate_Weighted”, and run.

Now you have the weighted service usage rate.
How to Calculate Weighted Proportions for Categorical Data
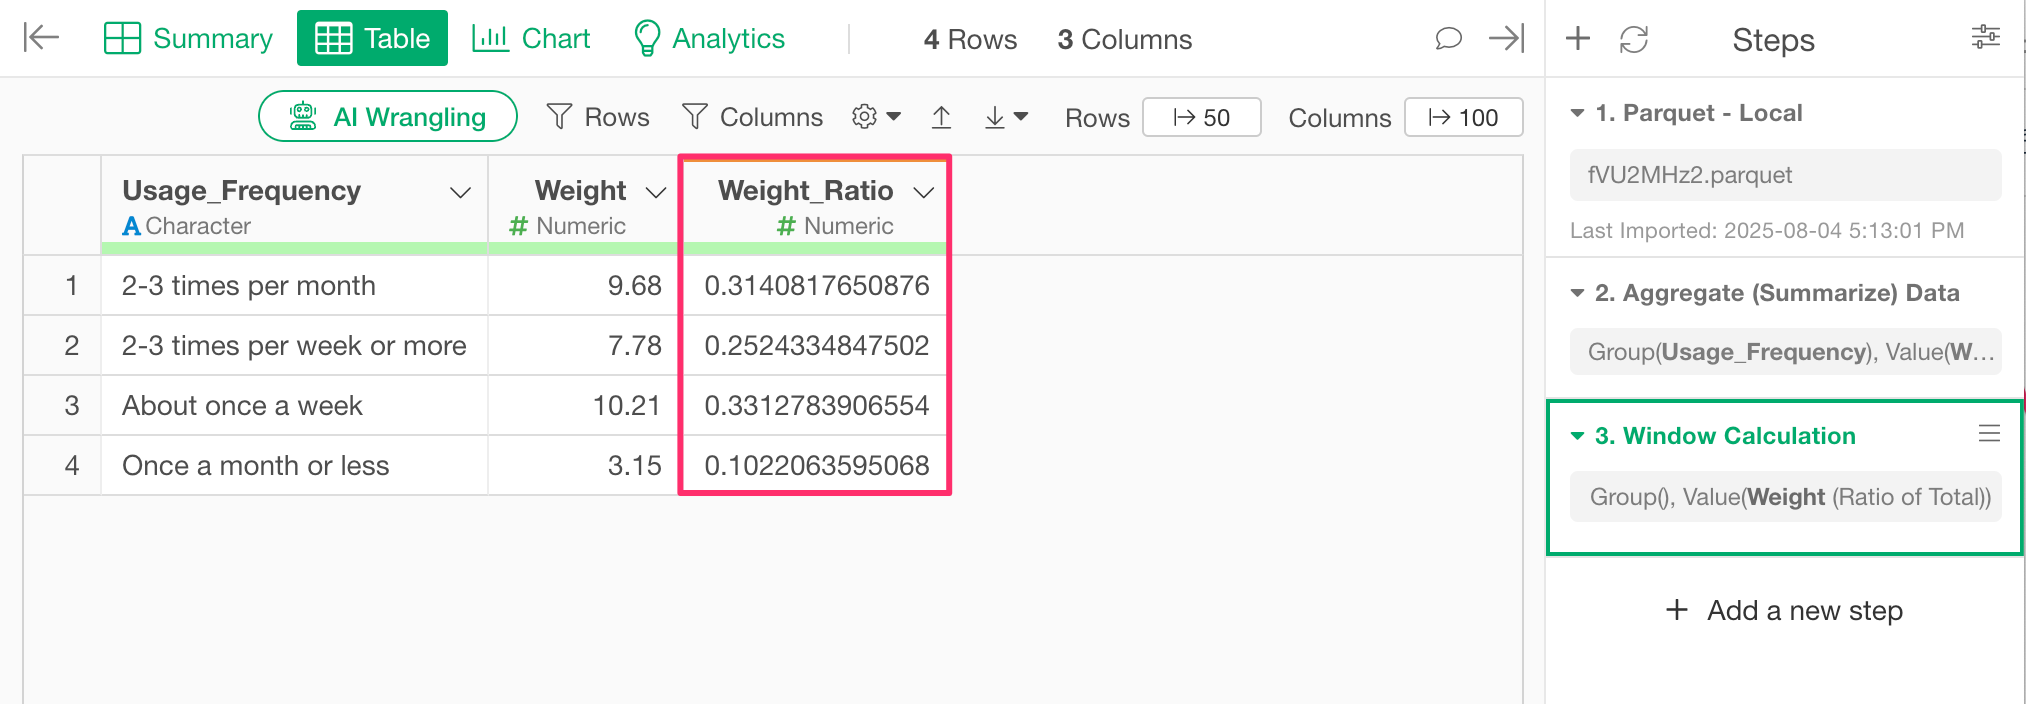
Lastly, we’ll calculate the weighted proportions (composition ratios) for categorical data like “Usage_Frequency”.
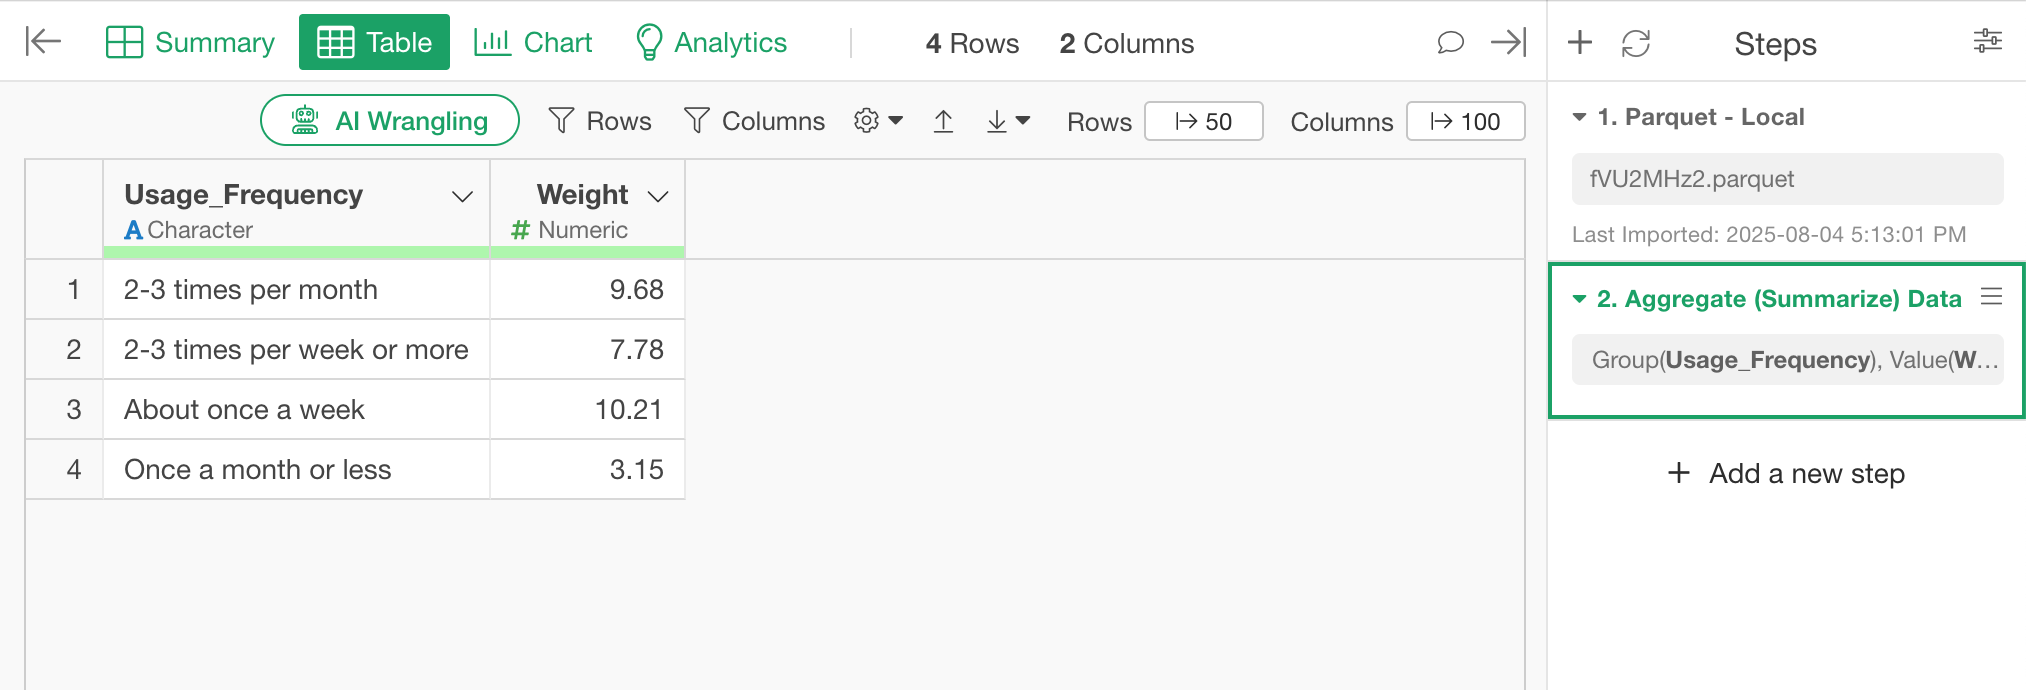
Start by summarizing the “Usage_Frequency” column.
From the column header, select “Summarize.”
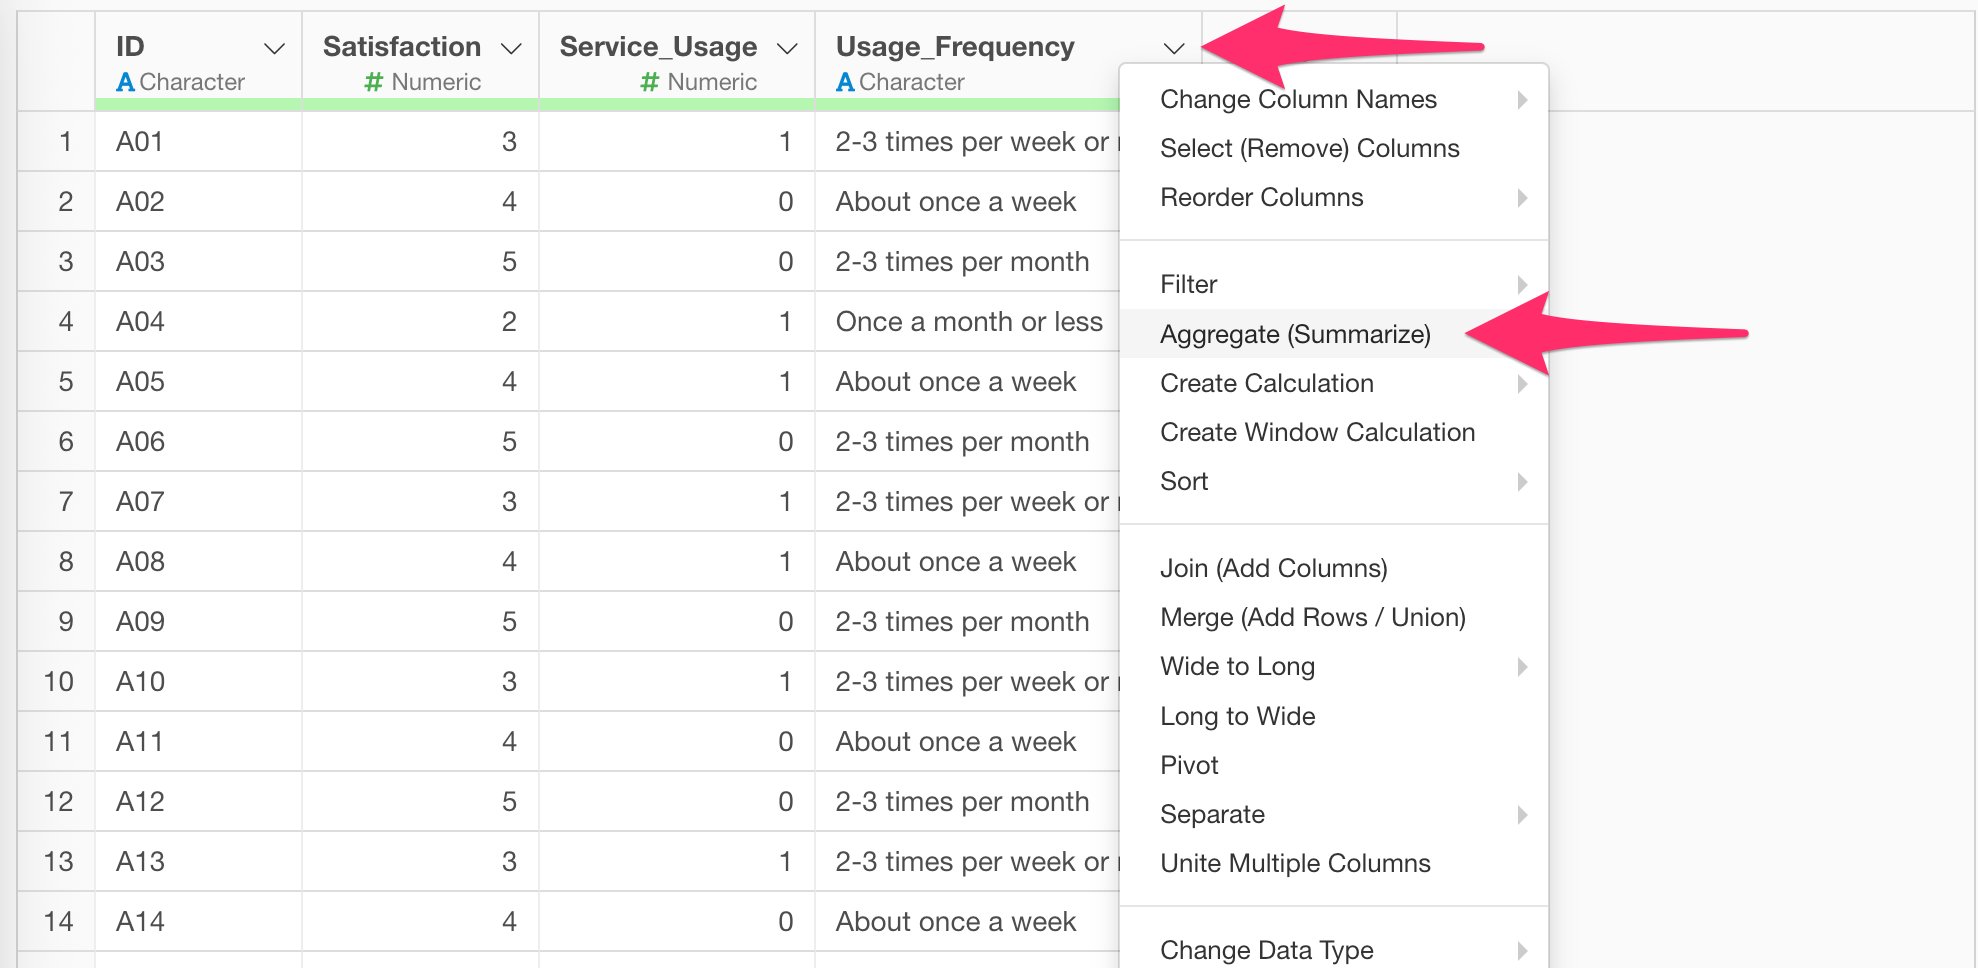
In the dialog, confirm “Usage_Frequency” is selected for “Group by” and choose “Weight” as the value, use SUM for function, and run.
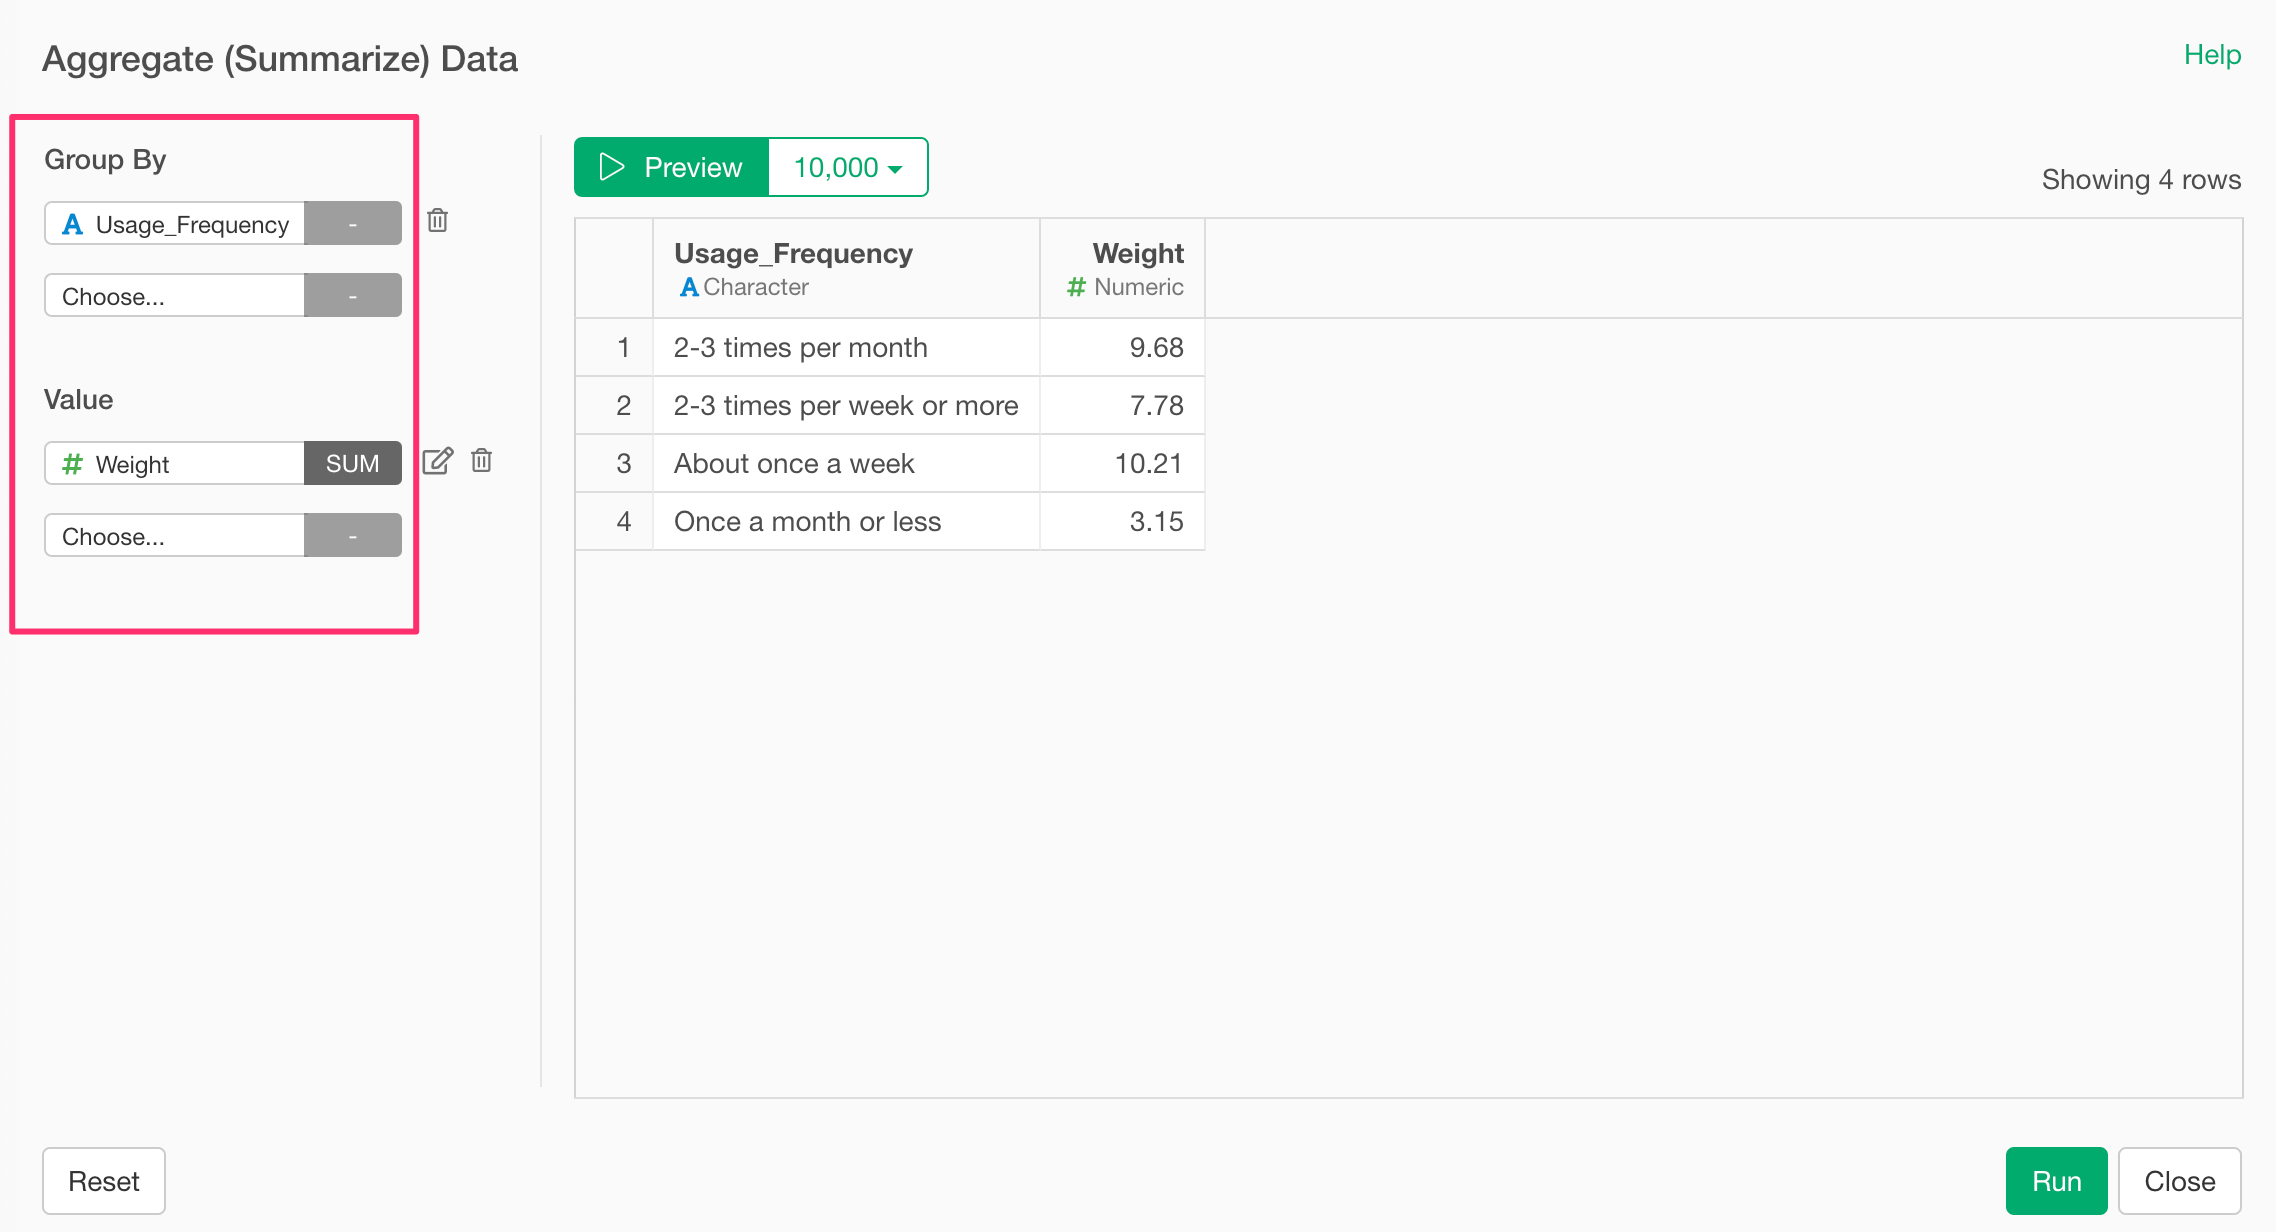
Now you have total weights for each frequency category.
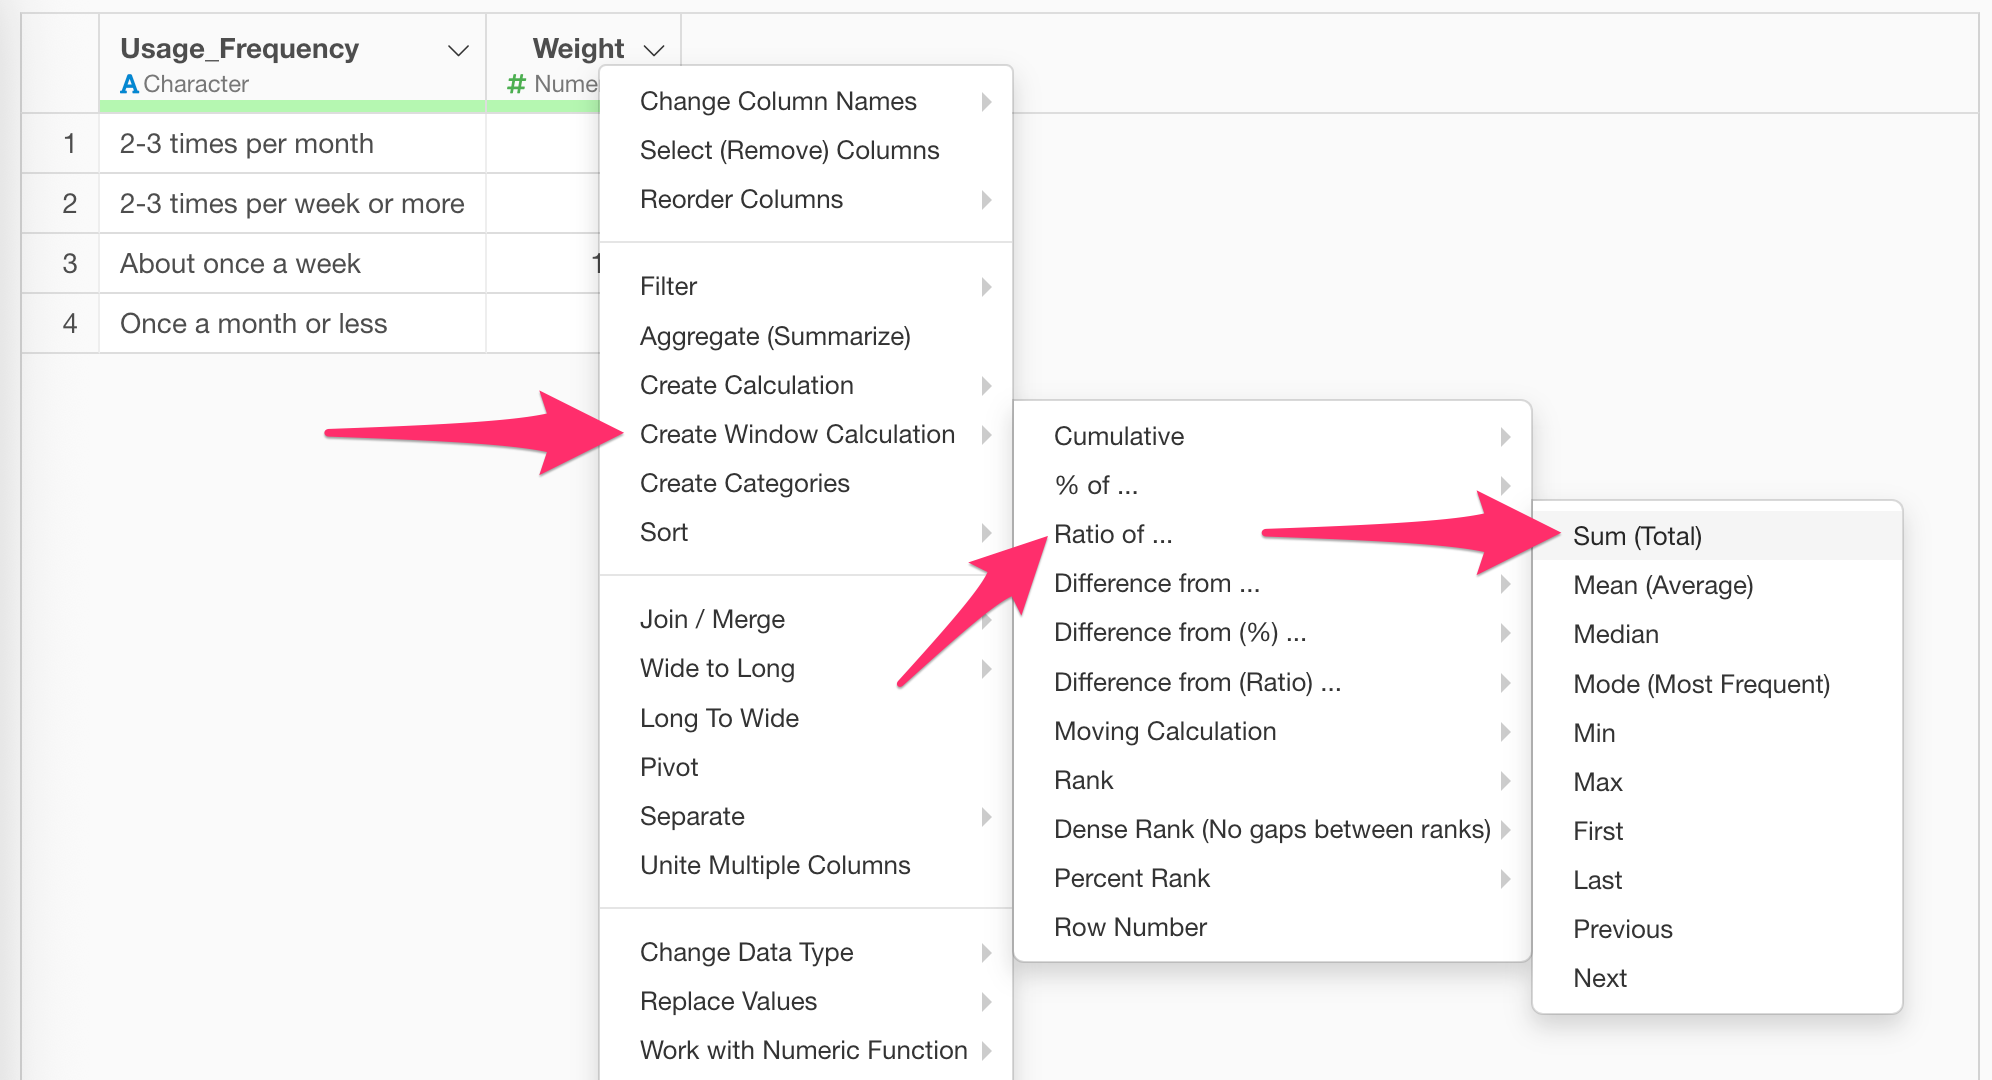
Next, calculate each category’s share of the total weight.
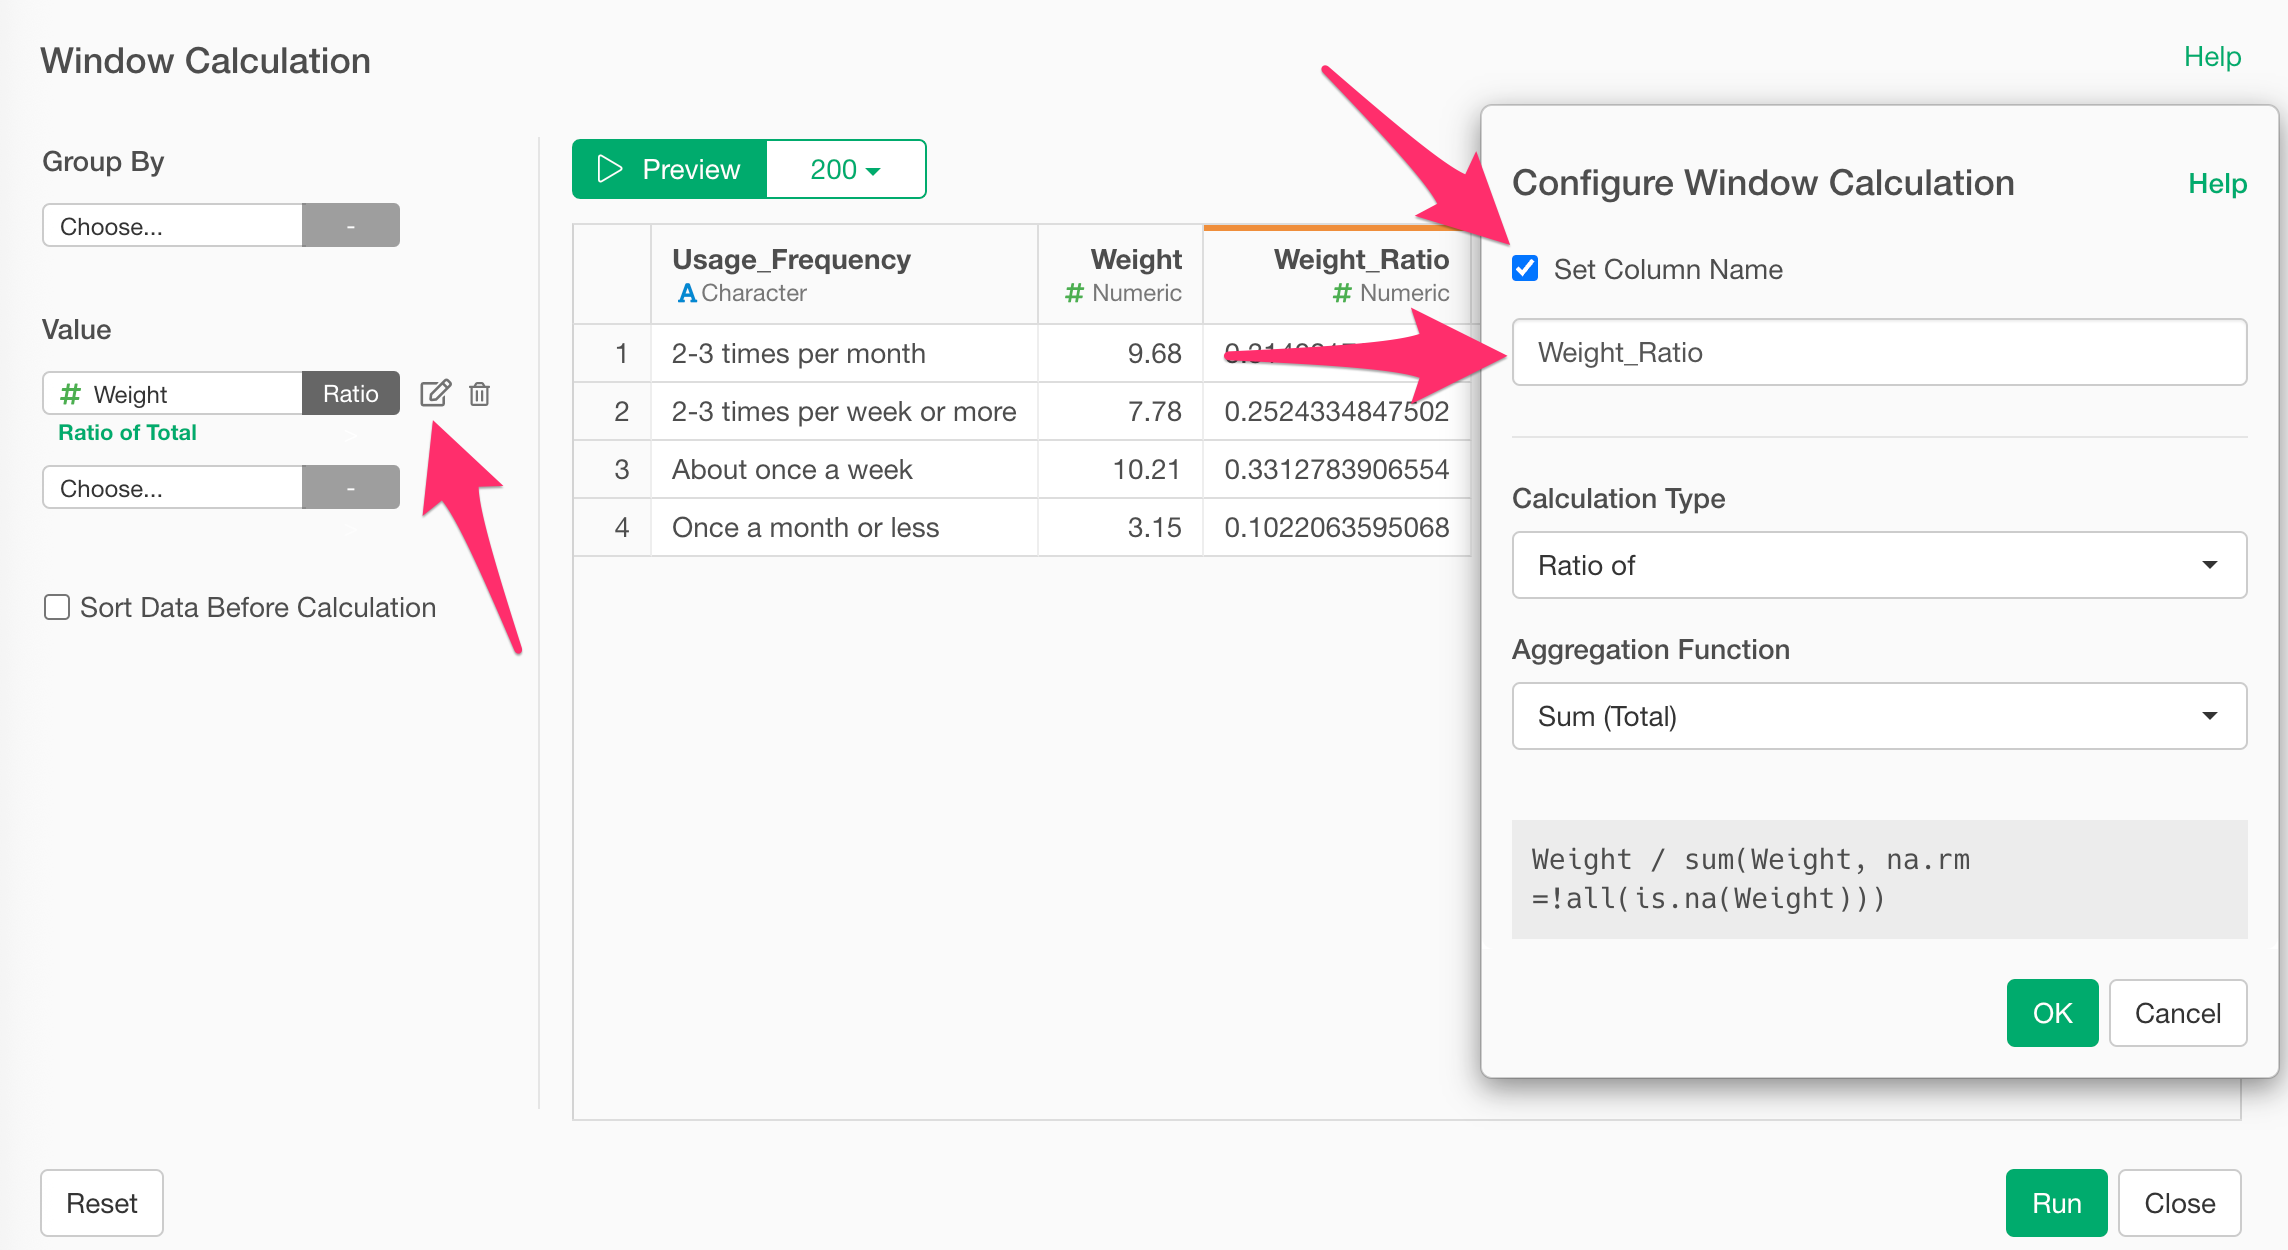
From the “Weight” column header, select “Table Calculation”, “Ratio of” and “Sum(Total)”.
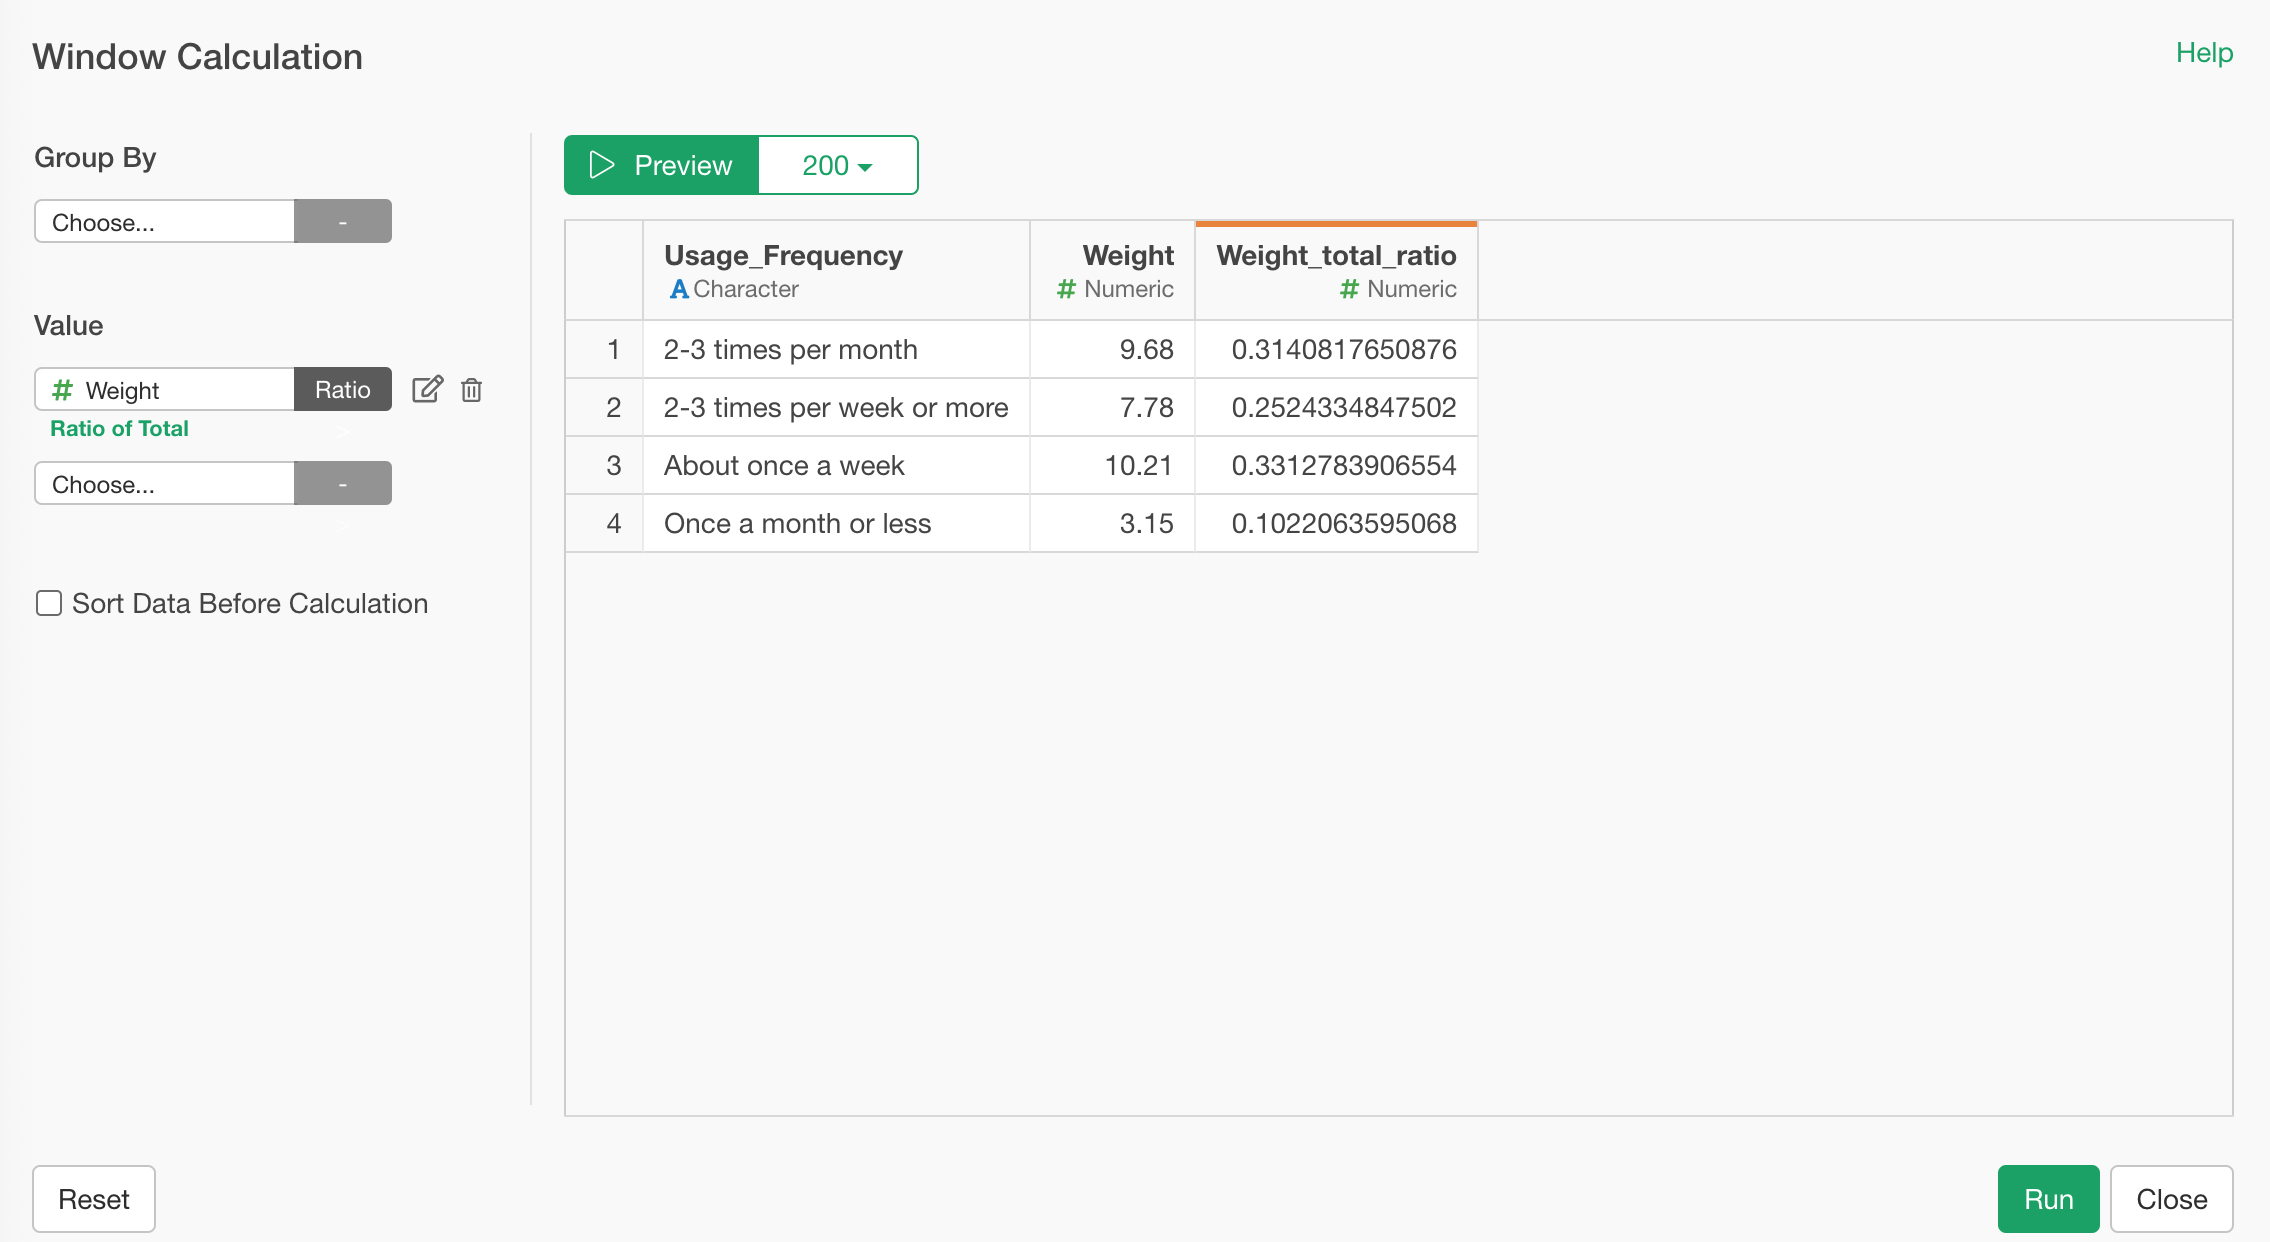
In the dialog, confirm that the weighted ratio for each category is shown.
 Click
to rename the column, e.g., “Weight_Ratio”.
Click
to rename the column, e.g., “Weight_Ratio”.
Preview the results, and then run.
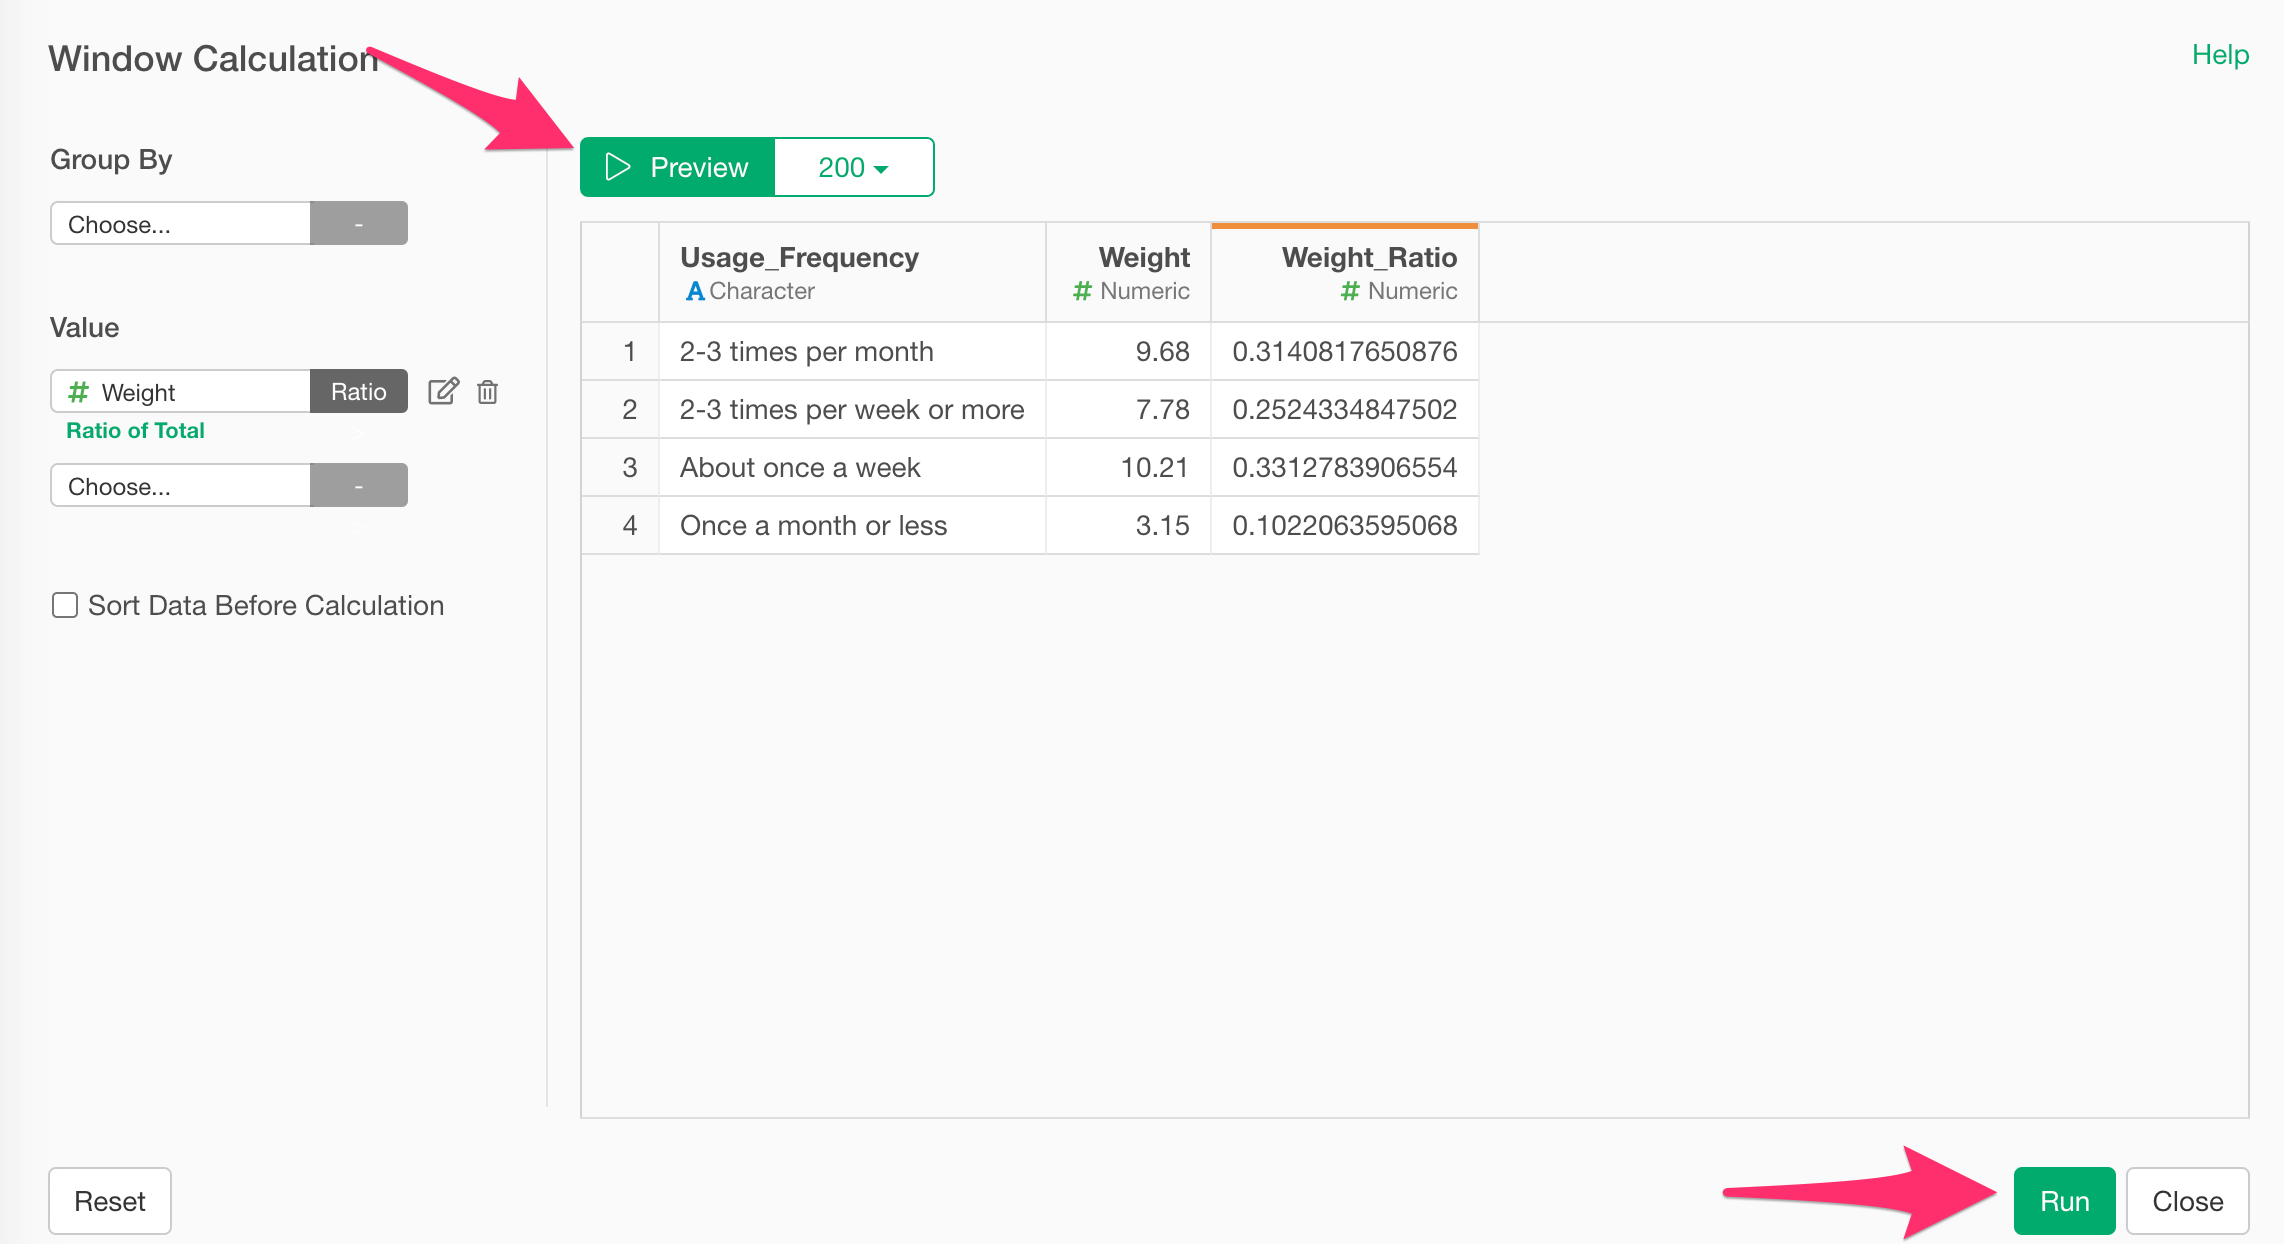
Now you can interpret the weighted proportions for each usage frequency category—e.g., what percentage of the population uses the service weekly.