Categorize Numeric Values with Equal Step
In Chart, you can convert numeric values such as Age, Income, Sales, etc. into a set of groups with various options. One of them is called 'Equal Step', which will create a group for an every given number such as 'every 10'.
Sample Data
We'll use this Employee Data. You can download it from this page.
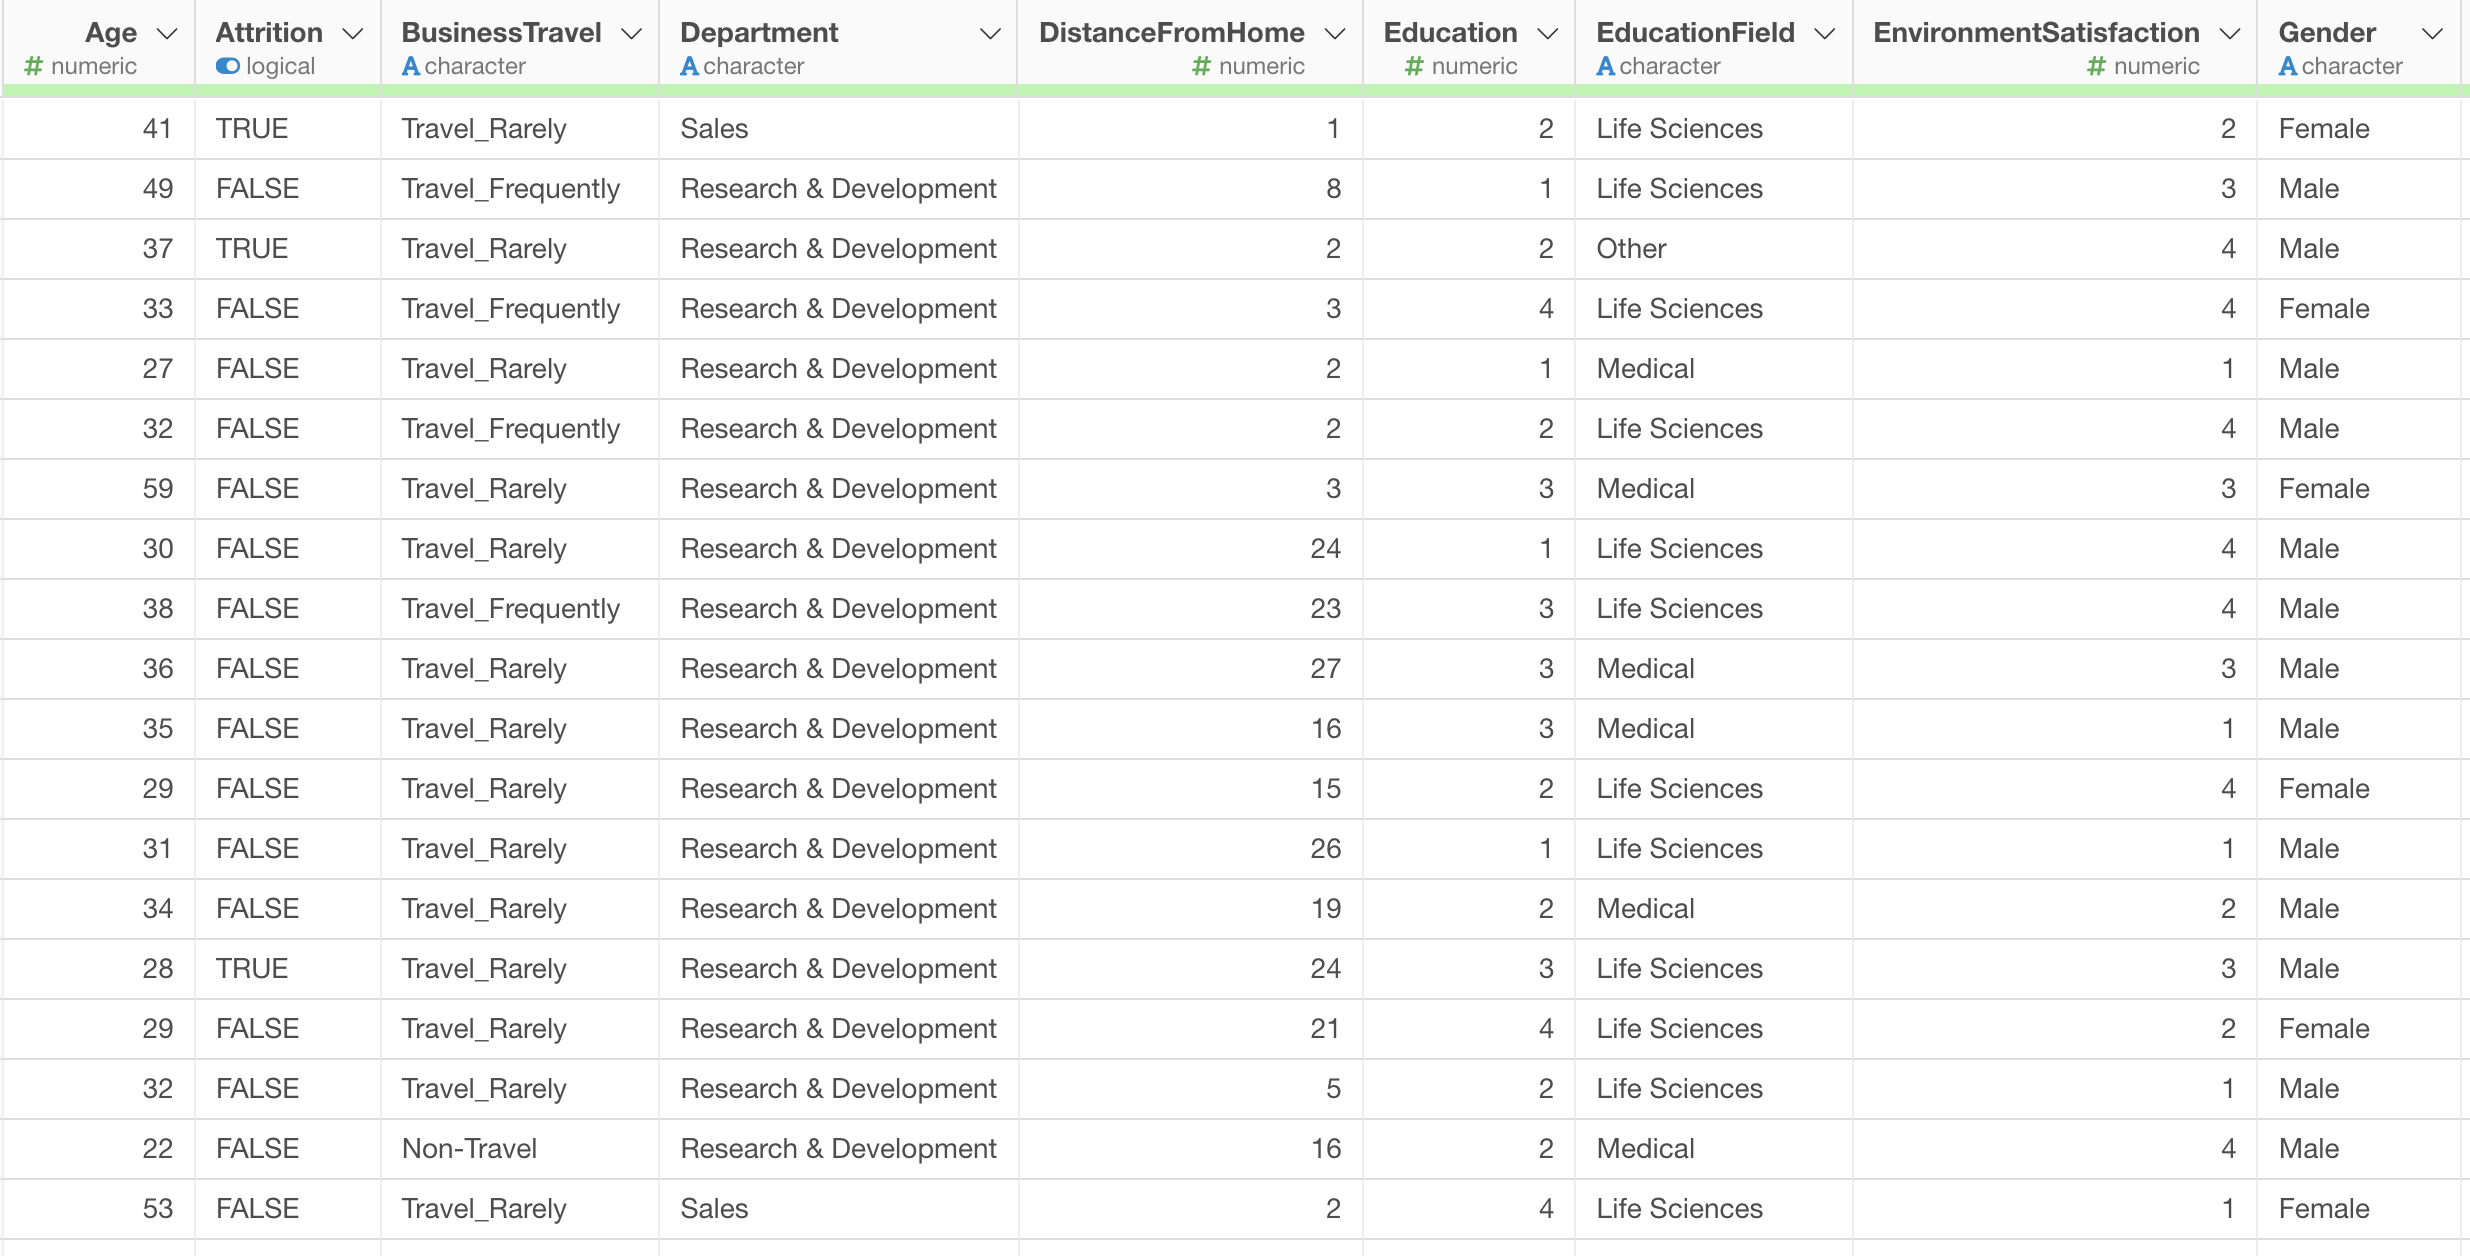
In this data, each row represents each employee, and the columns are employees' attribute information such as age, job type, income, etc.
Create Every N Groups with Equal Step
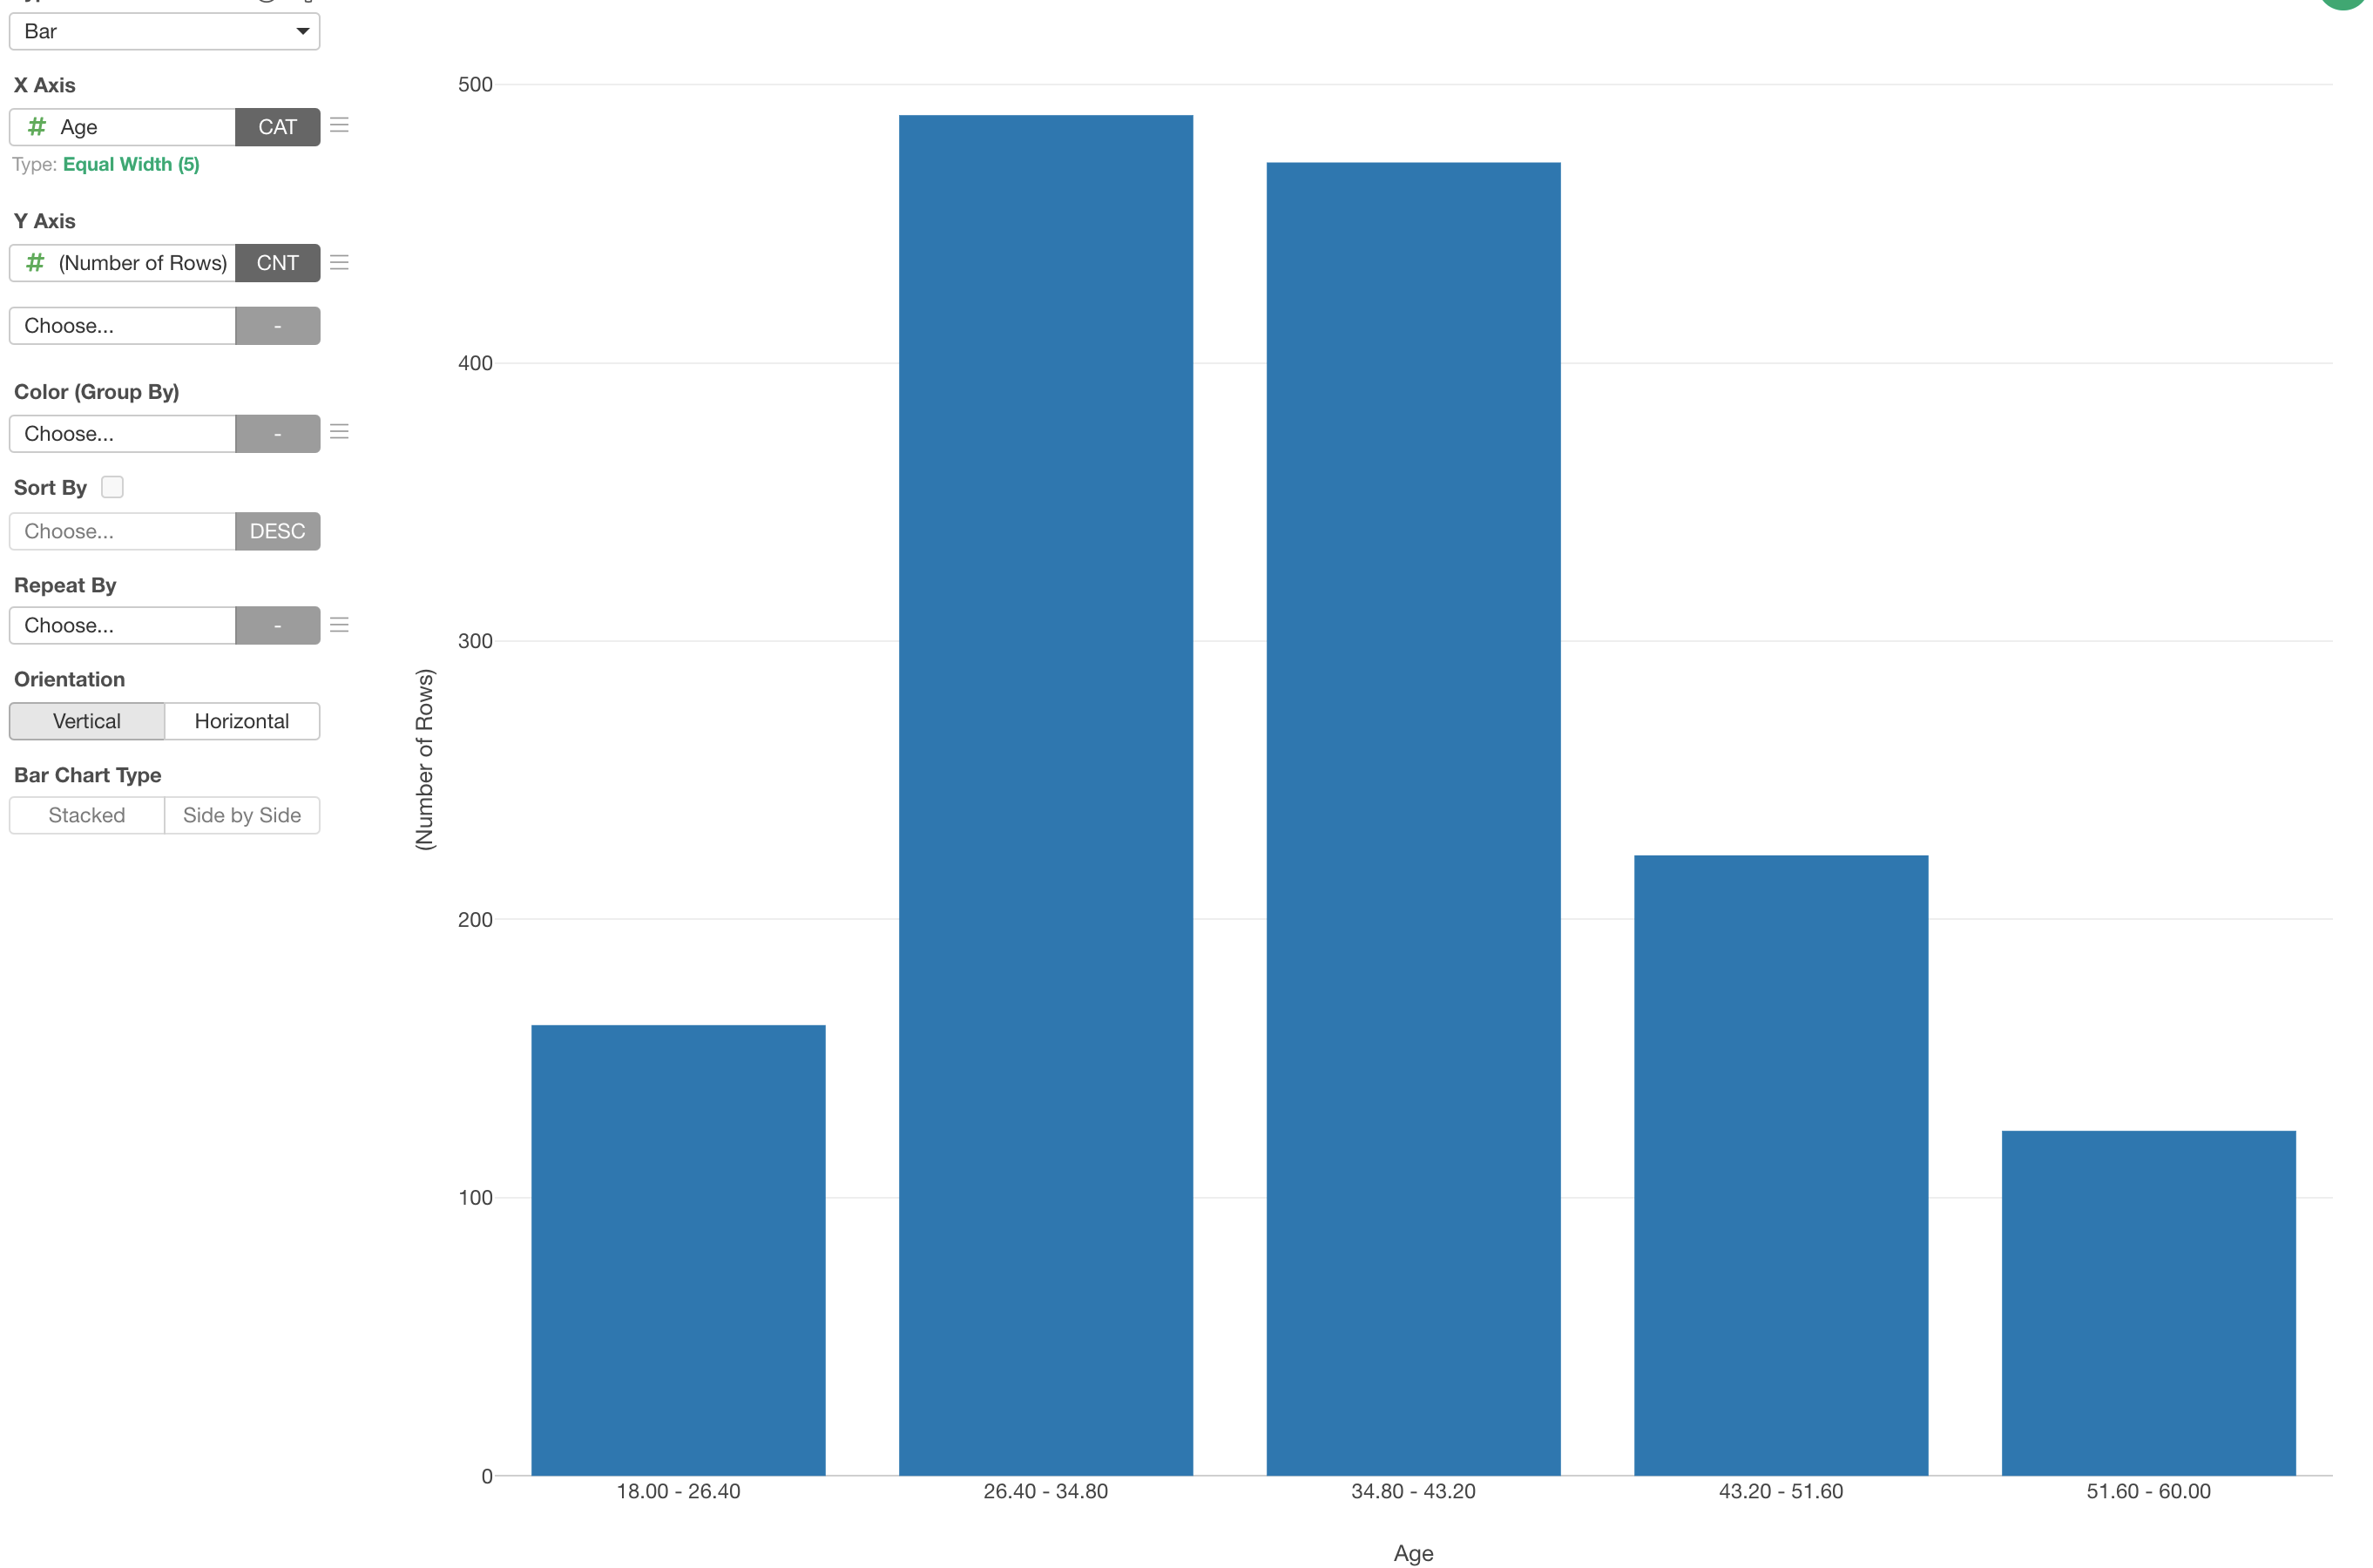
Here is a chart that shows number of employees for each Age group. Since the Age column is the numeric data type it automatically categorize the numeric values with 'Equal Width' option by default. Each group has equal range of the Age.
Now, let's say we want to show a bar for every 10 years so that we'll have 20s, 30s, 40s, etc. This is when you want to use 'Equal Step'.
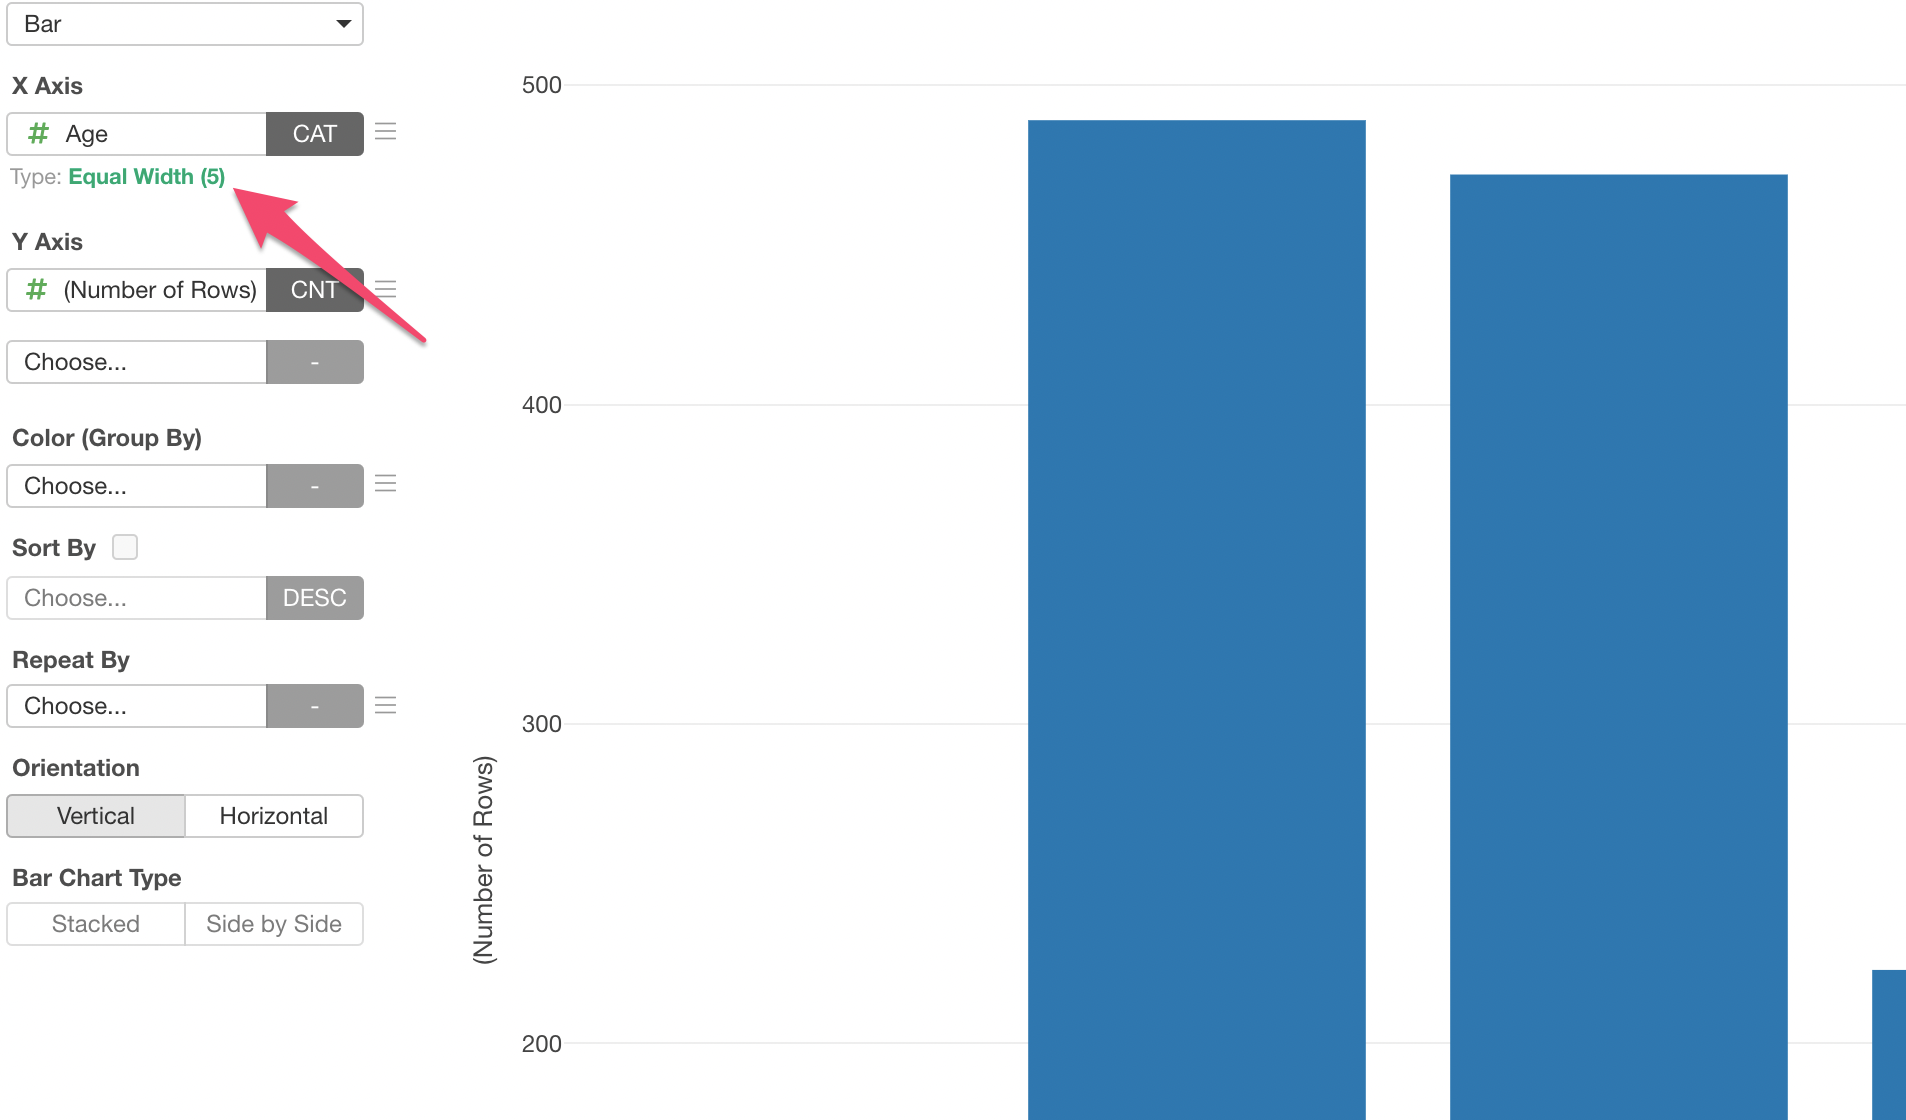
Click on the Green text.
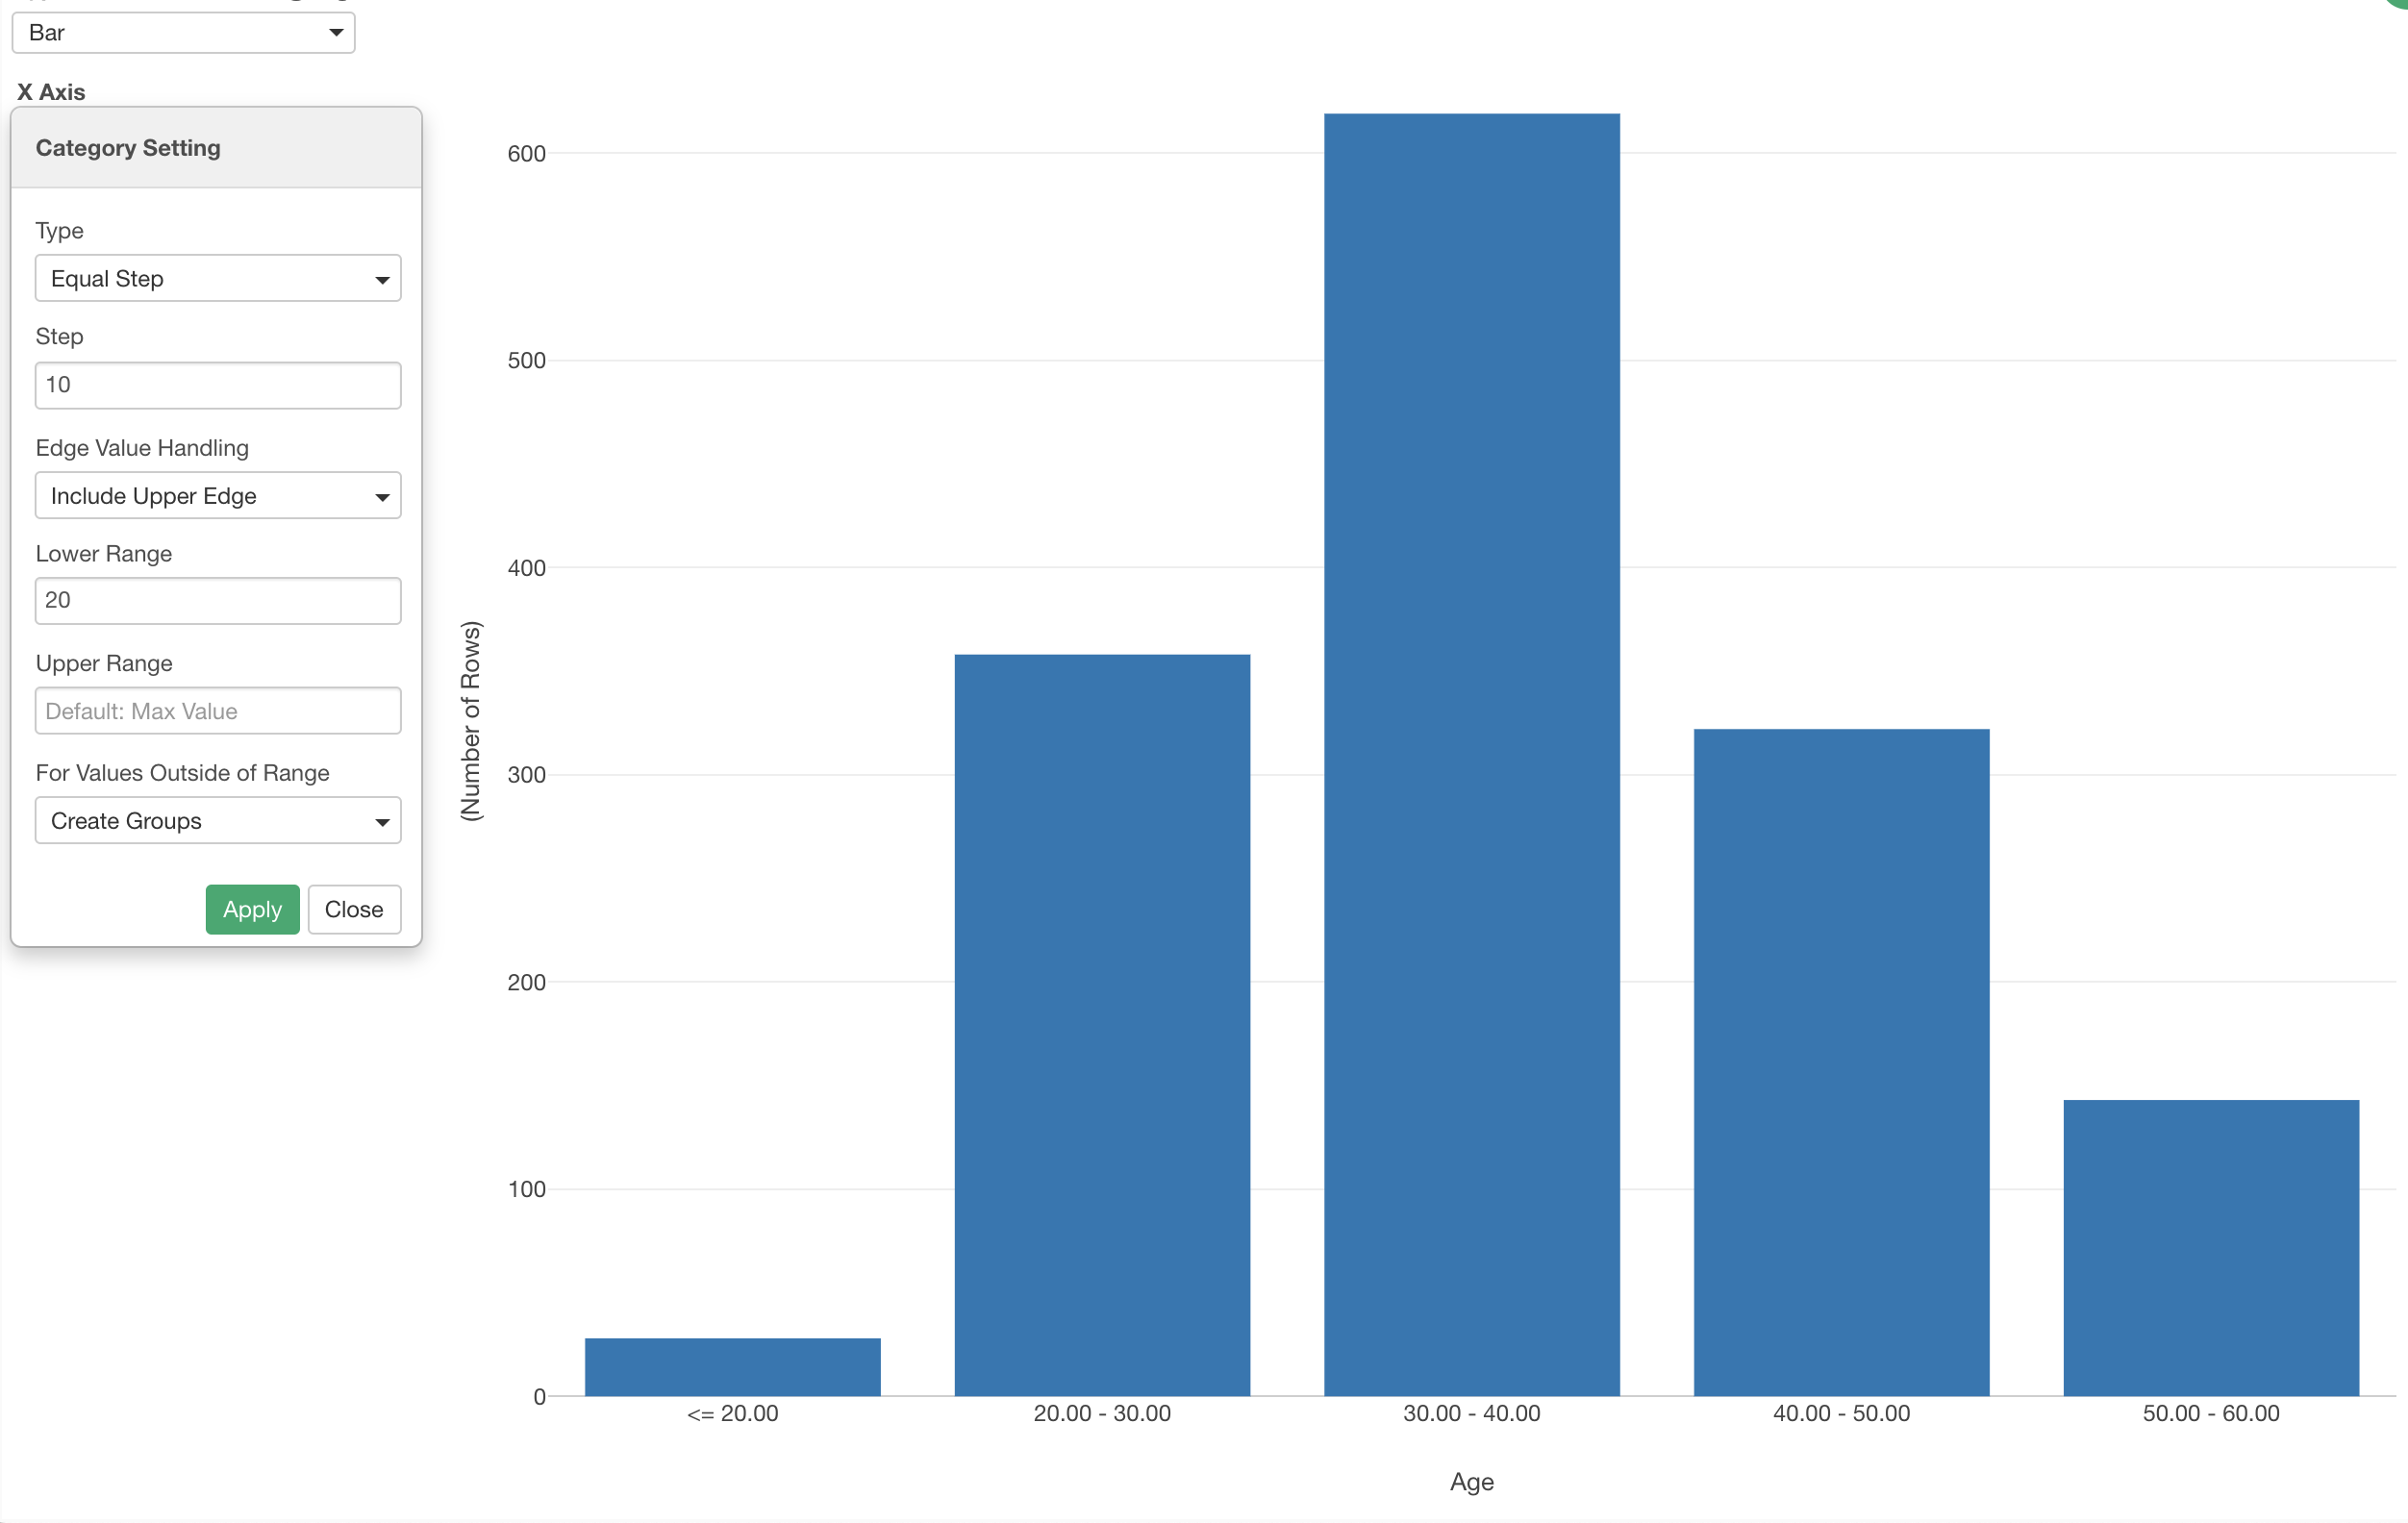
Change the 'Type' to 'Equal Step' and type 10 for the 'Step to create every 10 years groups.
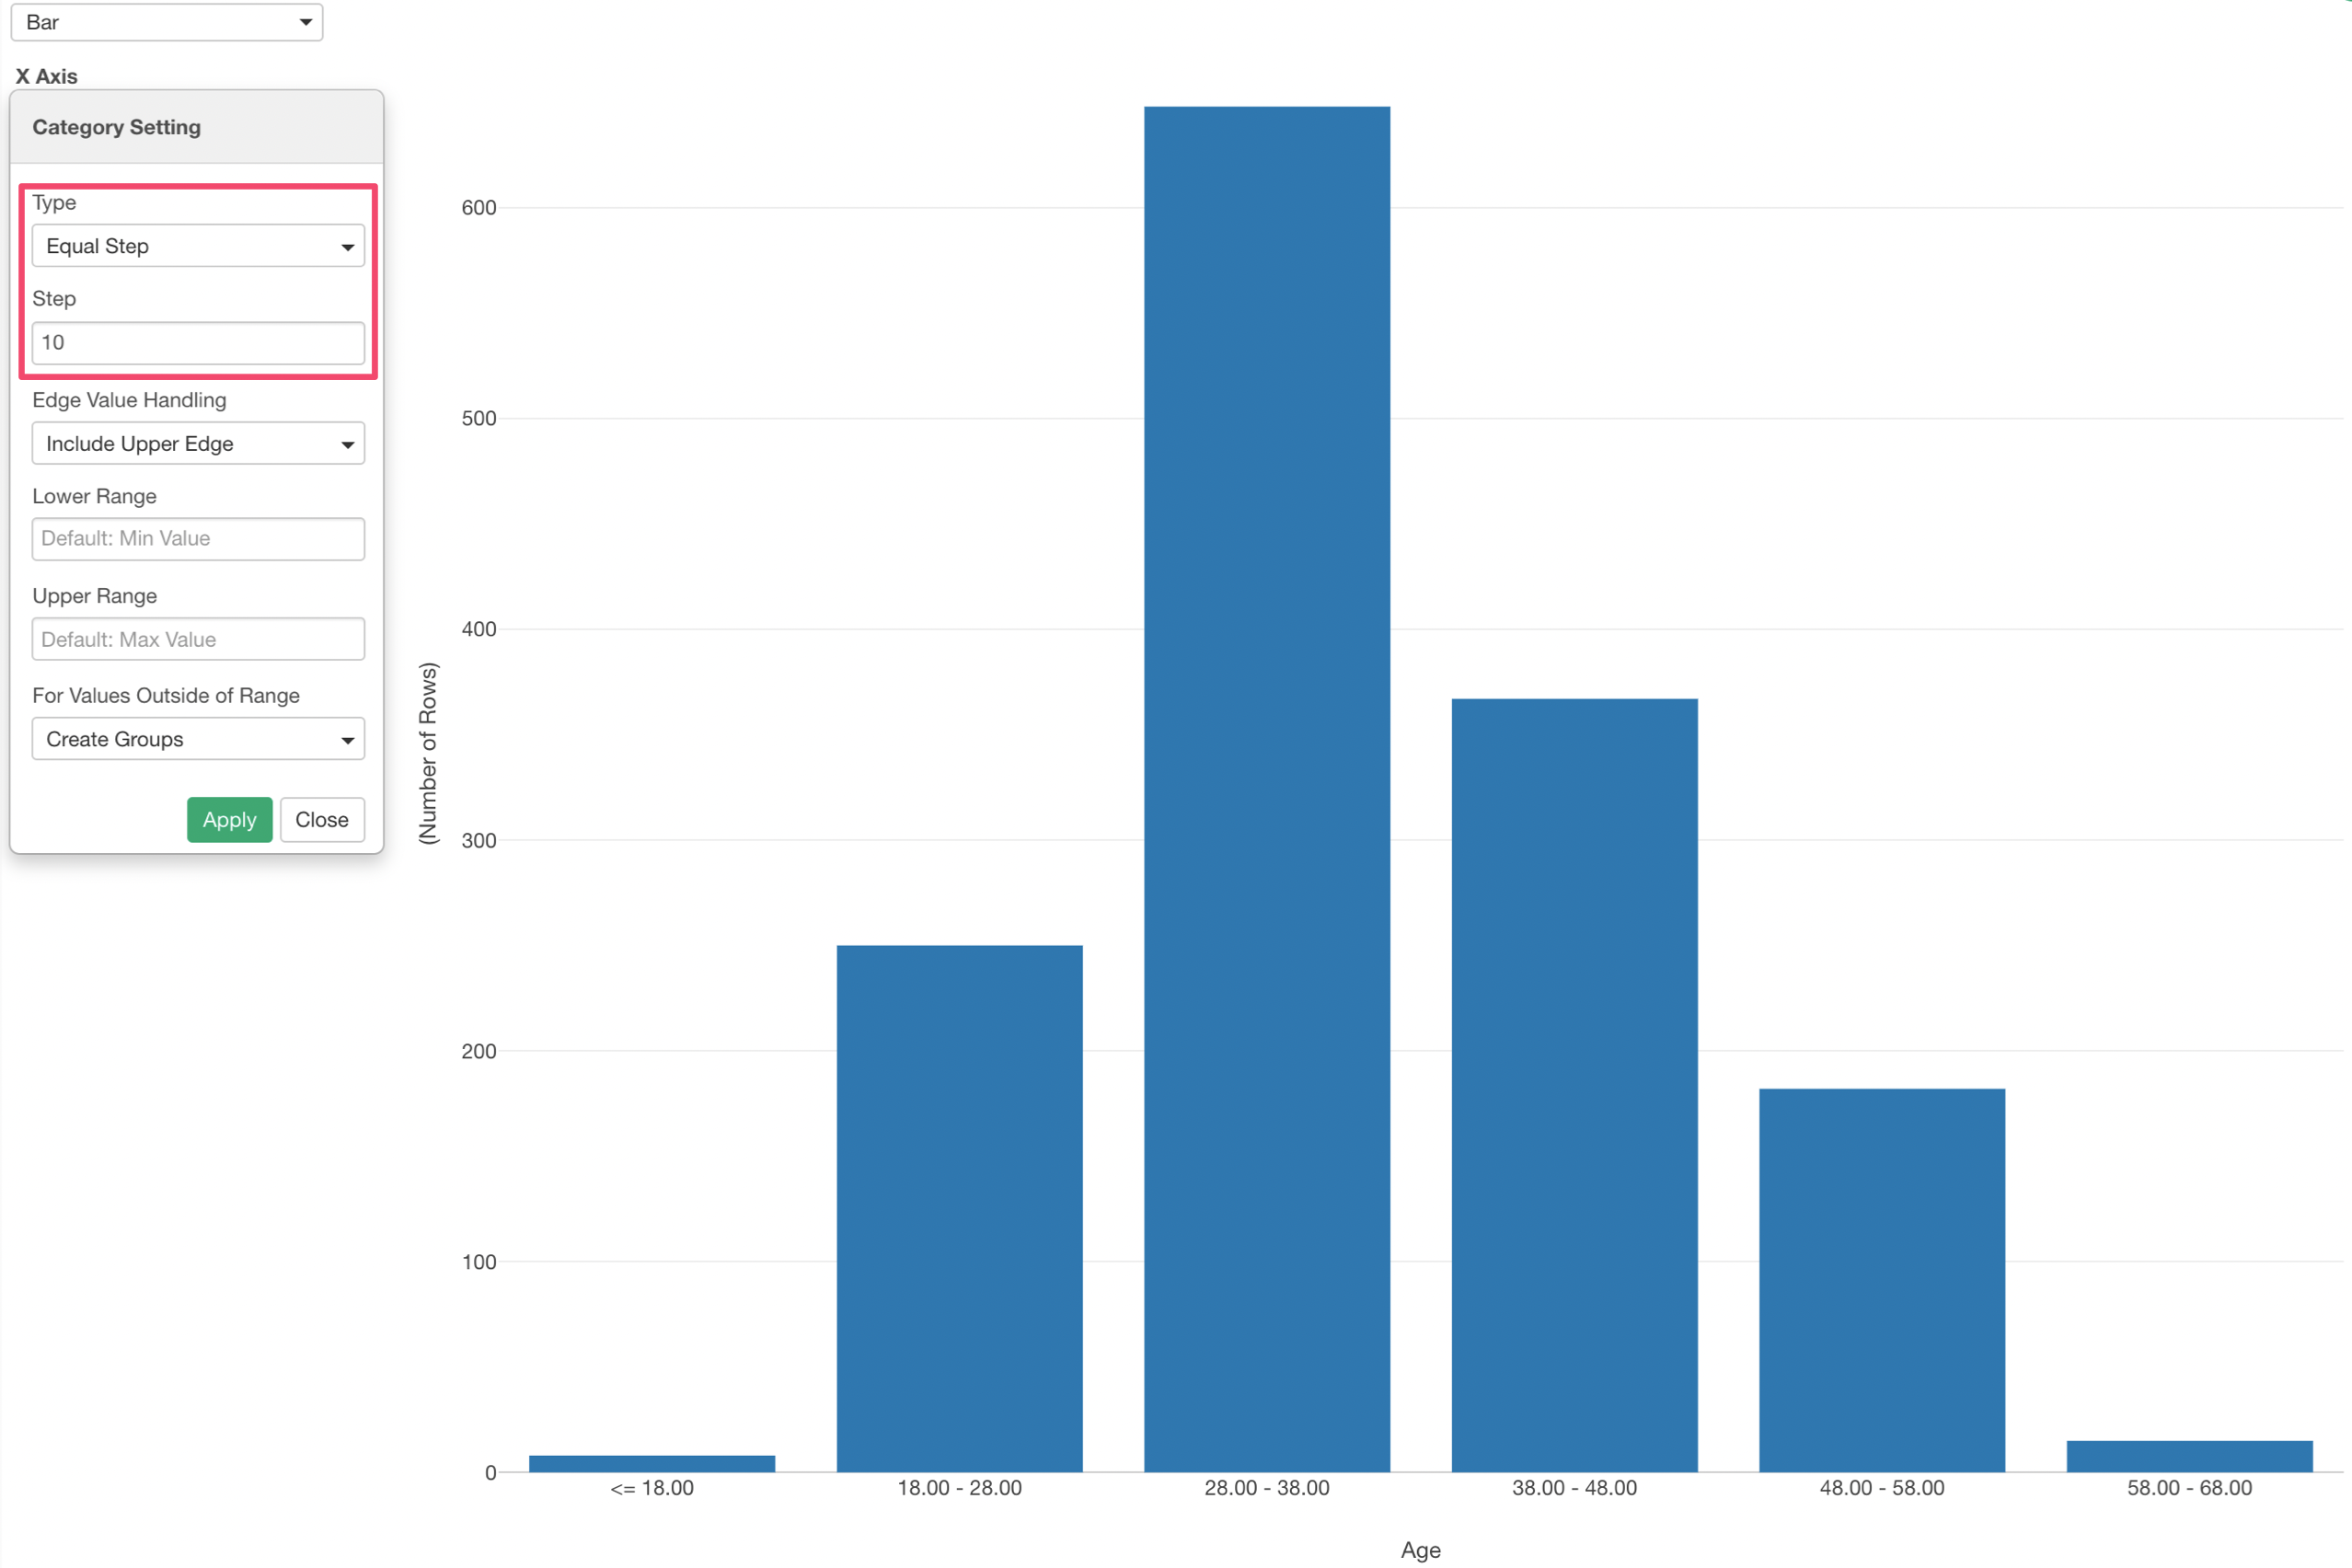
Notice that this creates the groups with every 10 years but doesn't start with 20, 30, etc. To fix this, you can use the Upper / Lower Range setting.
Type 20 for the 'Lower Range' and set 'Create Groups' for the 'For Values Outside of Range'.
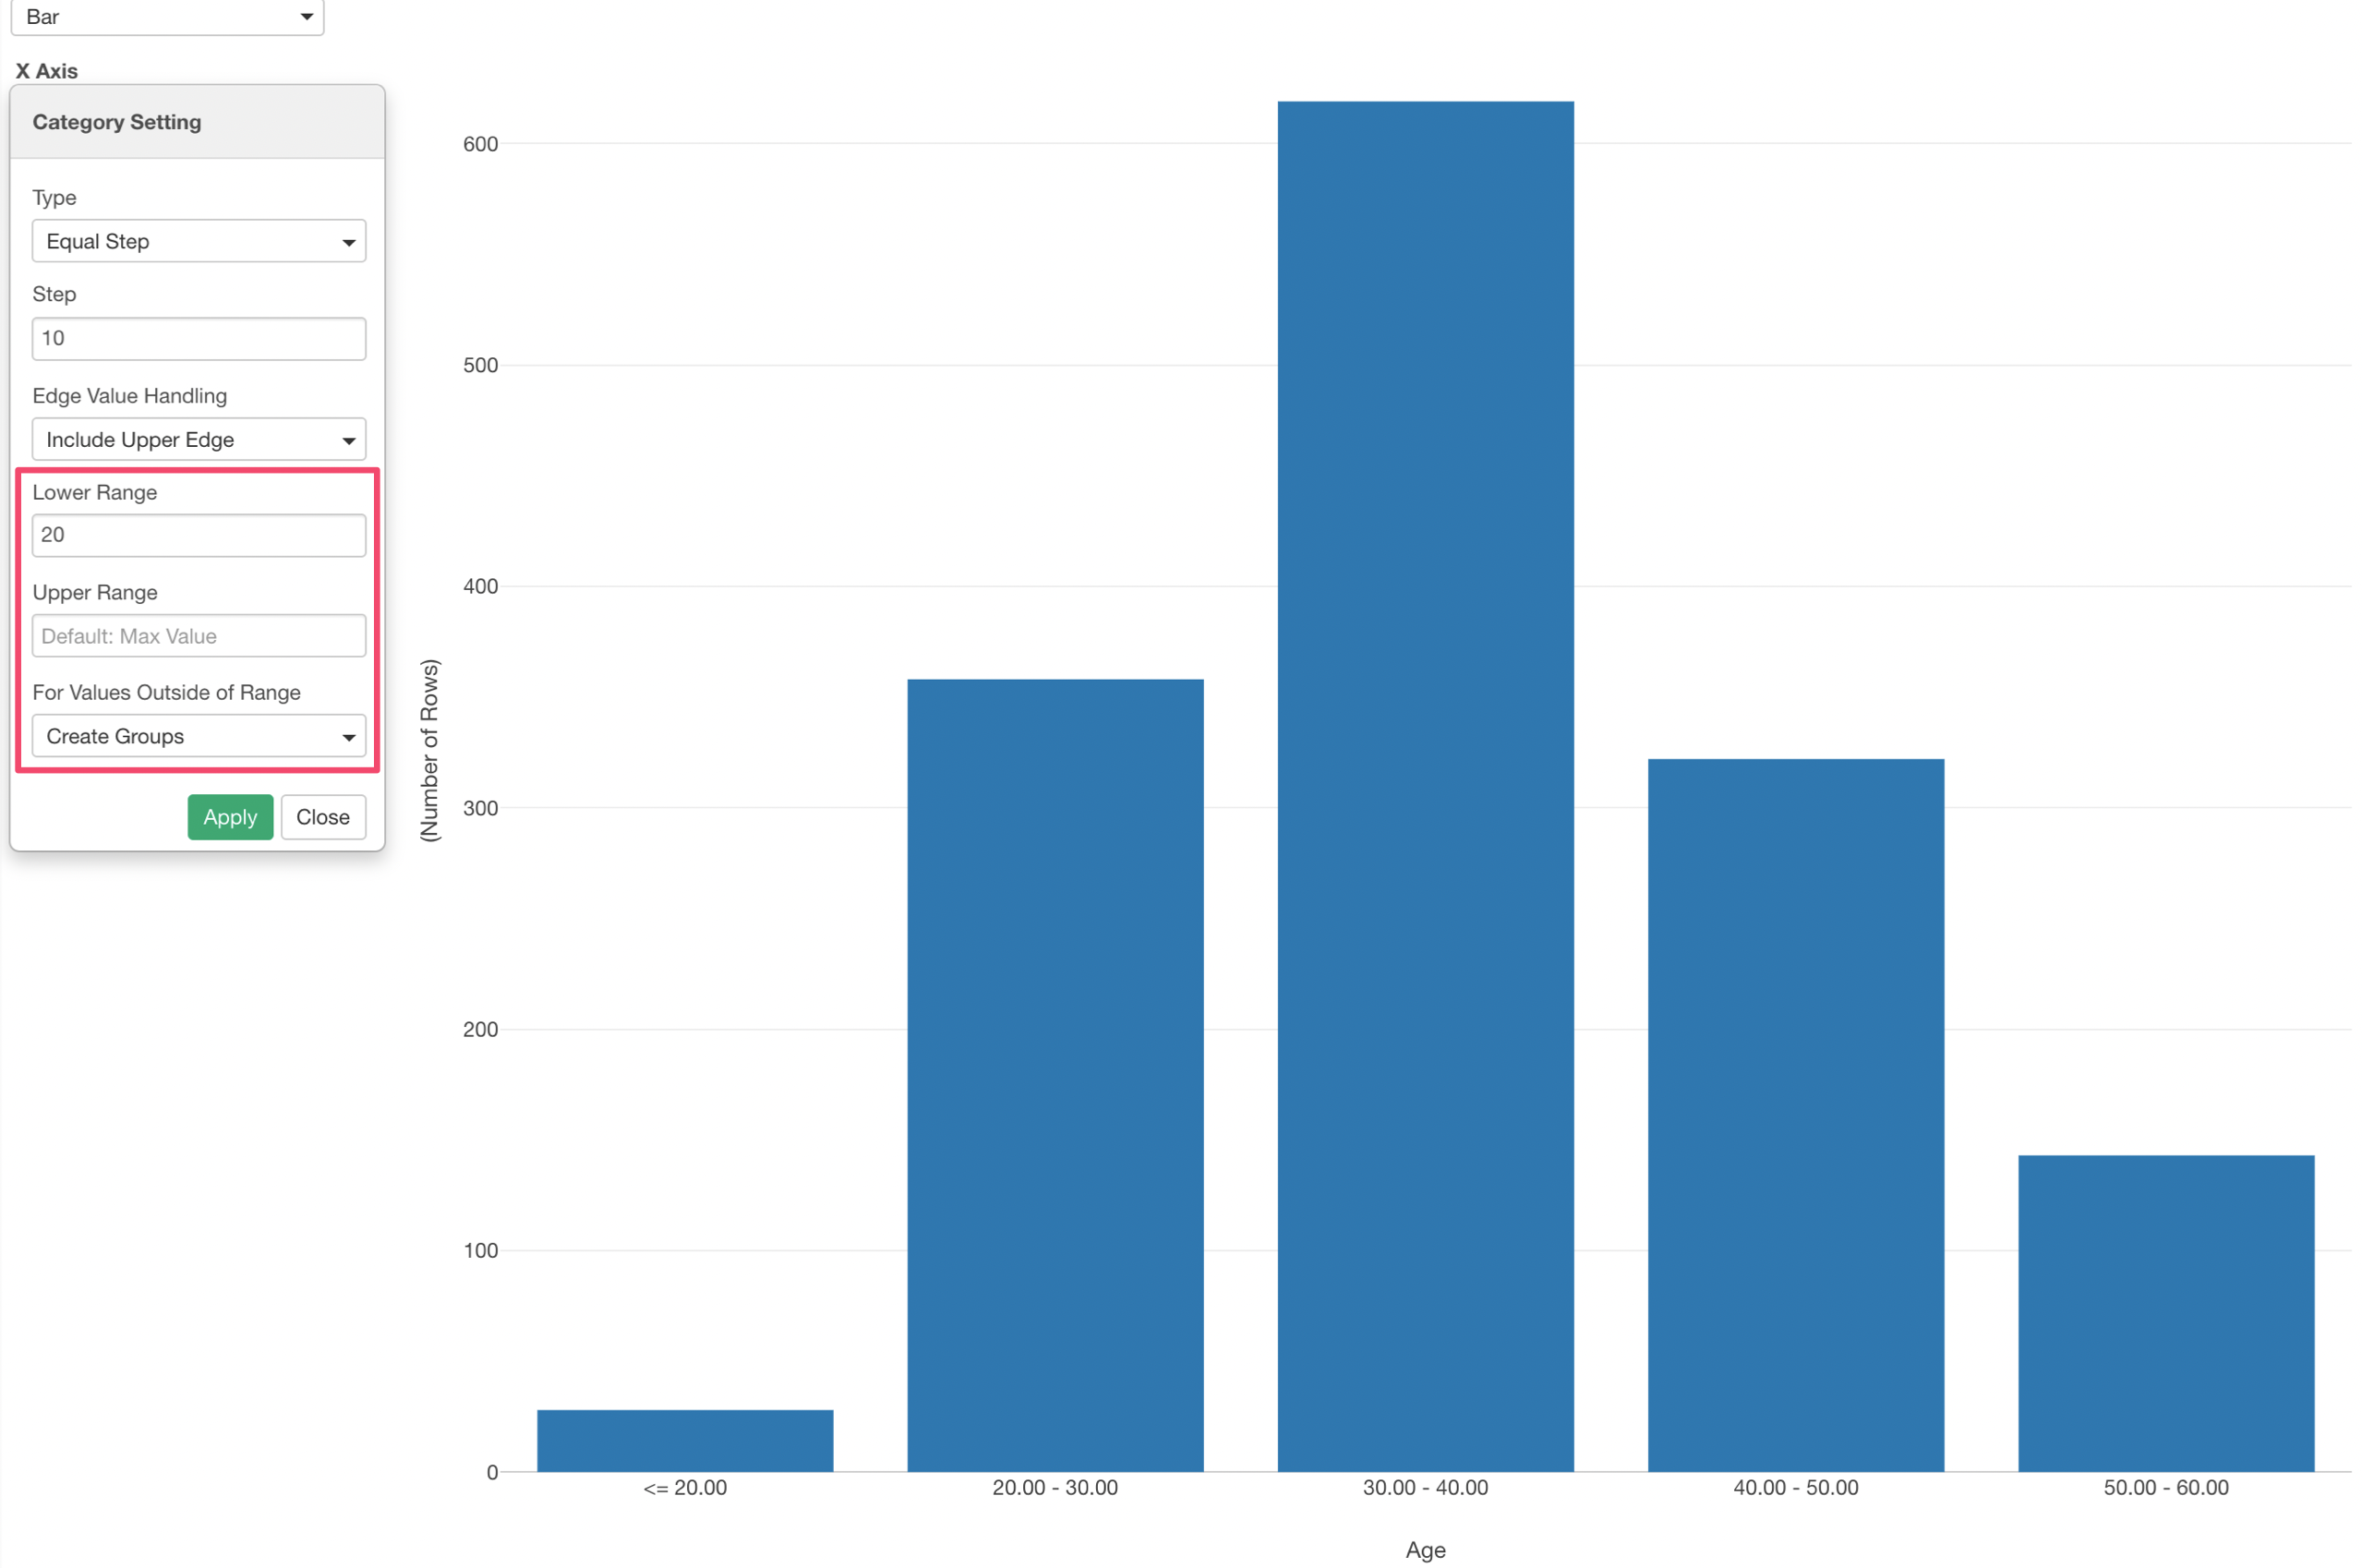
This creates the groups starting from 20, 30, etc. and also create an extra group for any numbers less than 20.
Edge Value Handling
Note that when the 'Edge Value handling' is set to 'Include Upper Edge' it means that each group is something like '20 < group <= 30'.
If it's set to 'Include Lower Edge' then it means something like '20 <= group < 30'.