How to Create Data for Market Basket Analysis
This note introduces how to convert your data into a format suitable for Market Basket Analysis when the original data is not in the required structure.
What is Market Basket Analysis?
Market Basket Analysis is a technique used to discover relationships between multiple items that tend to be “selected together.”
Originally, it has been widely utilized in the retail industry to analyze “combinations of products that are frequently purchased together.” For example, it can reveal associations such as “people who buy diapers also tend to buy beer.”
However, the applications of Market Basket Analysis are not limited to e-commerce or retail. It can also be applied to analyze multiple-choice survey data to understand “combinations of options that are likely to be answered together.” This method can be used across various industries and purposes whenever you want to capture the co-occurrence tendencies between different options.
Data Format for Market Basket Analysis
To perform Market Basket Analysis in Exploratory, you need data in a format where “one row represents one item within one order (basket).”
This corresponds to a format such as order details or payment transaction details.
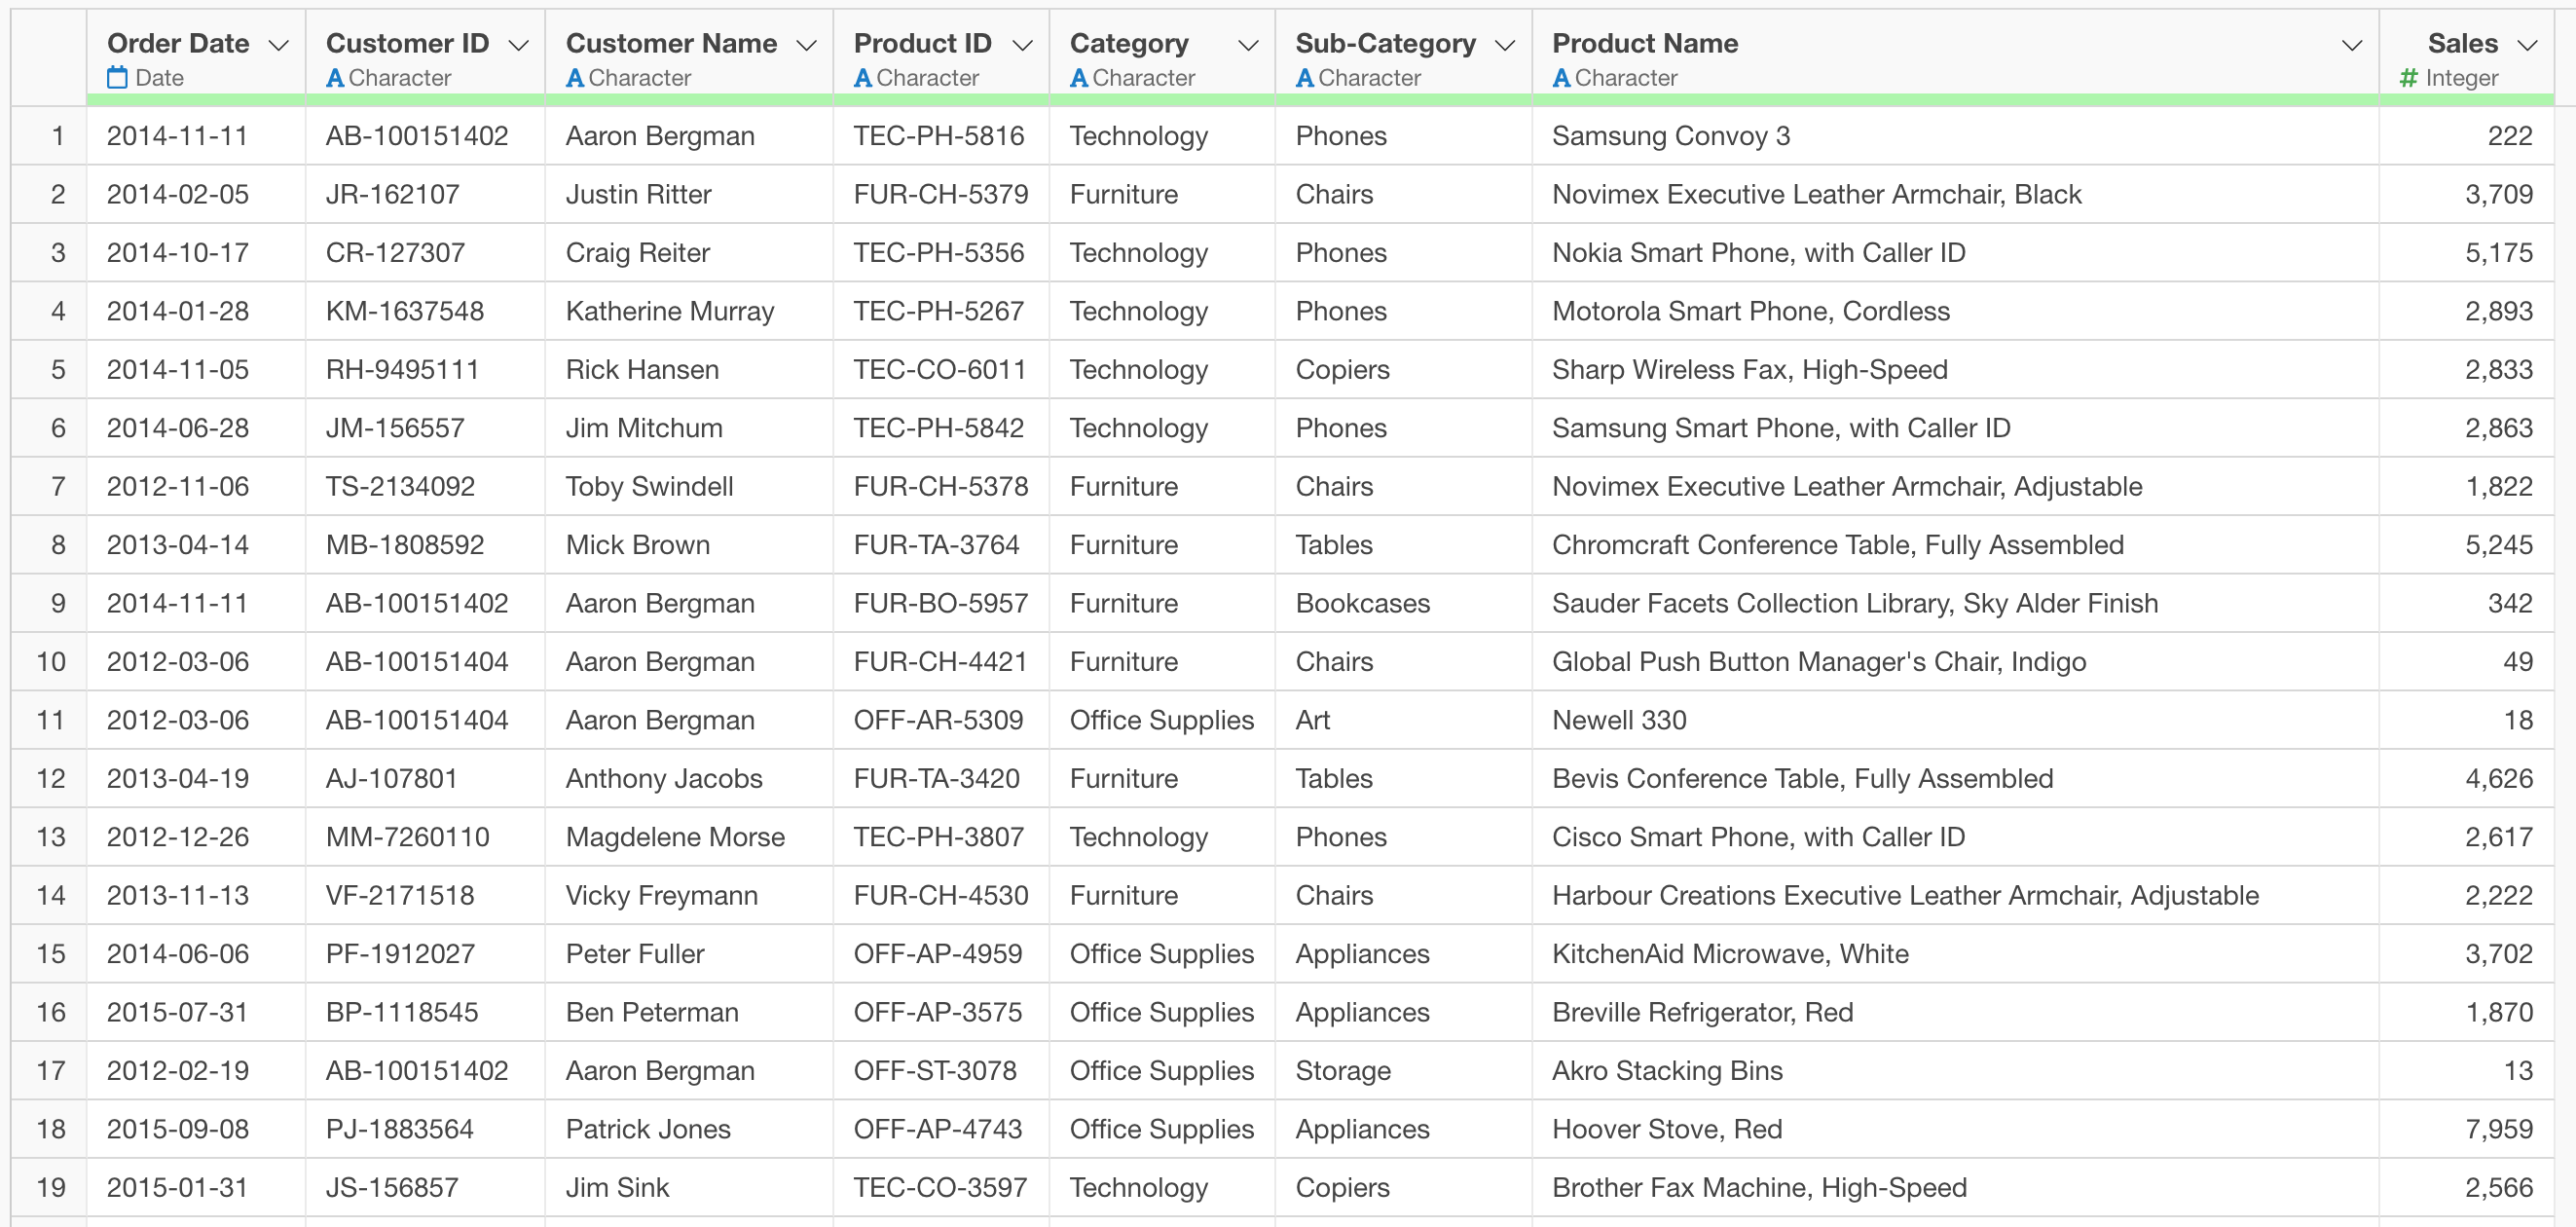
Since typical order or sales data is often already in this format, it can be used for Market Basket Analysis as is.
When Multiple Answers are Stored in a Single Cell in Survey Data
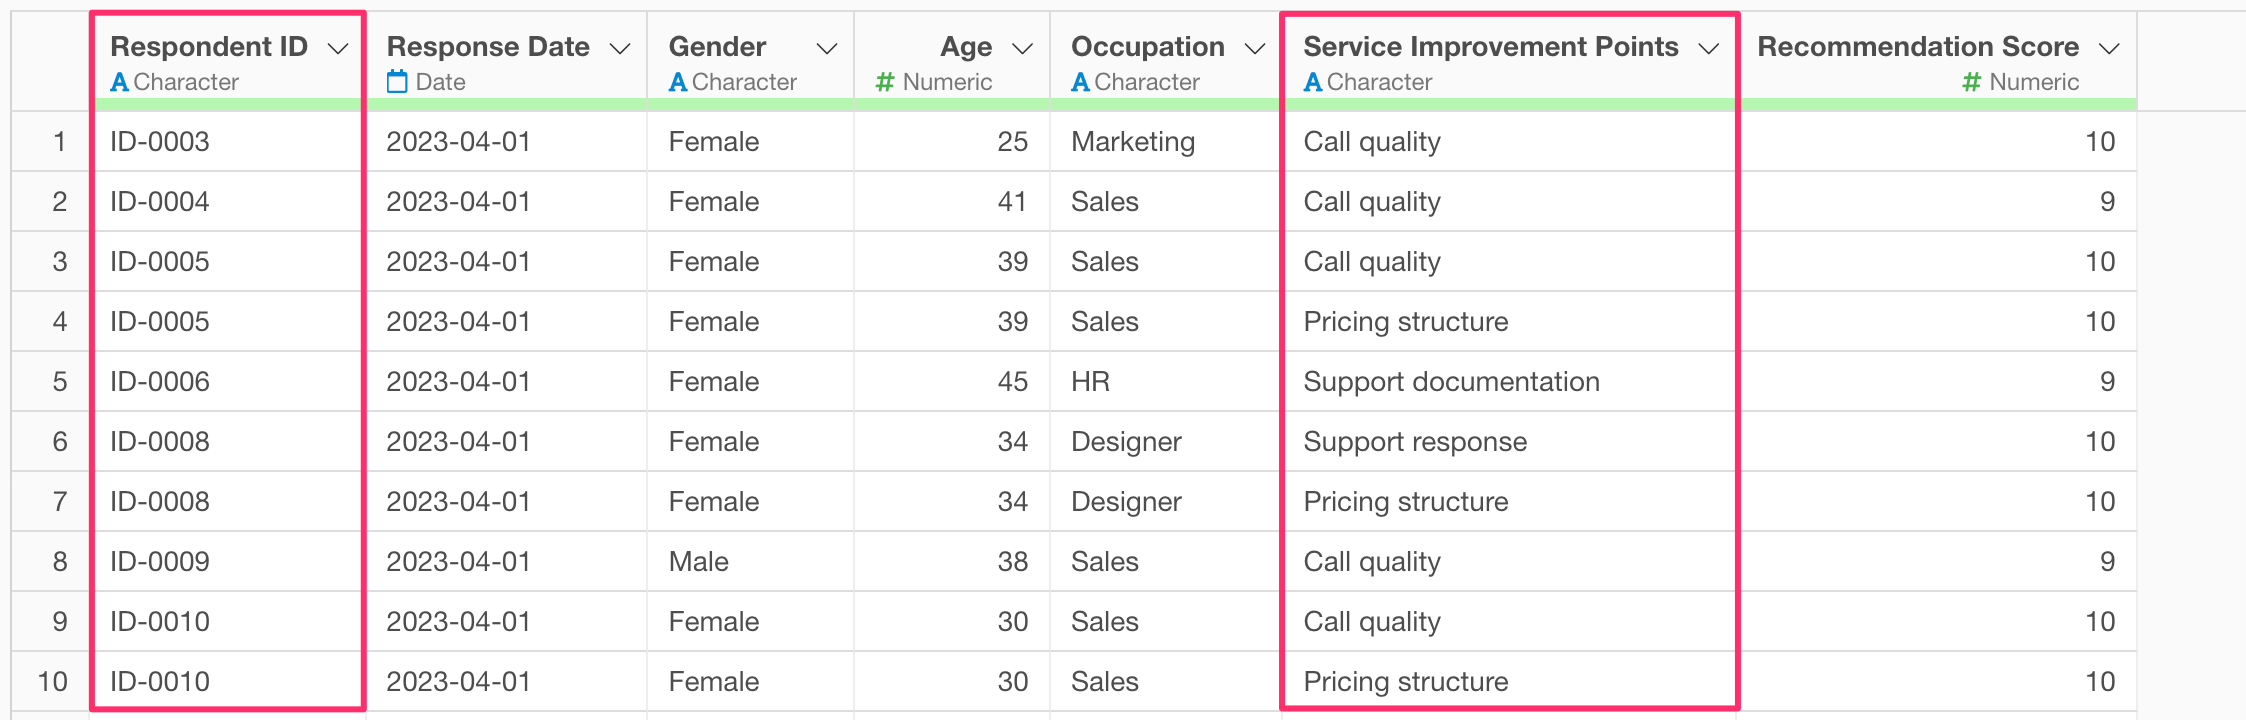
For example, consider survey data where one row represents one respondent.
In such survey data, multiple answers for a single question may be stored together in one cell using an arbitrary delimiter.
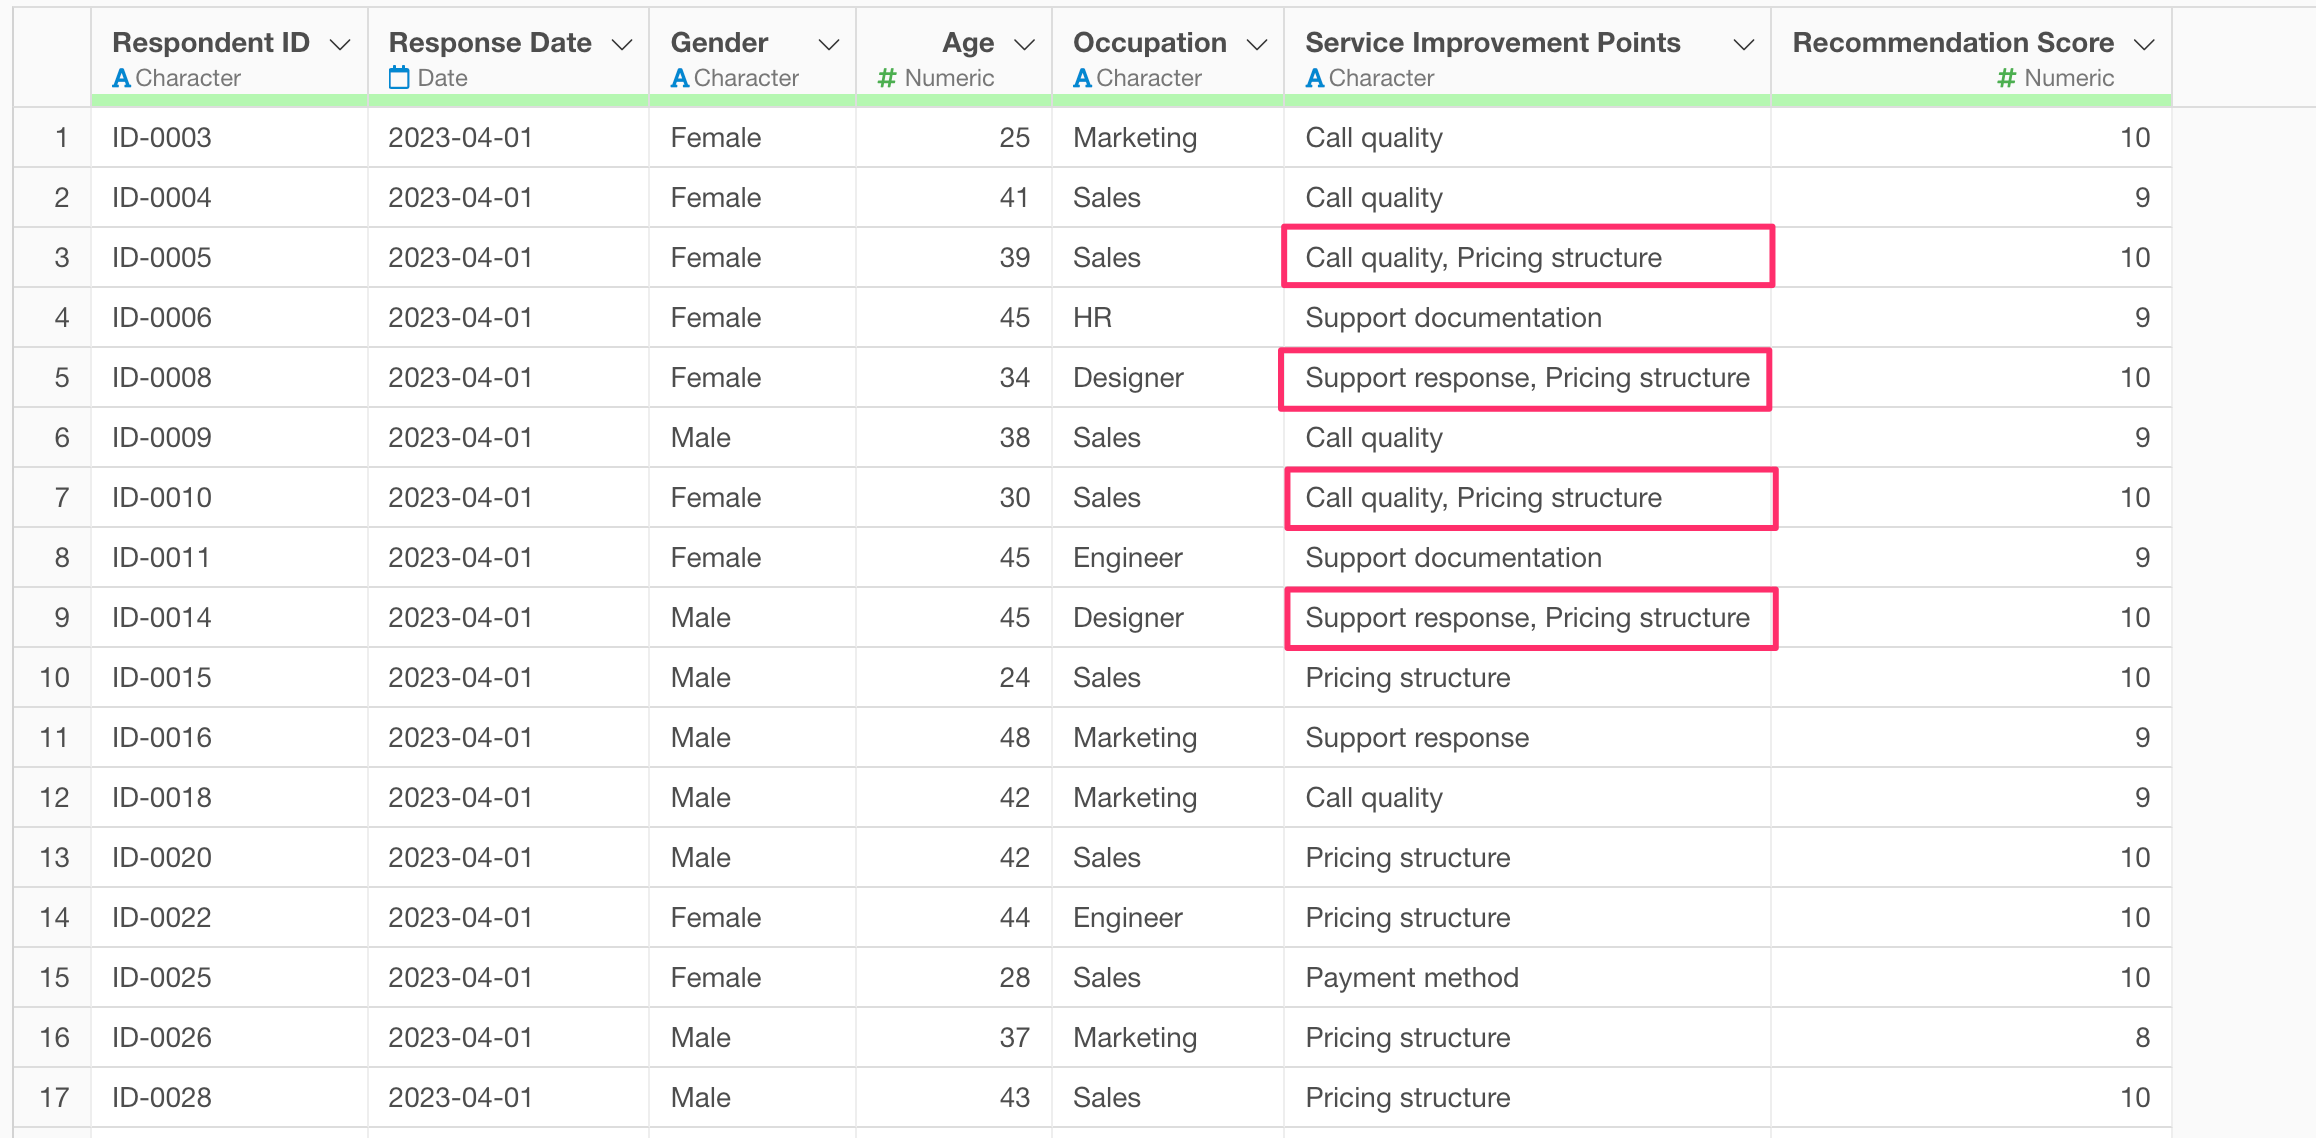
Since Market Basket Analysis cannot be executed in this format, the data must be converted into a “one row per answer” format.
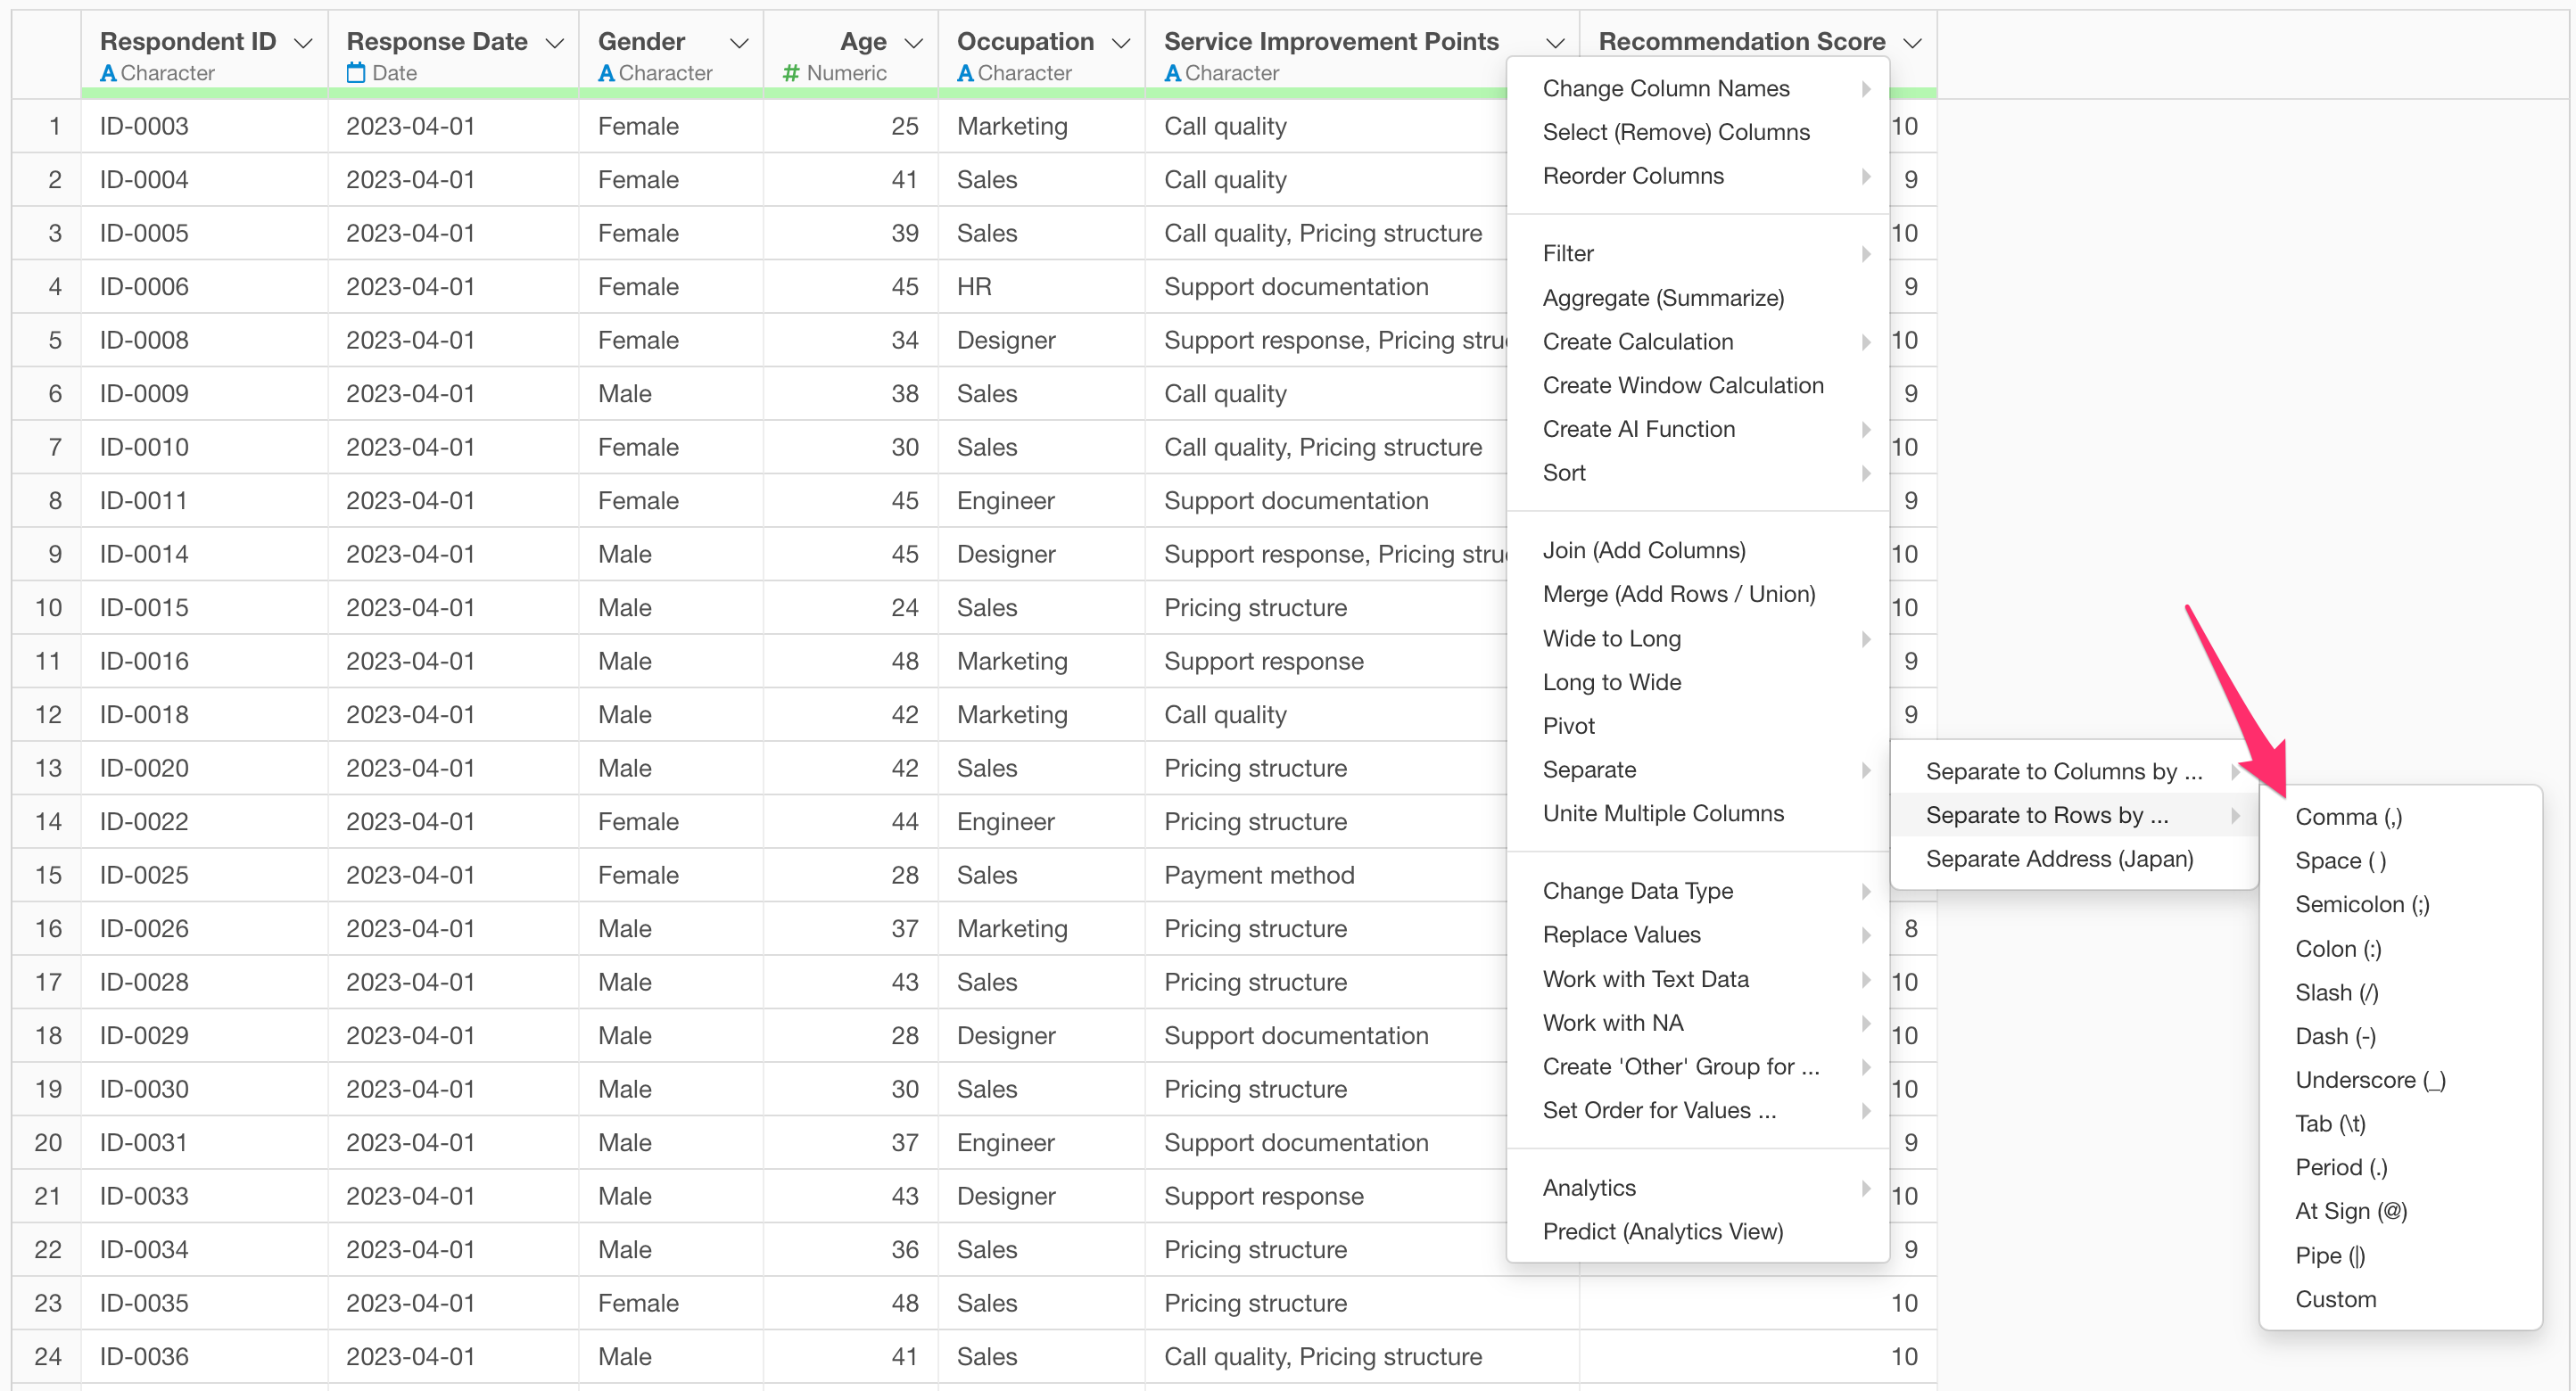
If you have data like this, select “Separate” and then “Separate to Rows by” from the column header menu of the “Service Improvement Points” column.
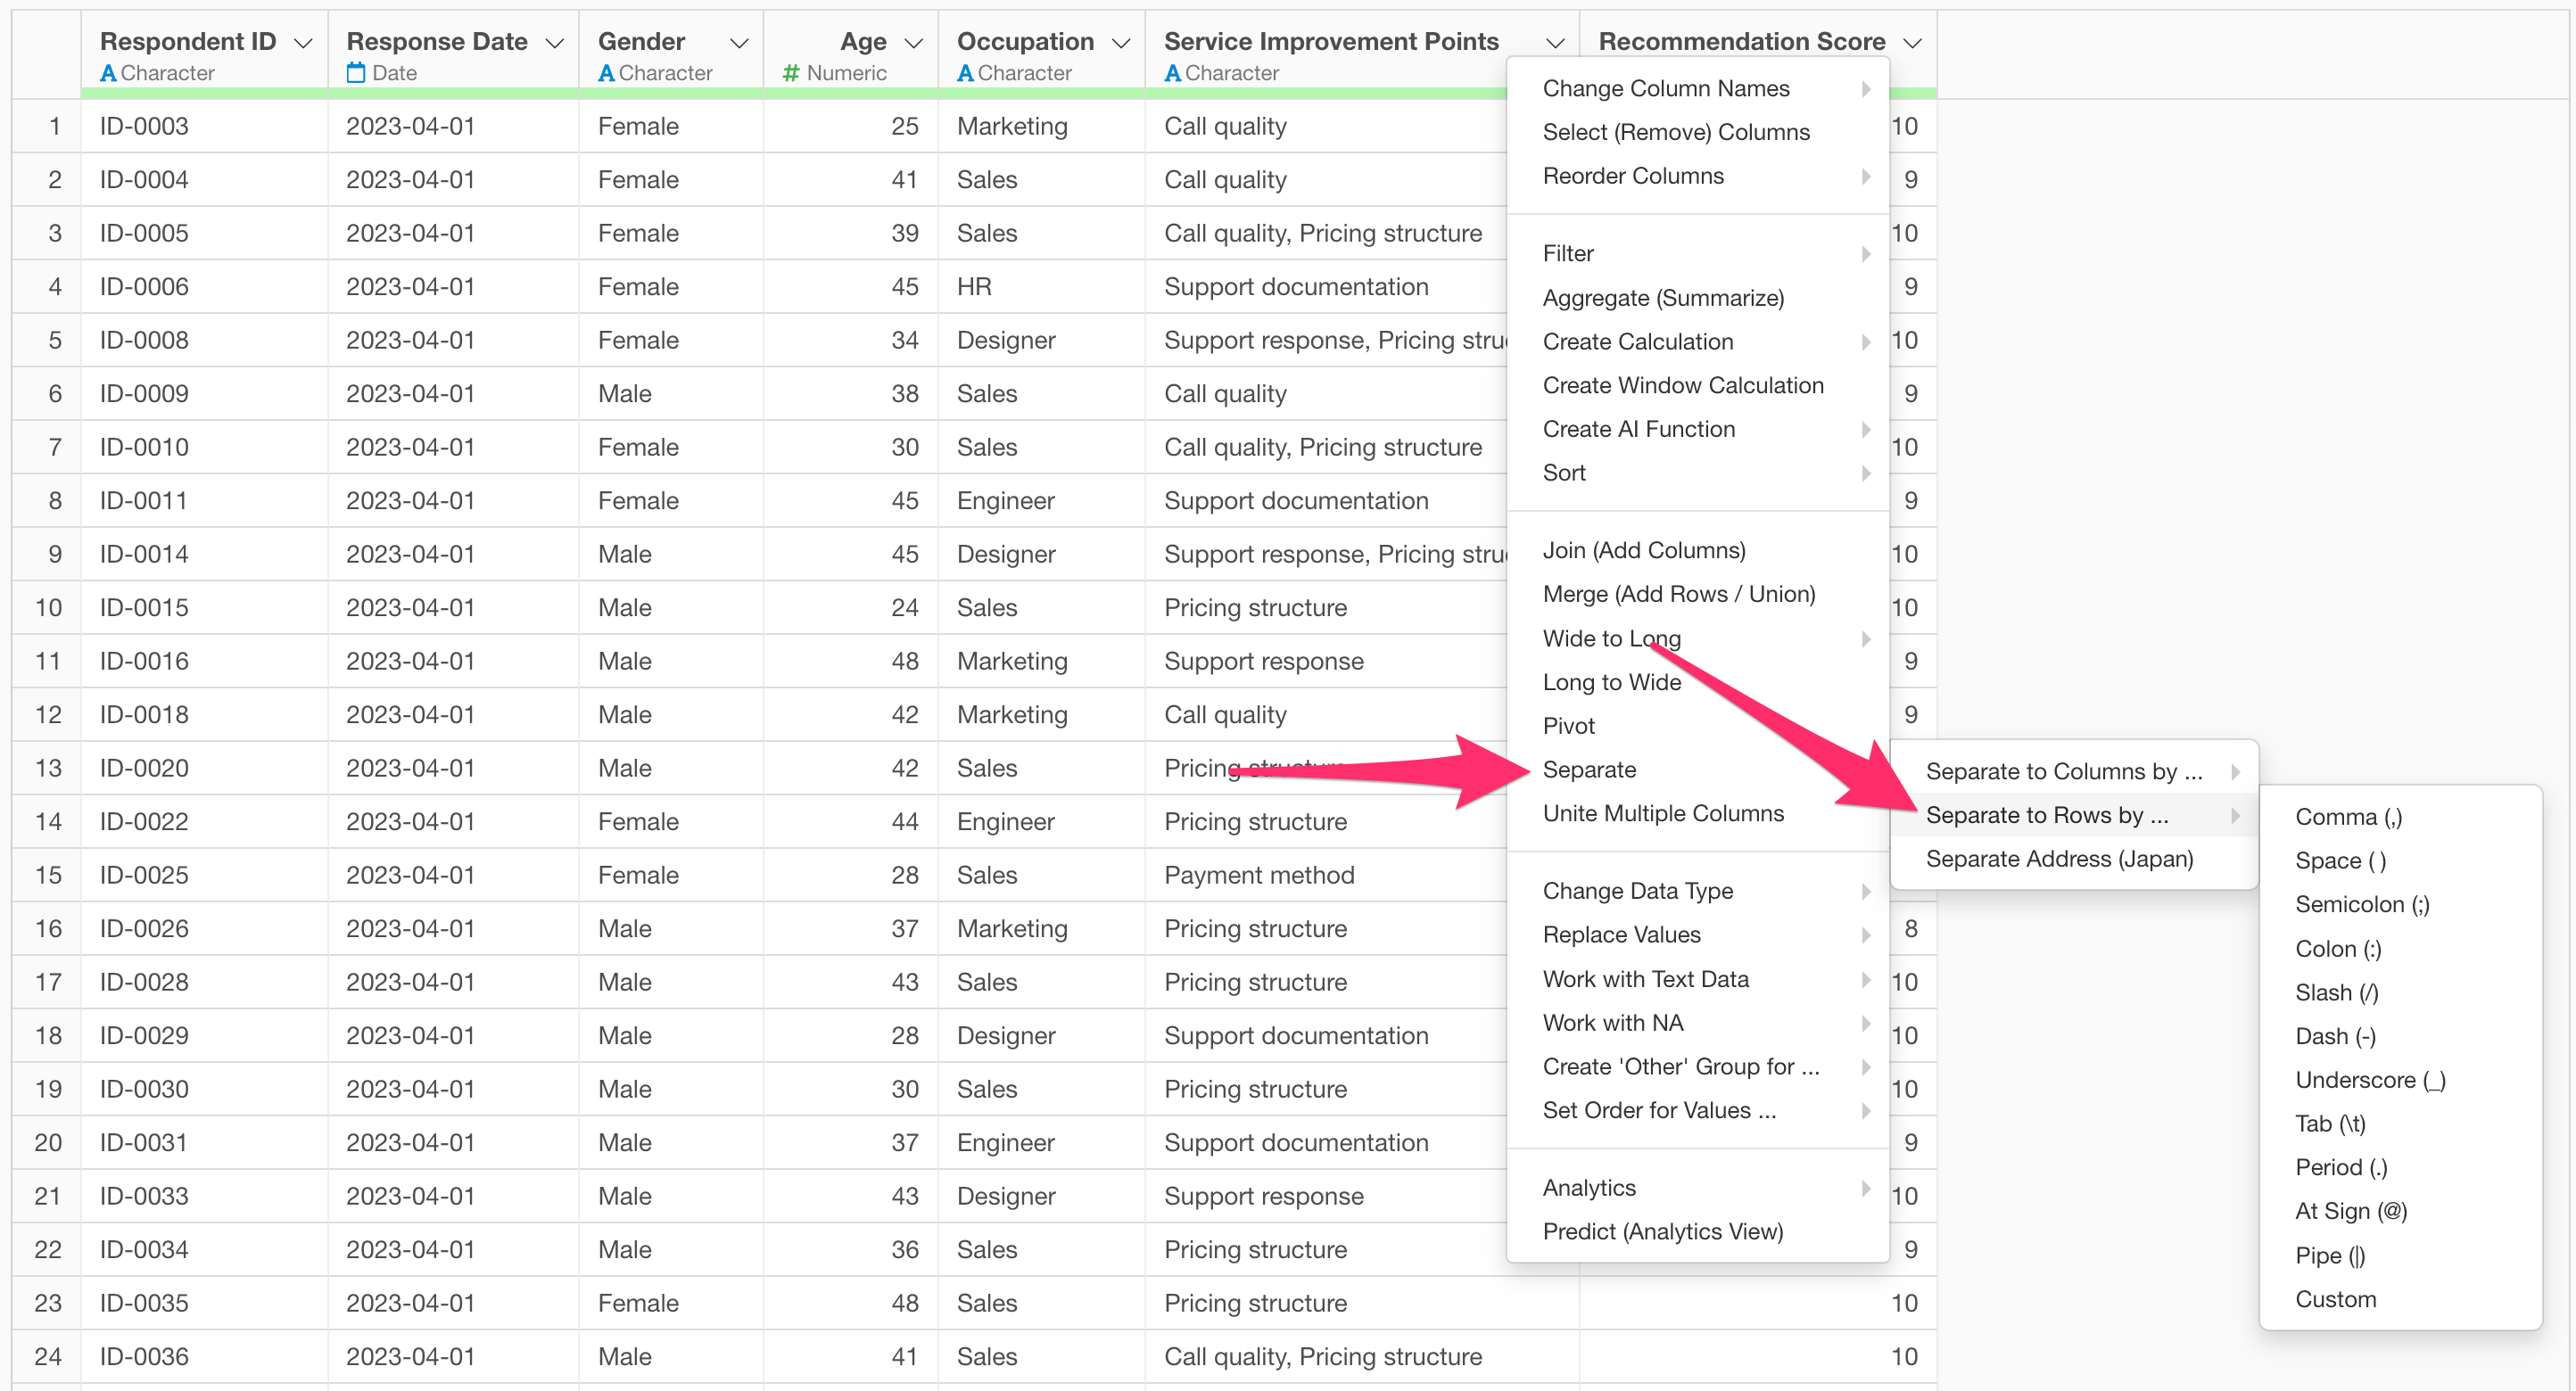
In this case, specify a “comma (,)” as the delimiter.
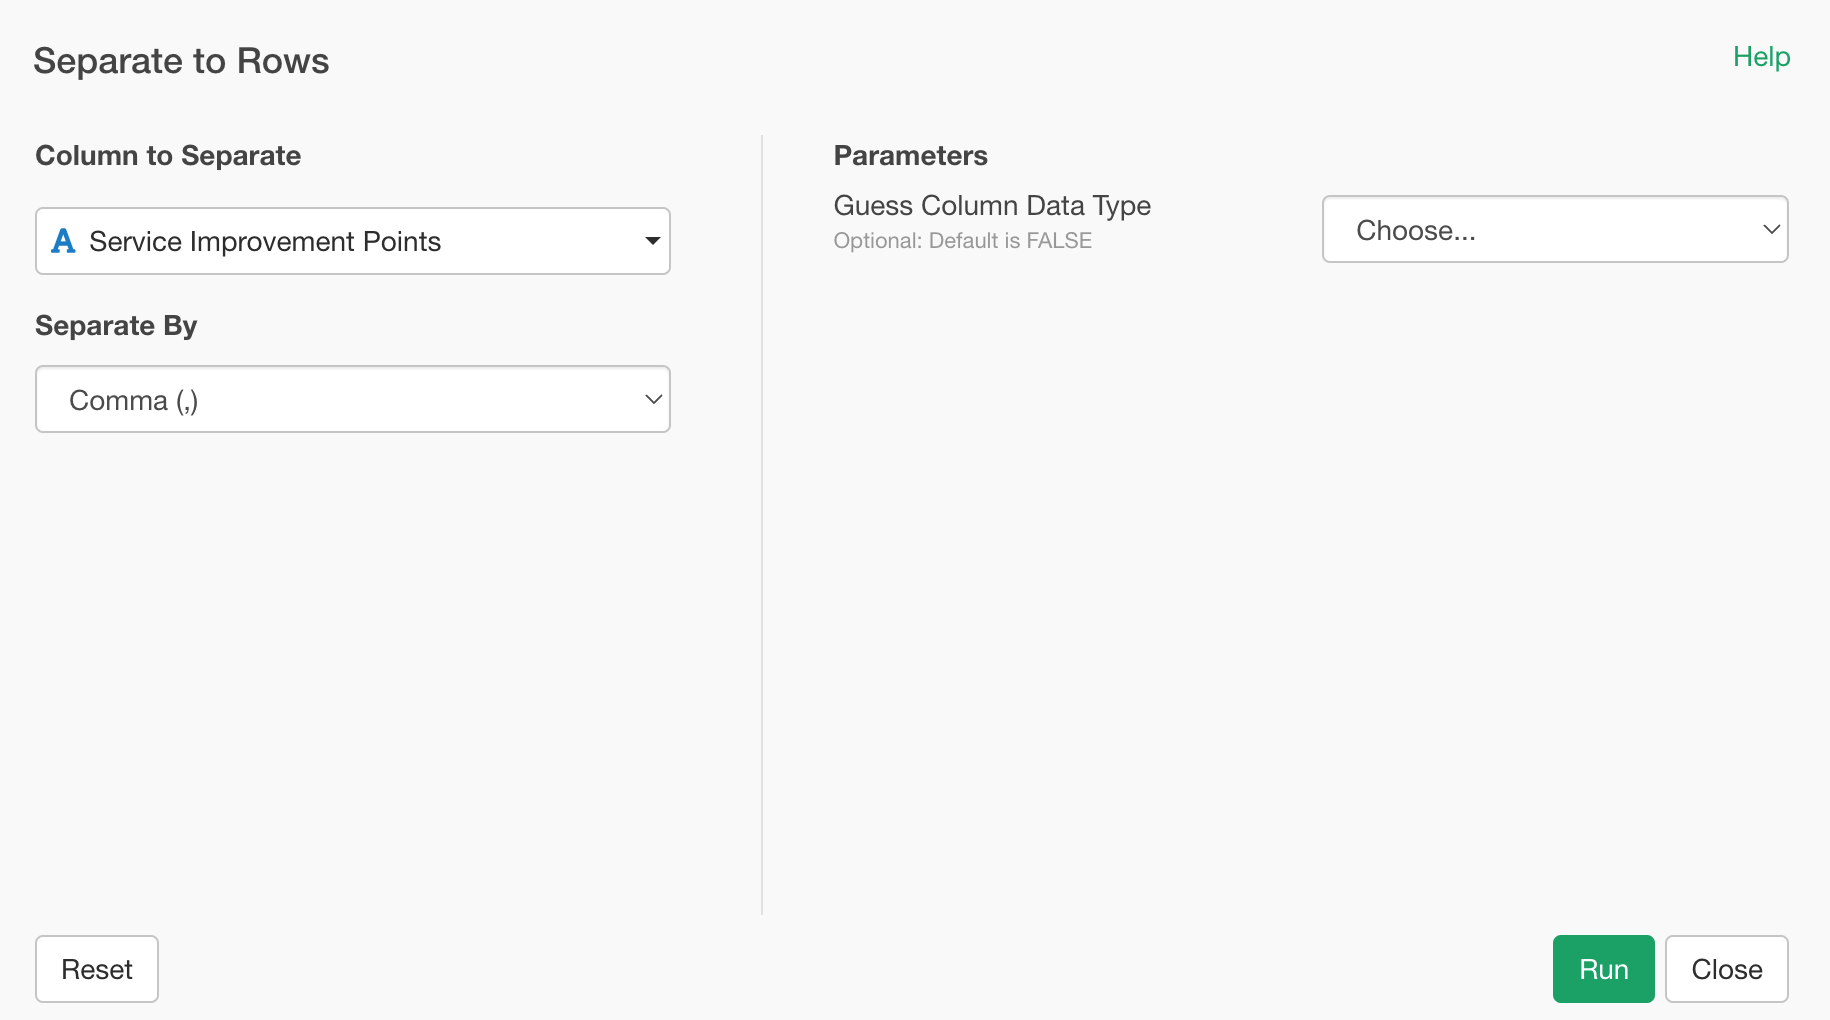
When the “Separate to Rows” dialog opens, click the Run button.
Now, each answer is expanded into a single row, converting the data into a format suitable for Market Basket Analysis.
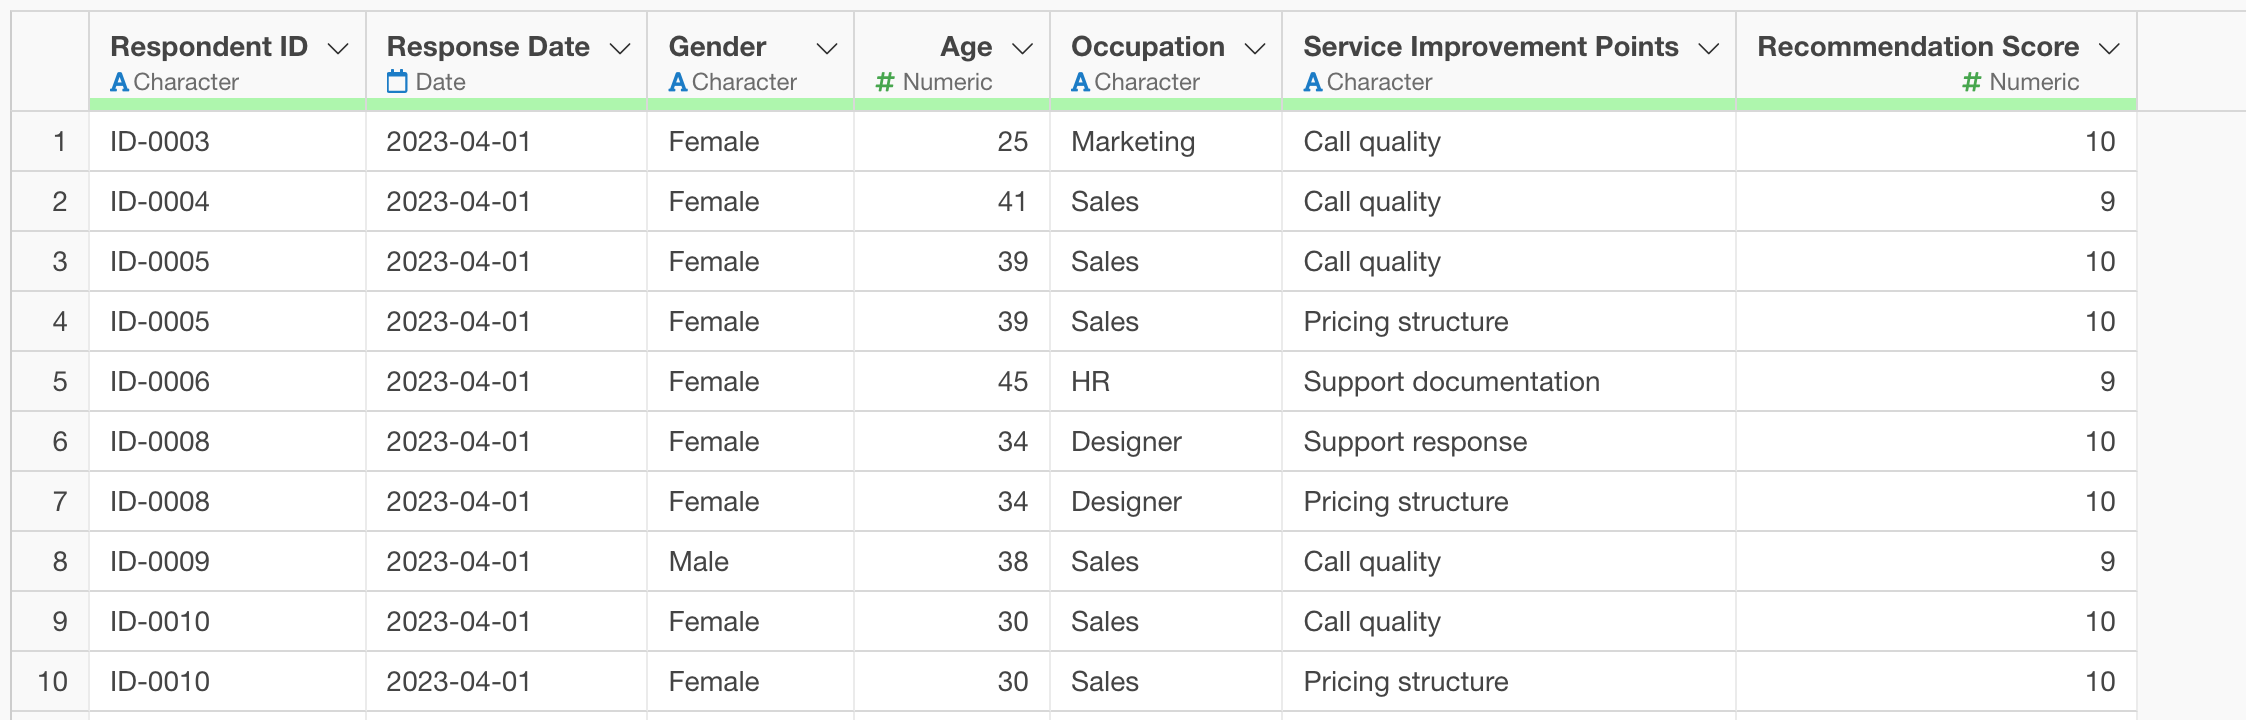
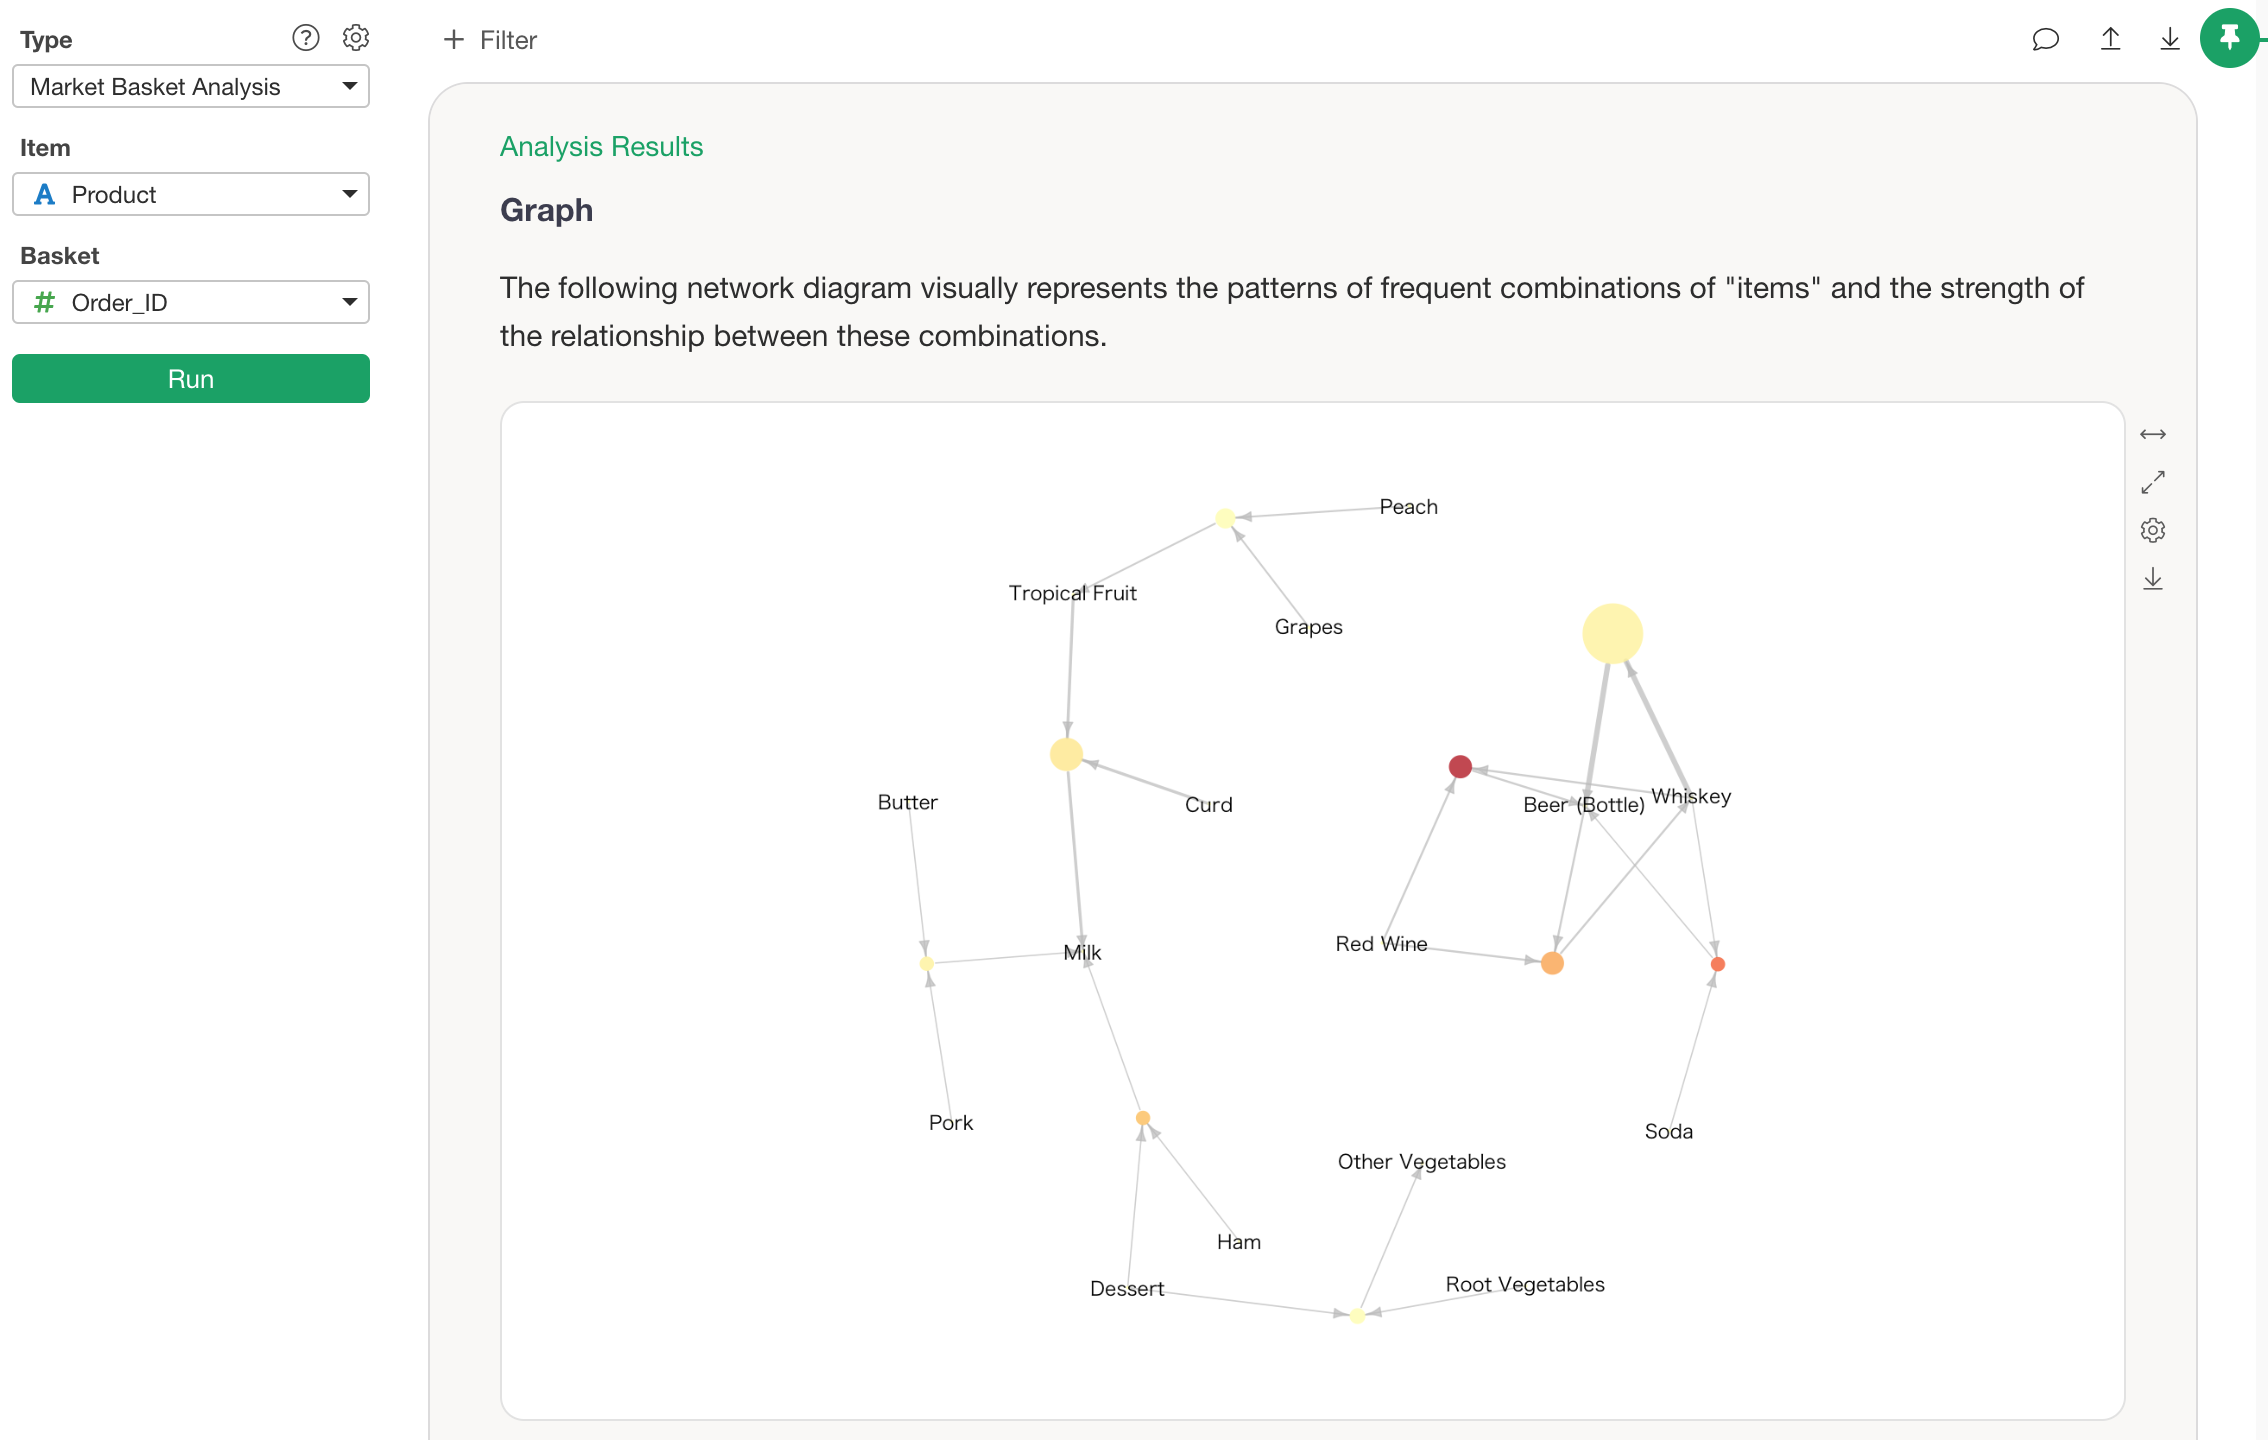
In the converted data, you can perform Market Basket Analysis by specifying “Respondent ID” as the Basket and “Service Improvements” as the Item information.
When Each Column Represents One Answer in Multiple-Choice Survey Data
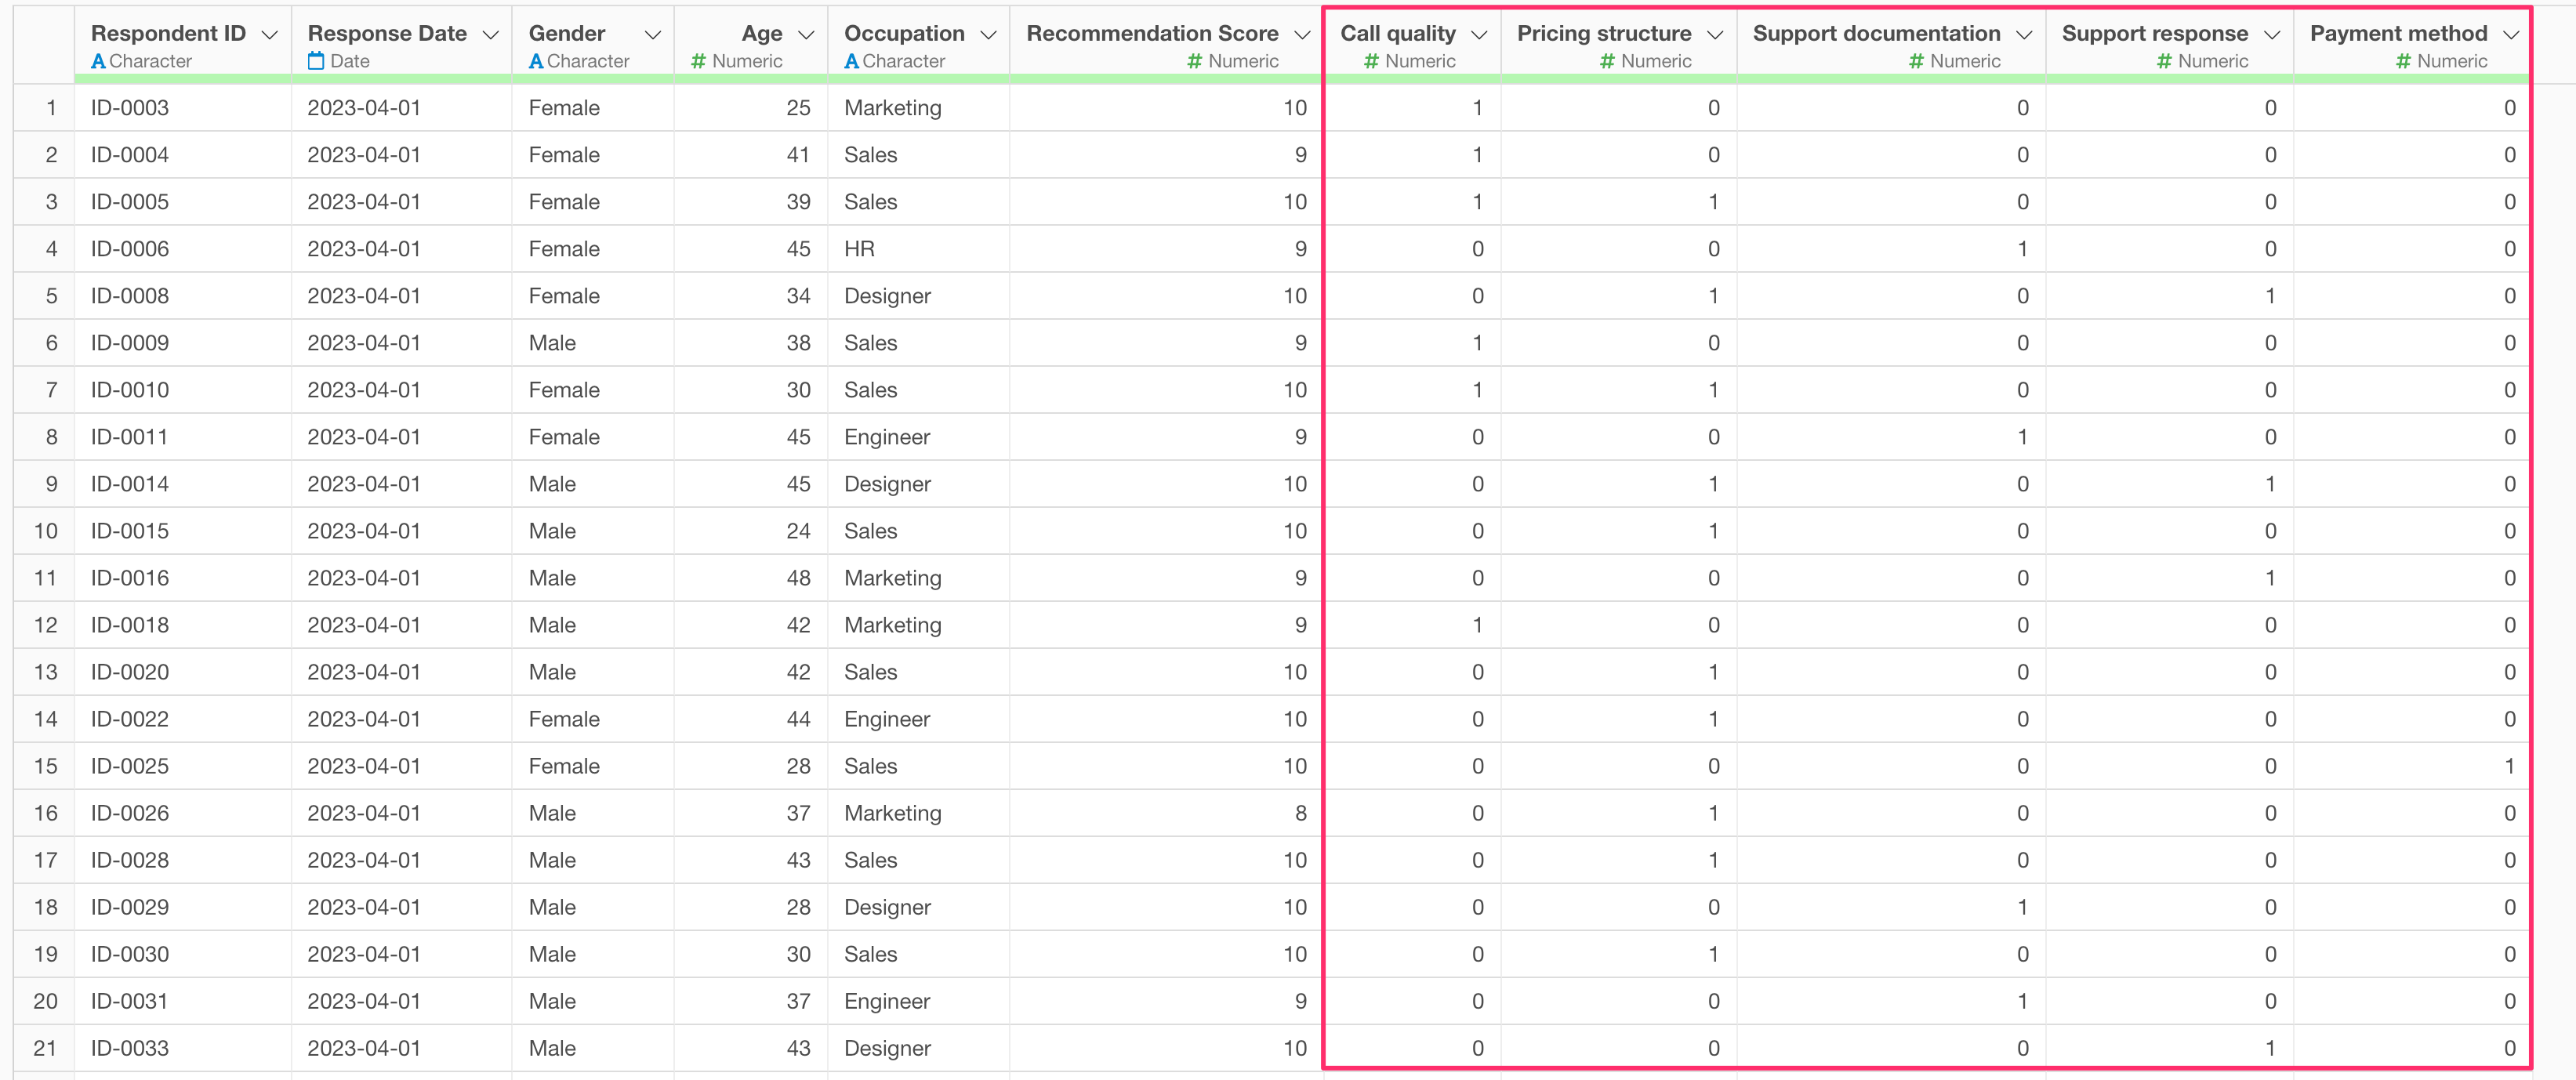
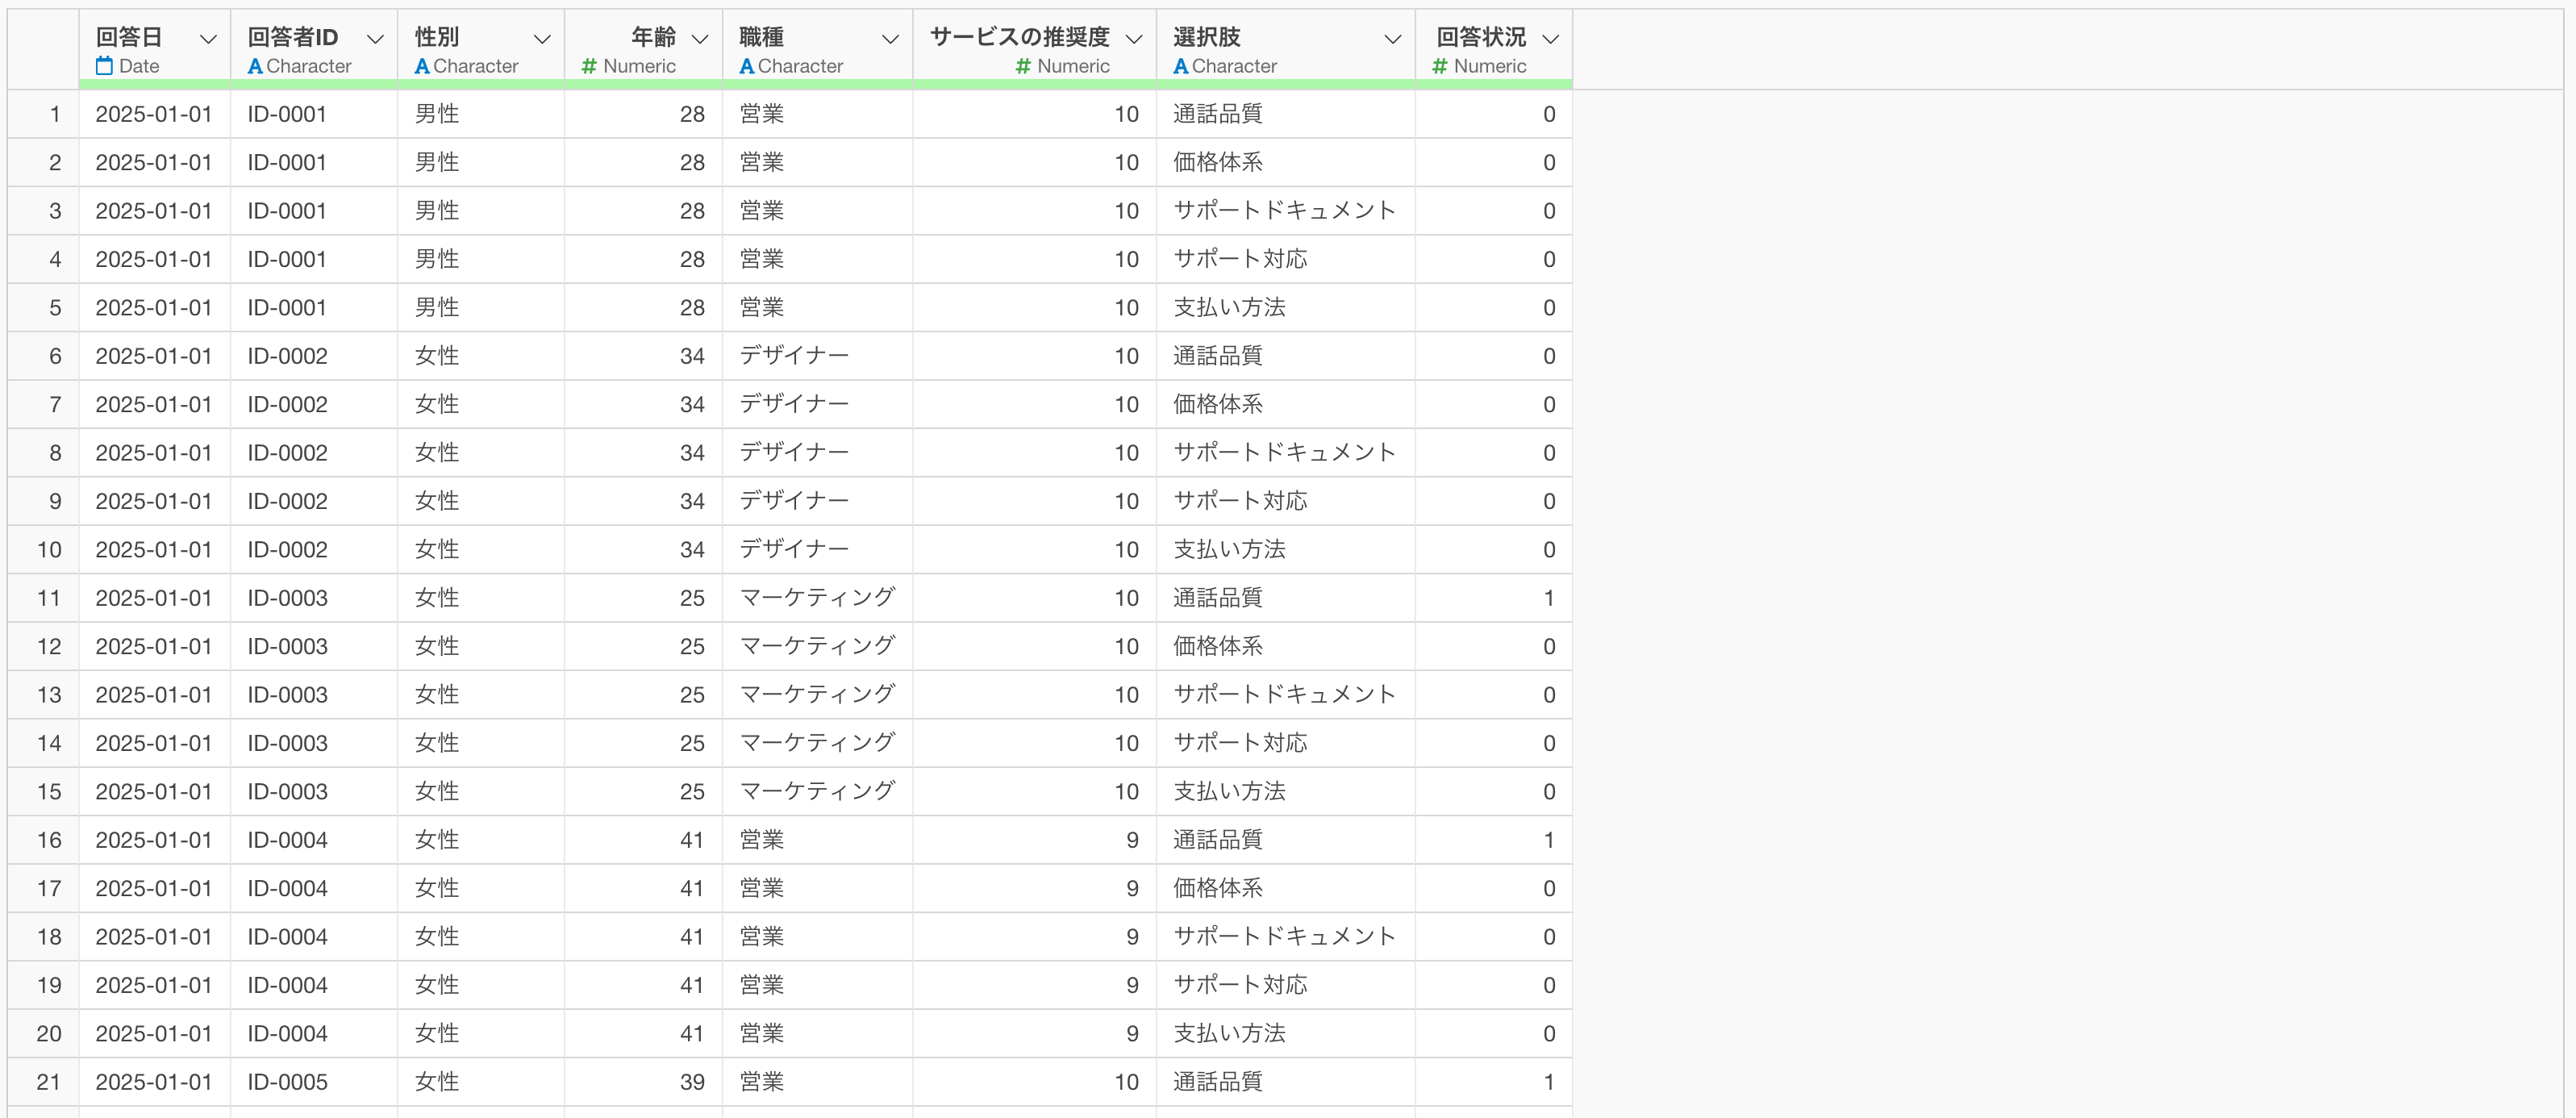
For example, consider survey data where one row represents one respondent.
In such survey data, there are cases where each column represents whether a specific option was selected, with “1” indicating selected and “0” indicating not selected.
For instance, the highlighted columns in the image below represent the response status for “points to be improved” for a certain service.
Since Market Basket Analysis cannot be executed in this format, the data must be converted into a “one row per answer” format.
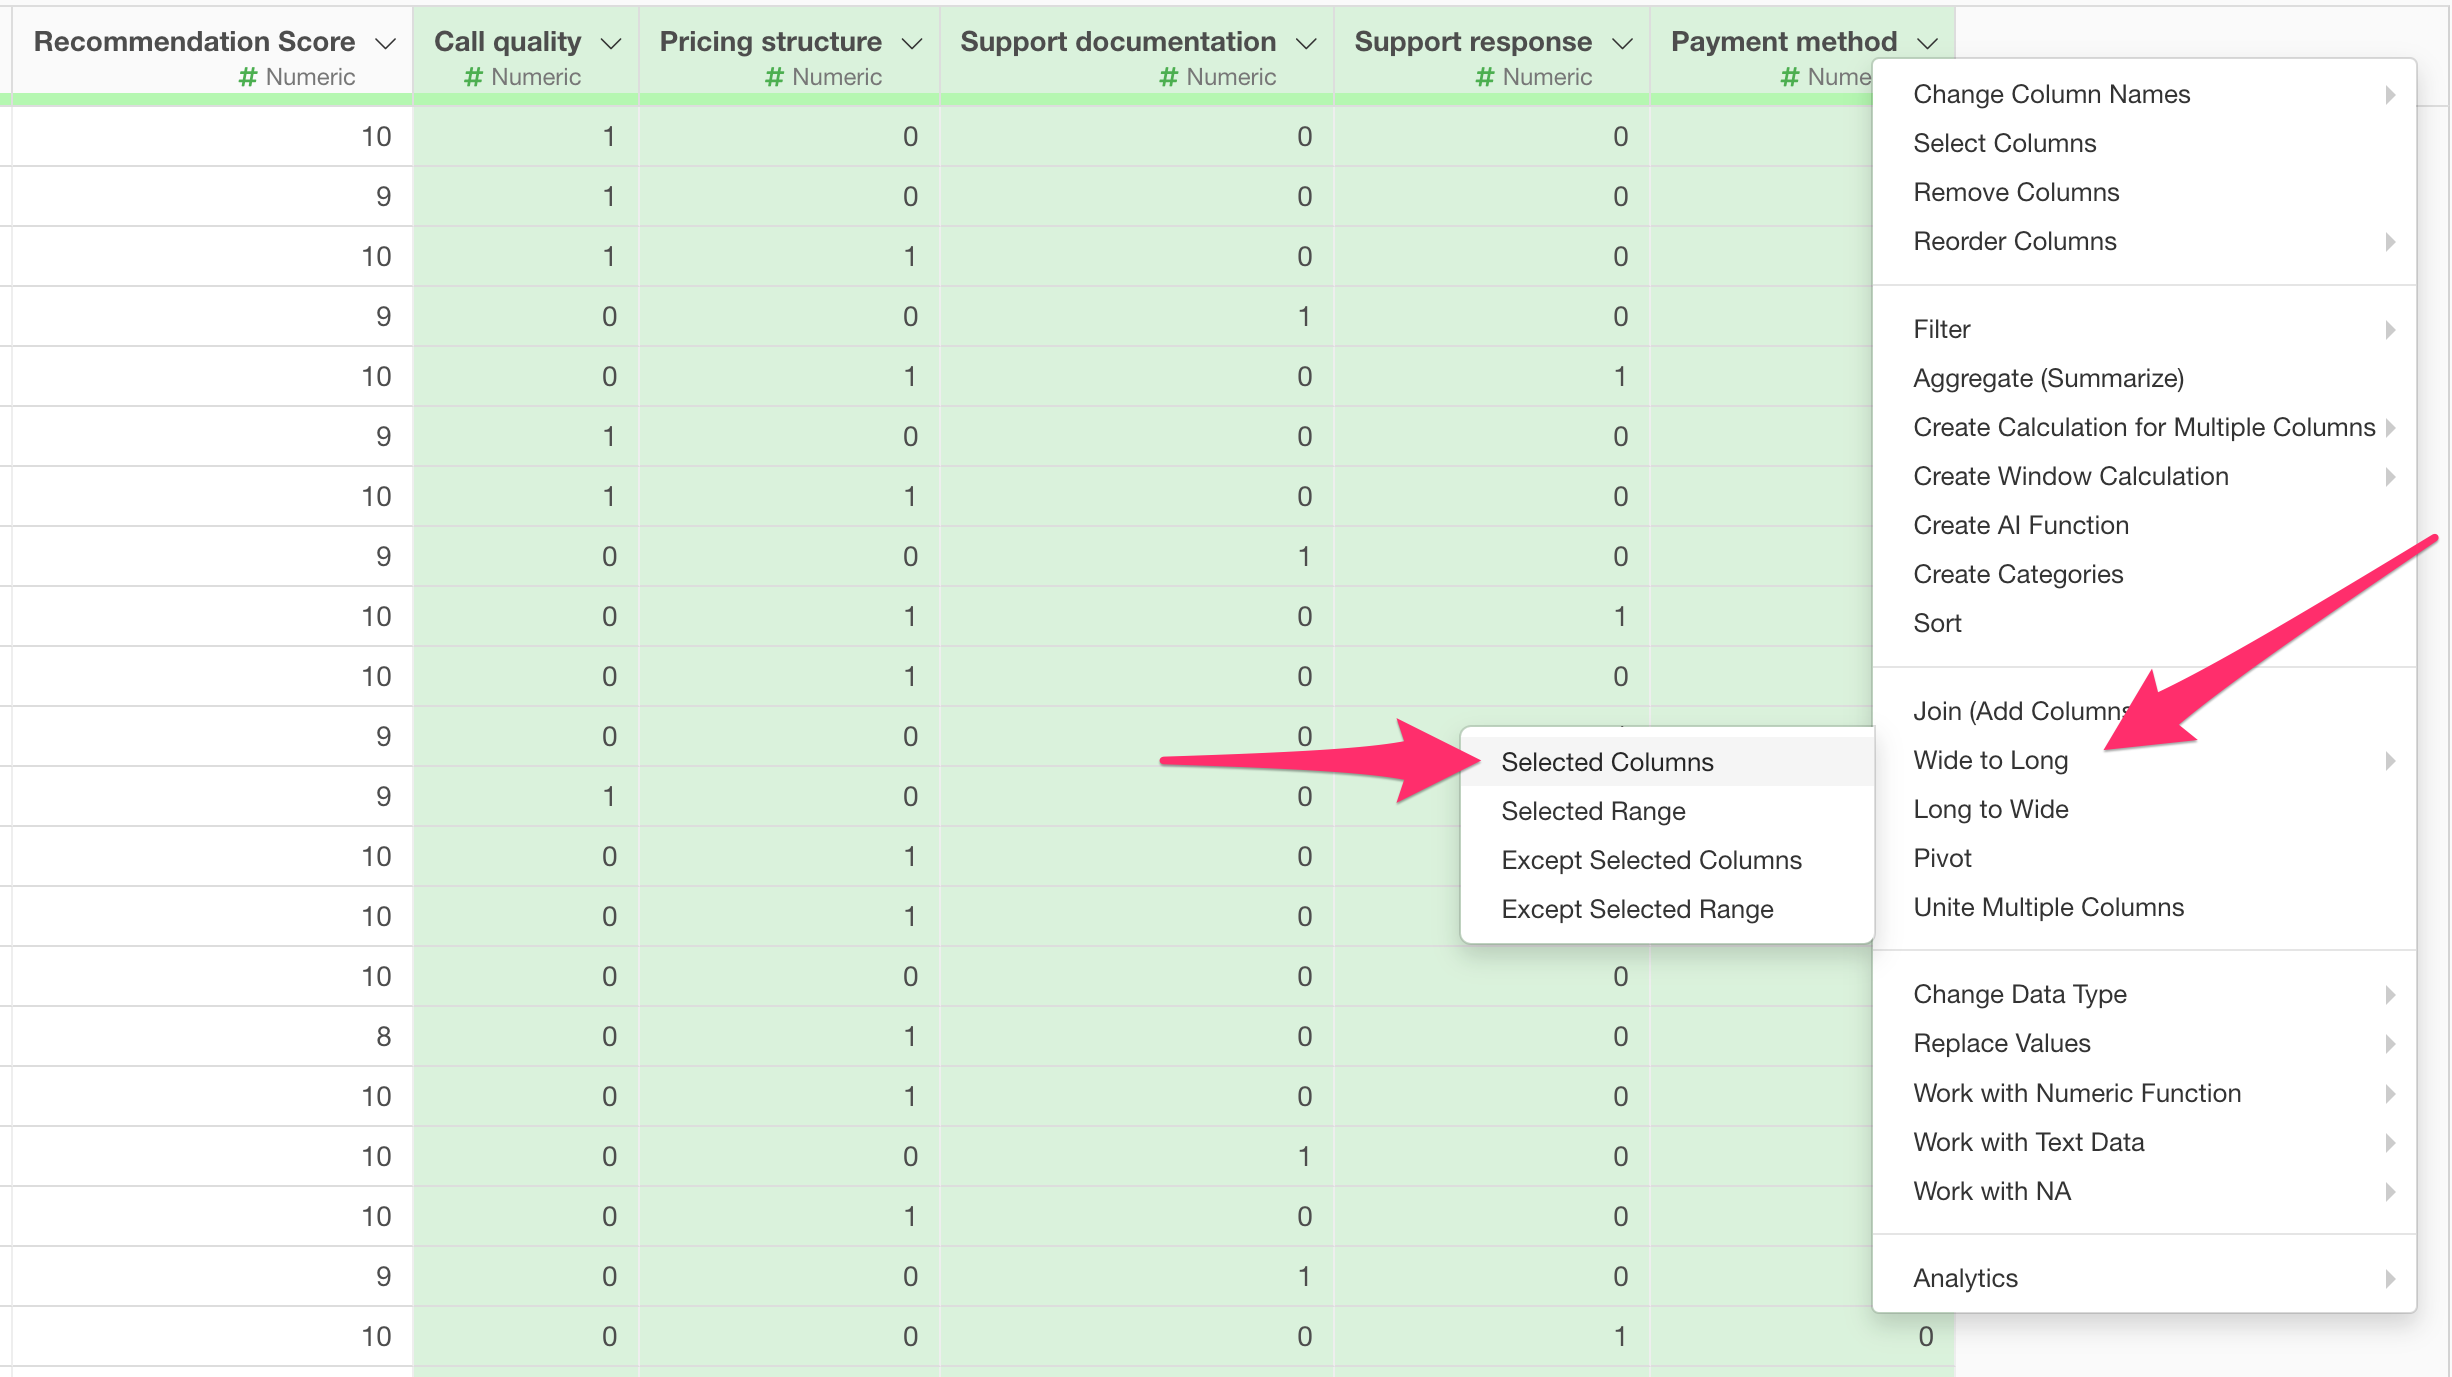
If you have data like this, select the target response columns and choose “Wide to Long” and then “Selected Columns” from any of the column header menus.
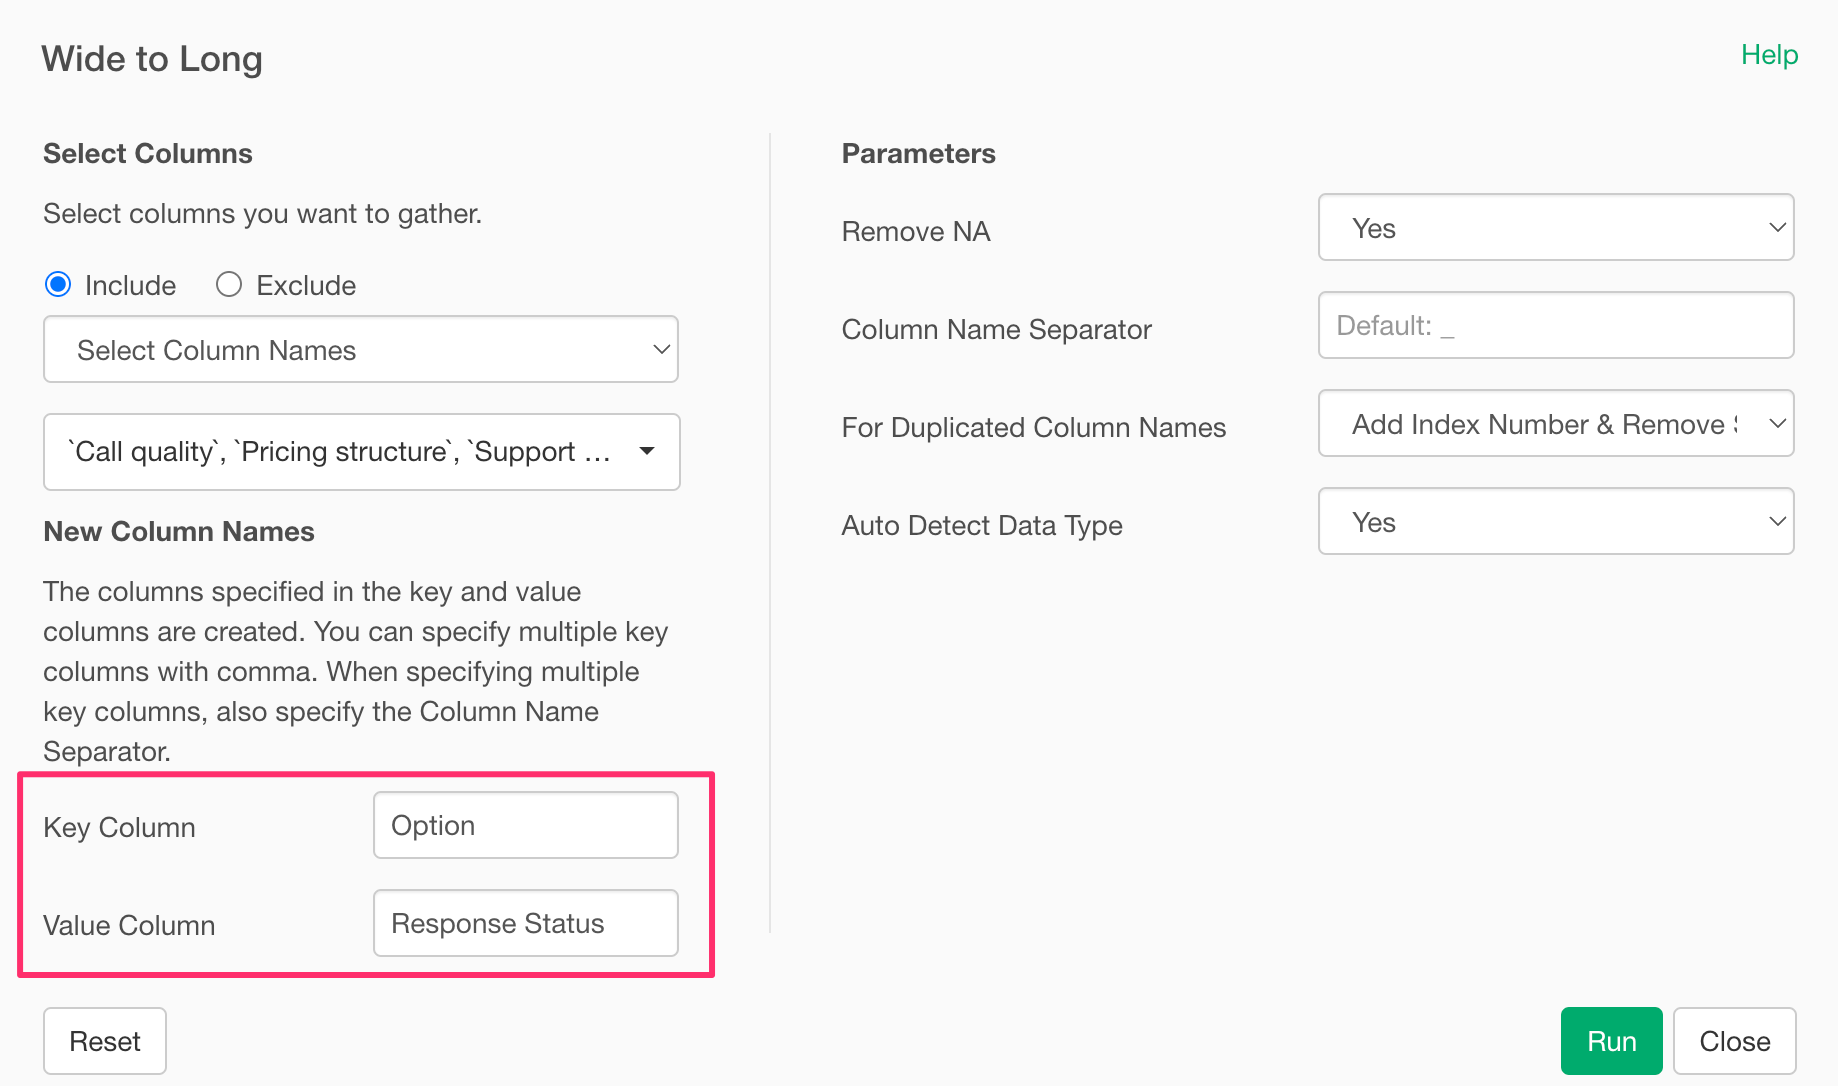
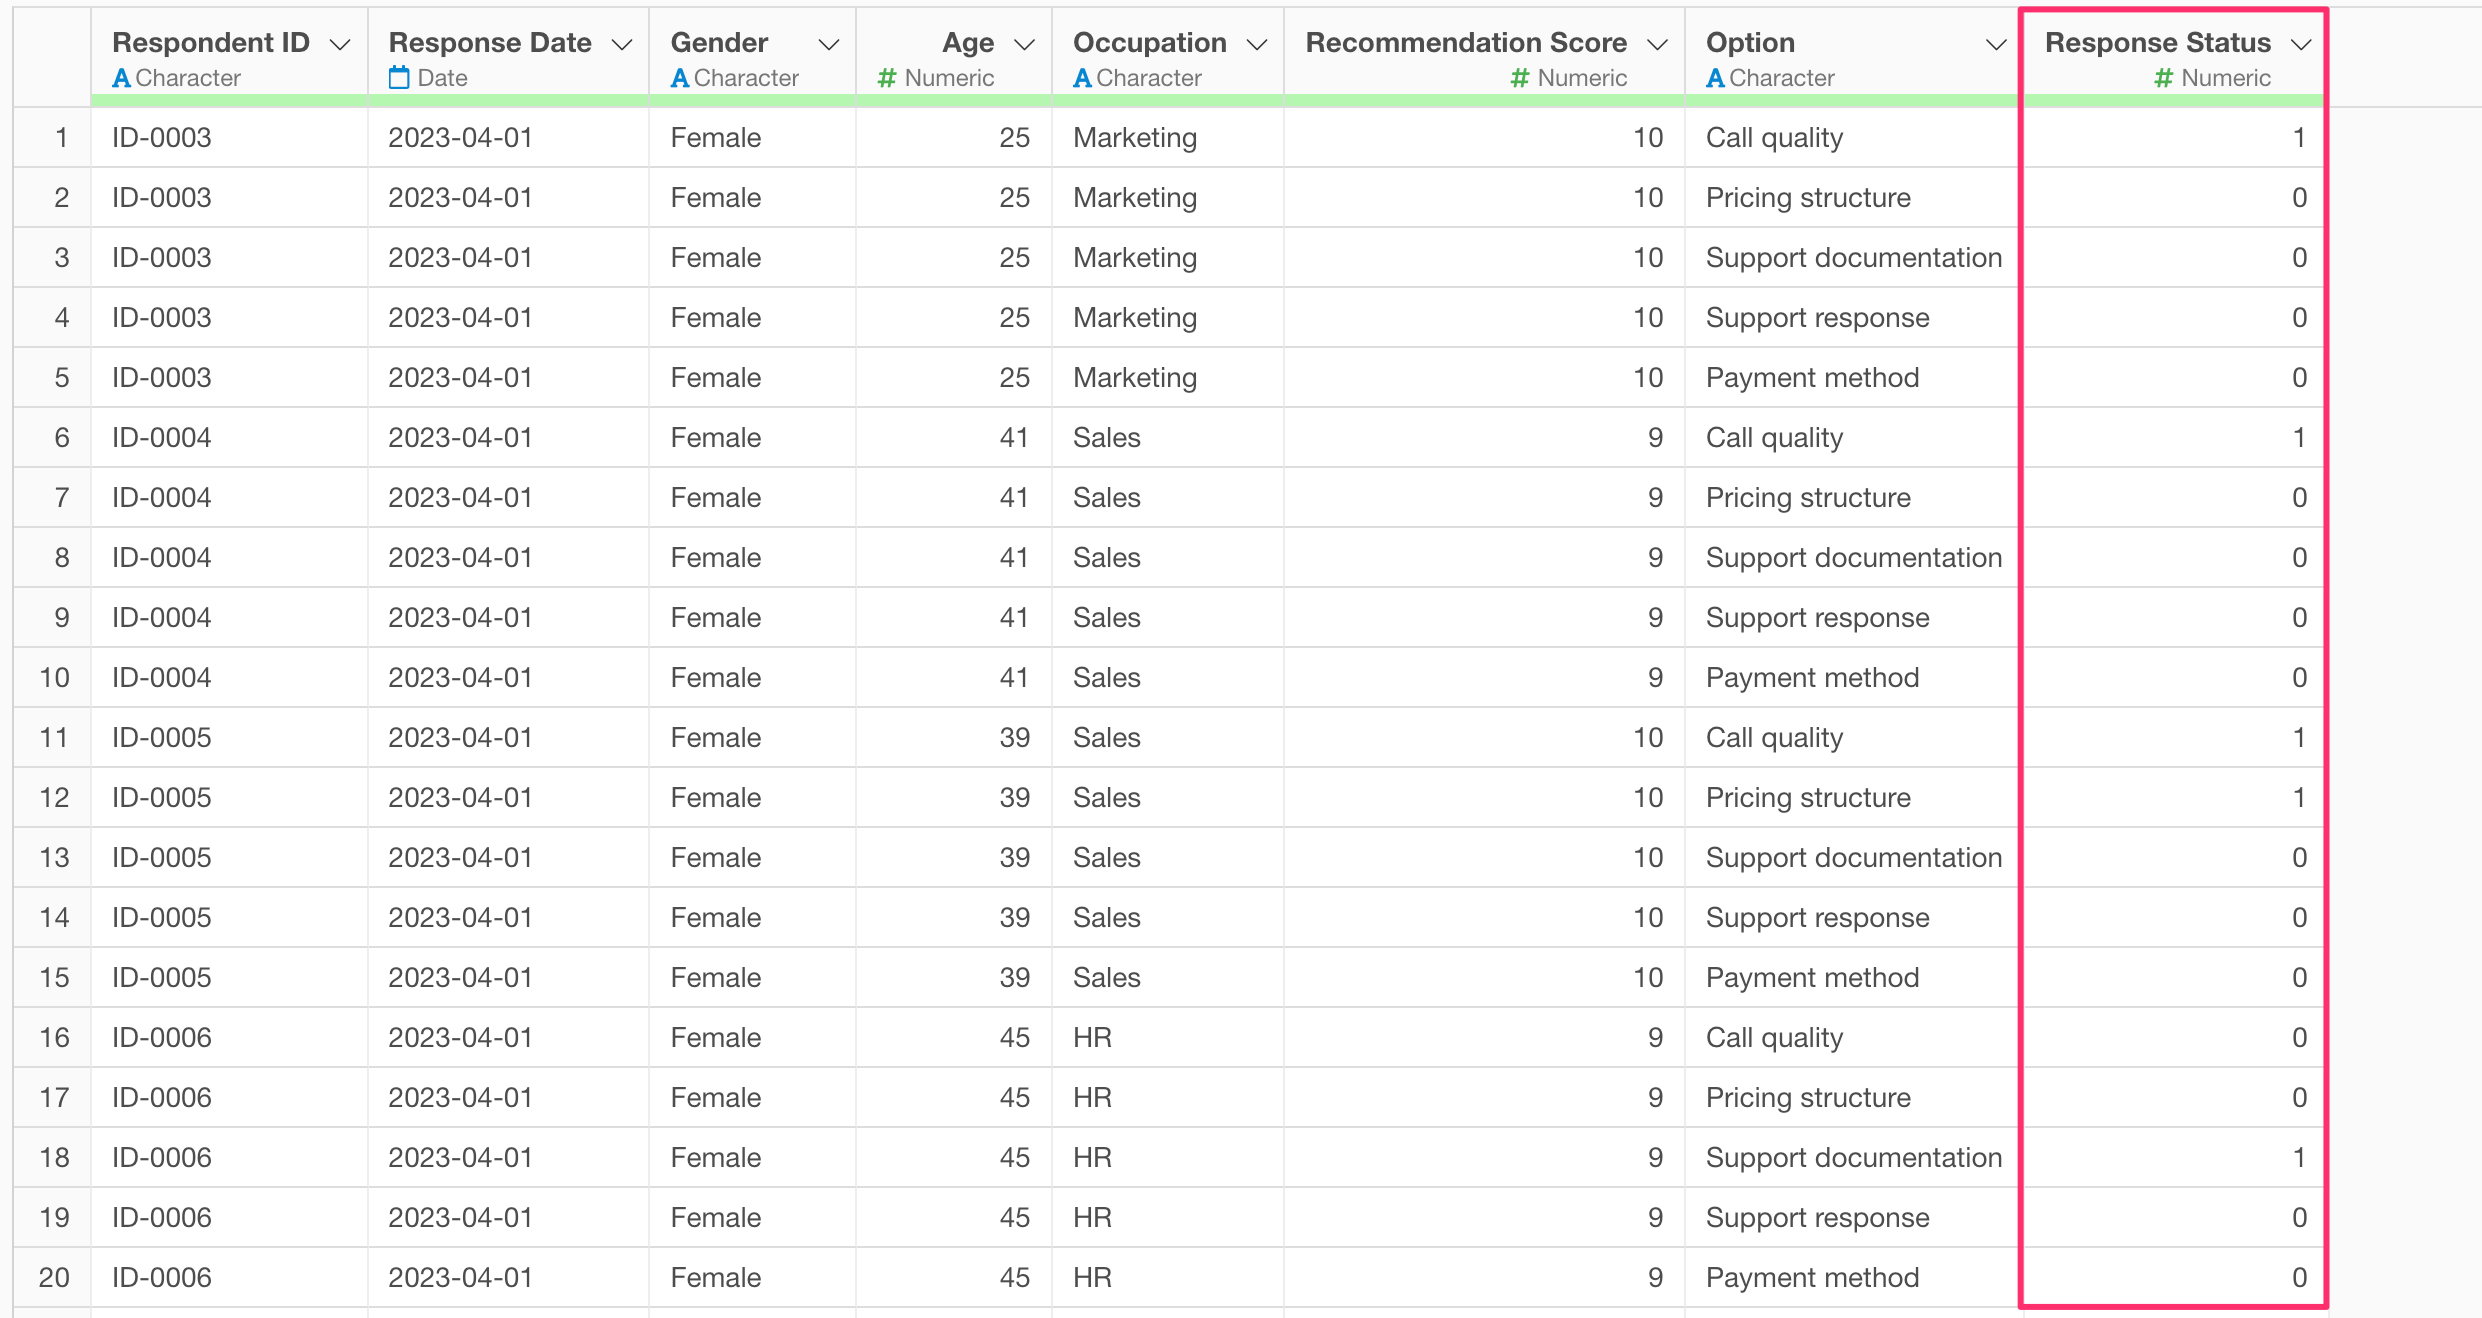
When the “Wide to Long” dialog opens, enter “Option” for the Key column and “Response Status” for the Value column, then click Run.
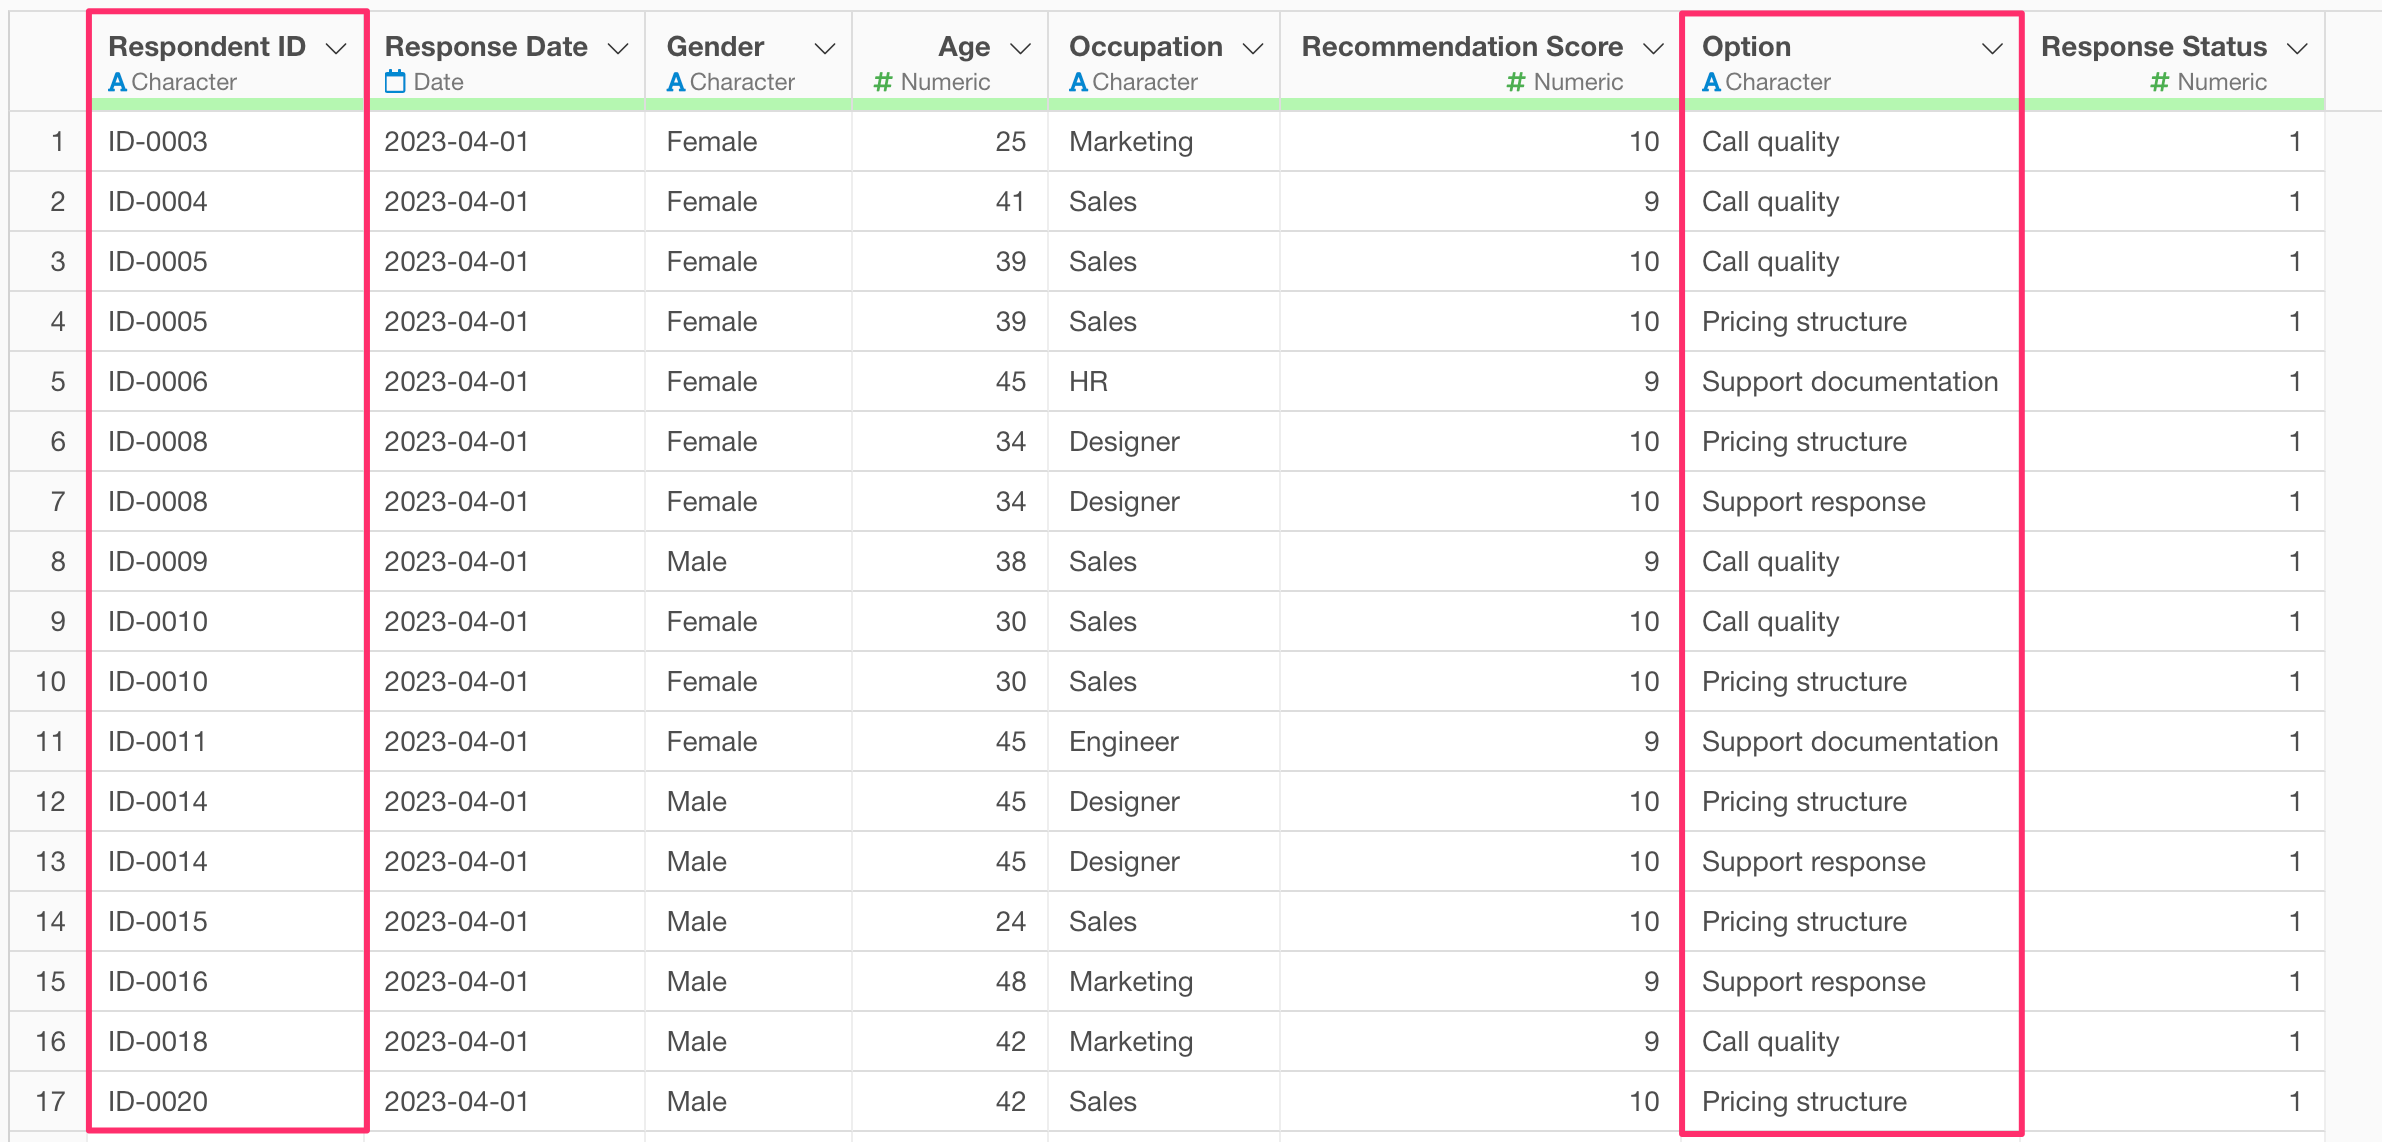
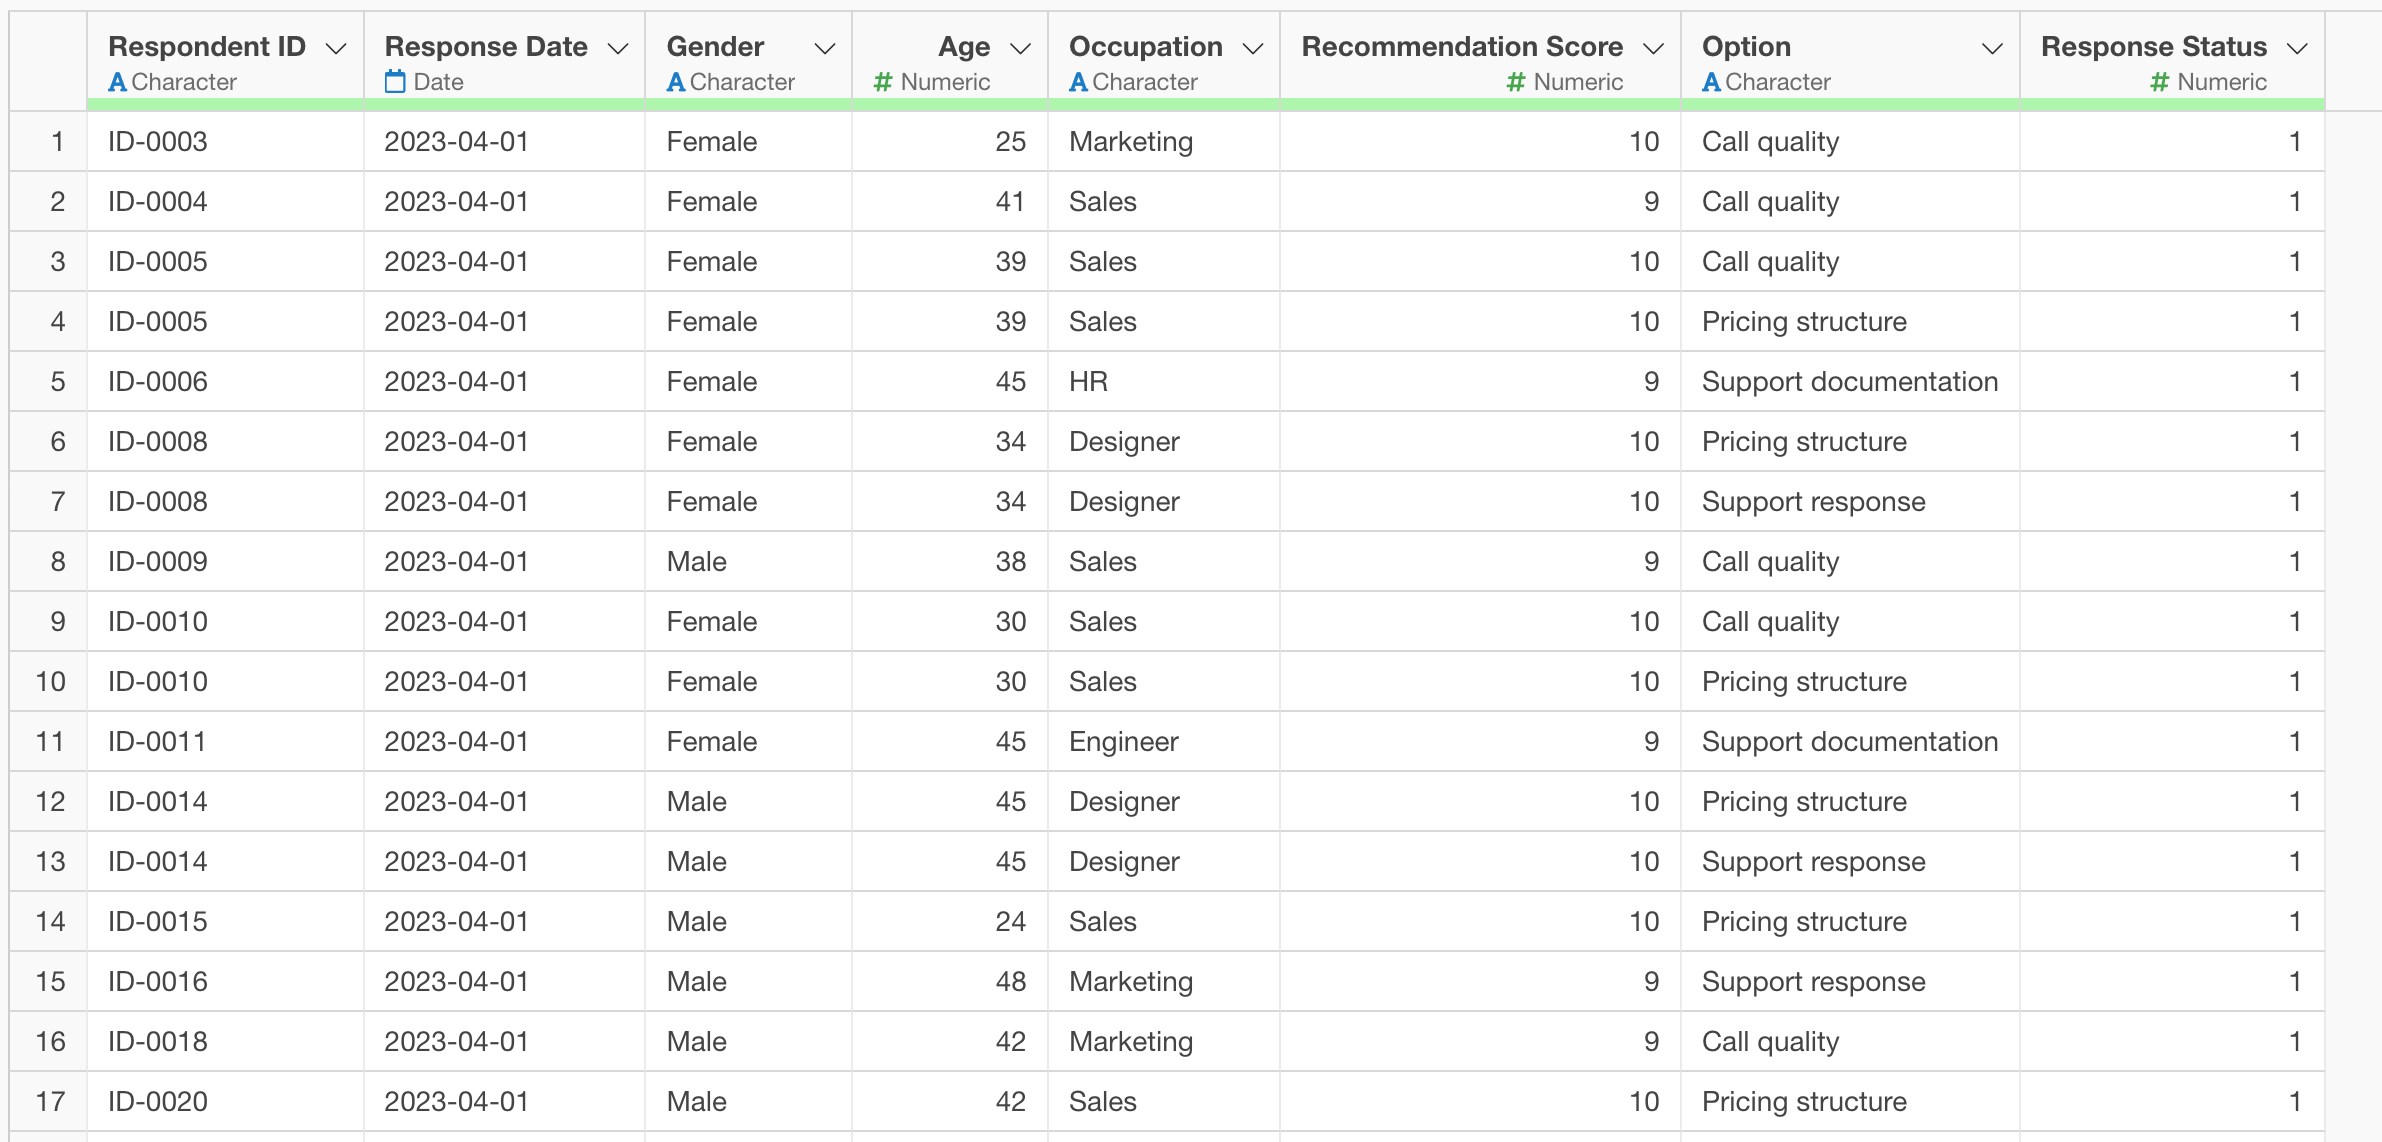
Now the data has been converted so that one row represents the response status for a single option.
However, in the current data, each row represents a response status (including zeros), and it does not yet represent only the data that the respondent actually selected.
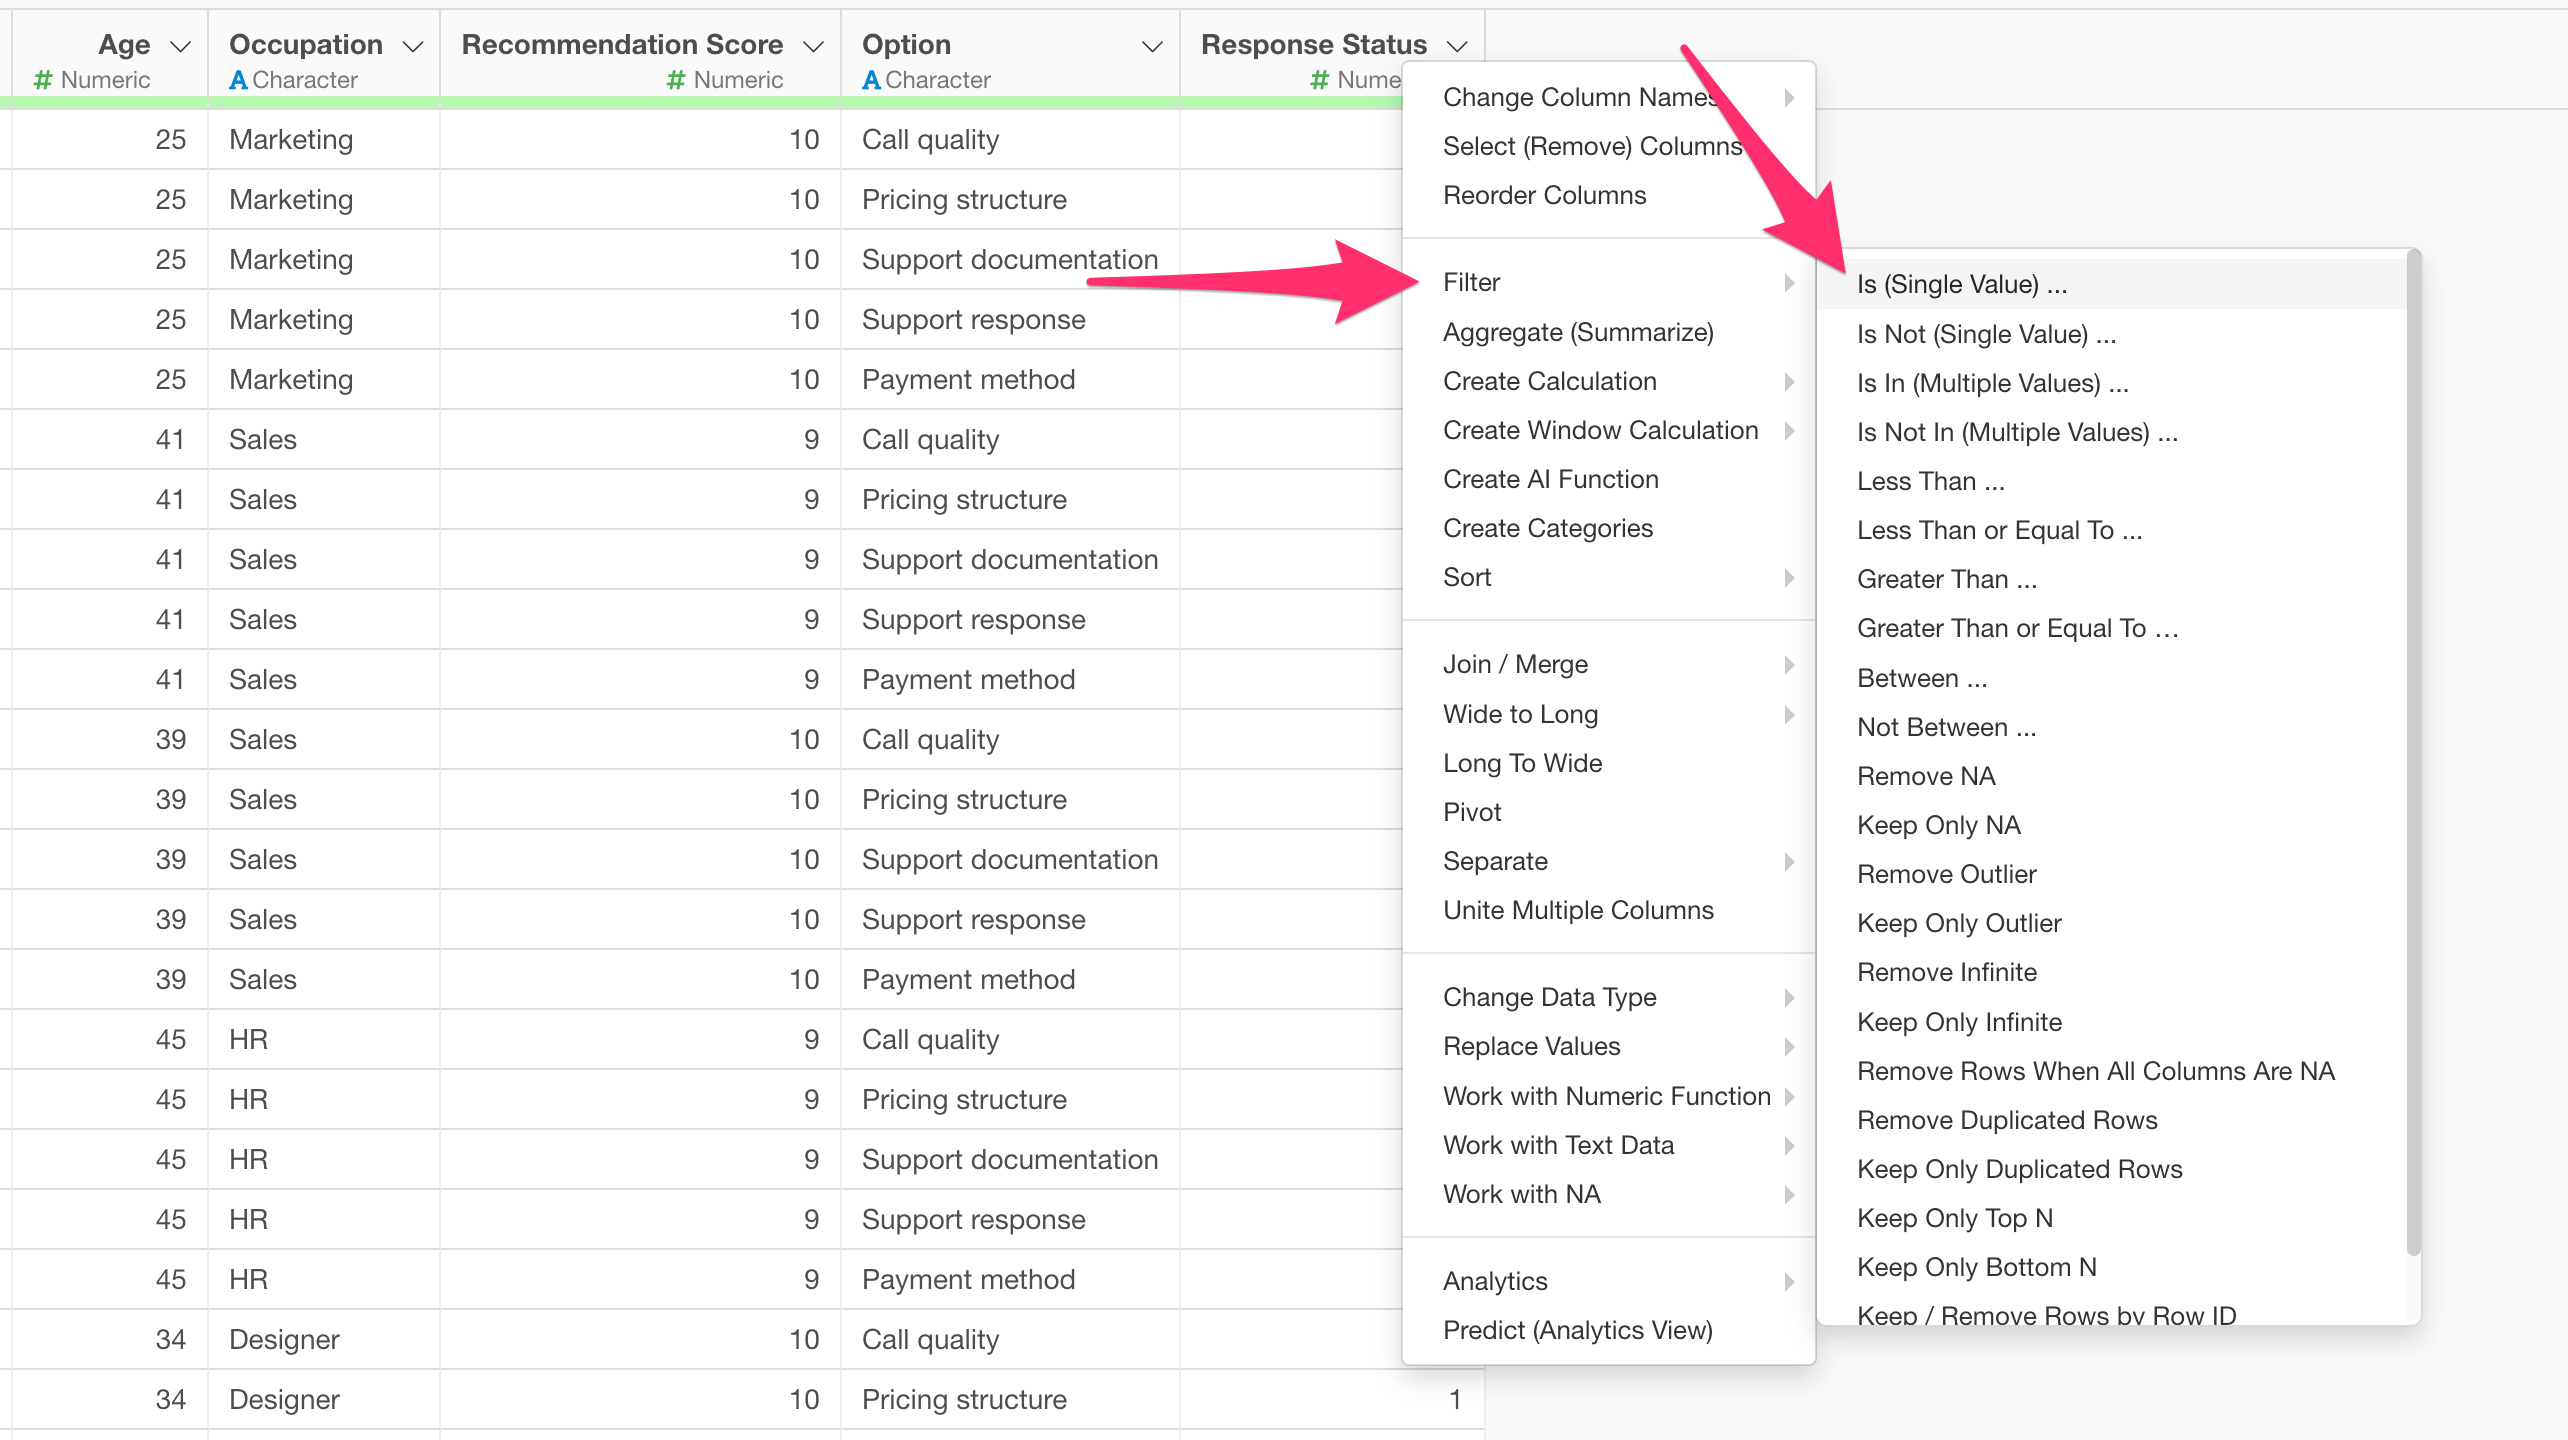
Therefore, filter the data to include only those where the “Response Status” value is “1” to convert it into data where one row represents one answer from one person.
From the column header menu of the “Response Status” column, select “Filter” and then “Is (Single Value)”
Enter “1” as the value and click Run.
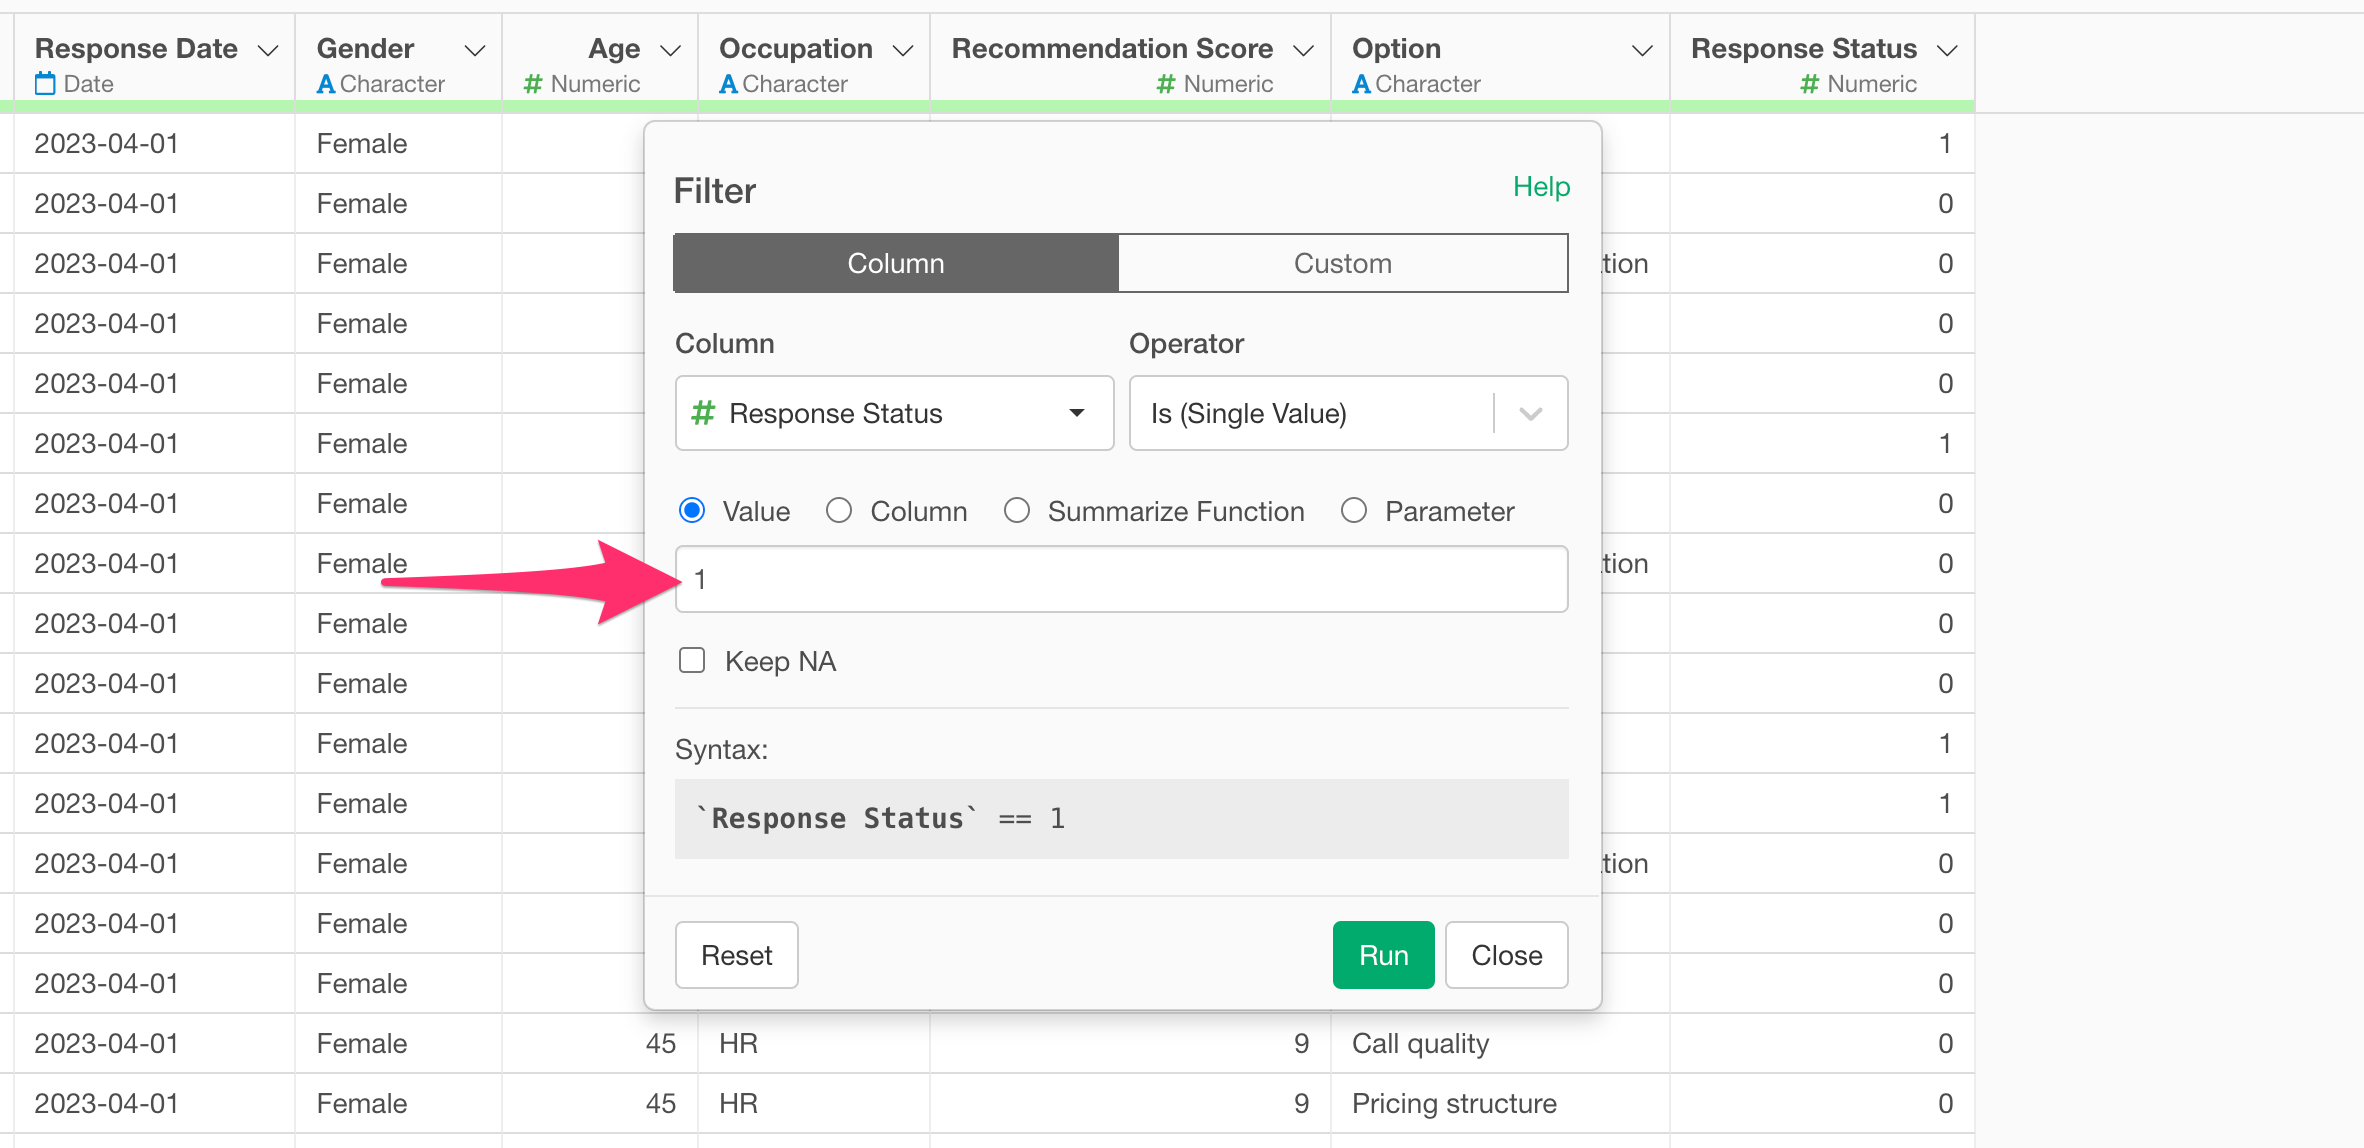
Now, each answer is expanded into a single row, converting the data into a format suitable for Market Basket Analysis.
In the converted data, you can perform Market Basket Analysis by specifying “Respondent ID” as the Basket and “Option” as the Item information.