How to Create Waterfall Chart with 'waterfalls' package
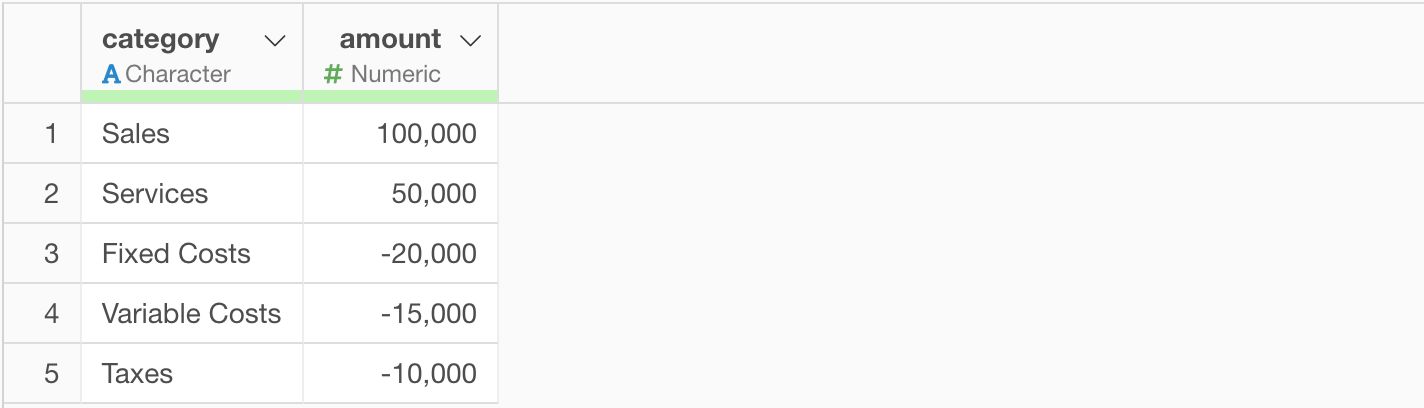
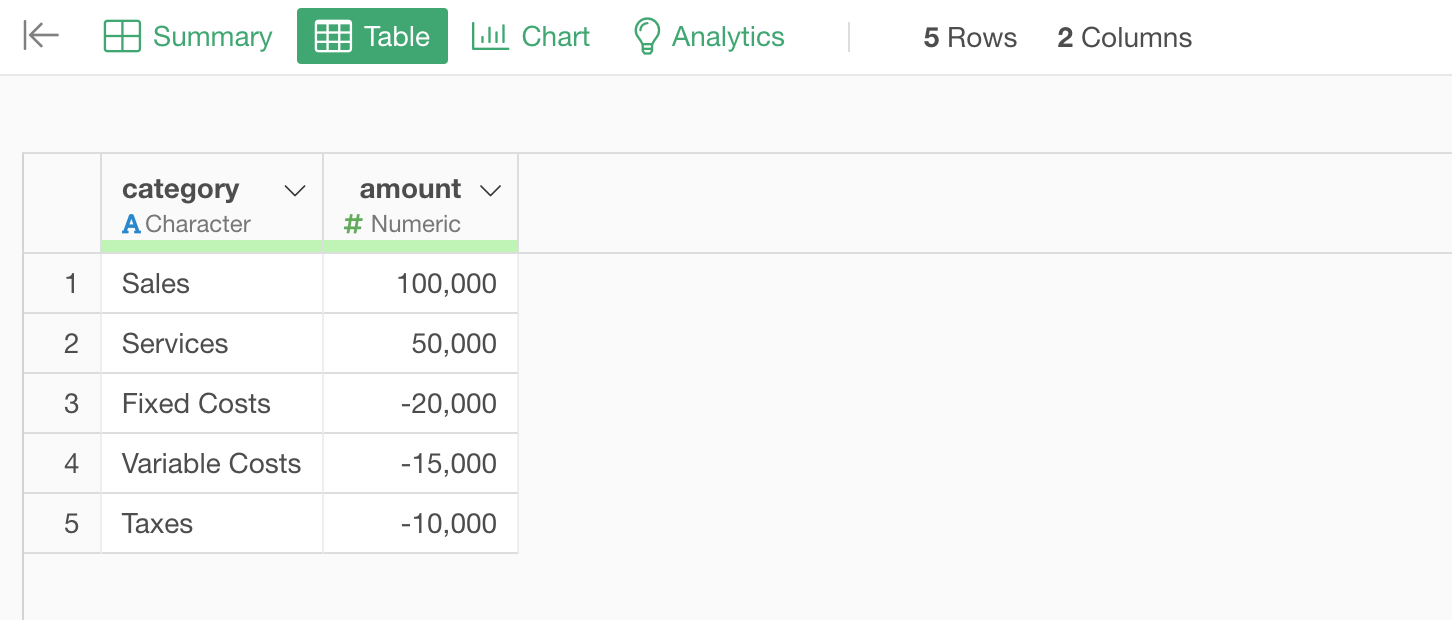
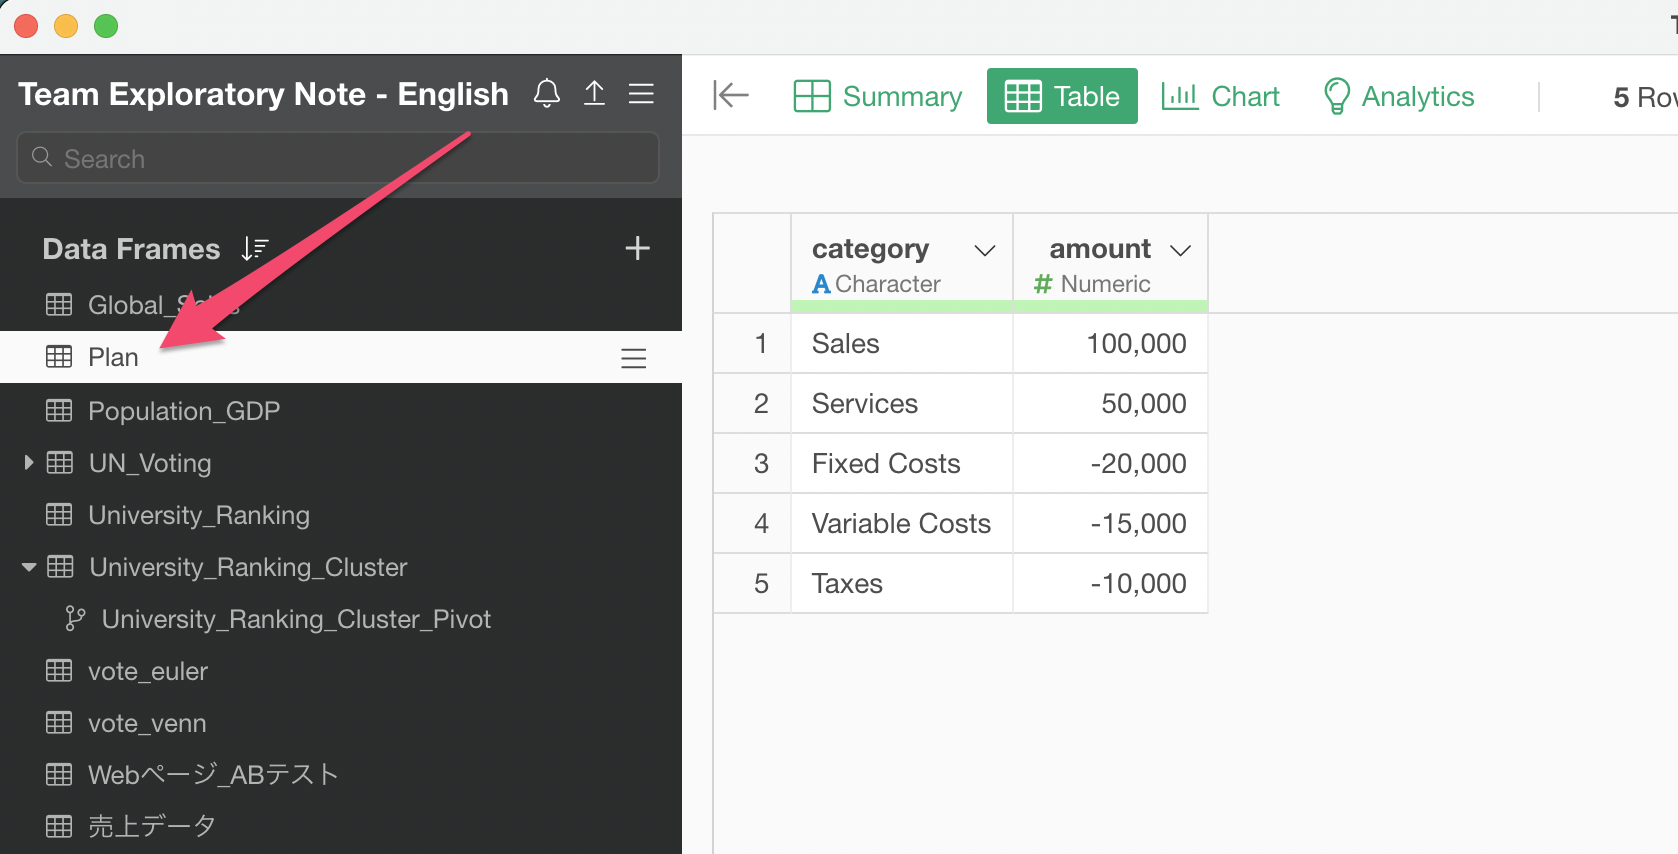
Let's say we have data like below.
Now, how can we visualize these numbers in a way that we can follow how the total money we have in our hands move at each step?
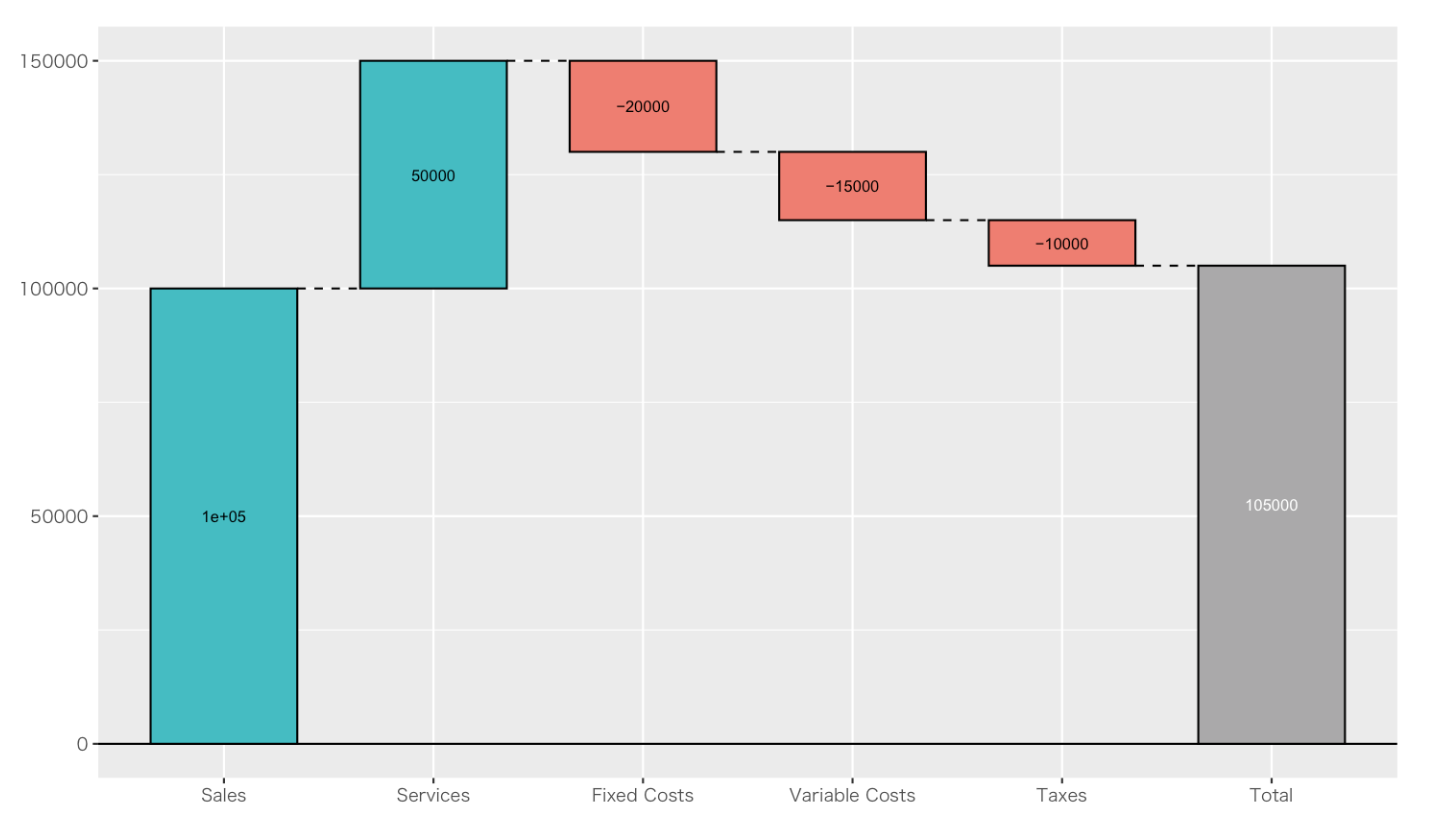
One common way is to use Waterfall chart like below.
As you can see, from the left to the right, each step shows how the total money is changed by the added or the subtracted value at each of the step.
Waterfall chart is not supported out of the box in Exploratory. However, you can use a R package called 'waterfalls' to create Waterfall charts in Note or Dashboard.
Here's how.
Data
We'll use a sample data like the below. You can download it from our data catalog.
1. Install 'waterfall' package
There is a R package called 'waterfalls'.
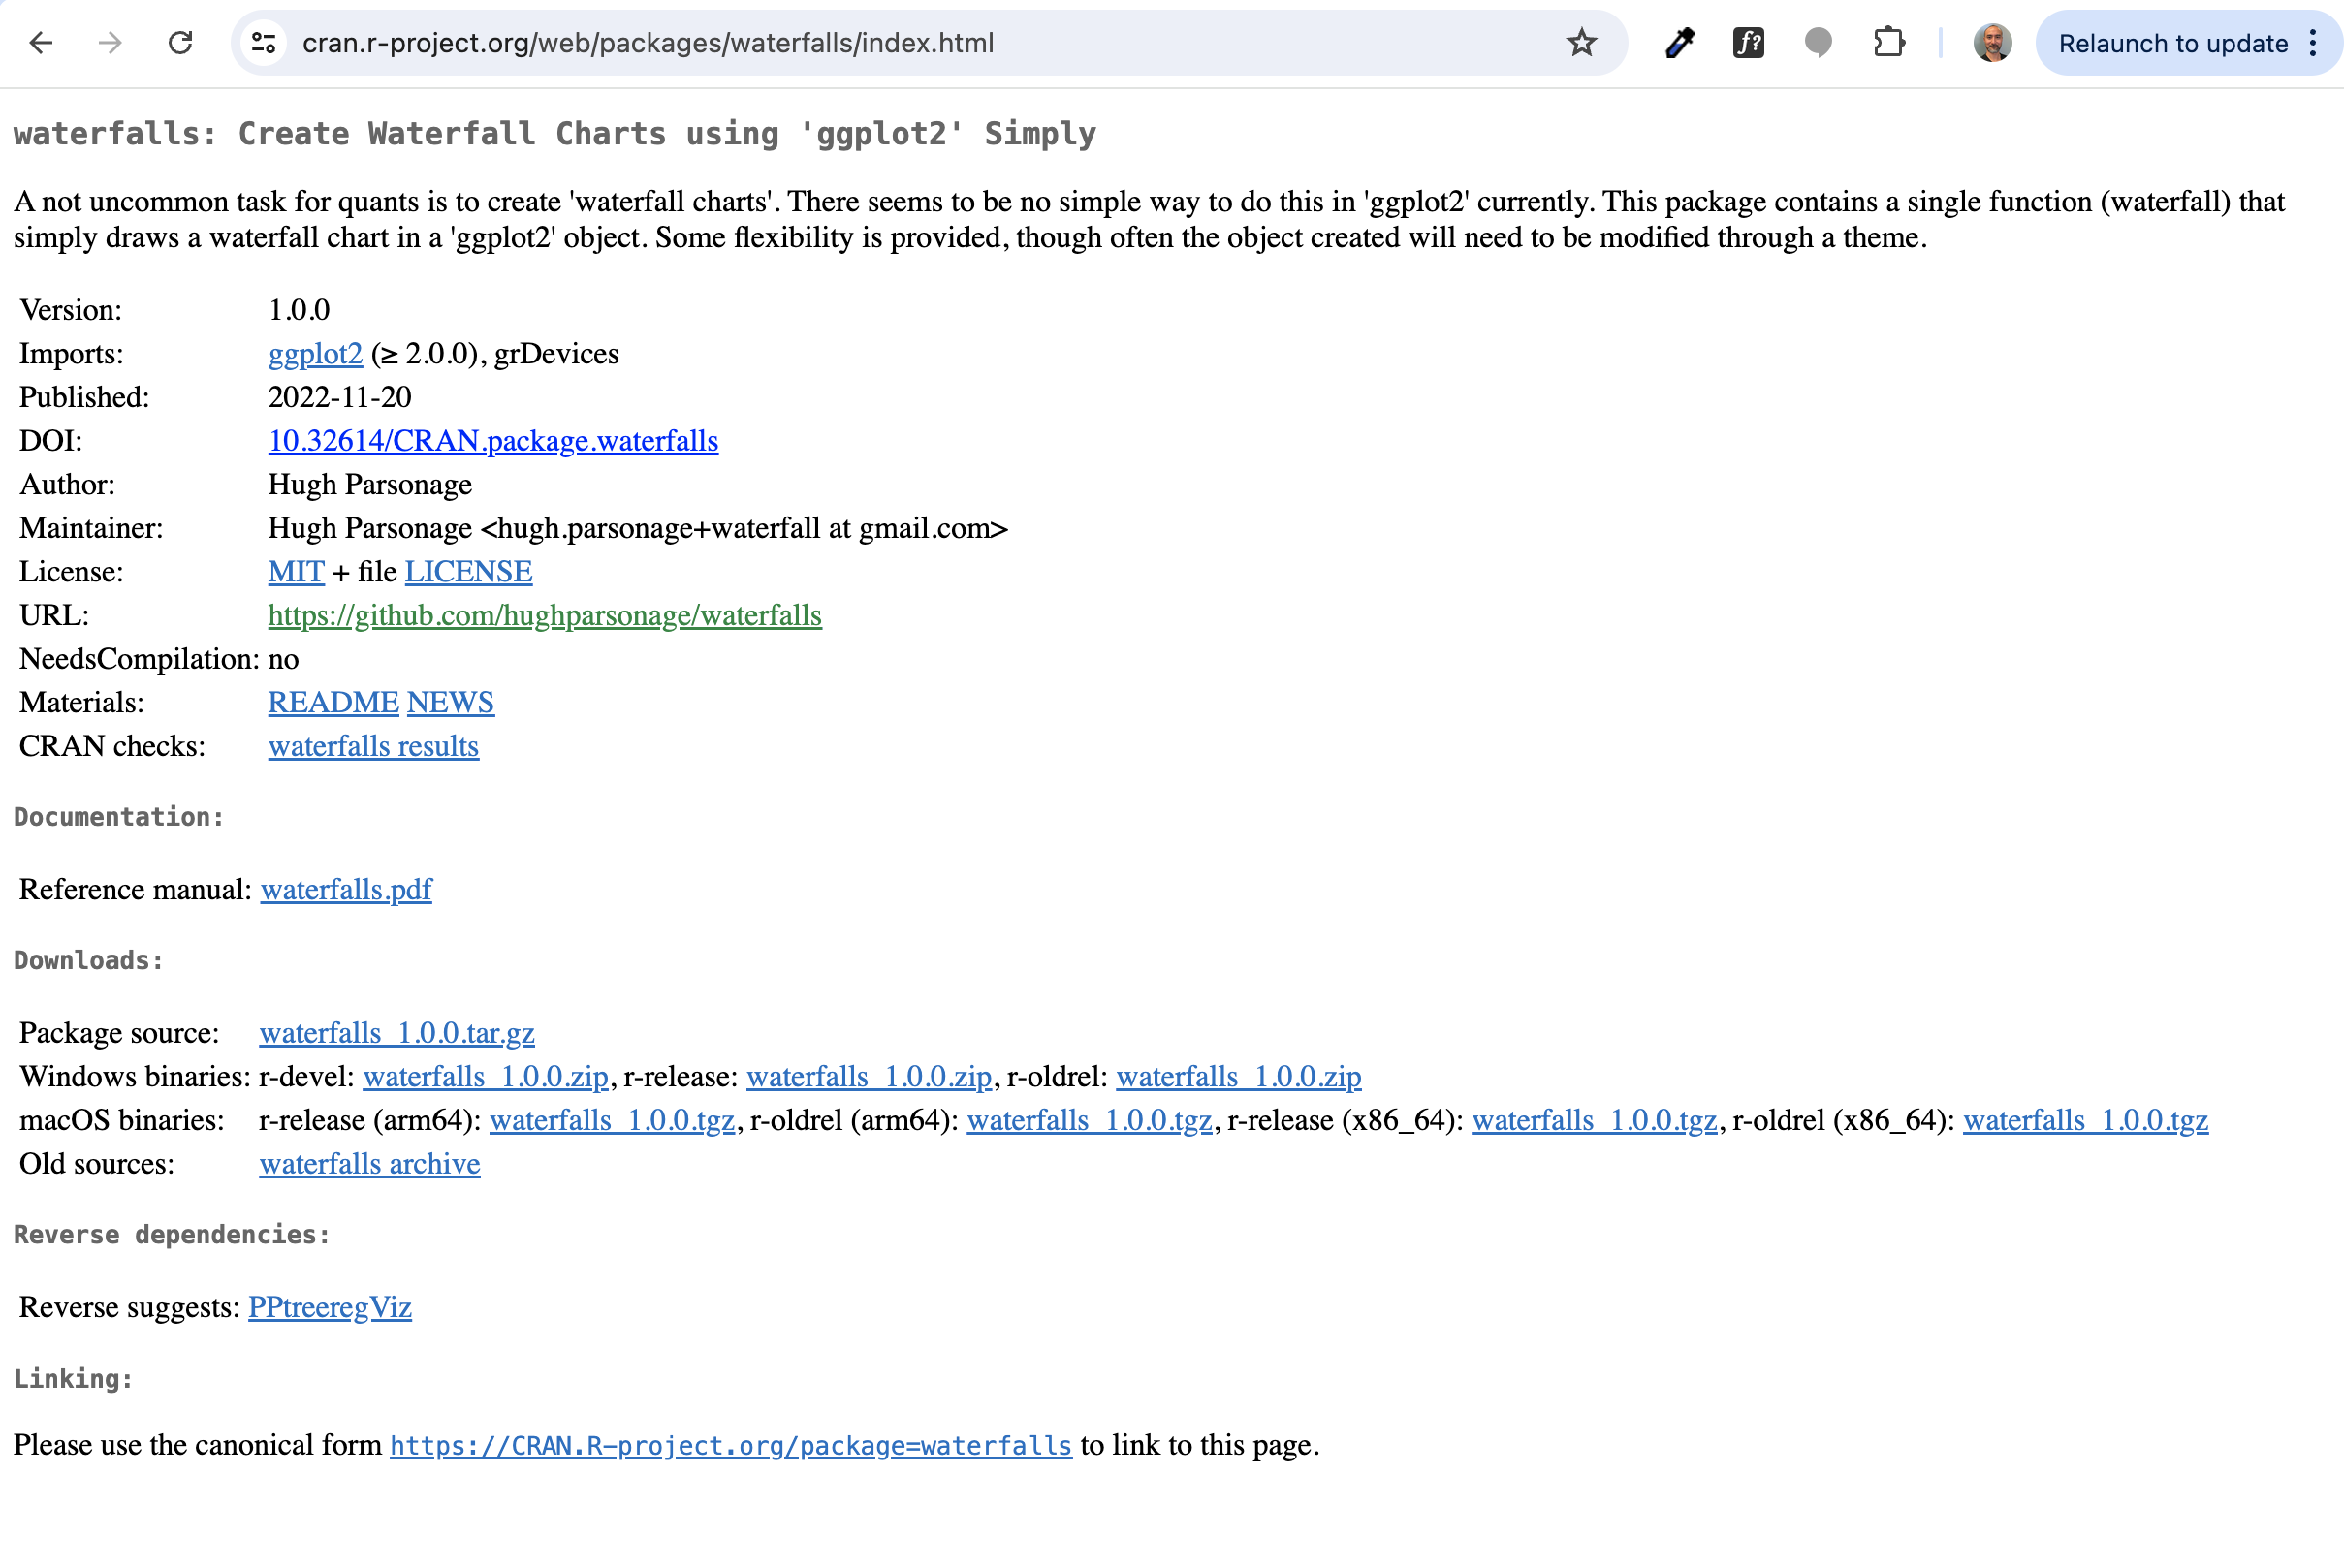
You want to install this package into Exploratory.
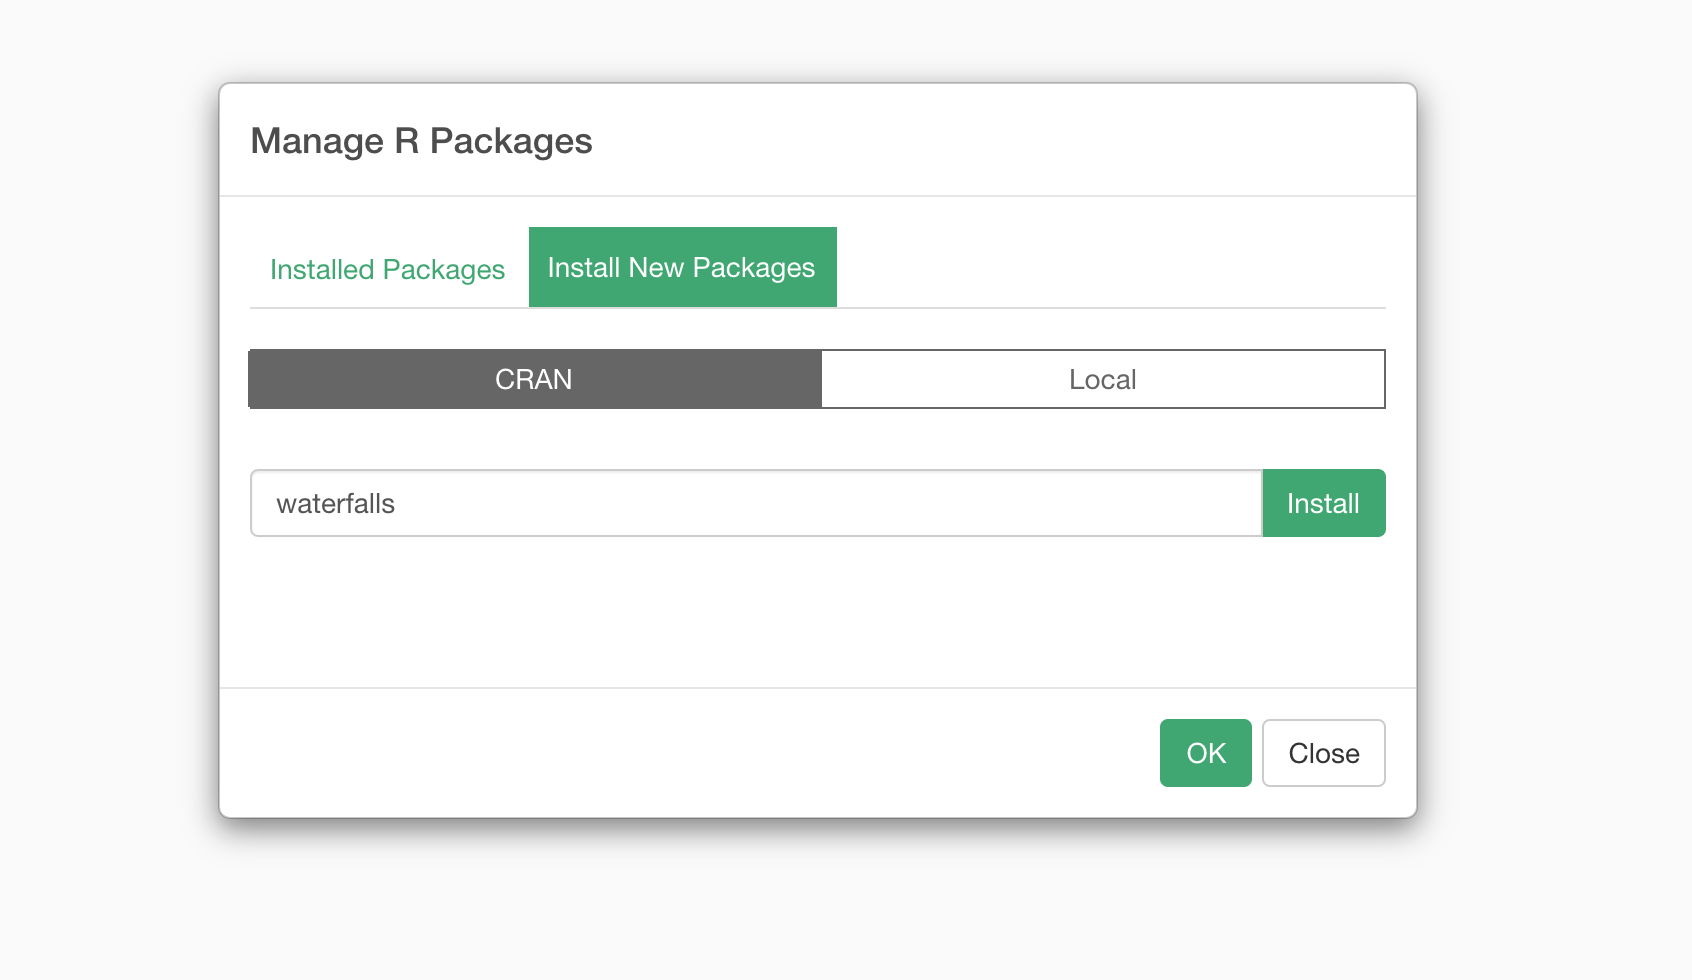
Take a look at this note for more details on how to install R package.
2. Create Waterfall Chart in Note
Select 'R Script' from the Plus menu to insert the R Script block.
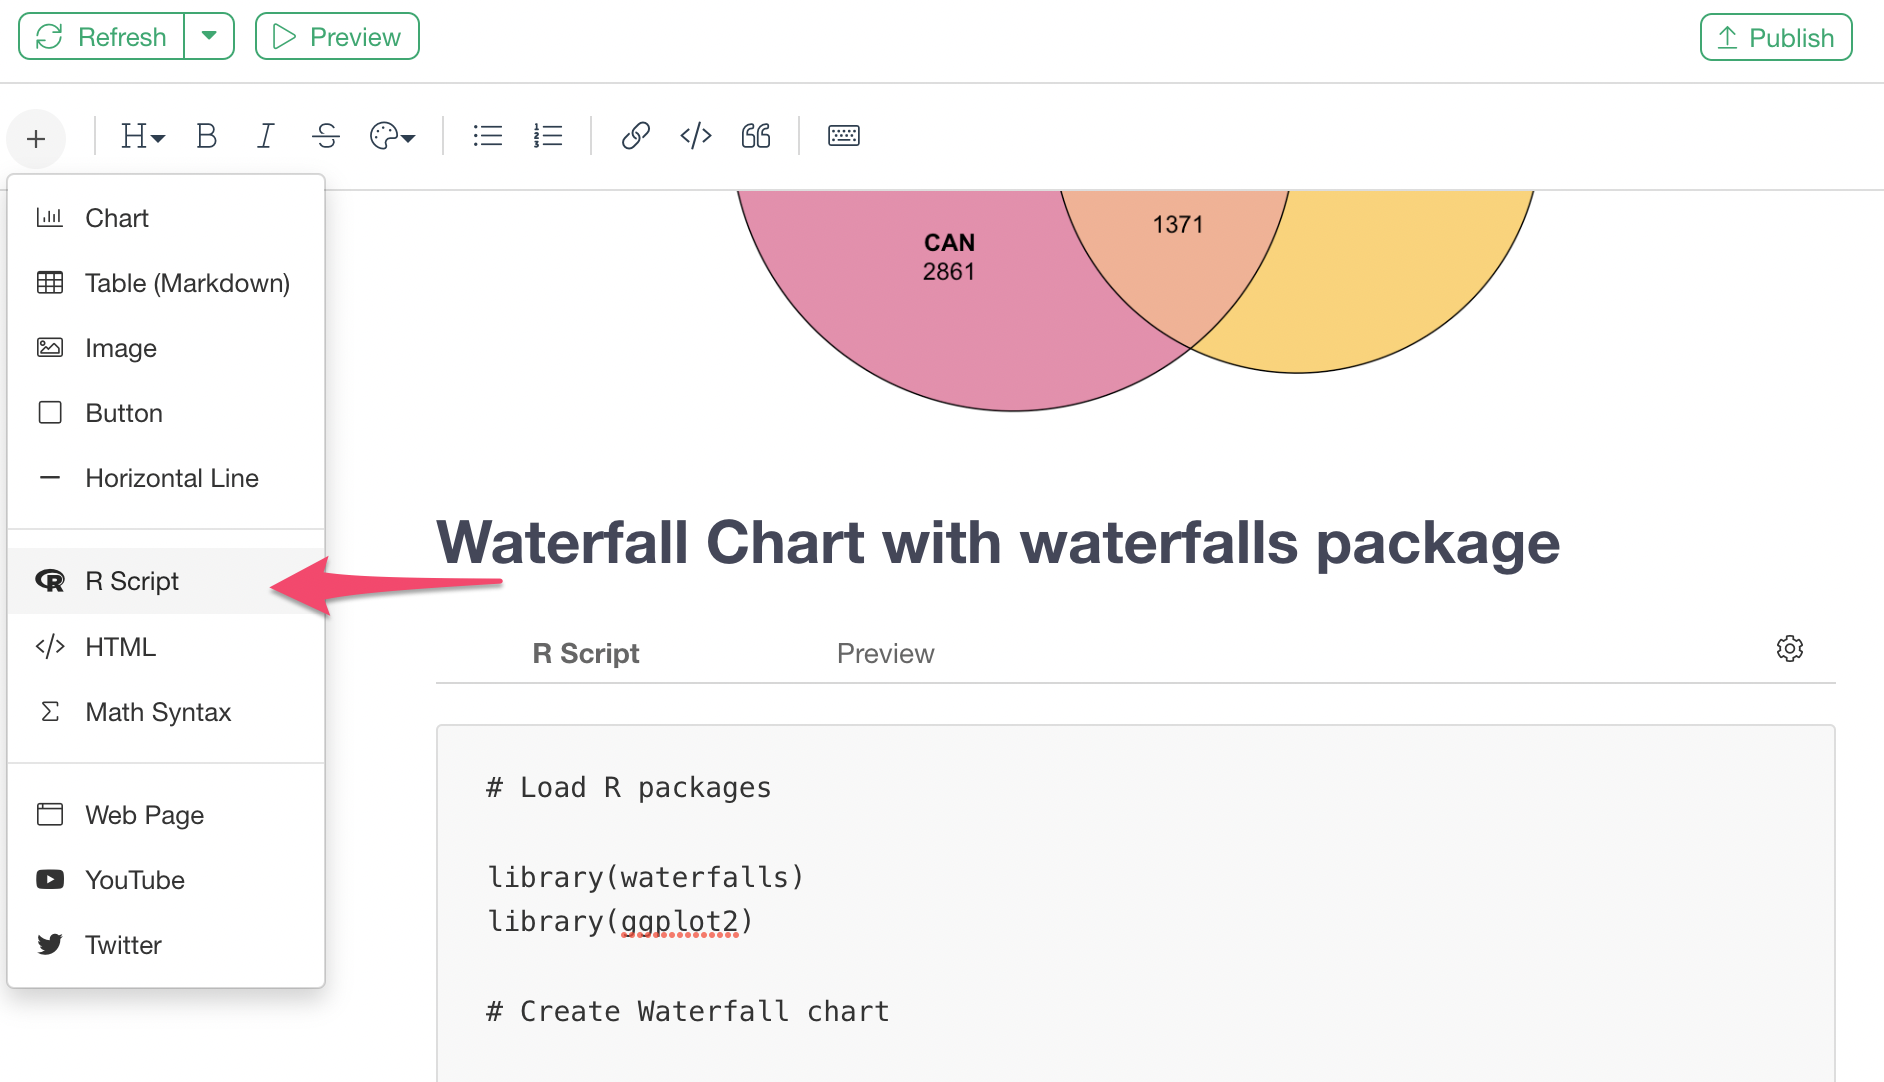
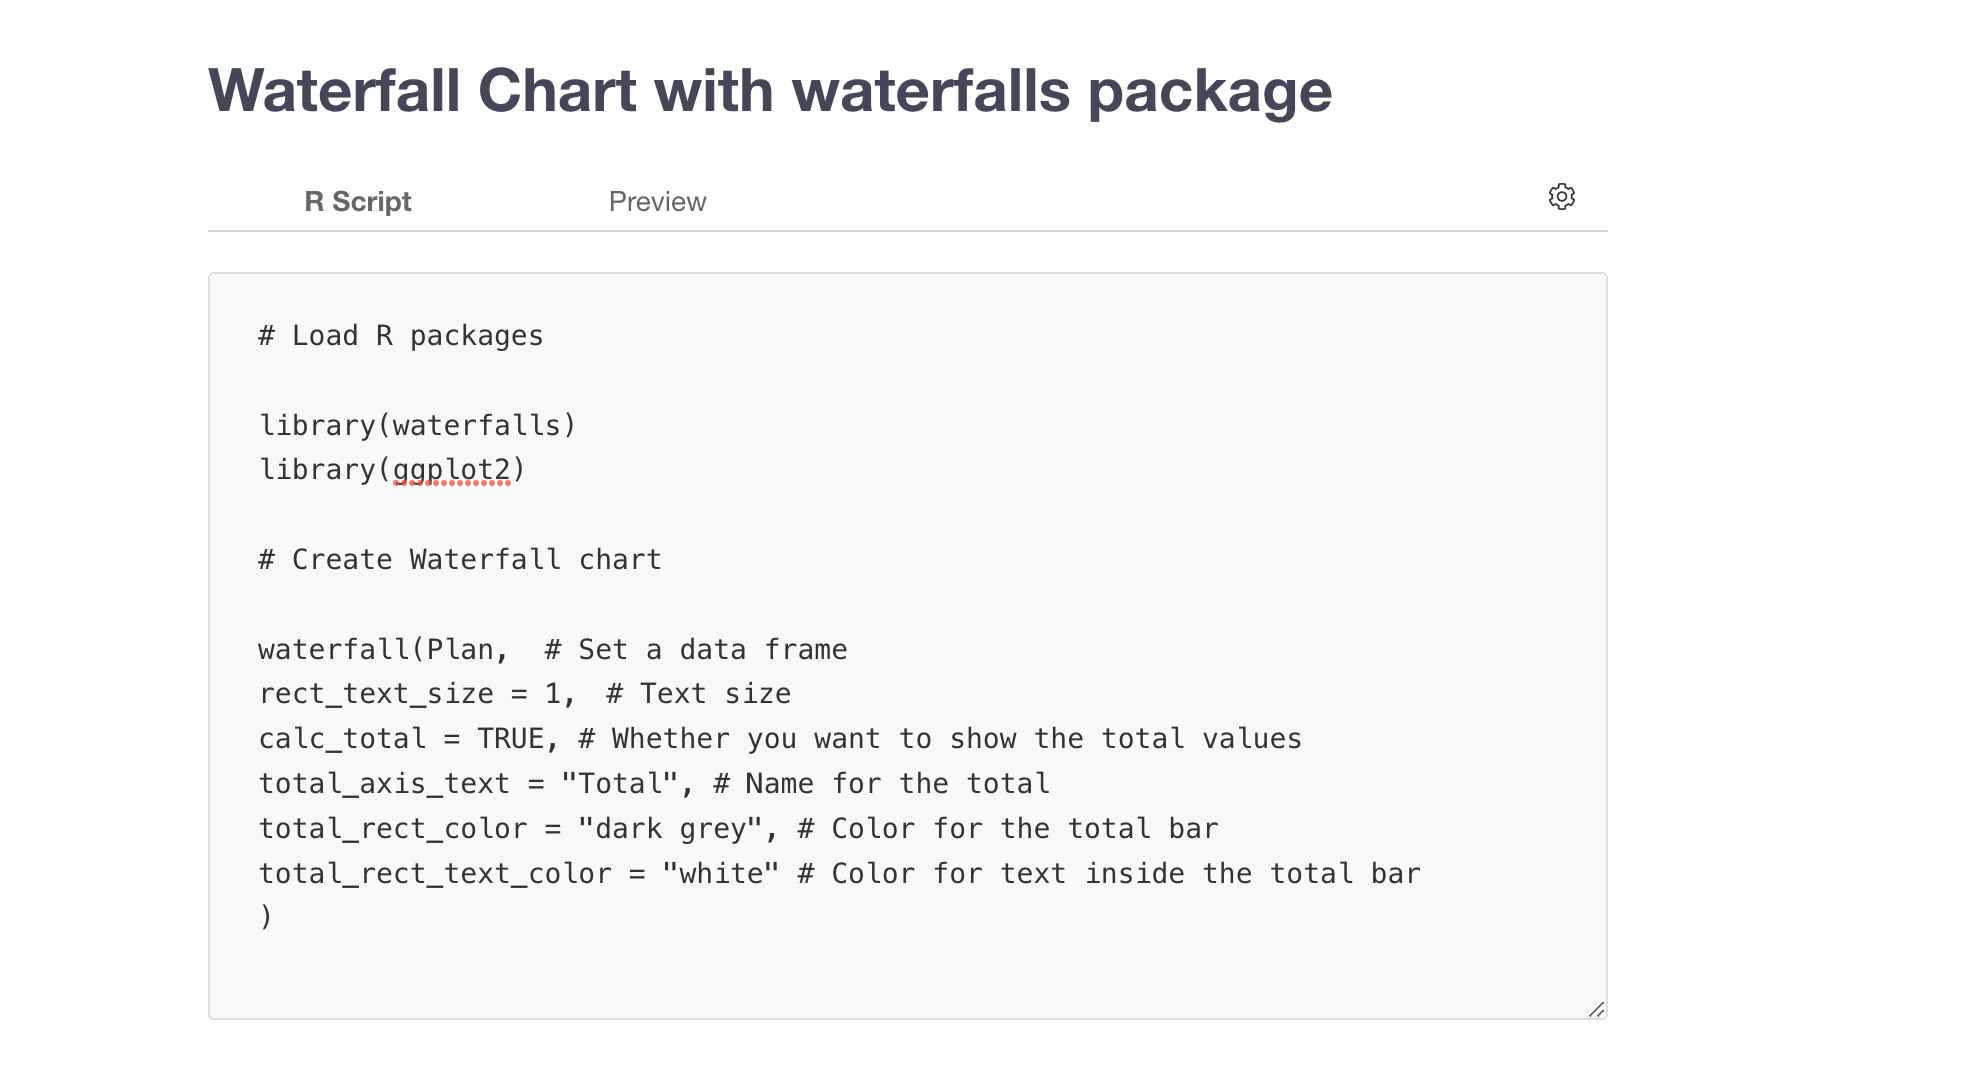
And you want to type in something like the below.
# Load R packages

library(waterfalls)
library(ggplot2)

# Create Waterfall chart

waterfall(Plan,  # Set a data frame
rect_text_size = 1, # Text size
calc_total = TRUE, # Whether you want to show the total values
total_axis_text = "Total", # Name for the total
total_rect_color = "dark grey", # Color for the total bar
total_rect_text_color = "white" # Color for text inside the total bar
)
And it should look like the below in your Note Editor.
The important thing is that you want to set the name of data frame as the first argument of the 'waterfall' function.
As long as you have the data that have two columns, the first column is the label text and the second column is the value, then you should be seeing a waterfall chart like below when you click on the Preview tab.

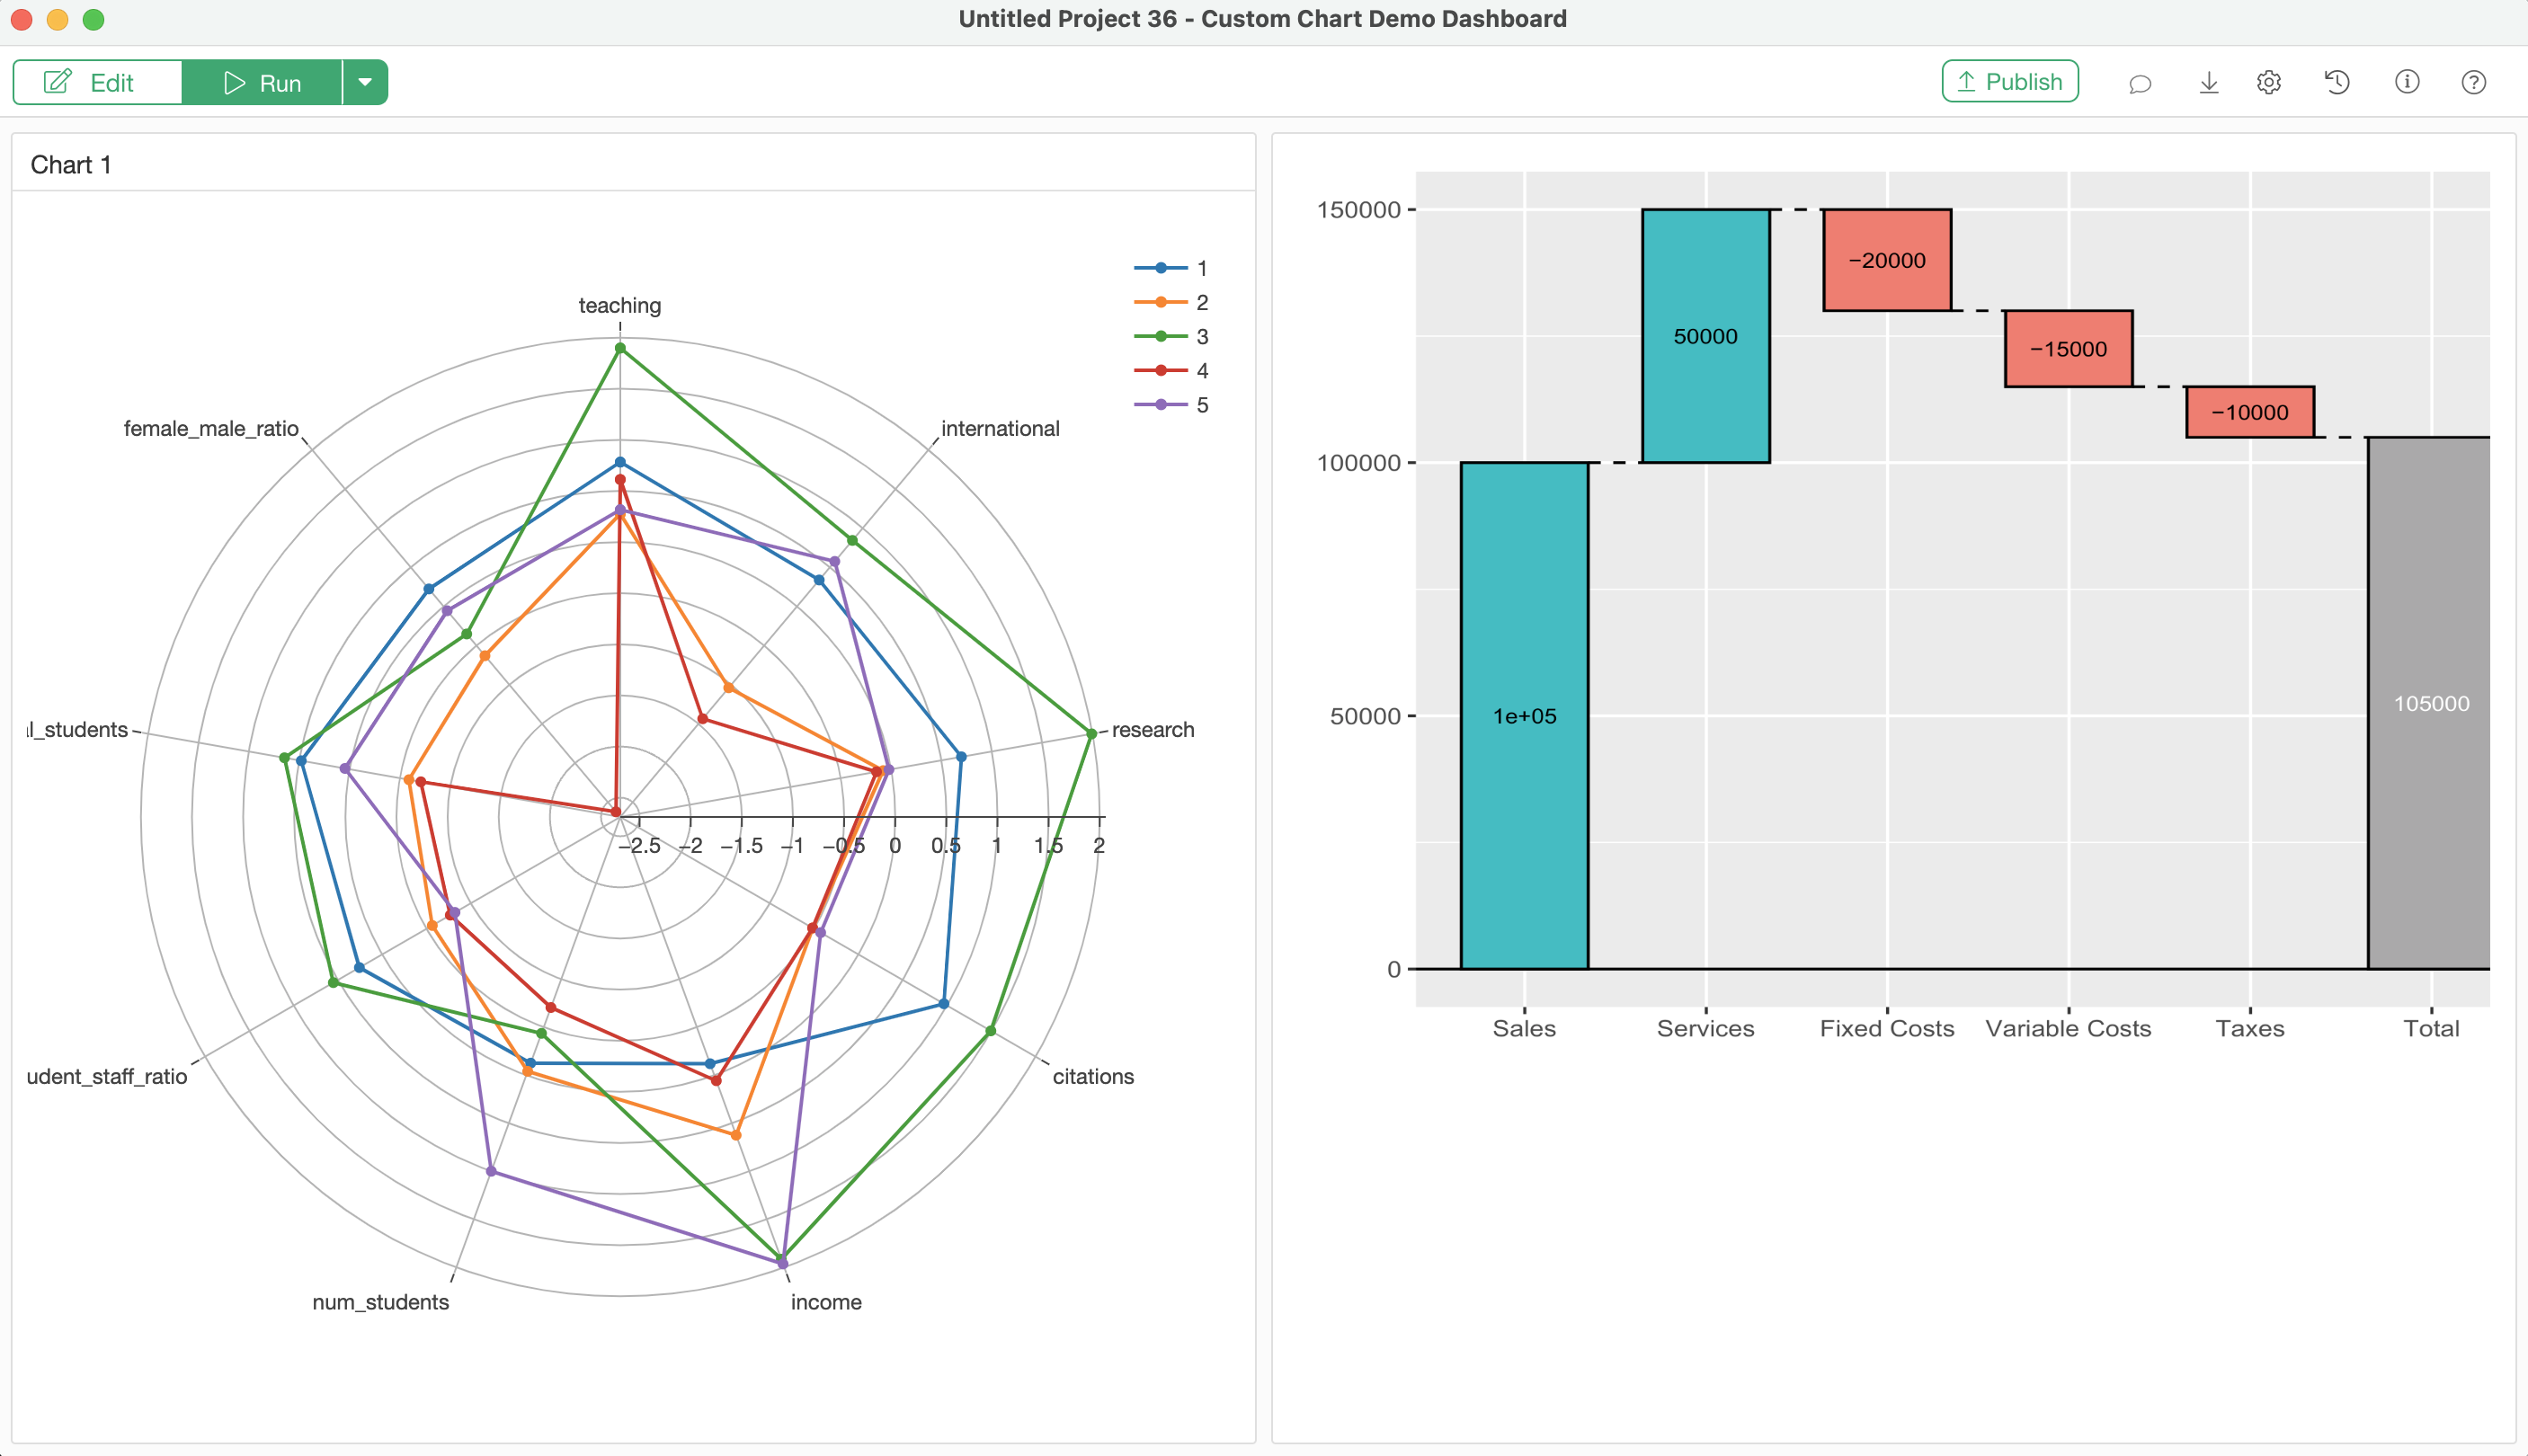
3. Create Waterfall Chart in Dashboard
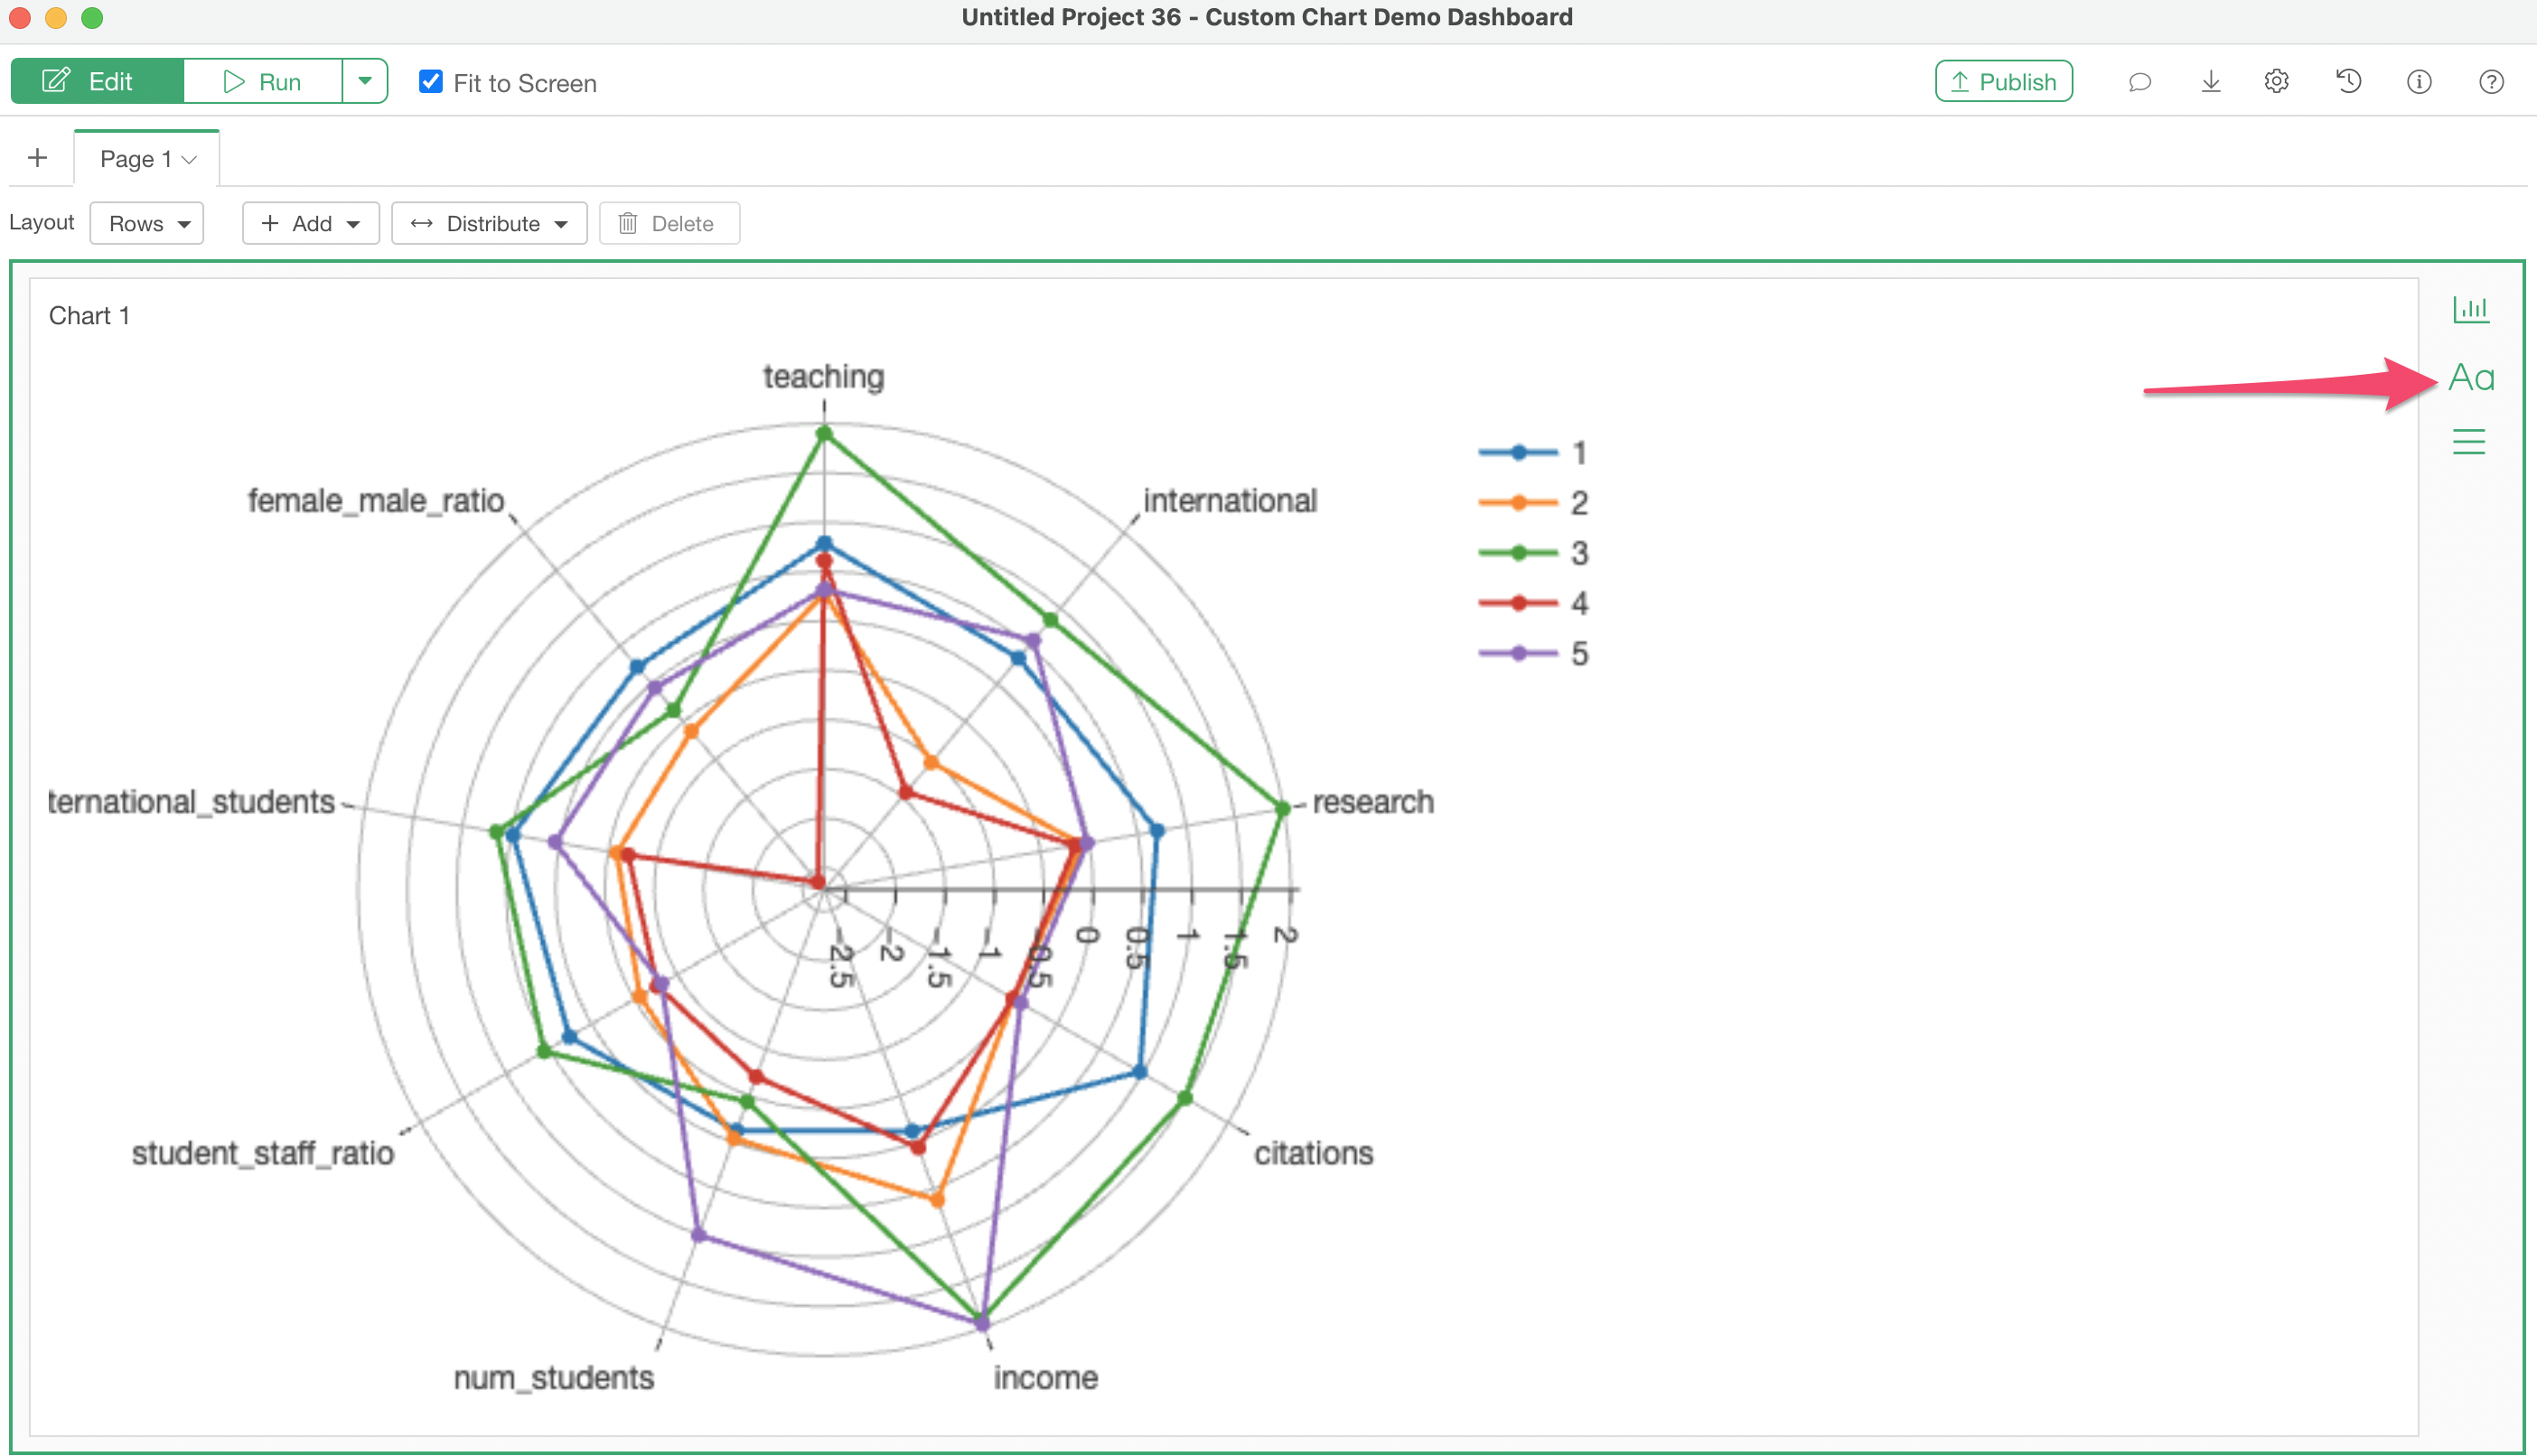
You can do the same thing in Dashboard as well.
You want to select 'Add Text' button.
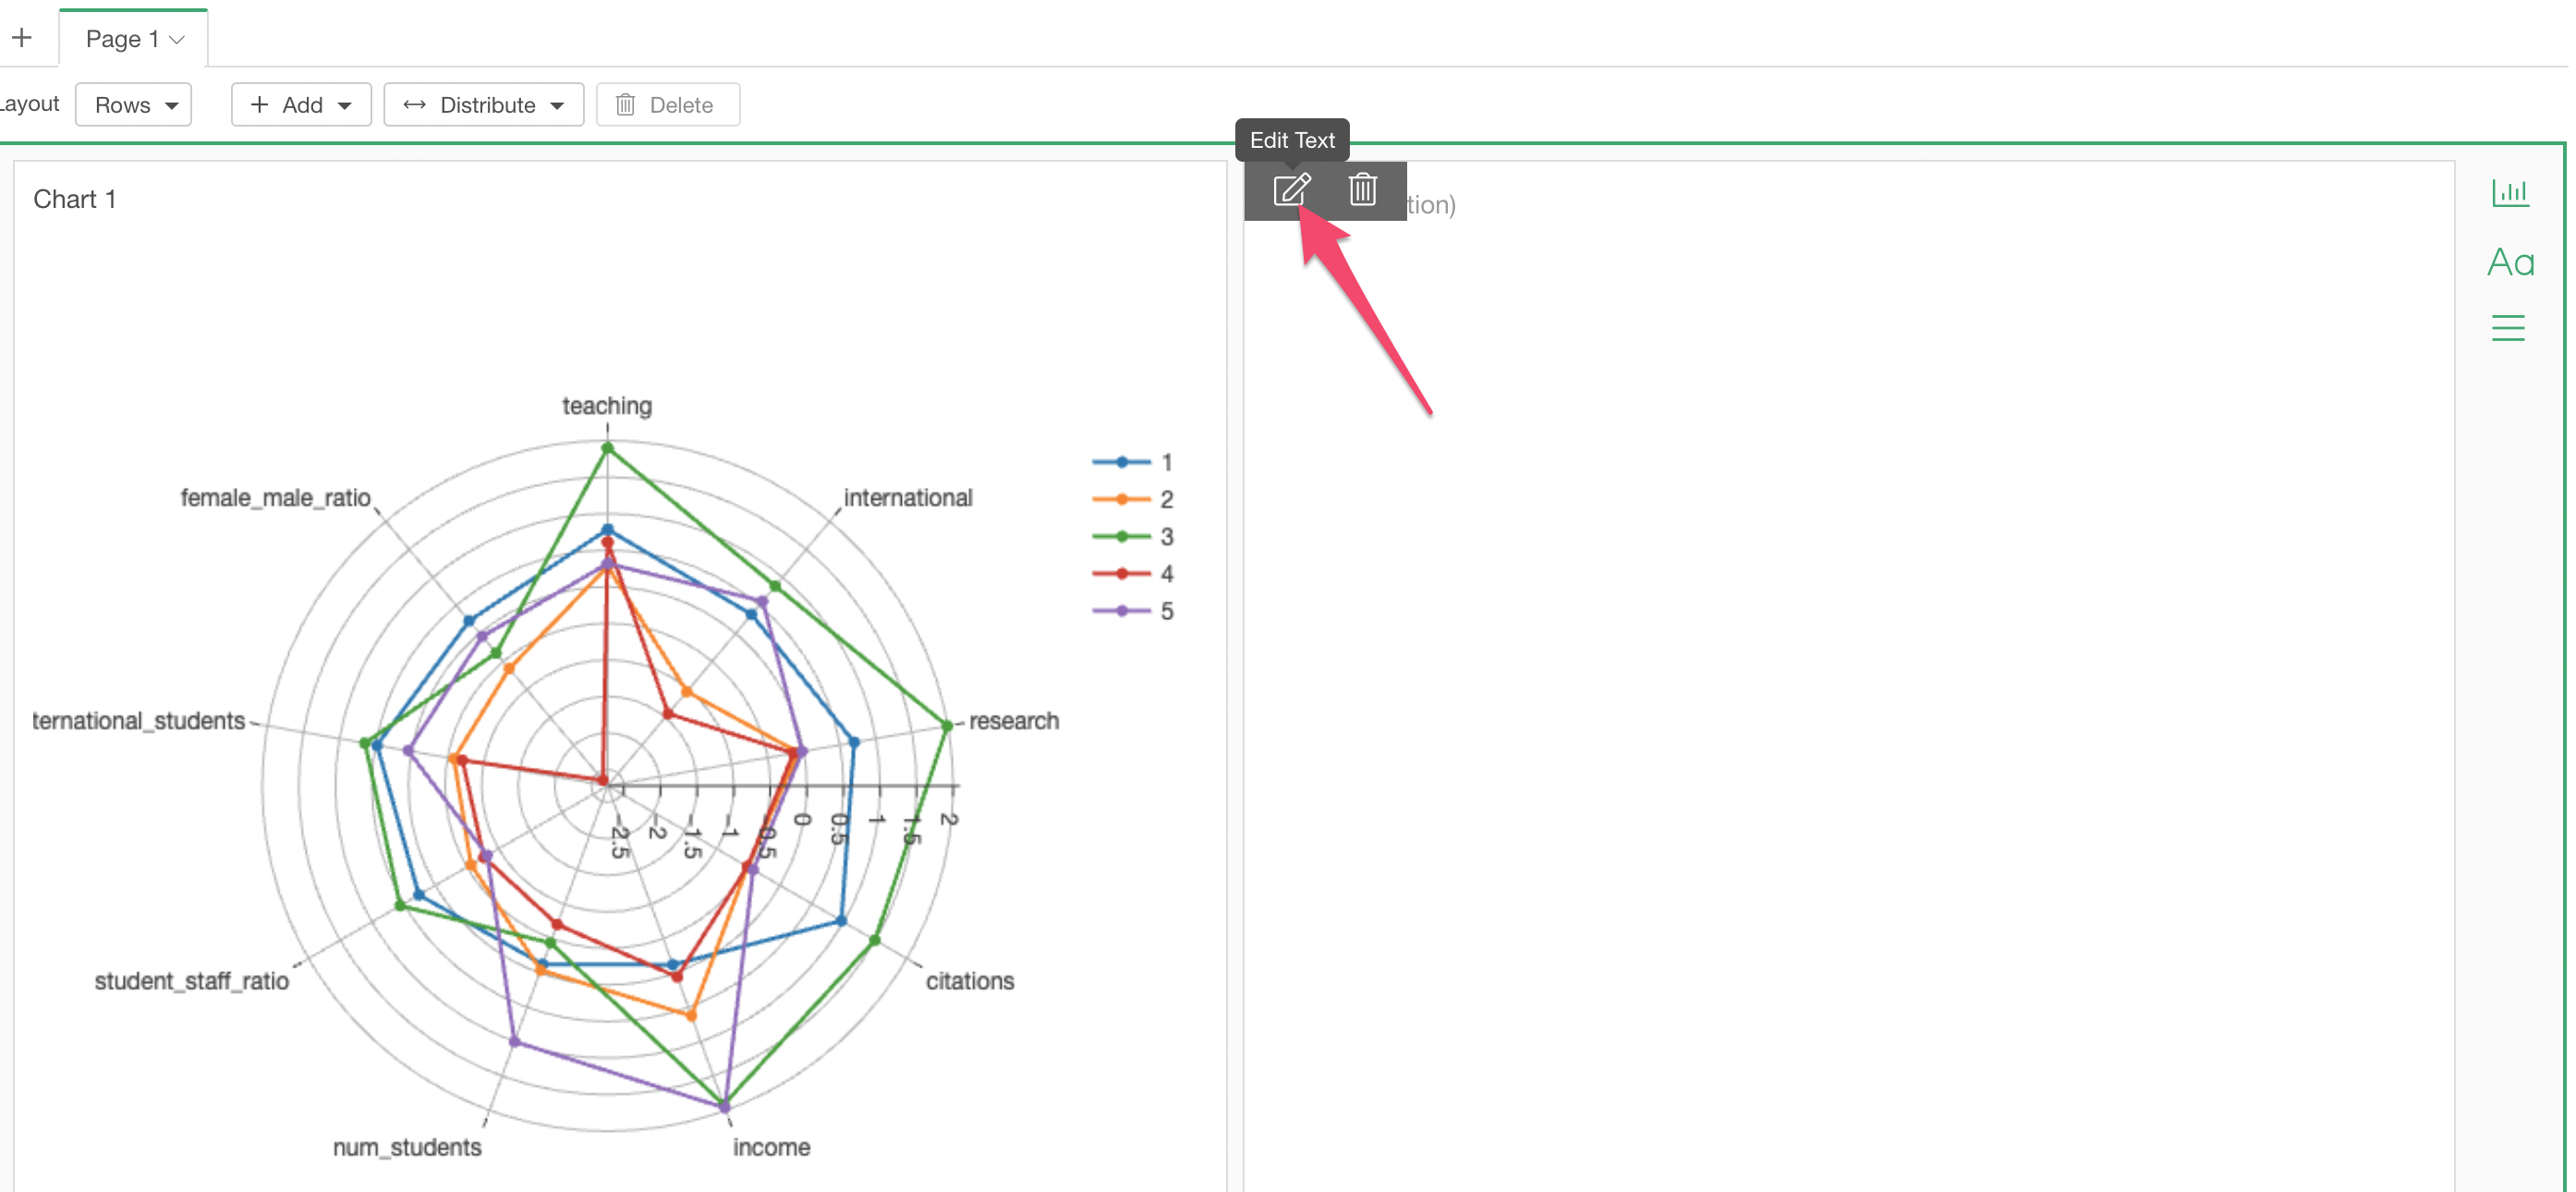
Click the 'Edit Text' button.
Select 'R Script' from the Plus button menu.
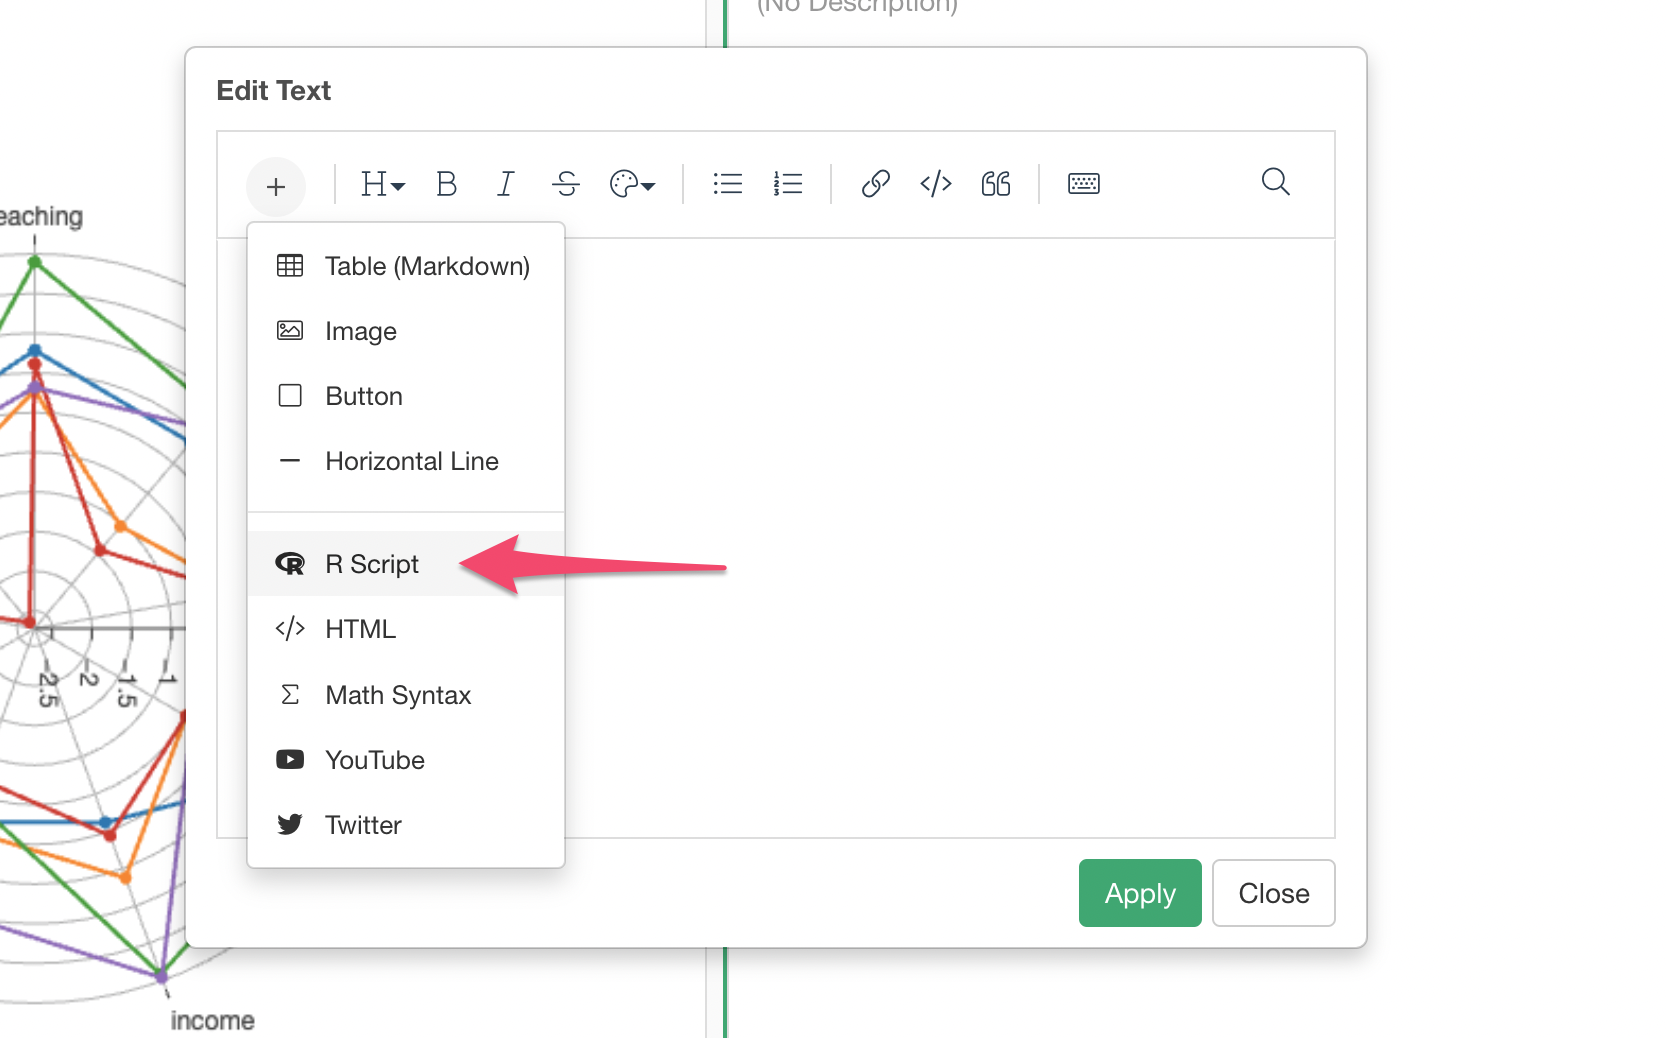
Then, type in the same code that we used for the above Note example.
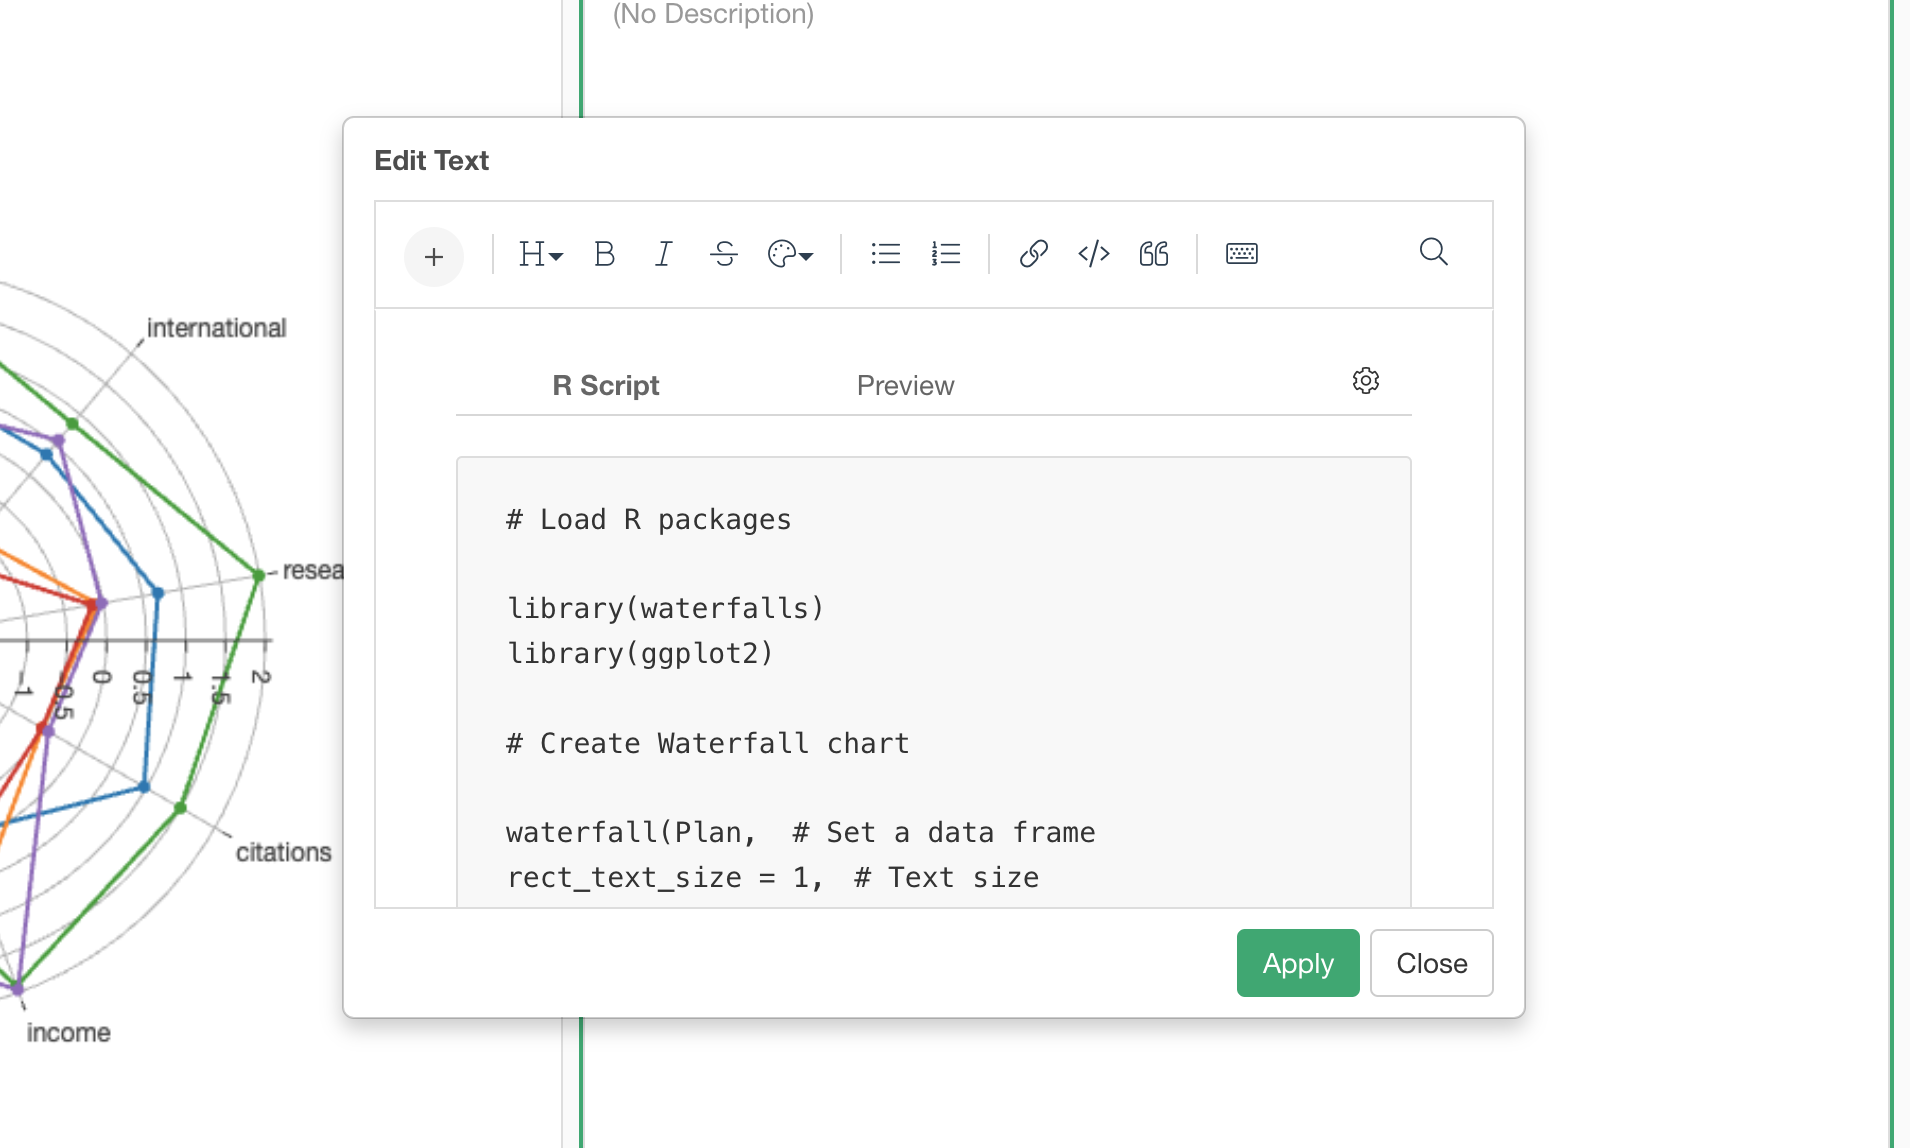
Click on the 'Apply' button to close the dialog. Then, click on the 'Run' button at the top, you'll see the waterfall chart generated inside the dashboard.