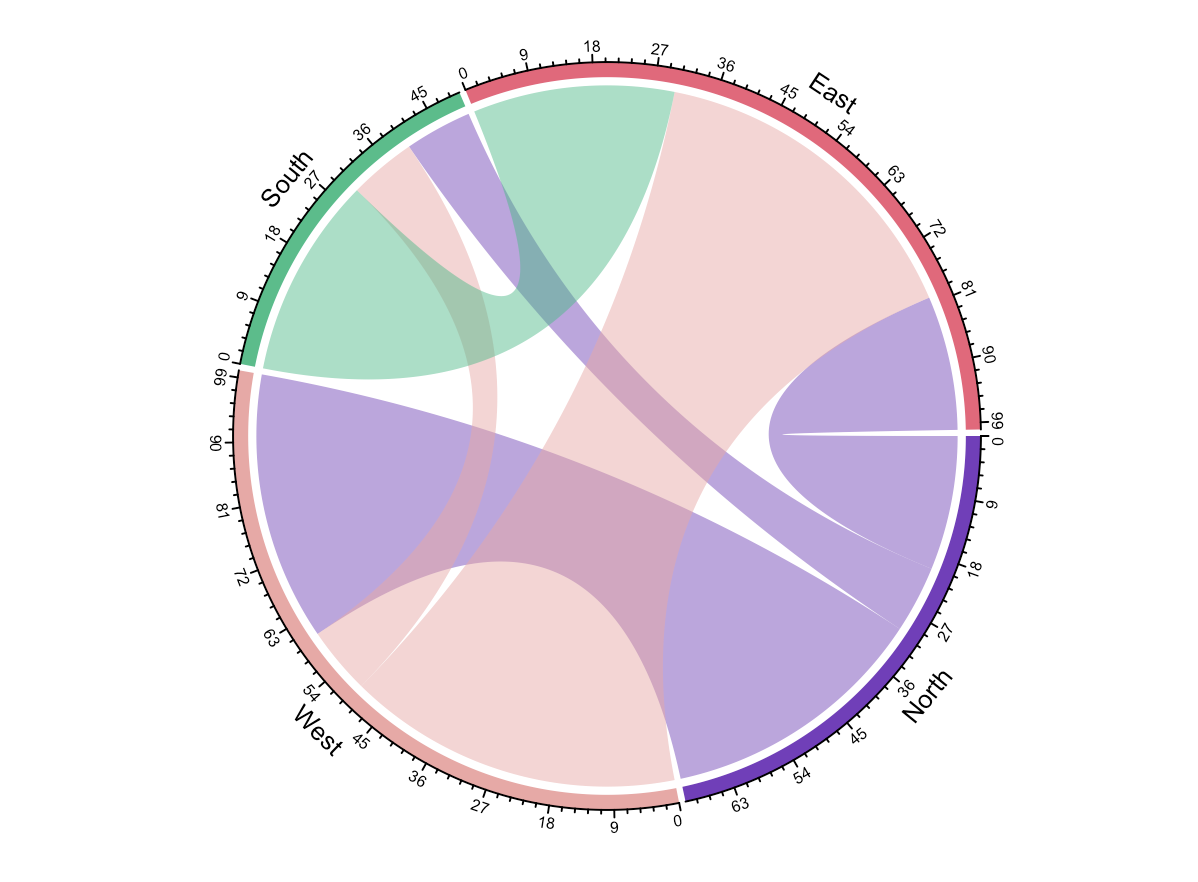
How to Create a Chord Diagram in Exploratory
It describes how to create a Chord Diagram in Exploratory using Note/Dashboard.
Install 'circlize' R package.
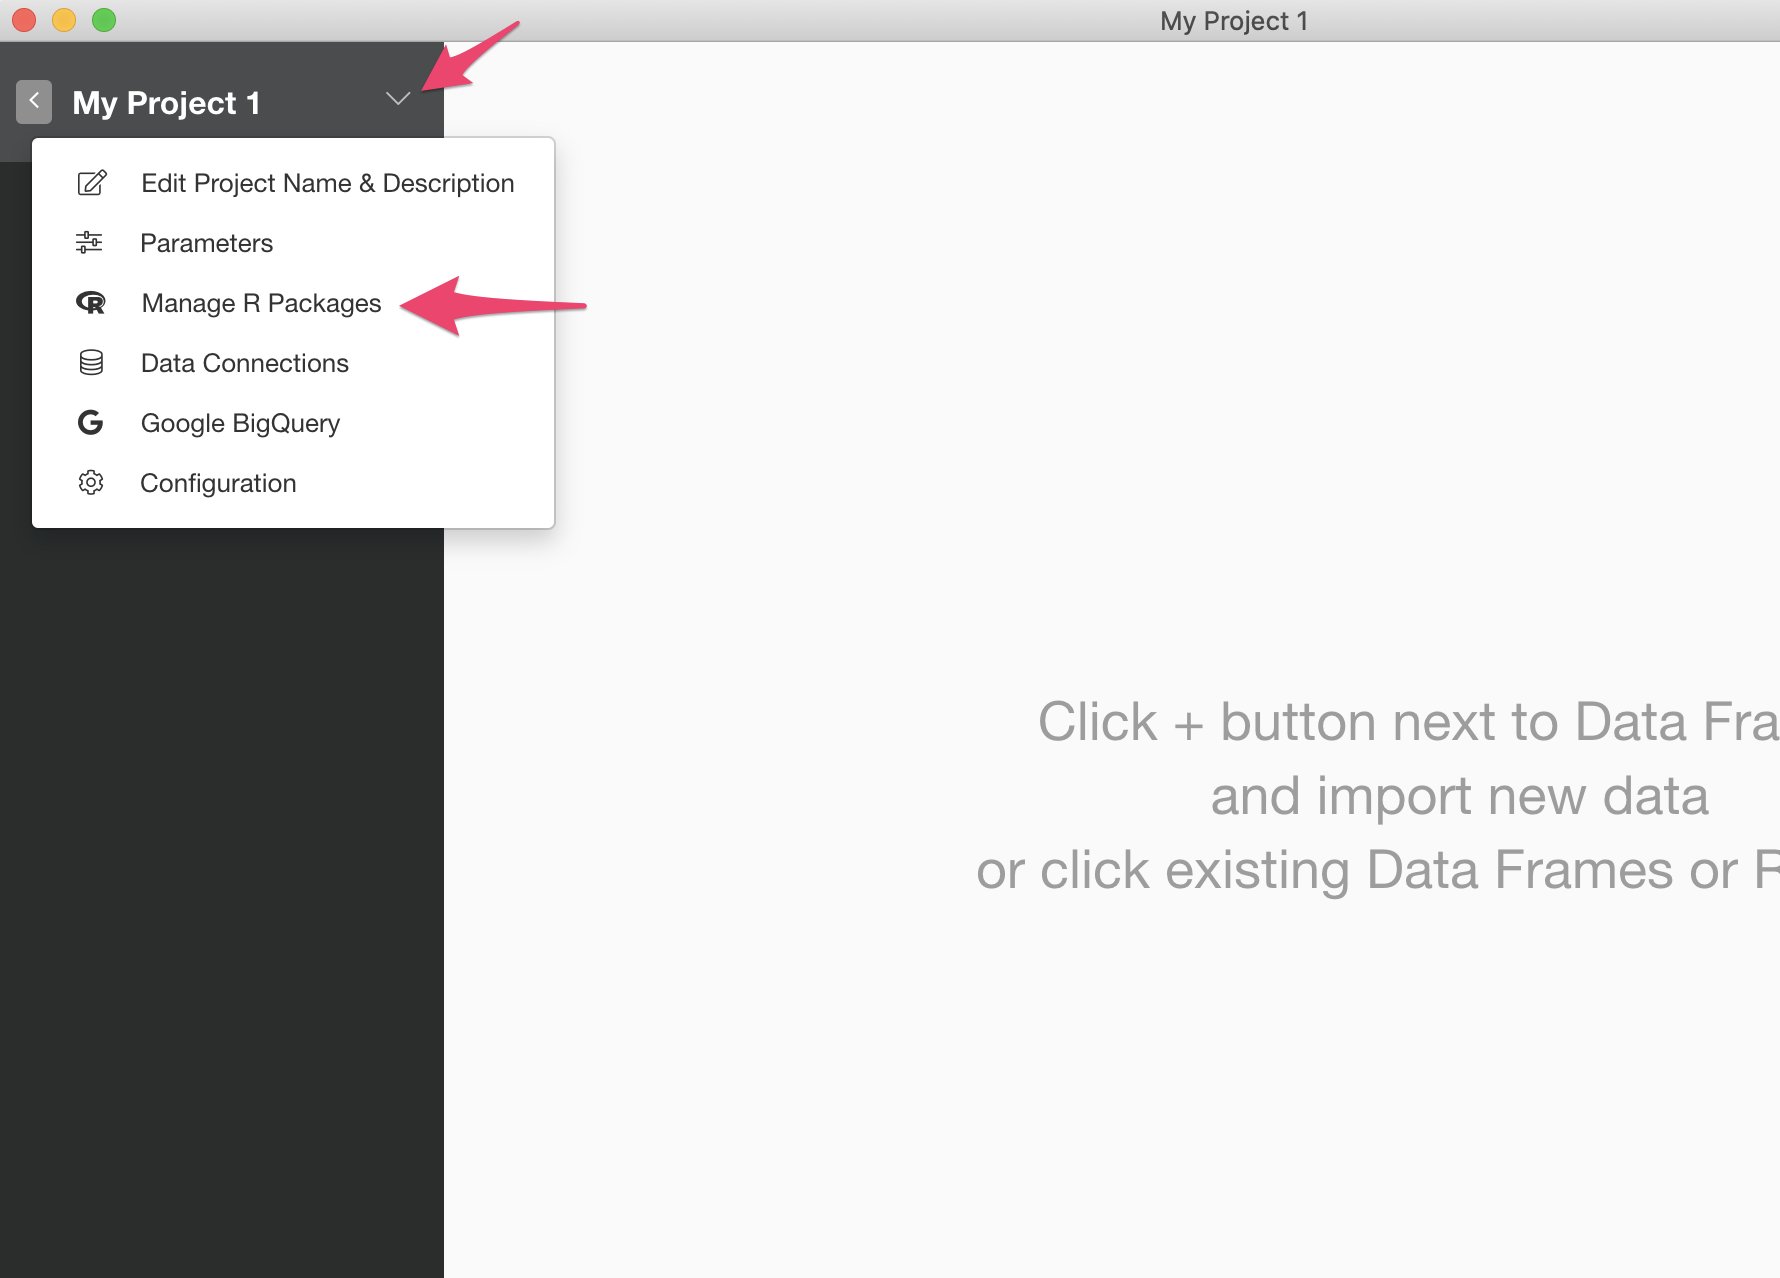
First, you need to install "circlize" R package into your Exploratory Desktop. Select the "Manage R Packages" menu from the project menu.
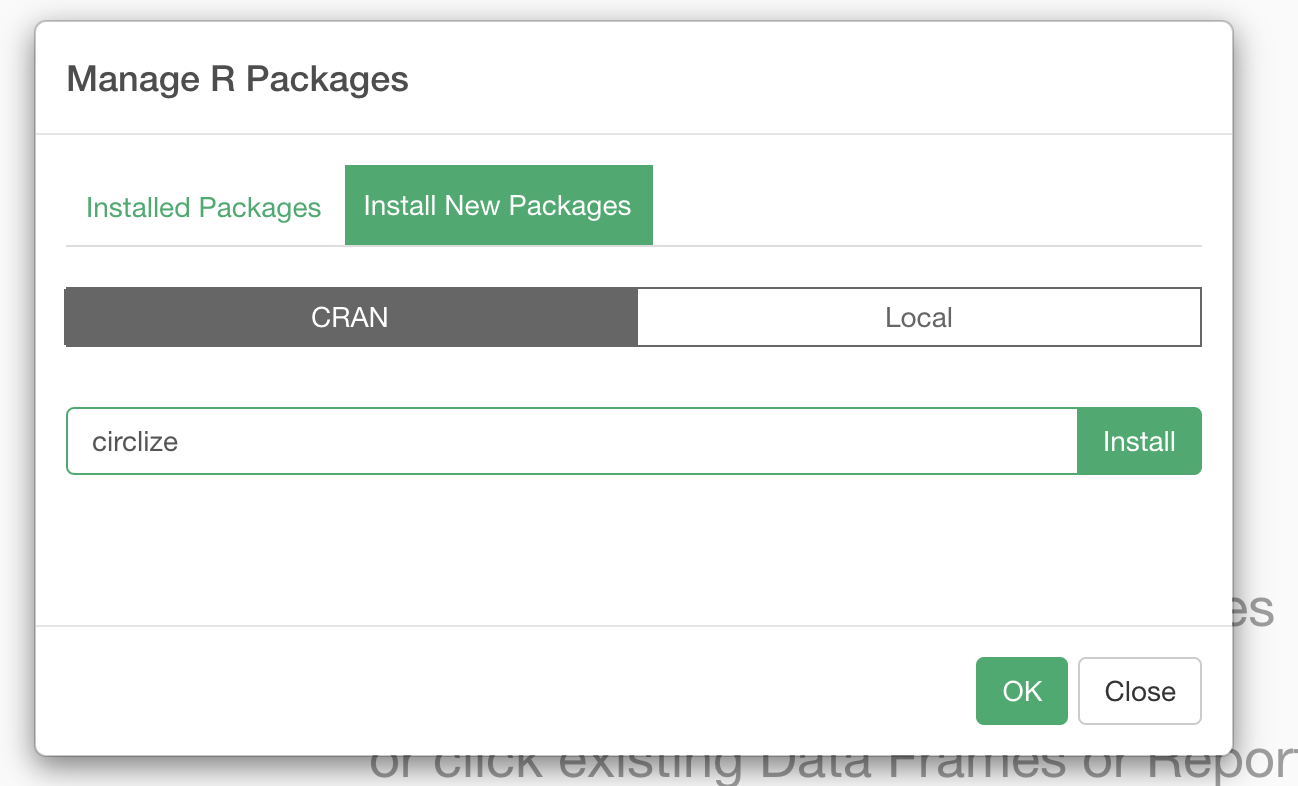
It will open the "Manage R Packages" dialog. Click the "Install New Packages" tab, type in "circlize" and hit the "Install" button to install the package.
Prepare Data
Here we use the following sample data.
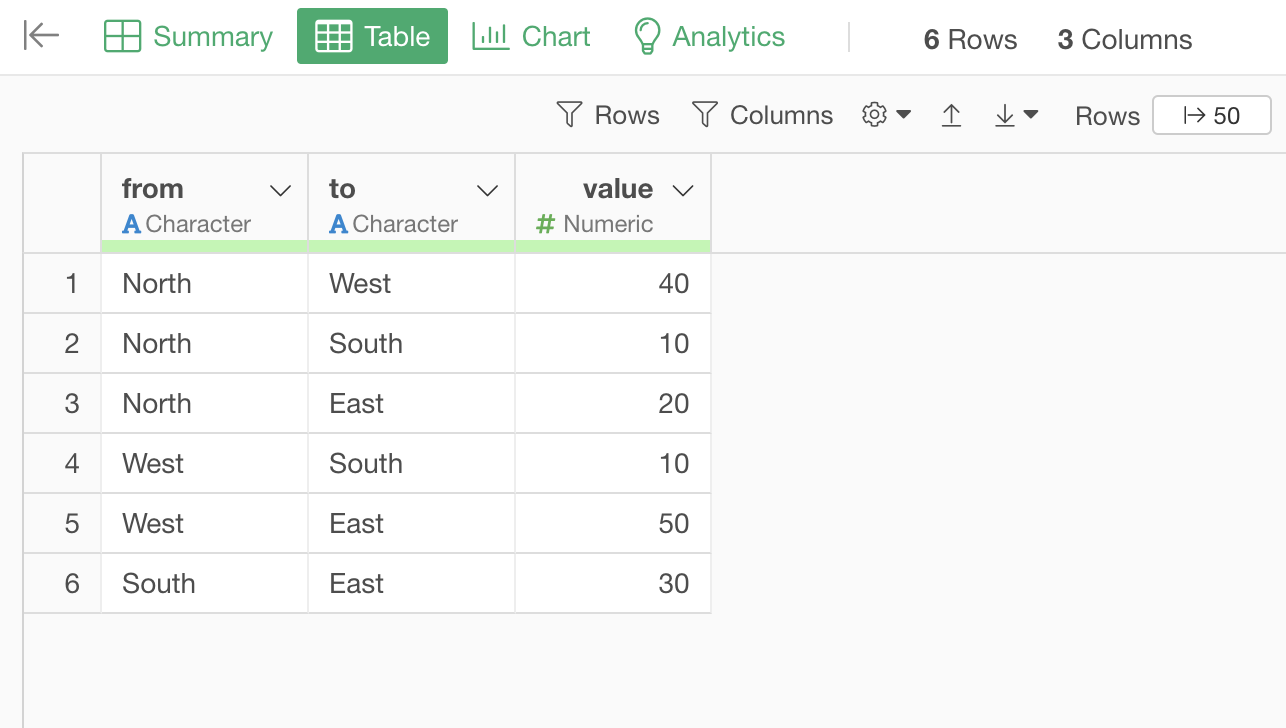
You can create this sample data frame by copying the following text into the "Text Input Data" data frame. Set "ChordData" for the name and save it.
from, to, value
"North", "West", 40
"North", "South", 10
"North", "East", 20
"West", "South", 10
"West", "East", 50
"South", "East", 30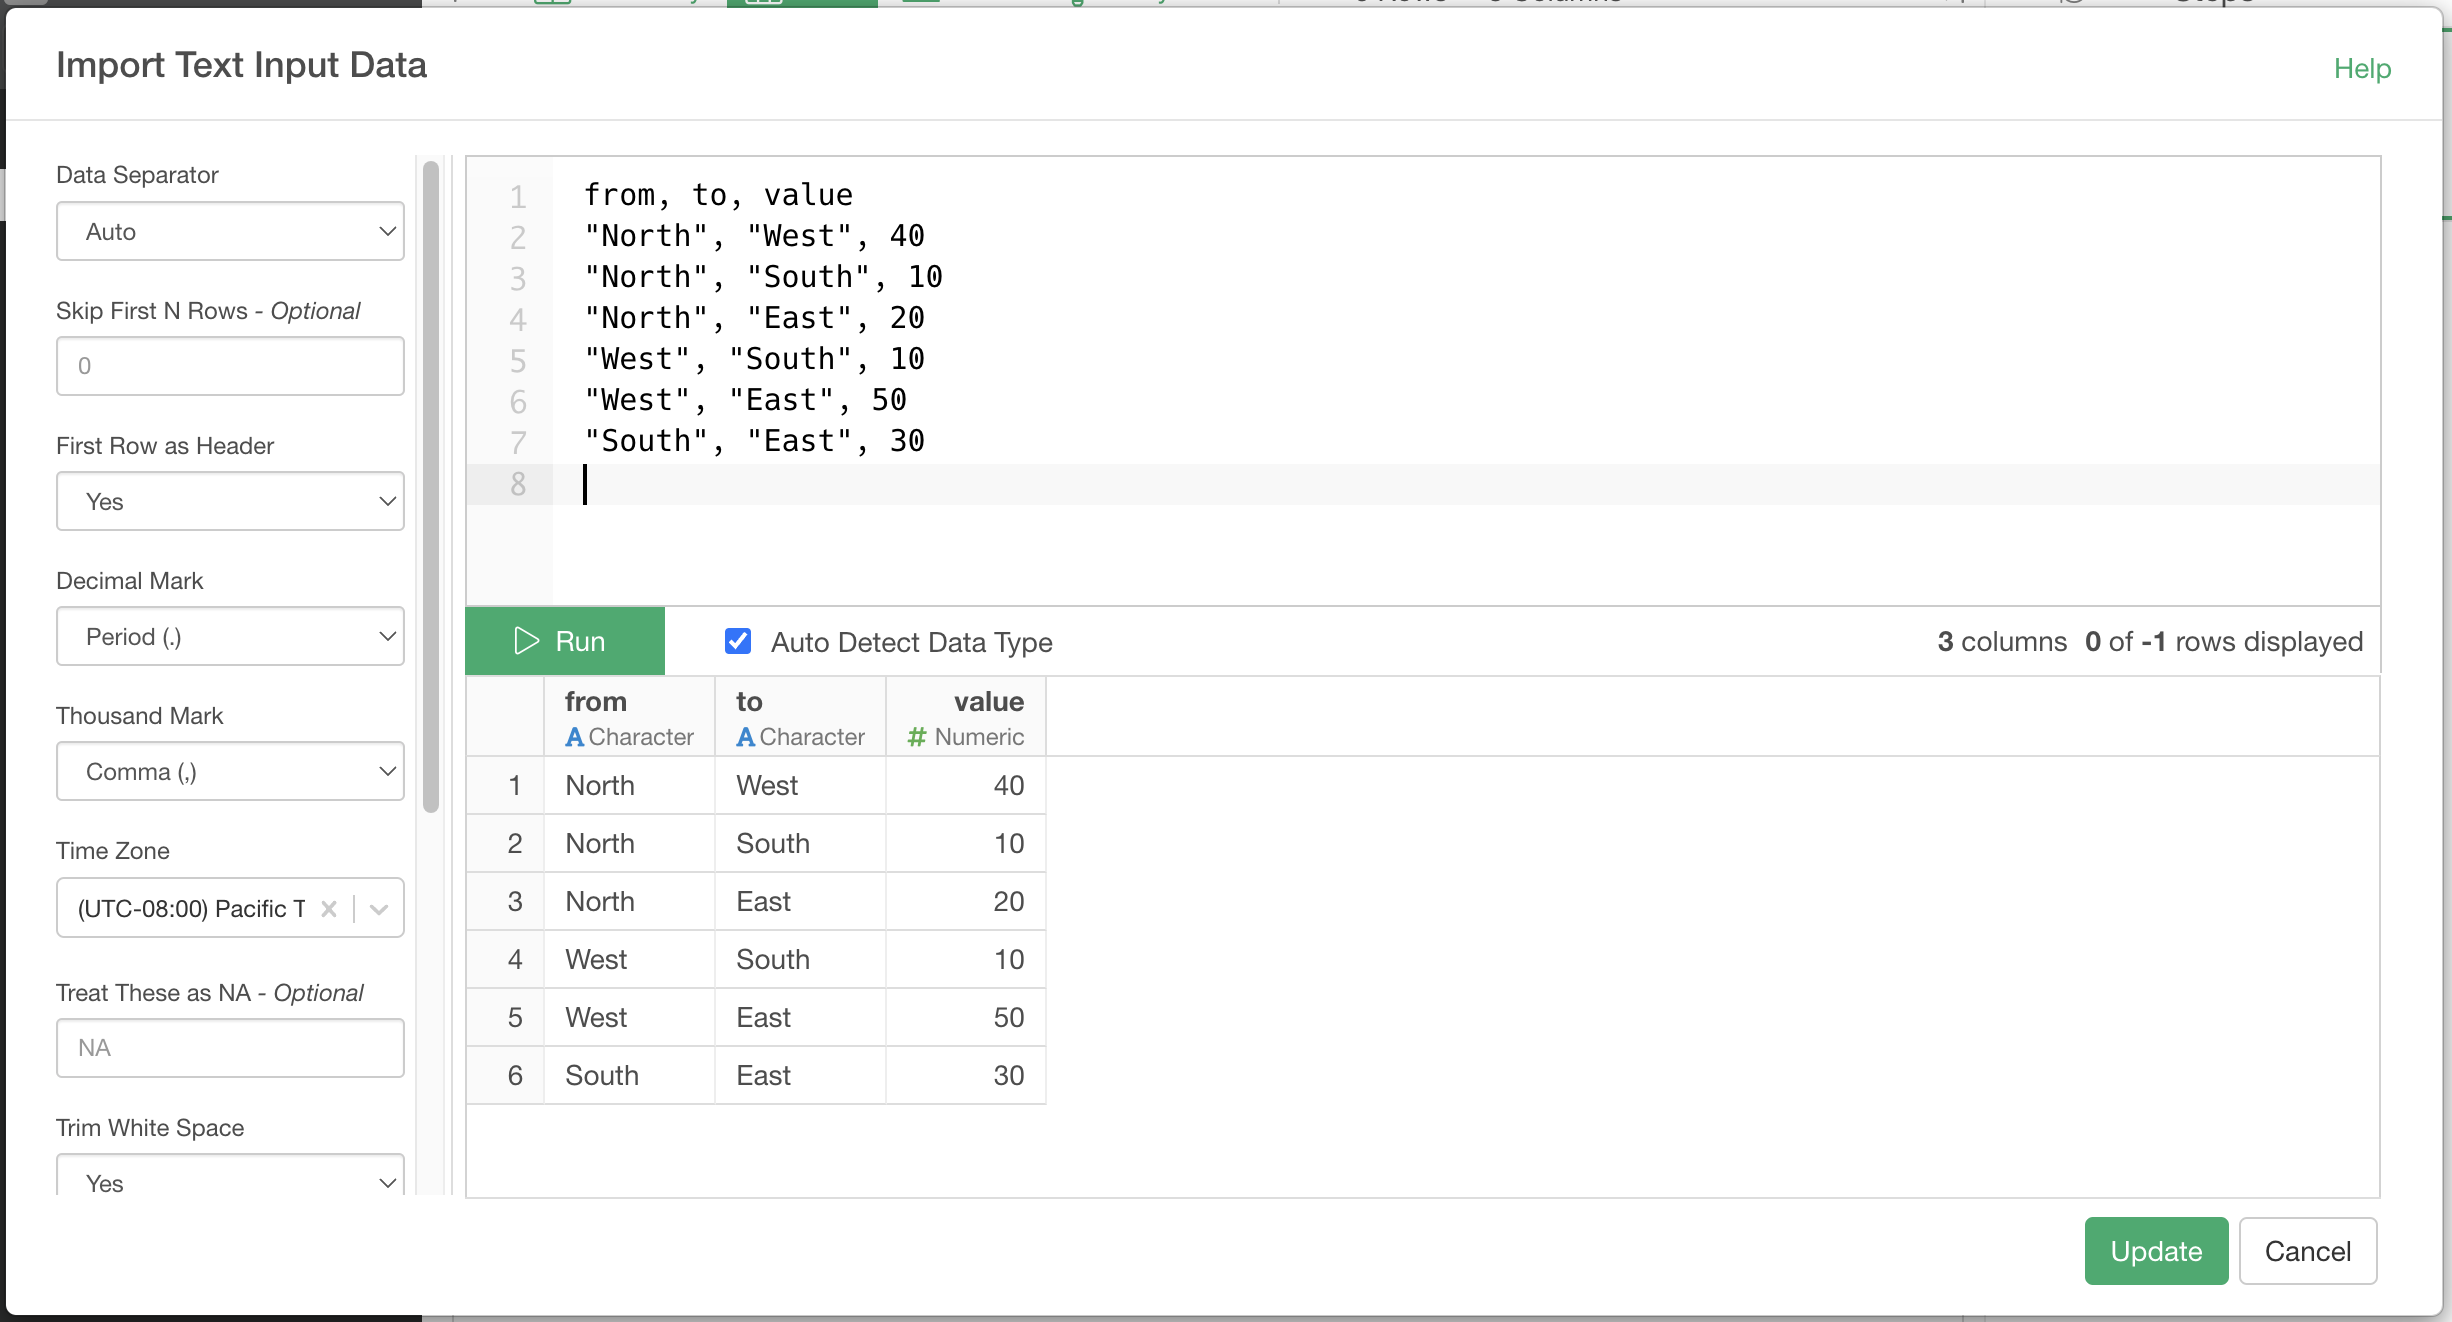
Create a Chord Diagram
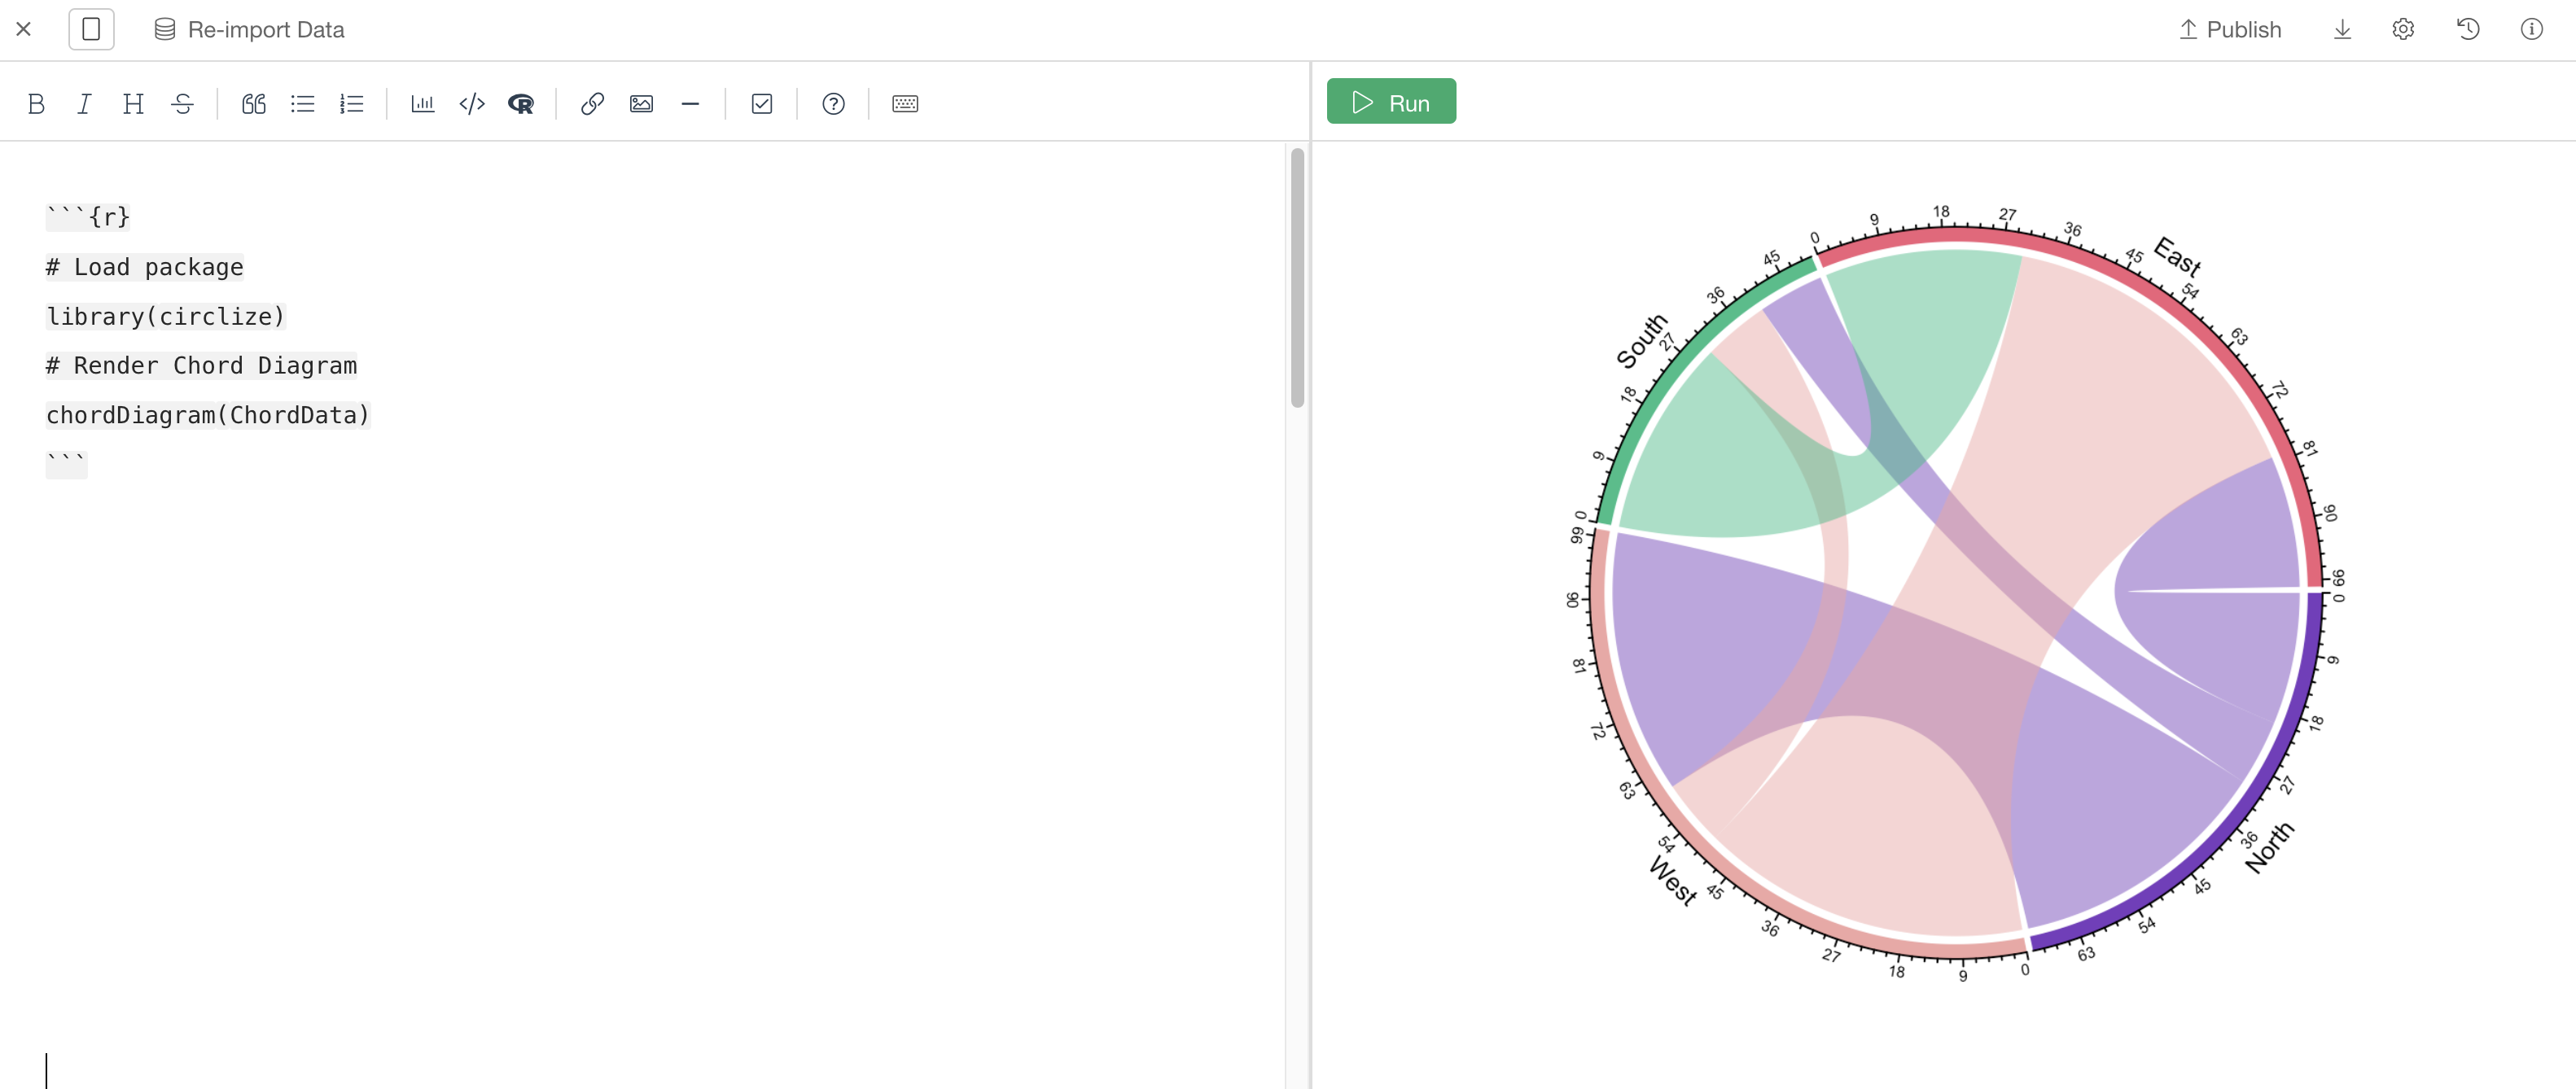
Create a new Note and cut and paste the R Markdown code below into your Note.
```{r}
# Load package
library(circlize)
# Render Chord Diagram
chordDiagram(ChordData)
```
Click the refresh button to run the Note. You will see the Chord Diagram in the preview screen on the right-hand side.
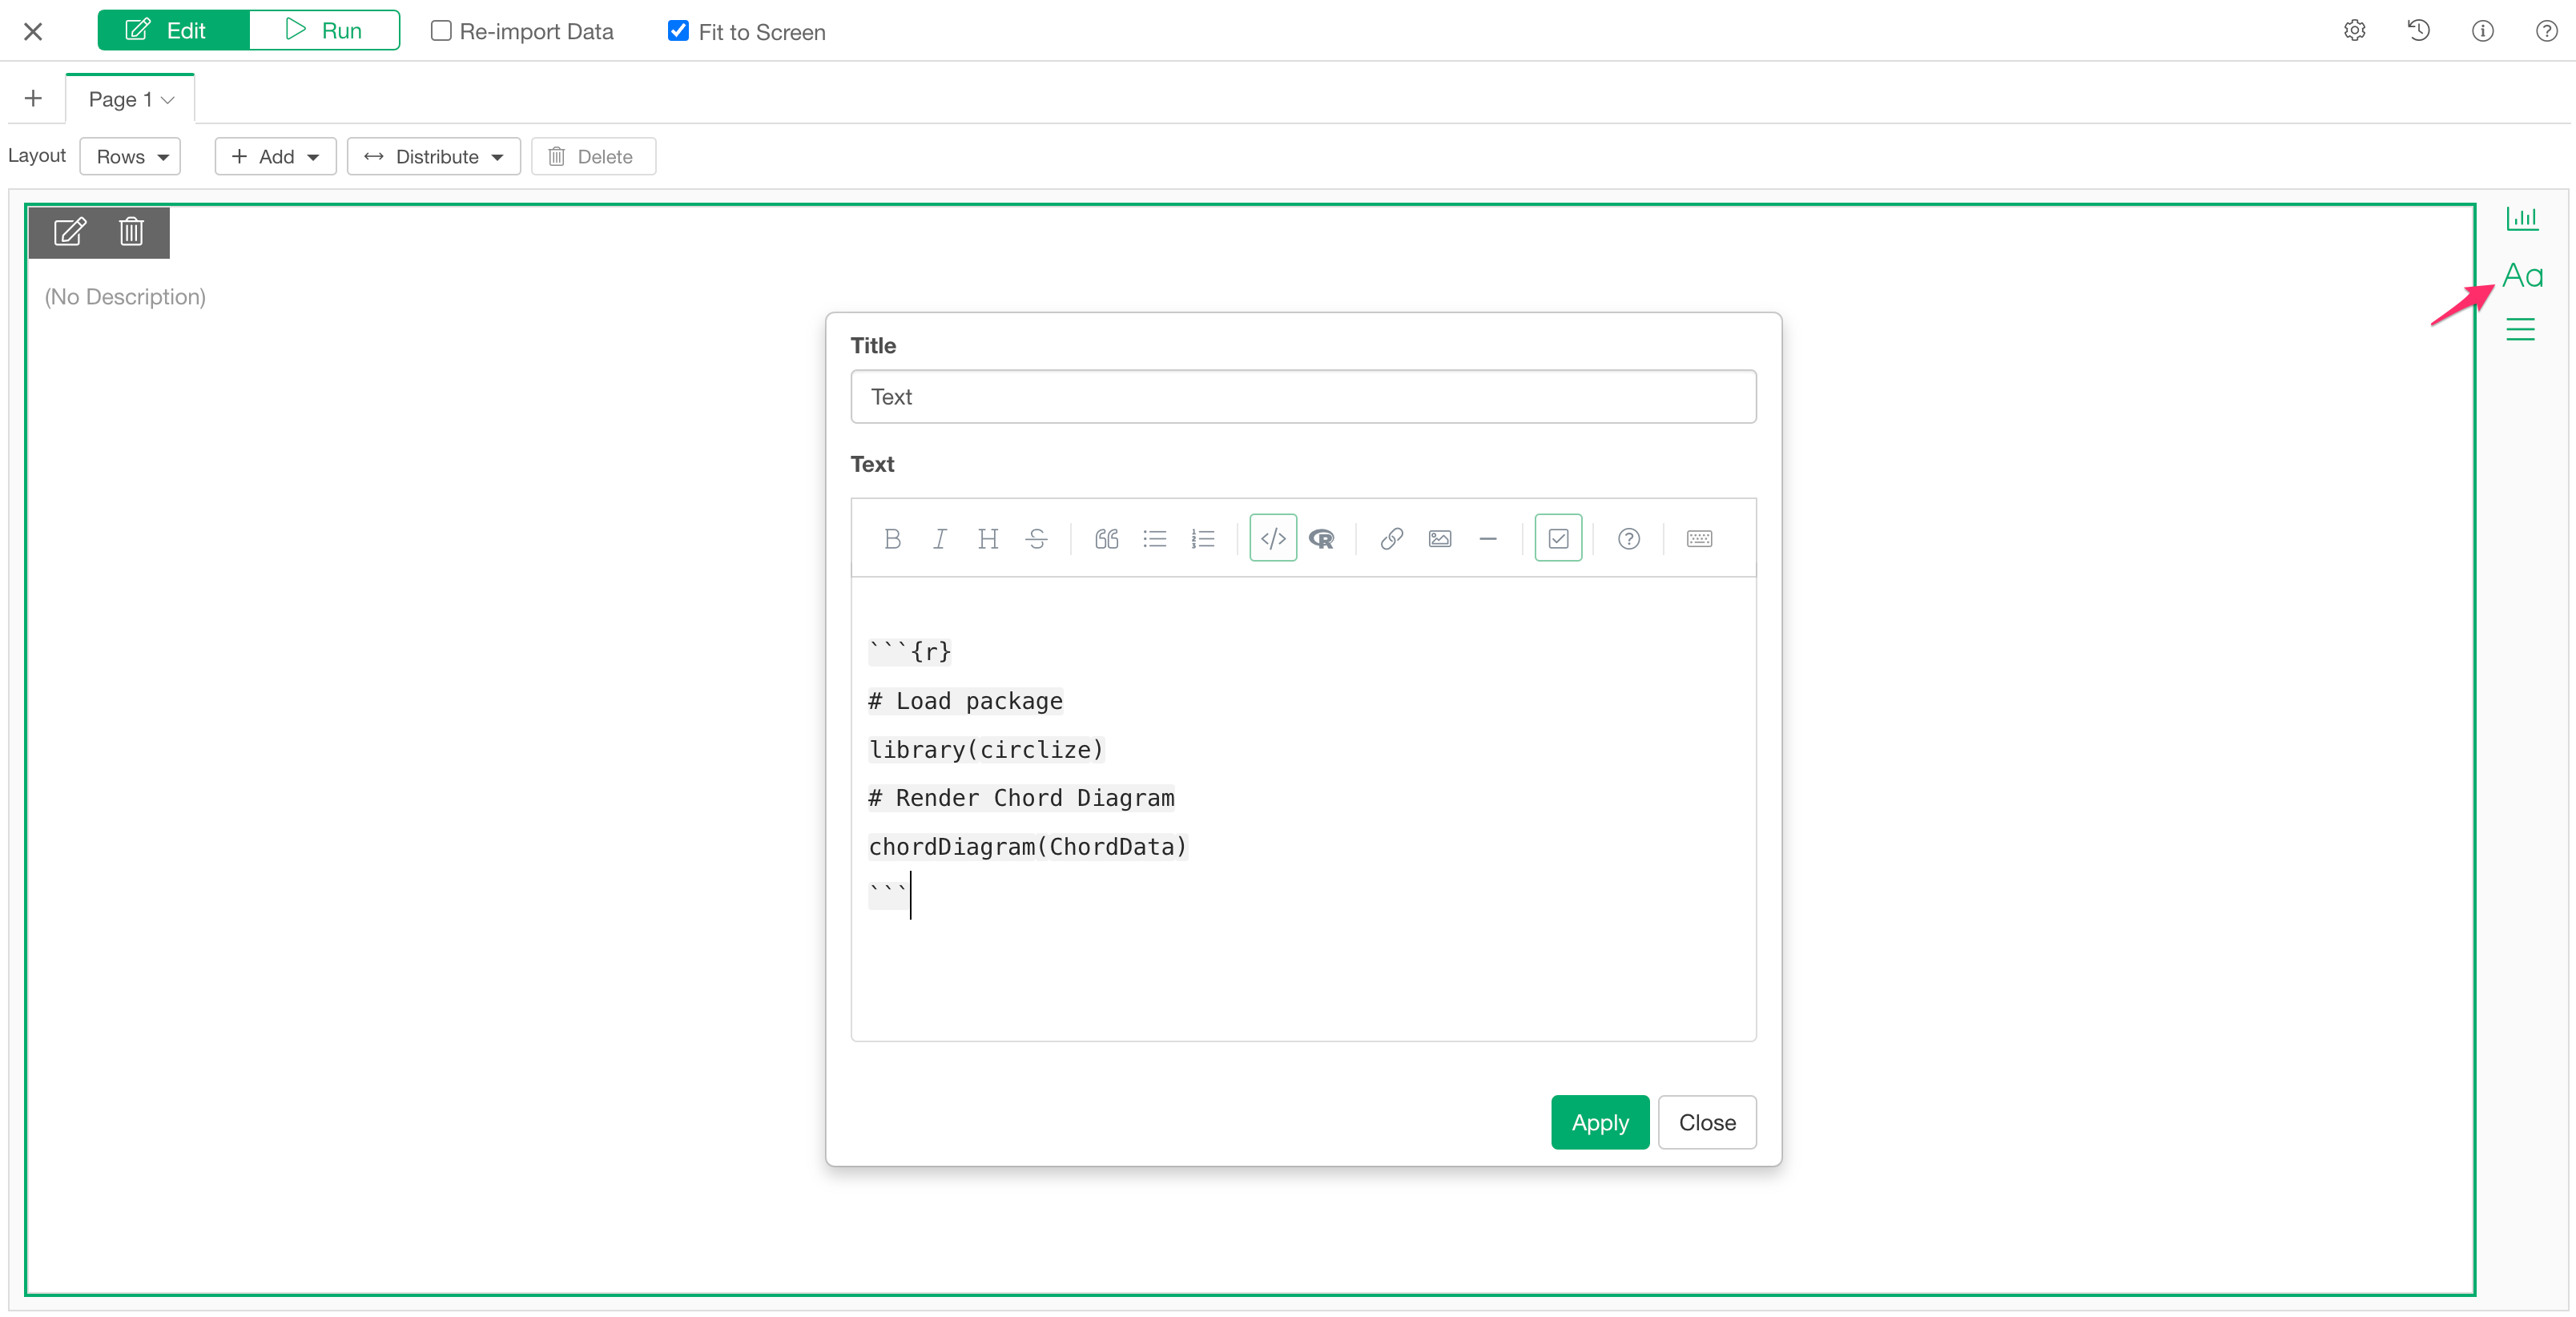
If you want to add it to a Dashboard, add a new text panel in your Dashboard and add the same R Markdown code into the "Text" field of the text panel.
Tips
- You can adjust the output size by setting "fig.height" and "fig.width" parameters to the 1st line of the code like the following.
```{r,fig.height=4, fig.width=8} - You can check Chord diagram in R with circlize for basic configuration such as changing color, etc,.
- You can check out the Circular Visualization in R for all the details and configurations.