How to Determine the Optimal Threshold for Binary Classification Models
In Exploratory, you can build models from the Analytics view to predict answers to questions that can be answered with “TRUE” or “FALSE,” such as “Will this person convert?” or “Will they leave the company?”
Strictly speaking, however, these models do not predict whether the outcome will be TRUE or FALSE; instead, they predict the “probability of being TRUE.”
Therefore, to decide whether the final prediction result should be TRUE or FALSE based on the predicted “probability of being TRUE,” you need to set a “threshold” to determine at what probability level the model should return a TRUE result.
In Exploratory, the default threshold is set to 0.5 (50%), meaning a TRUE prediction is returned if the probability of being TRUE exceeds 0.5. However, the default threshold is not always the optimal value for predicting “TRUE” or “FALSE.”
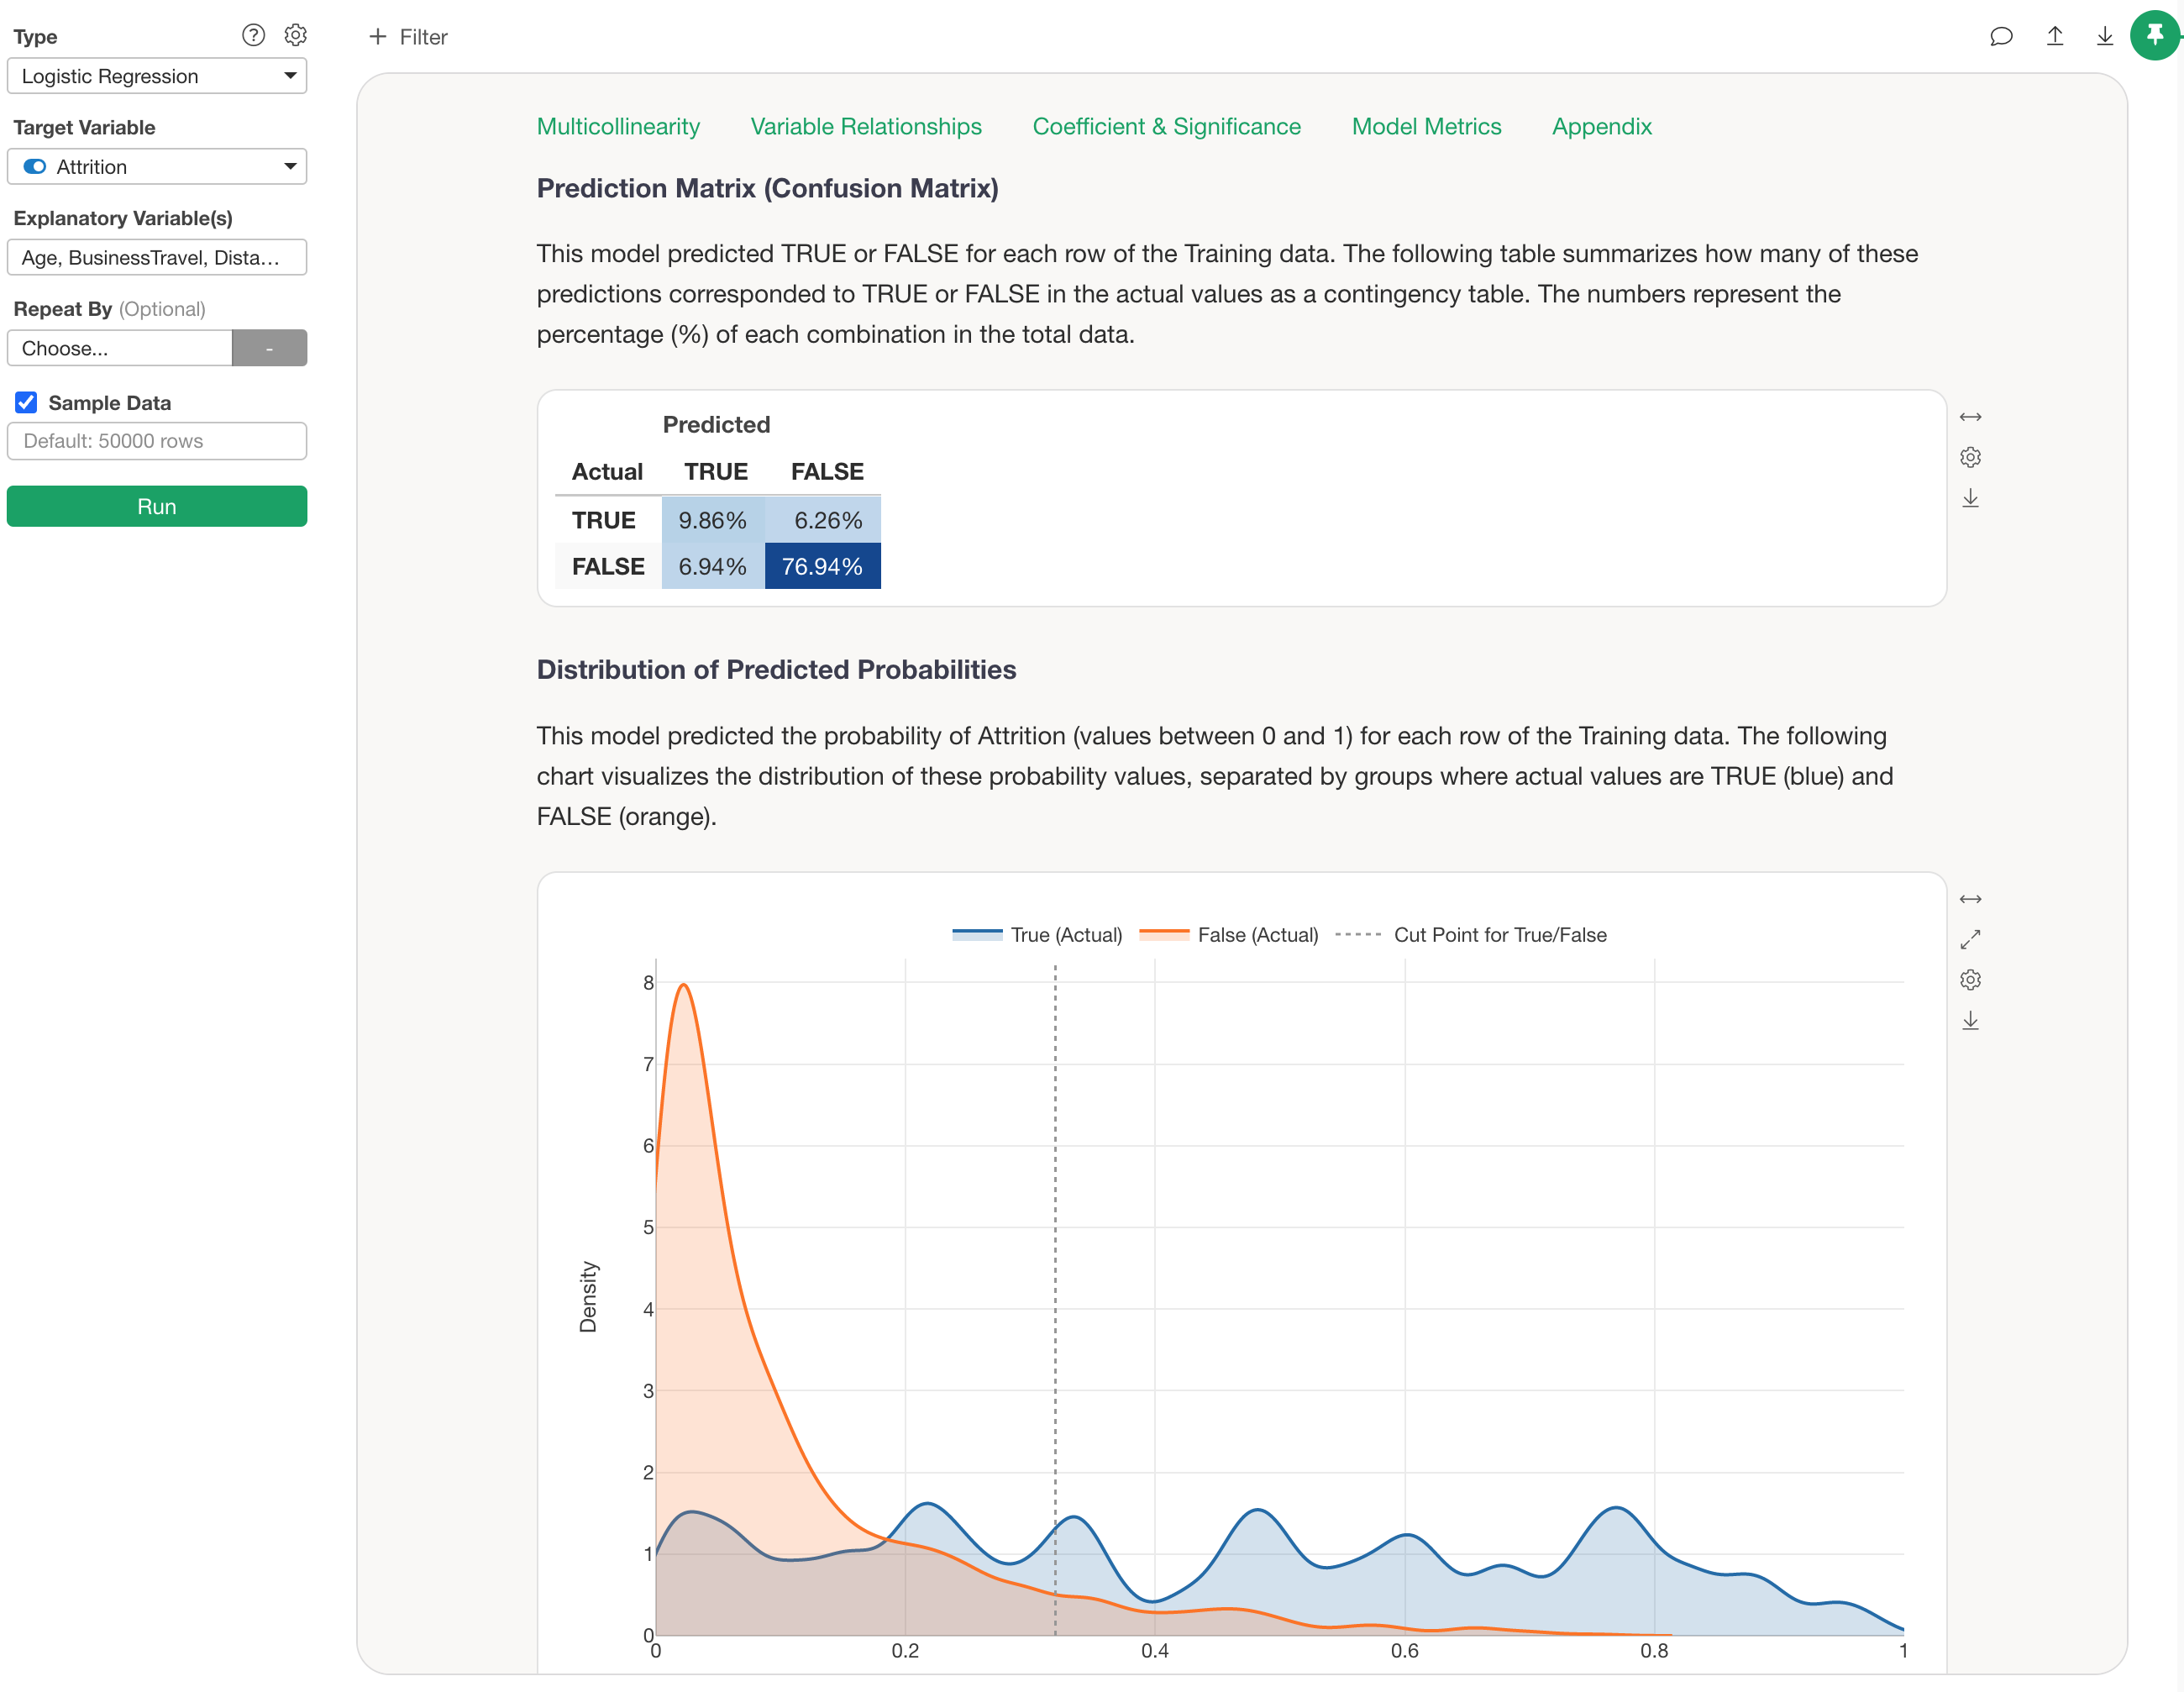
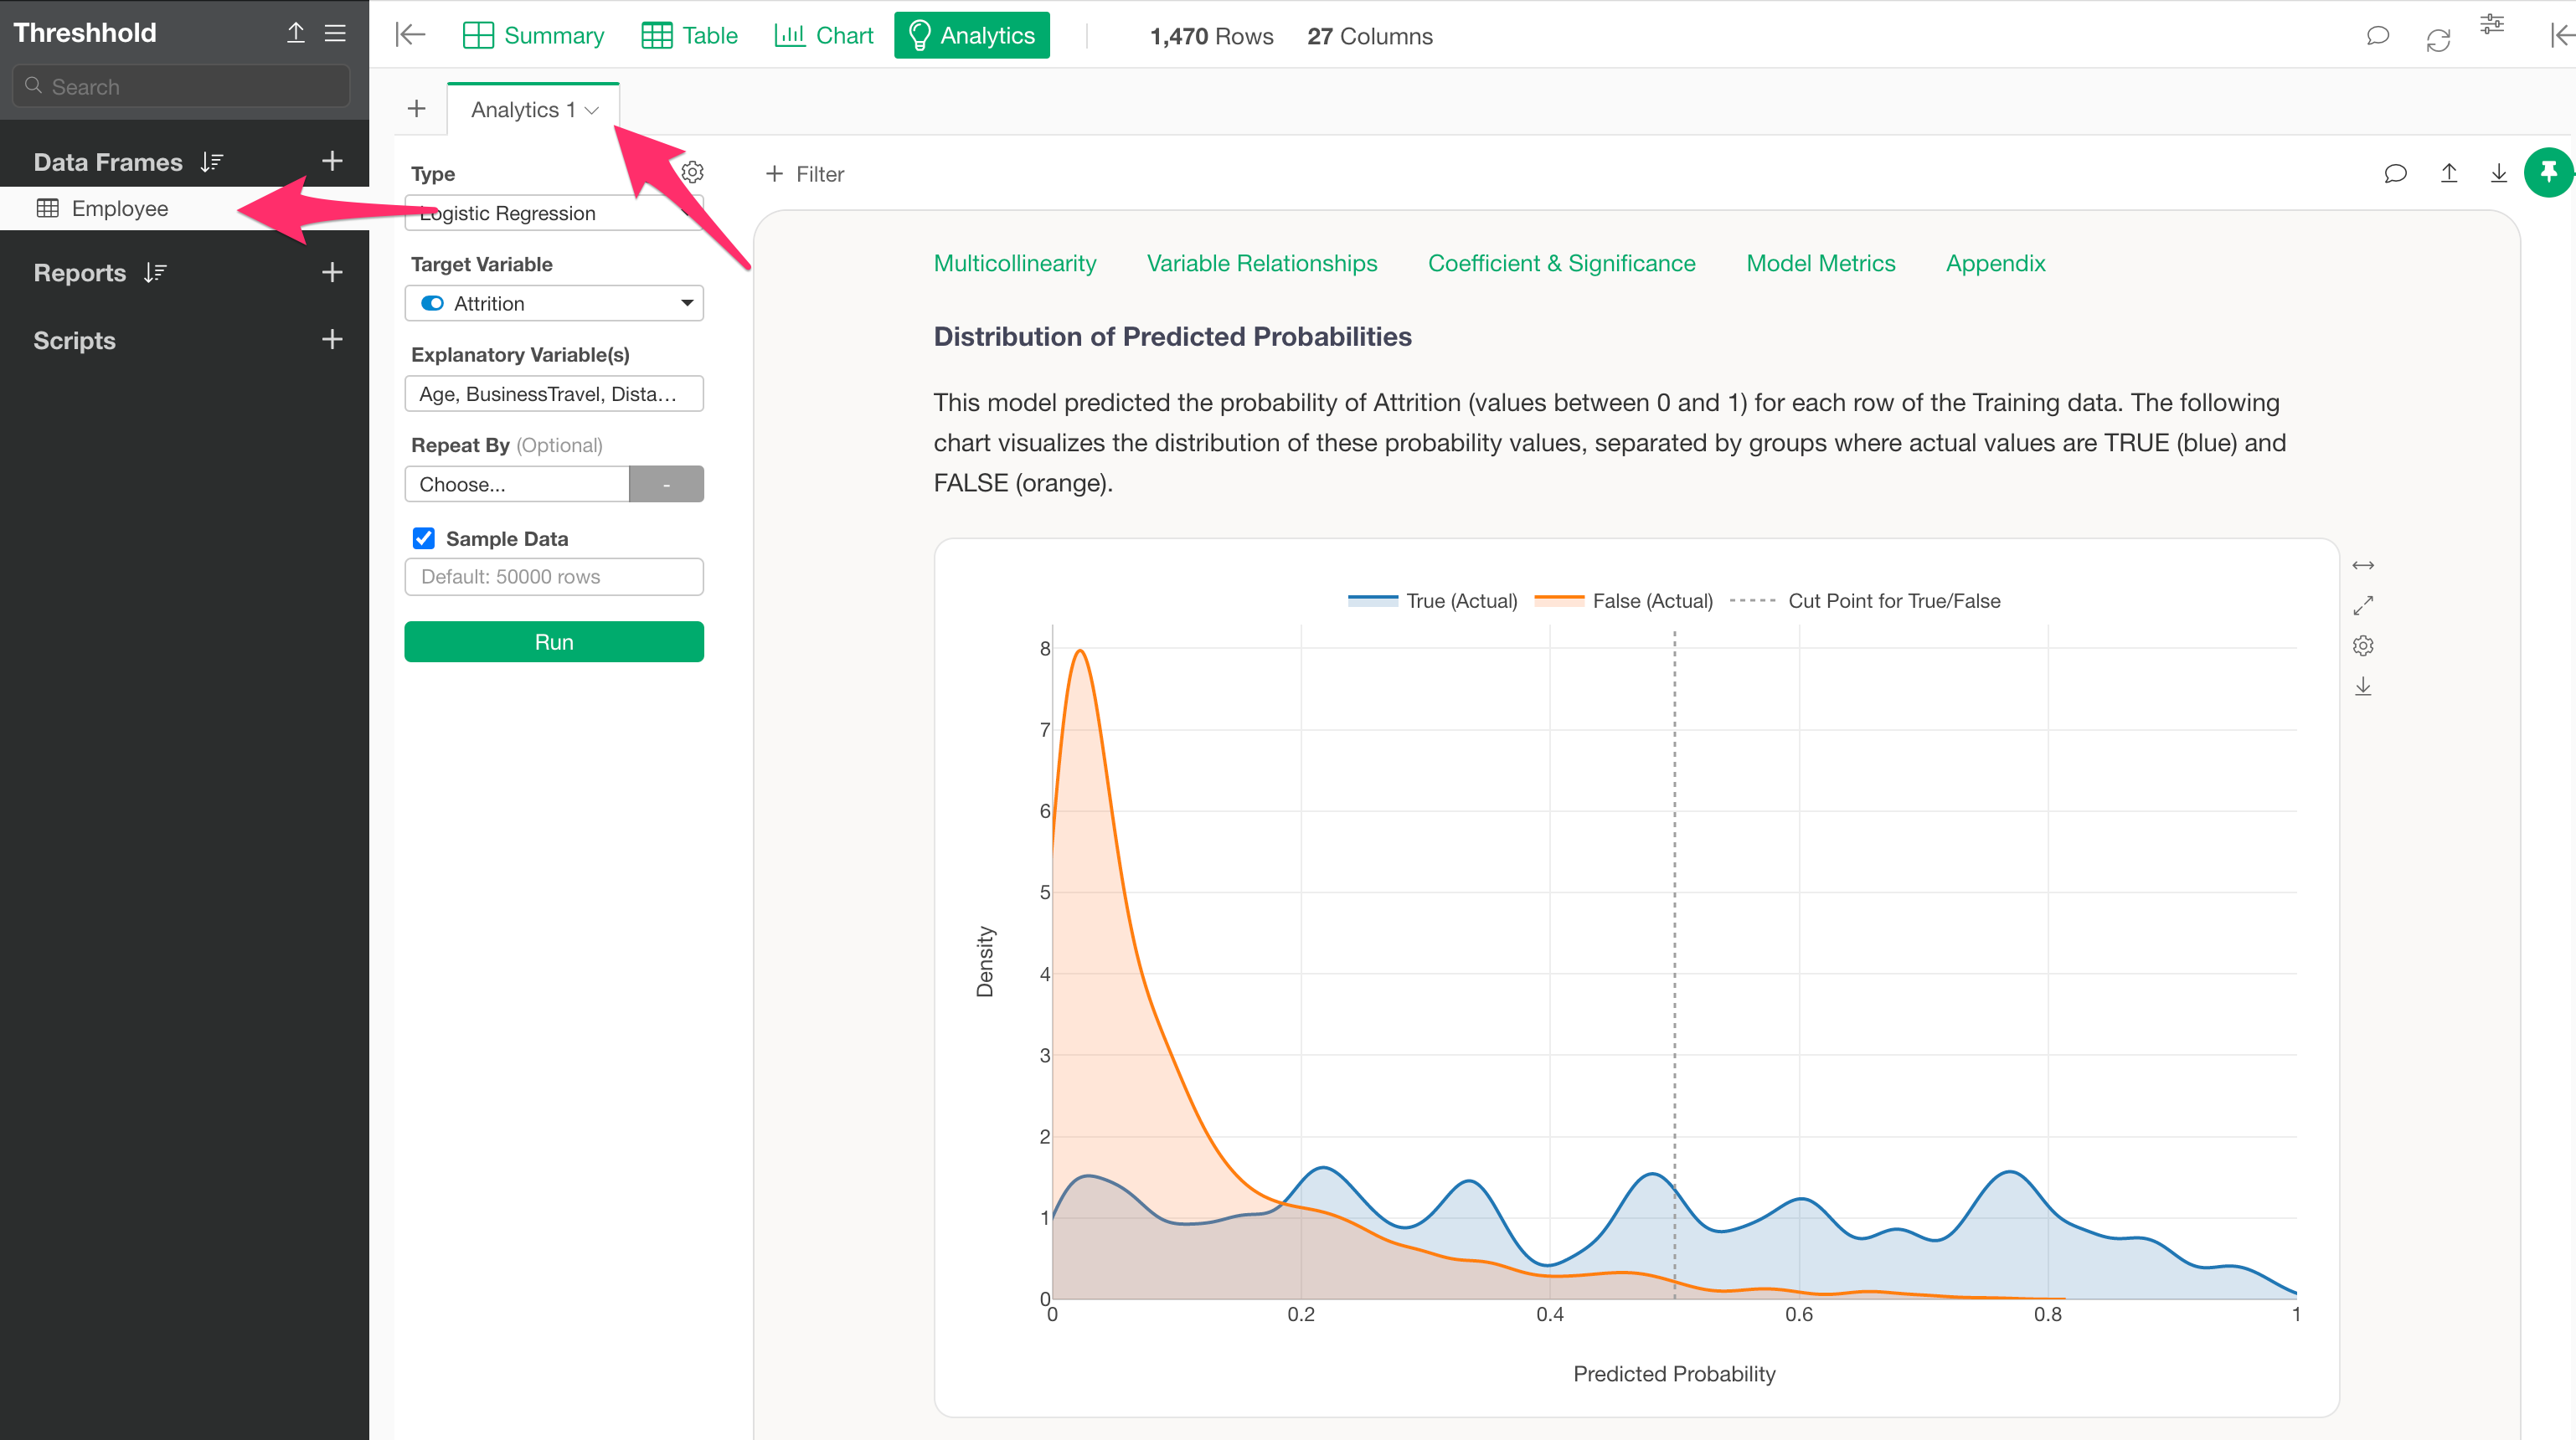
For example, the chart above visualizes the distribution of predicted probabilities for employee attrition in a Logistic Regression model, separated by whether the actual data was TRUE (blue) or FALSE (orange), using a Density Curve.
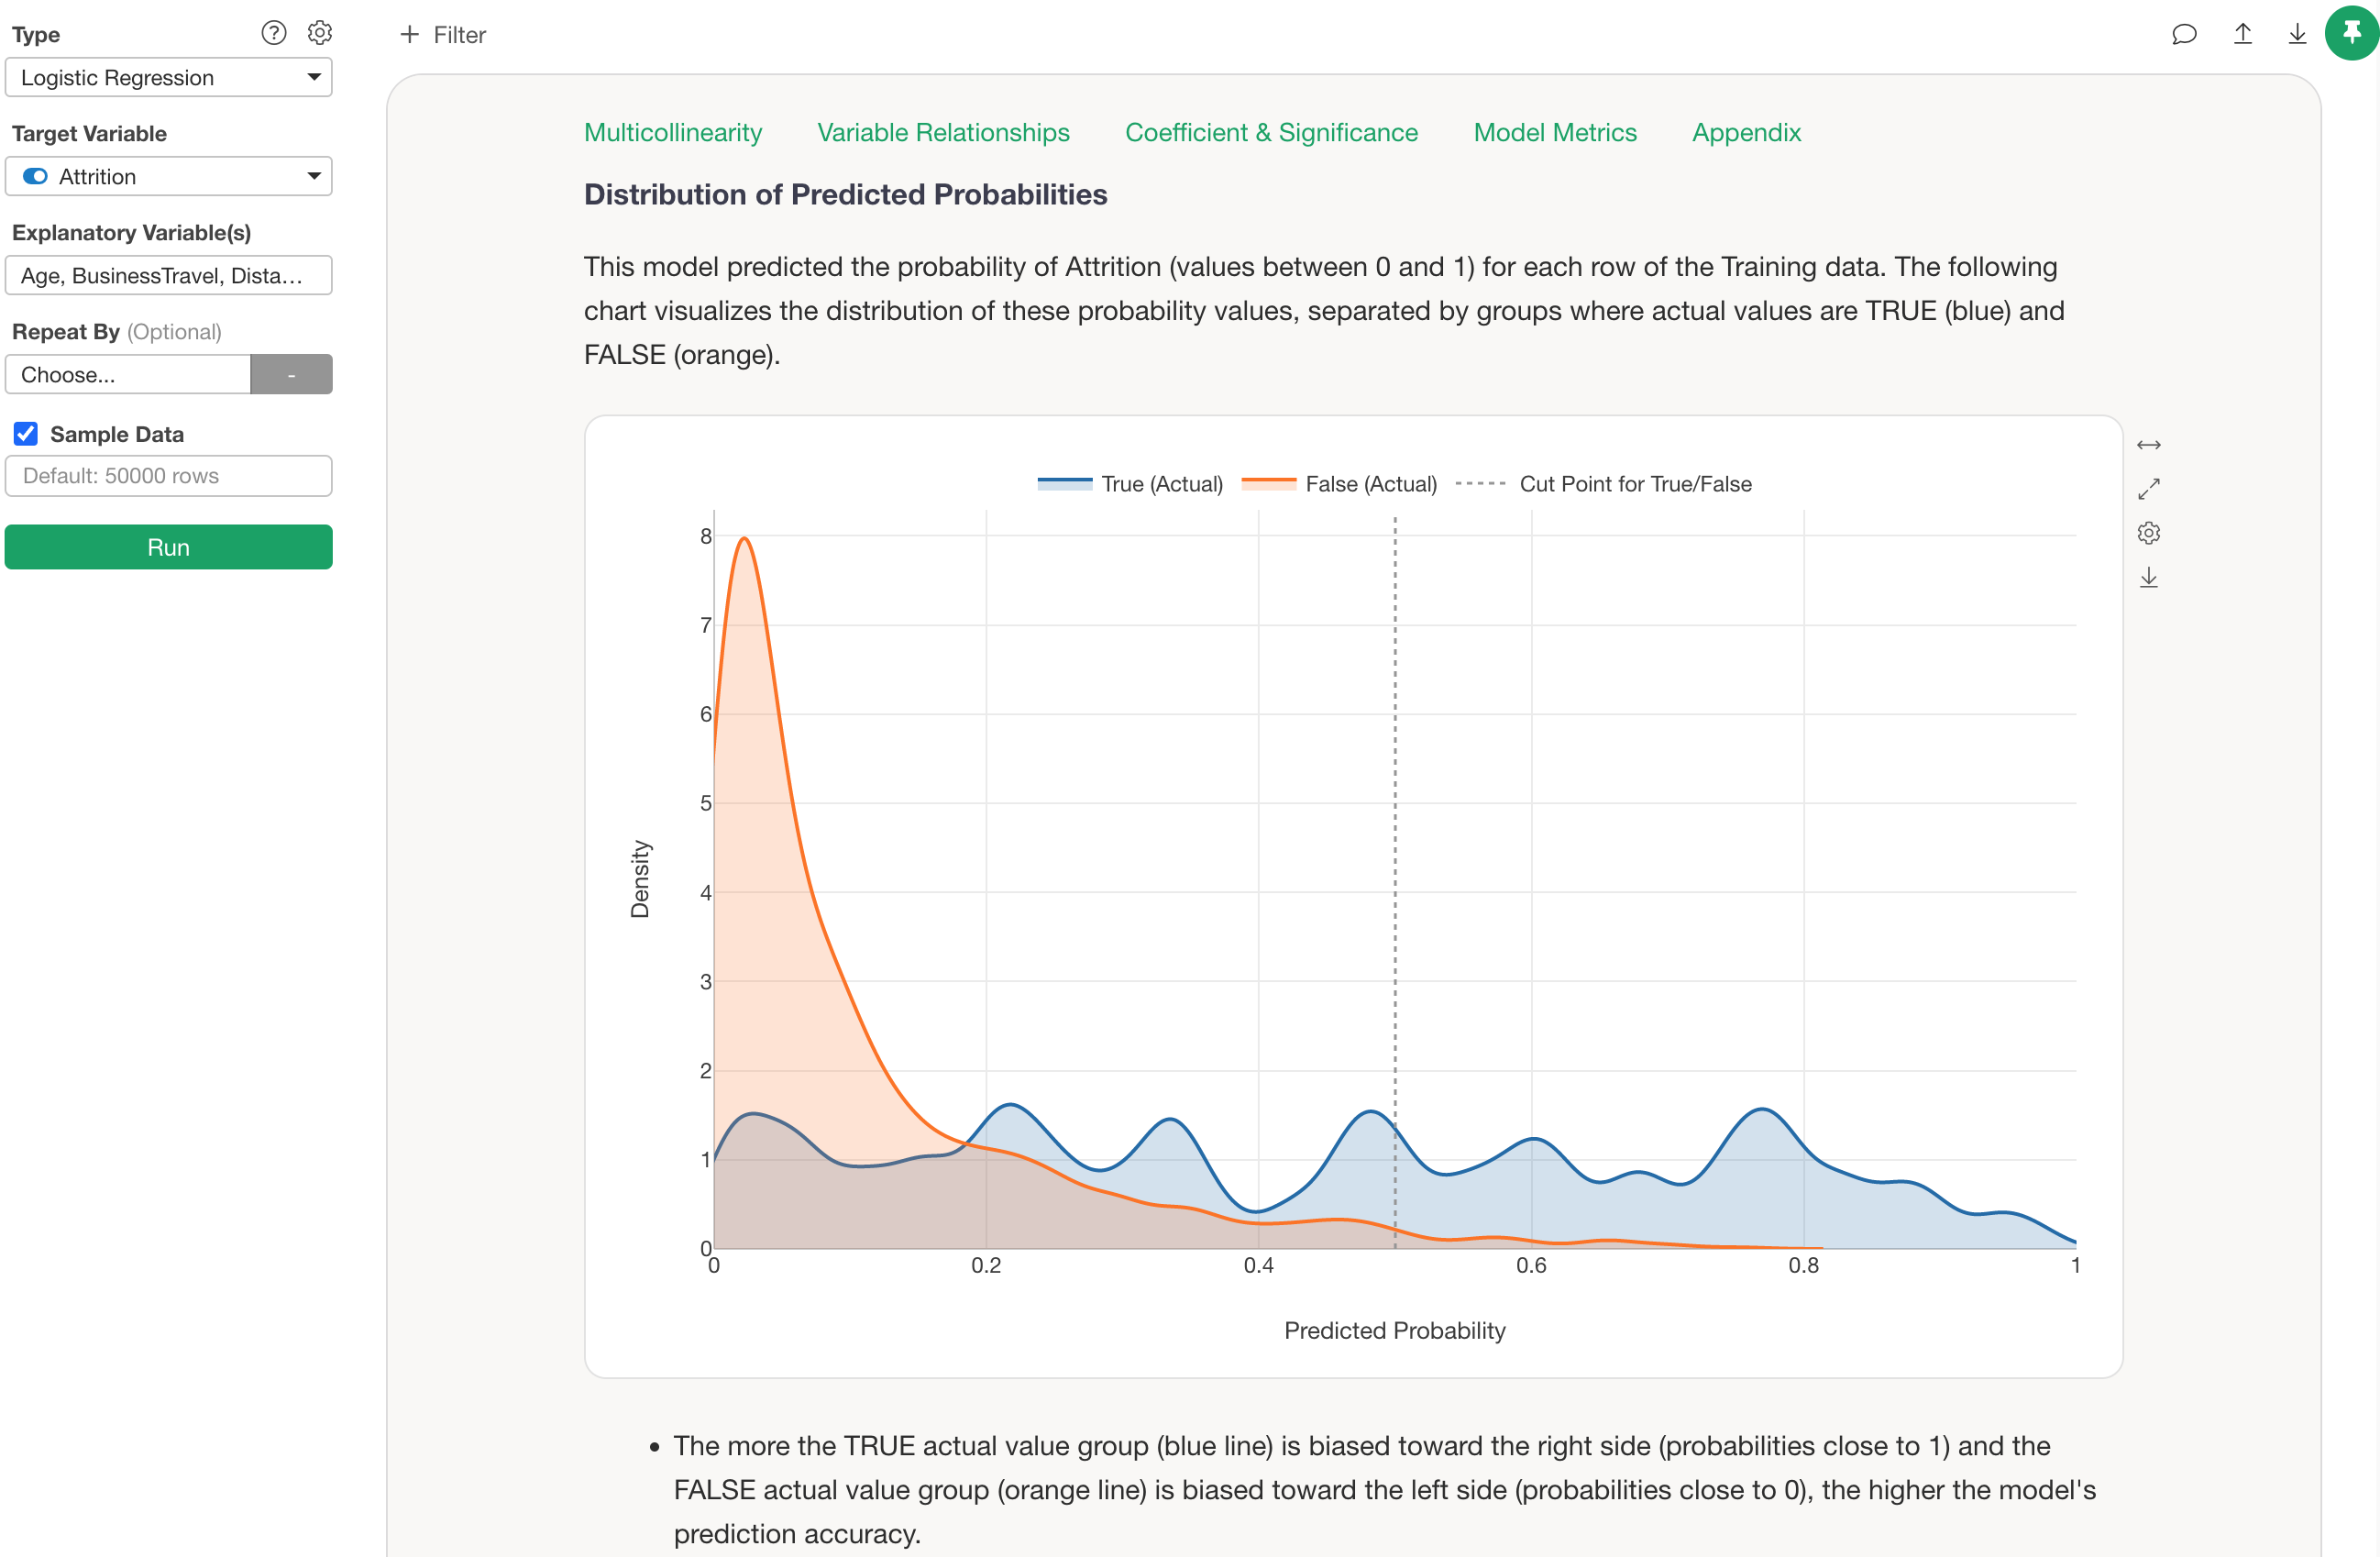
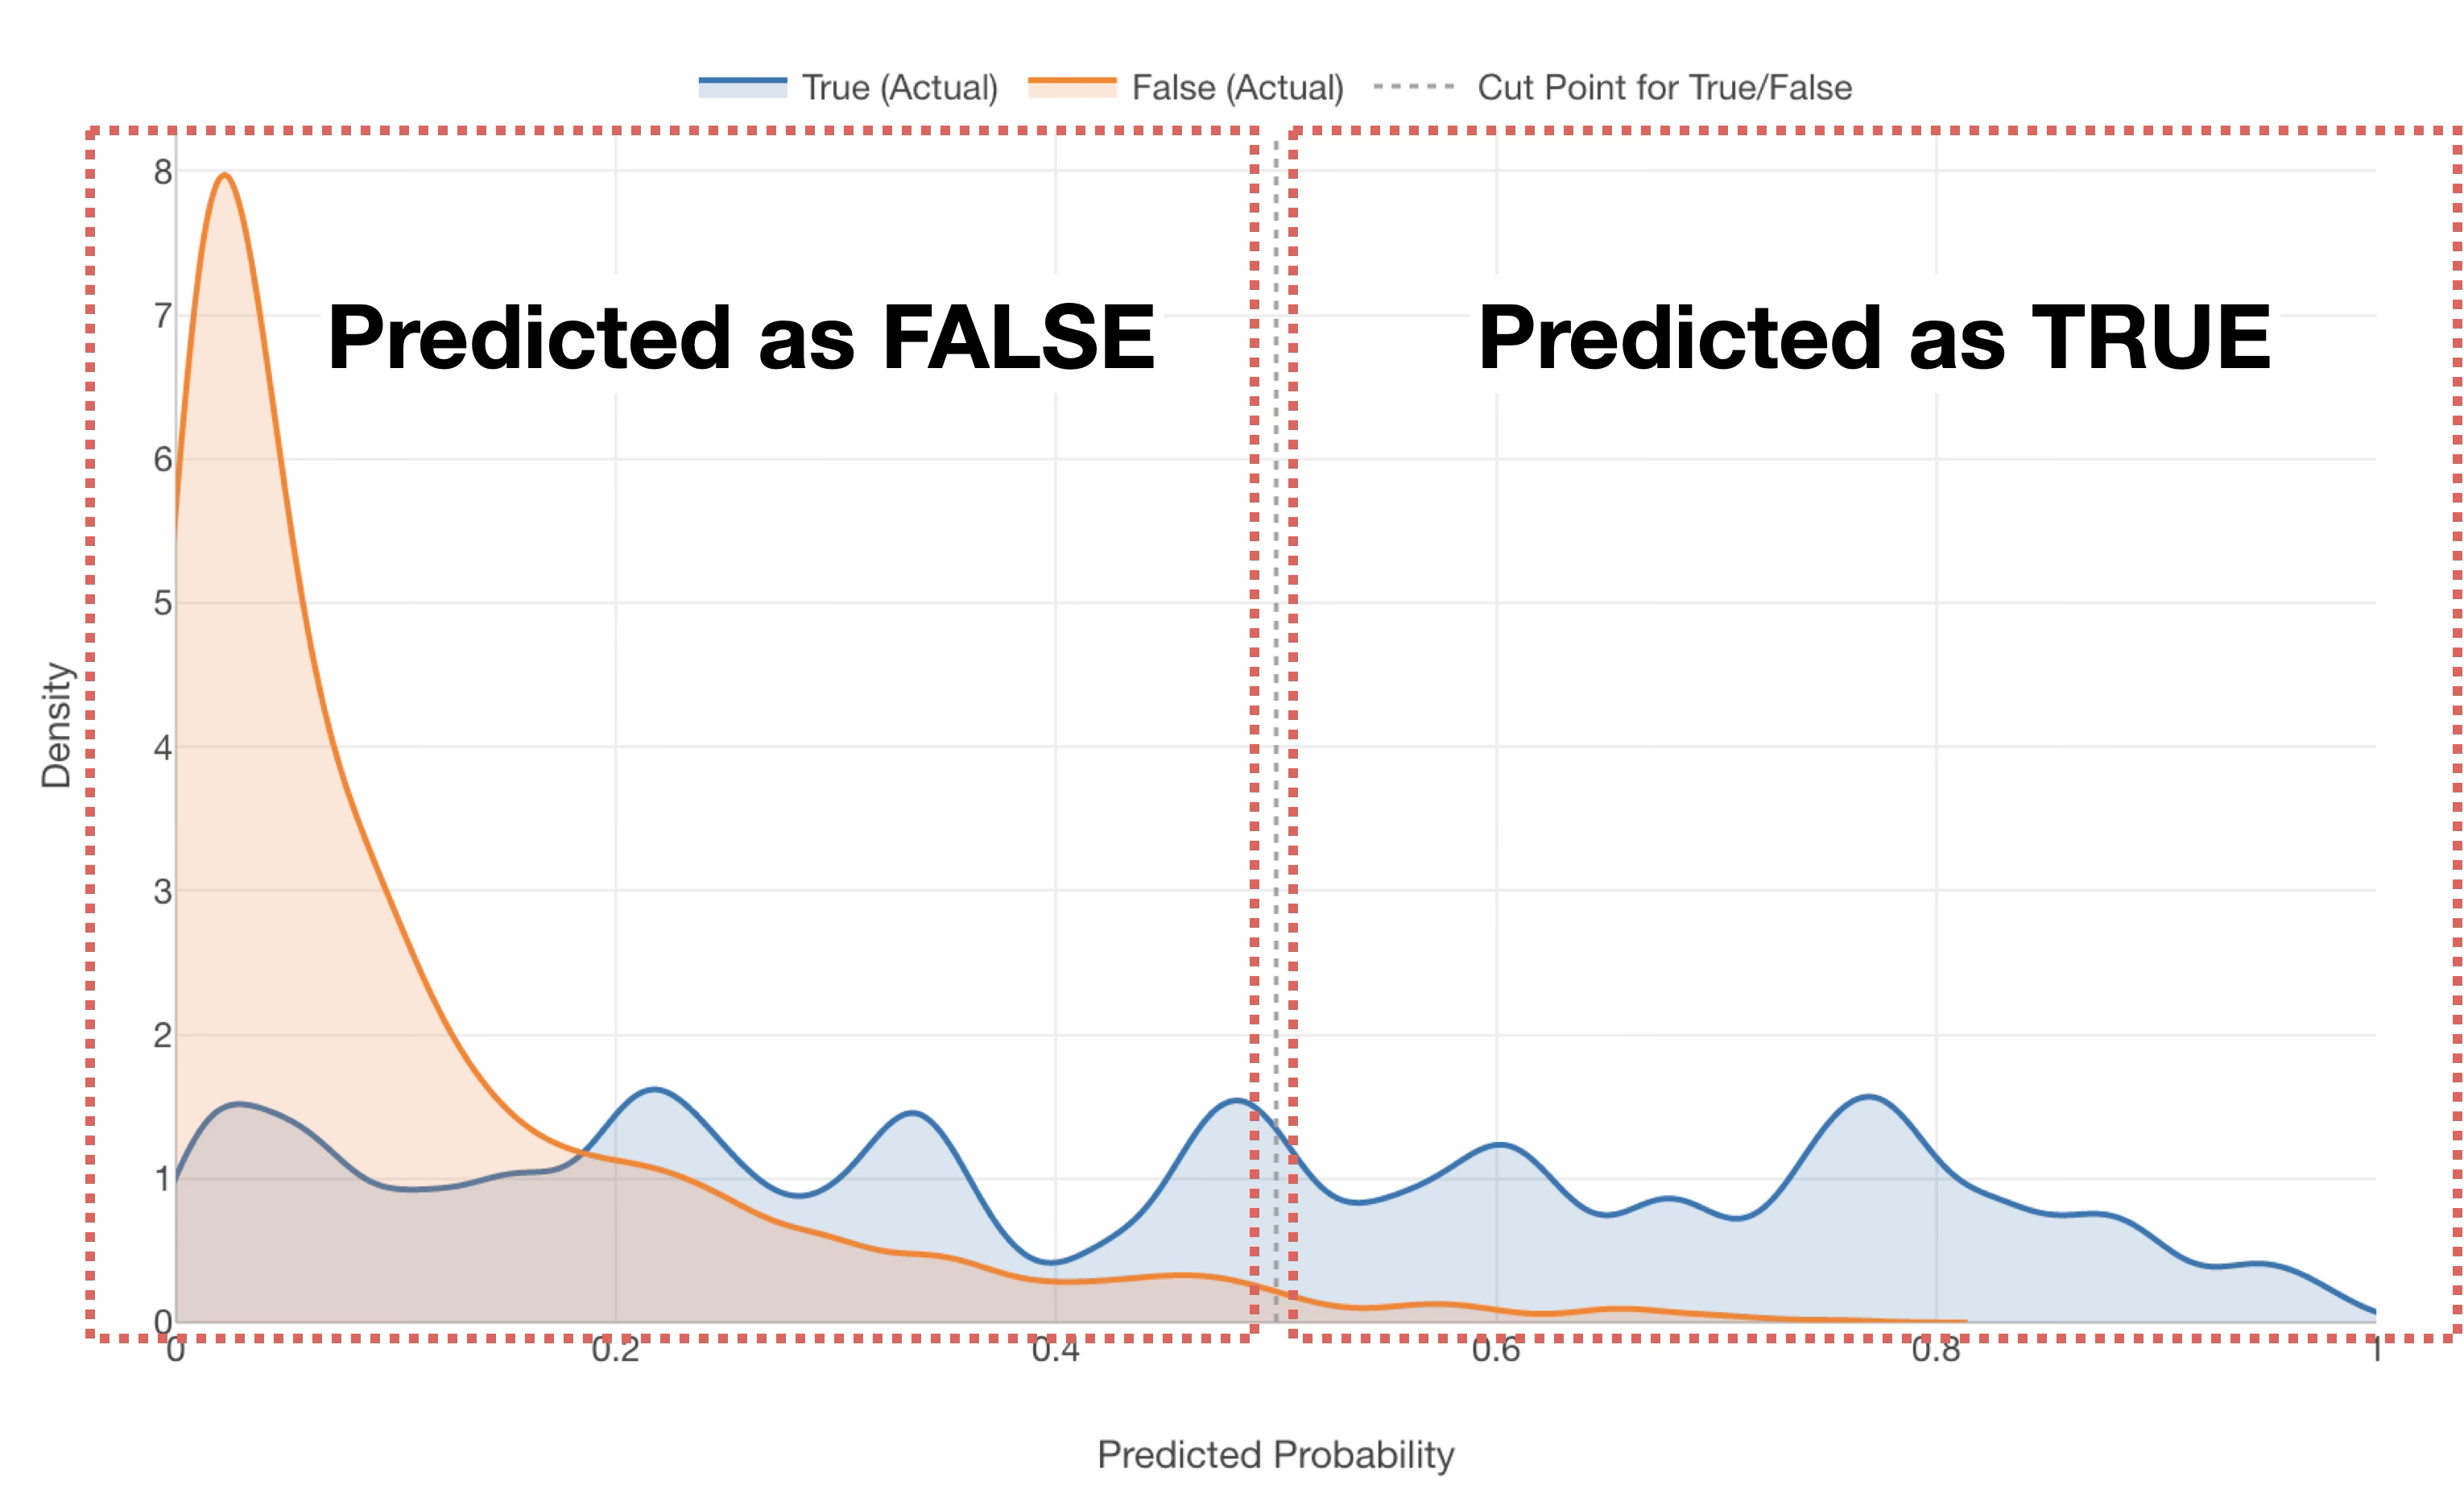
Since Exploratory’s default threshold is 0.5 (50%), any data with a “probability of being TRUE” of 0.5 (50%) or higher will be predicted as TRUE, regardless of whether the employee actually left.
However, in reality, you can see that many TRUE data points are included in the range where the probability of being TRUE is between 0.2 (20%) and 0.5 (50%)—data that would currently be predicted as FALSE.
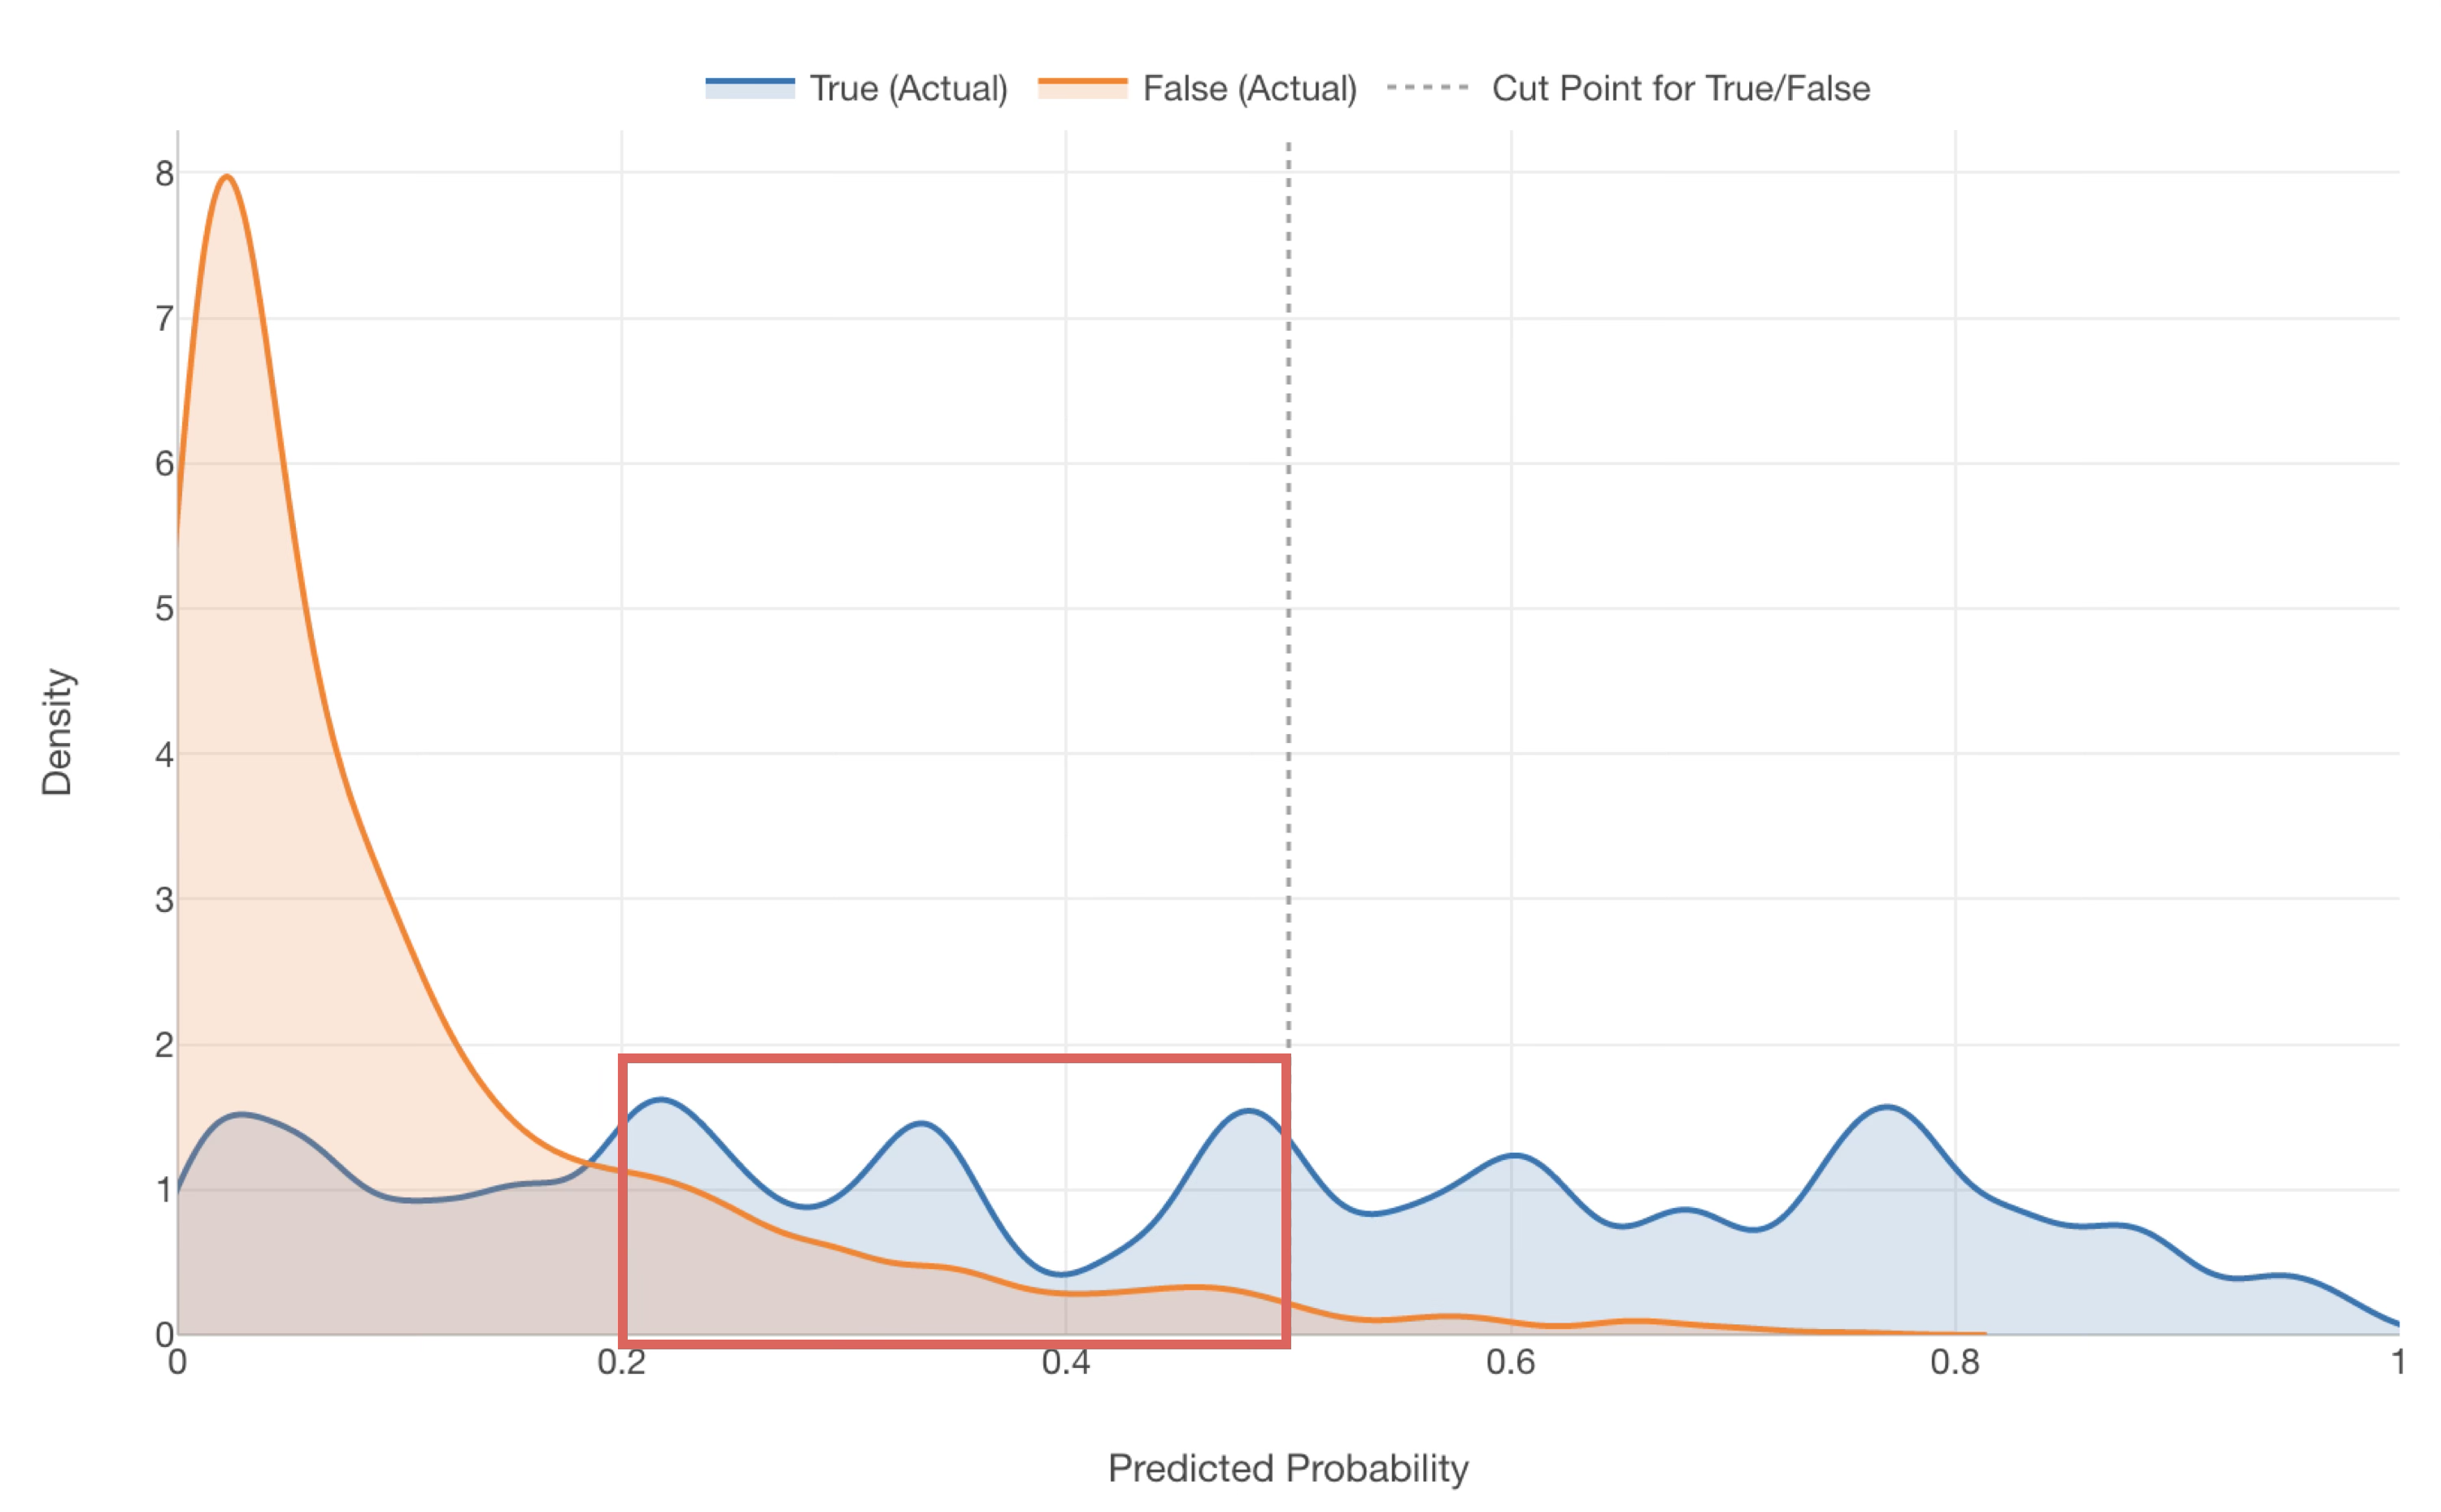
For such a model, setting the threshold for TRUE at around 0.2 (20%) rather than 0.5 (50%) might result in a more balanced prediction of TRUE and FALSE.
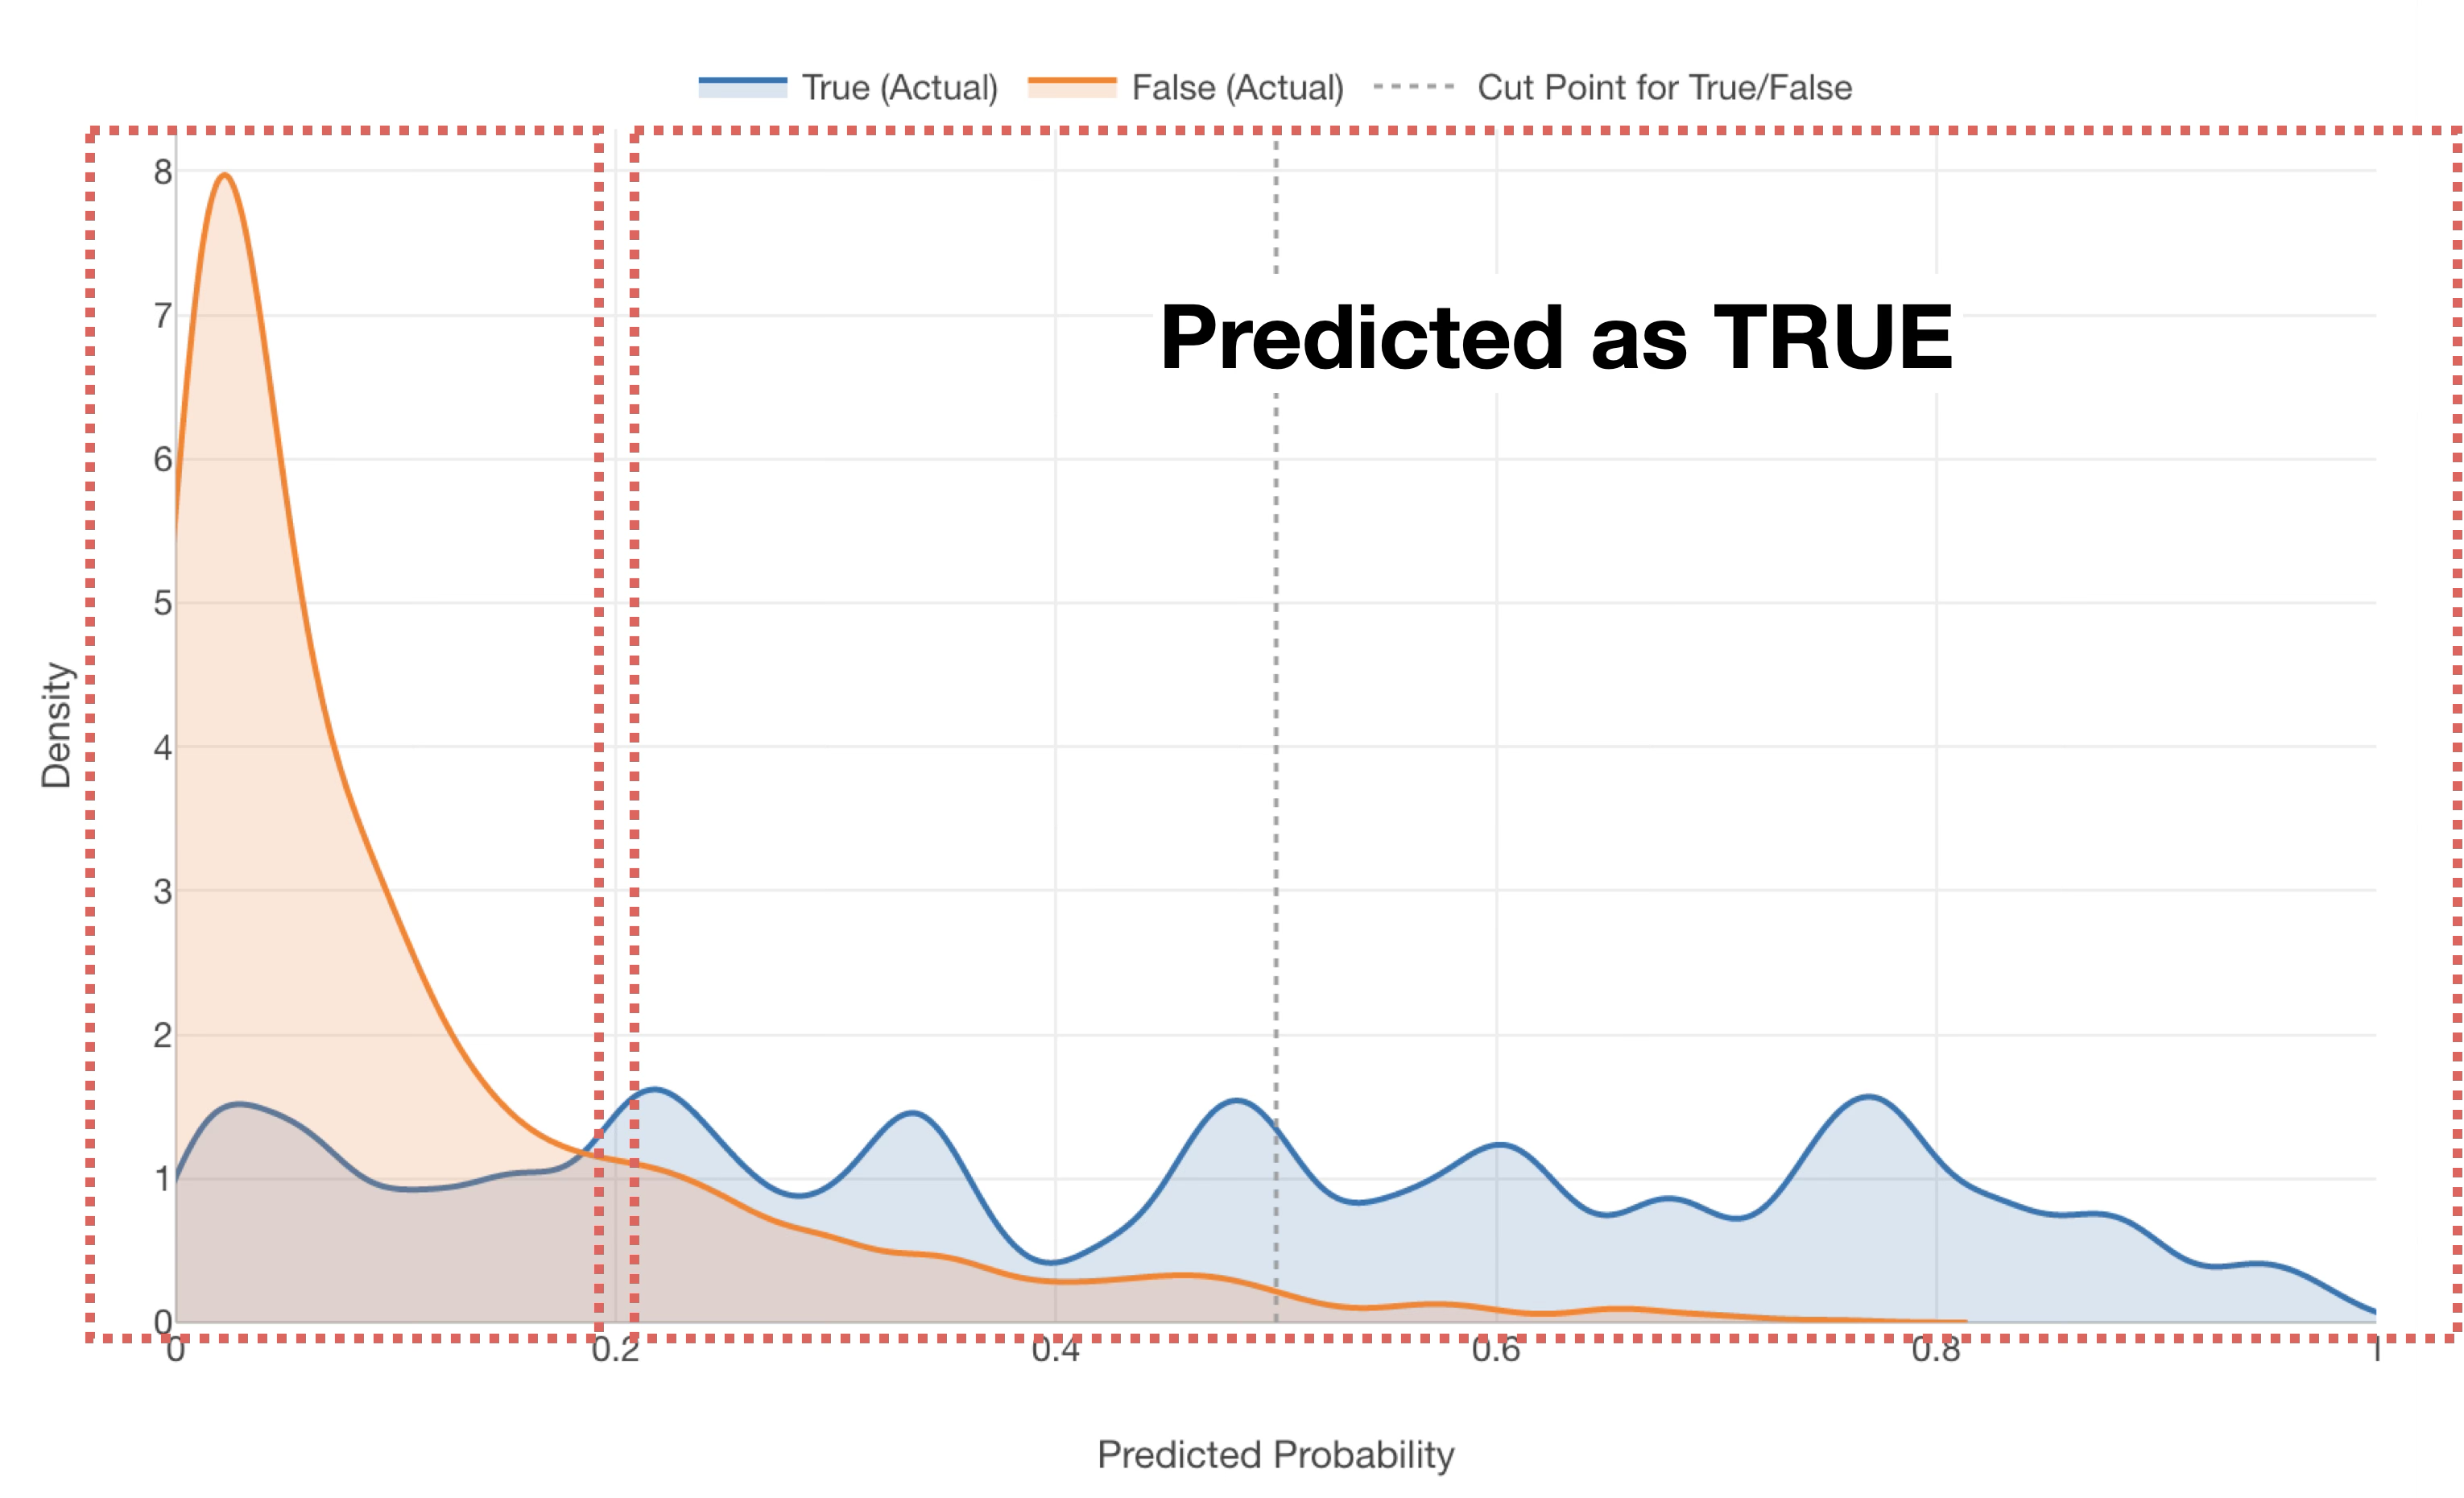
However, when actually deciding on a threshold, it is difficult to judge visually whether it should be 0.2 (20%) or 0.3 (30%).
Therefore, this note introduces how to determine the optimal threshold for deciding predicted values.
Prerequisite: Data and Model Used
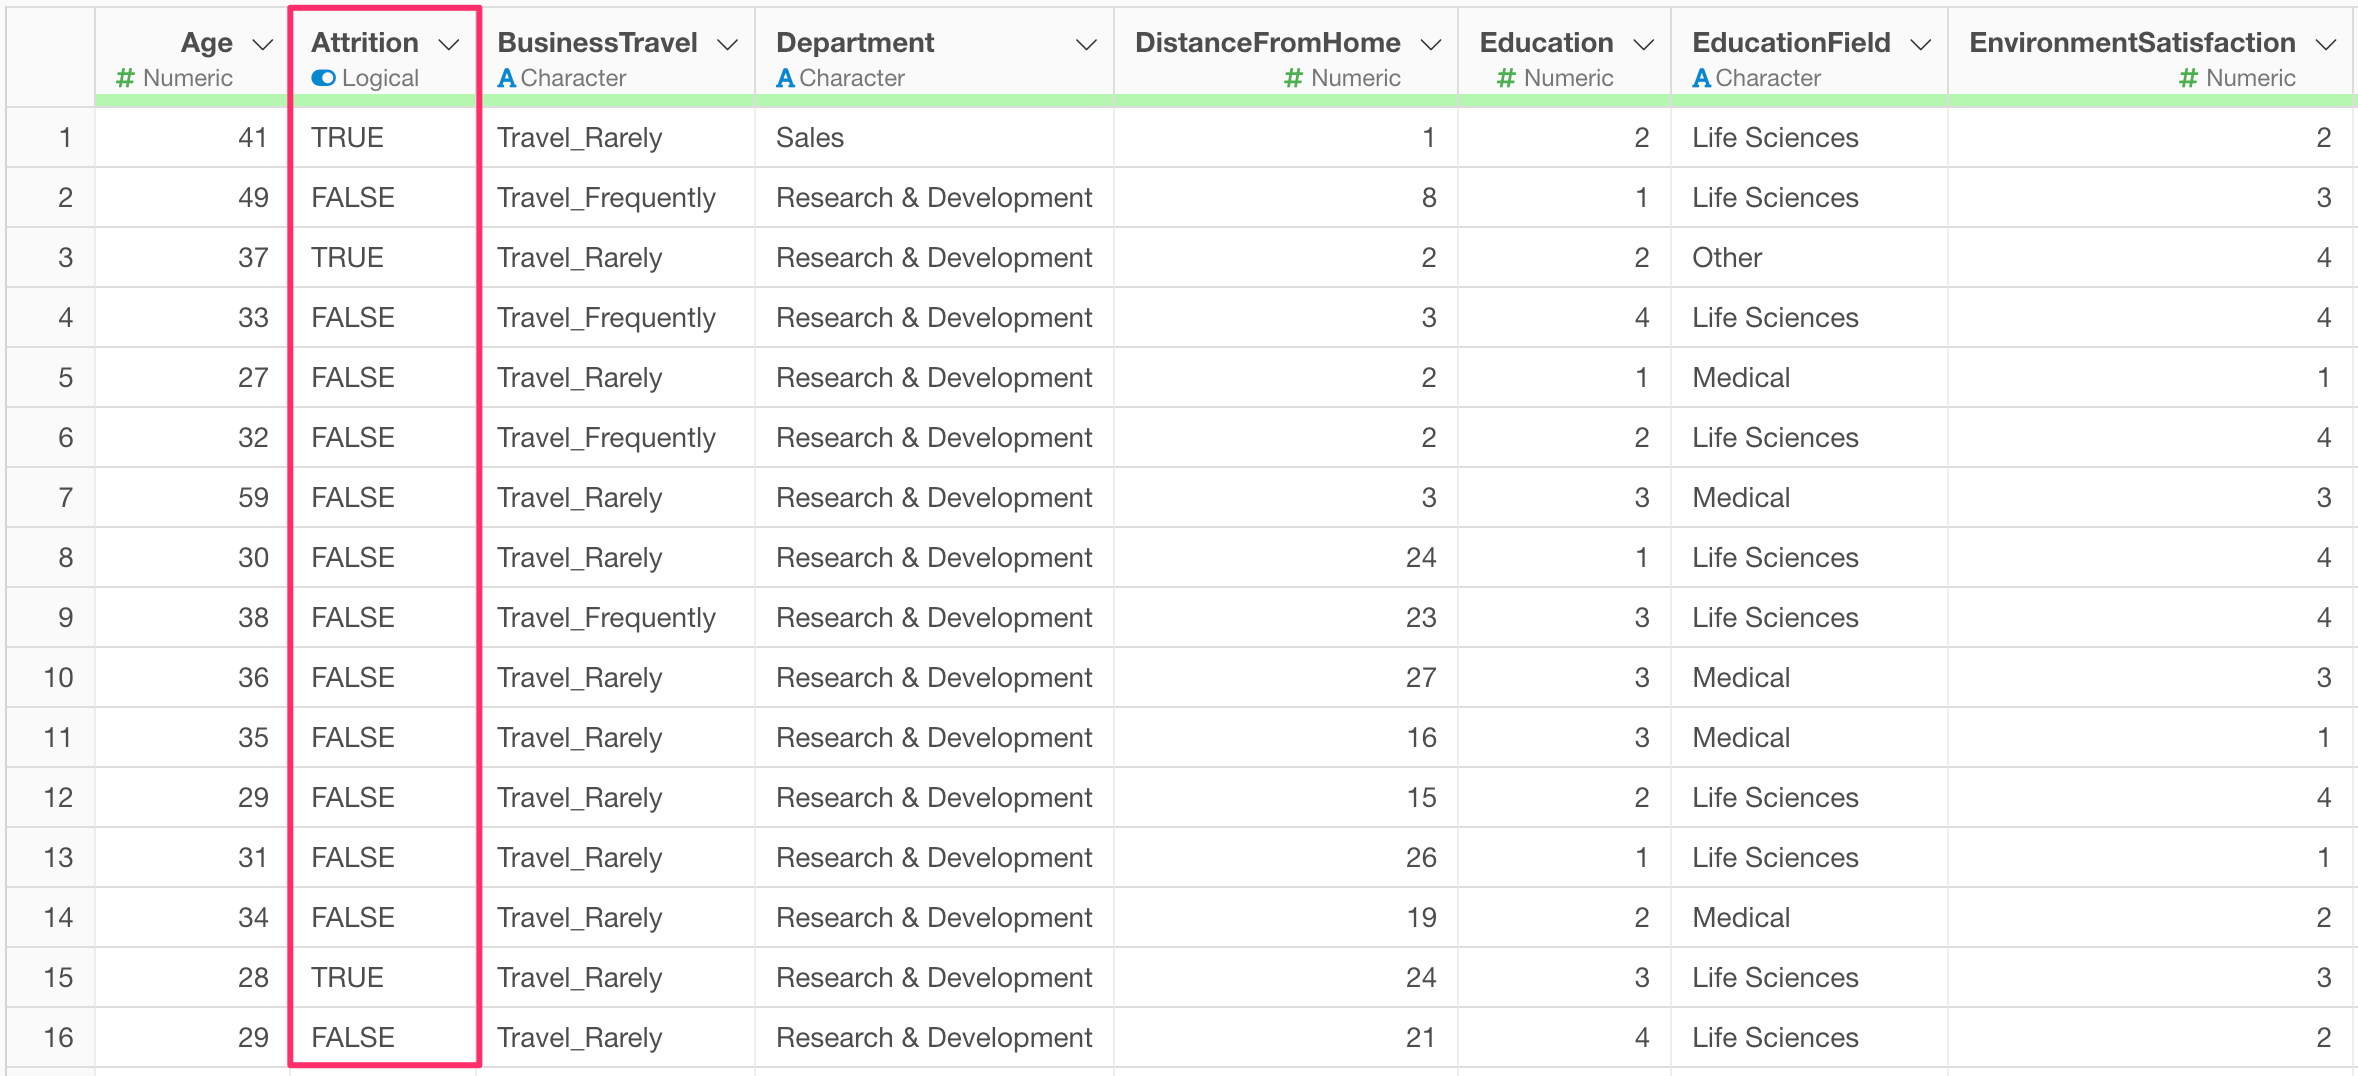
In this example, we will use employee data. Each row represents one employee, and columns include attributes such as age, department, and attrition.
We will proceed assuming that a Logistic Regression model to predict employee “Attrition” has already been built using the “Employee” data frame mentioned above.
Determining the Optimal Threshold for a Built Model
As of the current version of Exploratory Desktop (v10.7), it is not yet supported to reuse the data frame used for building a model in the Analytics view directly to check for the optimal threshold. Therefore, follow these steps to determine the optimal threshold:
- Use a branch to prepare a data frame with the same content as the one used for model building.
- Add a “Prediction” step using the data frame prepared in step 1.
- Determine the optimal threshold.
1. Use a branch to prepare a data frame with the same content as the one used for model building
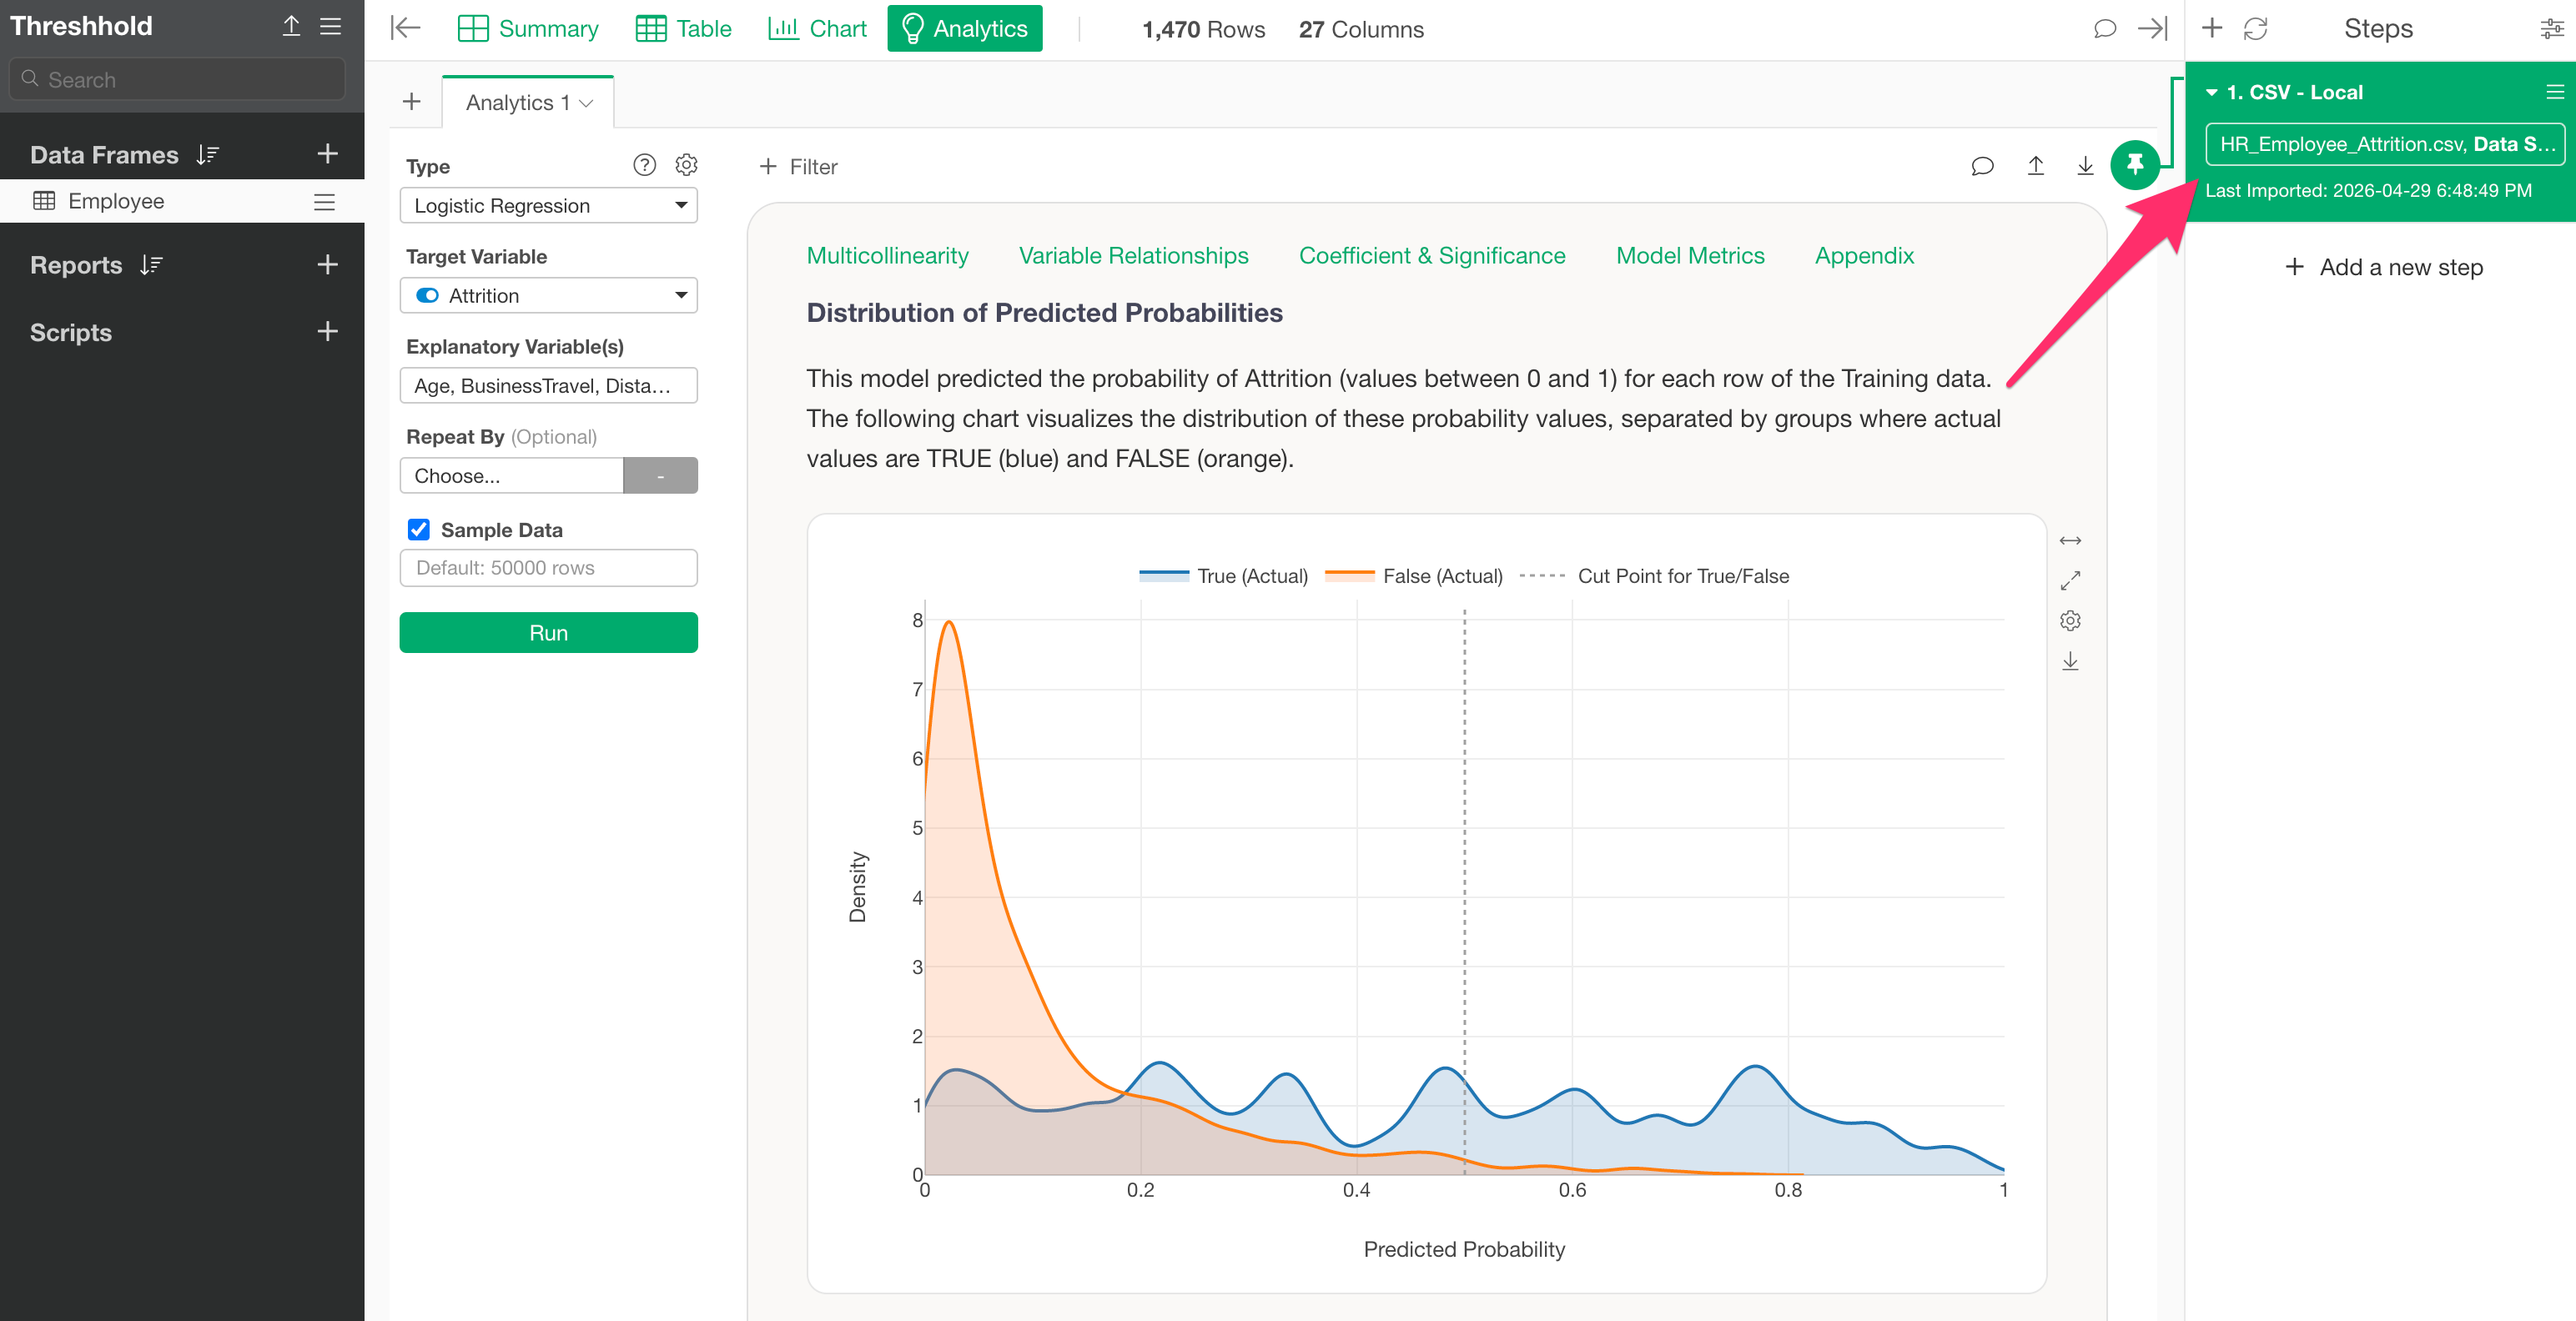
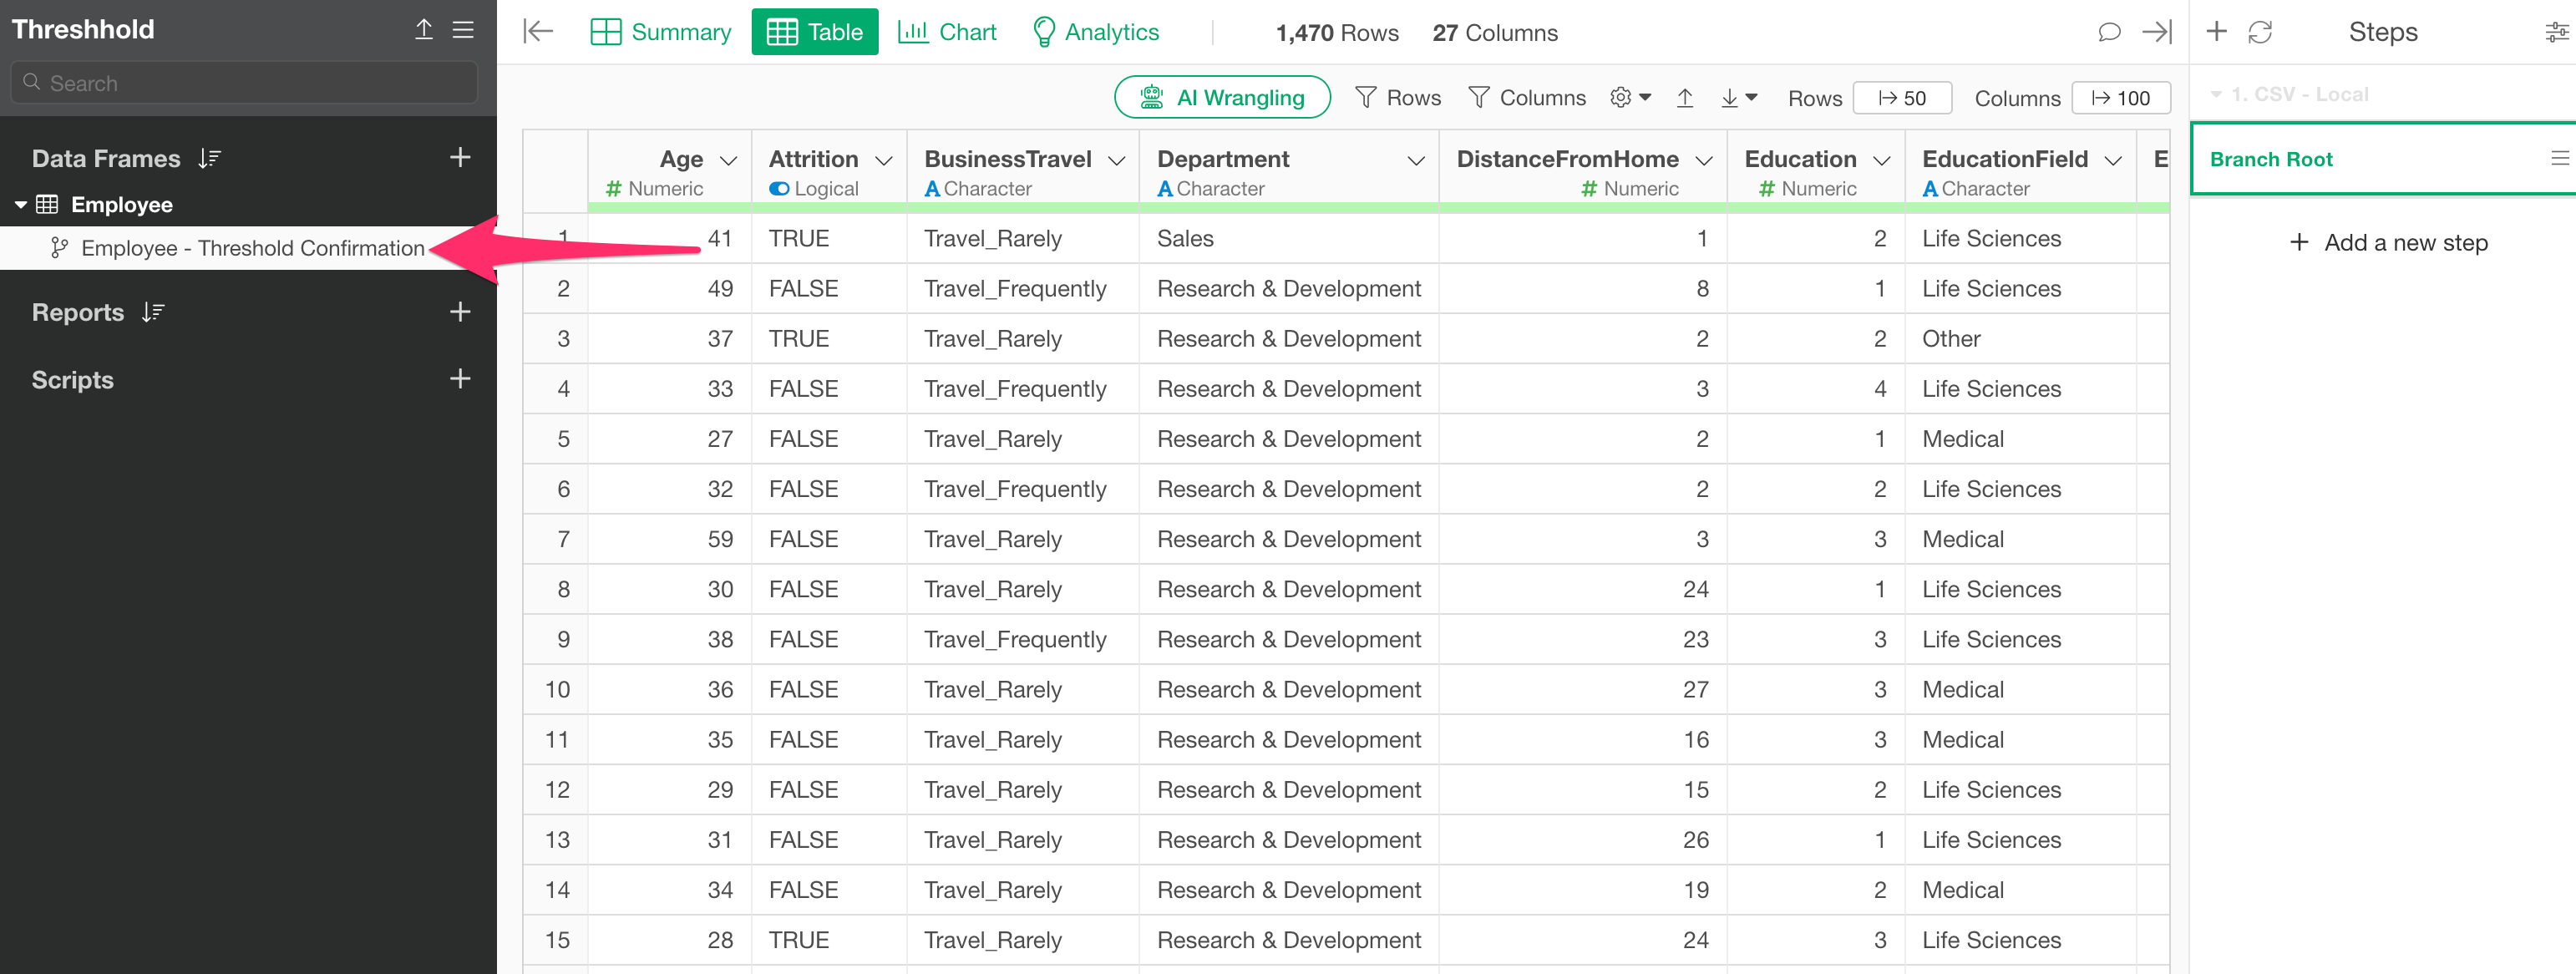
First, move to the step where you built the model for which you want to check the threshold.
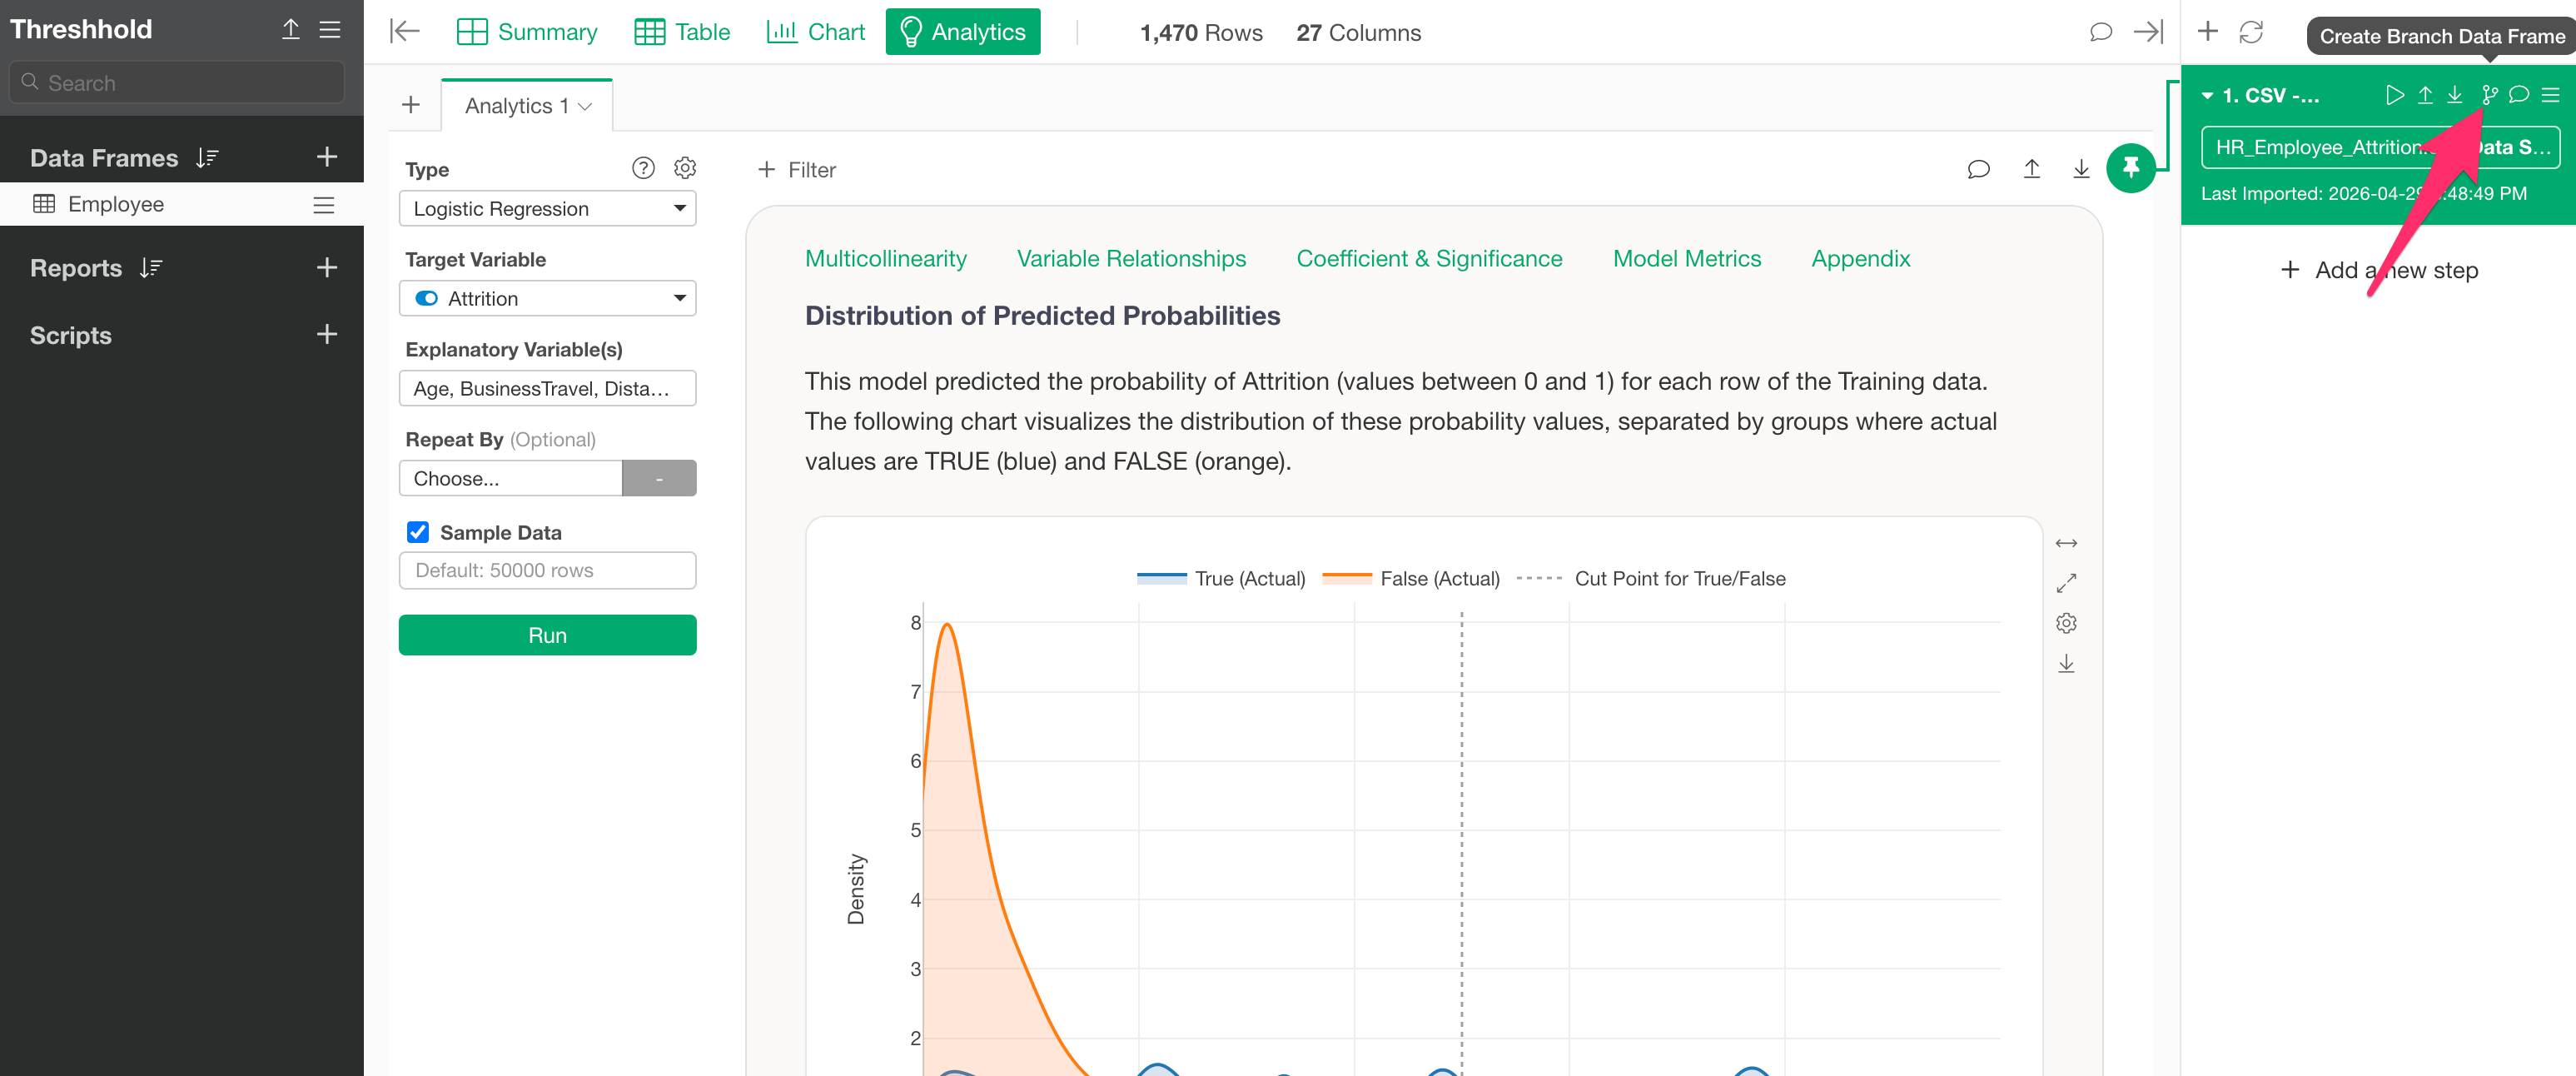
Next, click the Branch icon on the step and click the “Create Branch” button.
Specify a branch name and confirm the creation of the branch.
2. Add a “Prediction” step
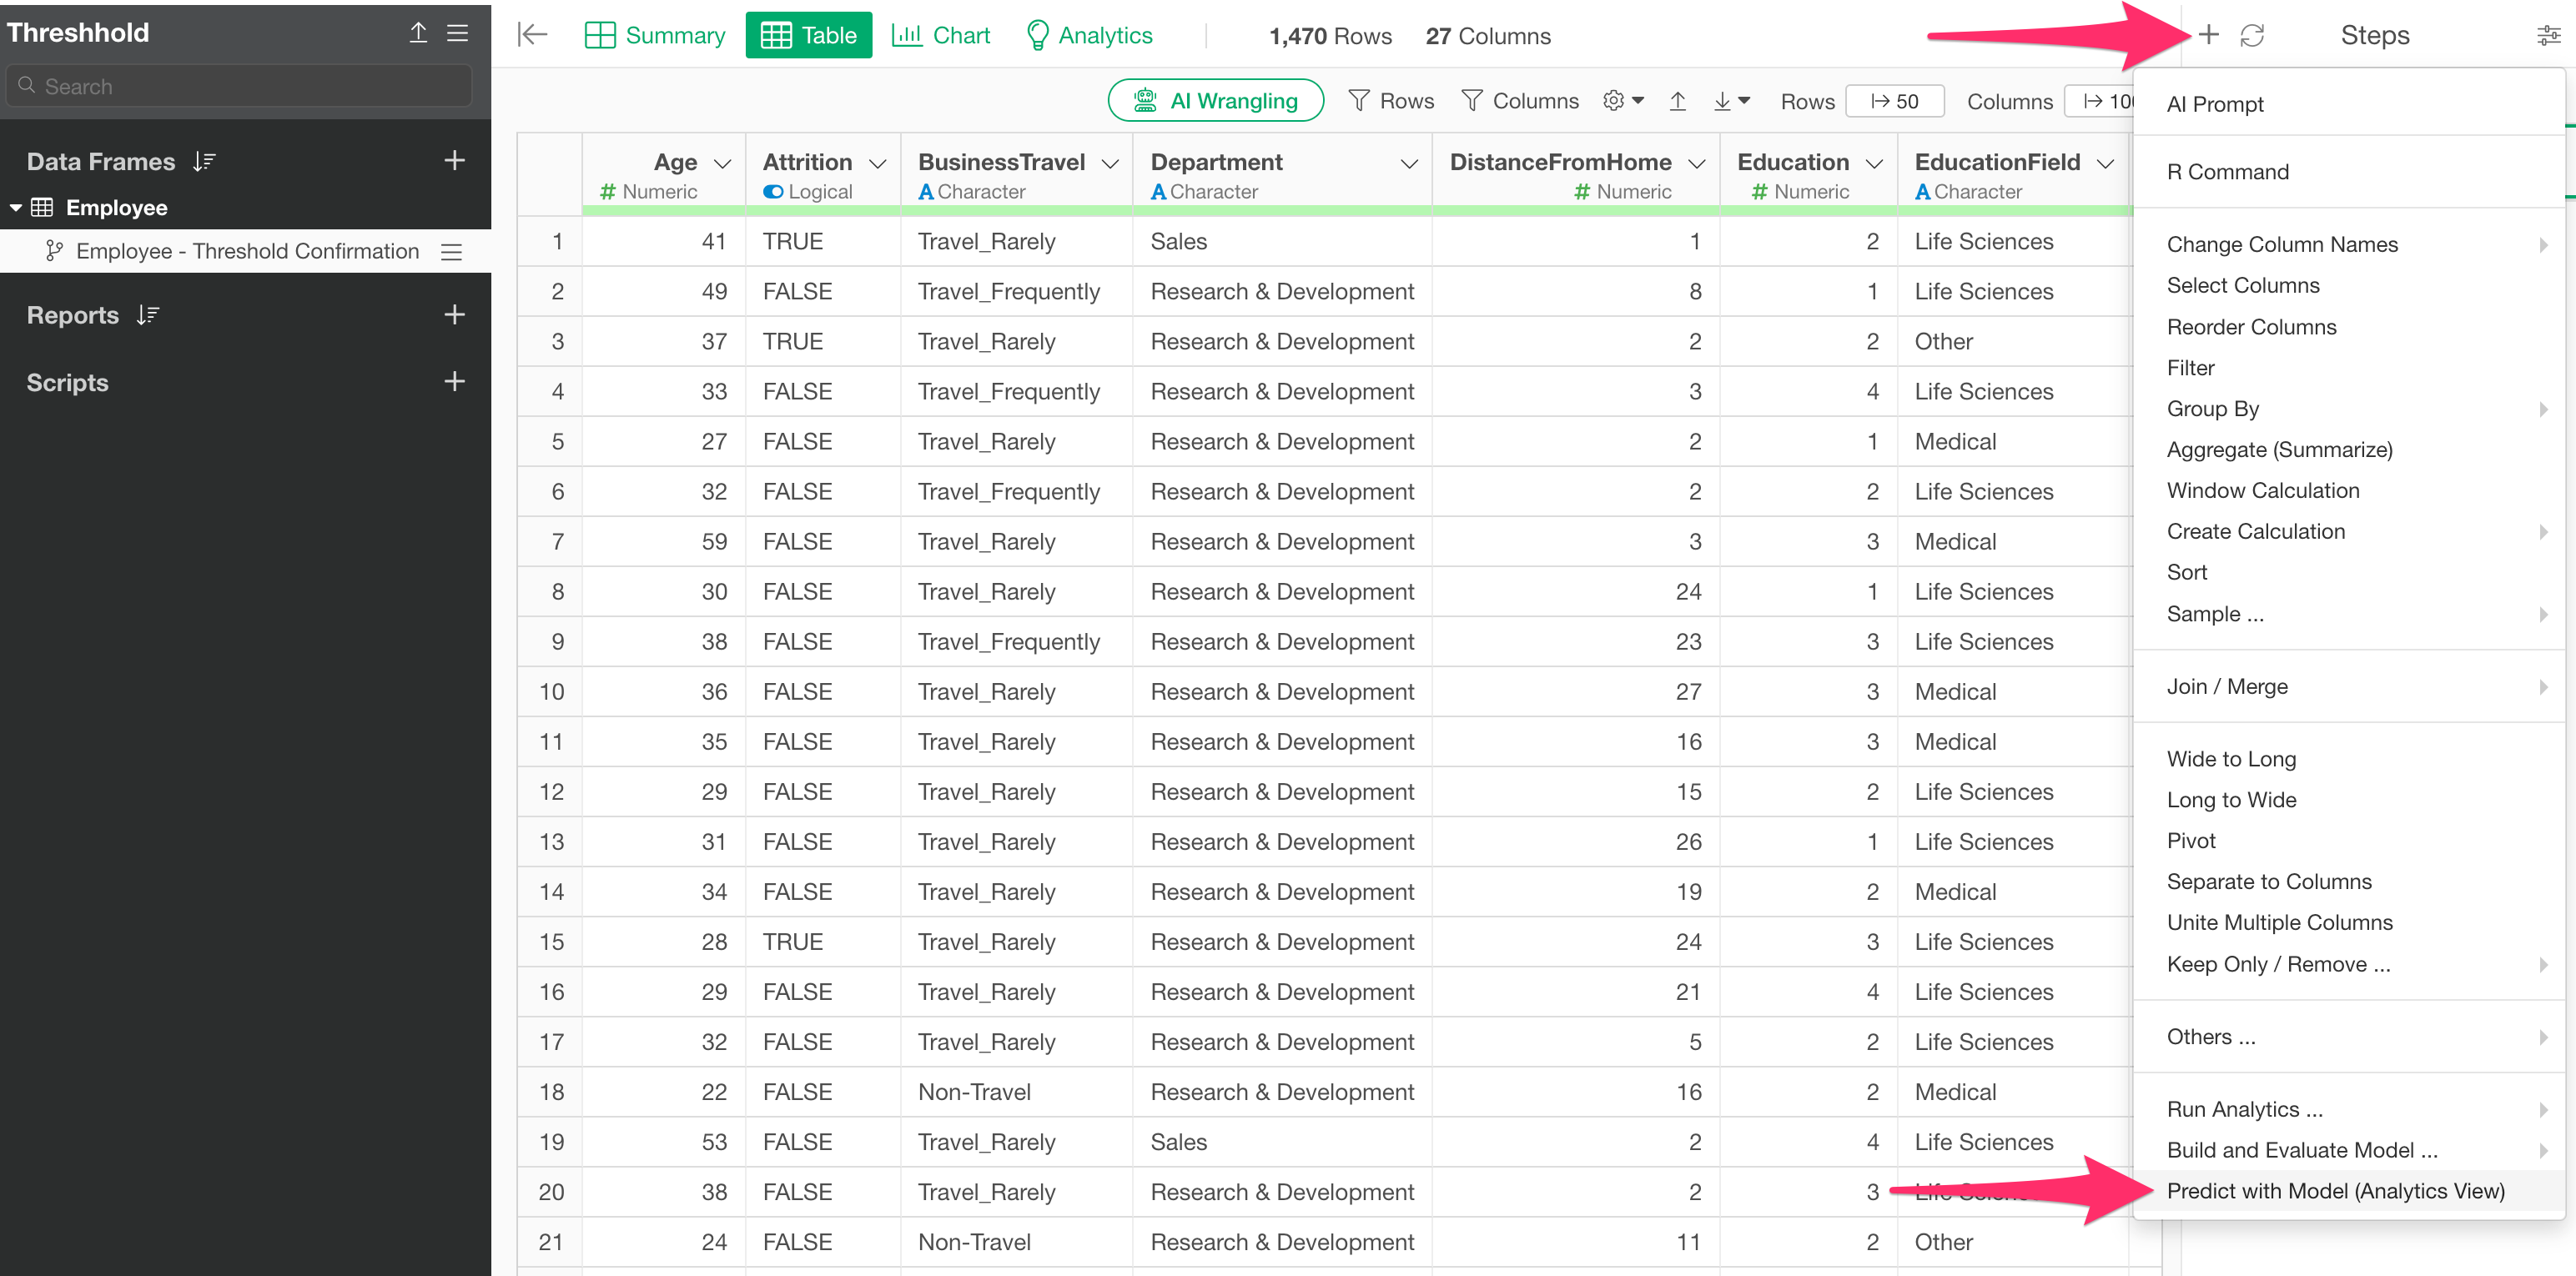
Next, from the step menu of the created branch, select “Predict with Model (Analytics View).”
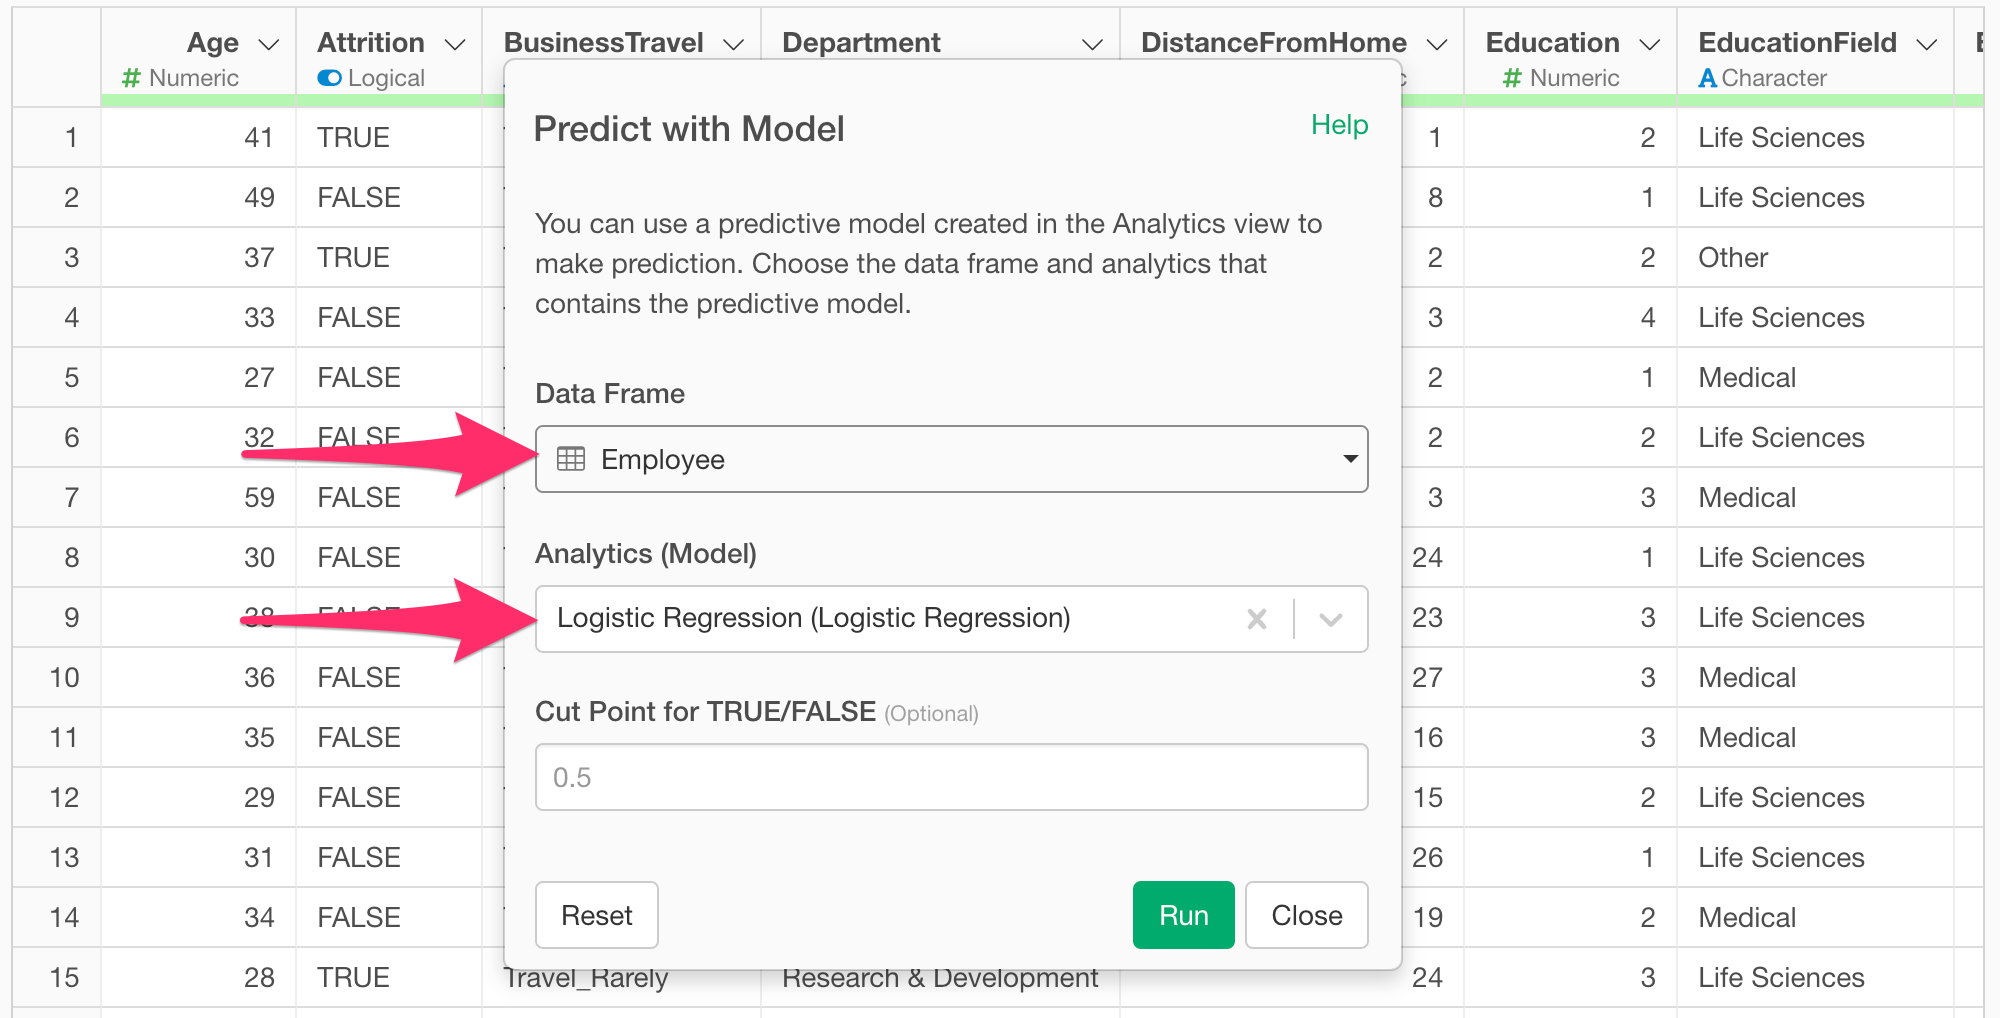
When the “Predict with Model” dialog appears, select the data frame where the prediction model was created, choose the model you want to use for prediction in “Analytics (Model),” and run it.
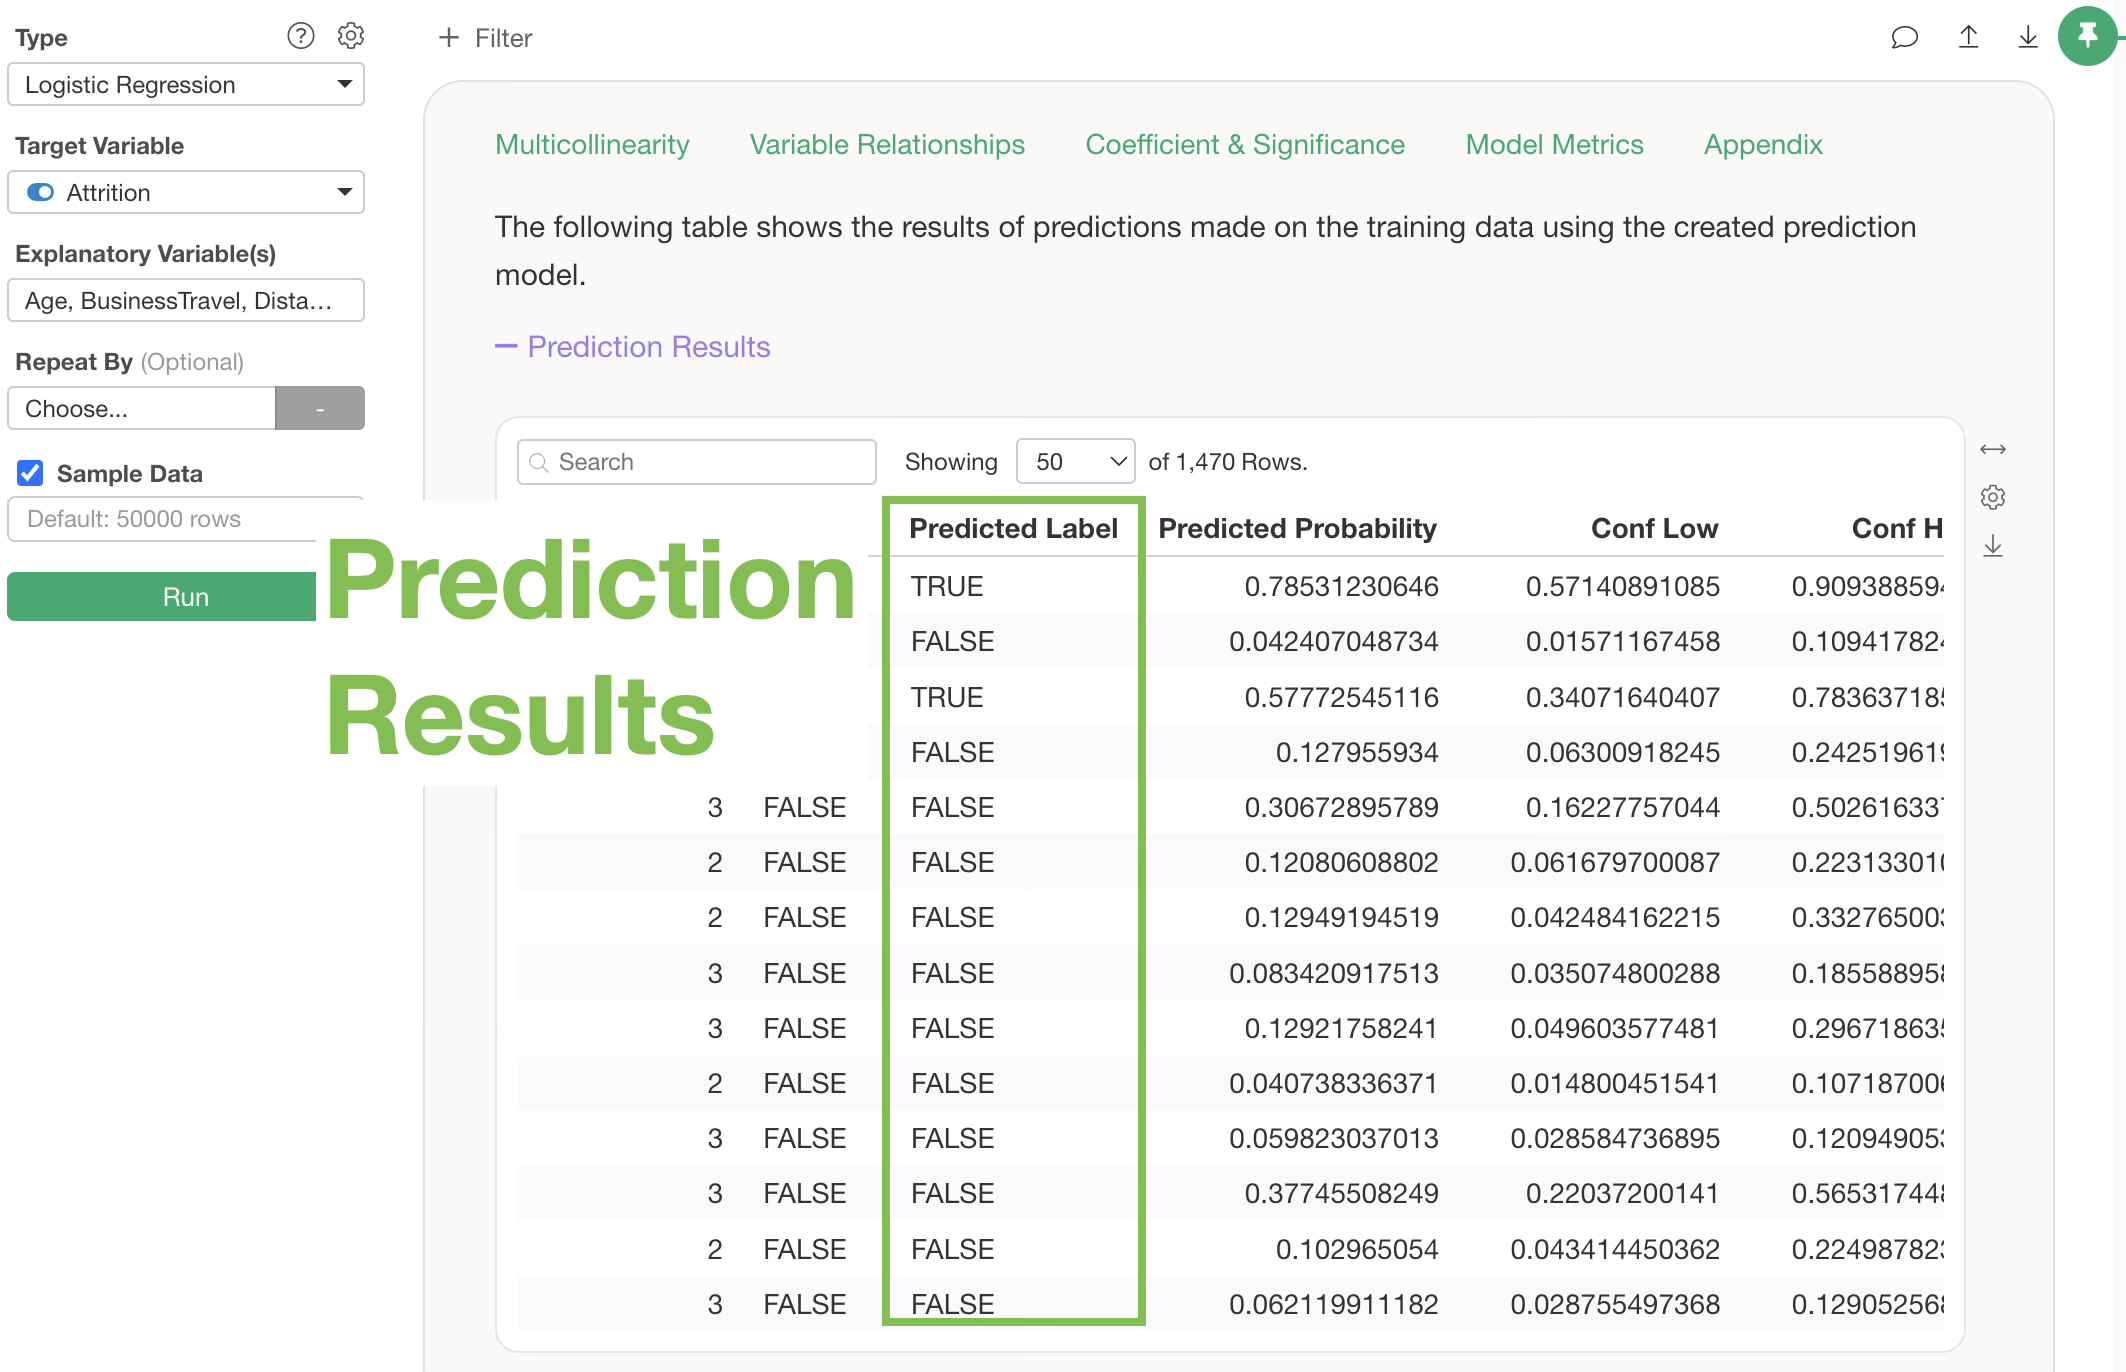
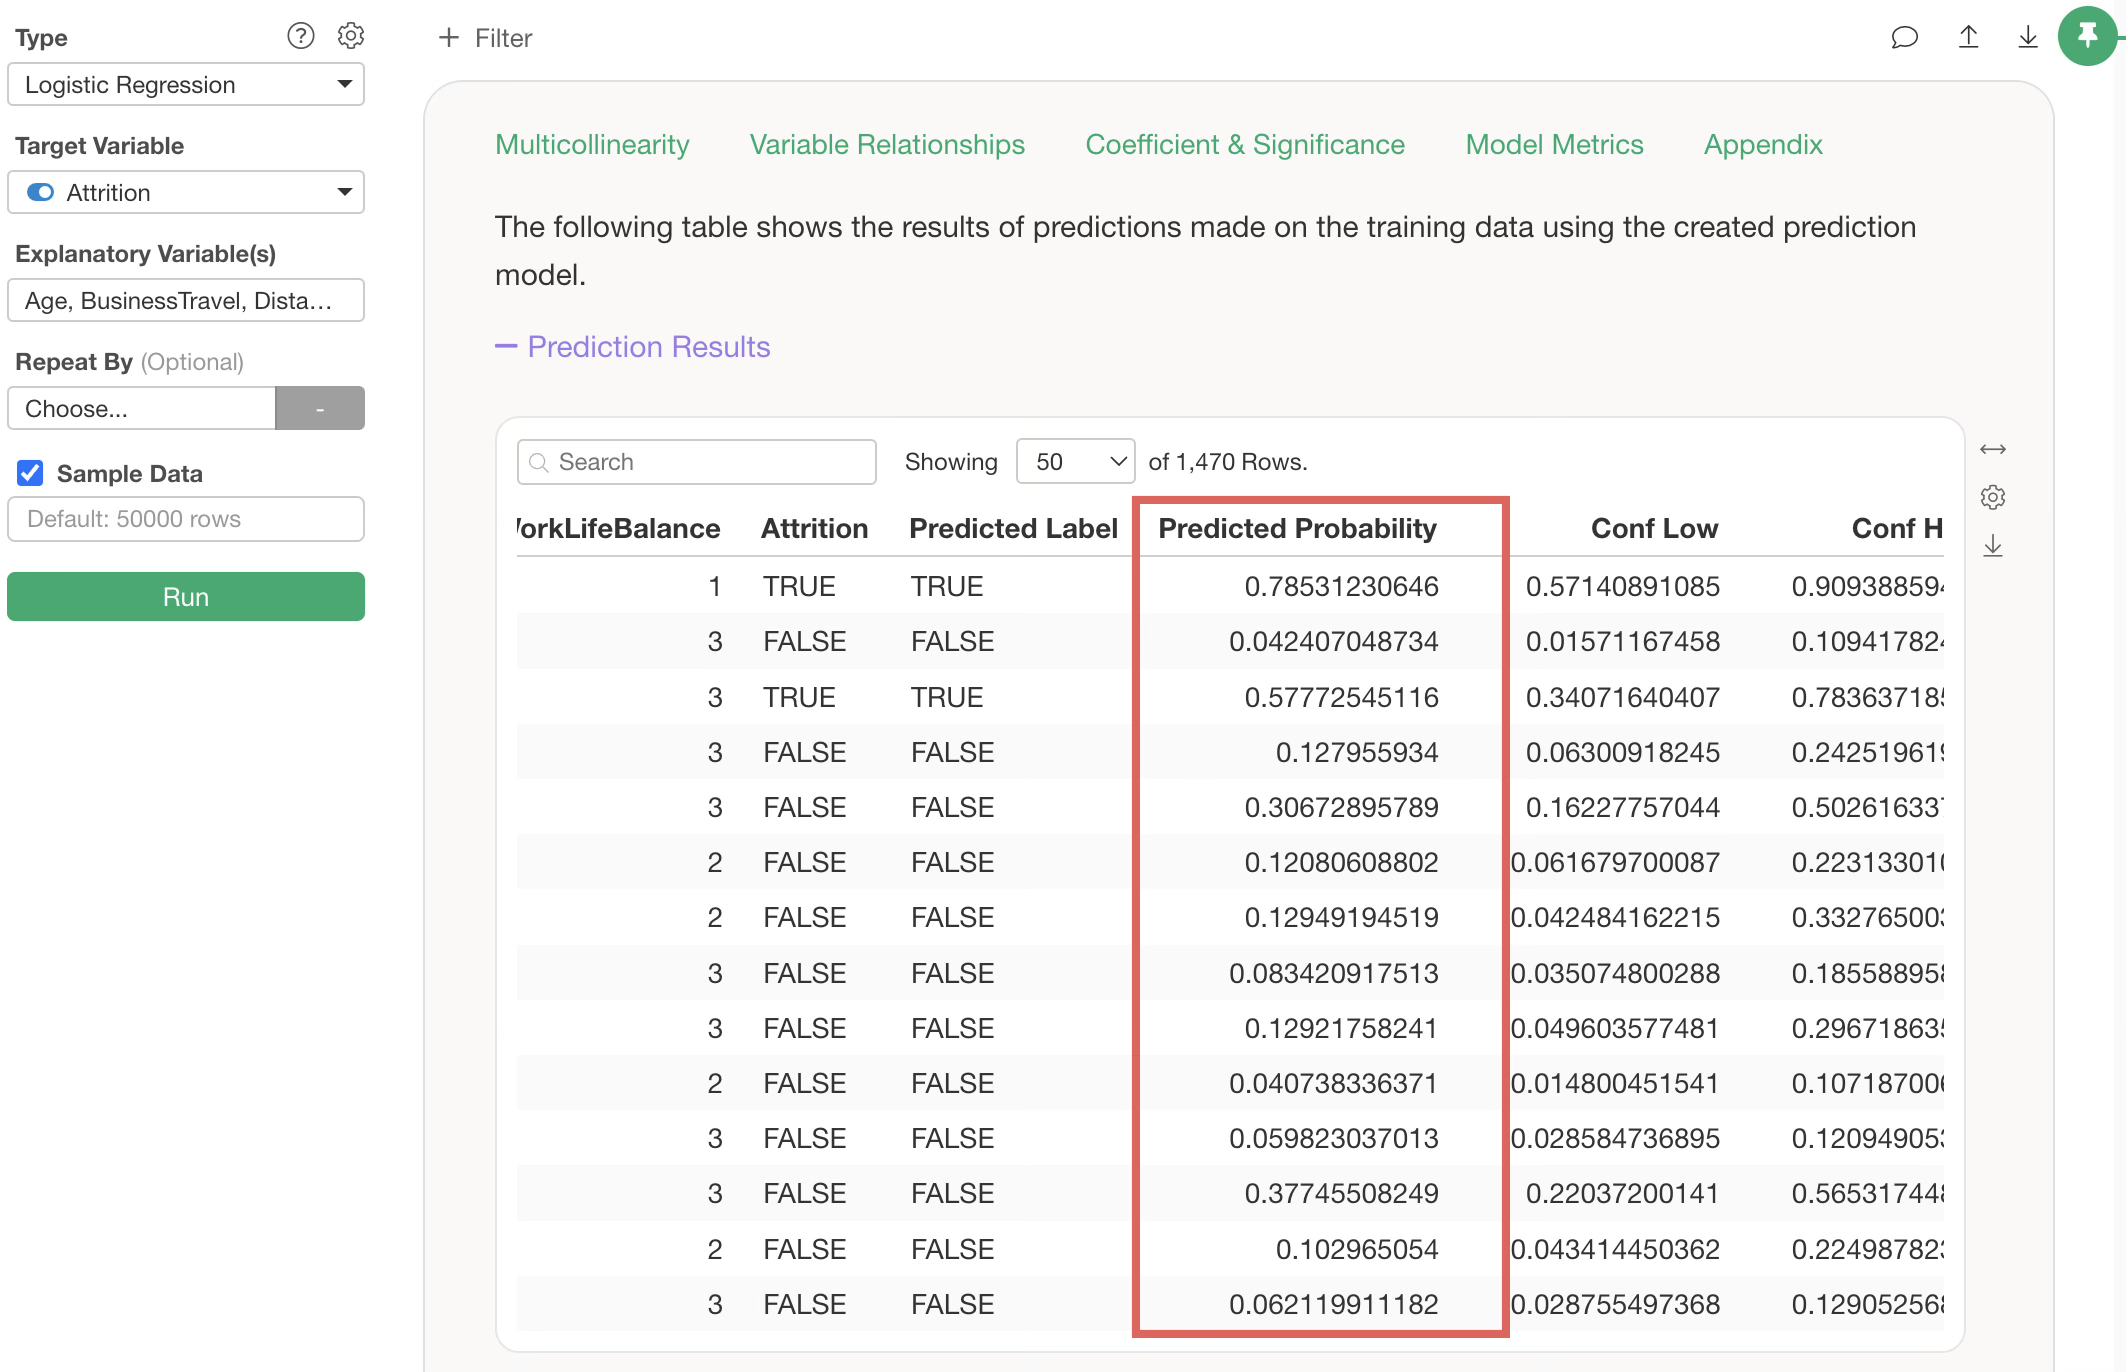
A prediction step will be added, along with columns such as “predicted_probability” (the predicted probability of being TRUE) and “predicted_label” (the prediction result).
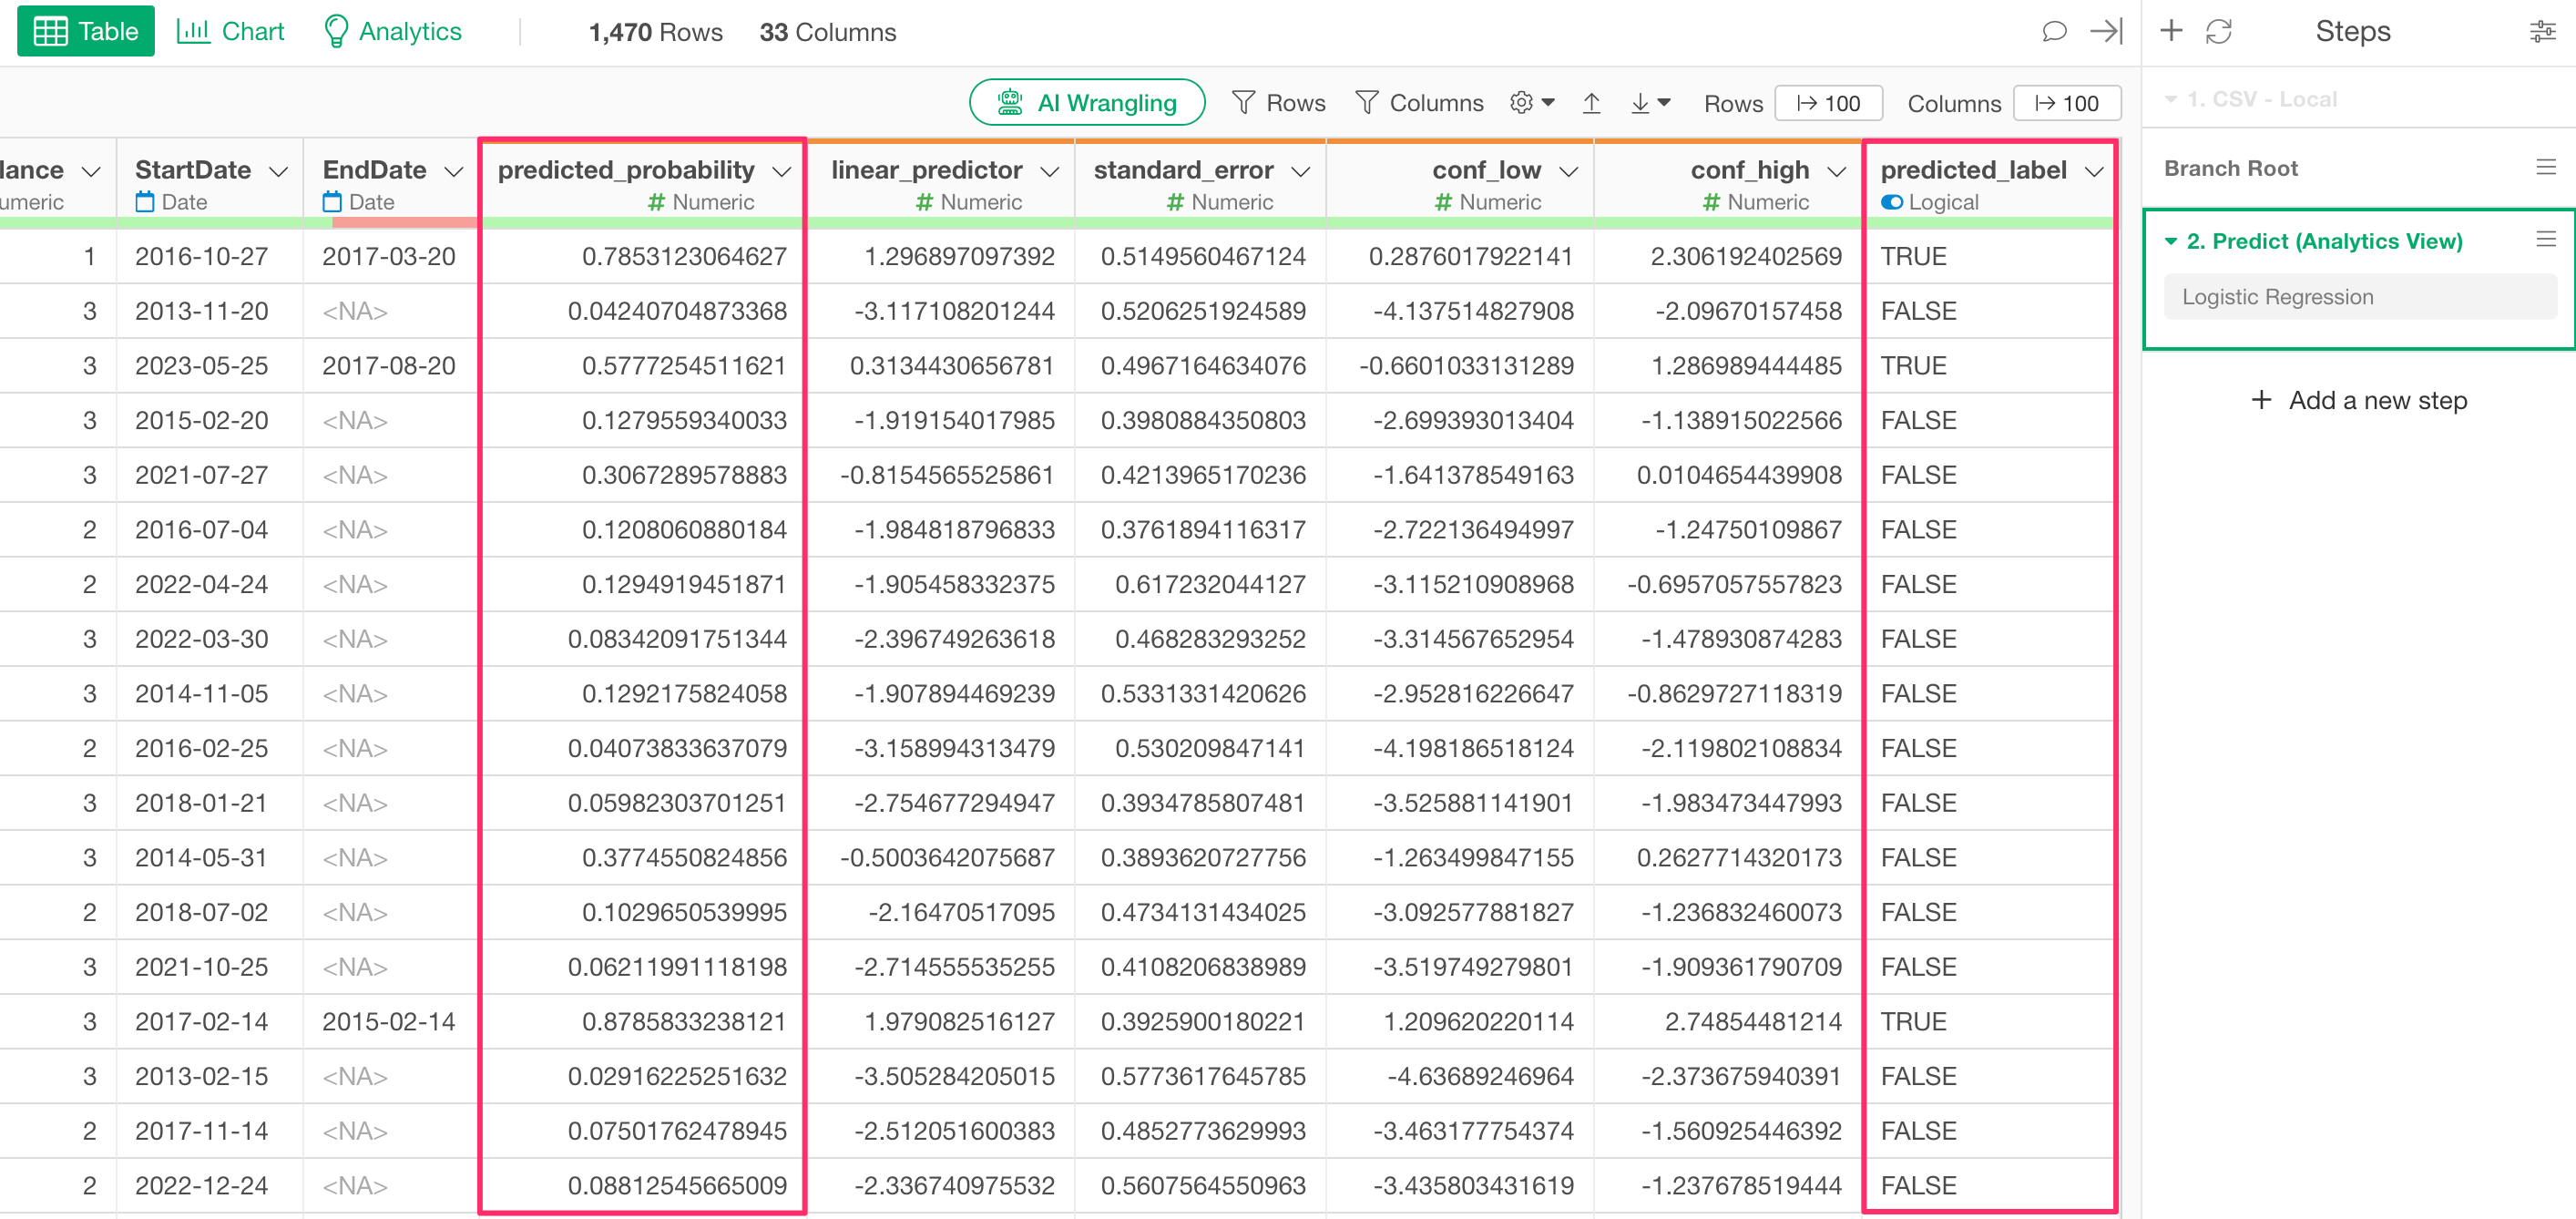
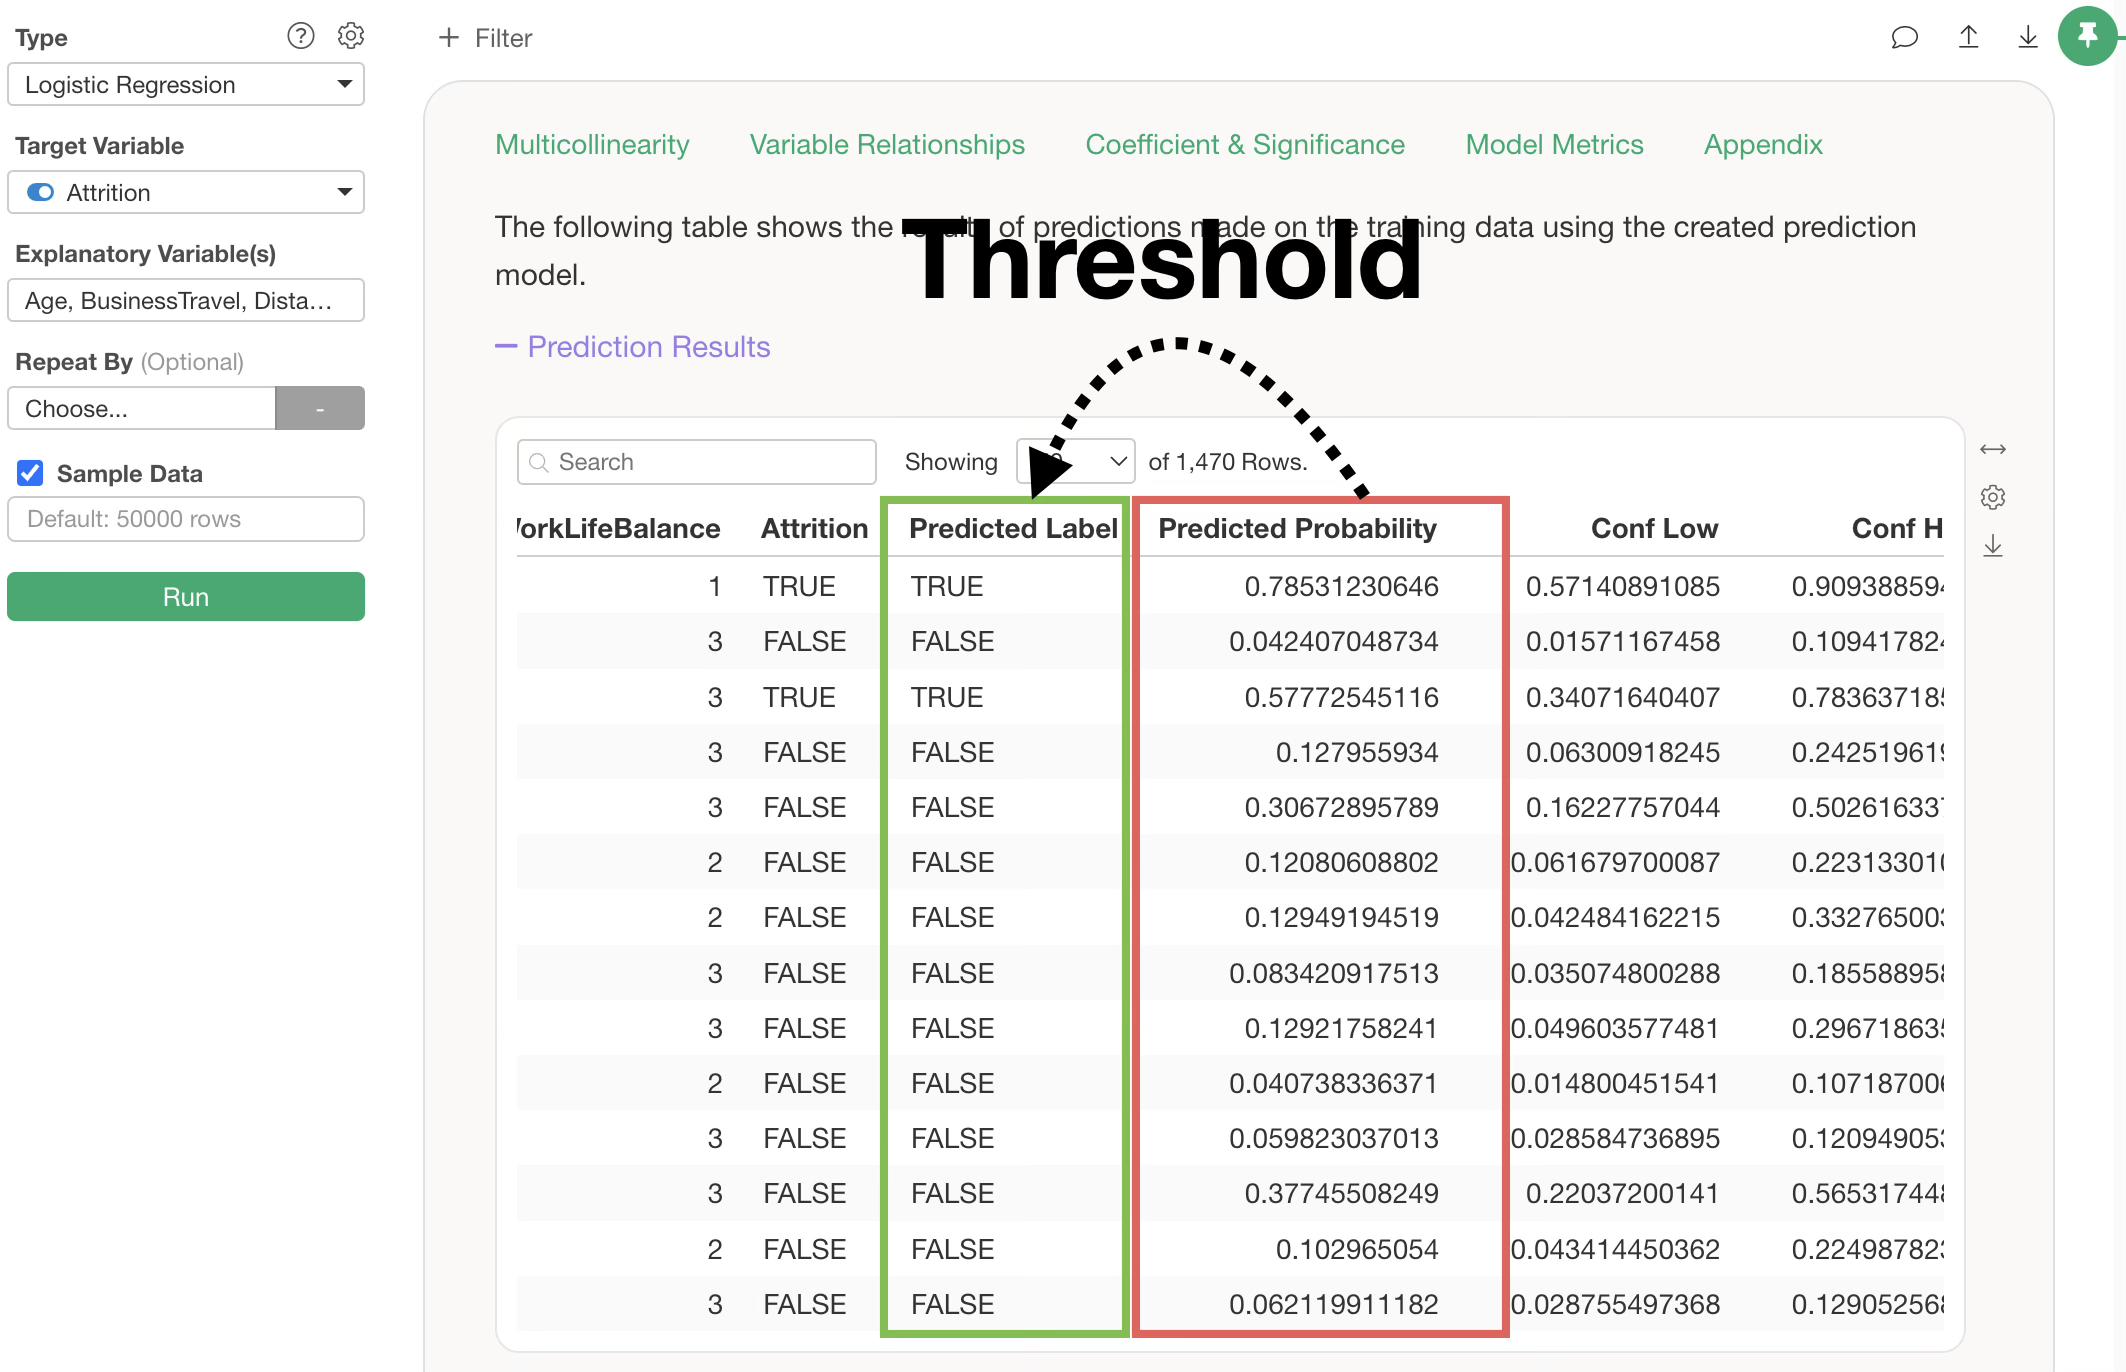
Note that the default setting for the “TRUE/FALSE Threshold,” which returns a TRUE prediction, is 0.5 (50%). Therefore, if “predicted_probability” is 0.5 (50%) or higher, the “predicted_label” will be TRUE.

3. Determine the optimal threshold
Next, we will investigate the optimal threshold for predicting attrition.
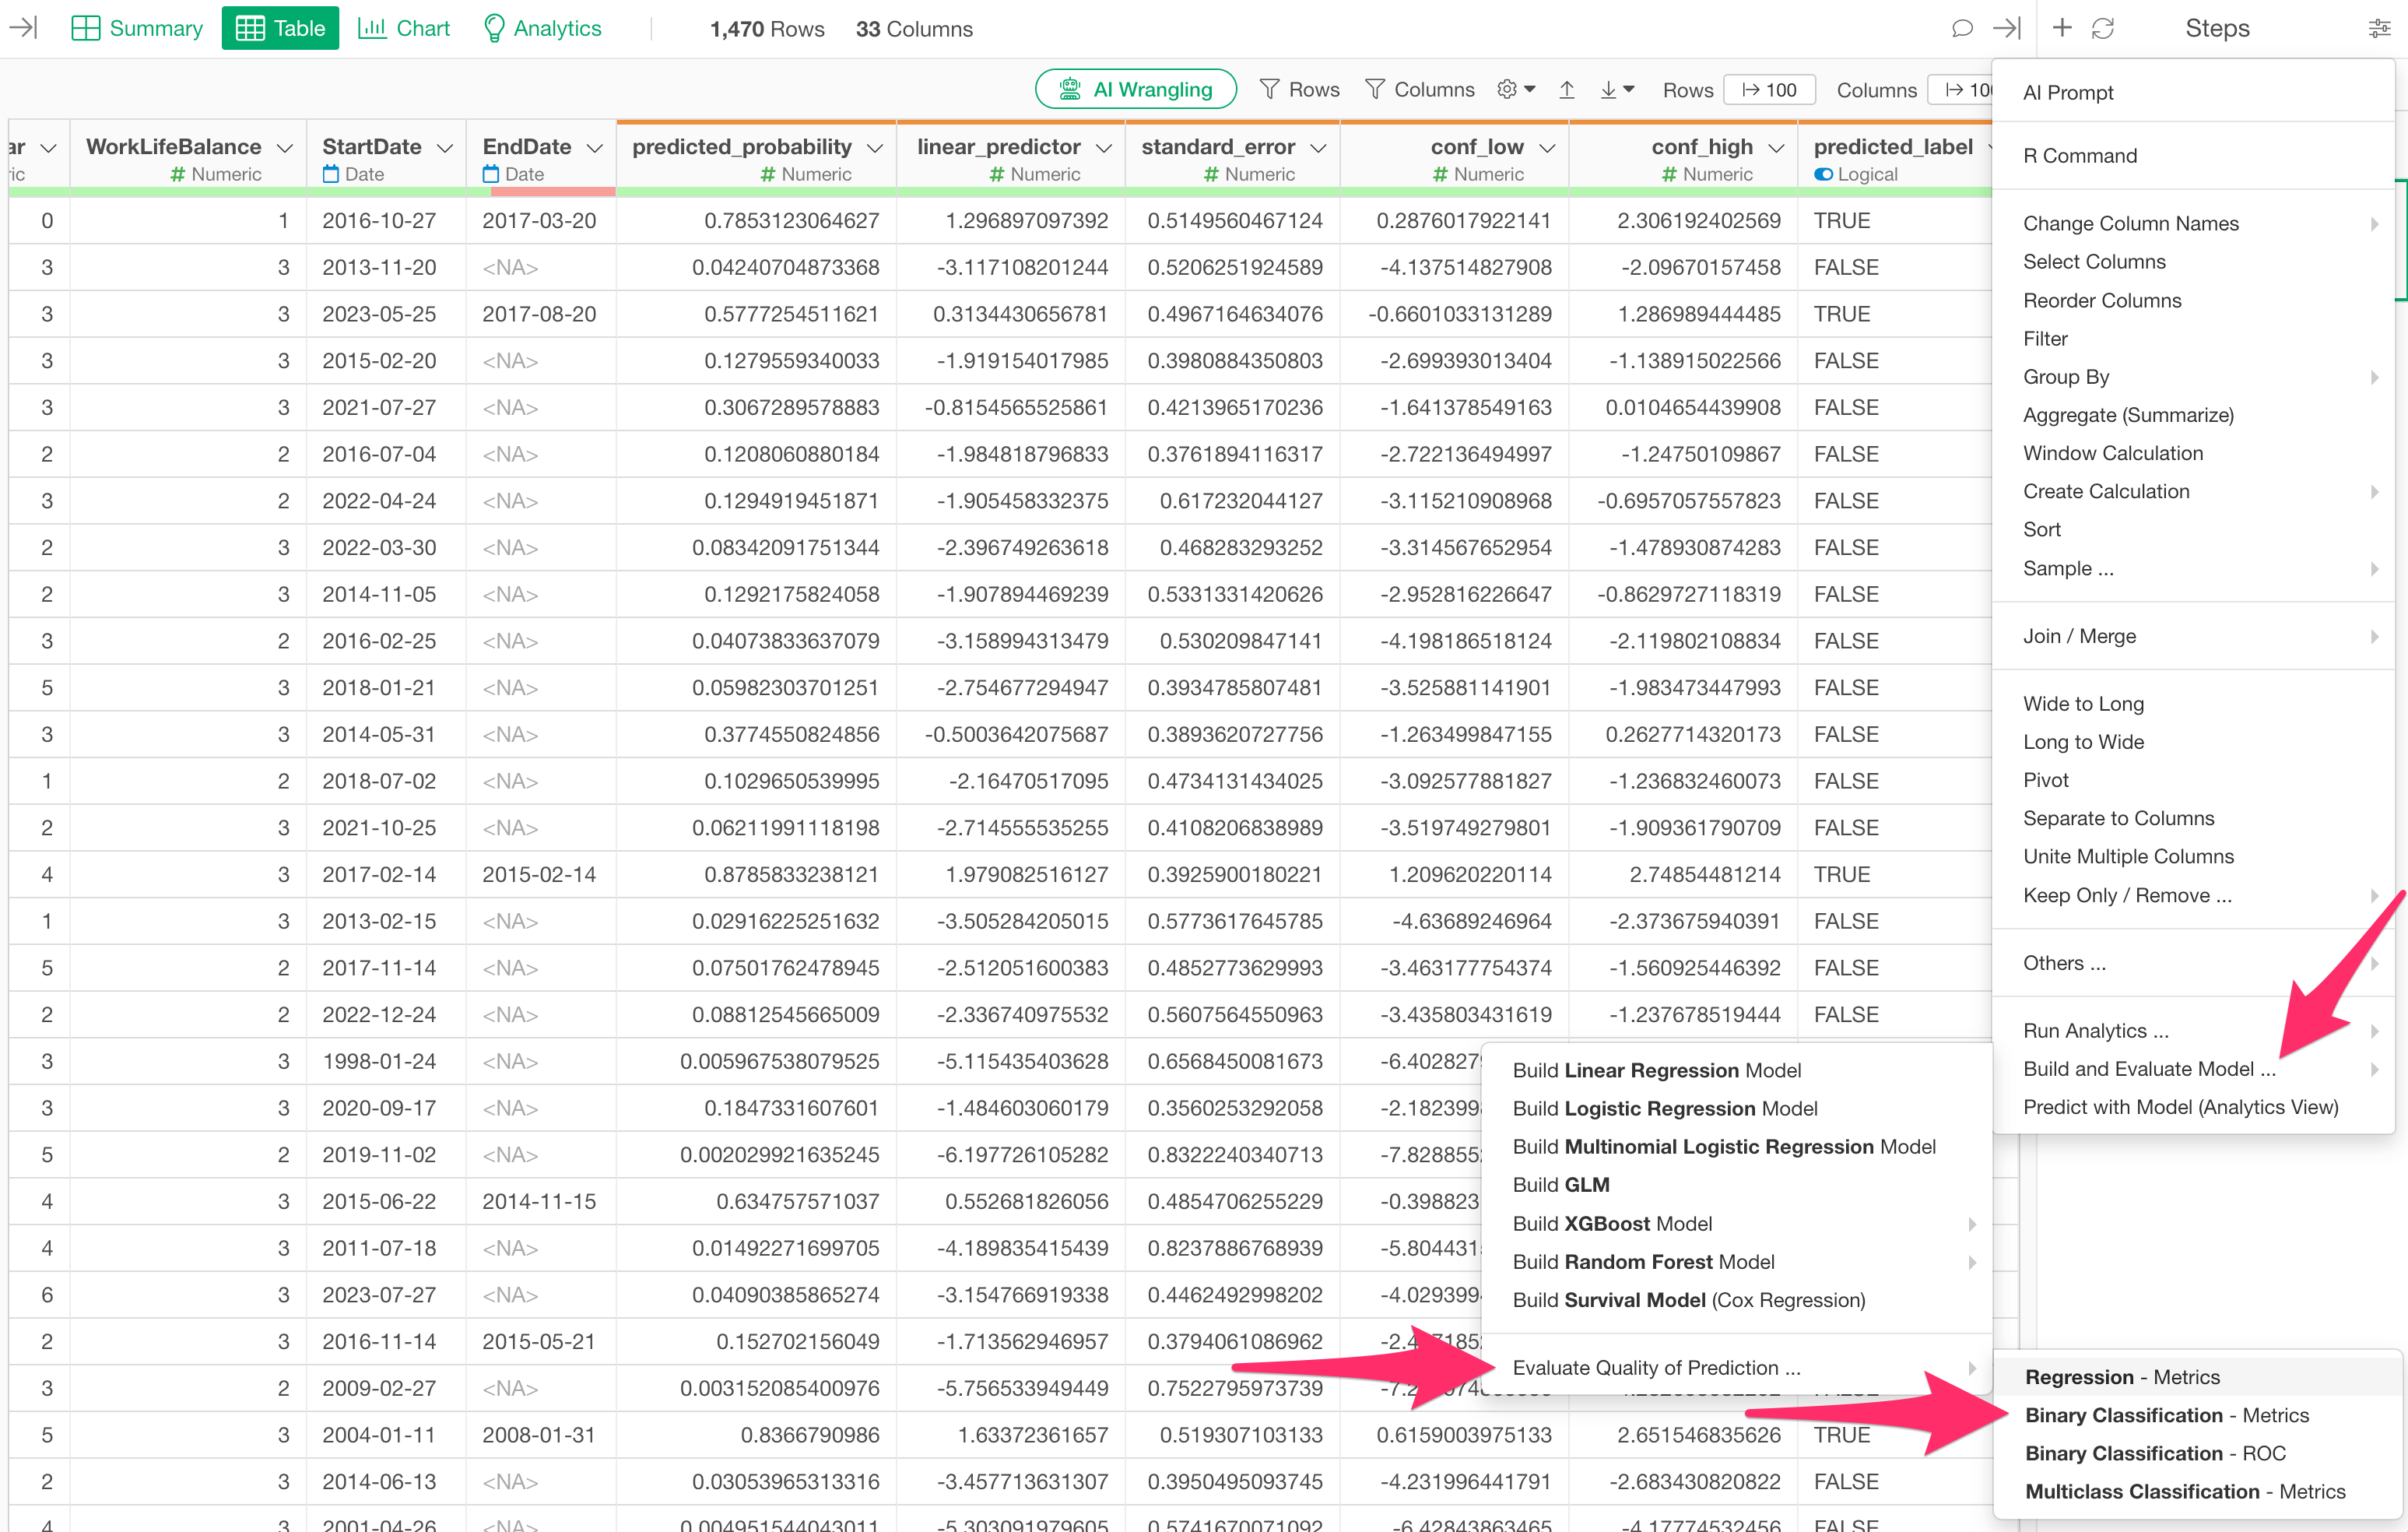
Open the step menu of the current branch’s data frame and select “Build/Evaluate Model…”, “Evaluate Quality of Prediction…”, and “Binary Classification - Metrics.”
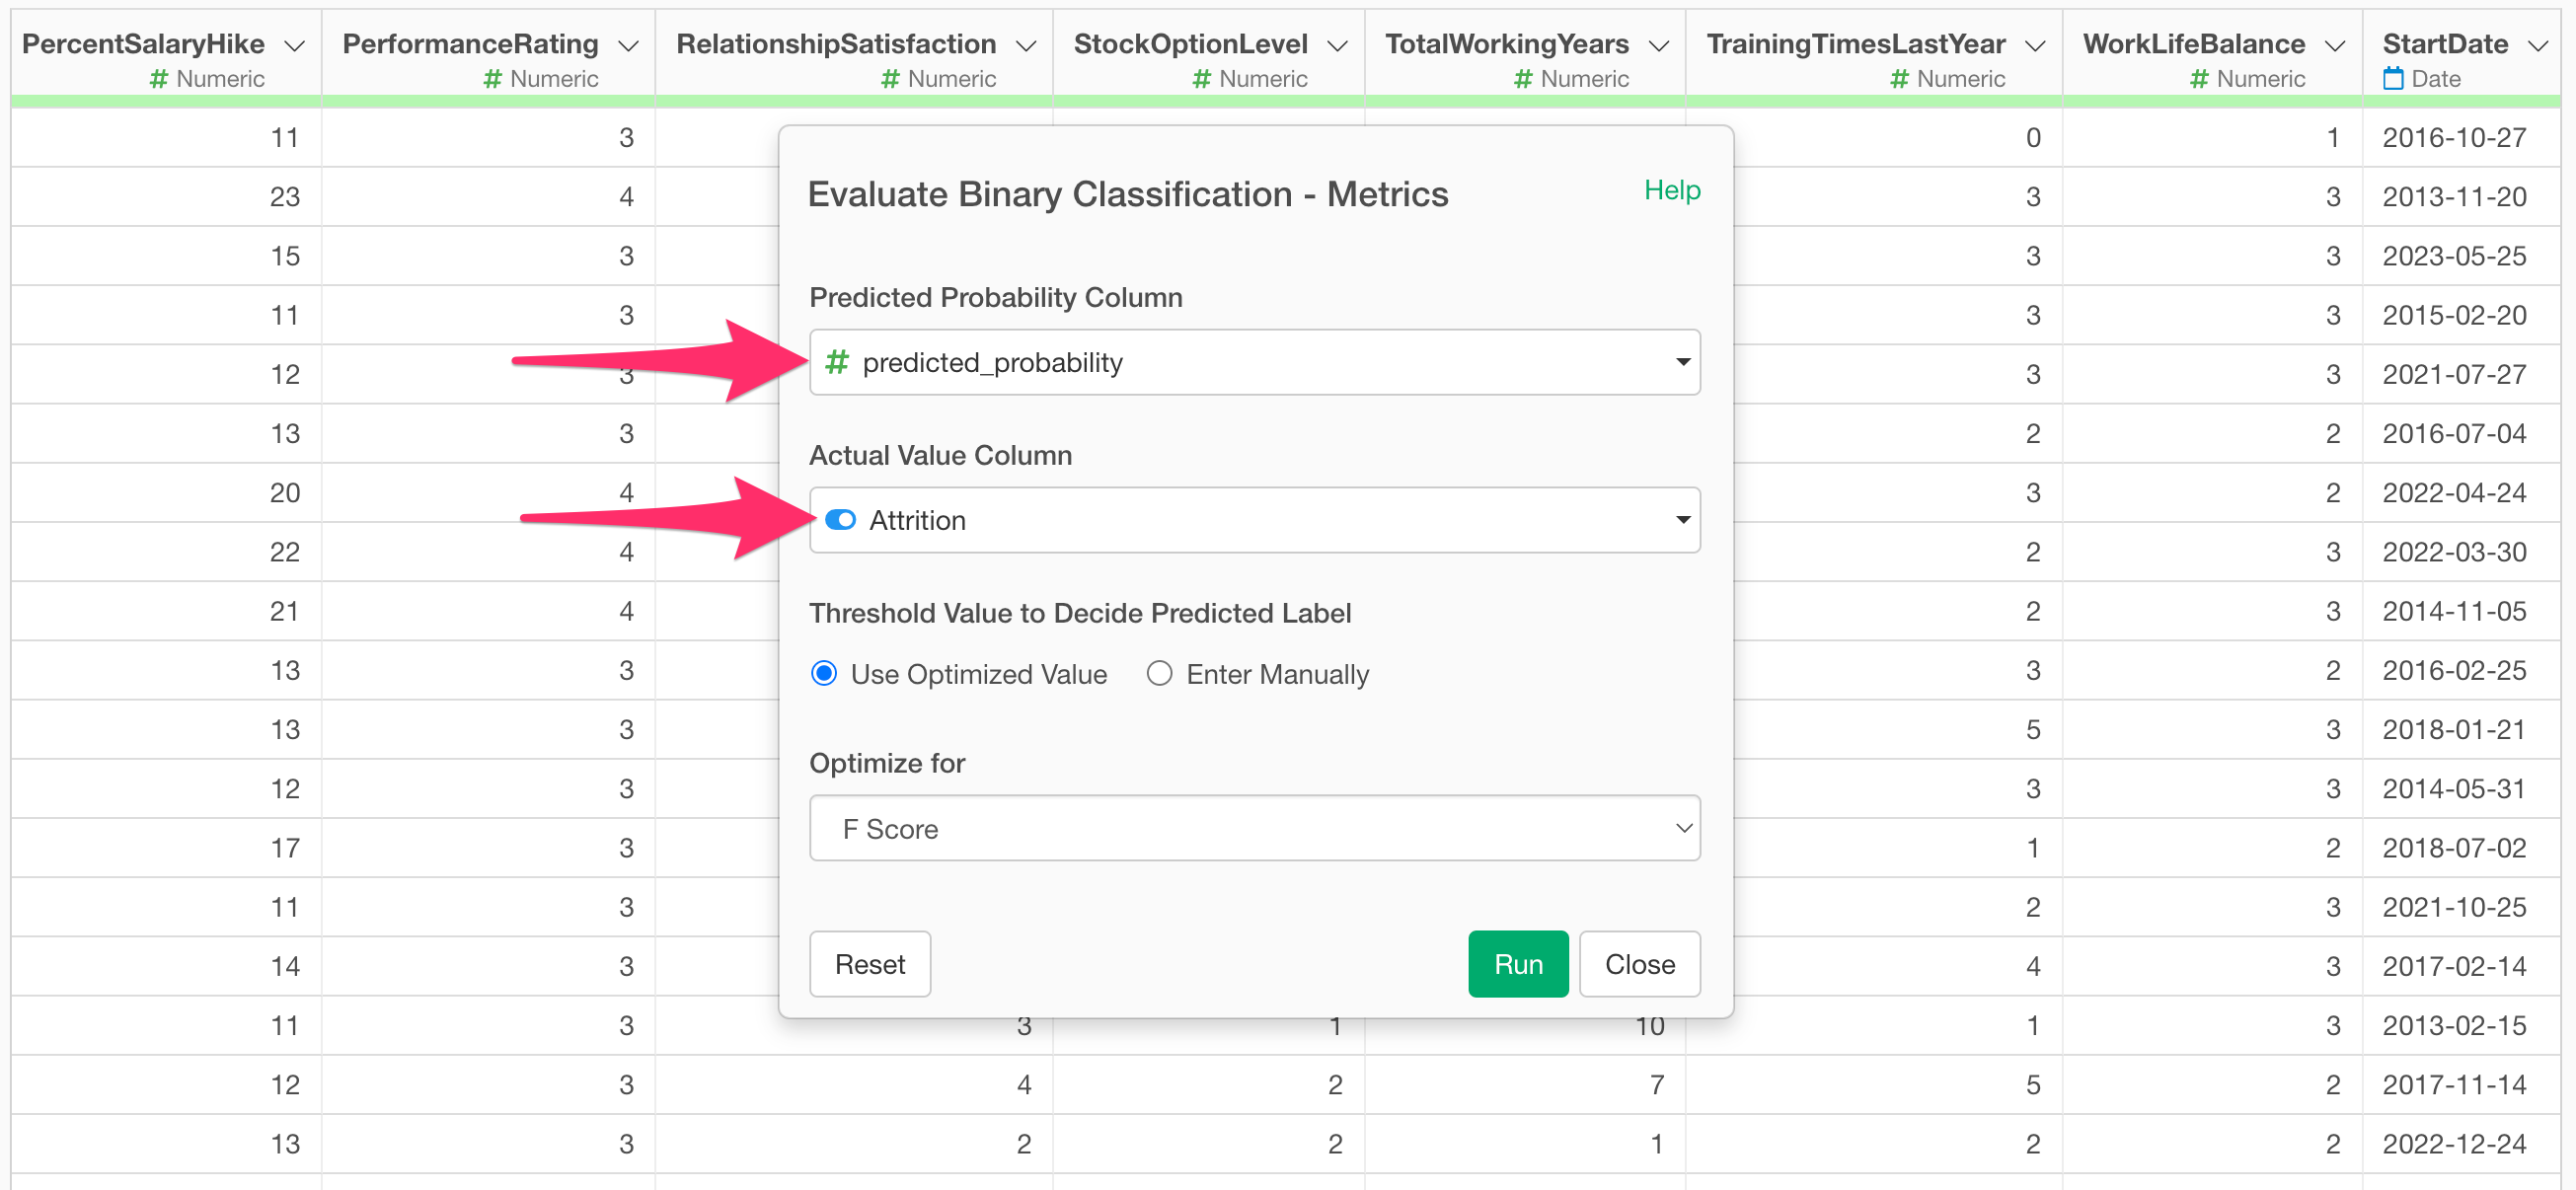
The “Evaluate Binary Classification Accuracy - Metrics” dialog will appear. The “Predicted Probability Column” will automatically have the “predicted_probability” column selected. For the “Actual Value Column,” select the target variable from the prediction model (in this case, “Attrition”).
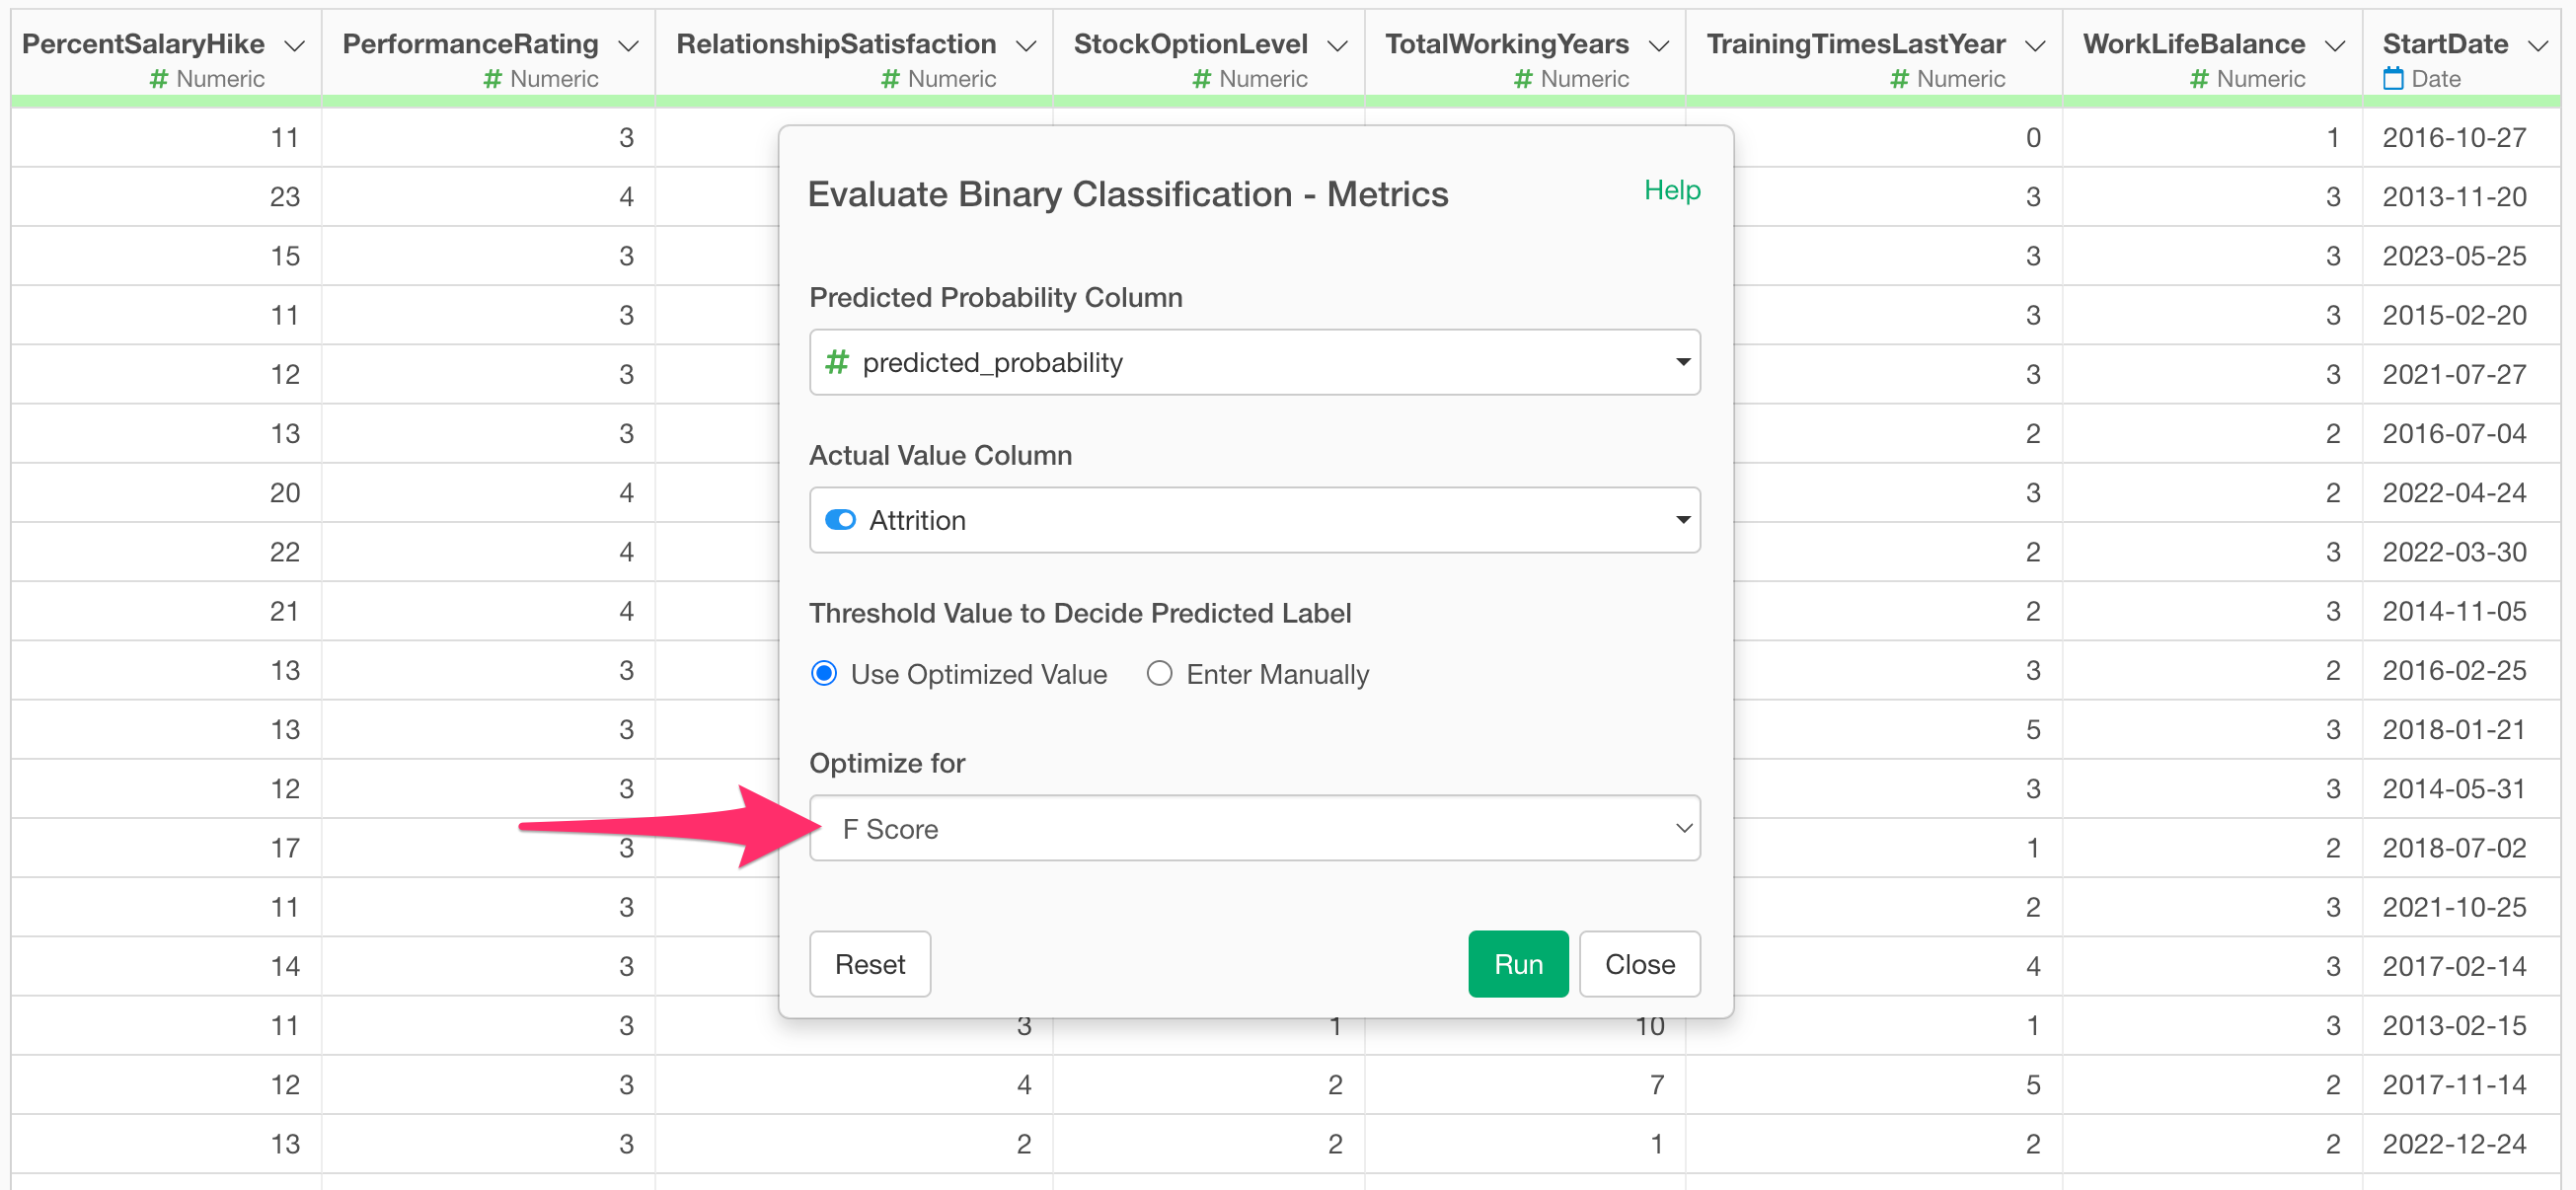
Next, check “Use Optimized Value” under “Threshold for Decision” and select a metric.
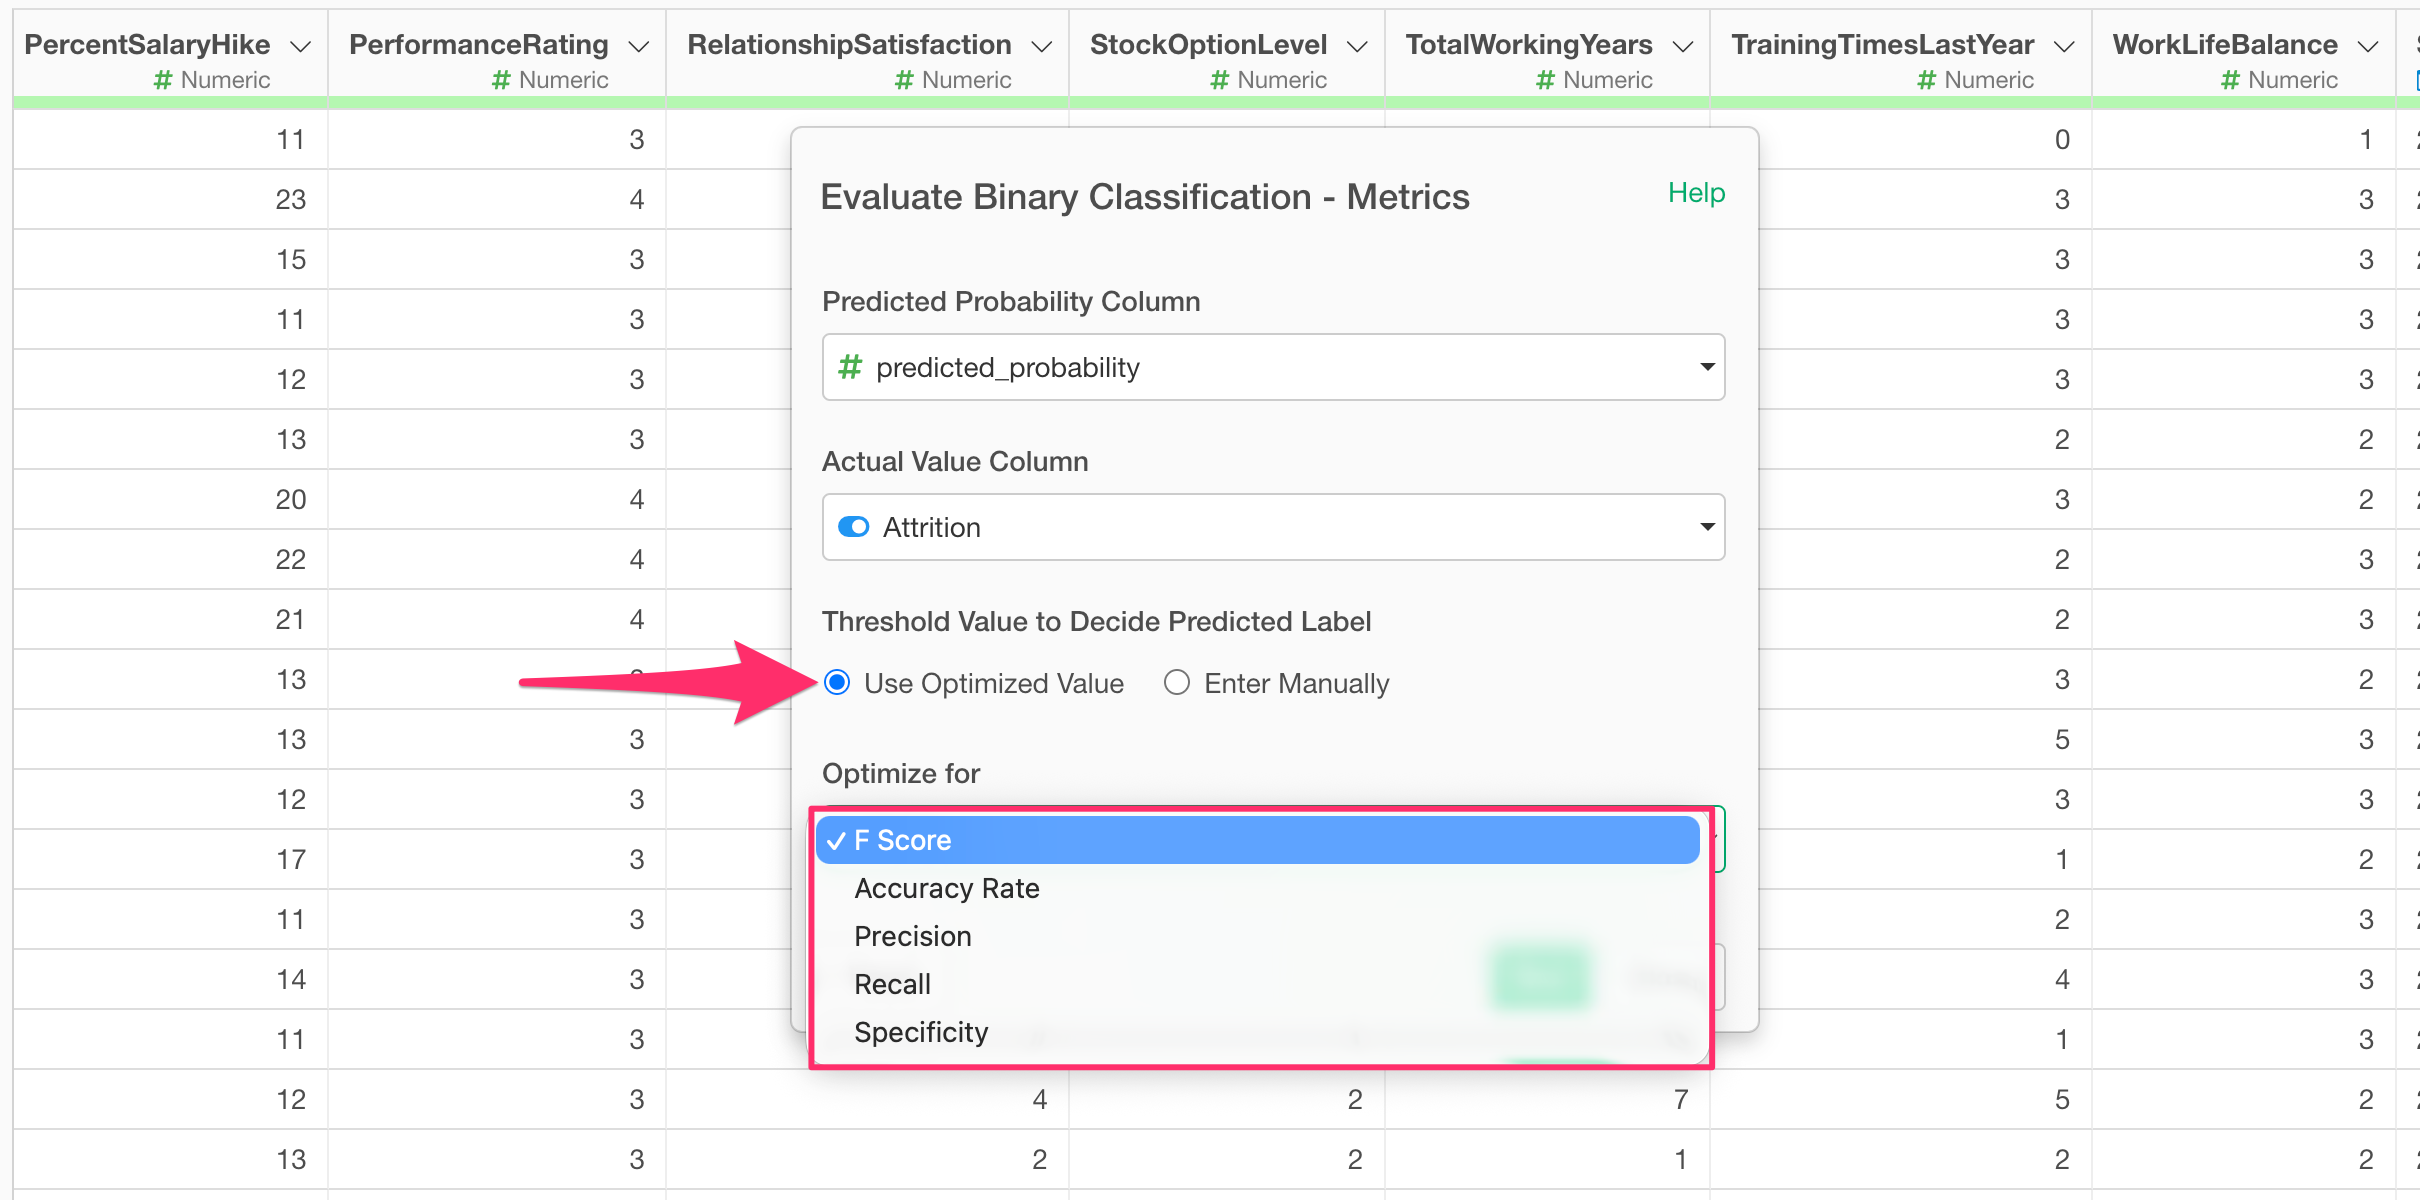
Once you have selected a metric, run it. (In this example, “F-score” is selected to balance TRUE and FALSE predictions, but if you want to prioritize predicting TRUE, you would select Recall.)
An “Evaluate Binary Classification Accuracy” step will be added, and you can find the optimal “threshold” in the last column.
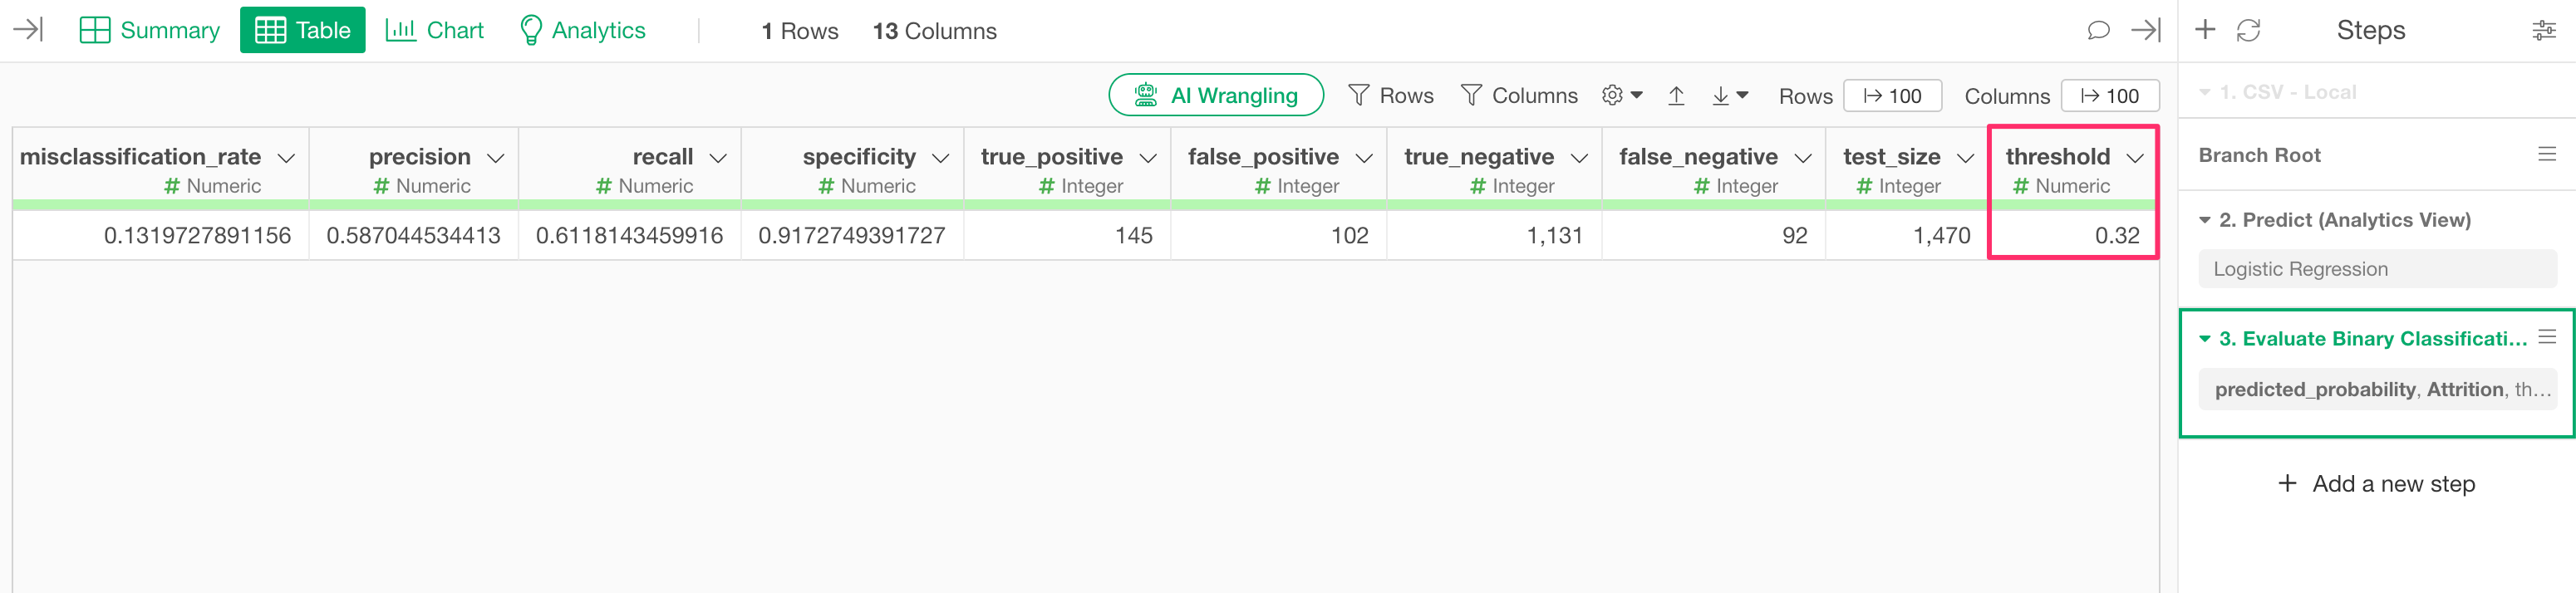
In this example, we can see that the optimal threshold for returning a TRUE prediction, optimized for the F-score, is “0.32 (32%).”
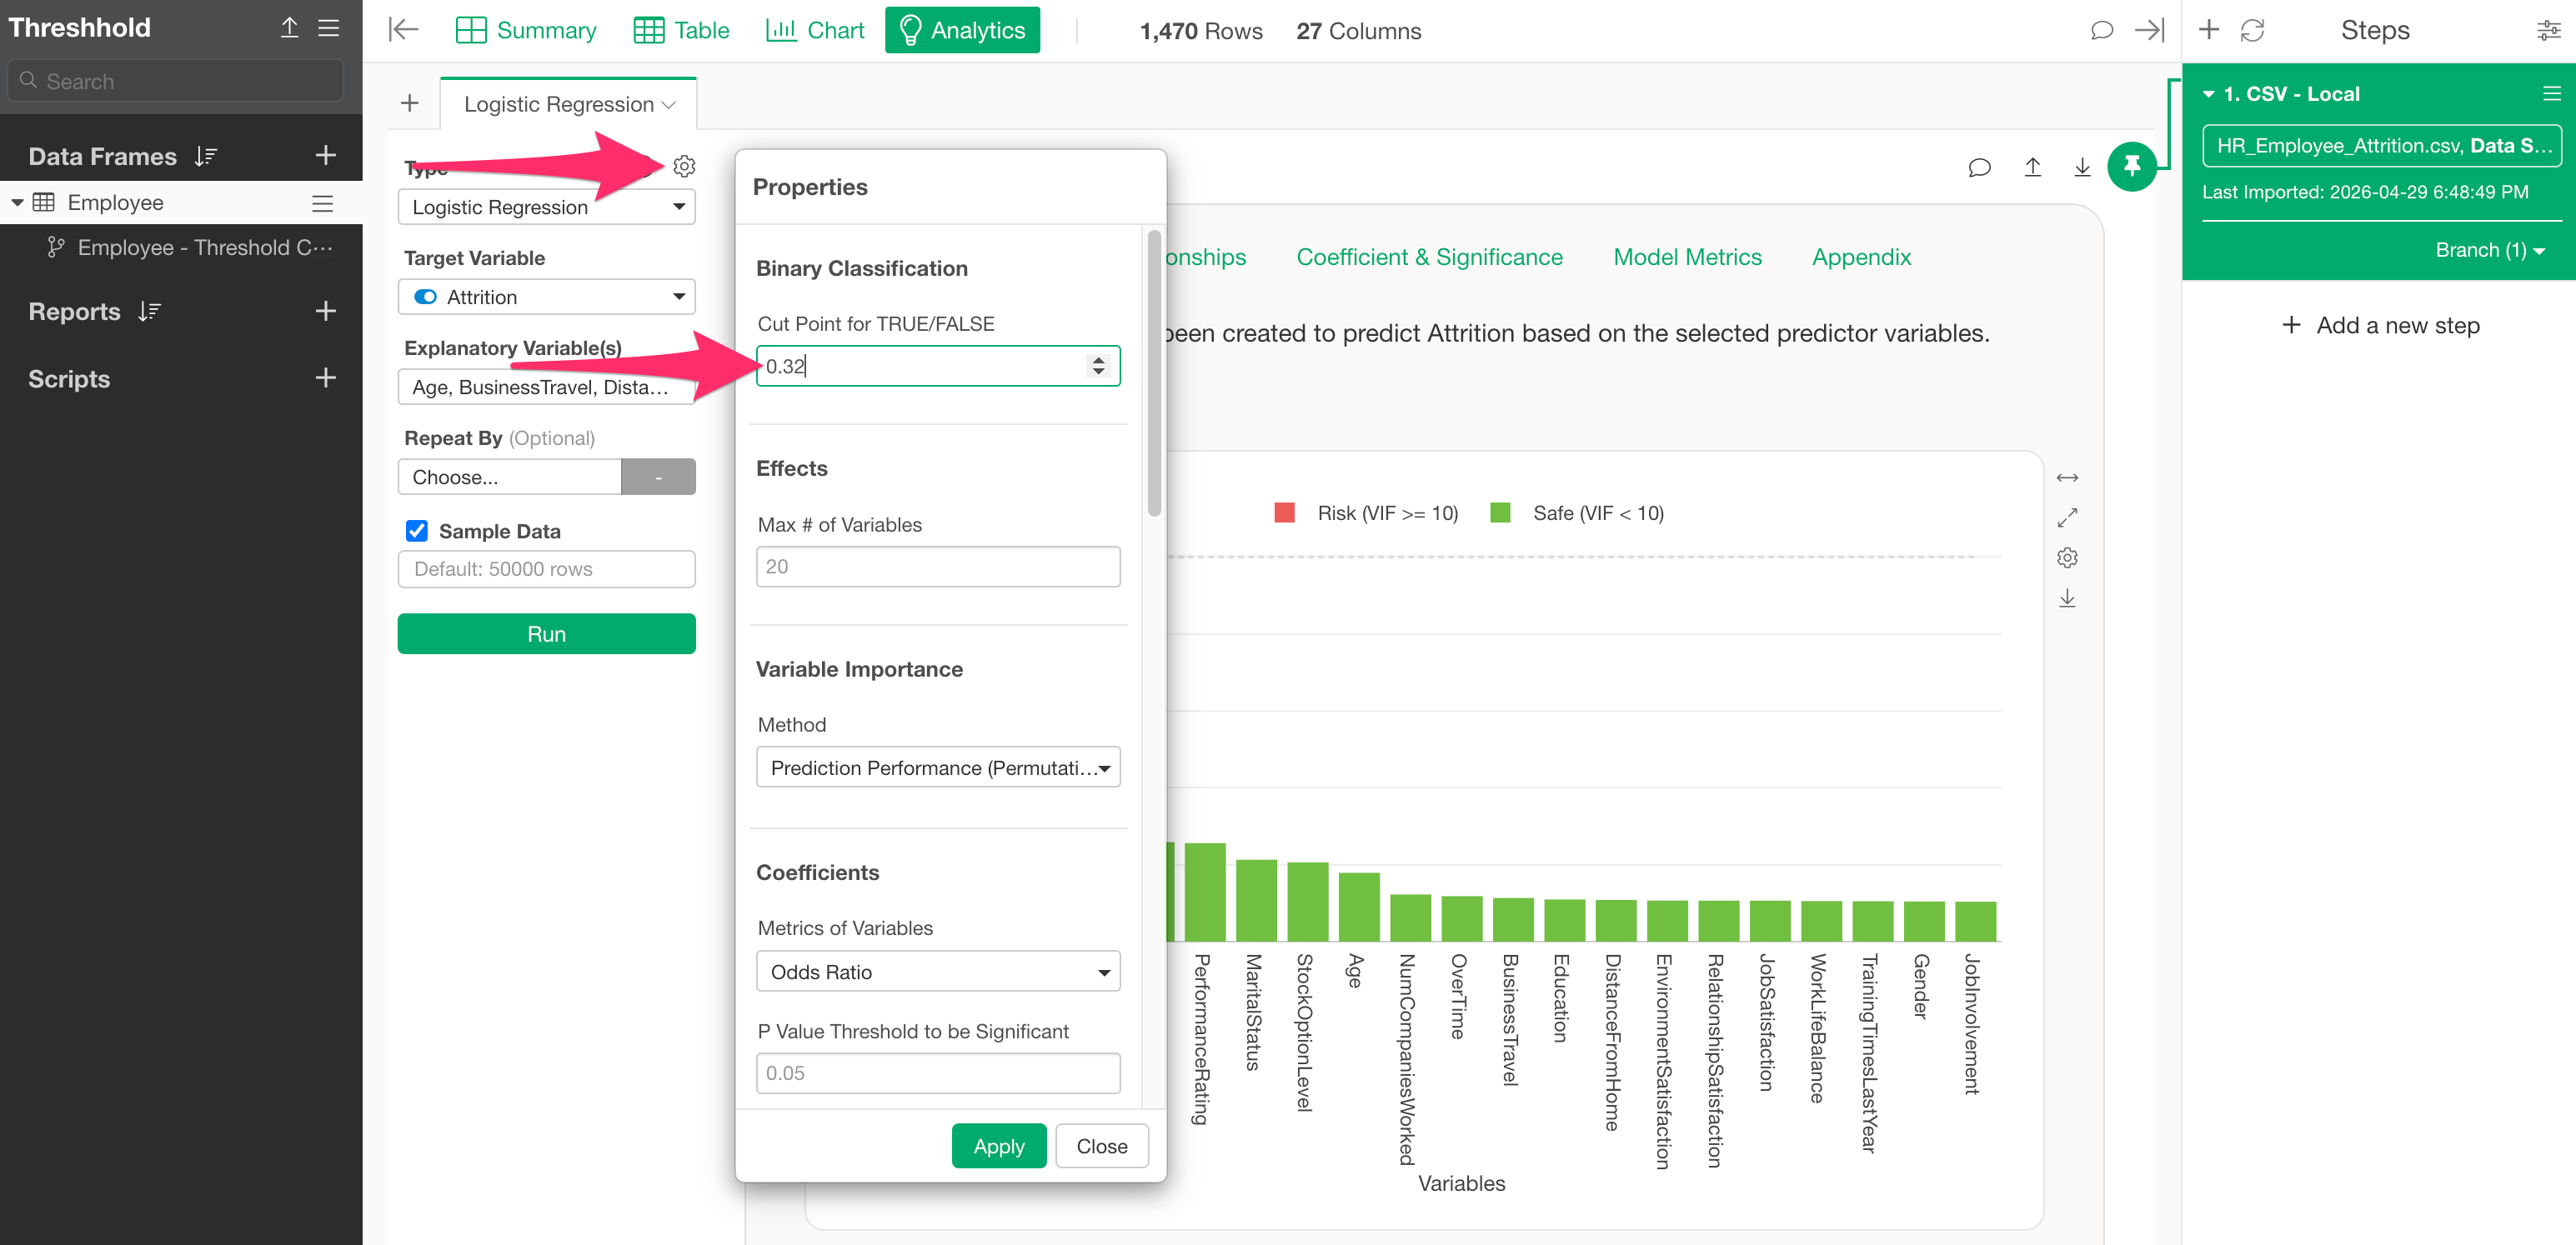
Therefore, return to the original Analytics view and set the threshold you just found, “0.32,” as the “TRUE/FALSE Threshold” in the Analytics settings to check the details of the prediction results with the optimized threshold.
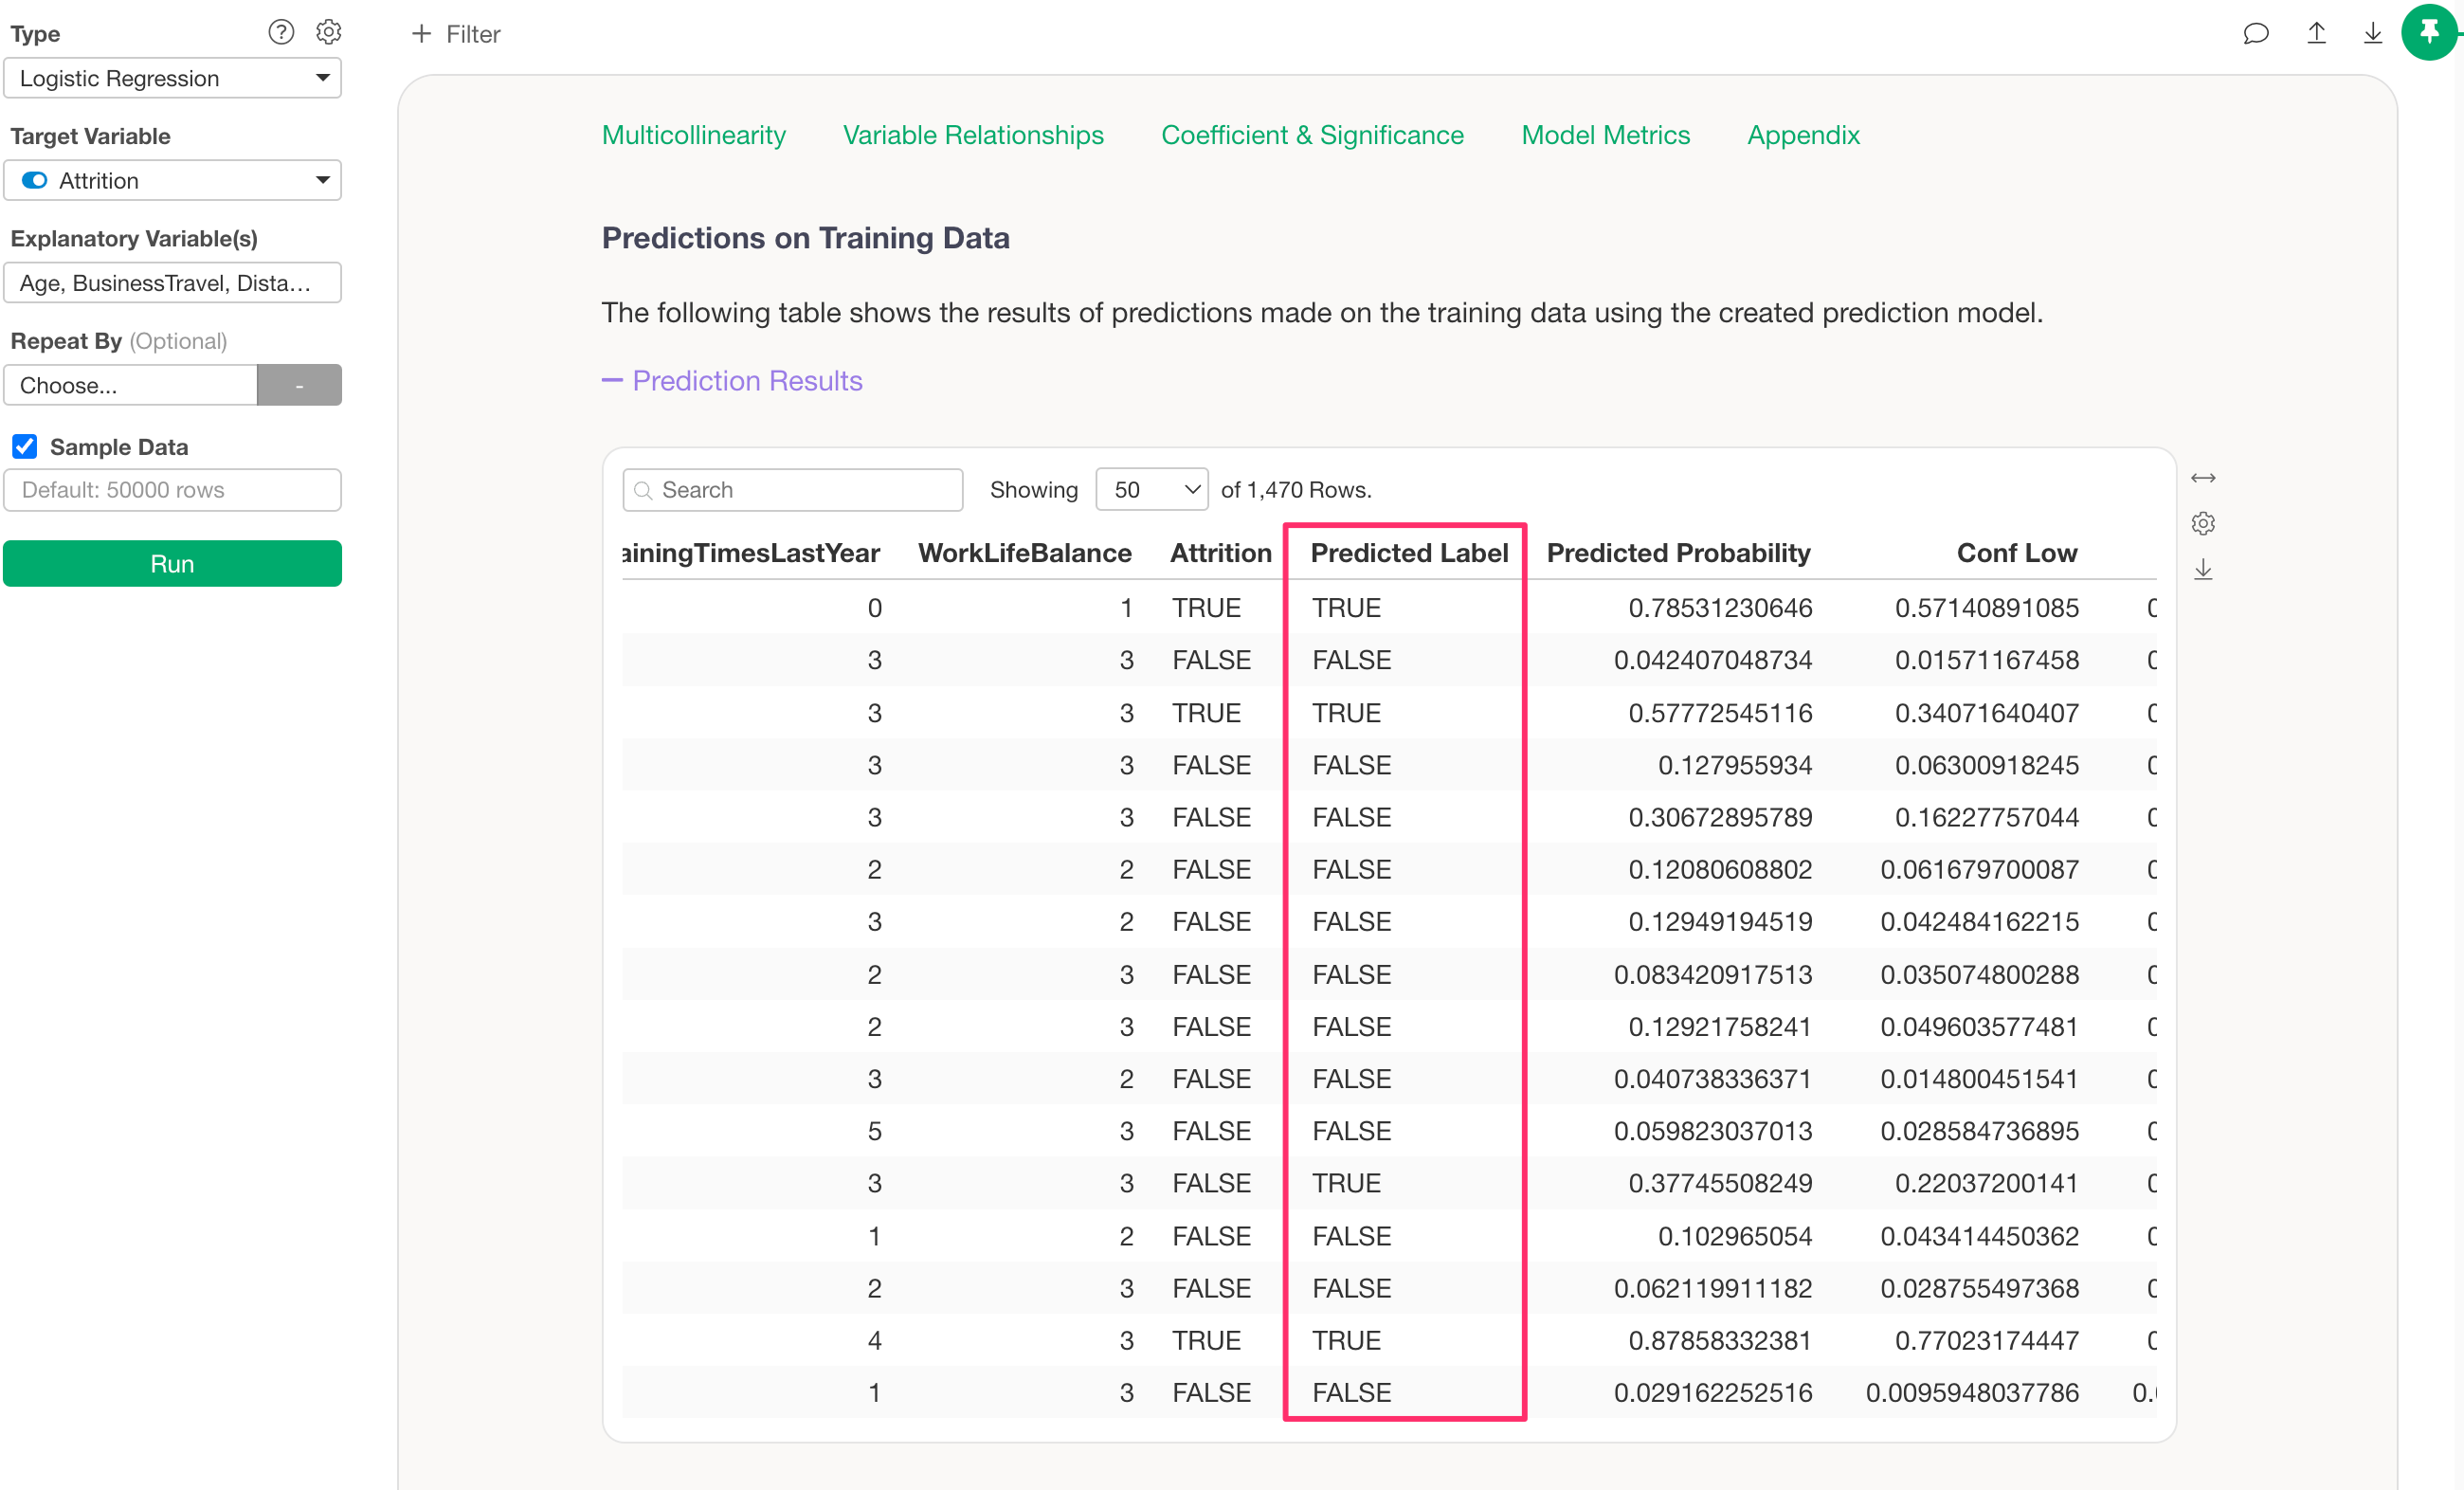
When you click the Apply button, the “Predicted Label” information in the “Predictions on Training Data” section will be updated based on the threshold you entered.
In addition to the above, the results for the “Prediction Matrix” and “Confusion Matrix” will also be updated.