How to Explore Relationships Between Variables Using the Correlation Mode in Summary View
Exploratory’s Summary View has a “Correlation Mode.” It is a feature that lets you examine the relationship between a given variable and all other variables at once, using charts and statistical indicators tailored to each data type.
For example, if you want to find out what factors are related to employee “Monthly Income,” creating charts one by one to examine the correlation between Monthly Income and every other column would be a tedious task.
With Correlation Mode, you can review the relationships with all variables in a single view with just a few clicks.
Running Correlation Mode
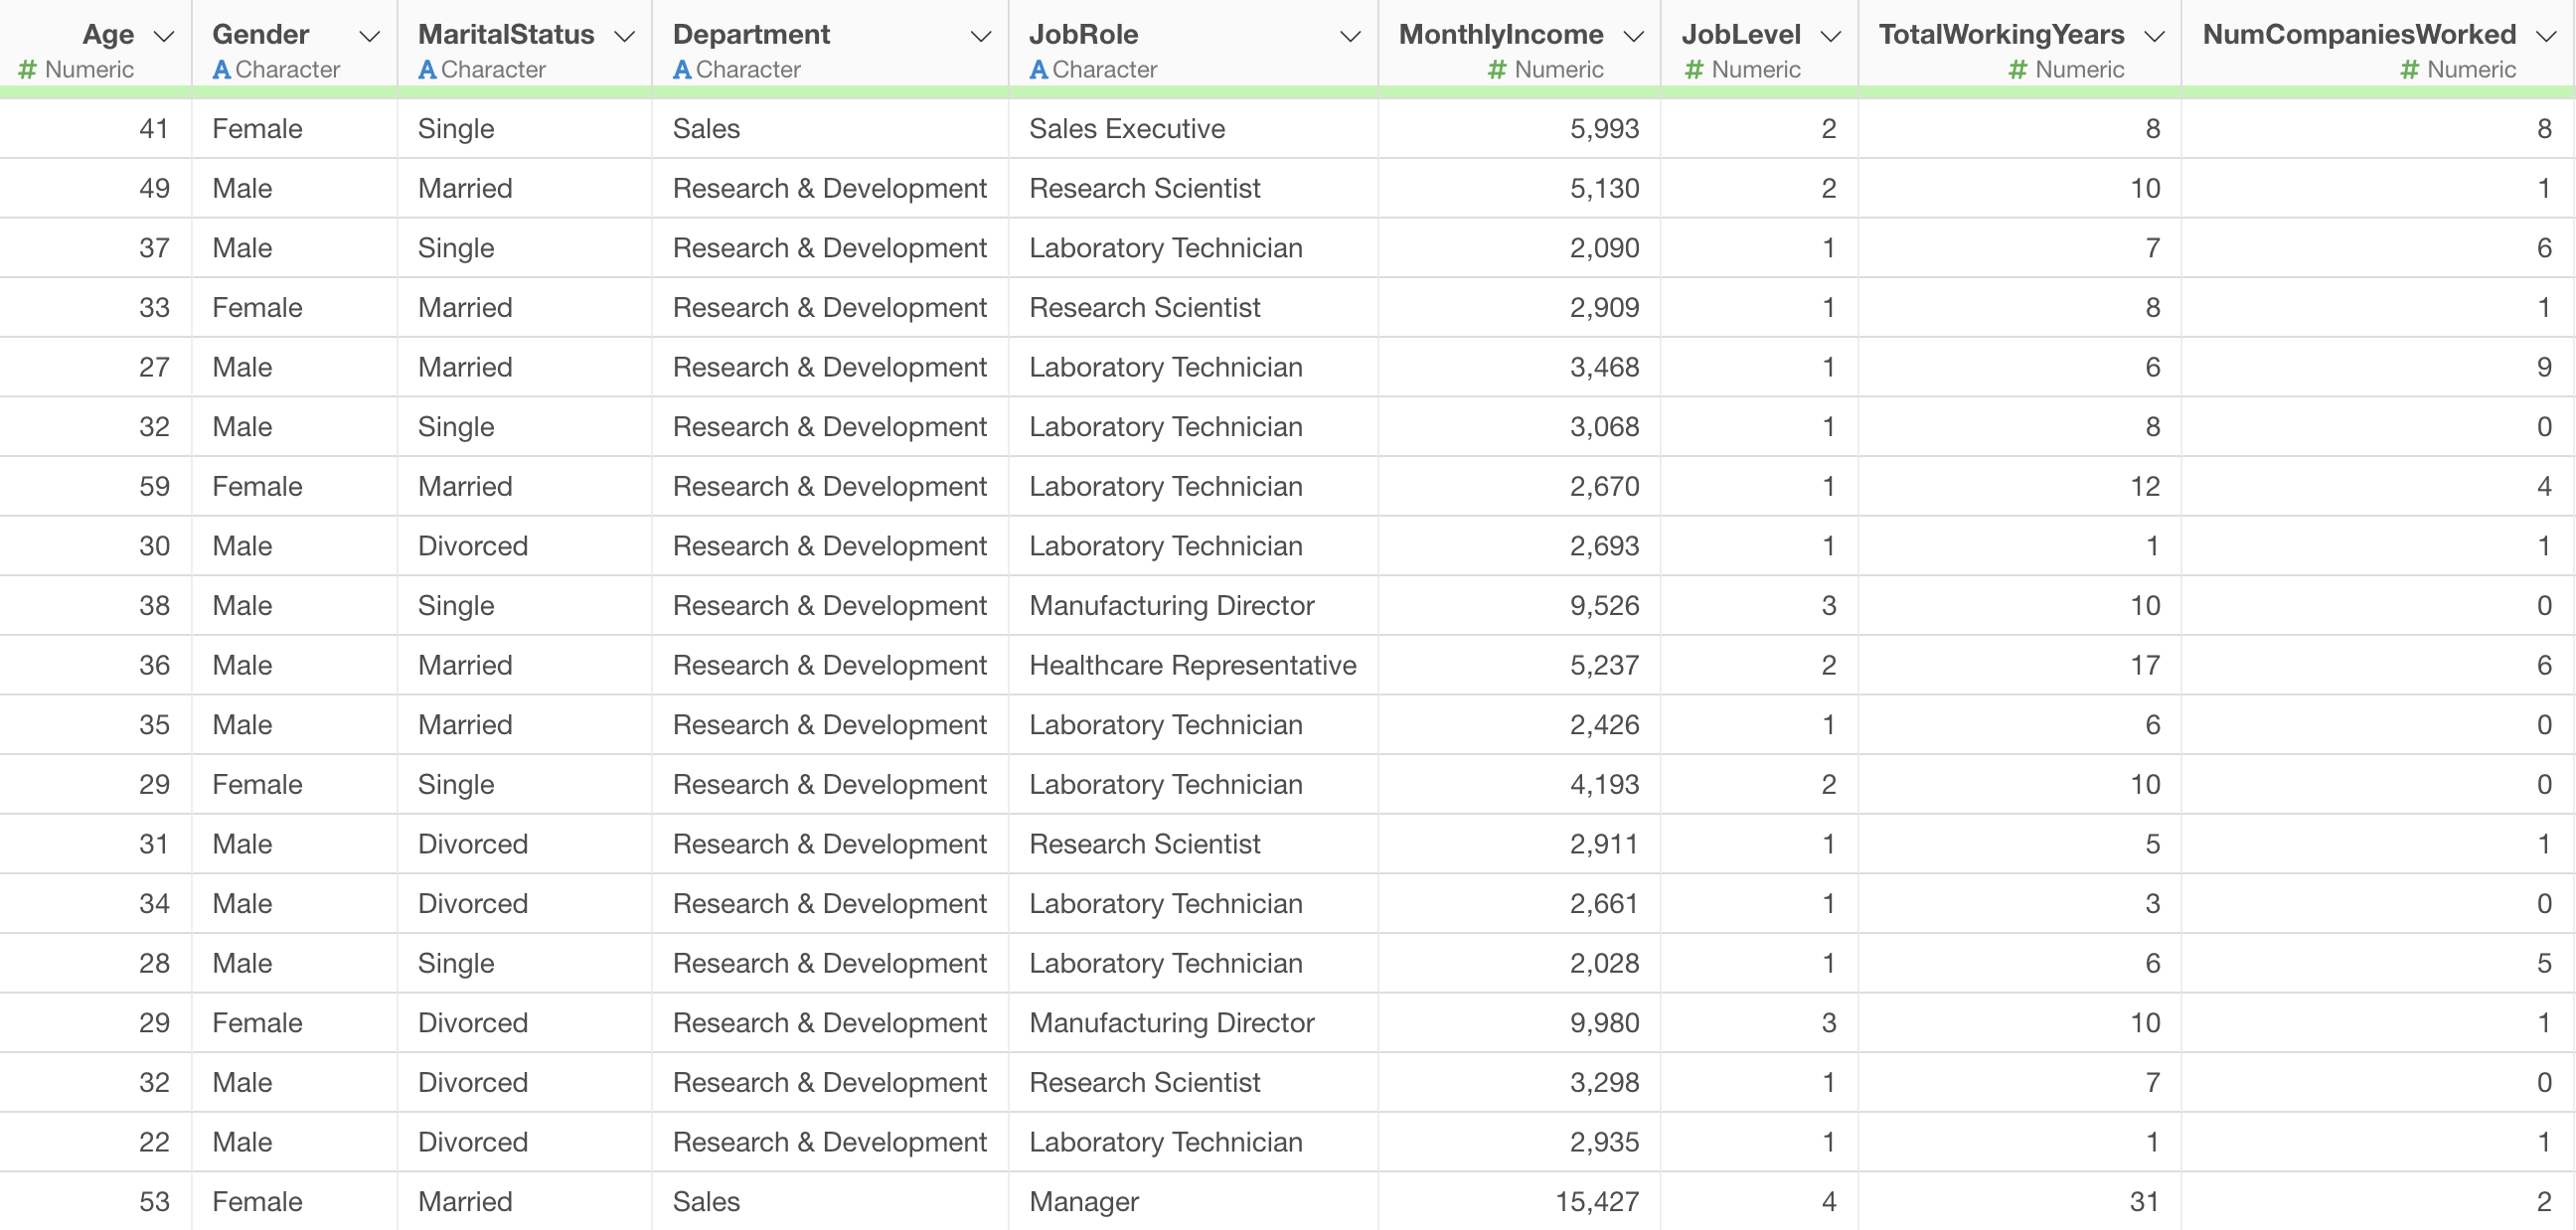
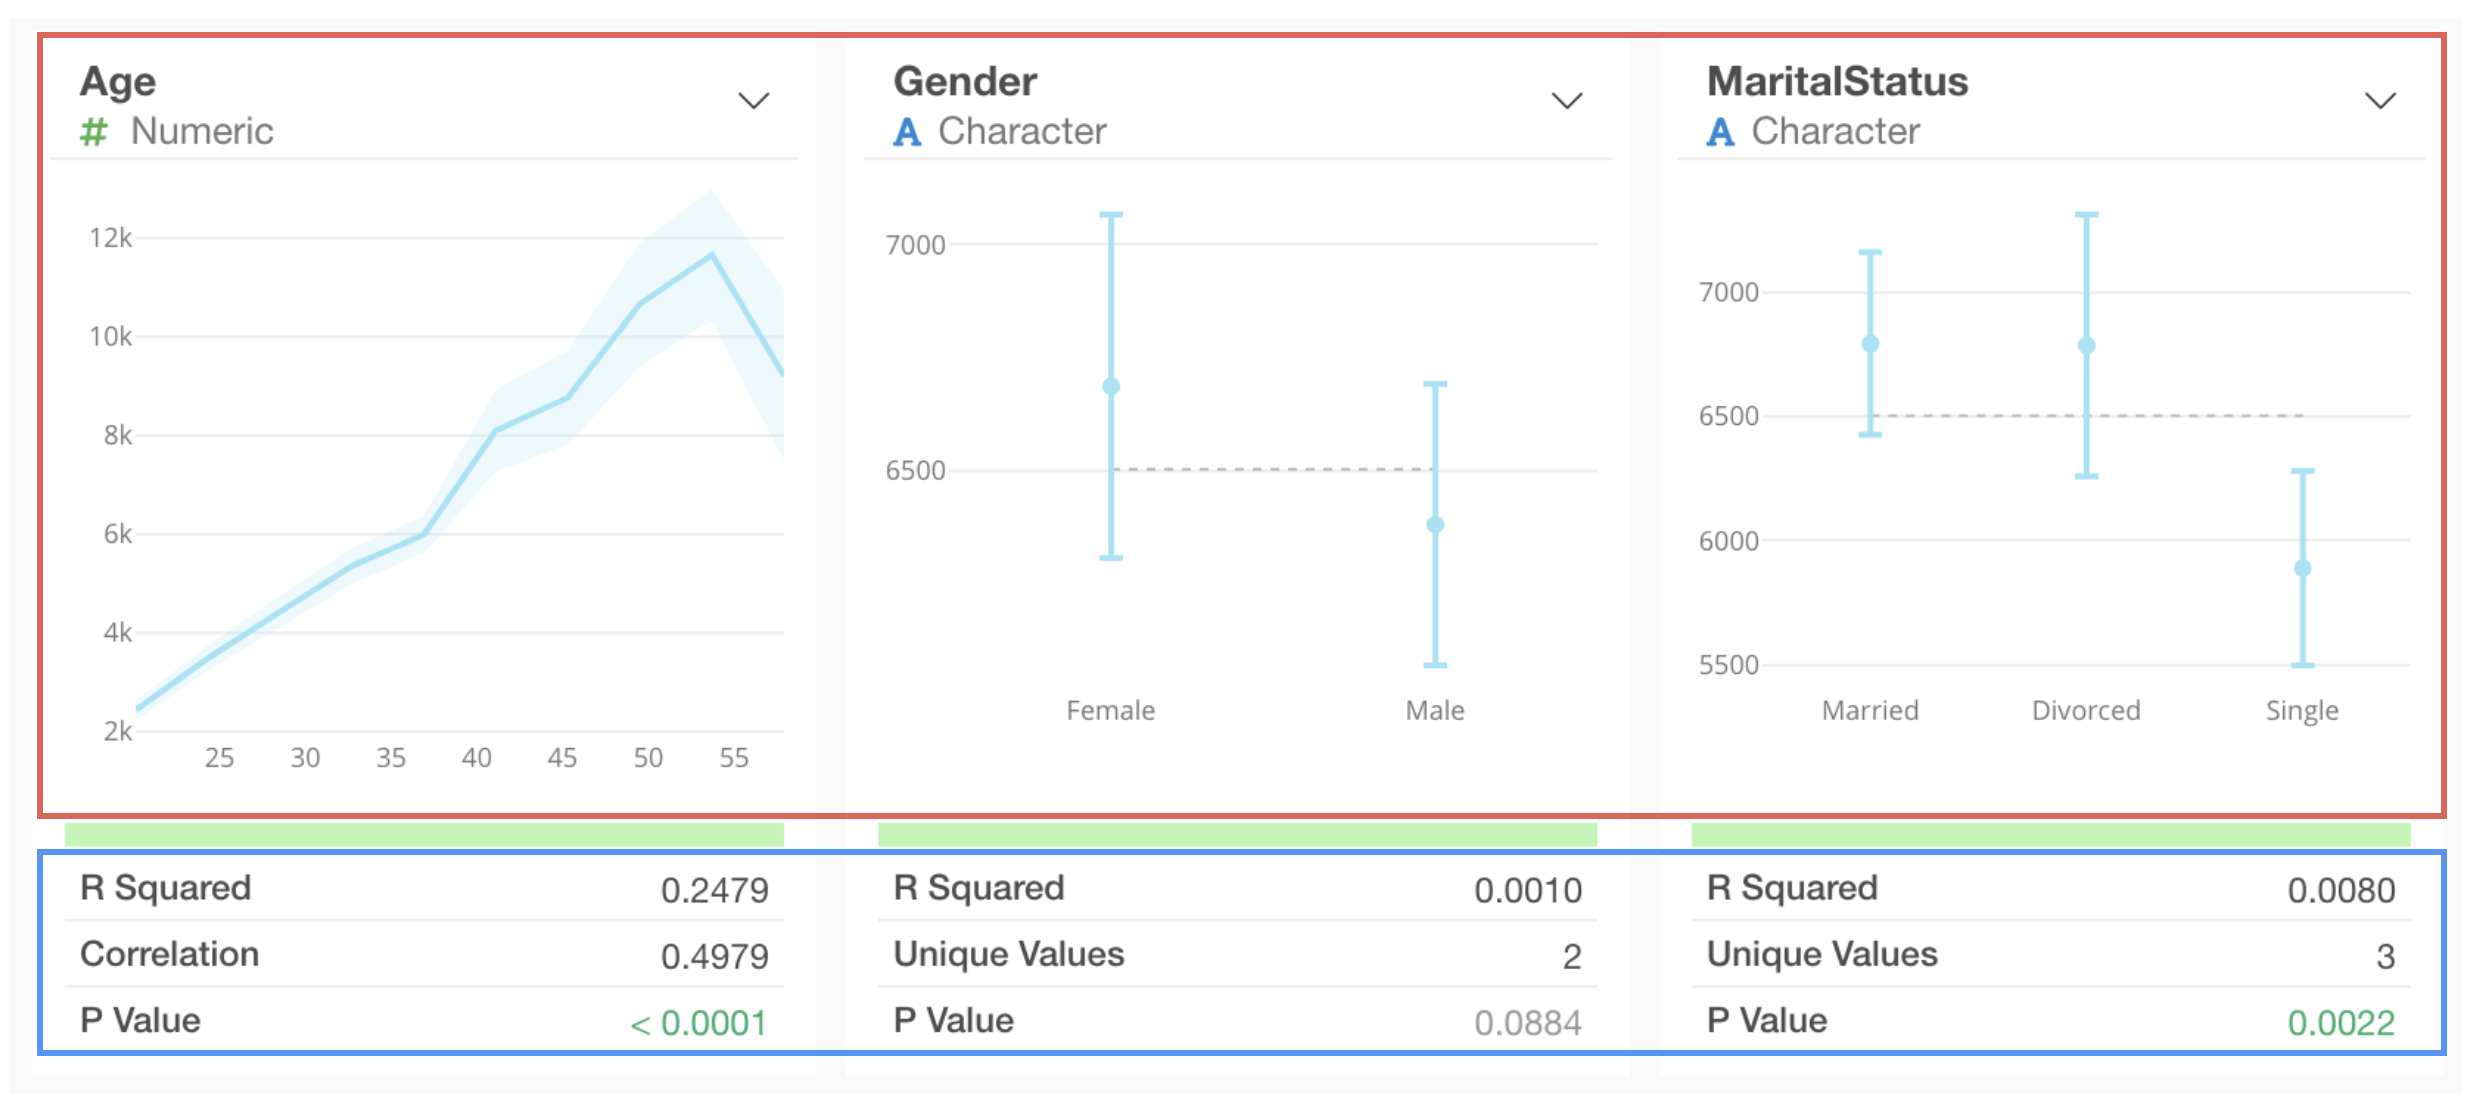
We will use employee data for this example. Each row represents one employee, and columns contain attribute information such as Monthly Income and years of service.
Let’s say we want to find out what factors are related to employee “Monthly Income.”
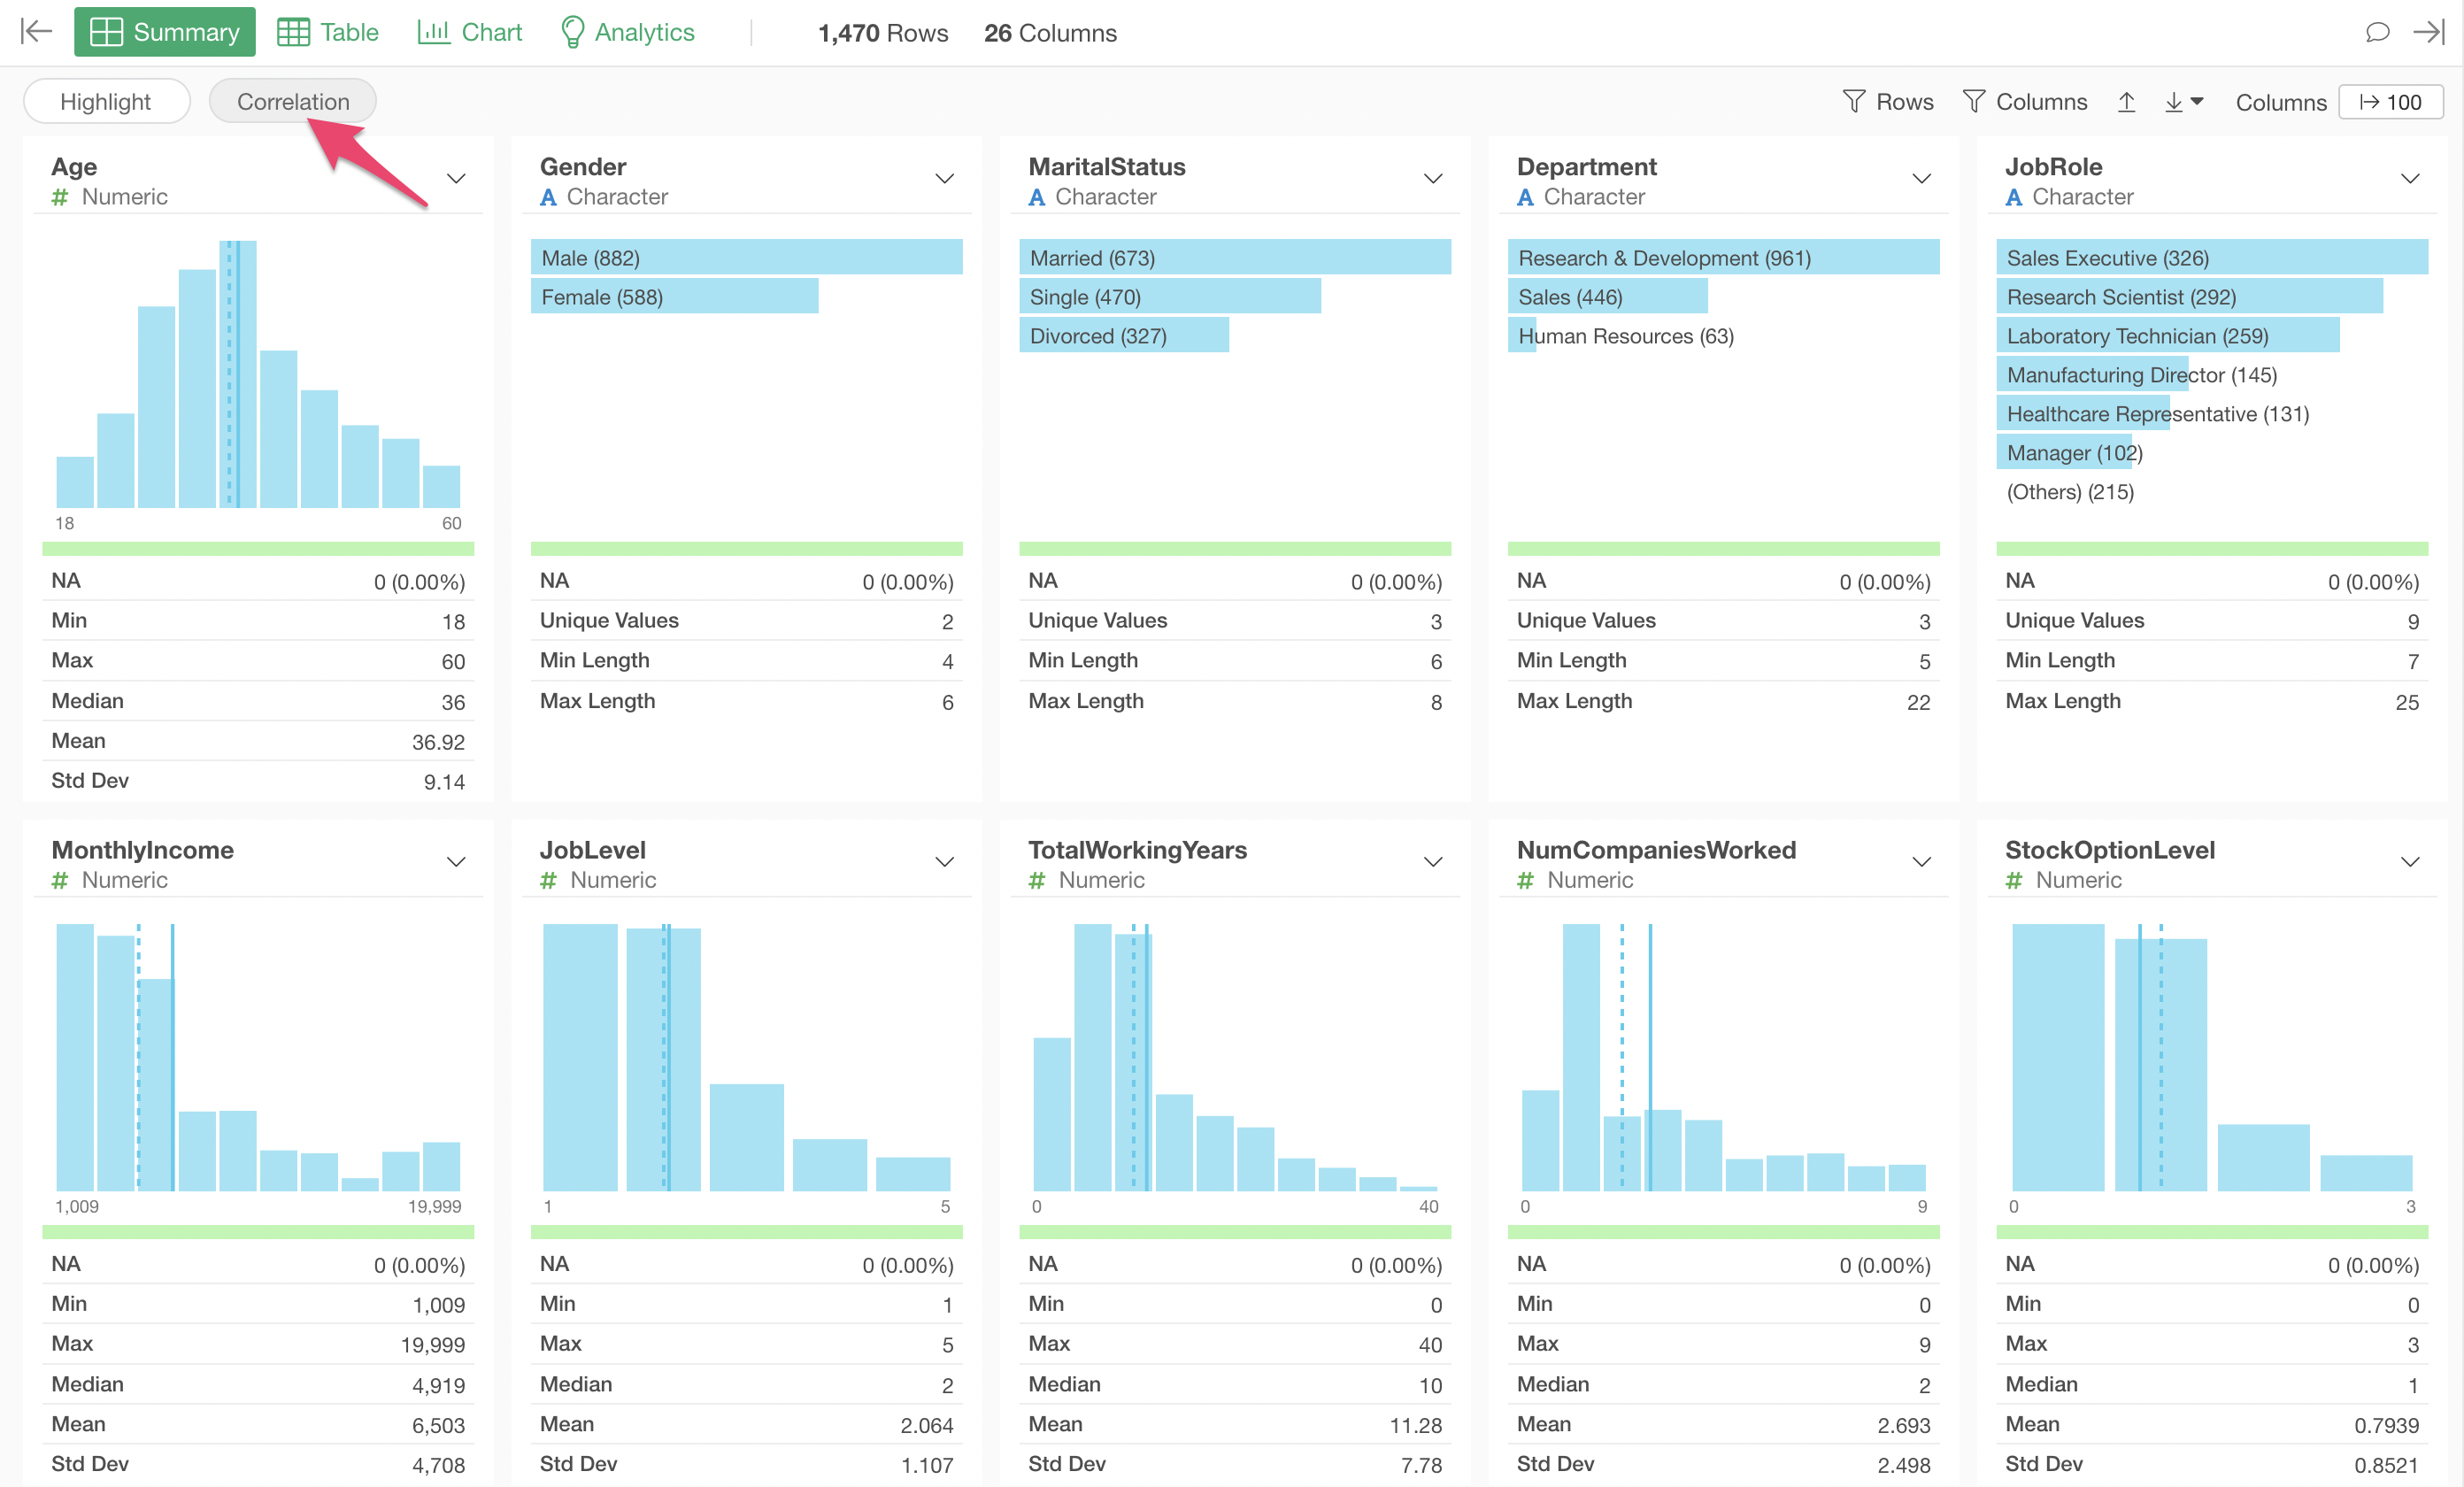
Open the Summary View of the data frame and click the “Correlation” button at the top.
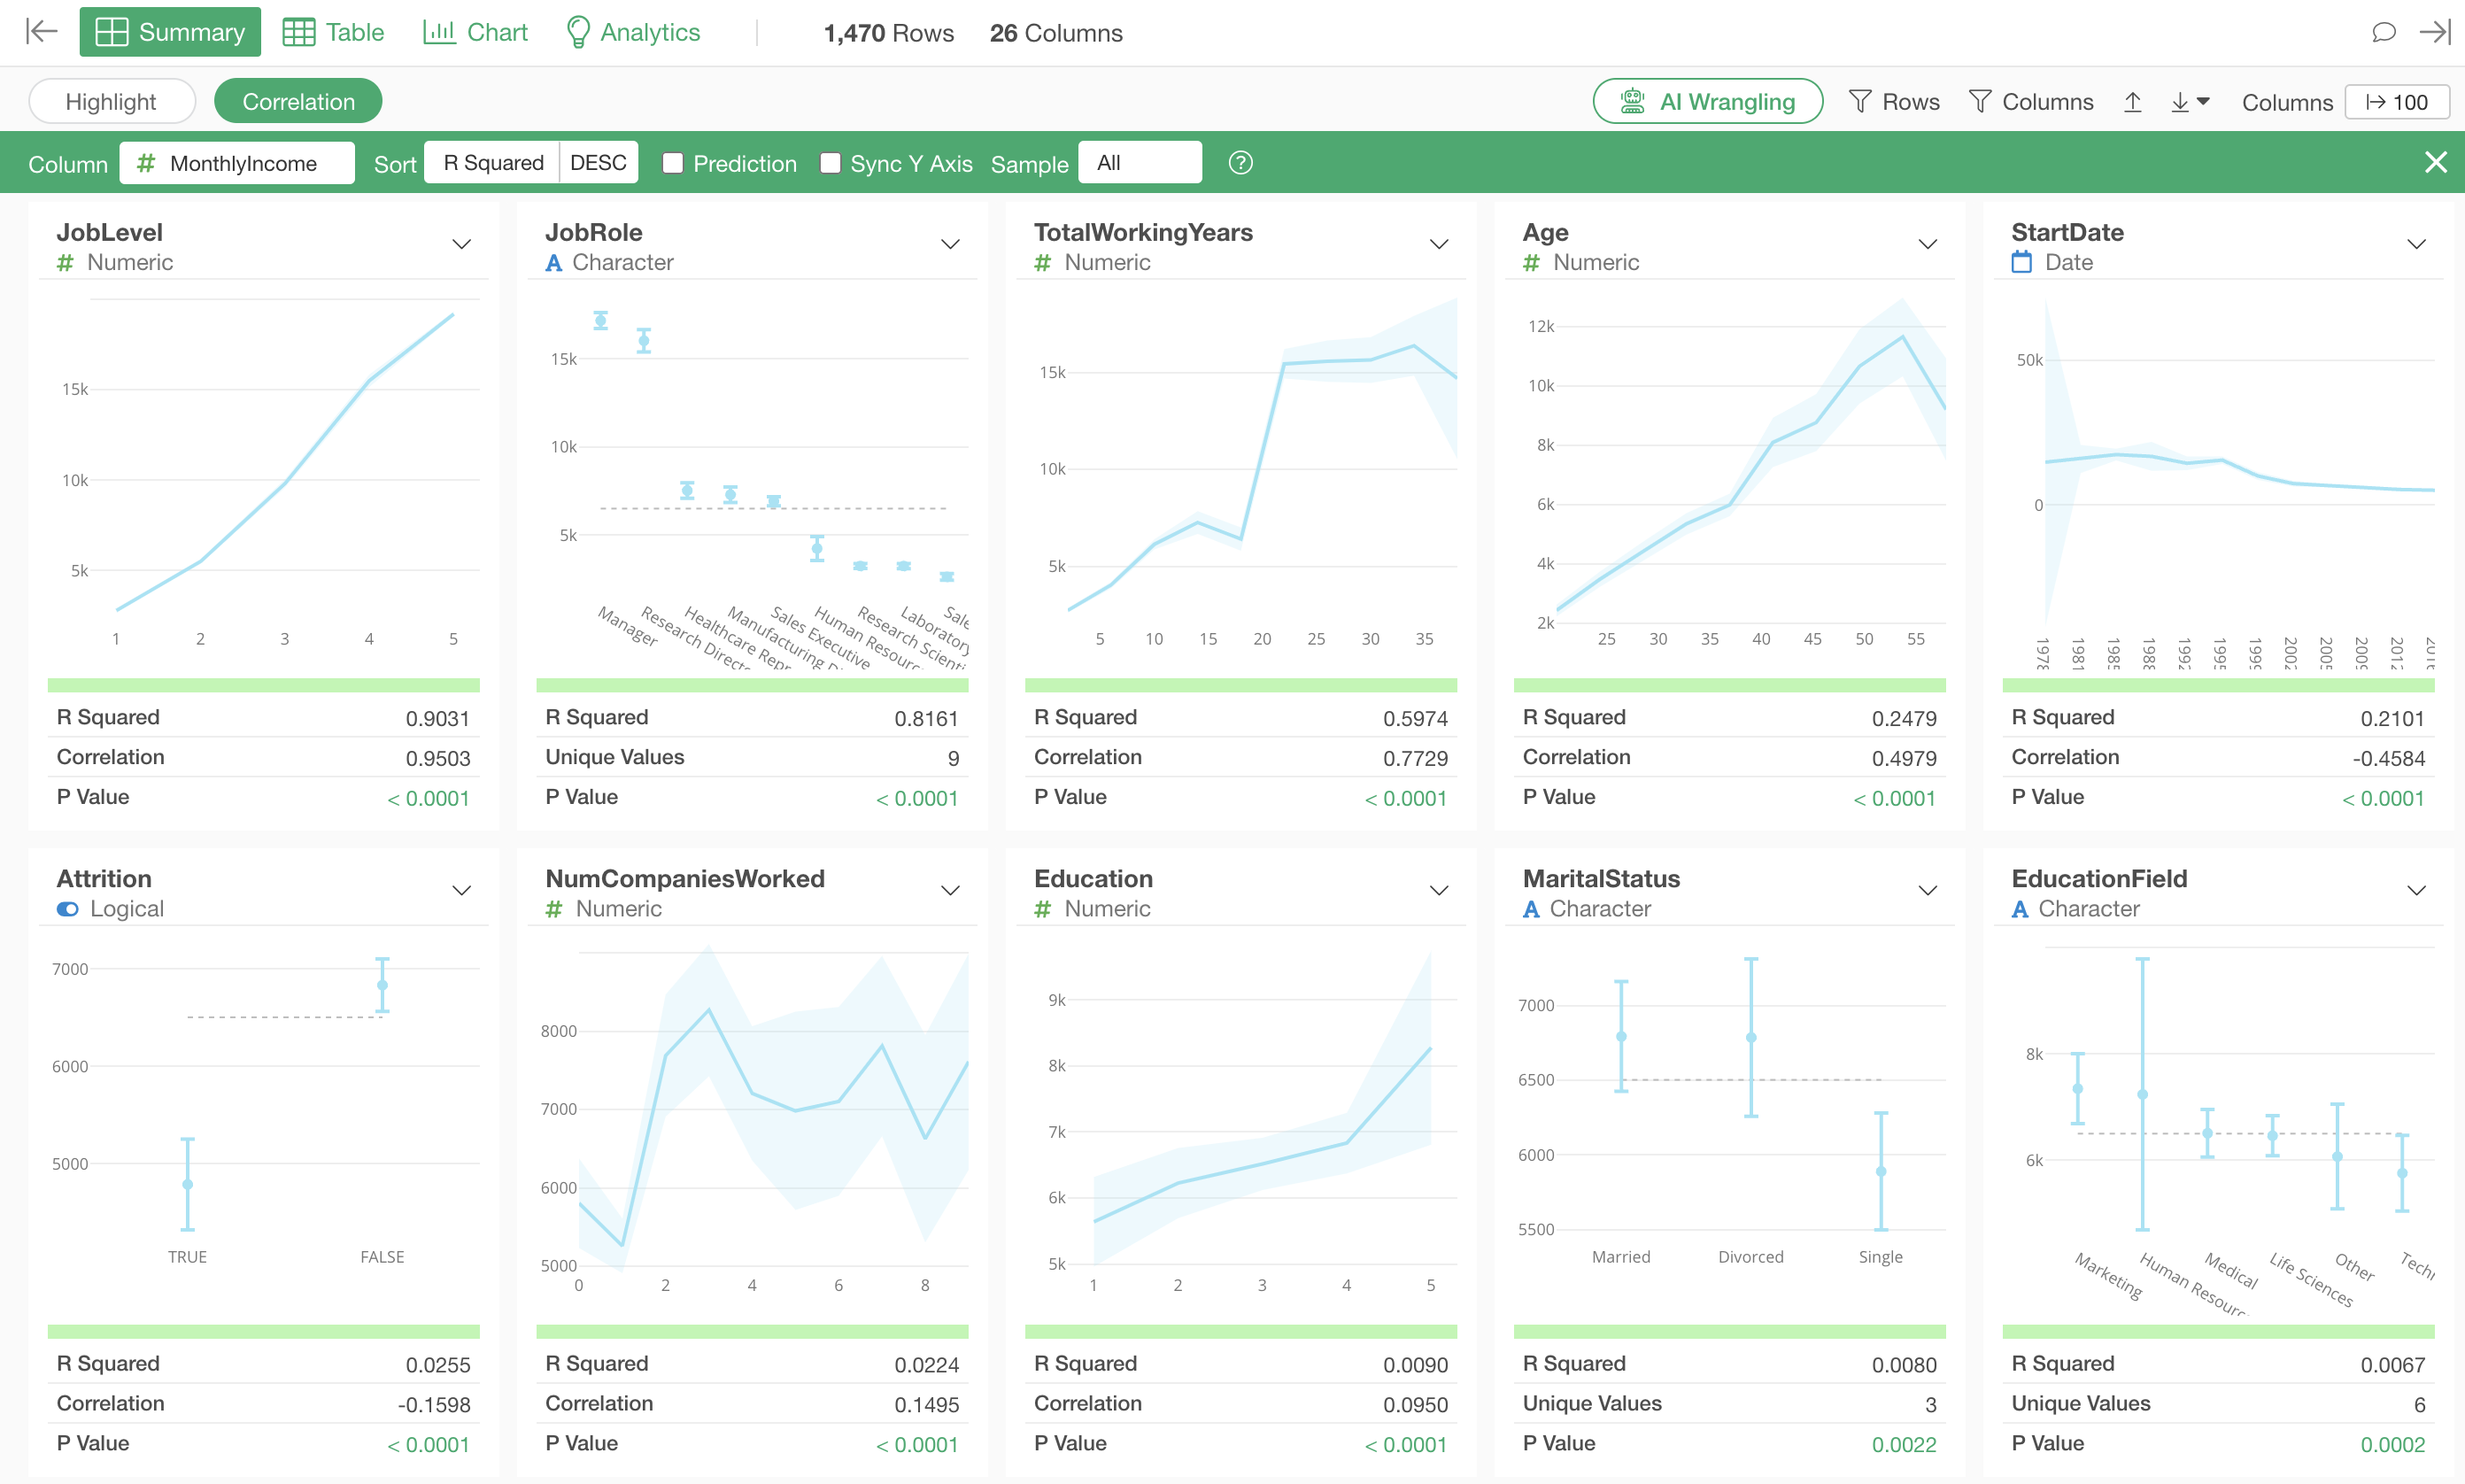
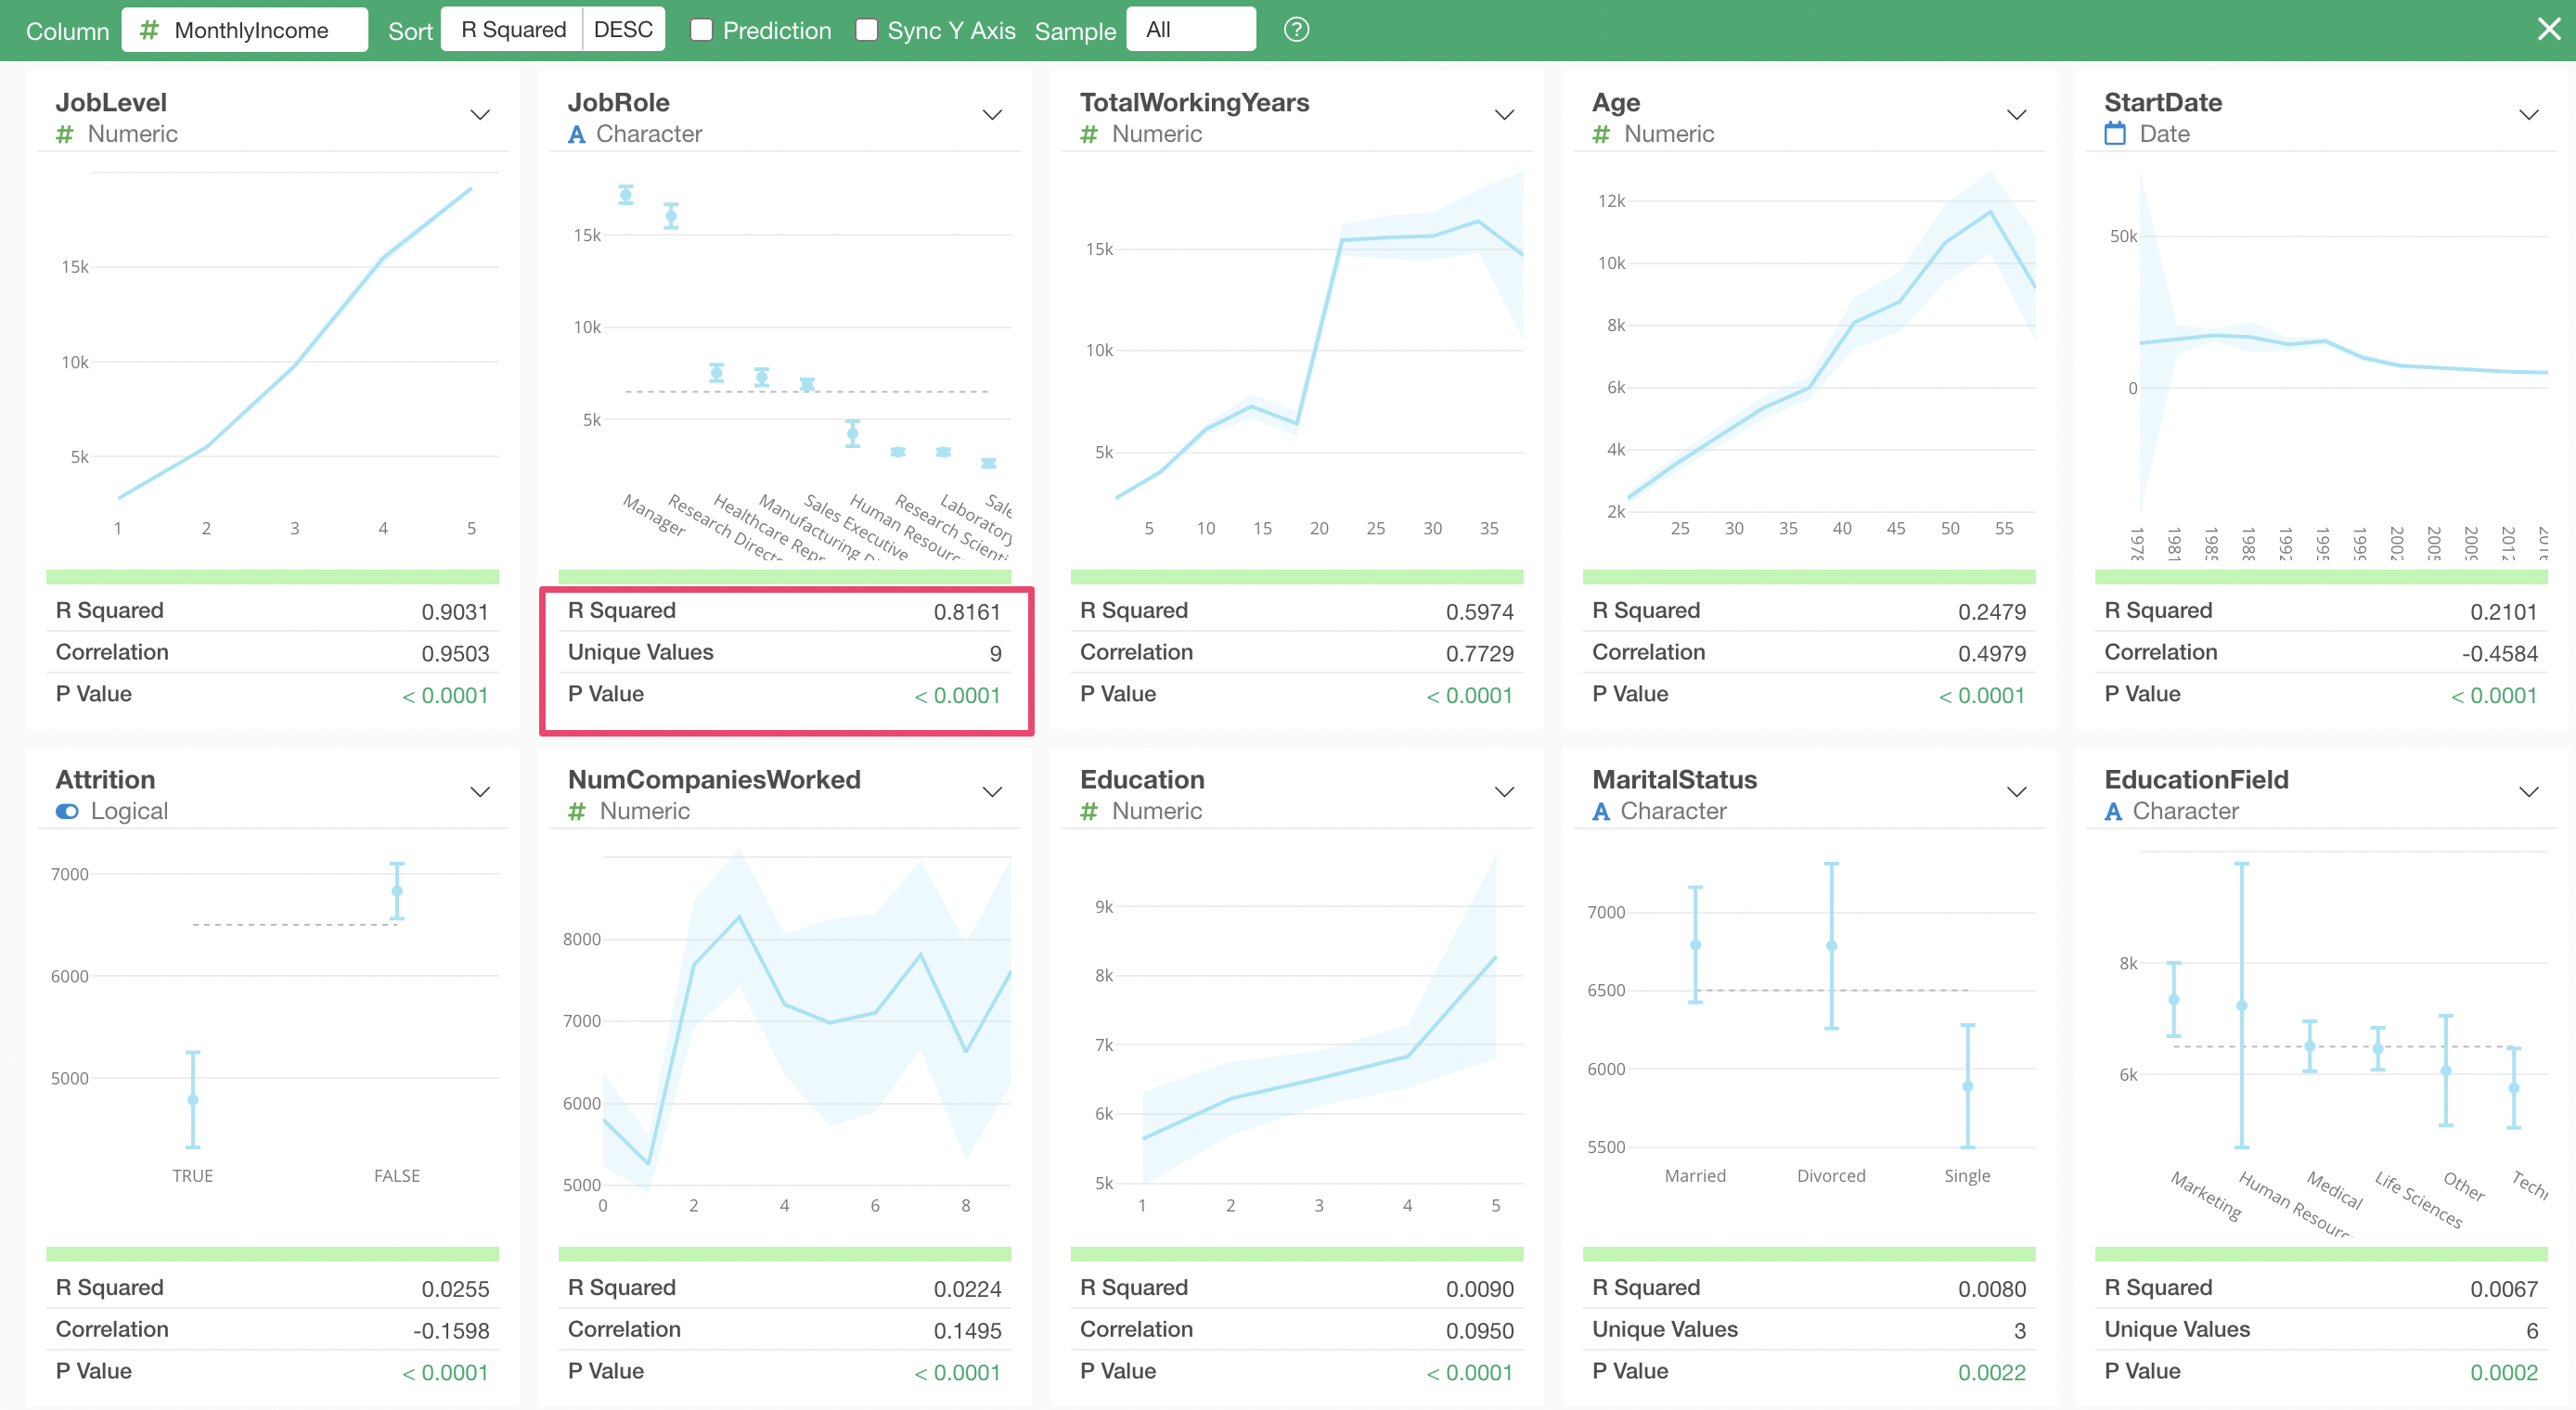
Once you switch to Correlation Mode, select the column you want to examine from the “Column” dropdown at the top left. Here, we select “MonthlyIncome” as an example.
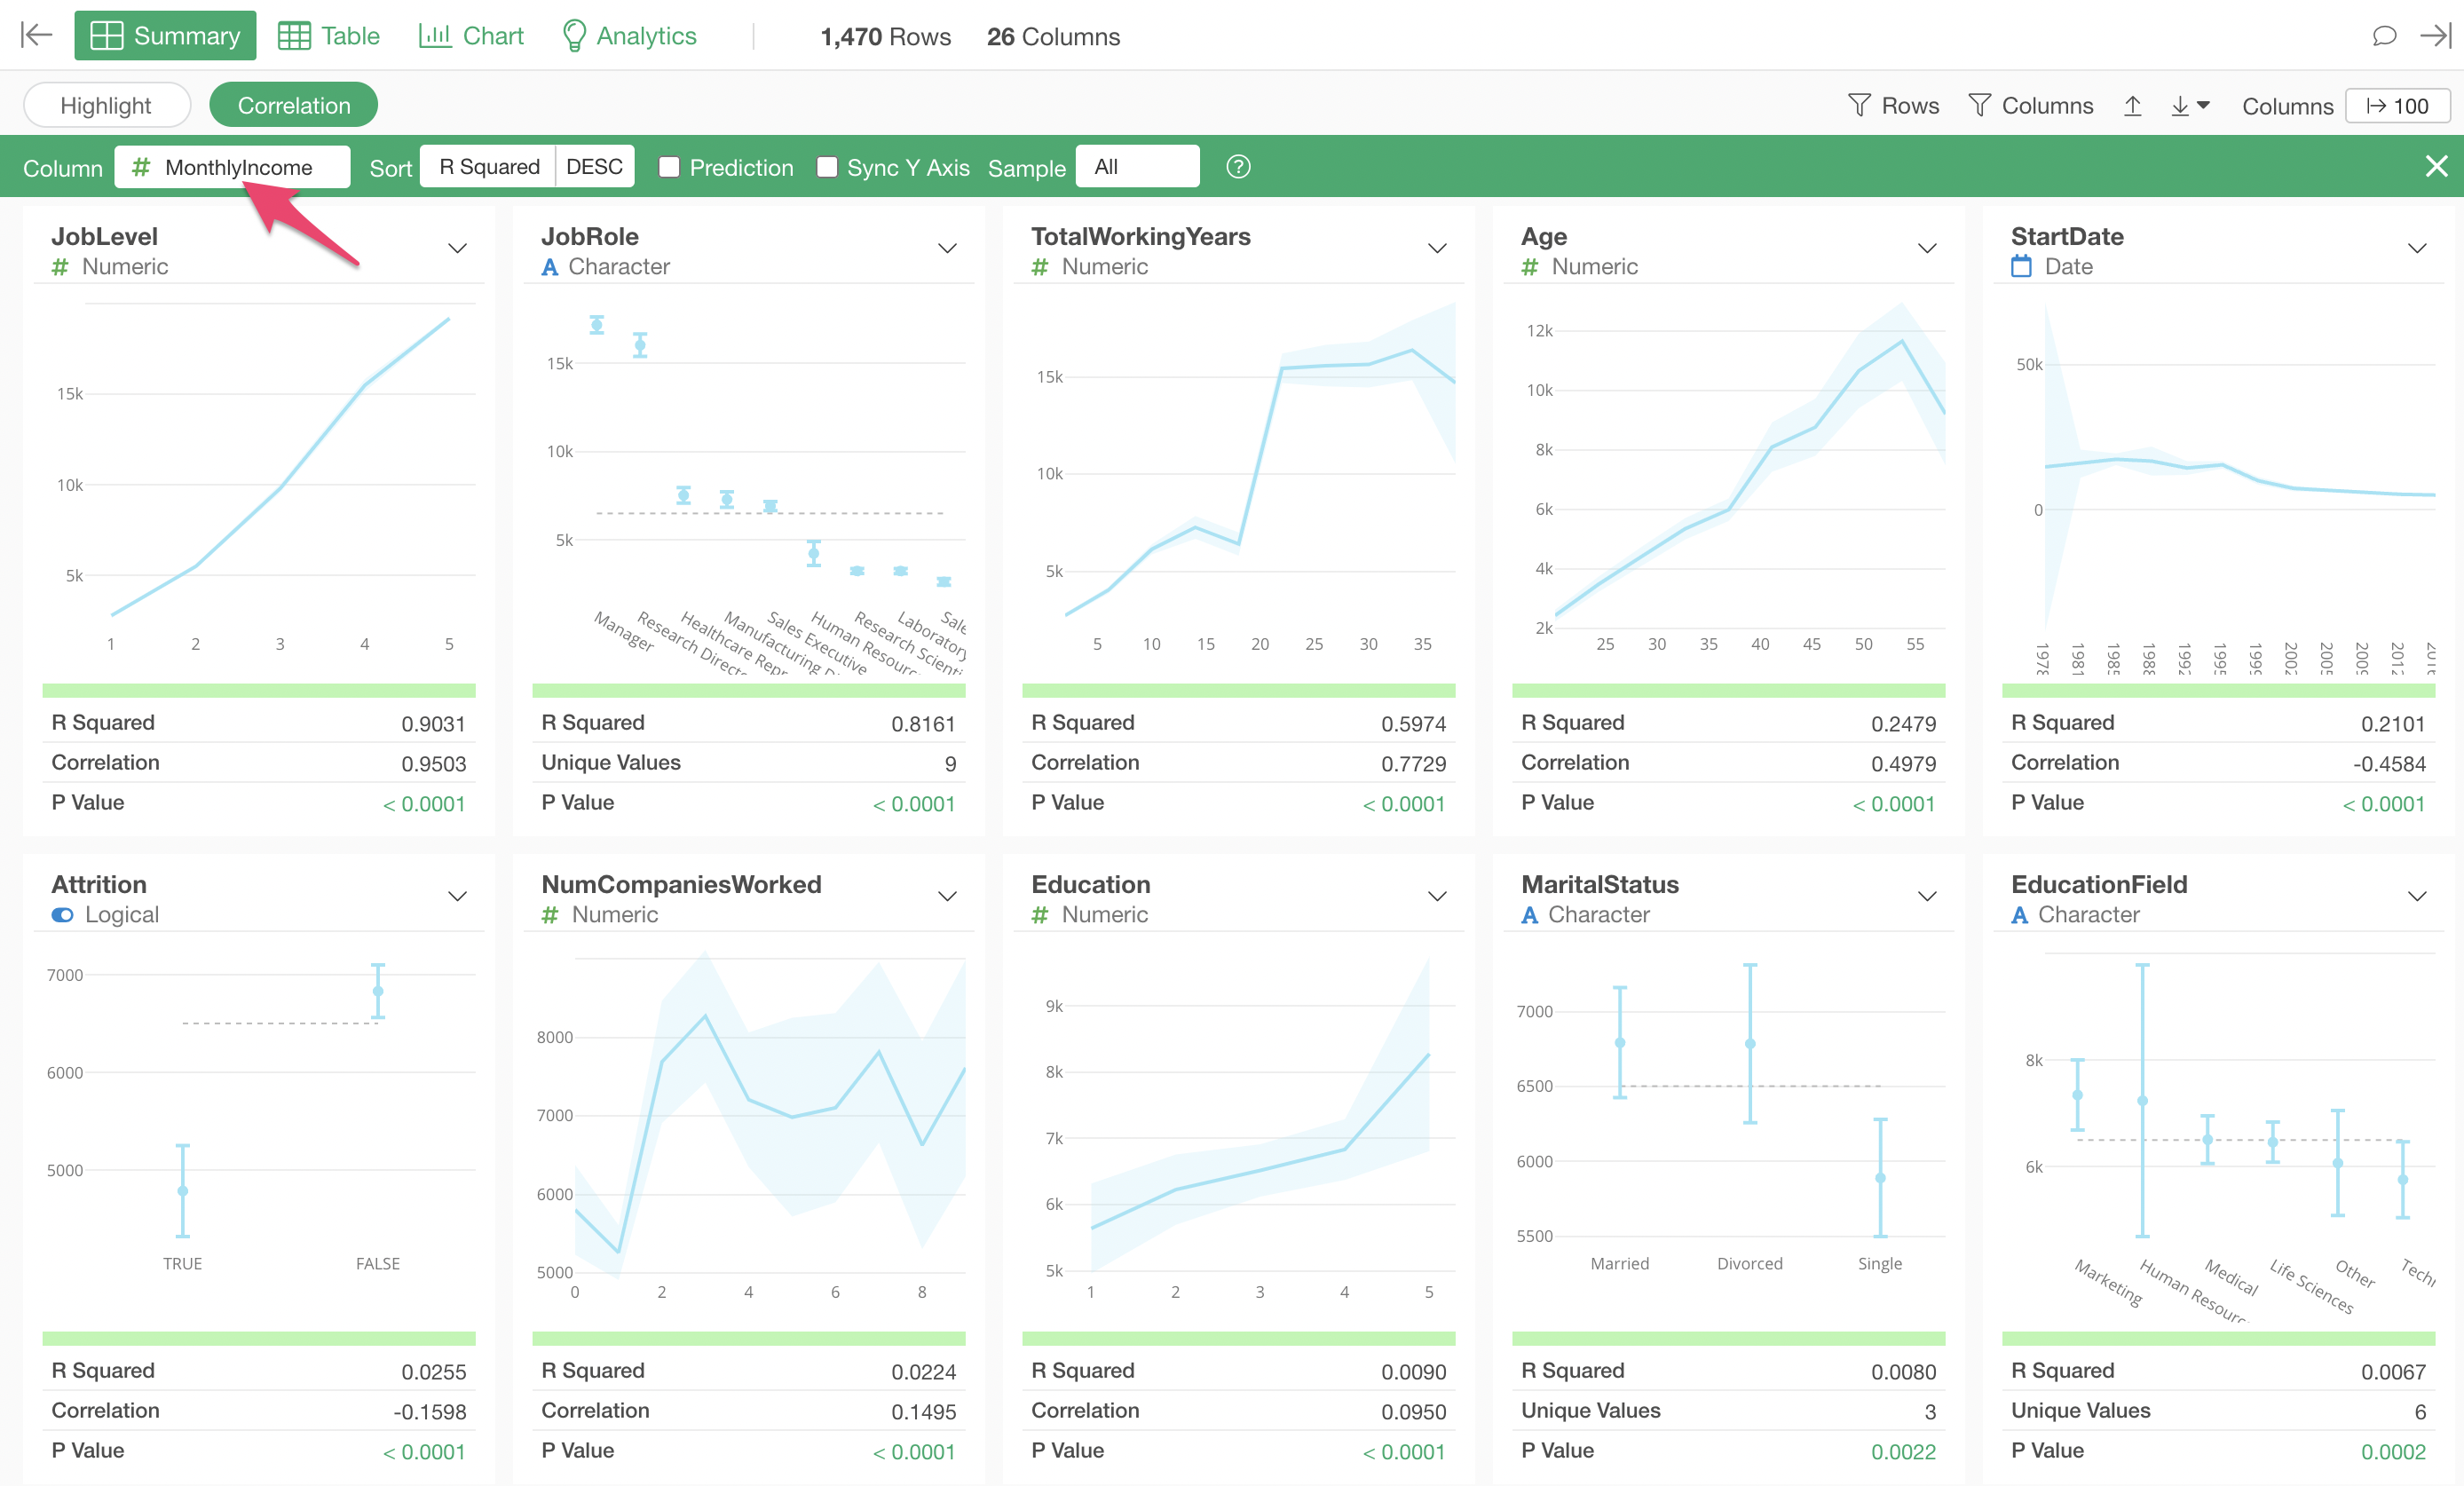
This will display charts showing the relationship with each variable according to its data type, indicators representing the strength of the correlation, and the significance of the relationship with each variable.
How to Interpret Charts
Numeric
For numeric types, values are divided into 10 equal-width intervals, and the average value for each interval is visualized as a line chart. The light blue shaded area represents the 95% confidence interval.
The length of the confidence interval varies depending on the amount and variability of the data. It becomes shorter as the amount of data increases and as variability decreases.

Category
For categorical types, the average value for each category and its 95% confidence interval are visualized as error bars.
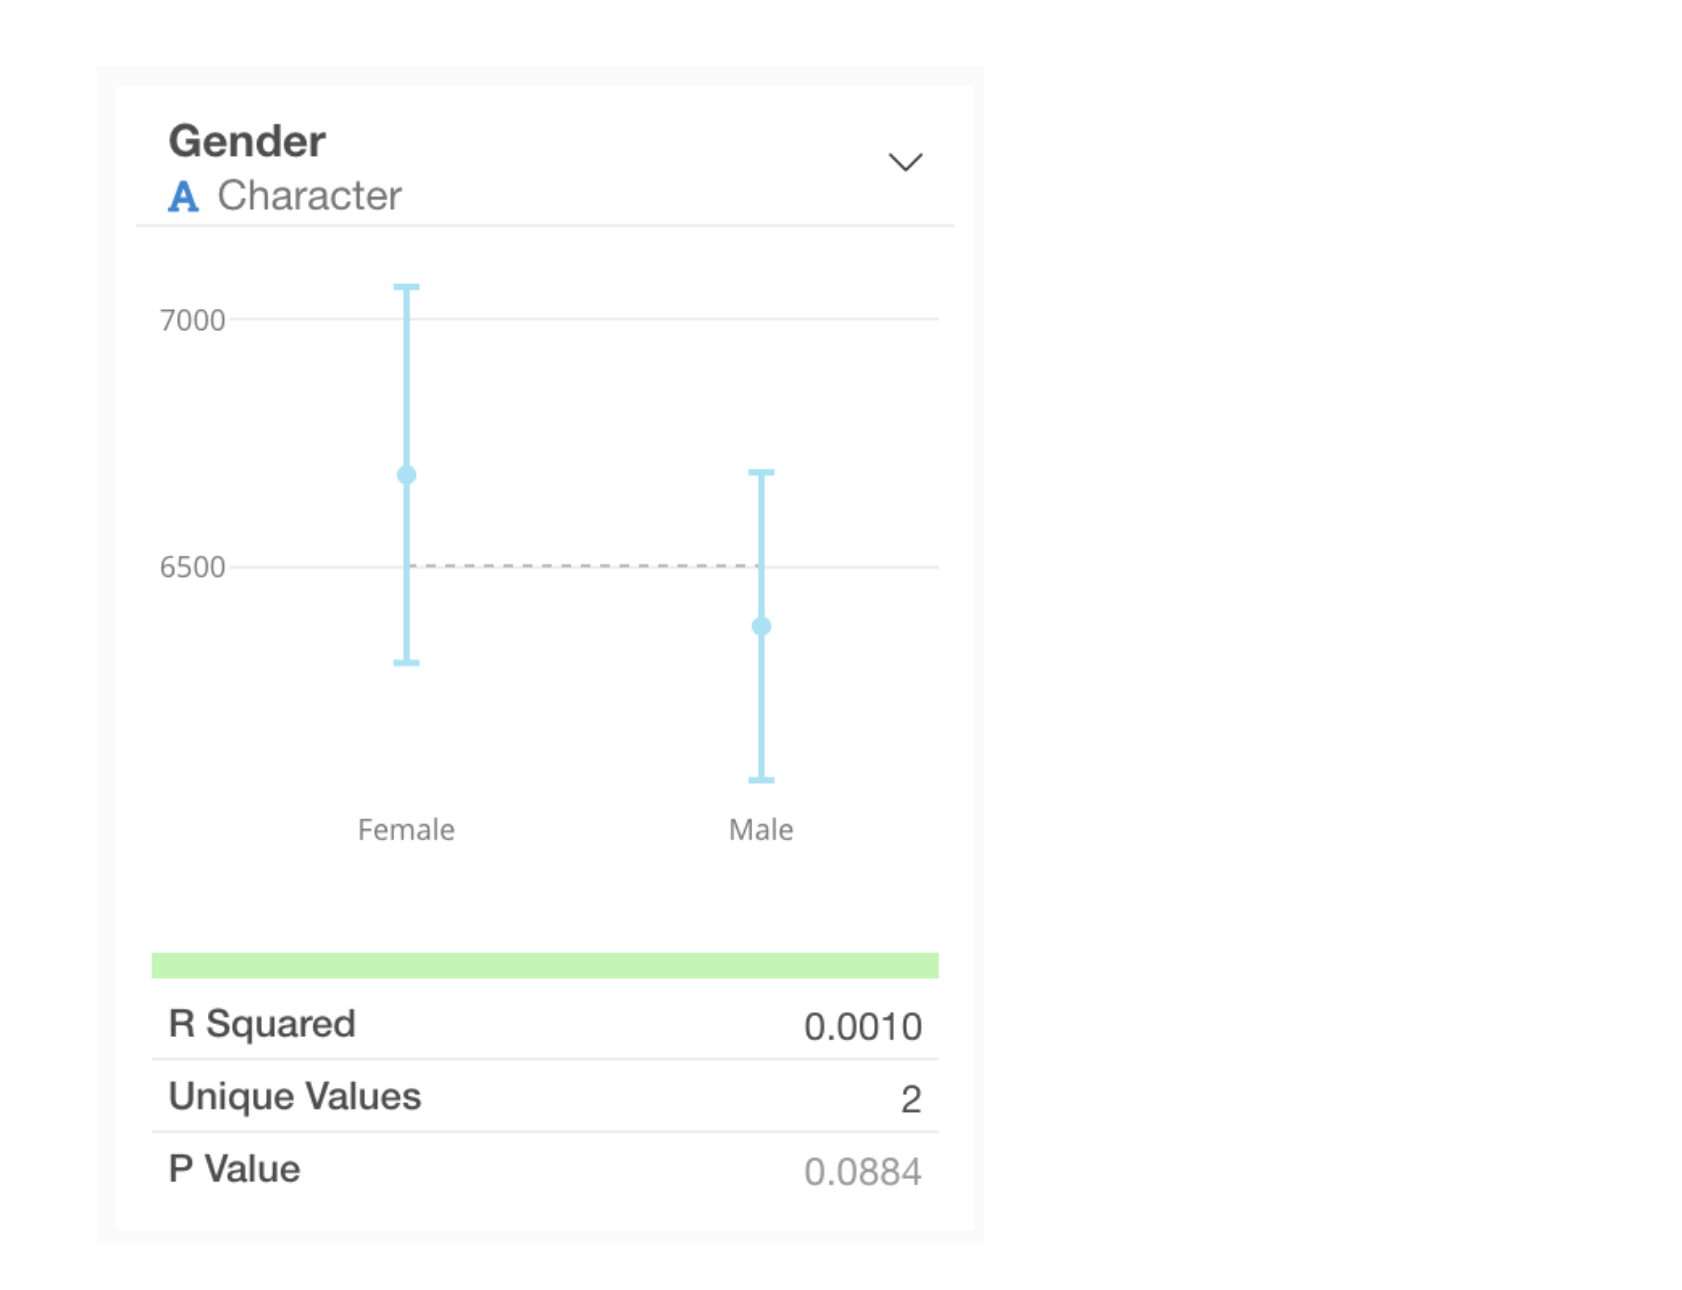
How to Interpret Indicators
When a numeric column is selected as the target for correlation, the following indicators are displayed below the chart for each column.
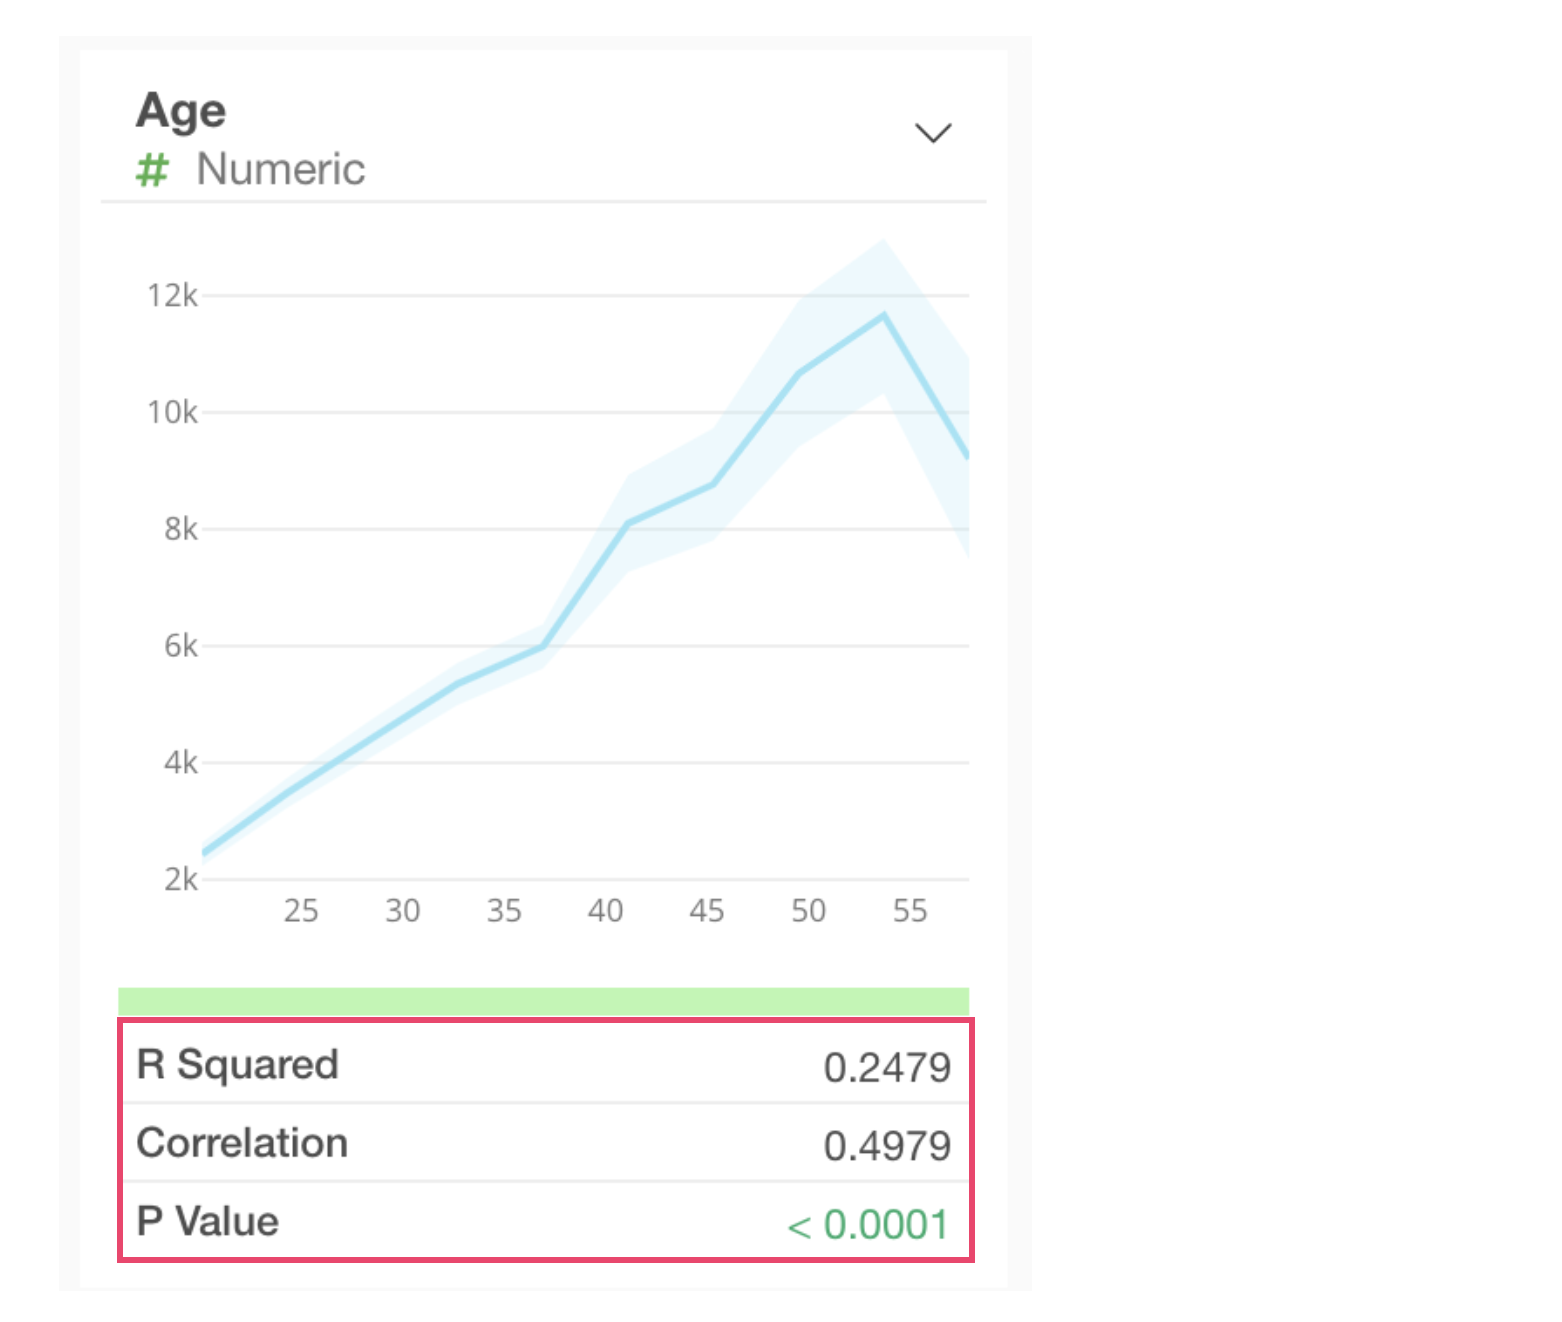
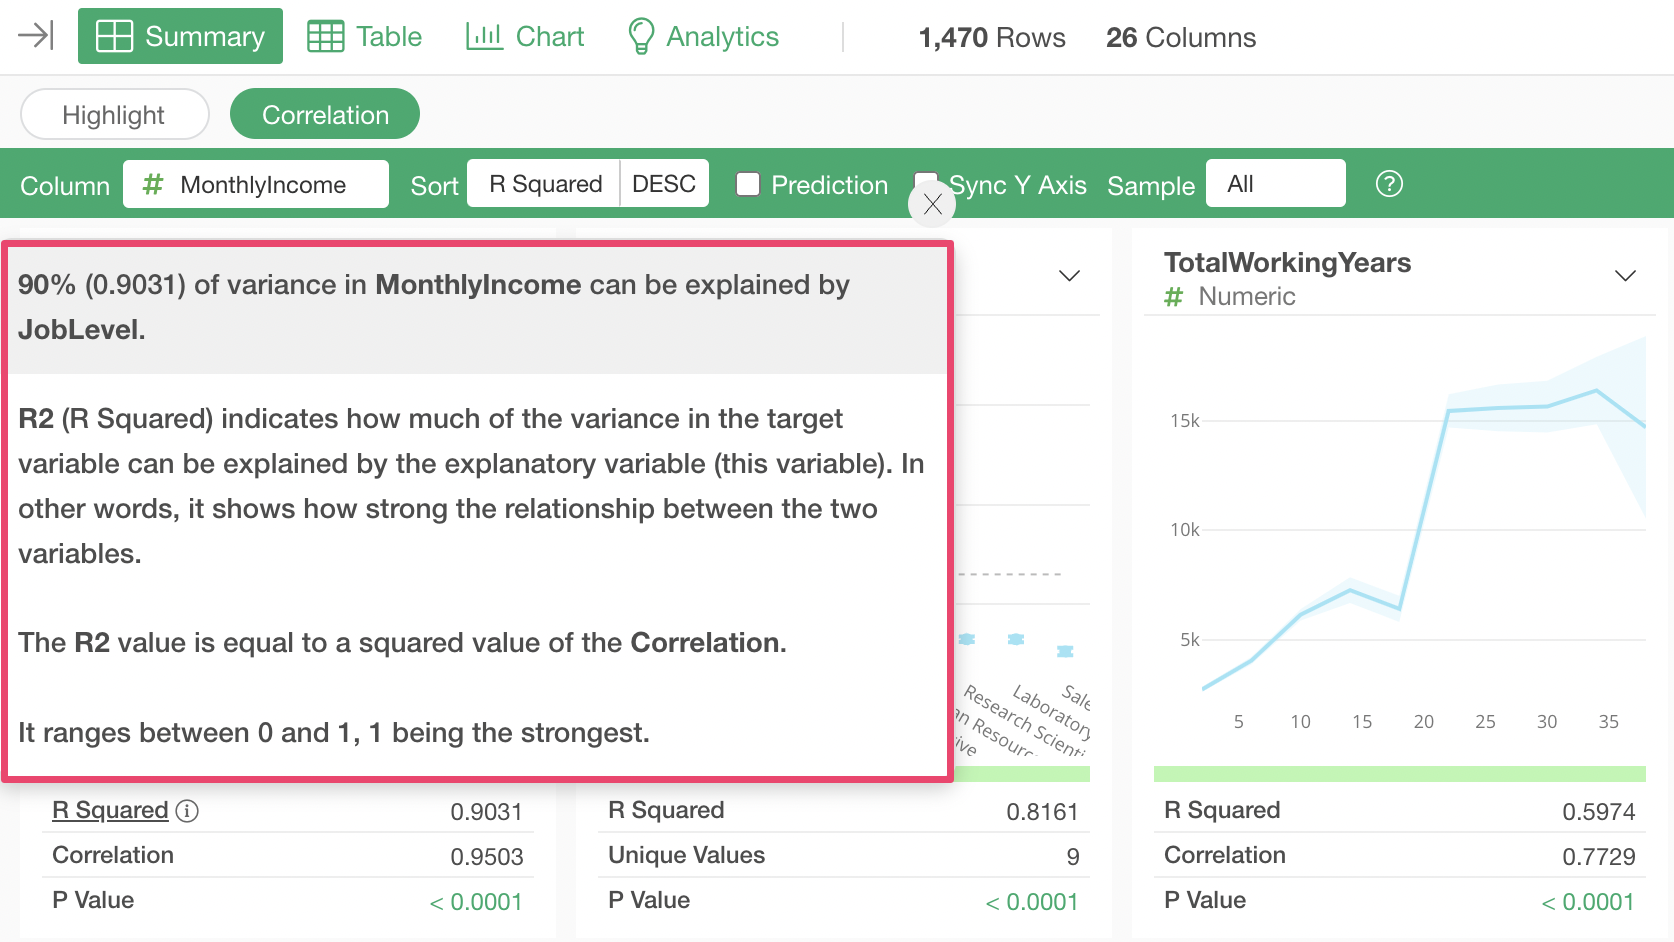
R-Squared: Indicates the proportion of the variance in the target variable that is explained by this variable. In other words, it represents the strength of the relationship between the two variables. The R-Squared value equals the square of the correlation coefficient. It ranges from 0 to 1, with 1 indicating the strongest relationship.
P-Value: Indicates the probability of observing a relationship like the one found here, given the null hypothesis that there is no relationship between the two variables. A threshold of 0.05 (5%) is commonly used, and values lower than this are considered statistically significant.
Correlation Coefficient: Represents the strength of the correlation with the target variable. It ranges from -1 to 1, where -1 indicates the strongest negative correlation, 1 indicates the strongest positive correlation, and 0 indicates no correlation.
You can check the meaning of each indicator by clicking the “i” icon to the right of it.
For example, clicking the “i” icon for the R-Squared indicator displays a pop-up like the one below, where you can confirm the meaning of the indicator.
Example of Interpreting Correlation Mode Results
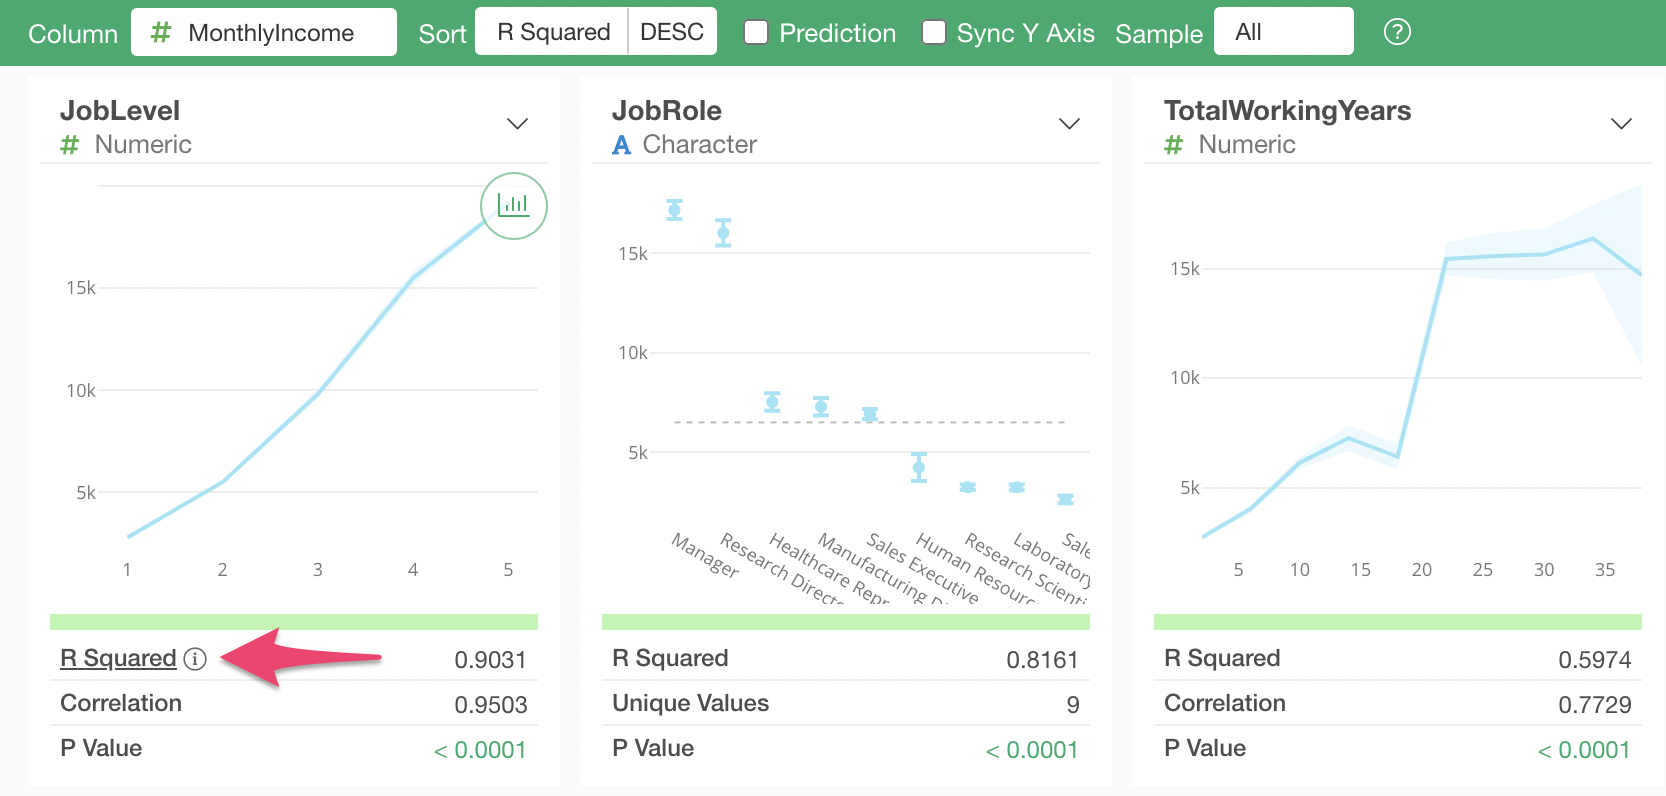
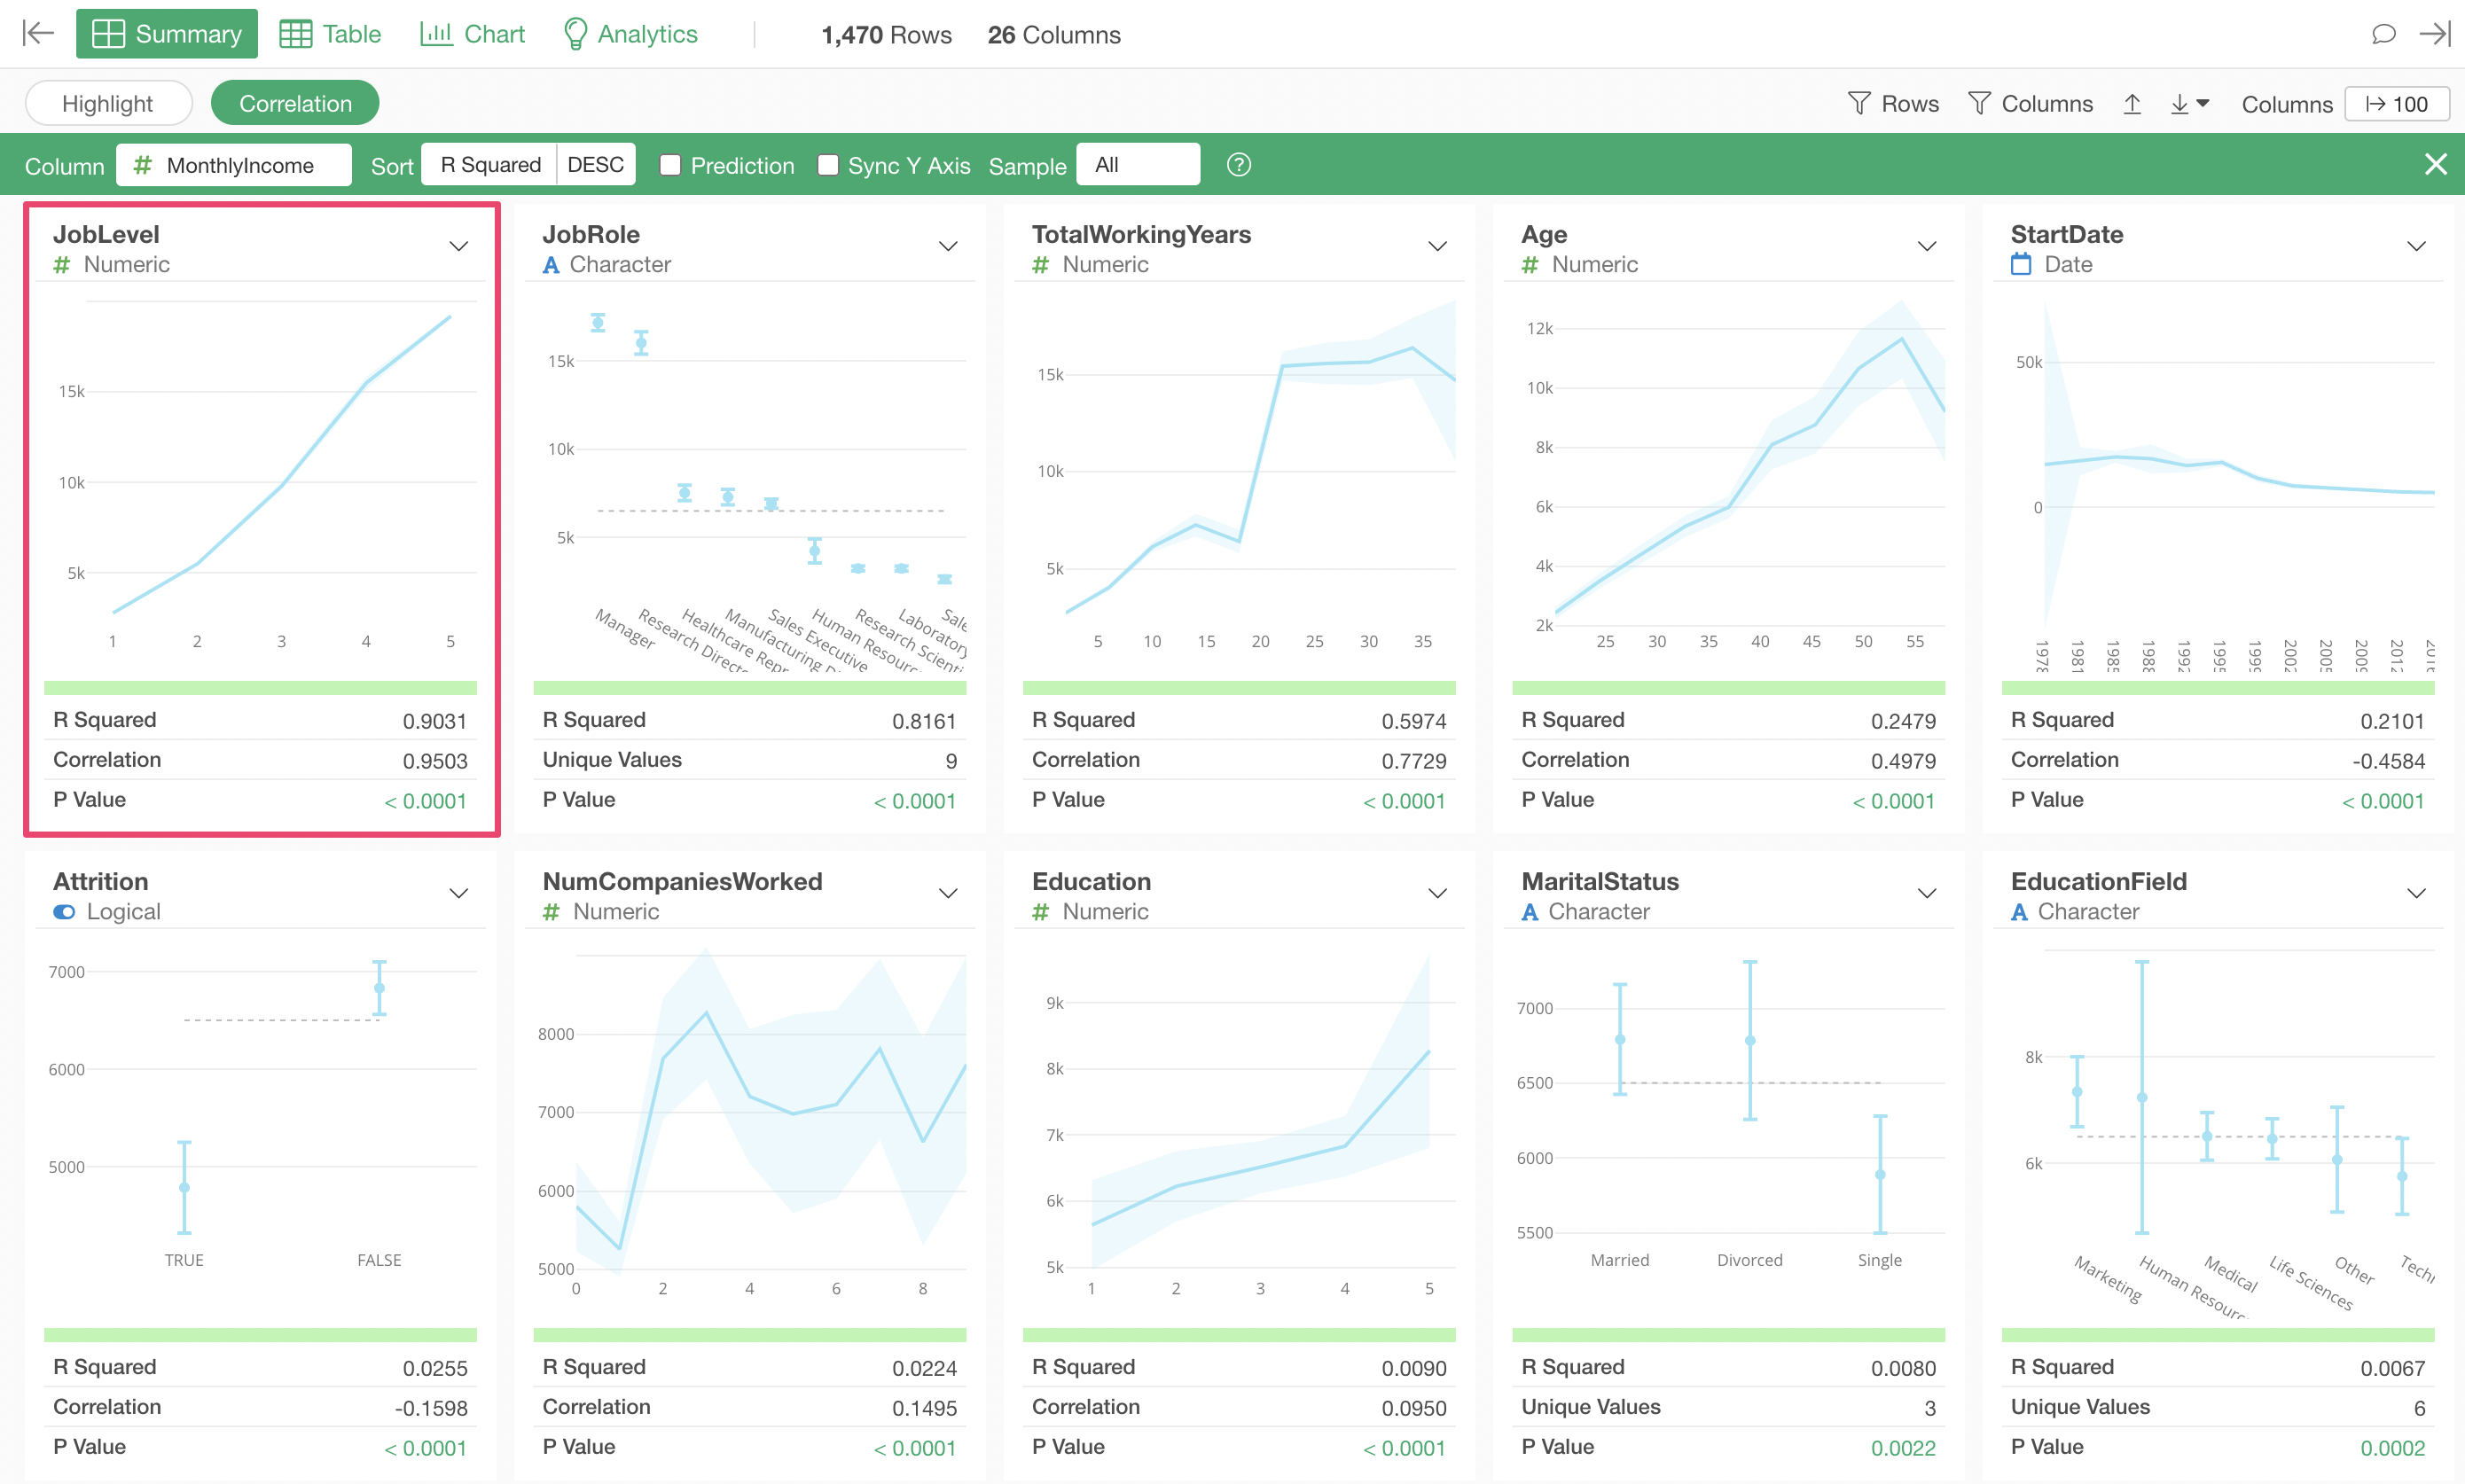
When using Correlation Mode, columns are sorted by default in descending order of “R-Squared” (strongest correlation first).
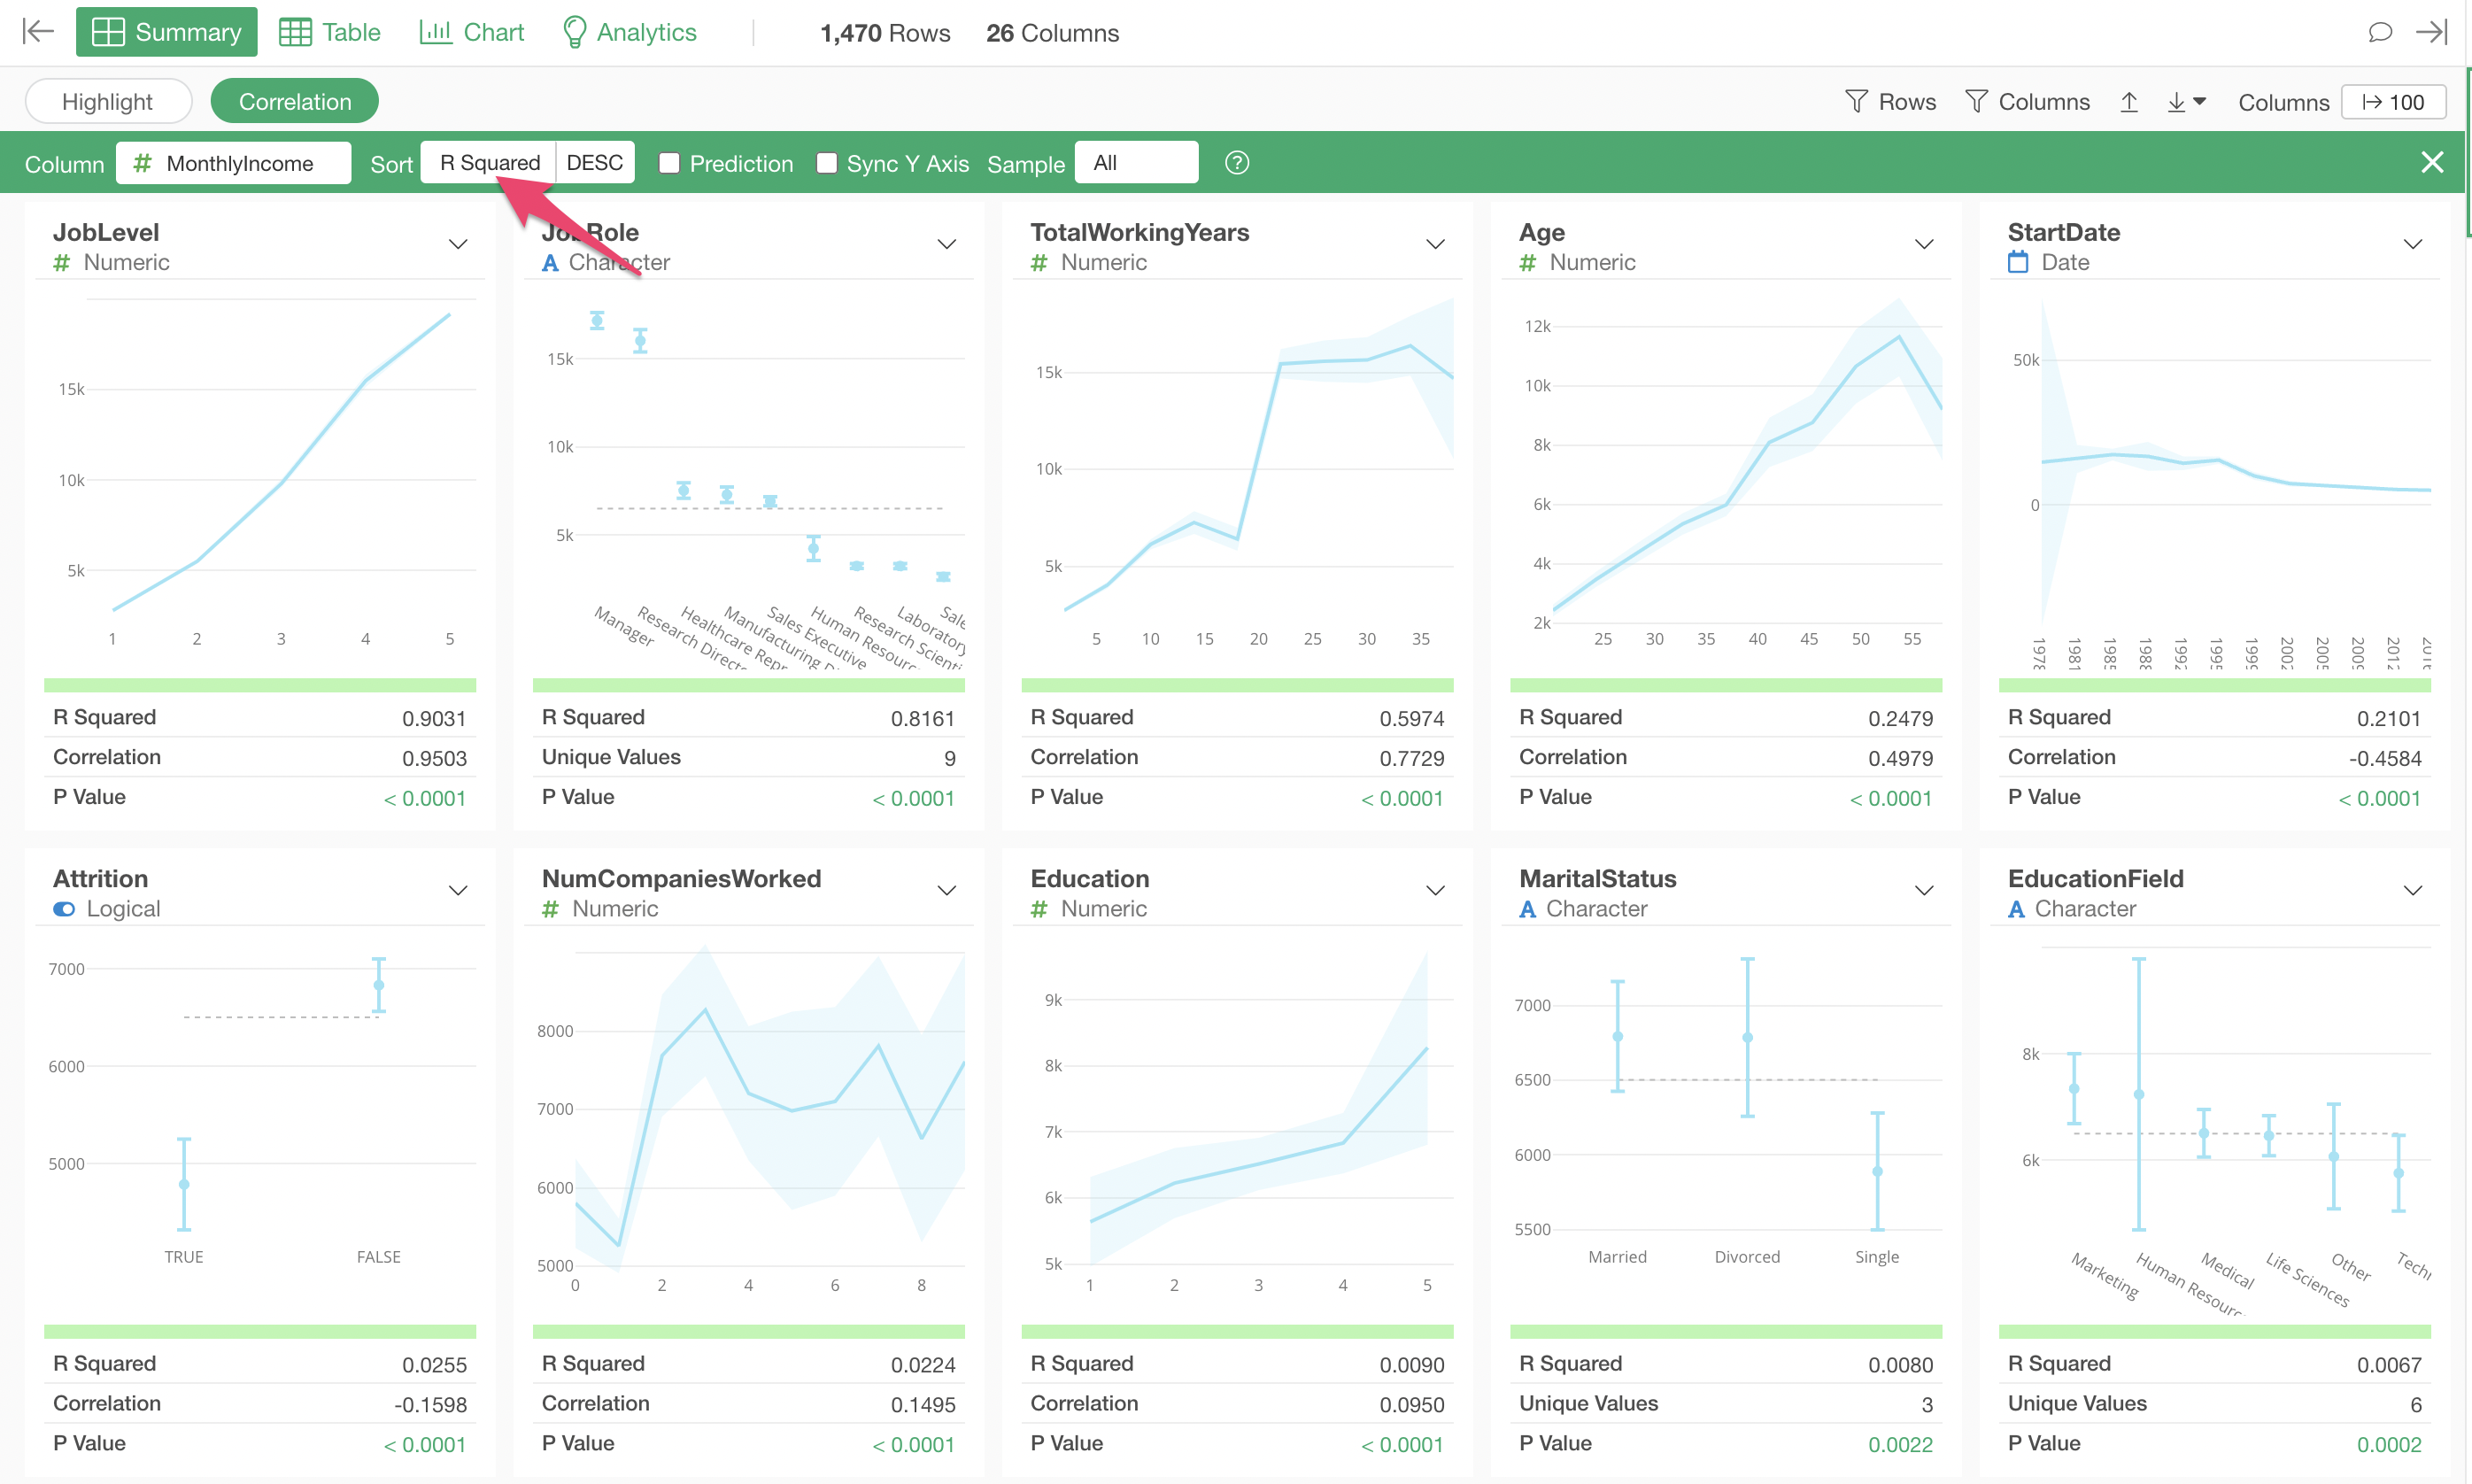
The variable most strongly correlated with Monthly Income is “Job Level.” Looking at the chart, you can see that as “Job Level” increases, the average “Monthly Income” also increases.
The next strongest correlation is with “Job Role.” The chart shows that “Managers” and “Research Directors” have higher salaries compared to other job roles.
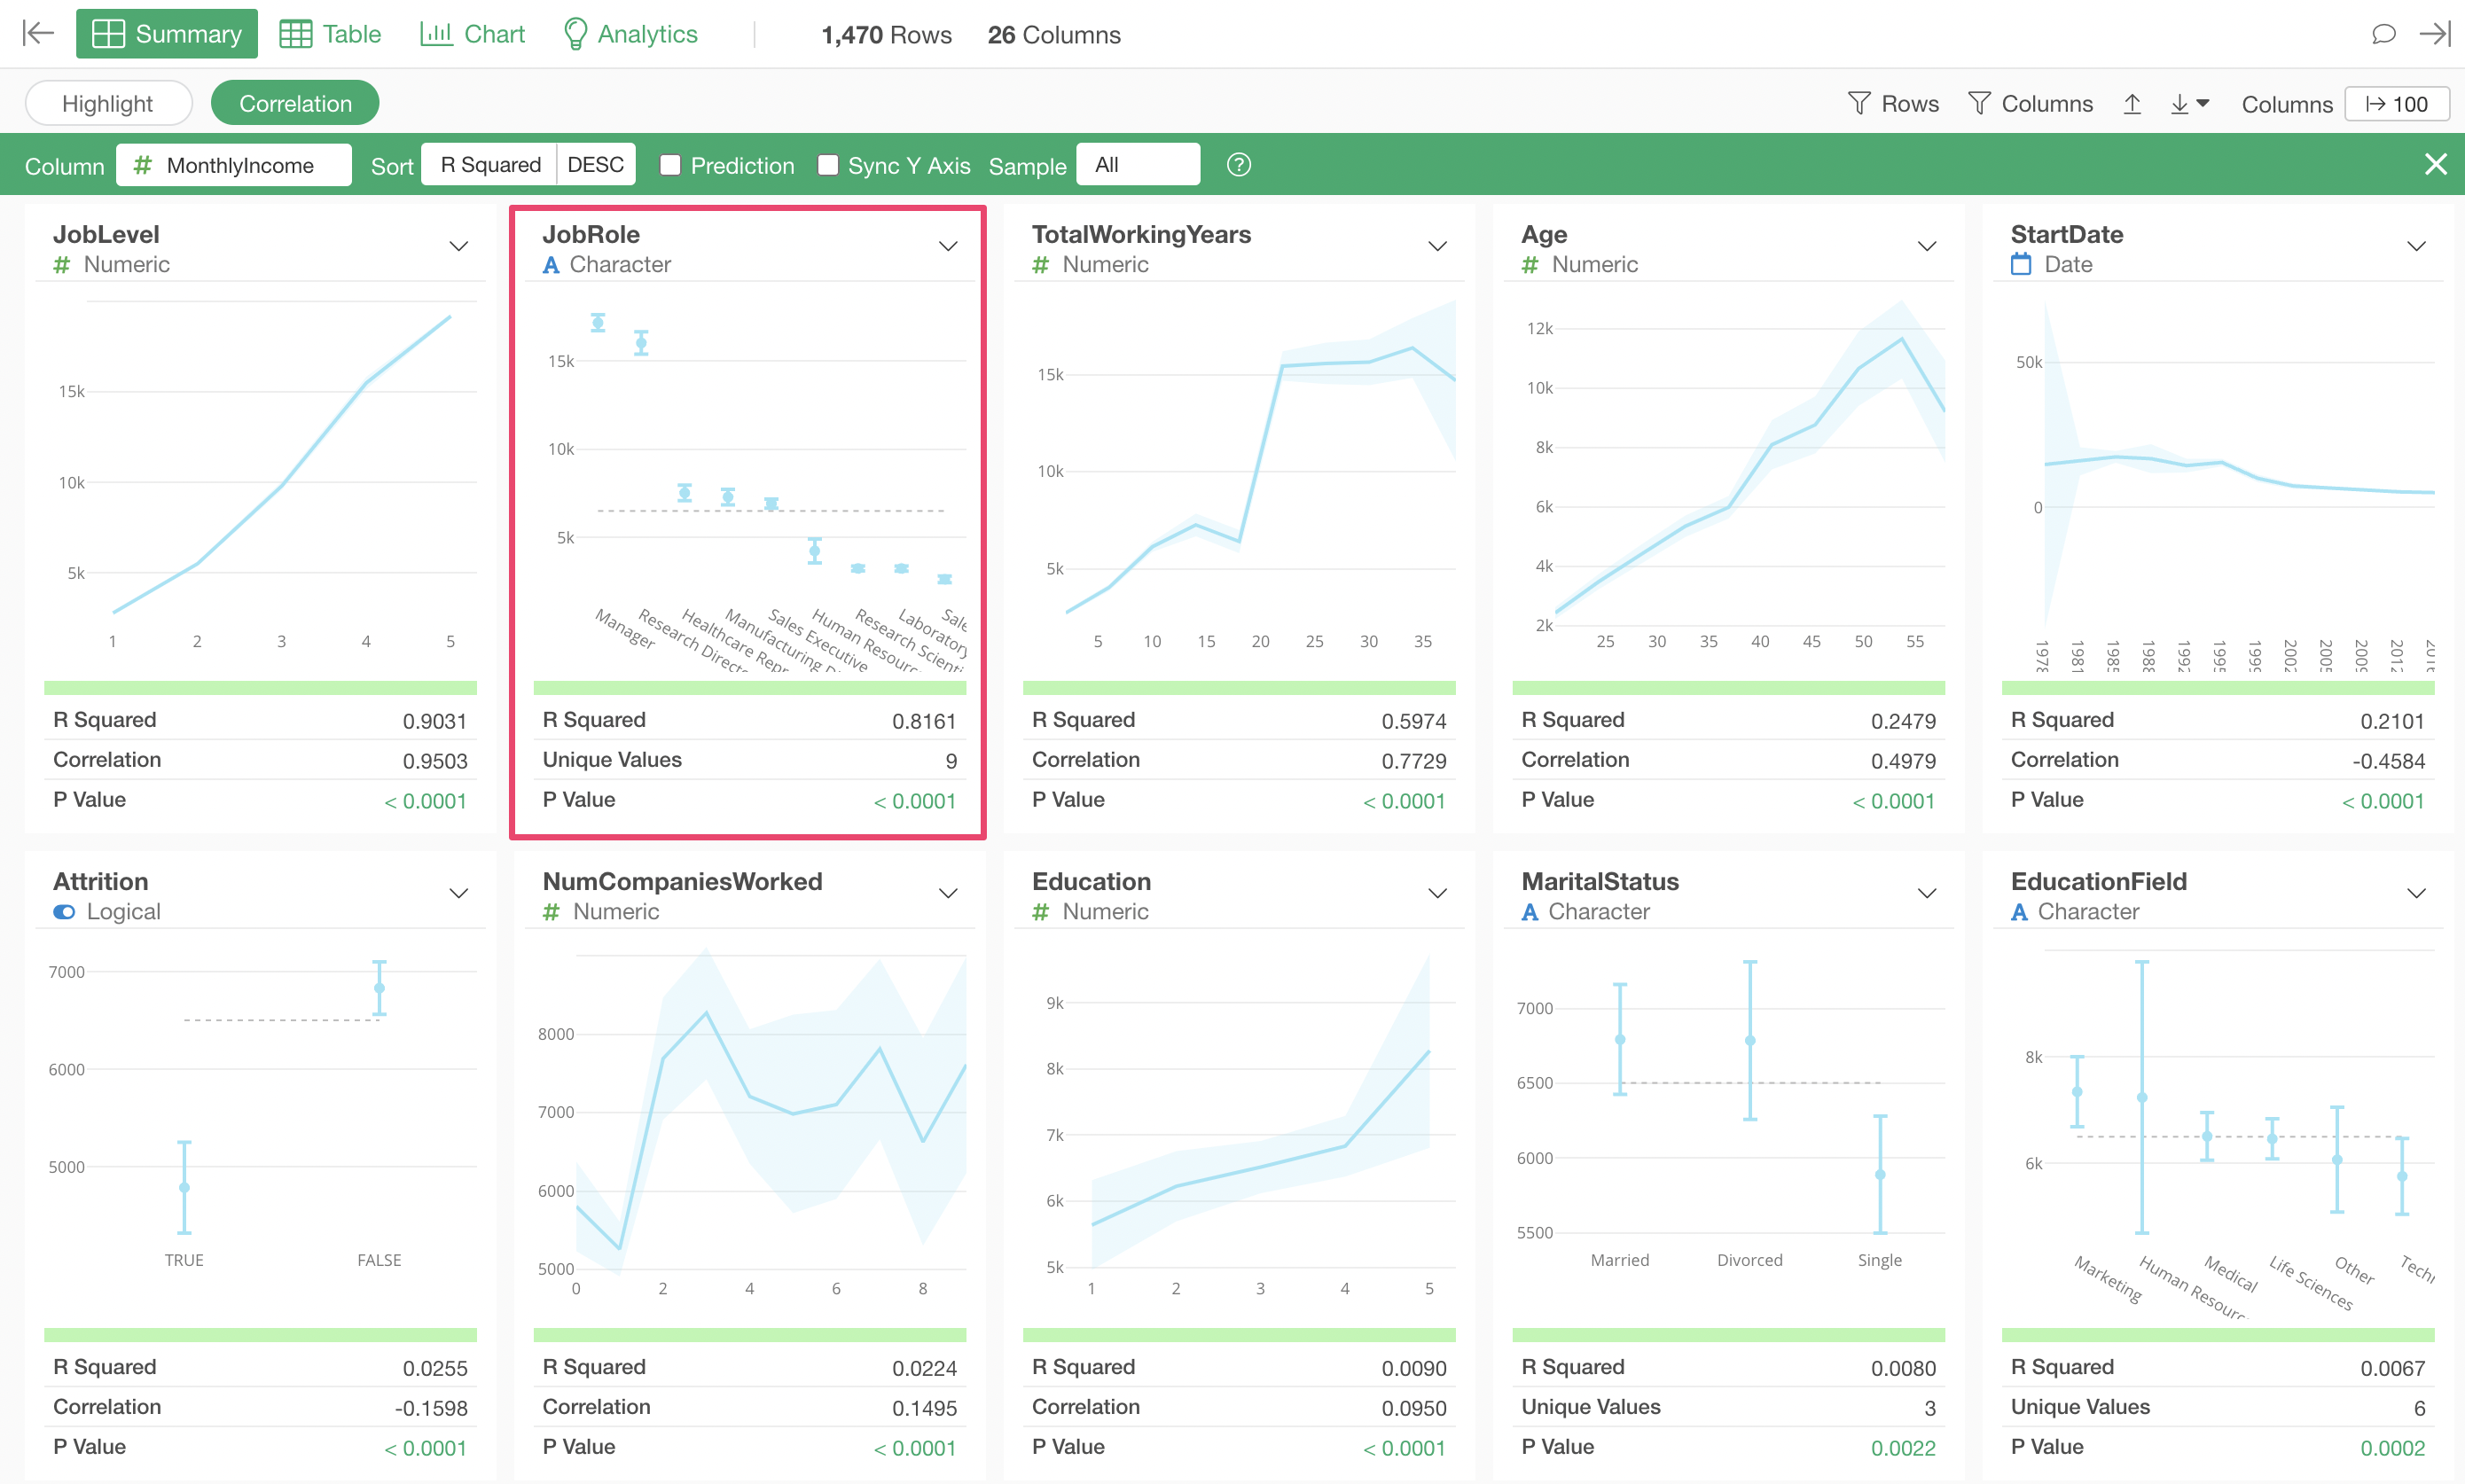
Looking at the indicators, the R-Squared is 0.8161, indicating a fairly high correlation. However, compared to the R-Squared of 0.9031 for “Job Level,” it is not quite as strong.
Using a Logical Type Variable as the Target Variable
In Correlation Mode, you can also select a logical type variable to examine its correlations.
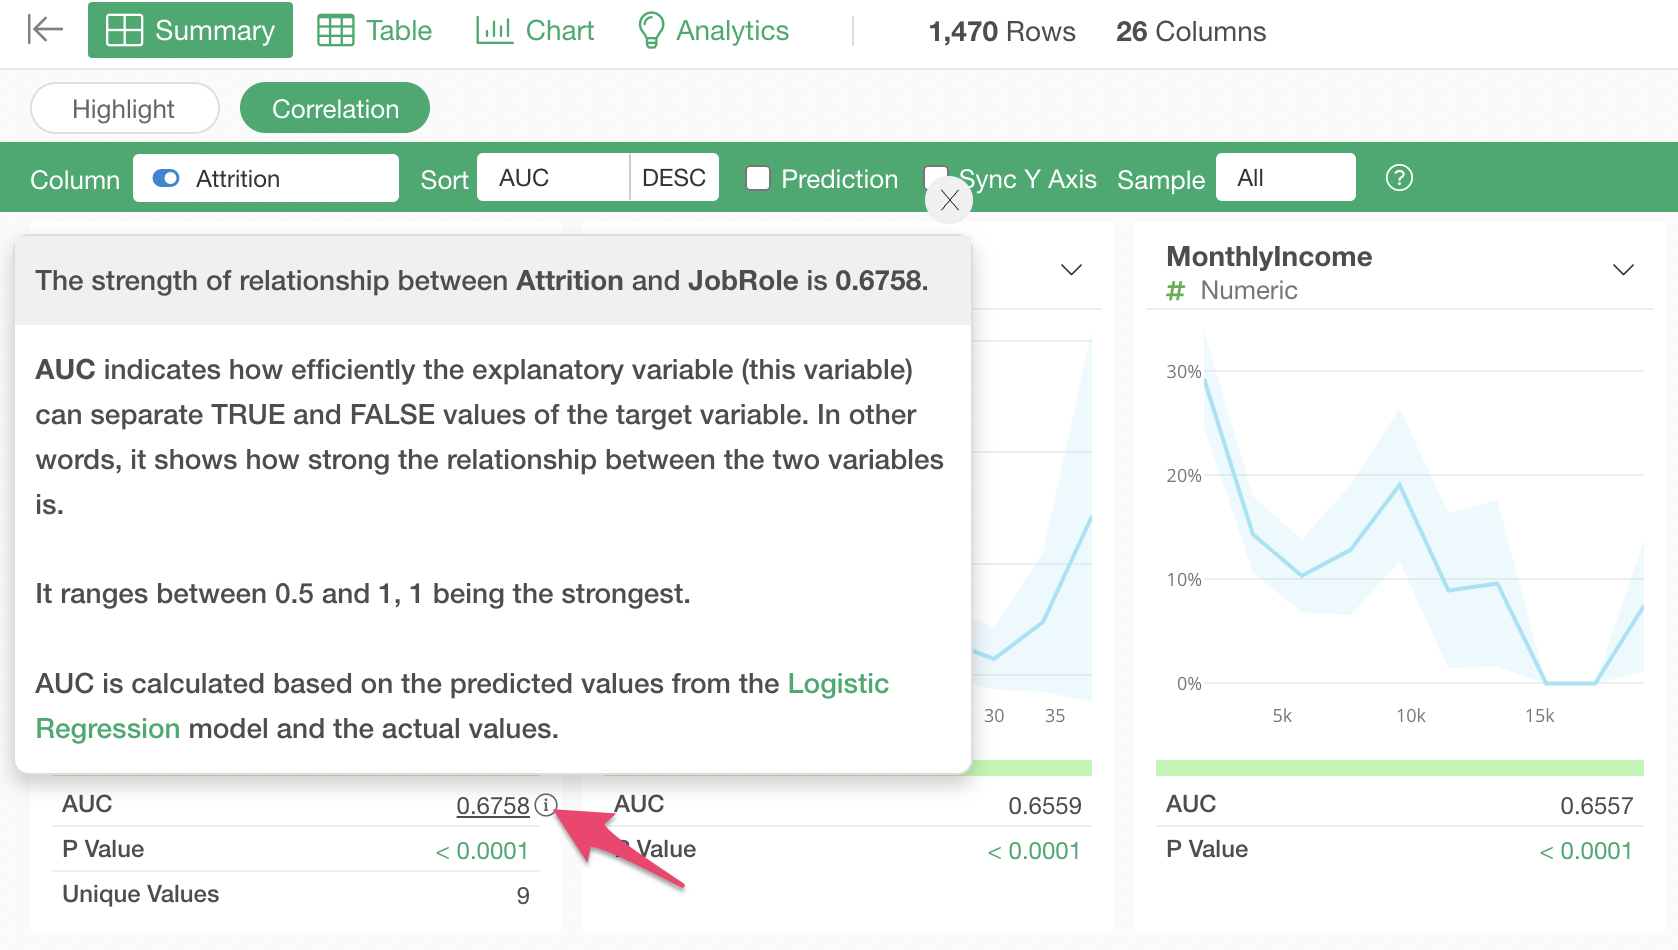
For example, select “Attrition” as the column you want to see correlations for.
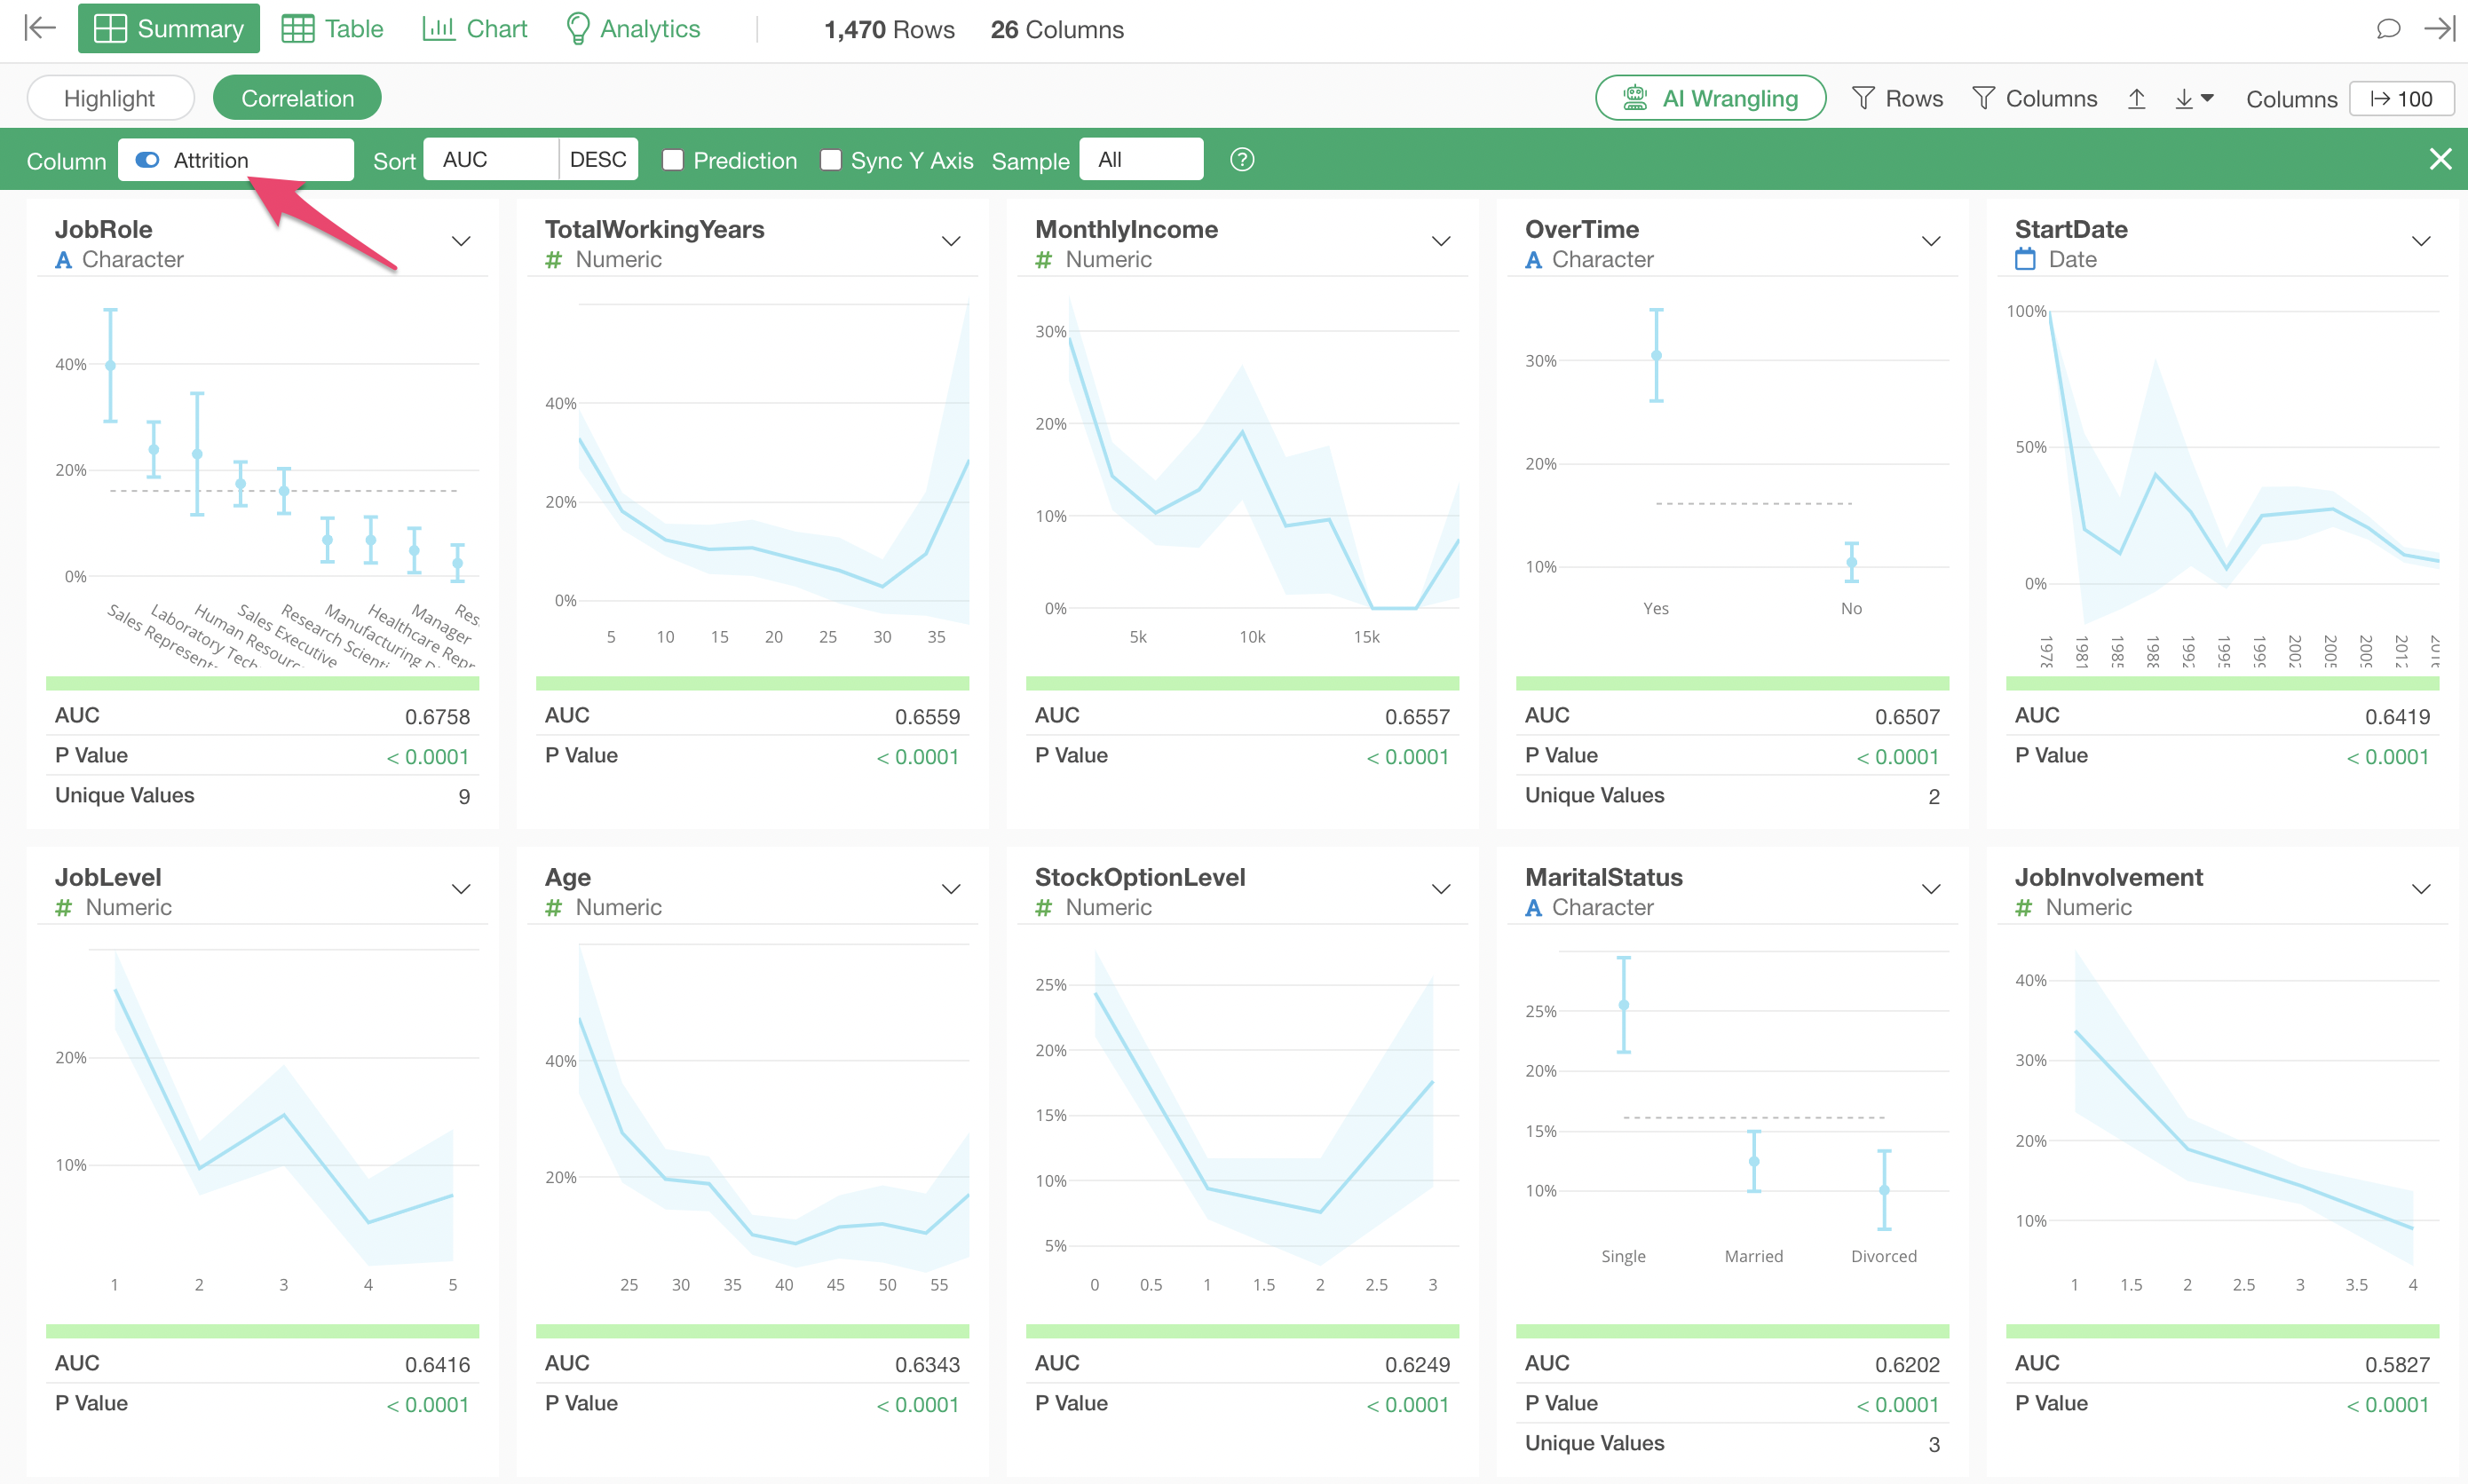
When the target variable is a logical type, the Y-axis of the charts becomes “Ratio of TRUE.”
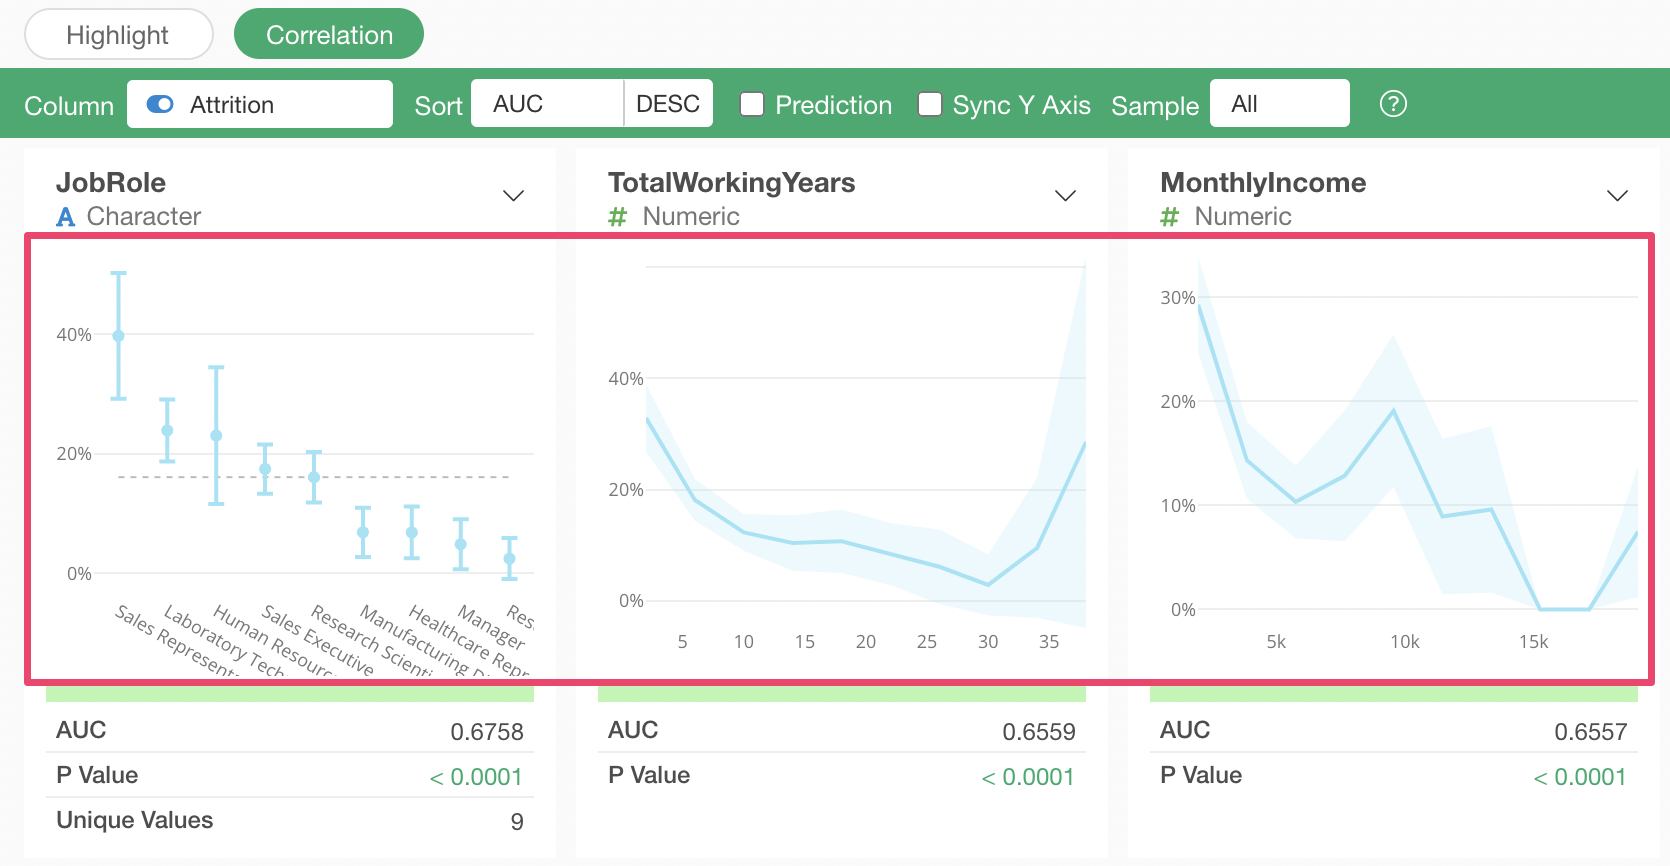
Additionally, AUC (Area Under the Curve) is used as the indicator instead of R-Squared.
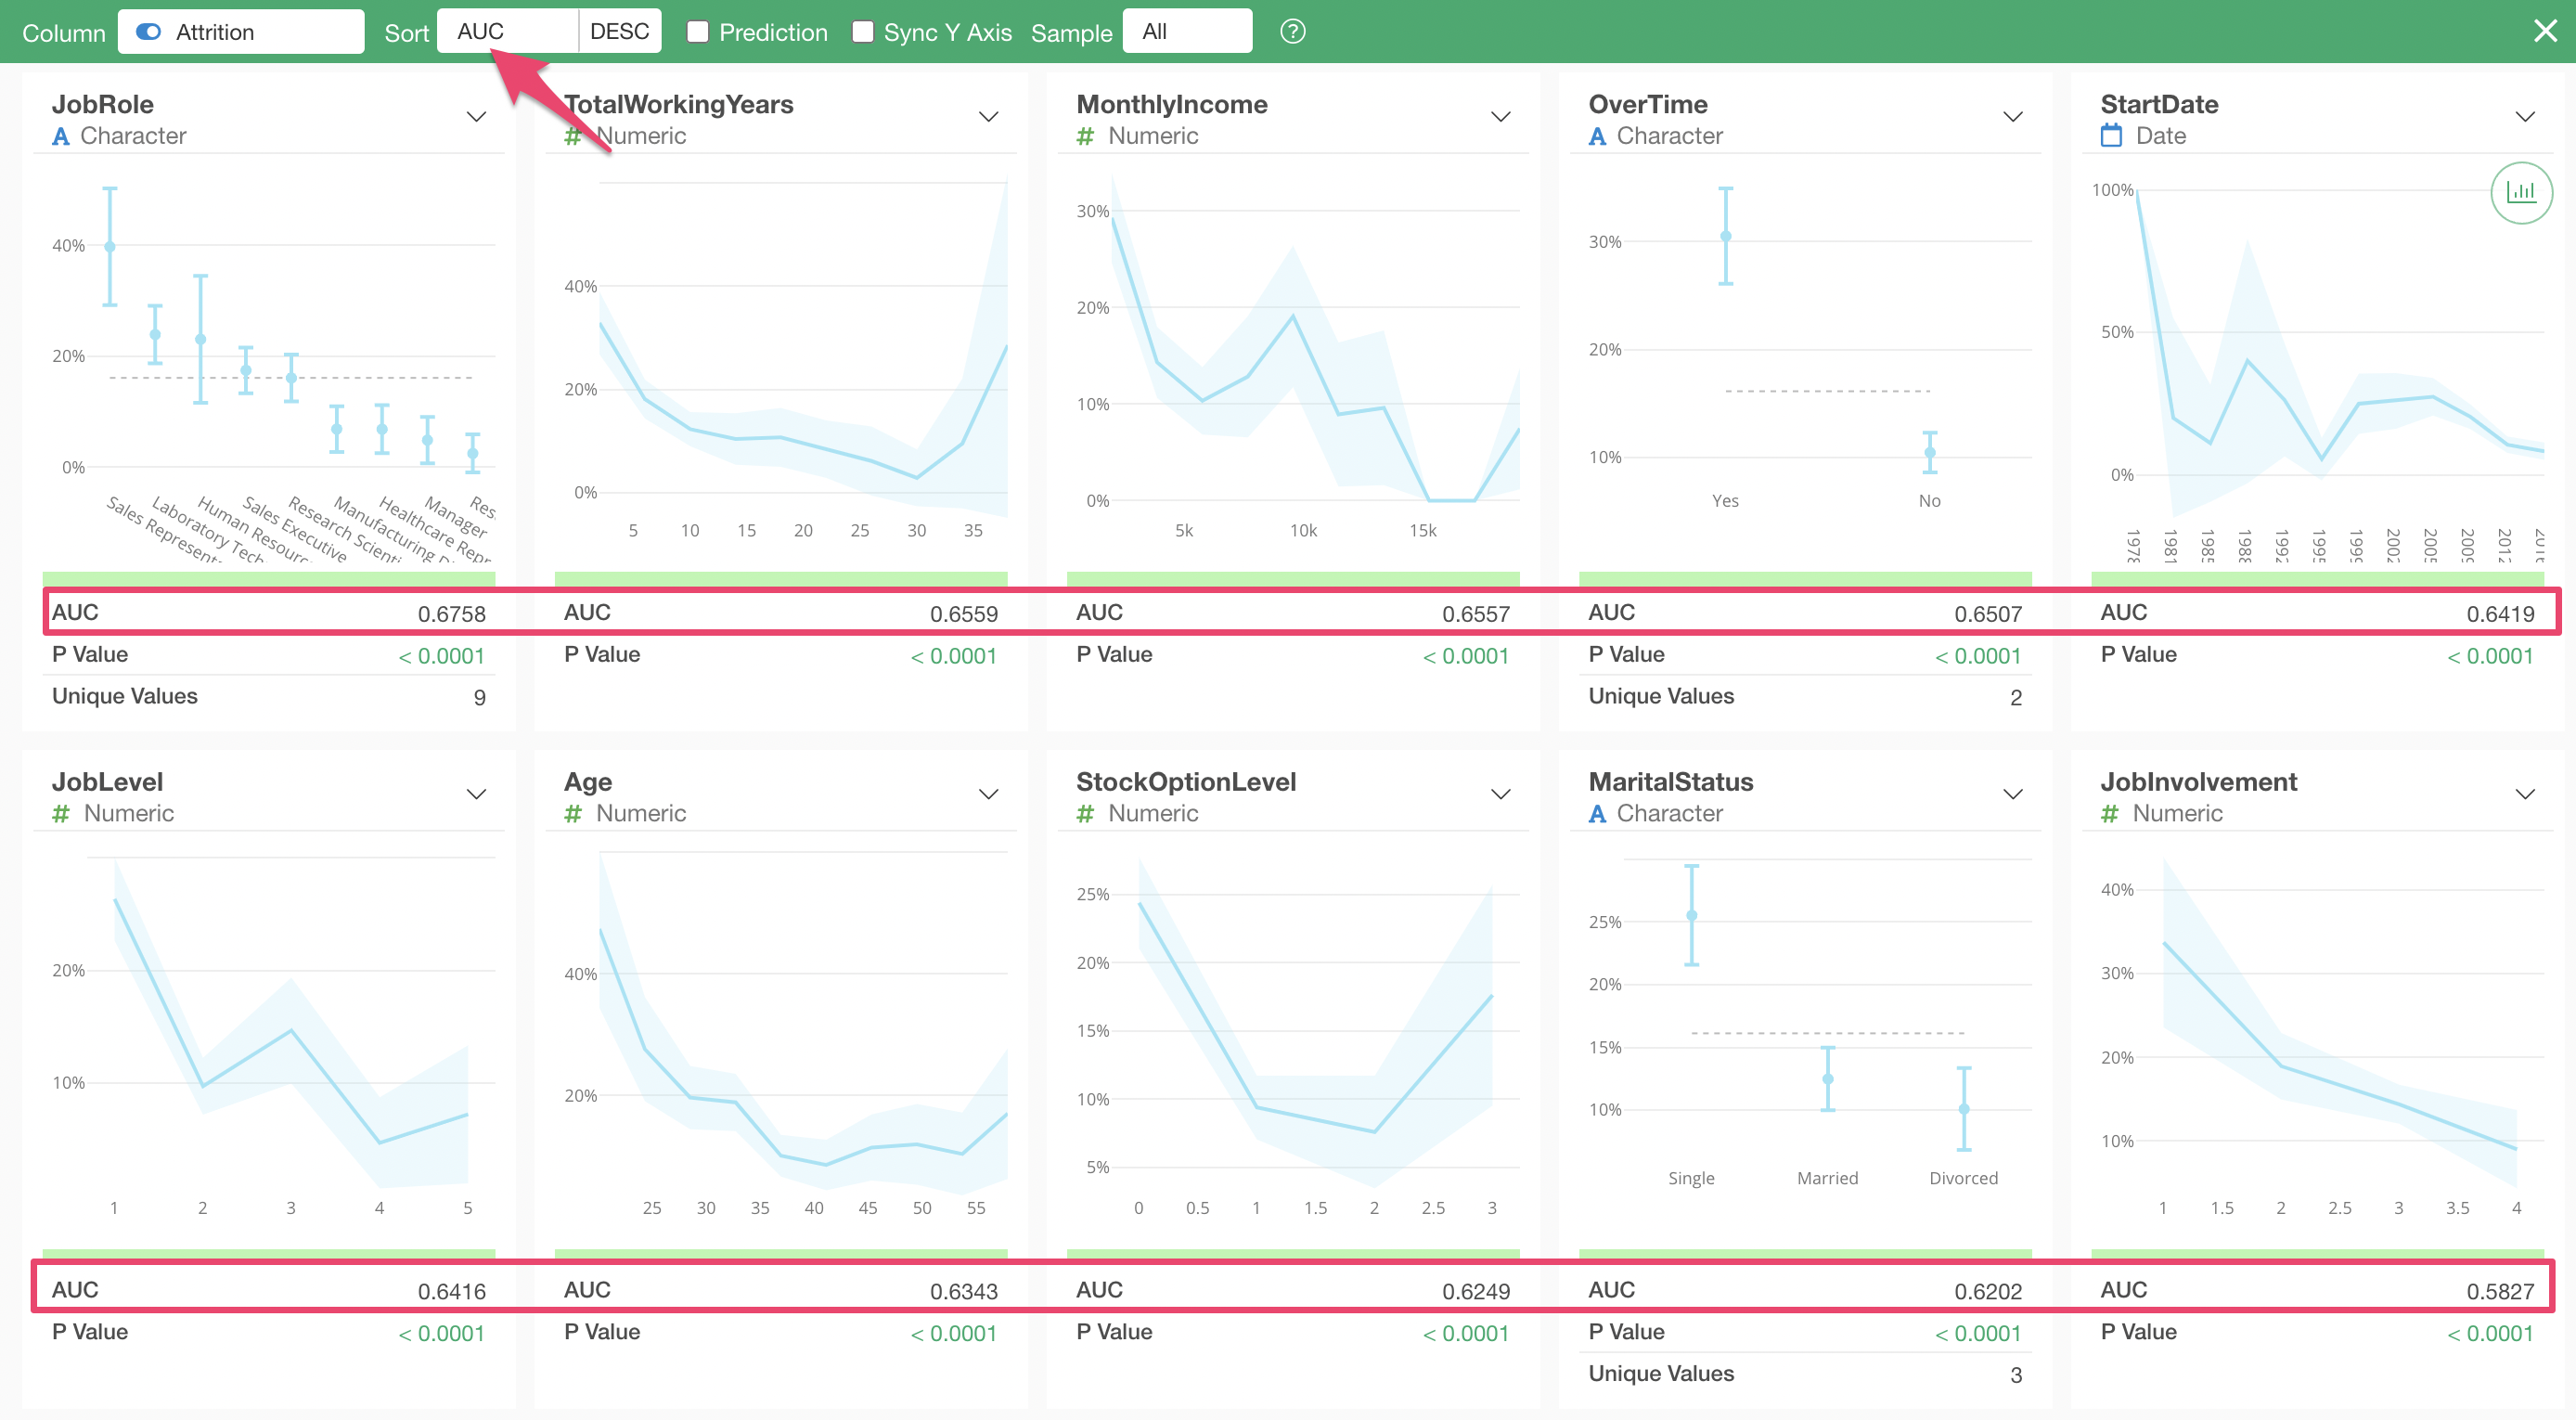
AUC (Area Under the Curve) is an indicator that shows the strength of the correlation with a logical type target variable. It takes values between 0.5 and 1, where values closer to 1 indicate a stronger correlation with the target variable.
You can check the details of AUC at any time by clicking the information icon (i).
Summary
With Correlation Mode, simply selecting a column lets you see the relationships between that variable and all other variables, displayed through charts and statistical indicators (R-Squared, P-Value, and Correlation Coefficient).
This eliminates the need to create charts or run tests for each variable individually, significantly reducing the time required for correlation analysis. Results are automatically sorted by R-Squared in descending order, allowing you to quickly identify which variables to focus on and move forward with the next steps of your analysis.