How to Export Data in Exploratory
Exploratory allows you to export data in various formats such as Excel and CSV from processed data (summary table view), charts, and analytics views.
Exporting Processed Data
In Exploratory, you can export processed data as Excel or CSV files after step processing.
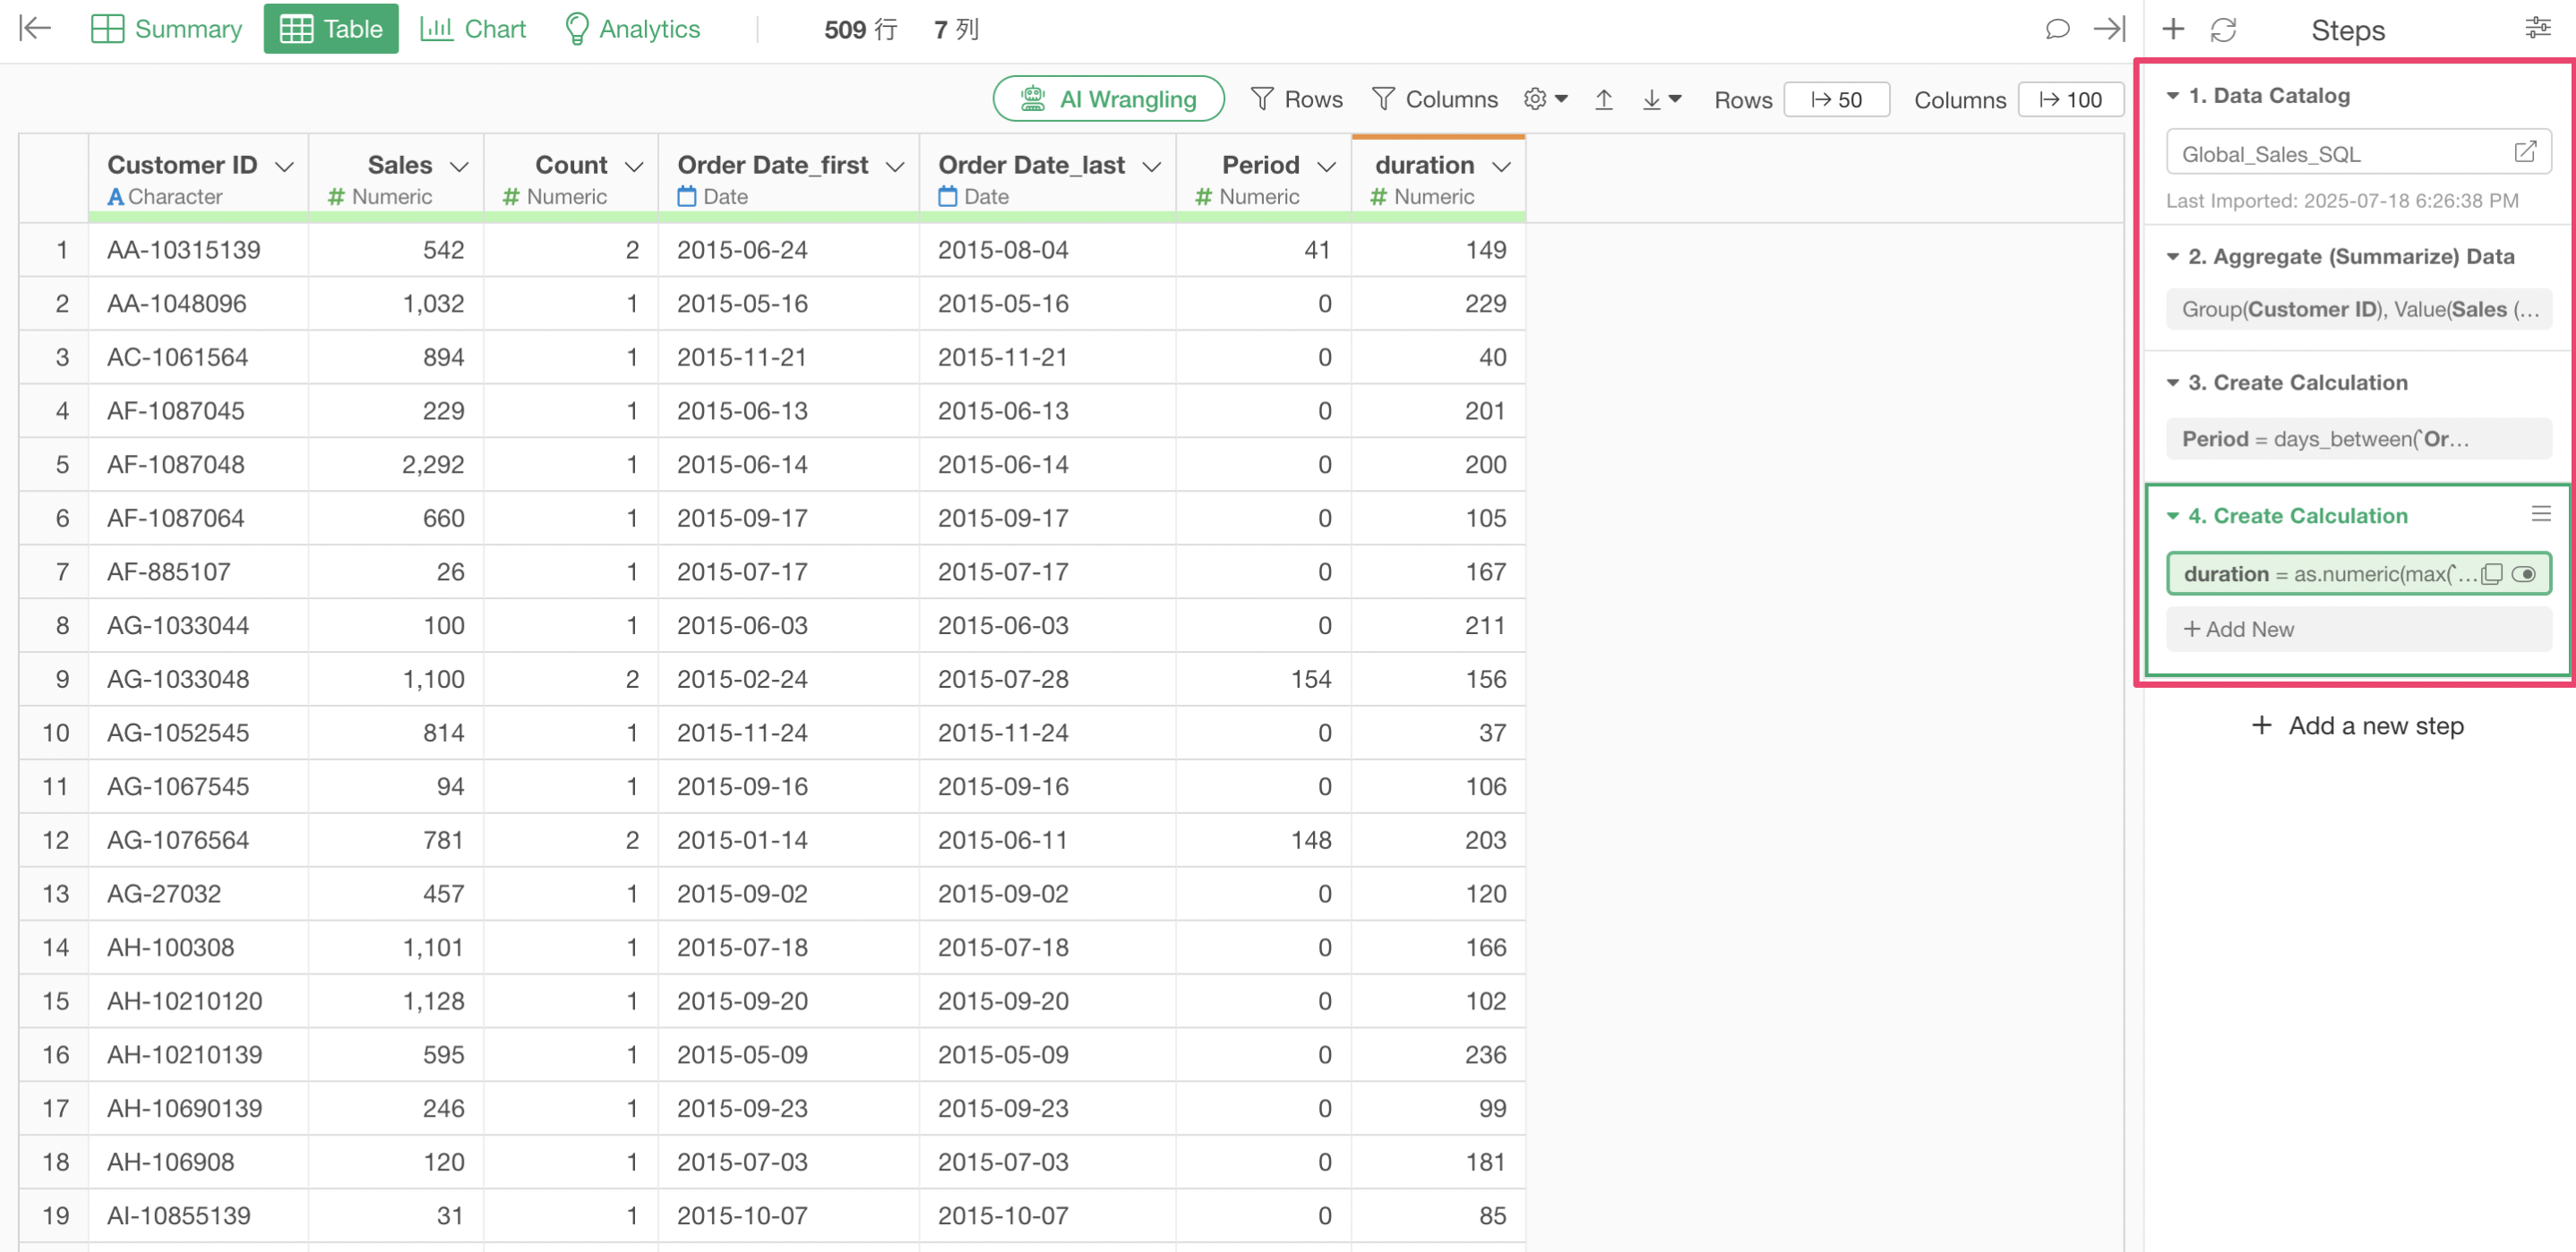
Navigate to the Table View. Click the “Export Data” button in the toolbar at the top right of the screen.
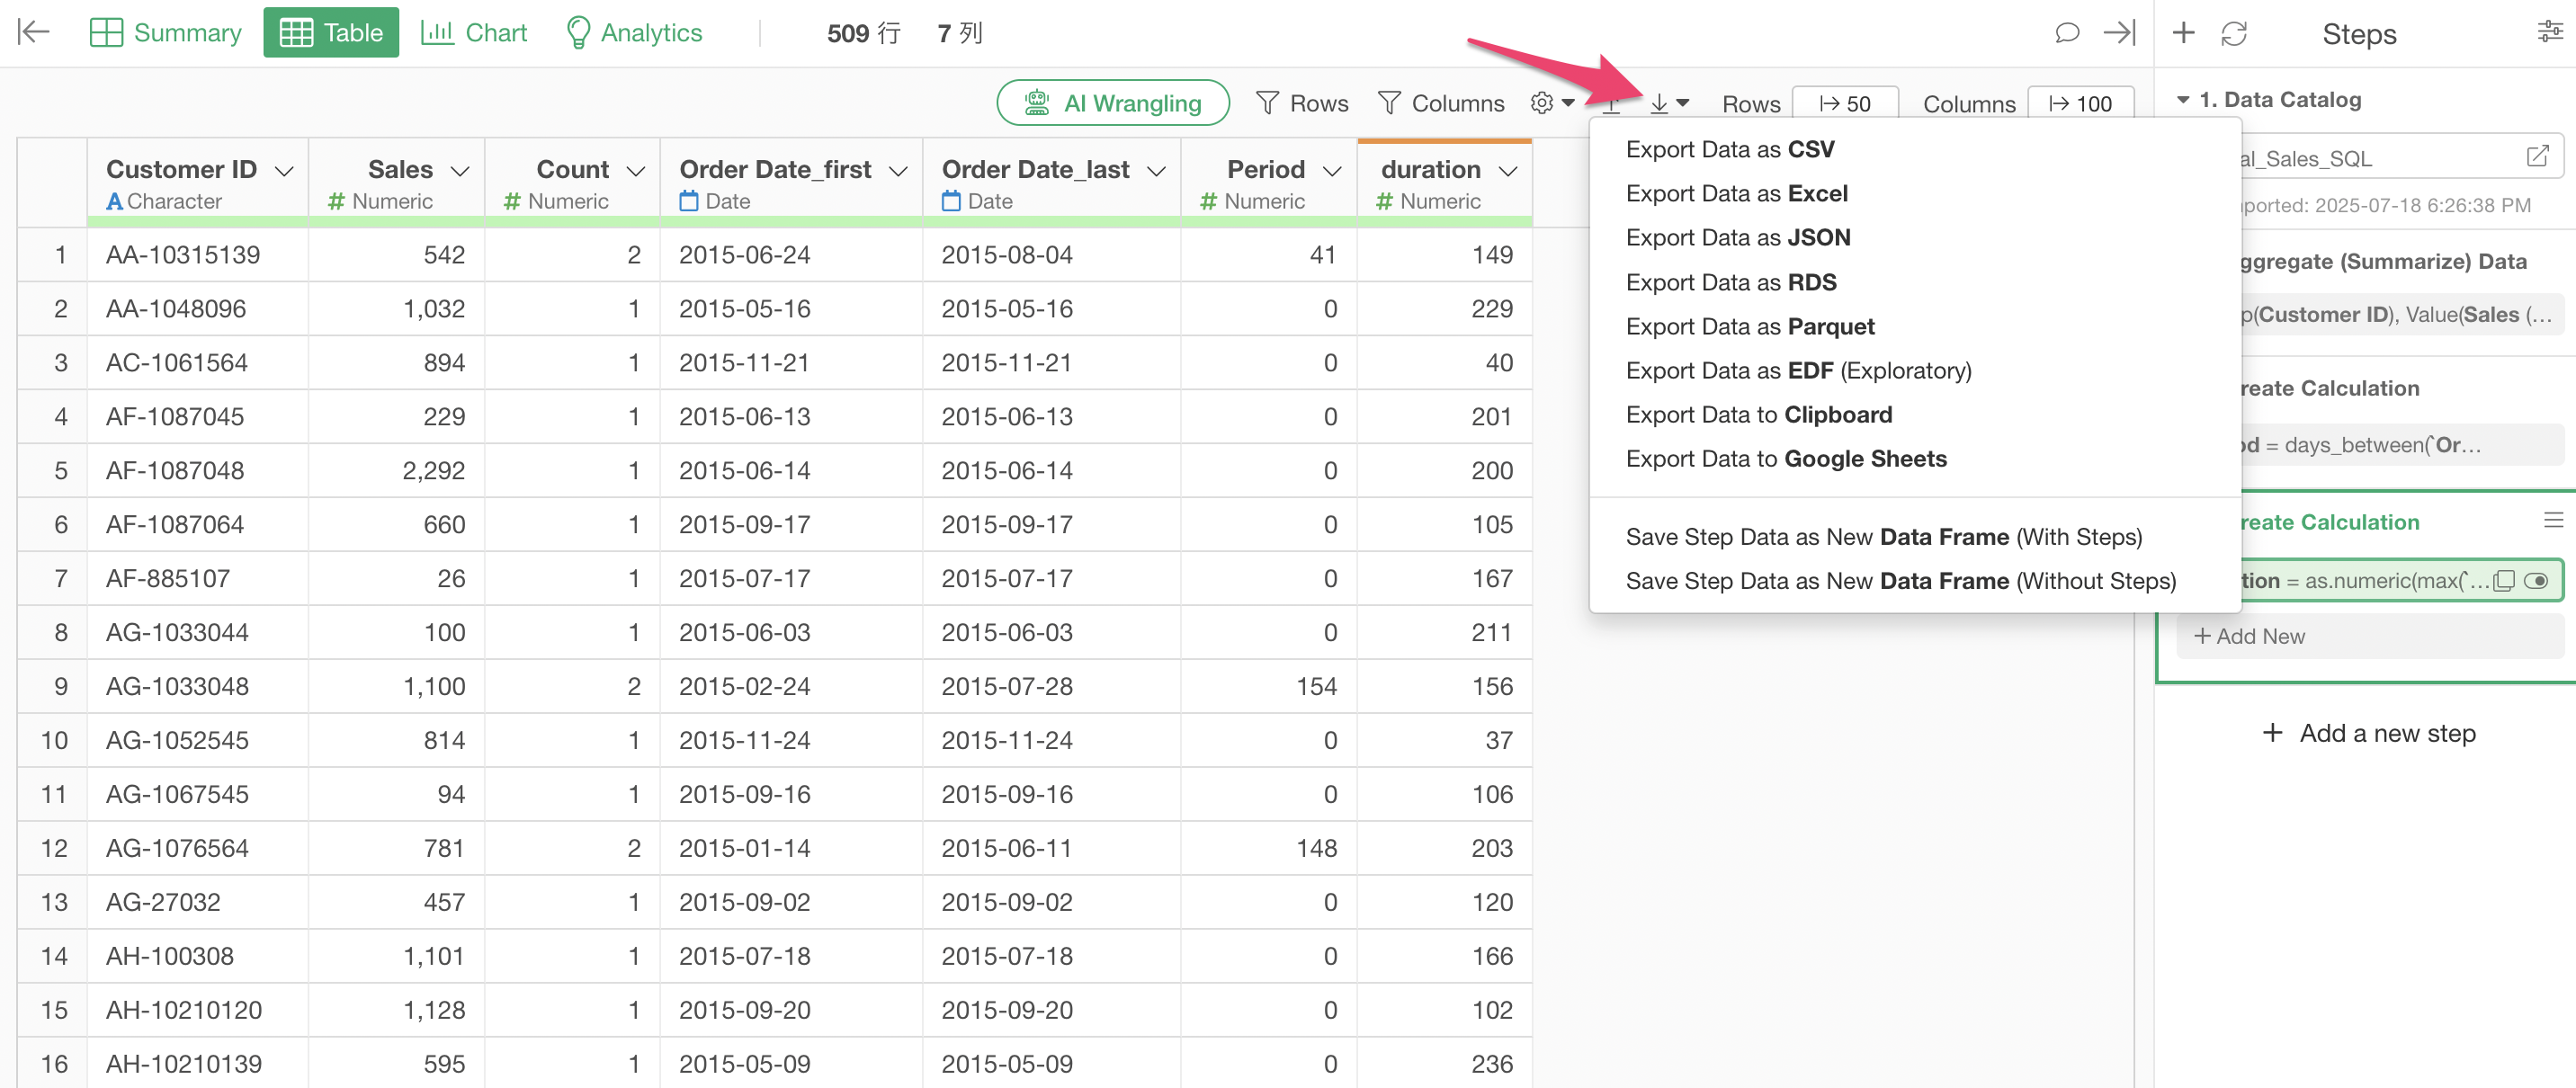
From the displayed menu, you can select “Export Data as CSV” or “Export Data as Excel”. Additionally, various other file formats are supported, including JSON and Parquet.
Exporting Chart Data
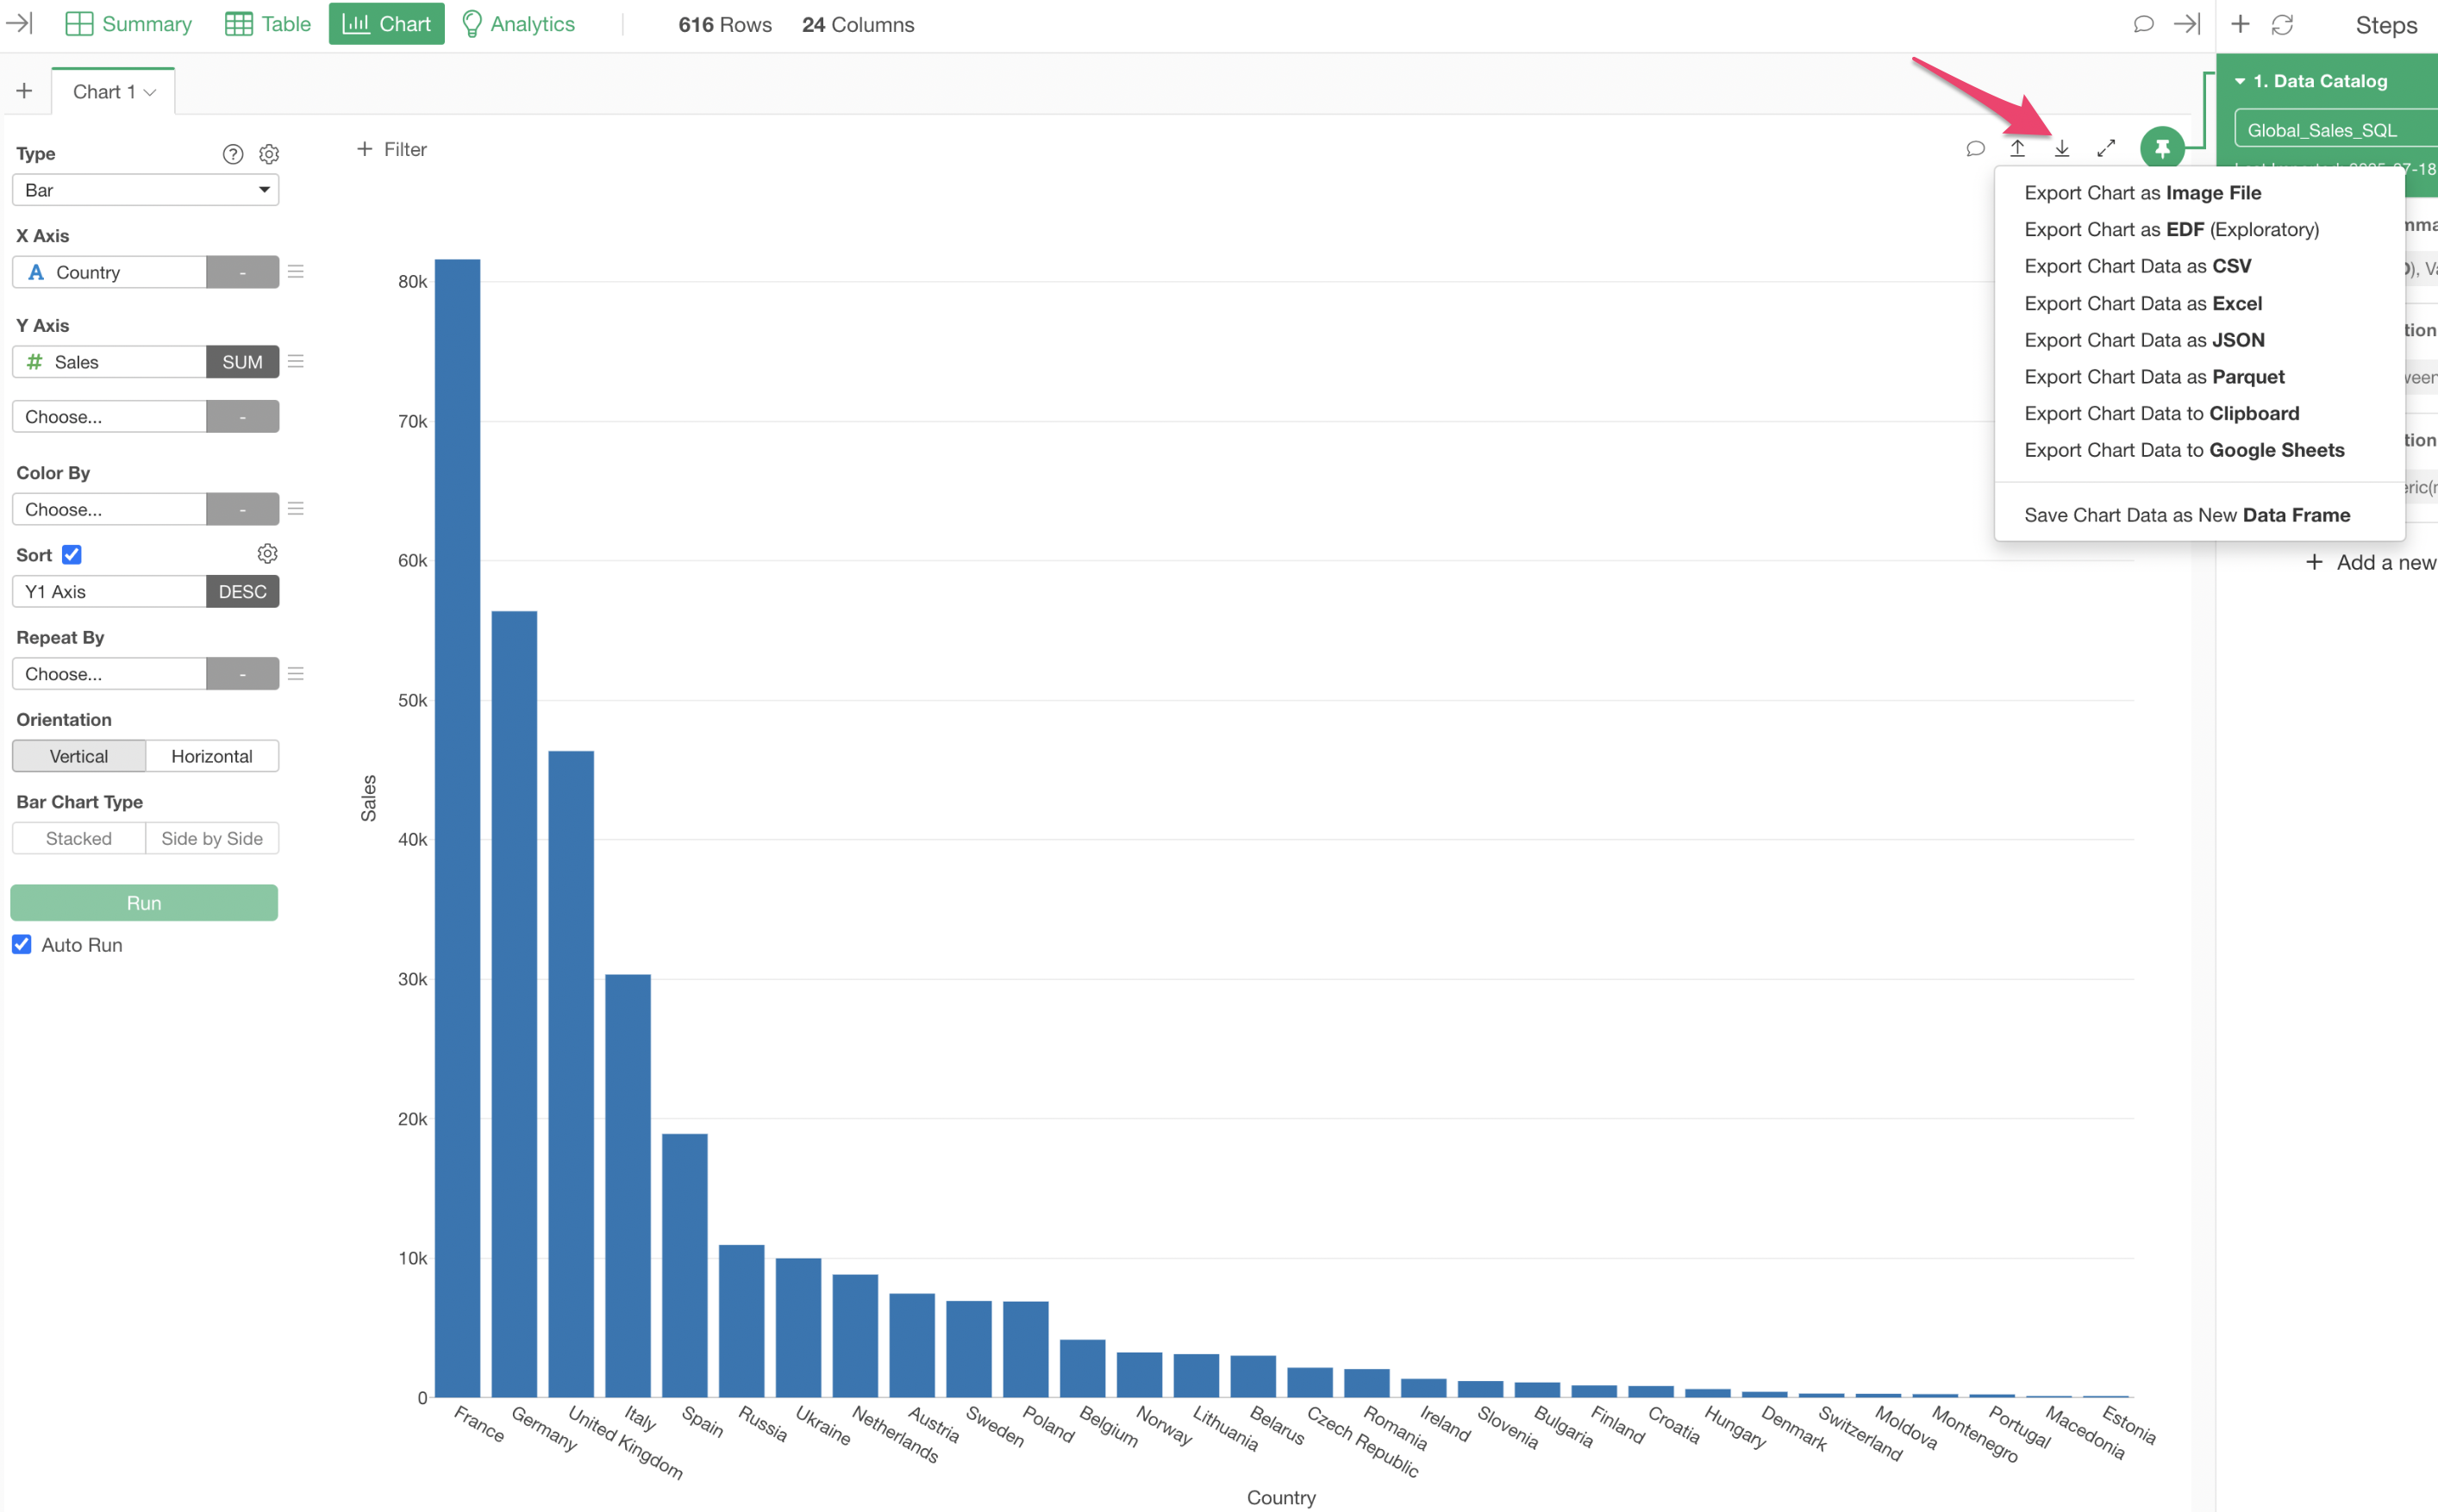
Data visualized in charts can also be exported as Excel or CSV files.
Click the “Export Chart Data” button at the top right of the chart and select your preferred file format.
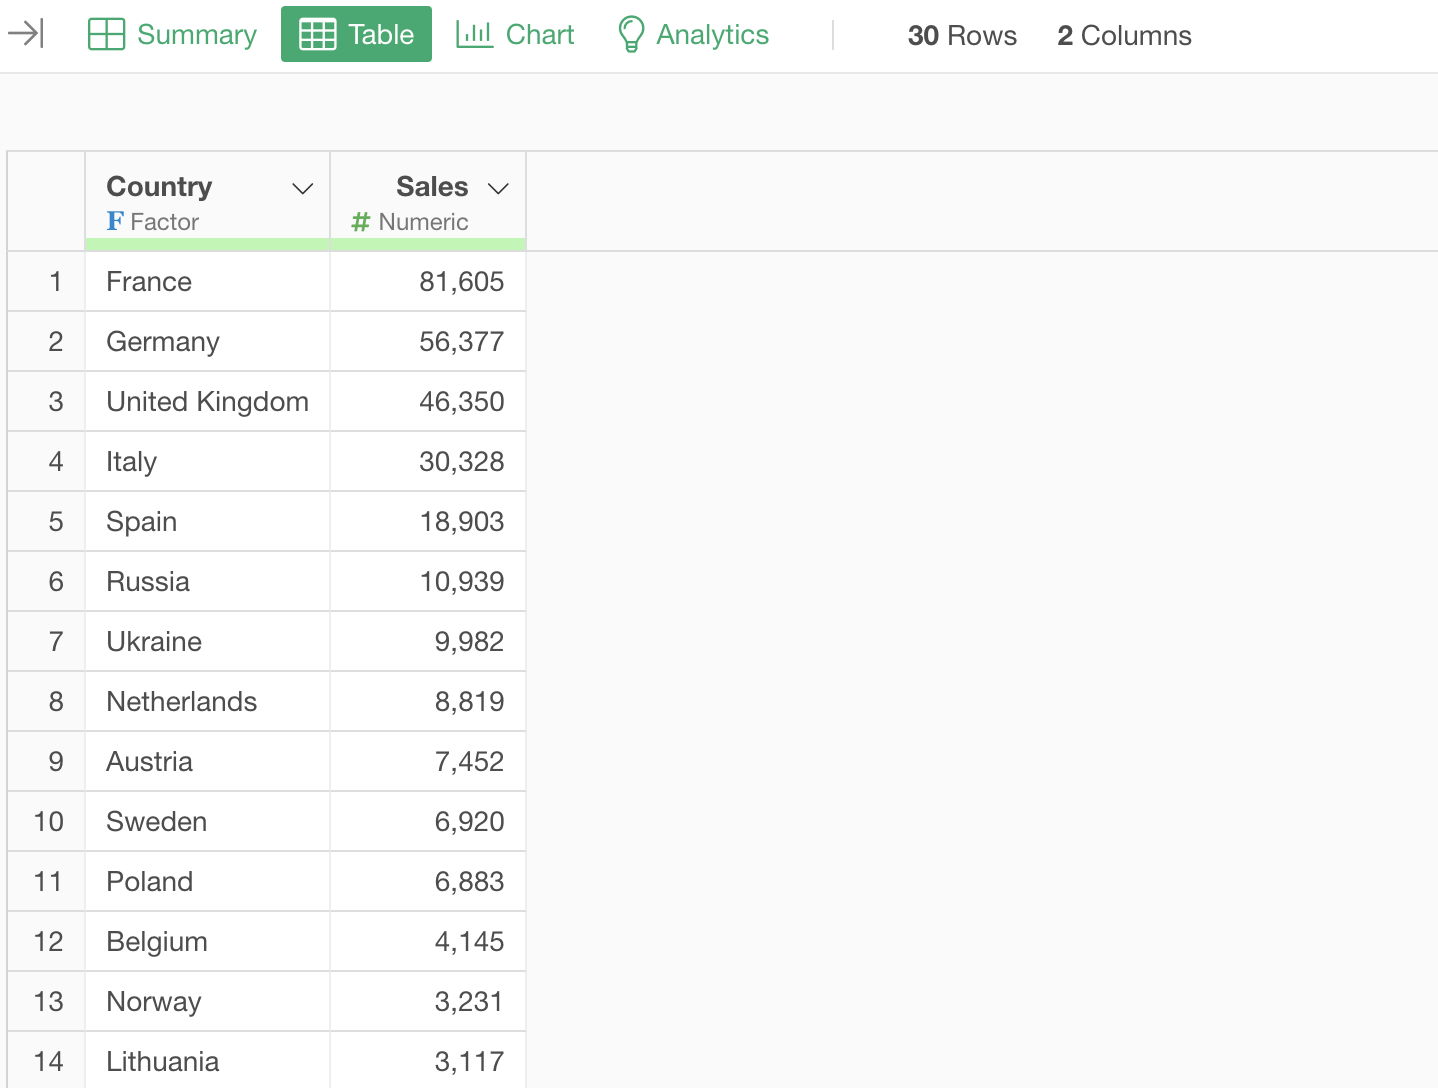
When exporting chart data, the data used to render the chart is exported. Below is the data exported from the bar chart shown earlier.
Exporting Analytics Data to Excel/CSV
For analytics, each created chart has its own export button.
Click the export button from the chart containing the data you want to export.
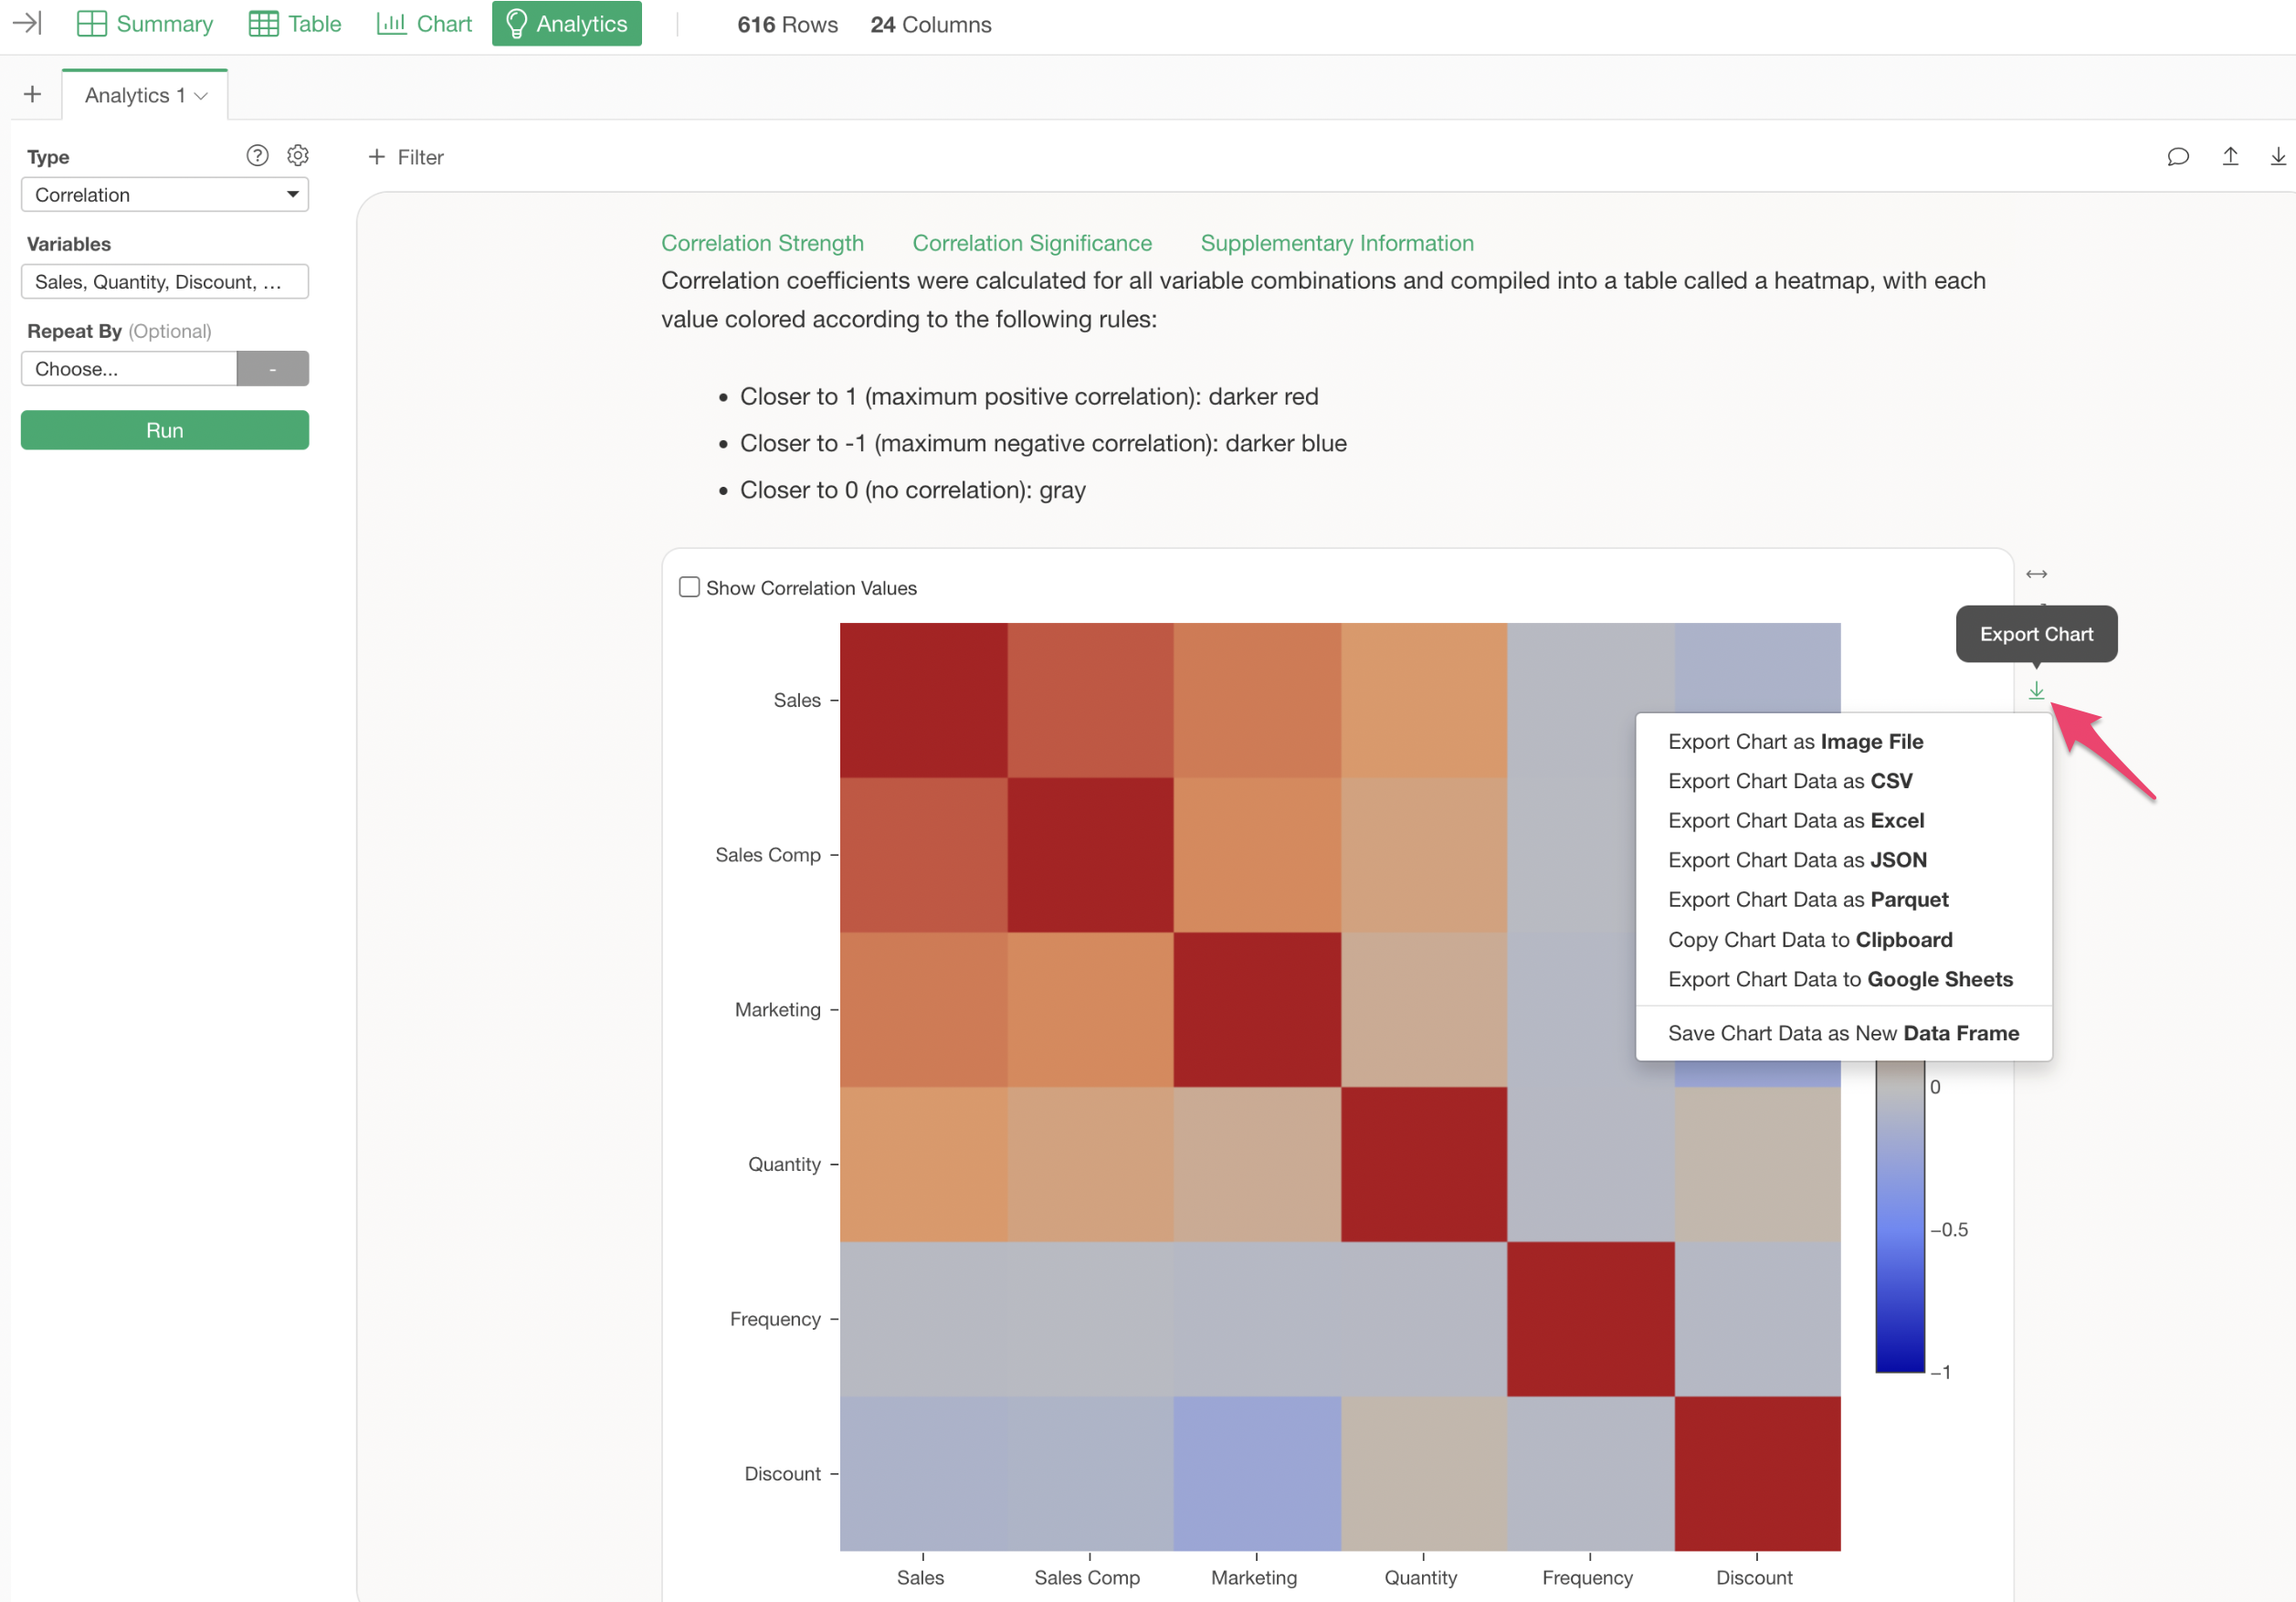
This operation exports the data from charts created by analytics.