How to Fill Missing Values
This note introduces three methods for filling missing values.
- Fill missing values with a specific value
- Fill missing values with values from previous or next rows
- Replace missing values with values from another column
Let’s look at each method.
Fill Missing Values with a Specific Value
For example, let’s say there are missing values in the Country column.
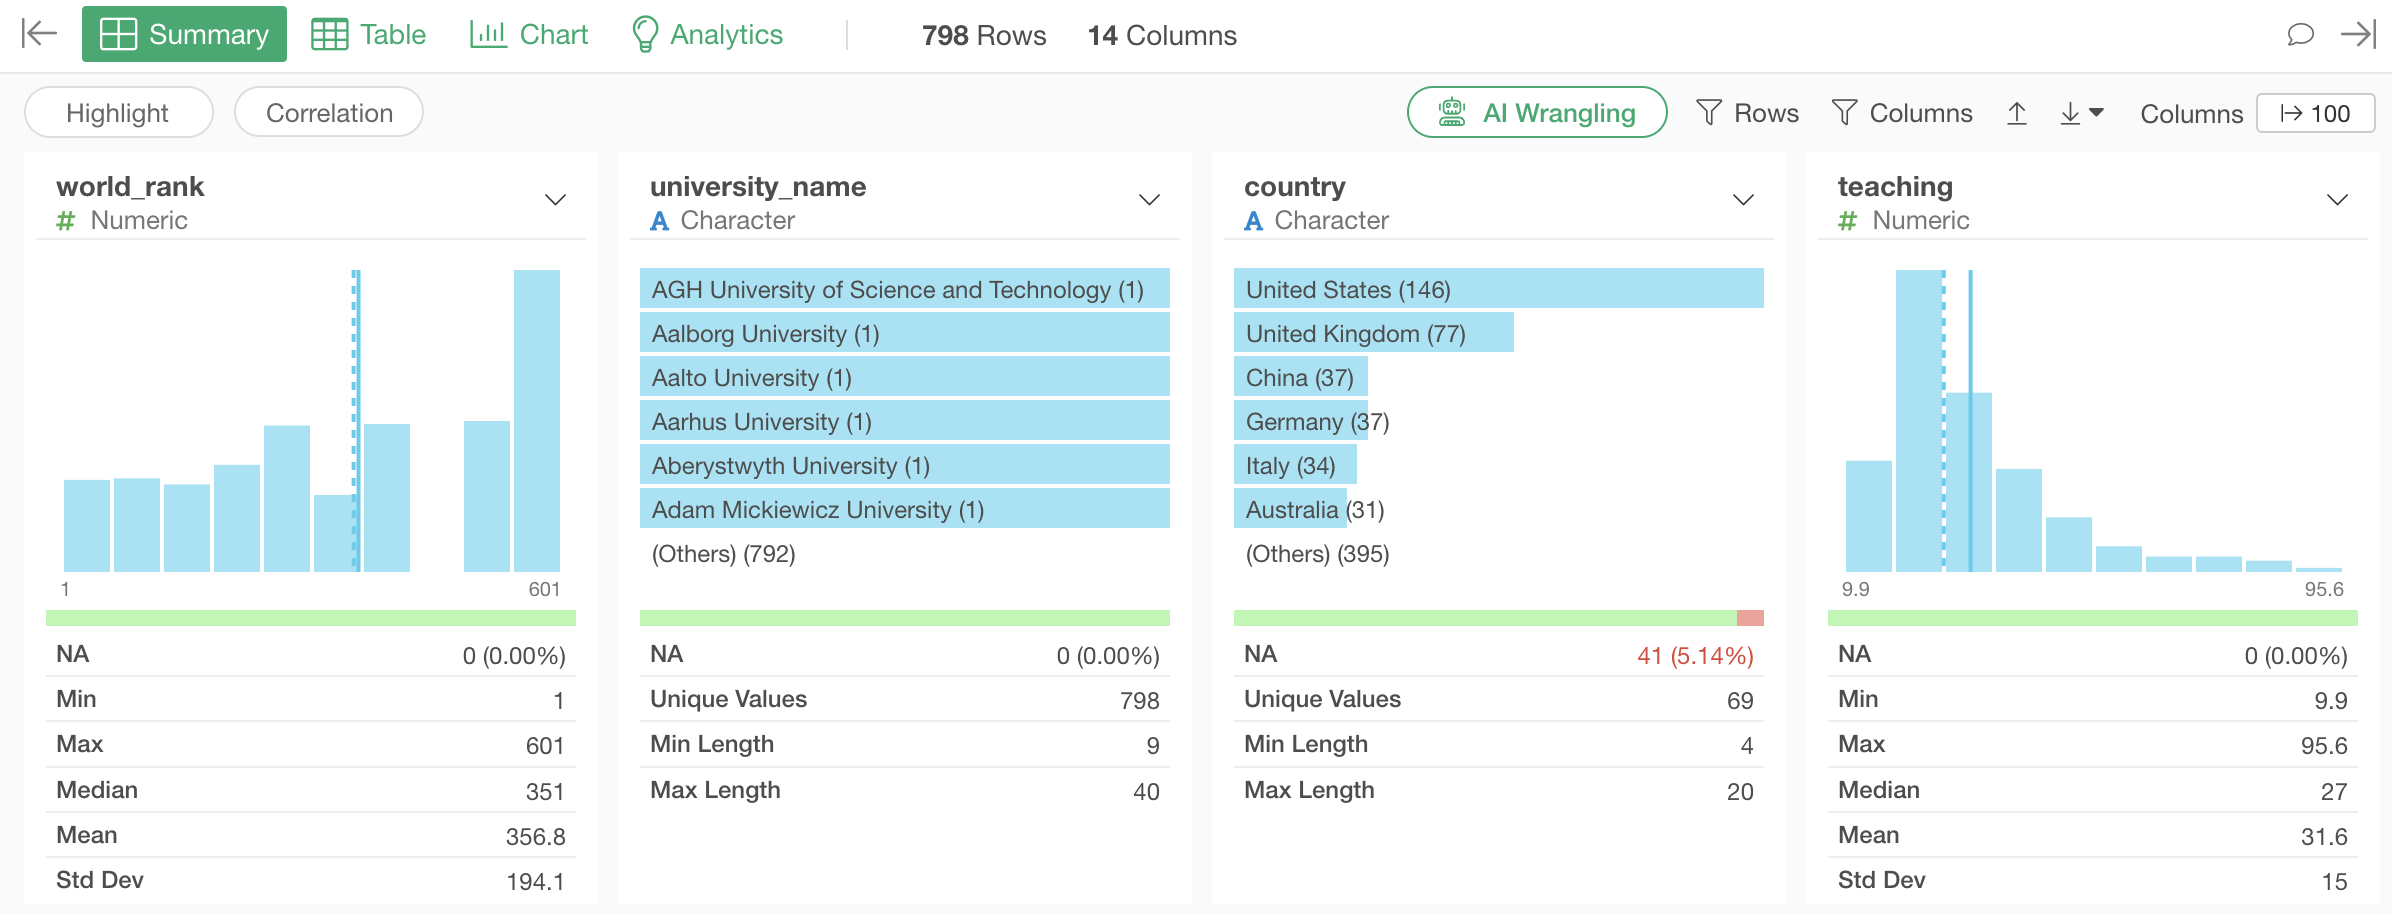
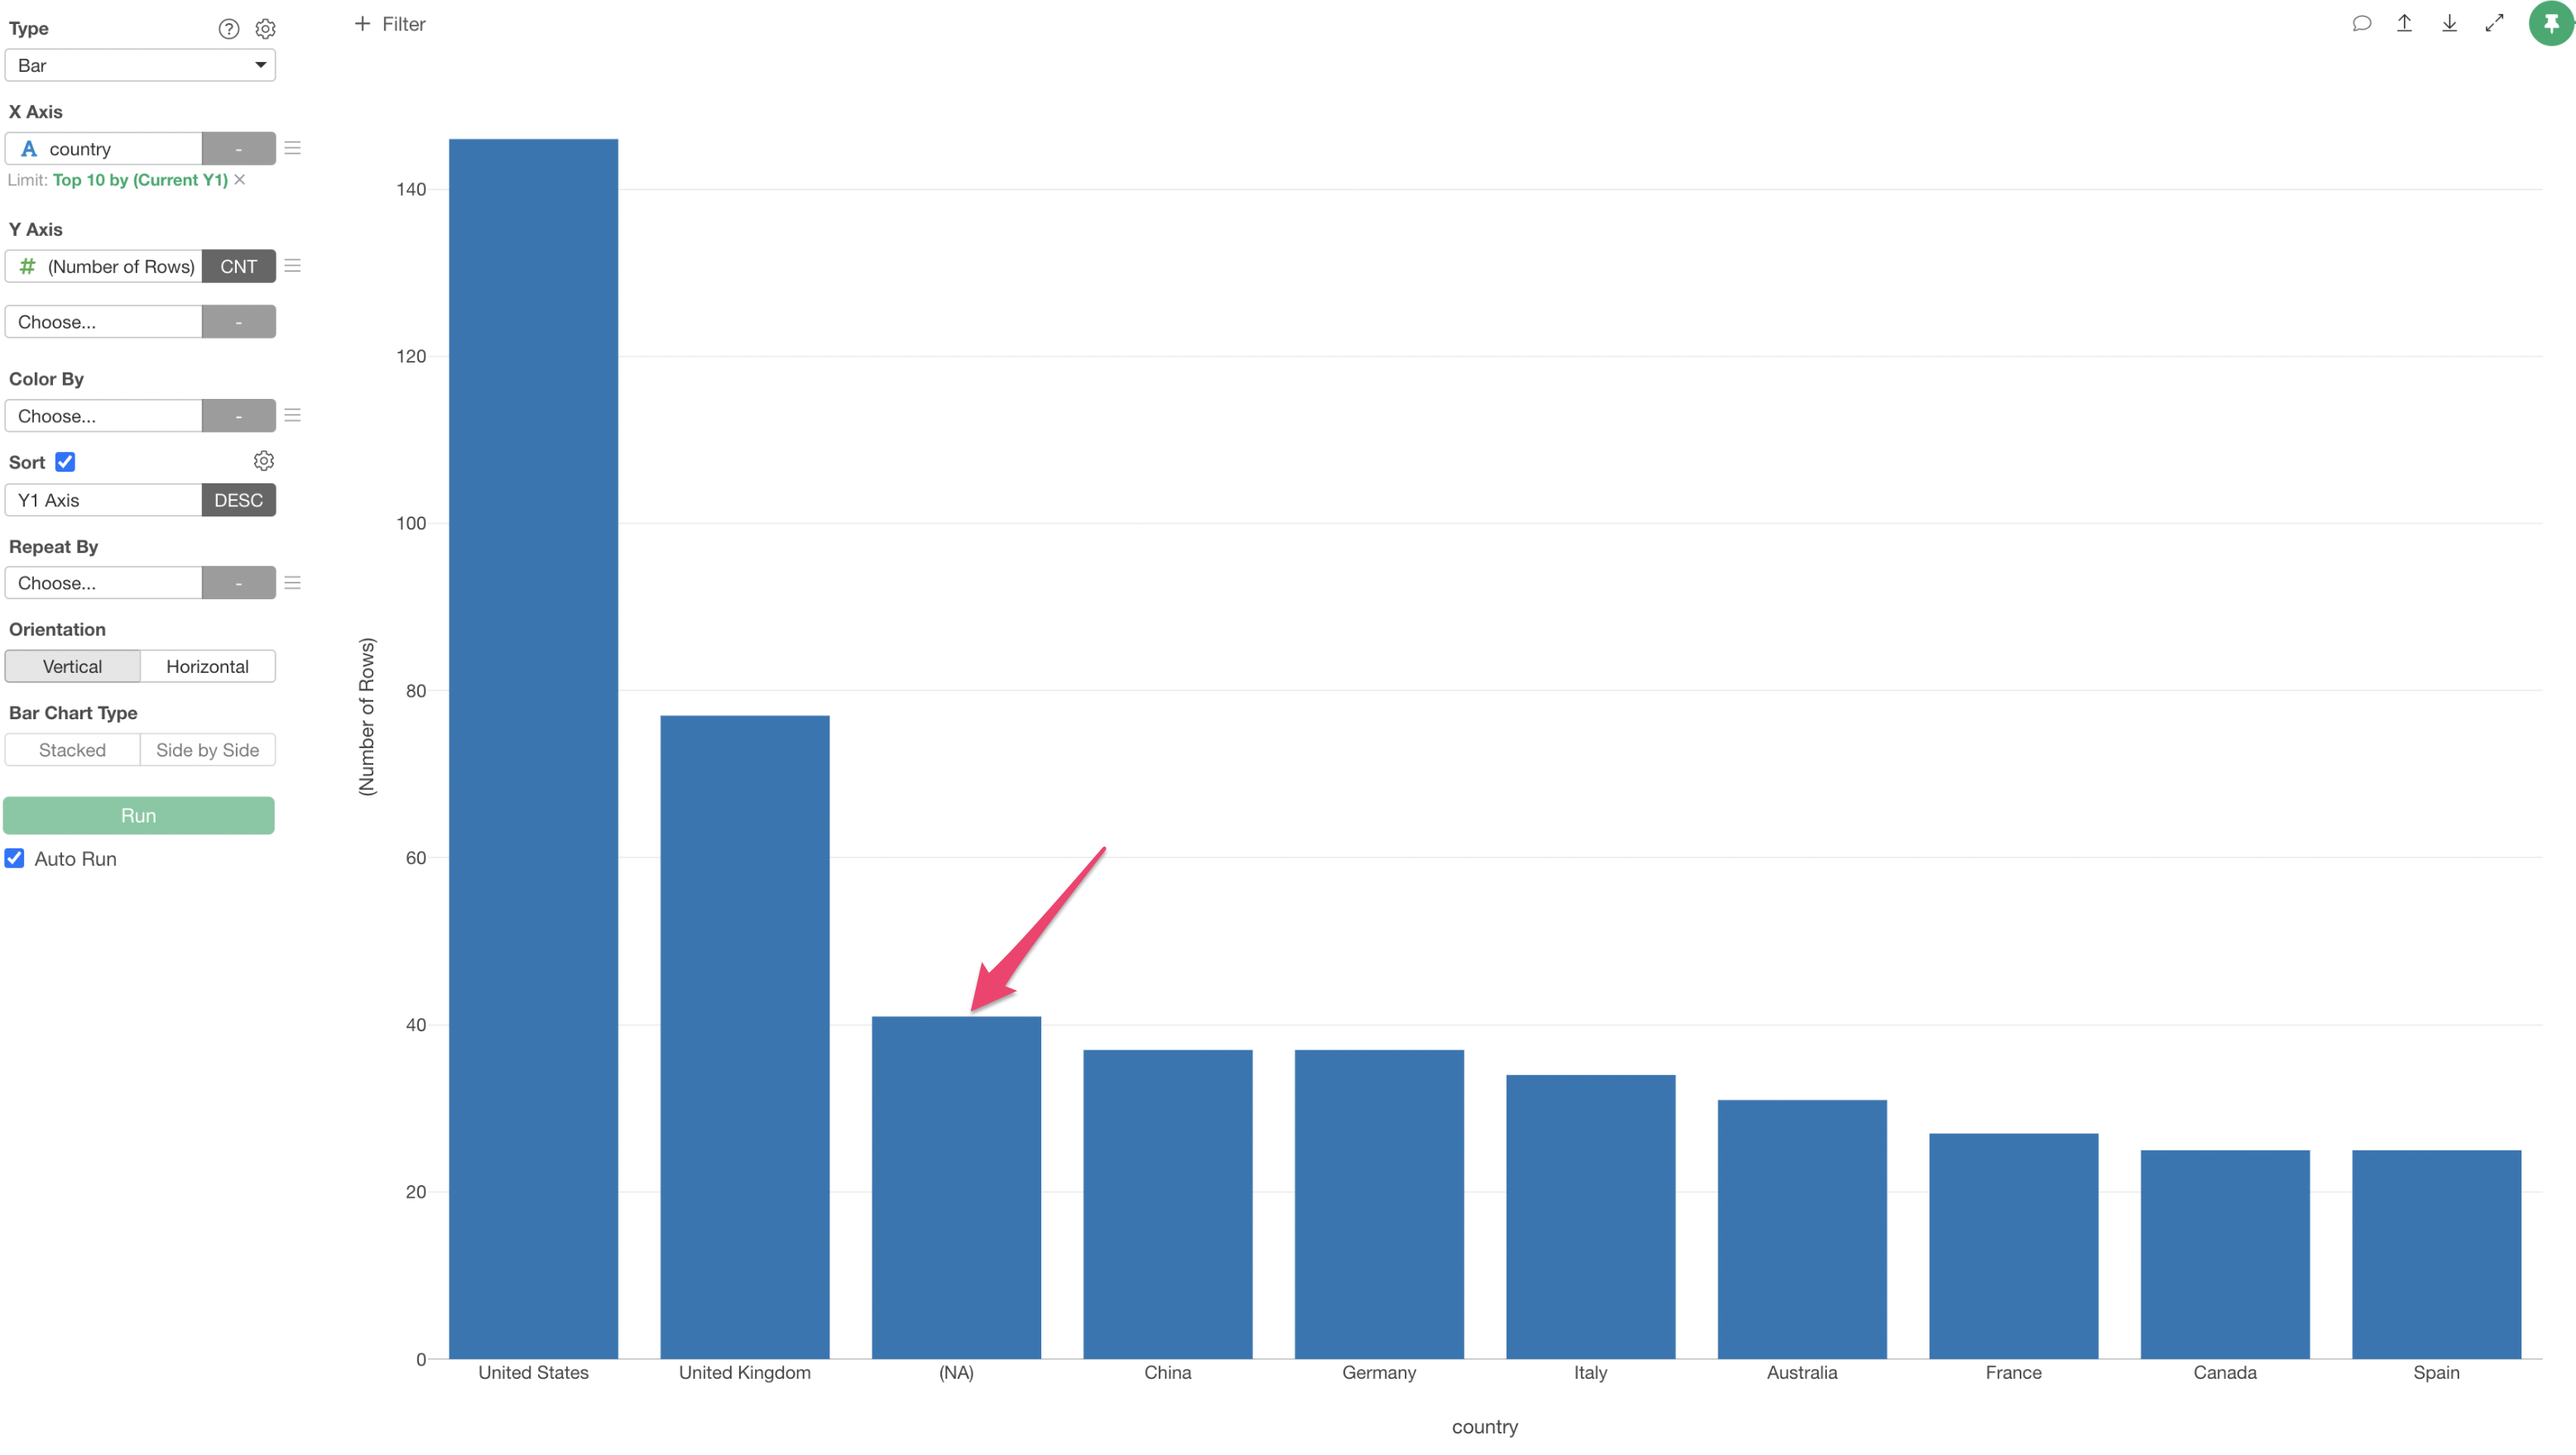
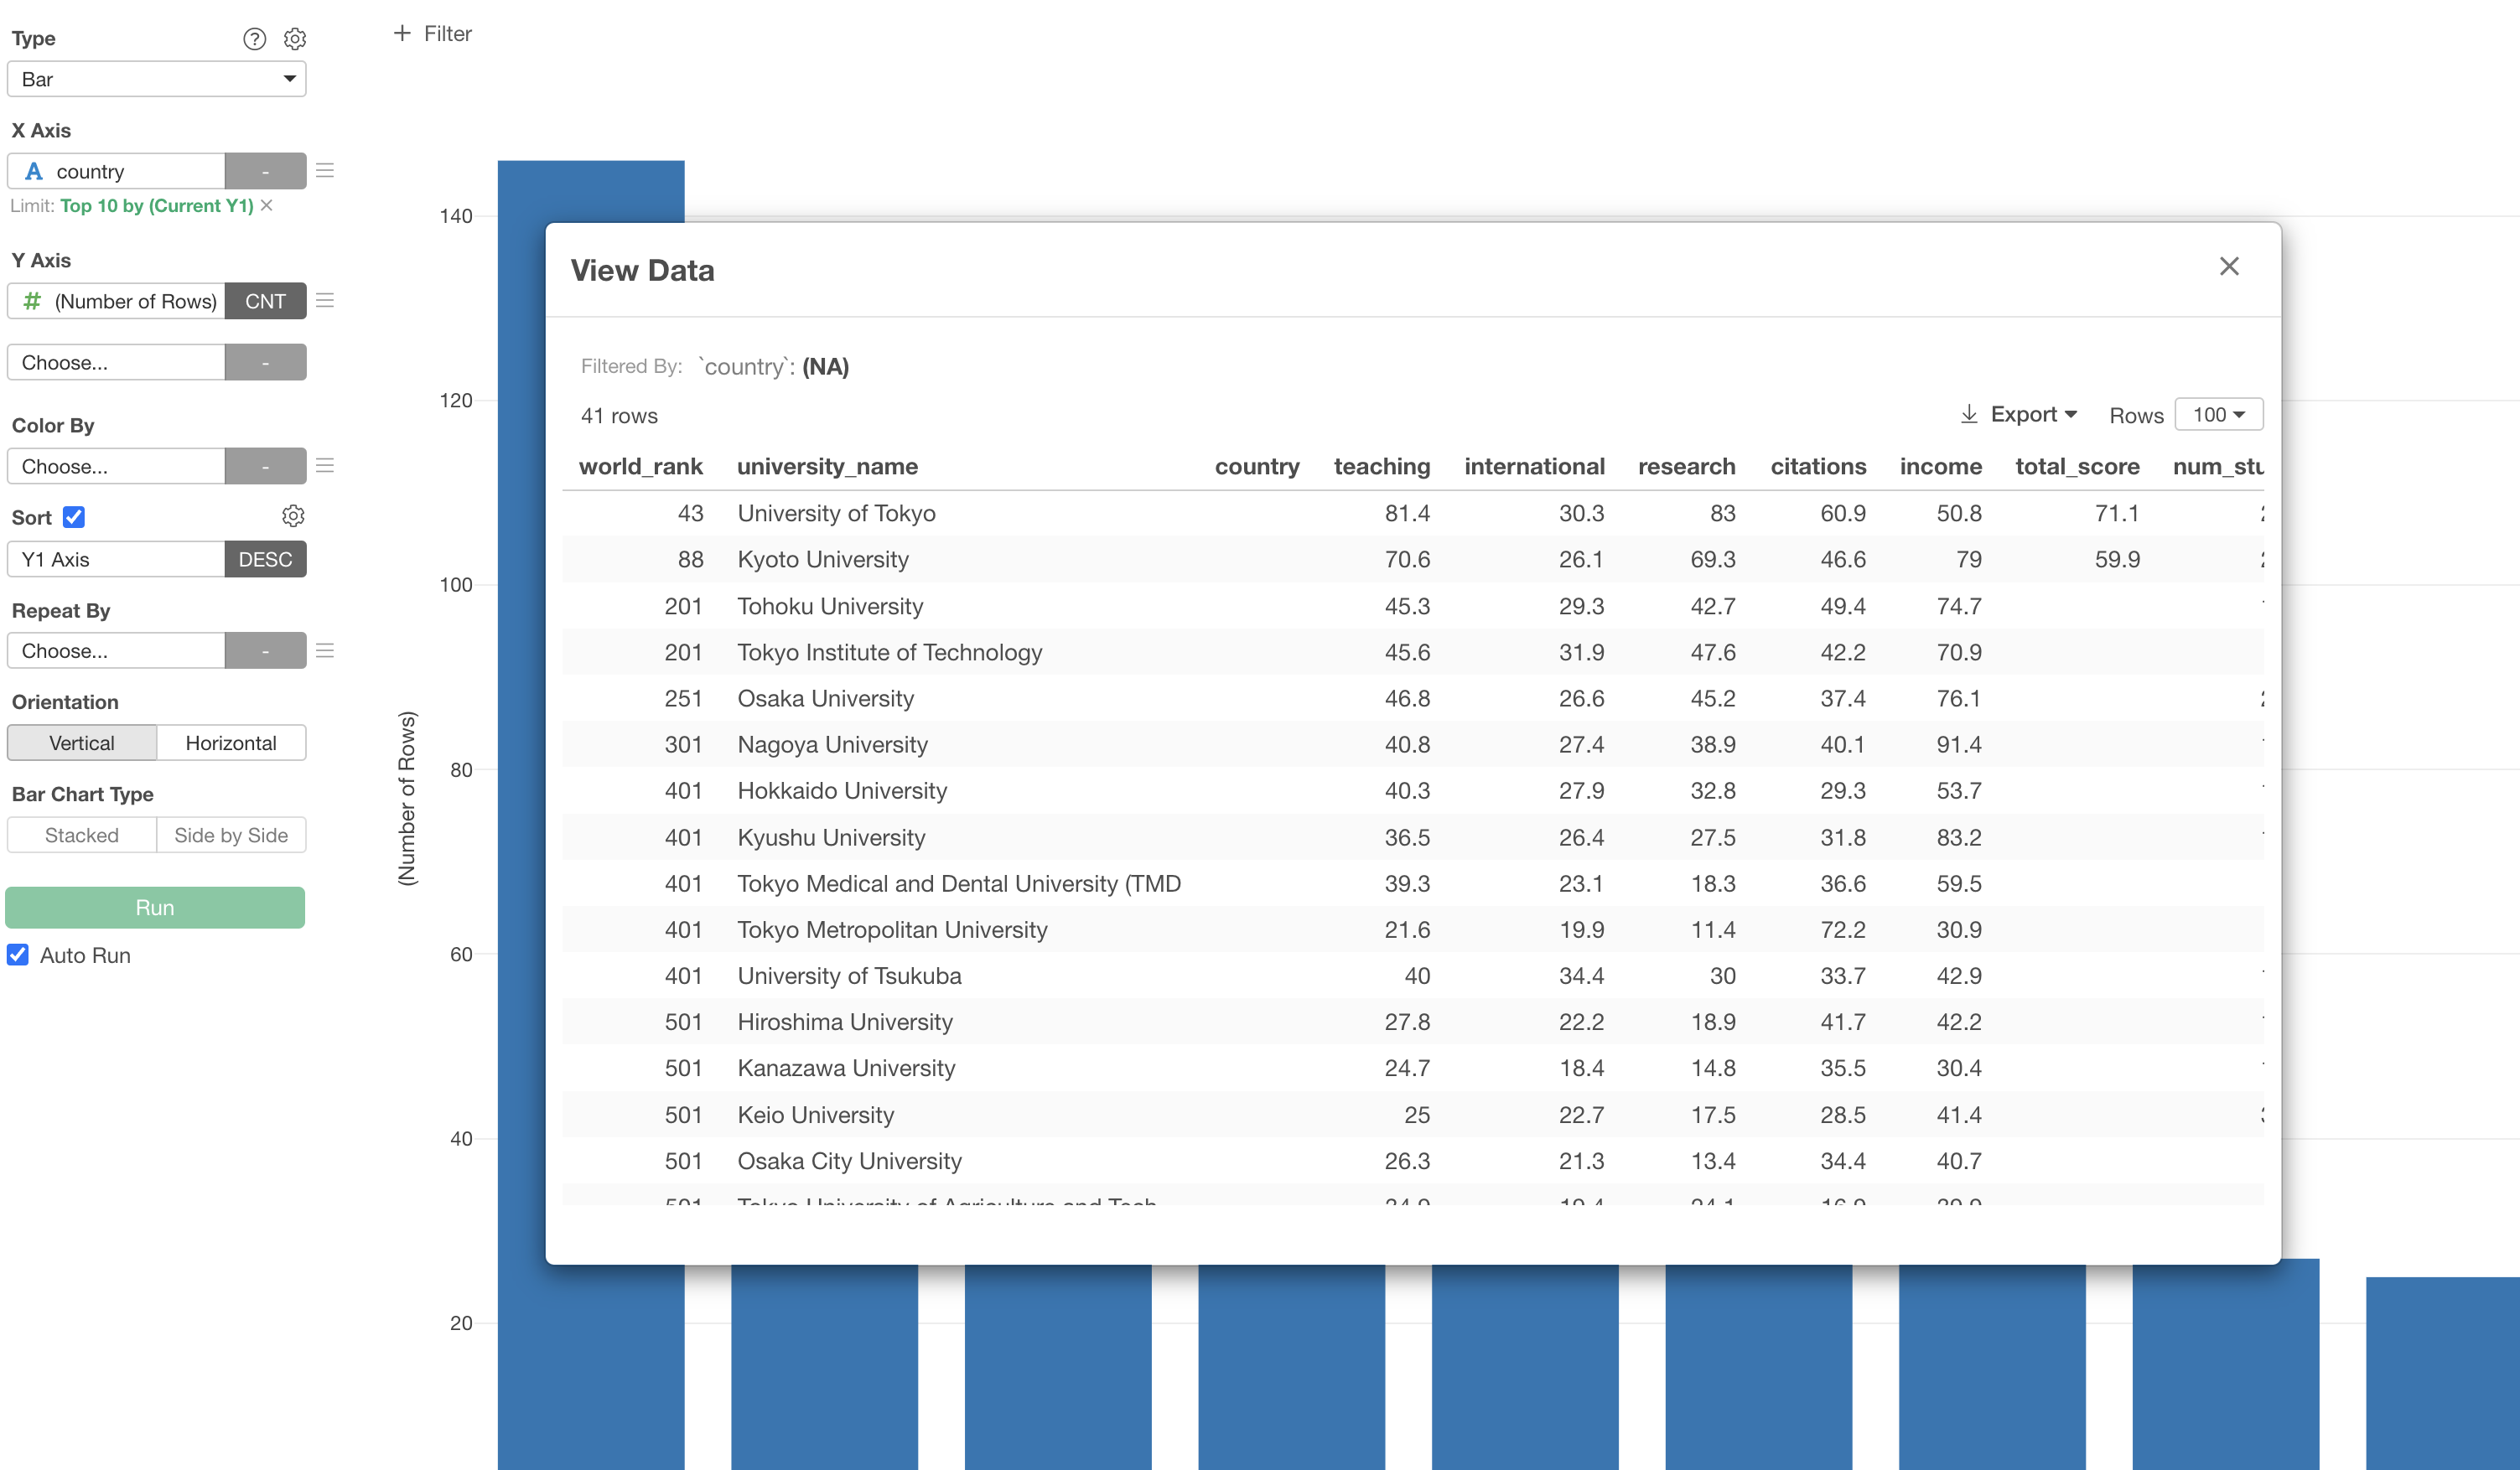
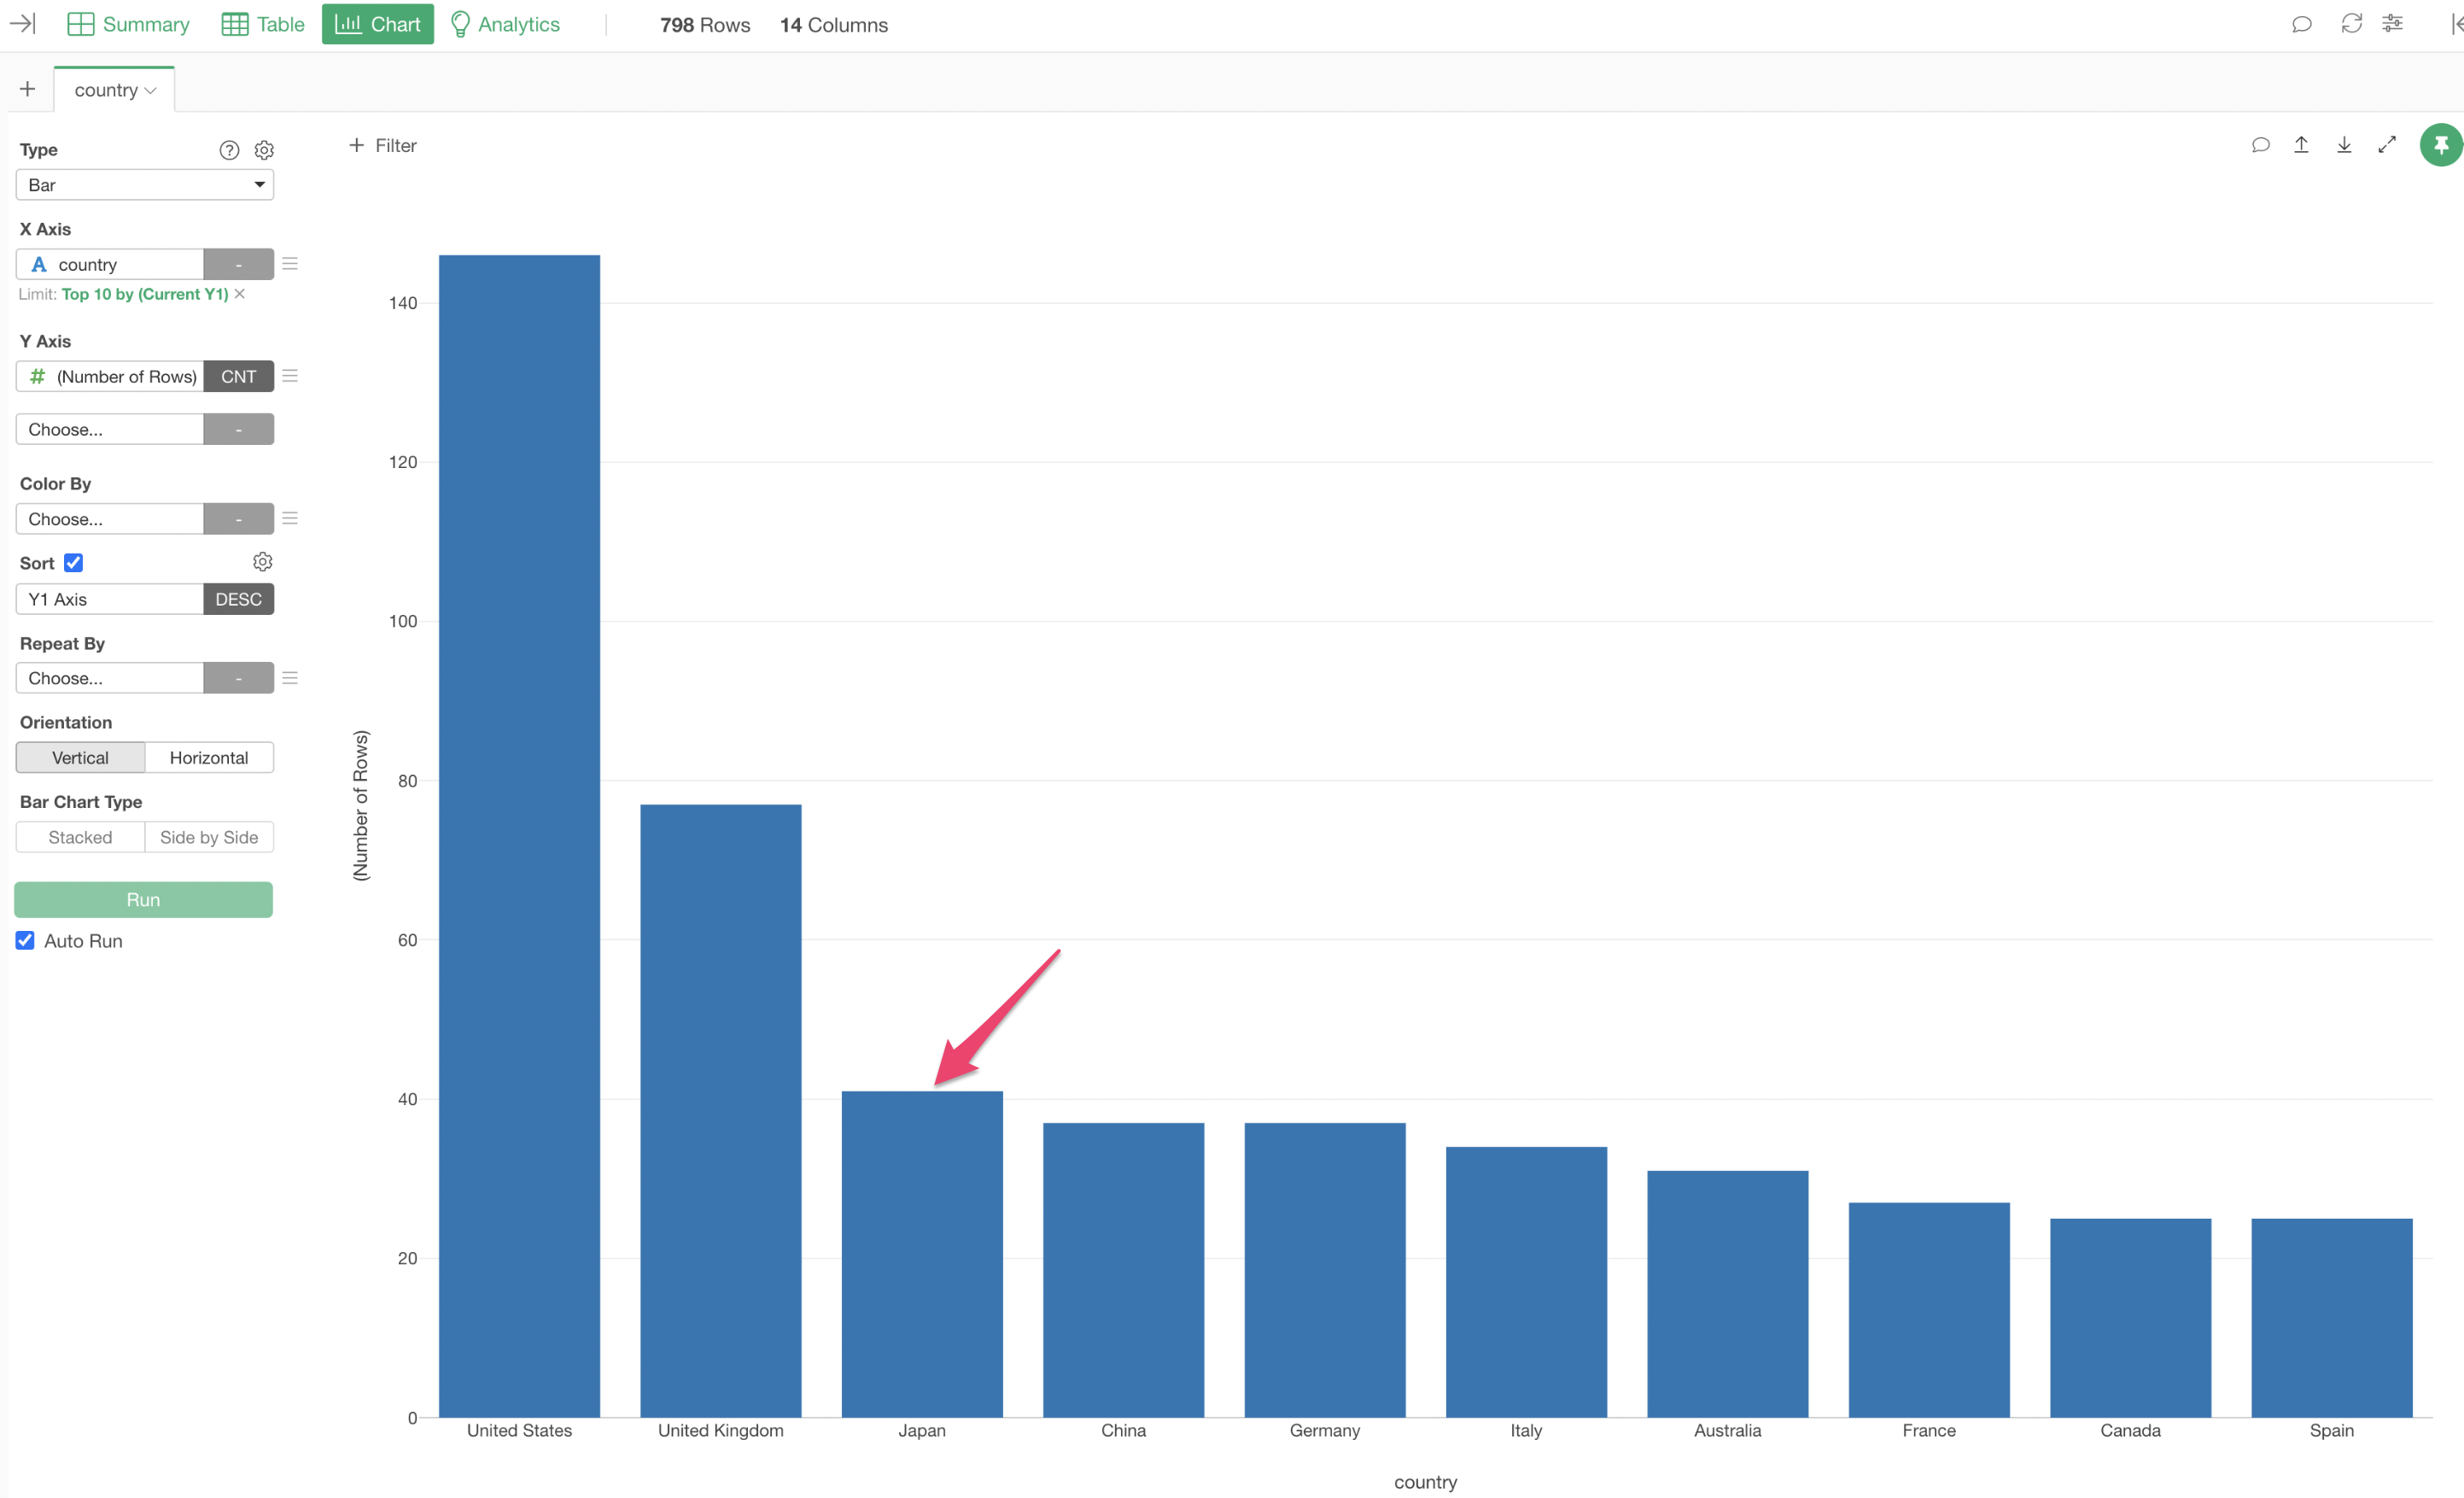
When visualized in a bar chart, we can see that NA is the third most frequent value due to the large number of missing values.
Click on the NA section of the bar chart and open “Show Detail.”
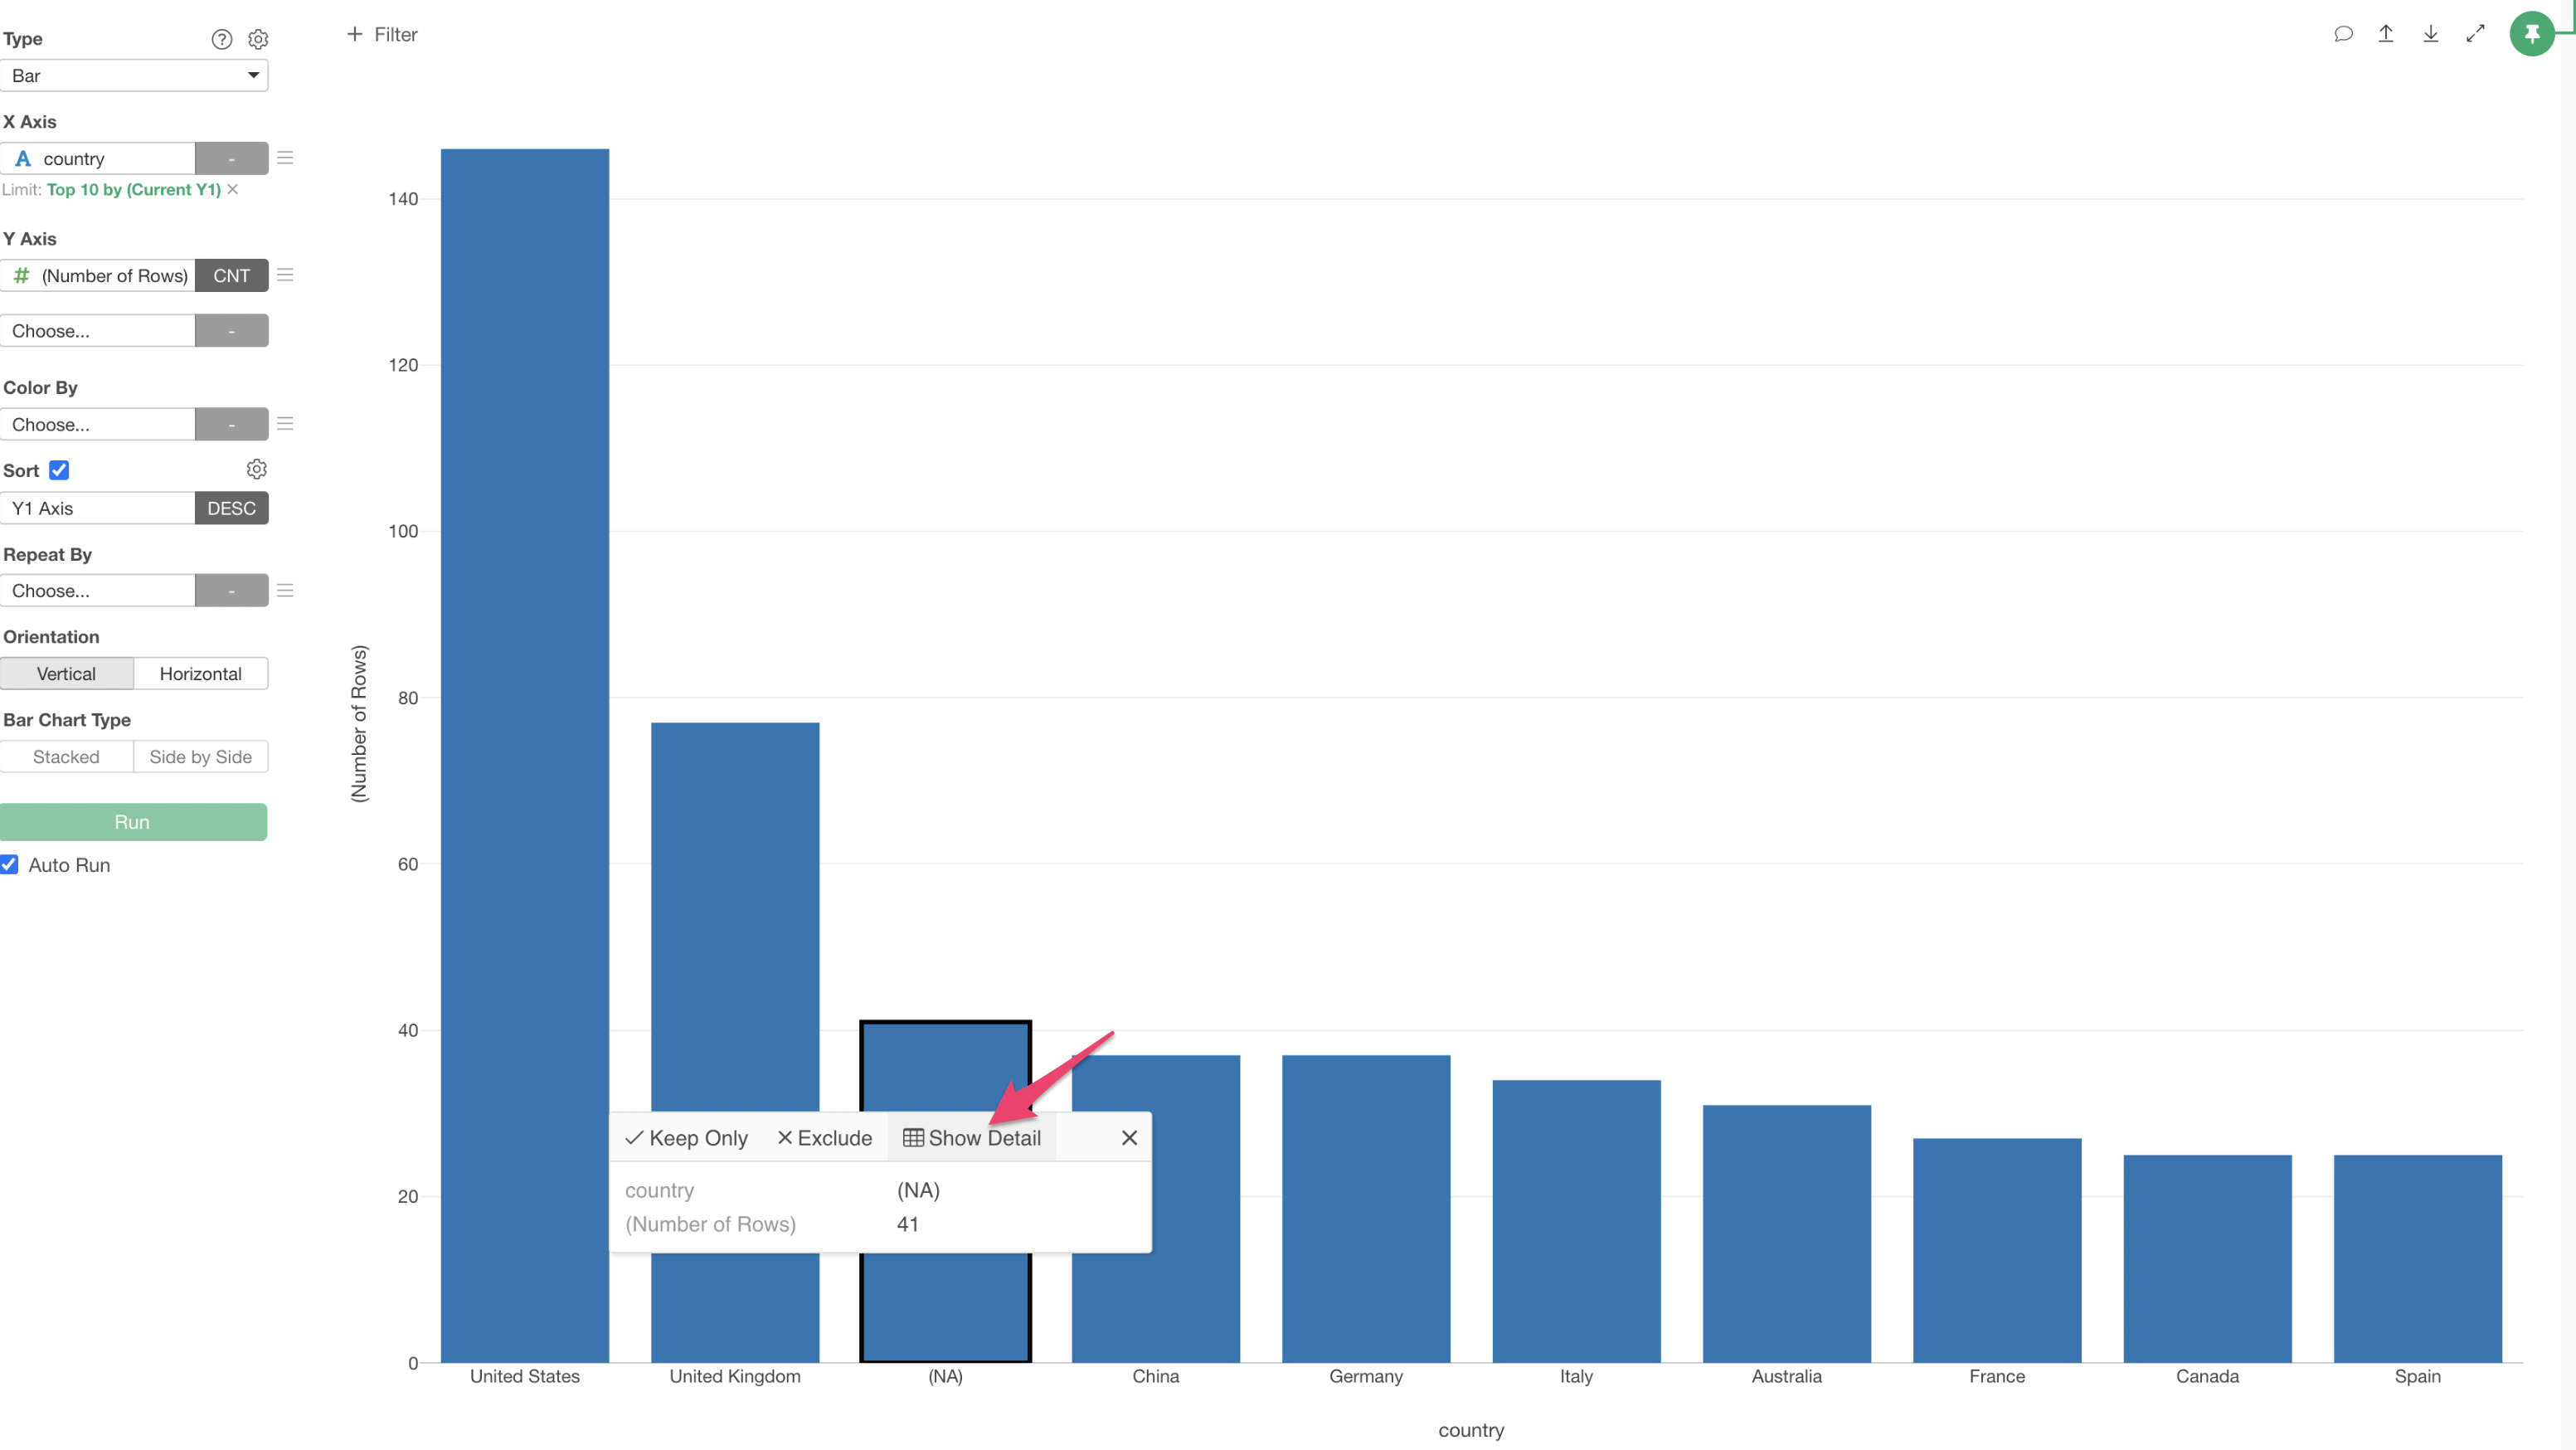
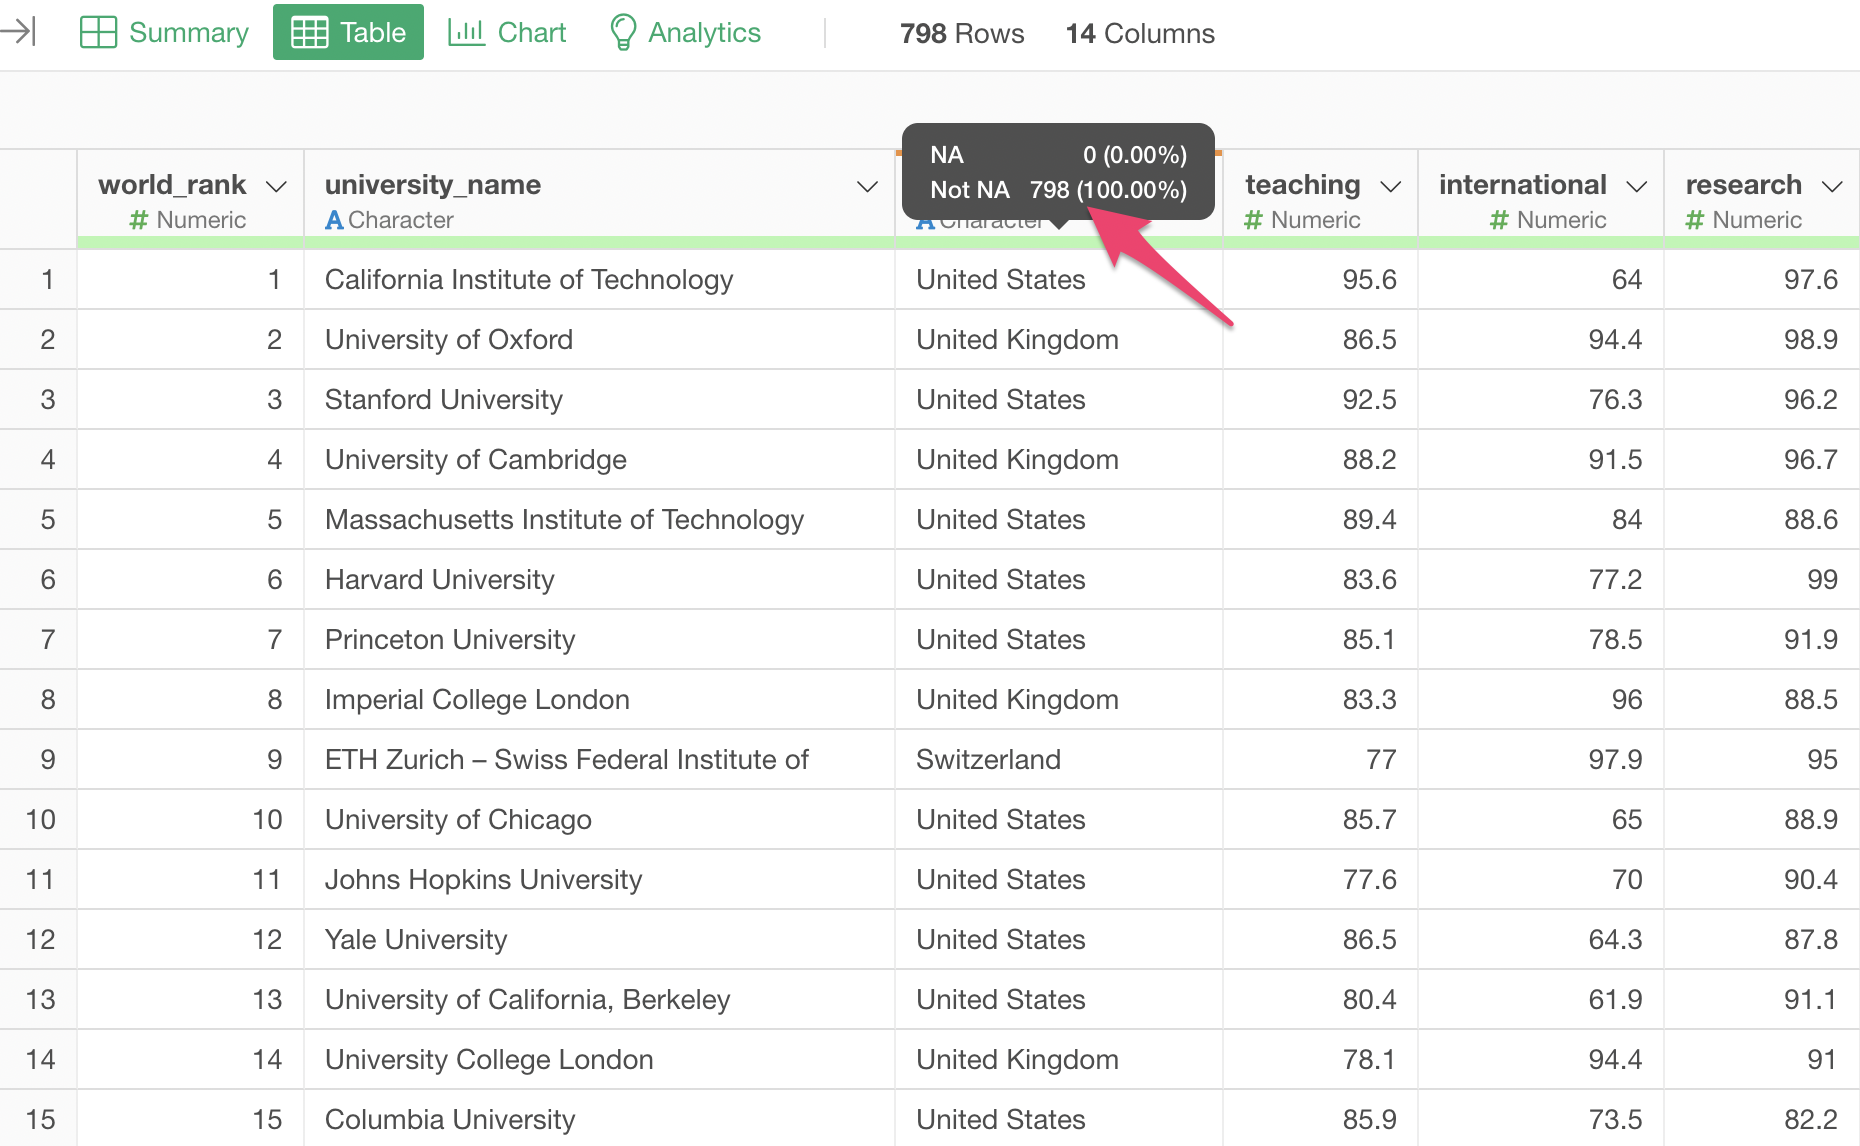
Looking at the details of the missing values, we discovered that these are all Japanese universities.
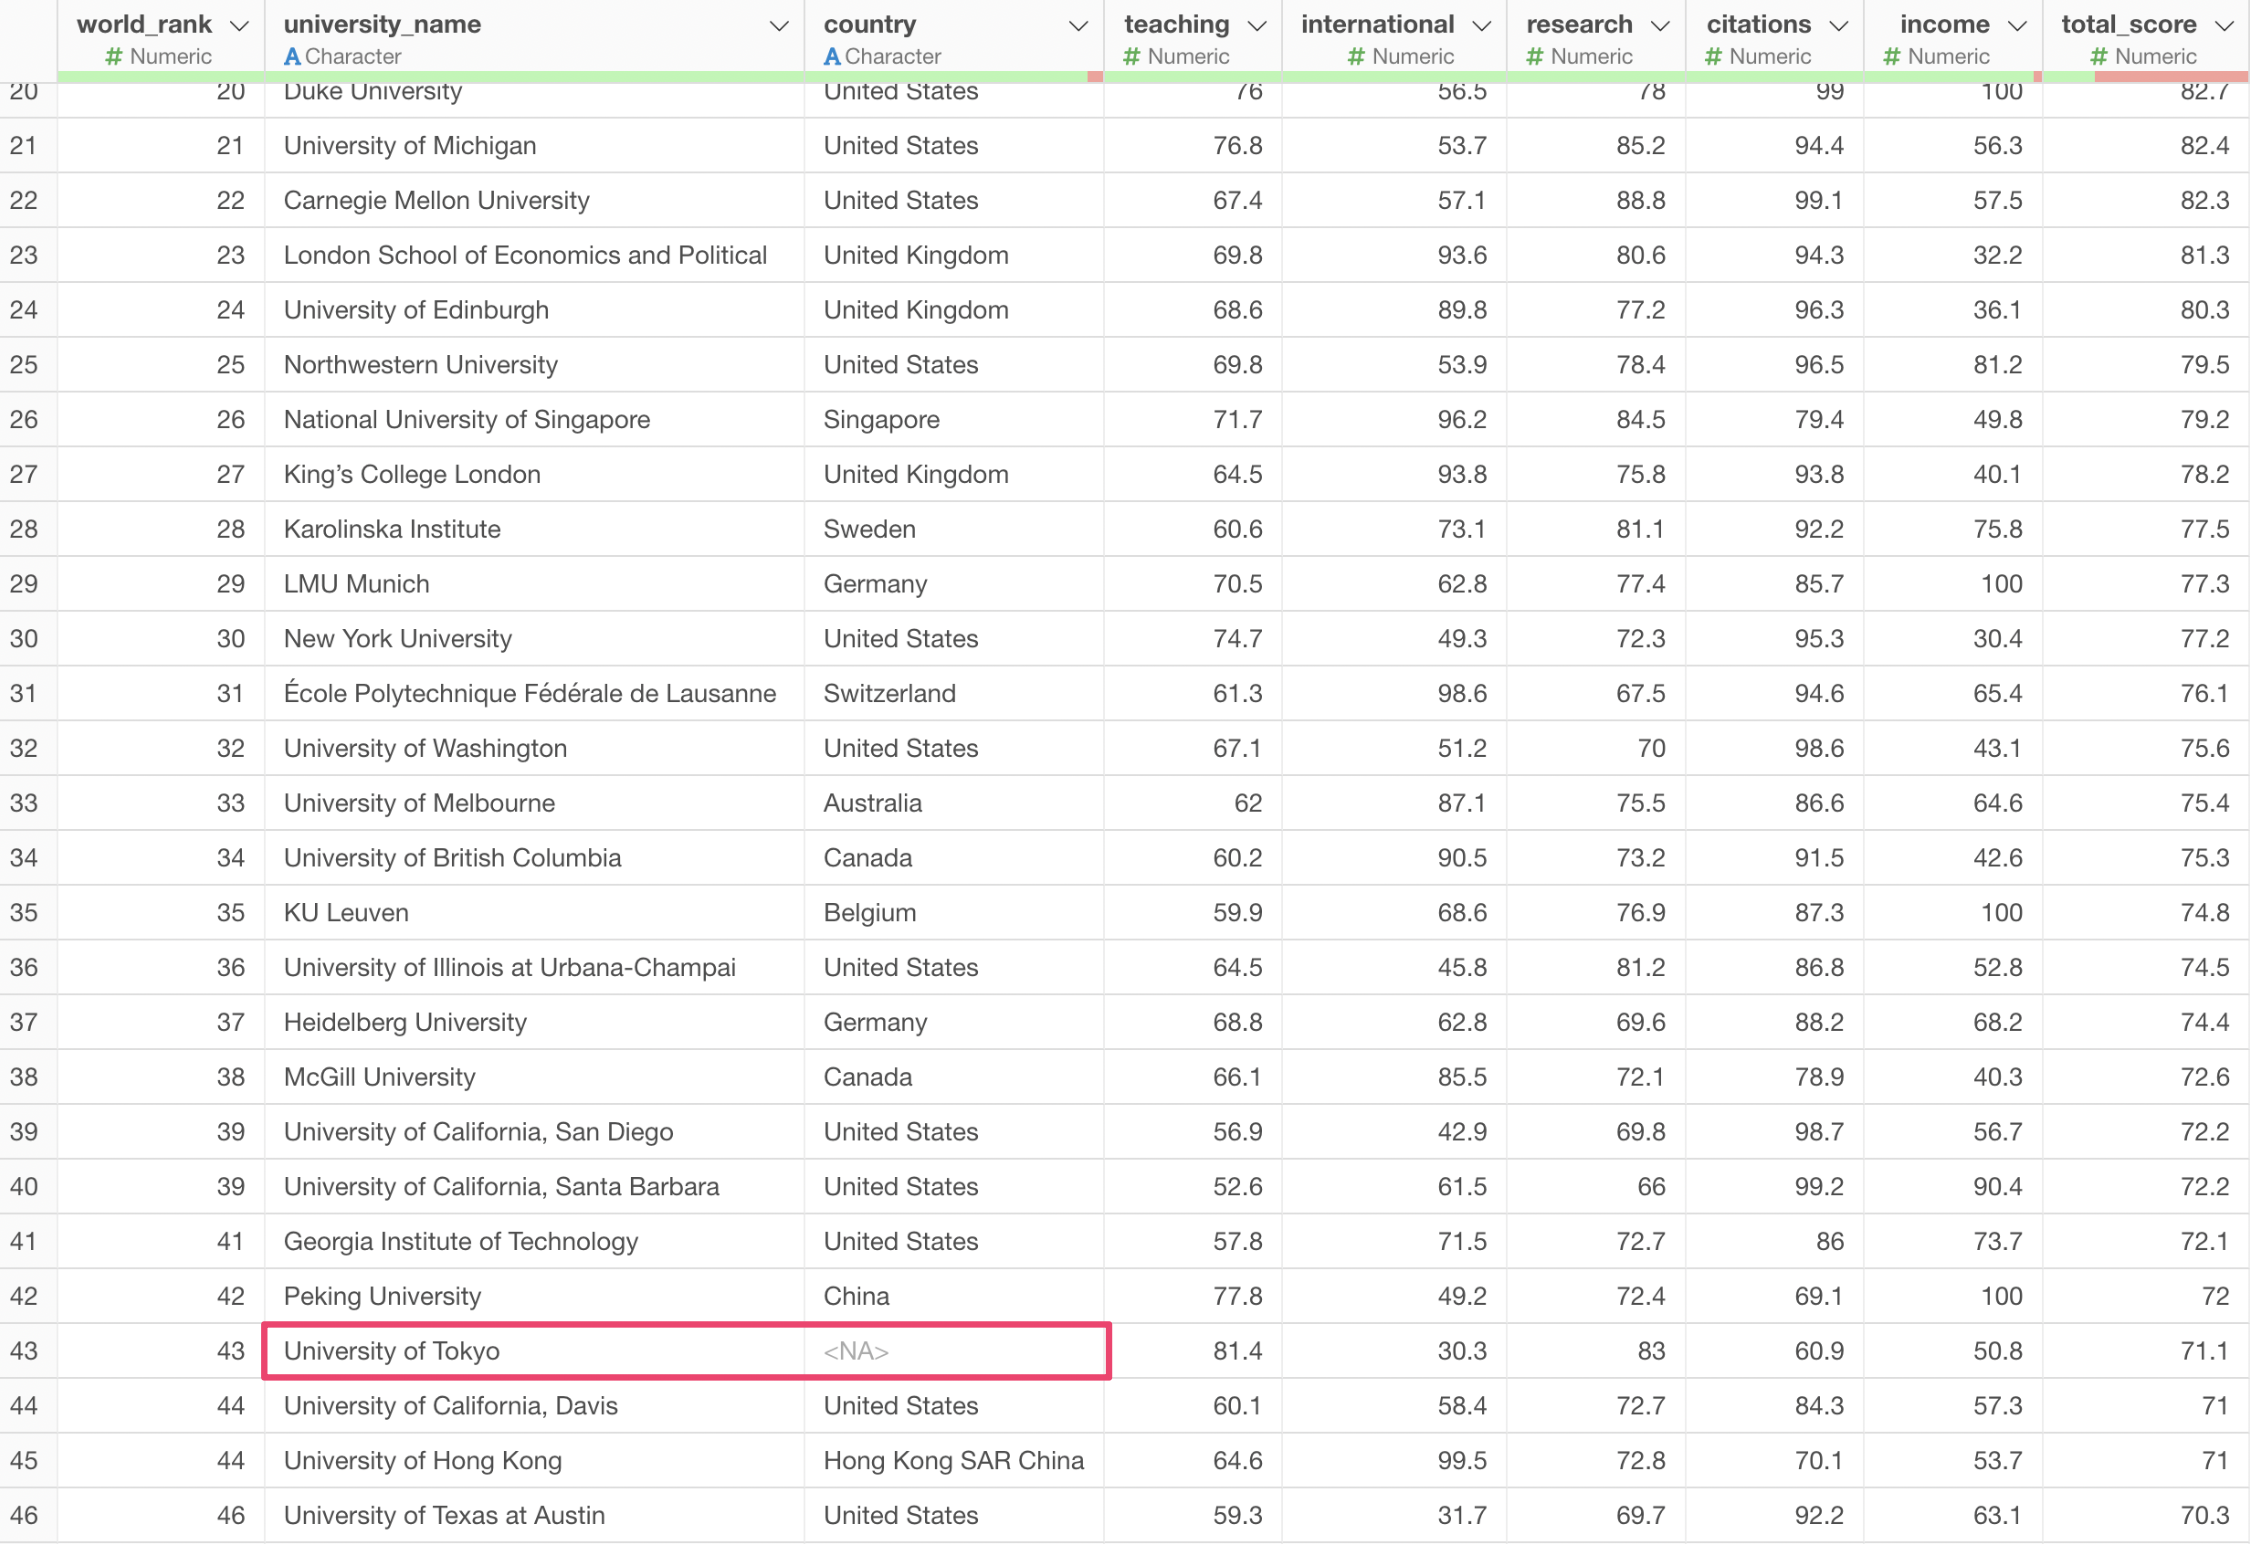
Checking the table view confirms that Japanese universities have missing values in the Country column.
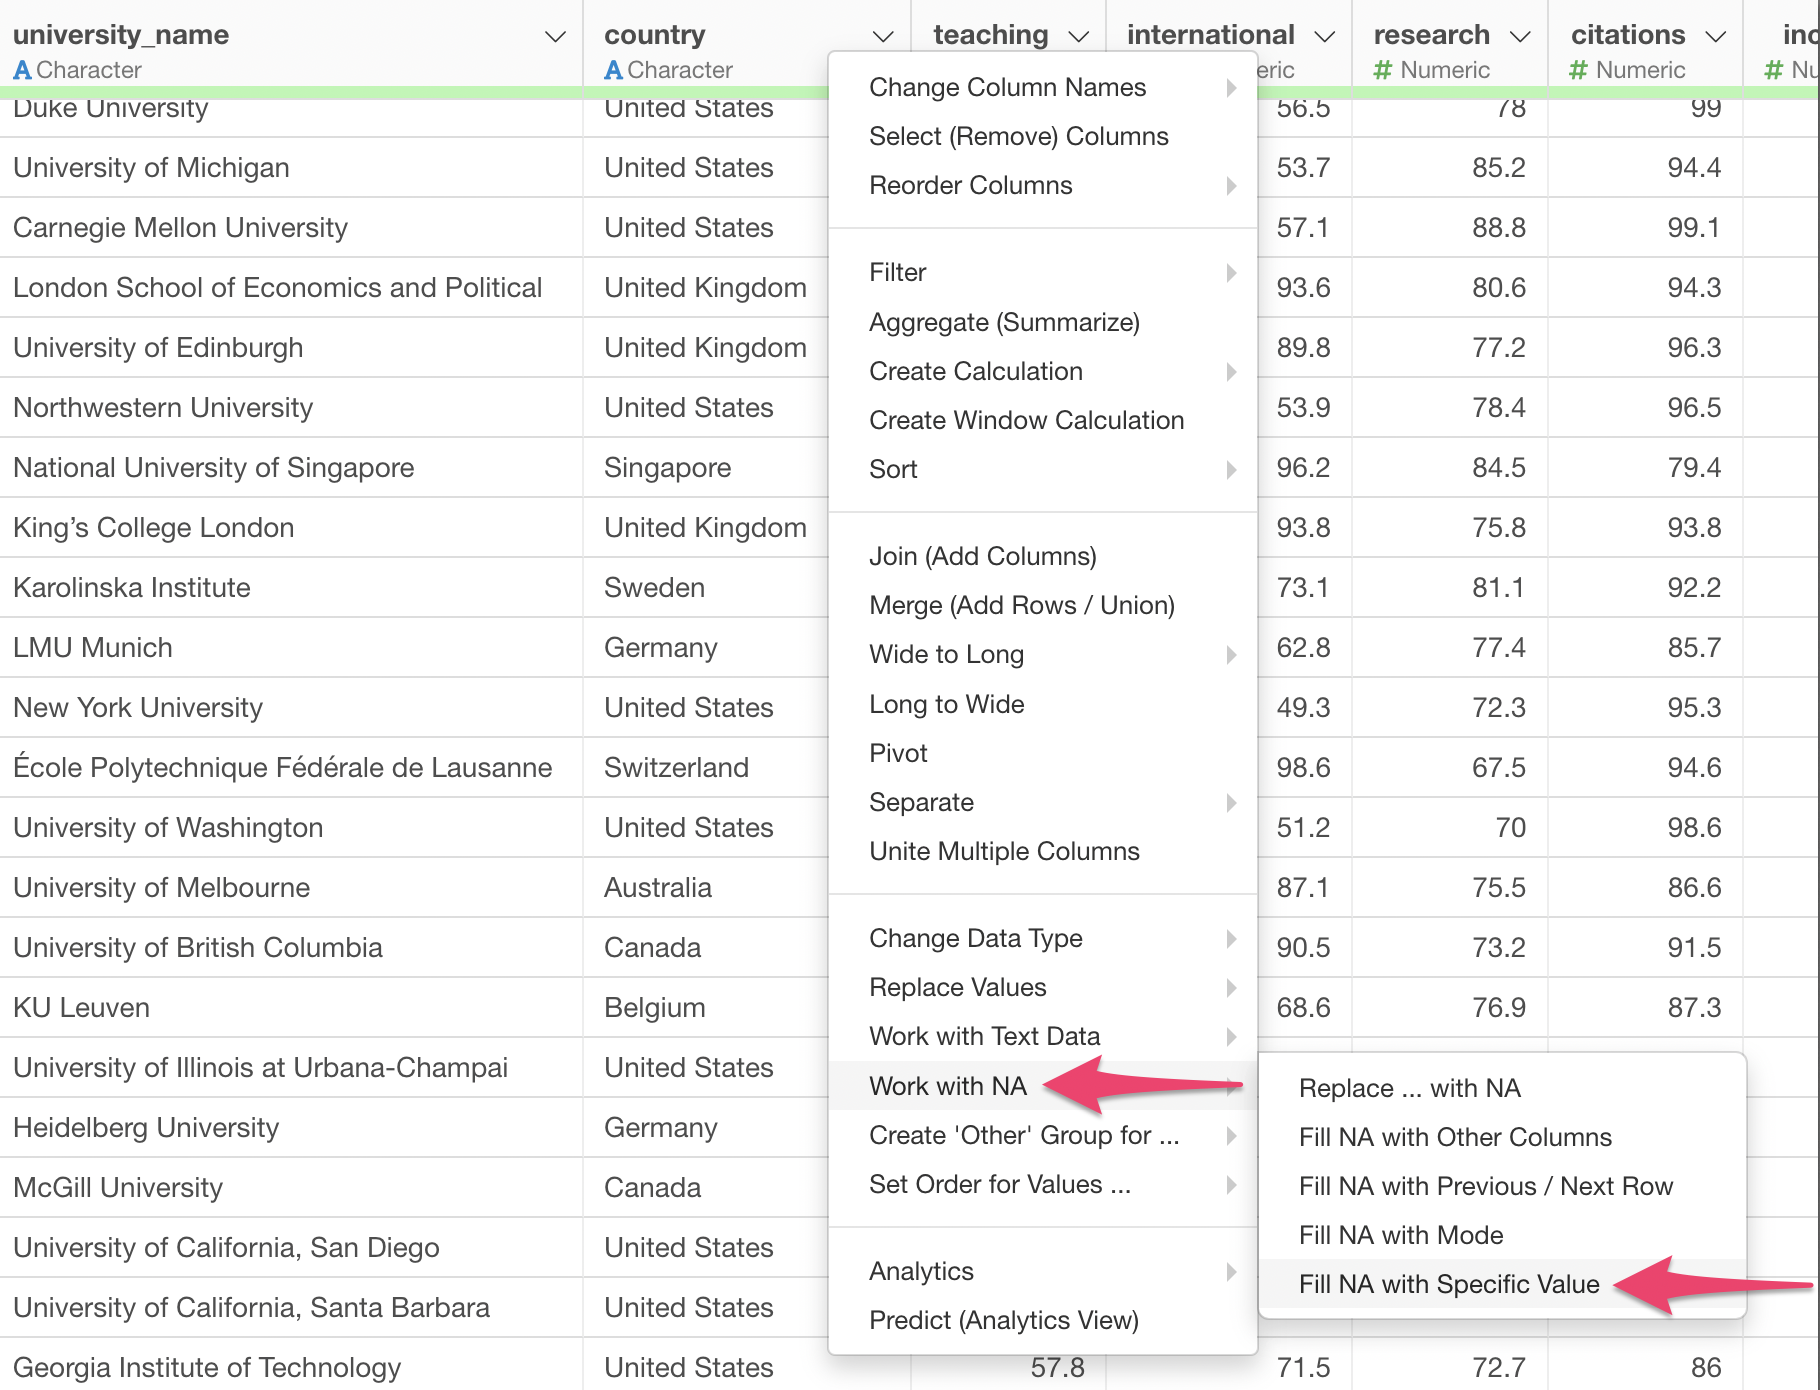
From the column header menu, select “Work with NA” Operations and then “Fill NA with Specific Value.”
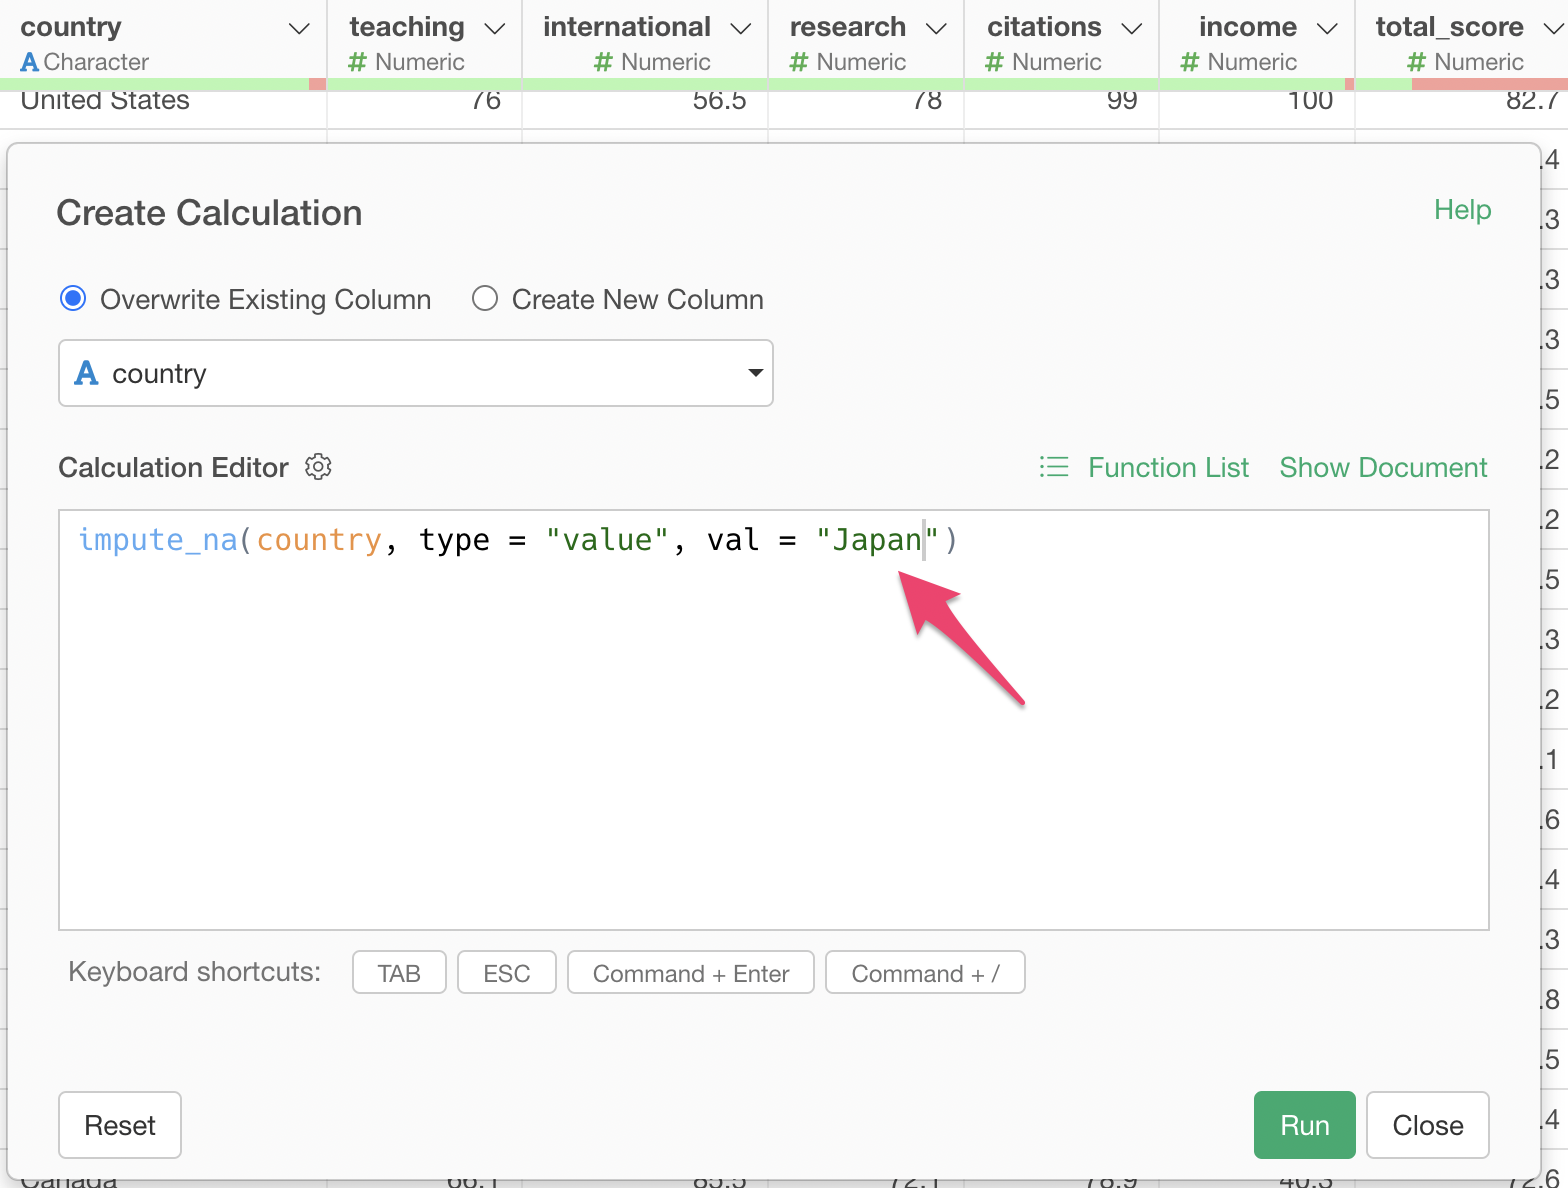
A dialog opens with the function already entered in the calculation editor.
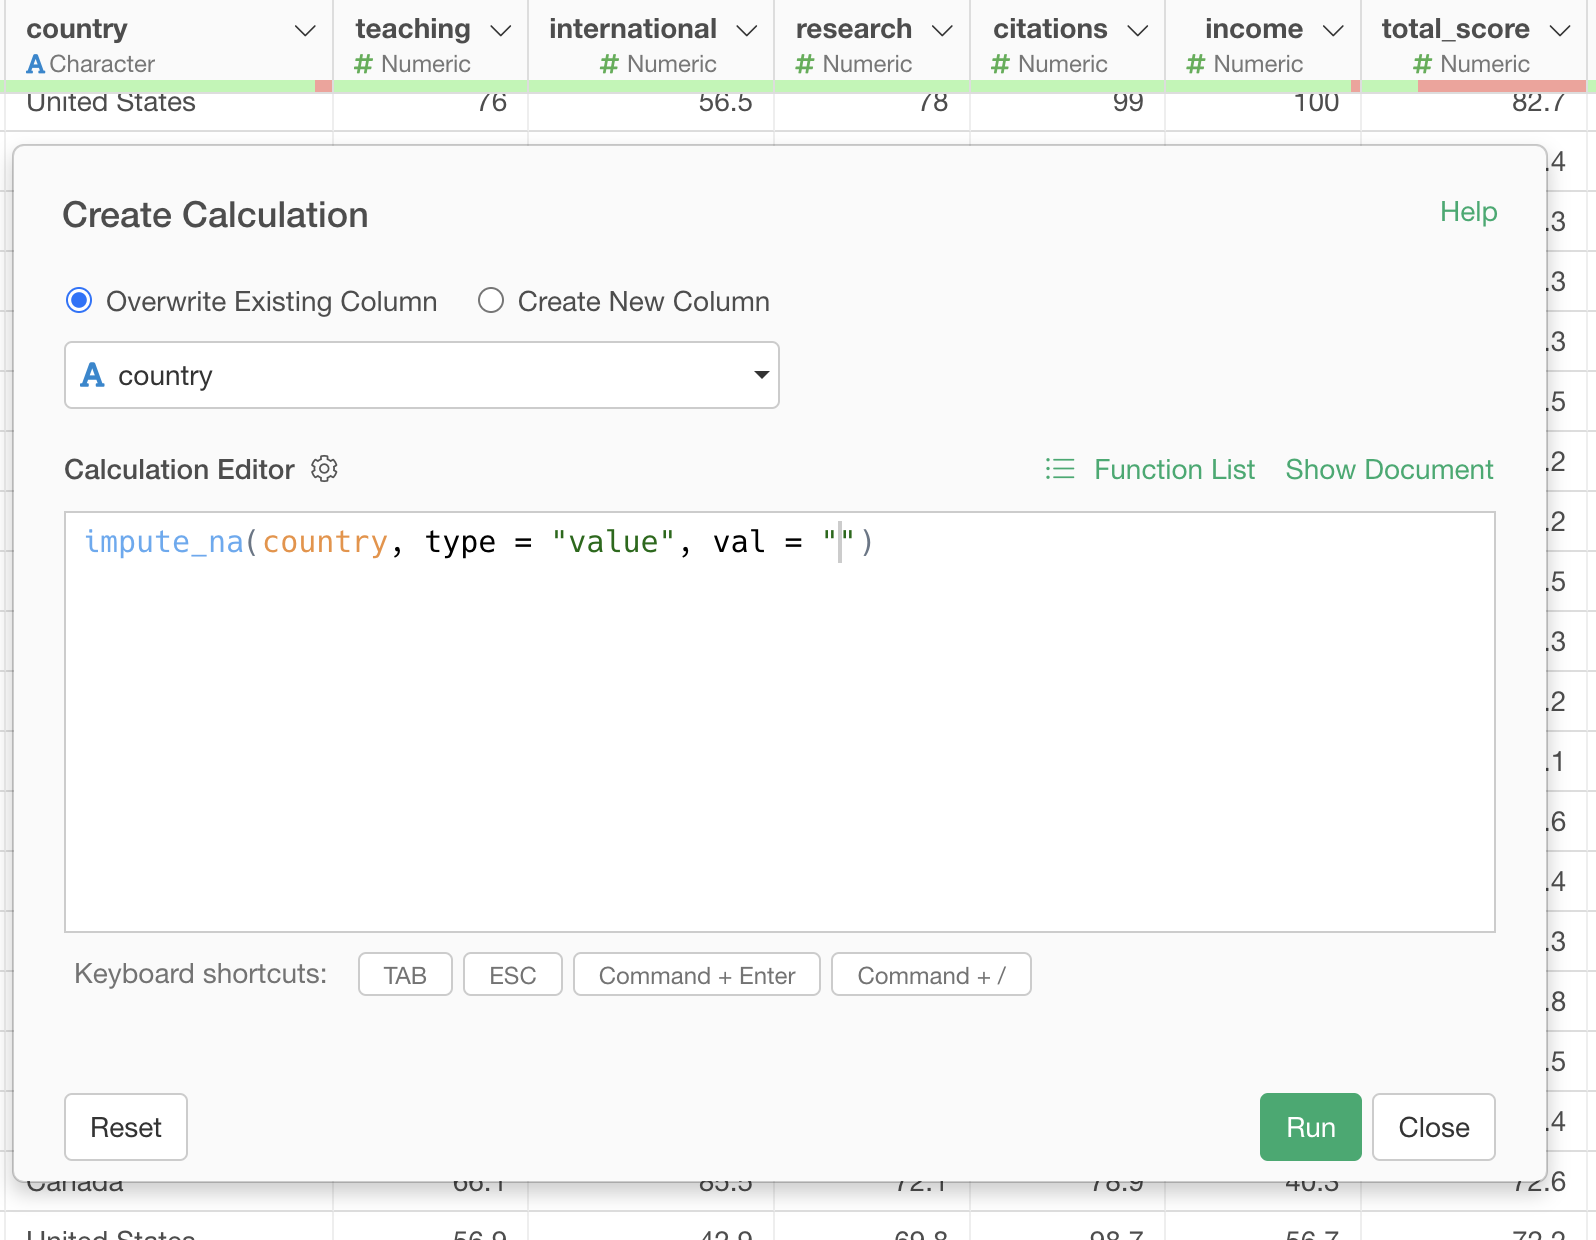
To fill missing values, enter the value in
val = "value to fill missing values". In this case, we want
to fill with “Japan”, so it becomes val = "Japan".
After entering the value to fill missing values, execute the function.
Looking at the Country column, we can see that the missing values have been filled.
Going back to the previously created bar chart and changing the chart pin to the latest step, we can see that the bar that was missing values has been replaced with “Japan.”
Fill Missing Values with Values from Previous or Next Rows
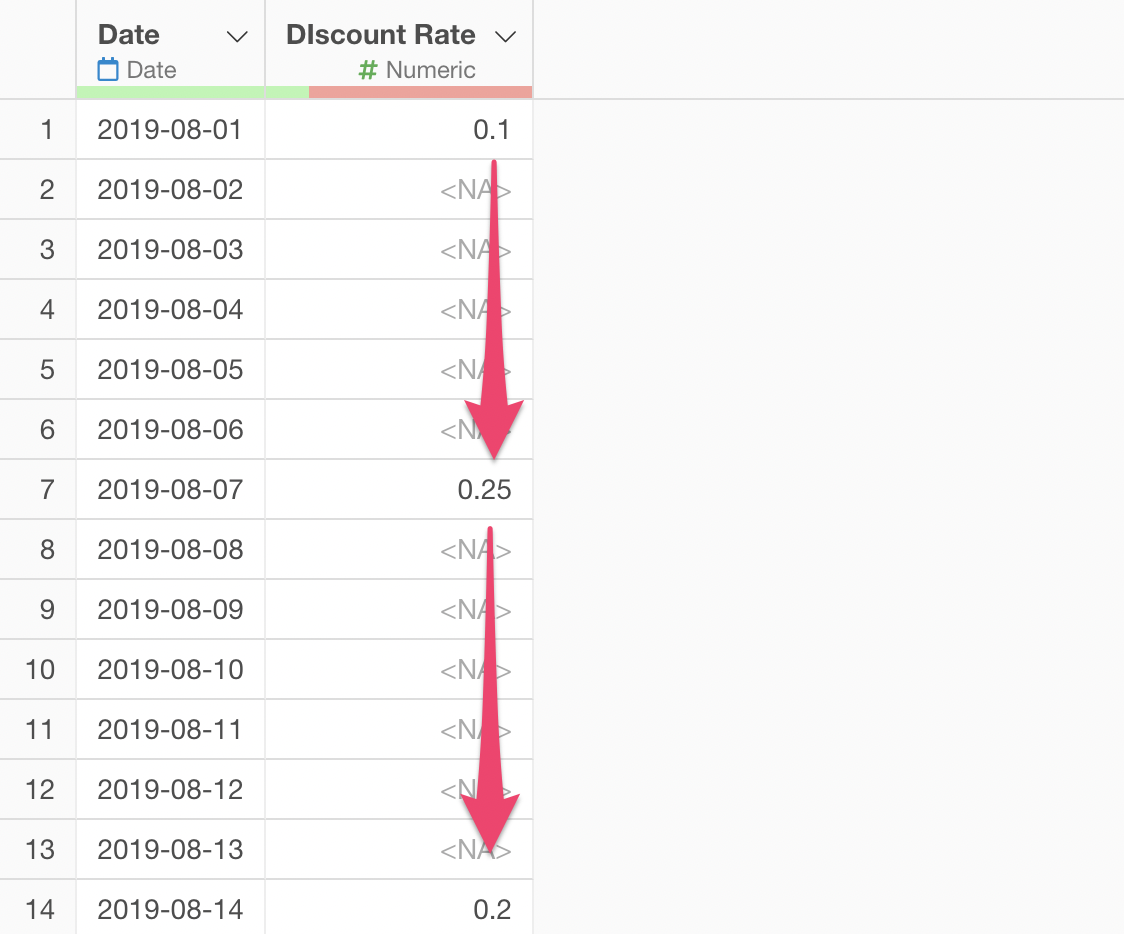
For example, imagine a store that changes its discount rate weekly.
Since the discount rate doesn’t change until the next week once it’s been changed, values are only entered on the days when changes occur.
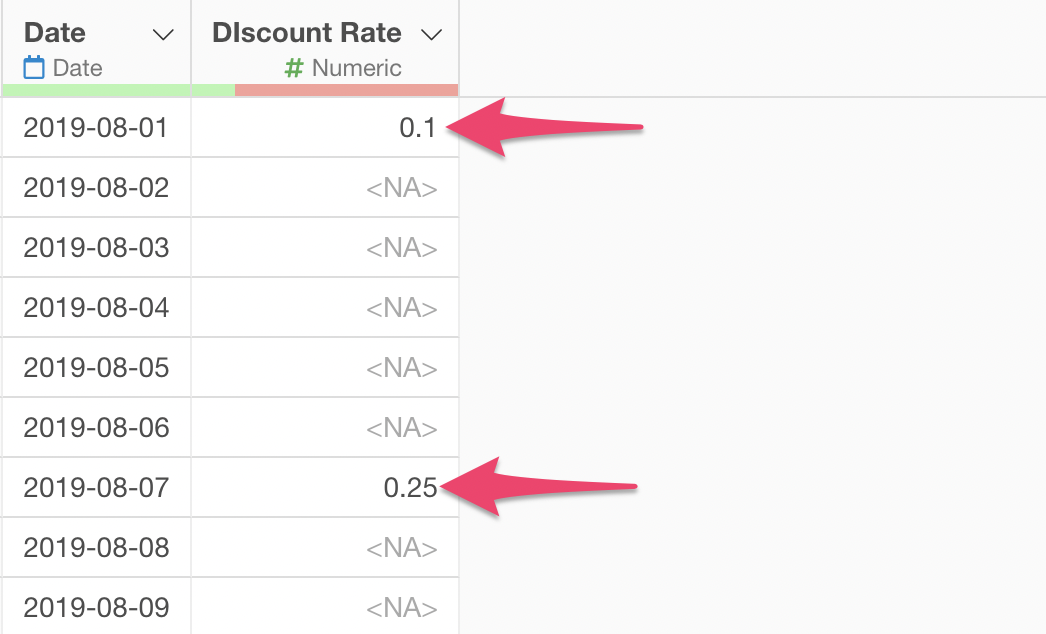
we want to fill missing values with the previous value until the next discount rate change.
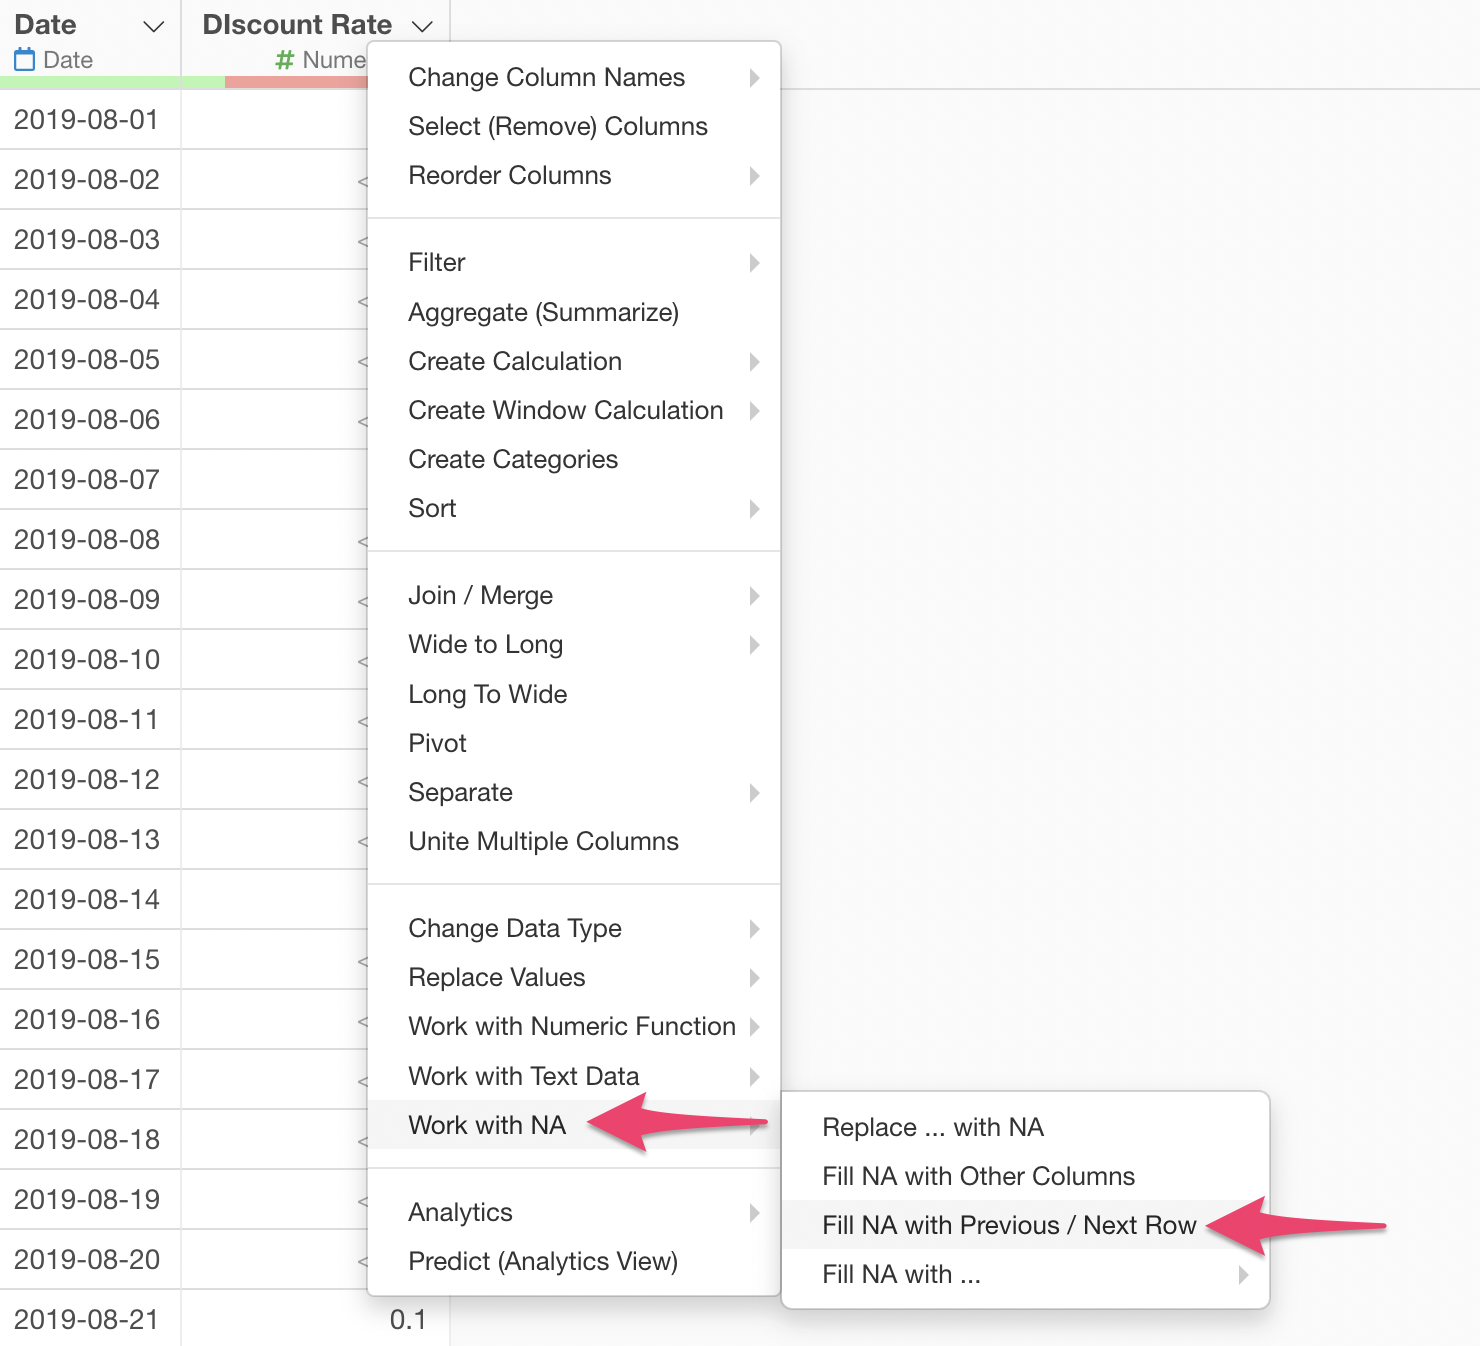
From the column header menu, select “Work with NA” Operations and then “Fill NA with Previous or Next Row.”
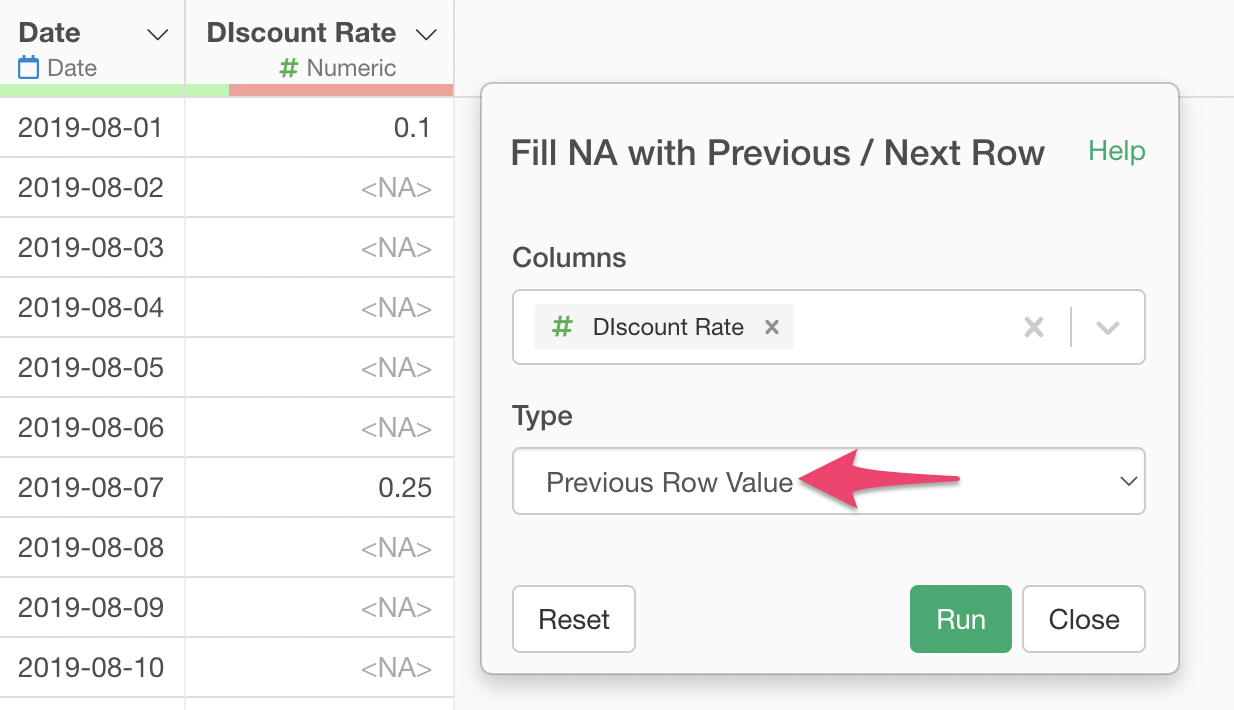
In this case, we select the previous value since the discount rate remains constant from when it changes until the next change.
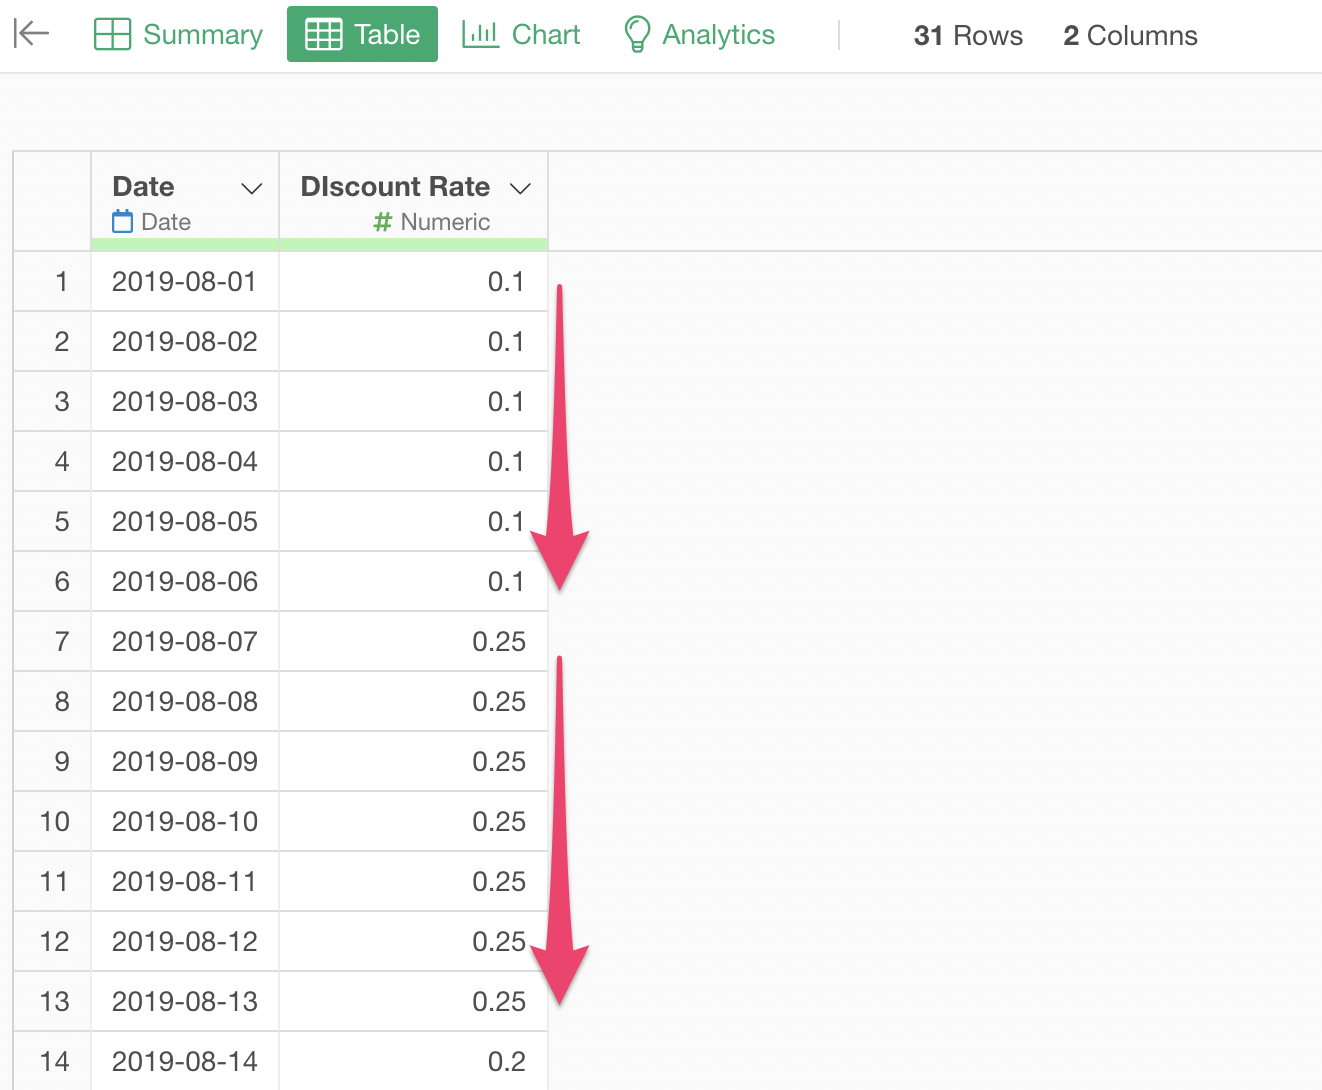
This allows us to fill missing values with the previous value, maintaining a constant discount rate until the next change.
How to Fill Missing Values Directly in Charts
Actually, if you just want to visualize the discount rate trend, there’s a way to handle missing values directly in the chart without using data wrangling steps.
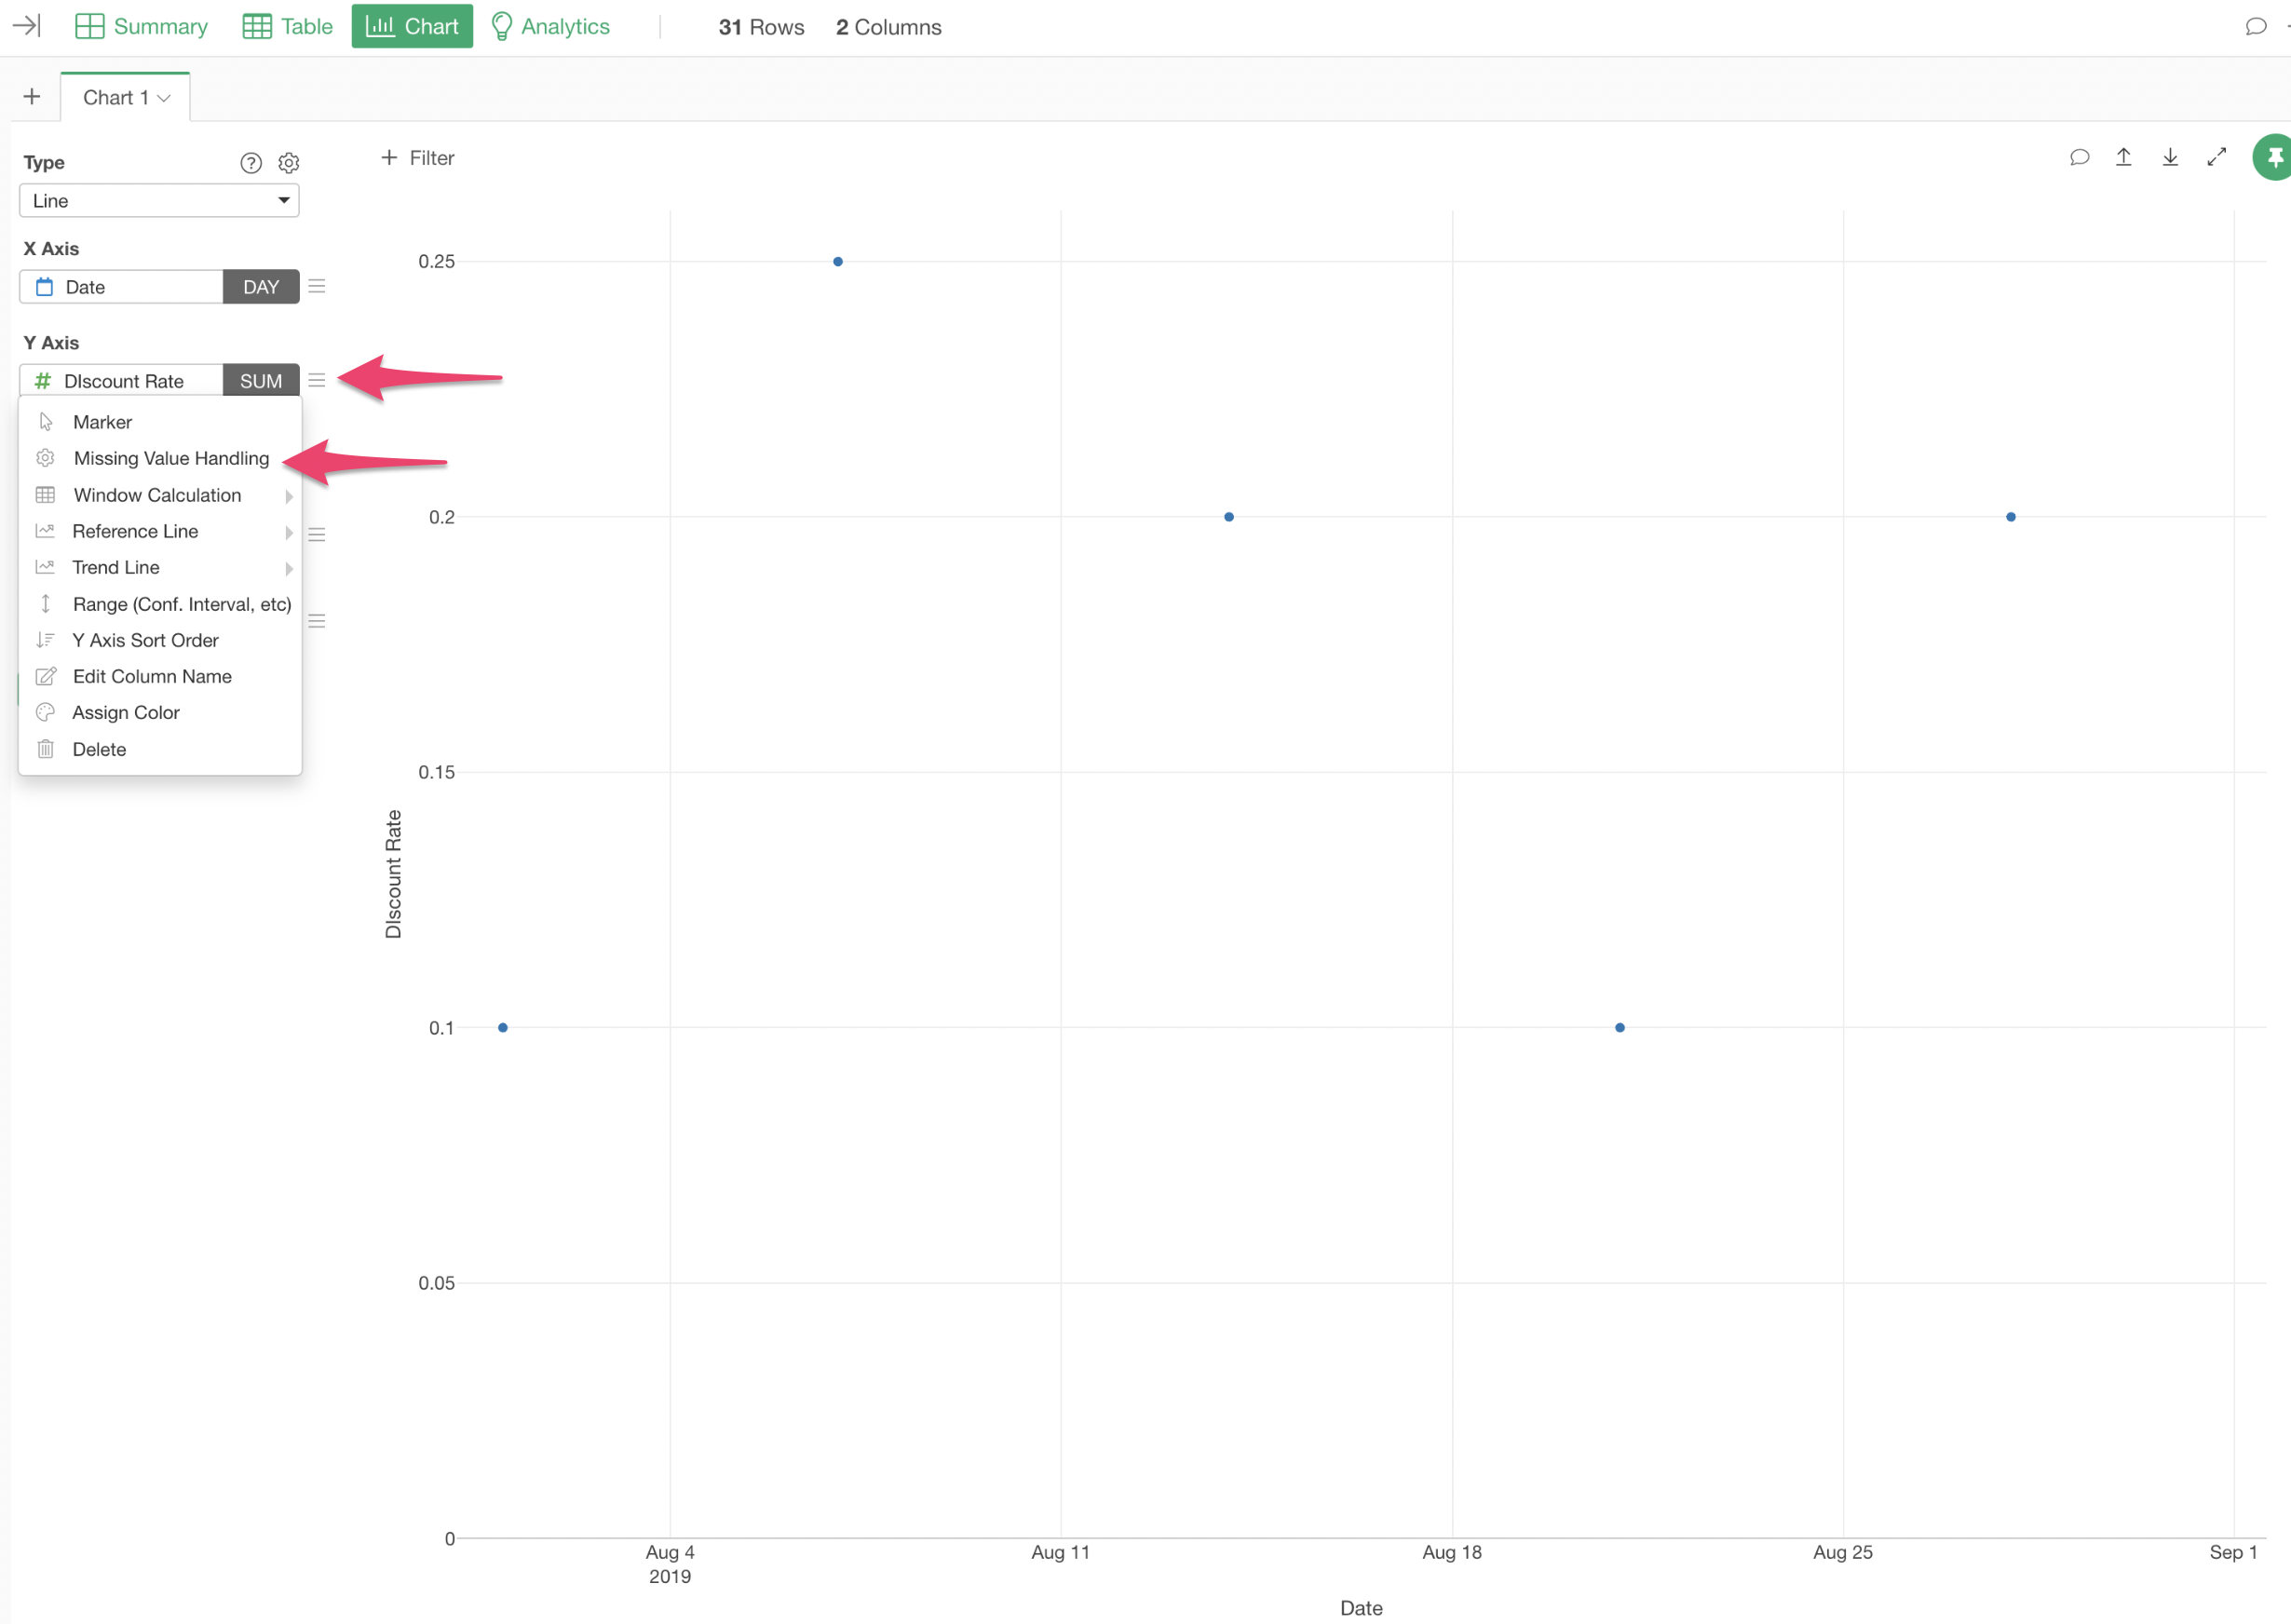
Select “Missing Value Handling” from the Y-axis menu.
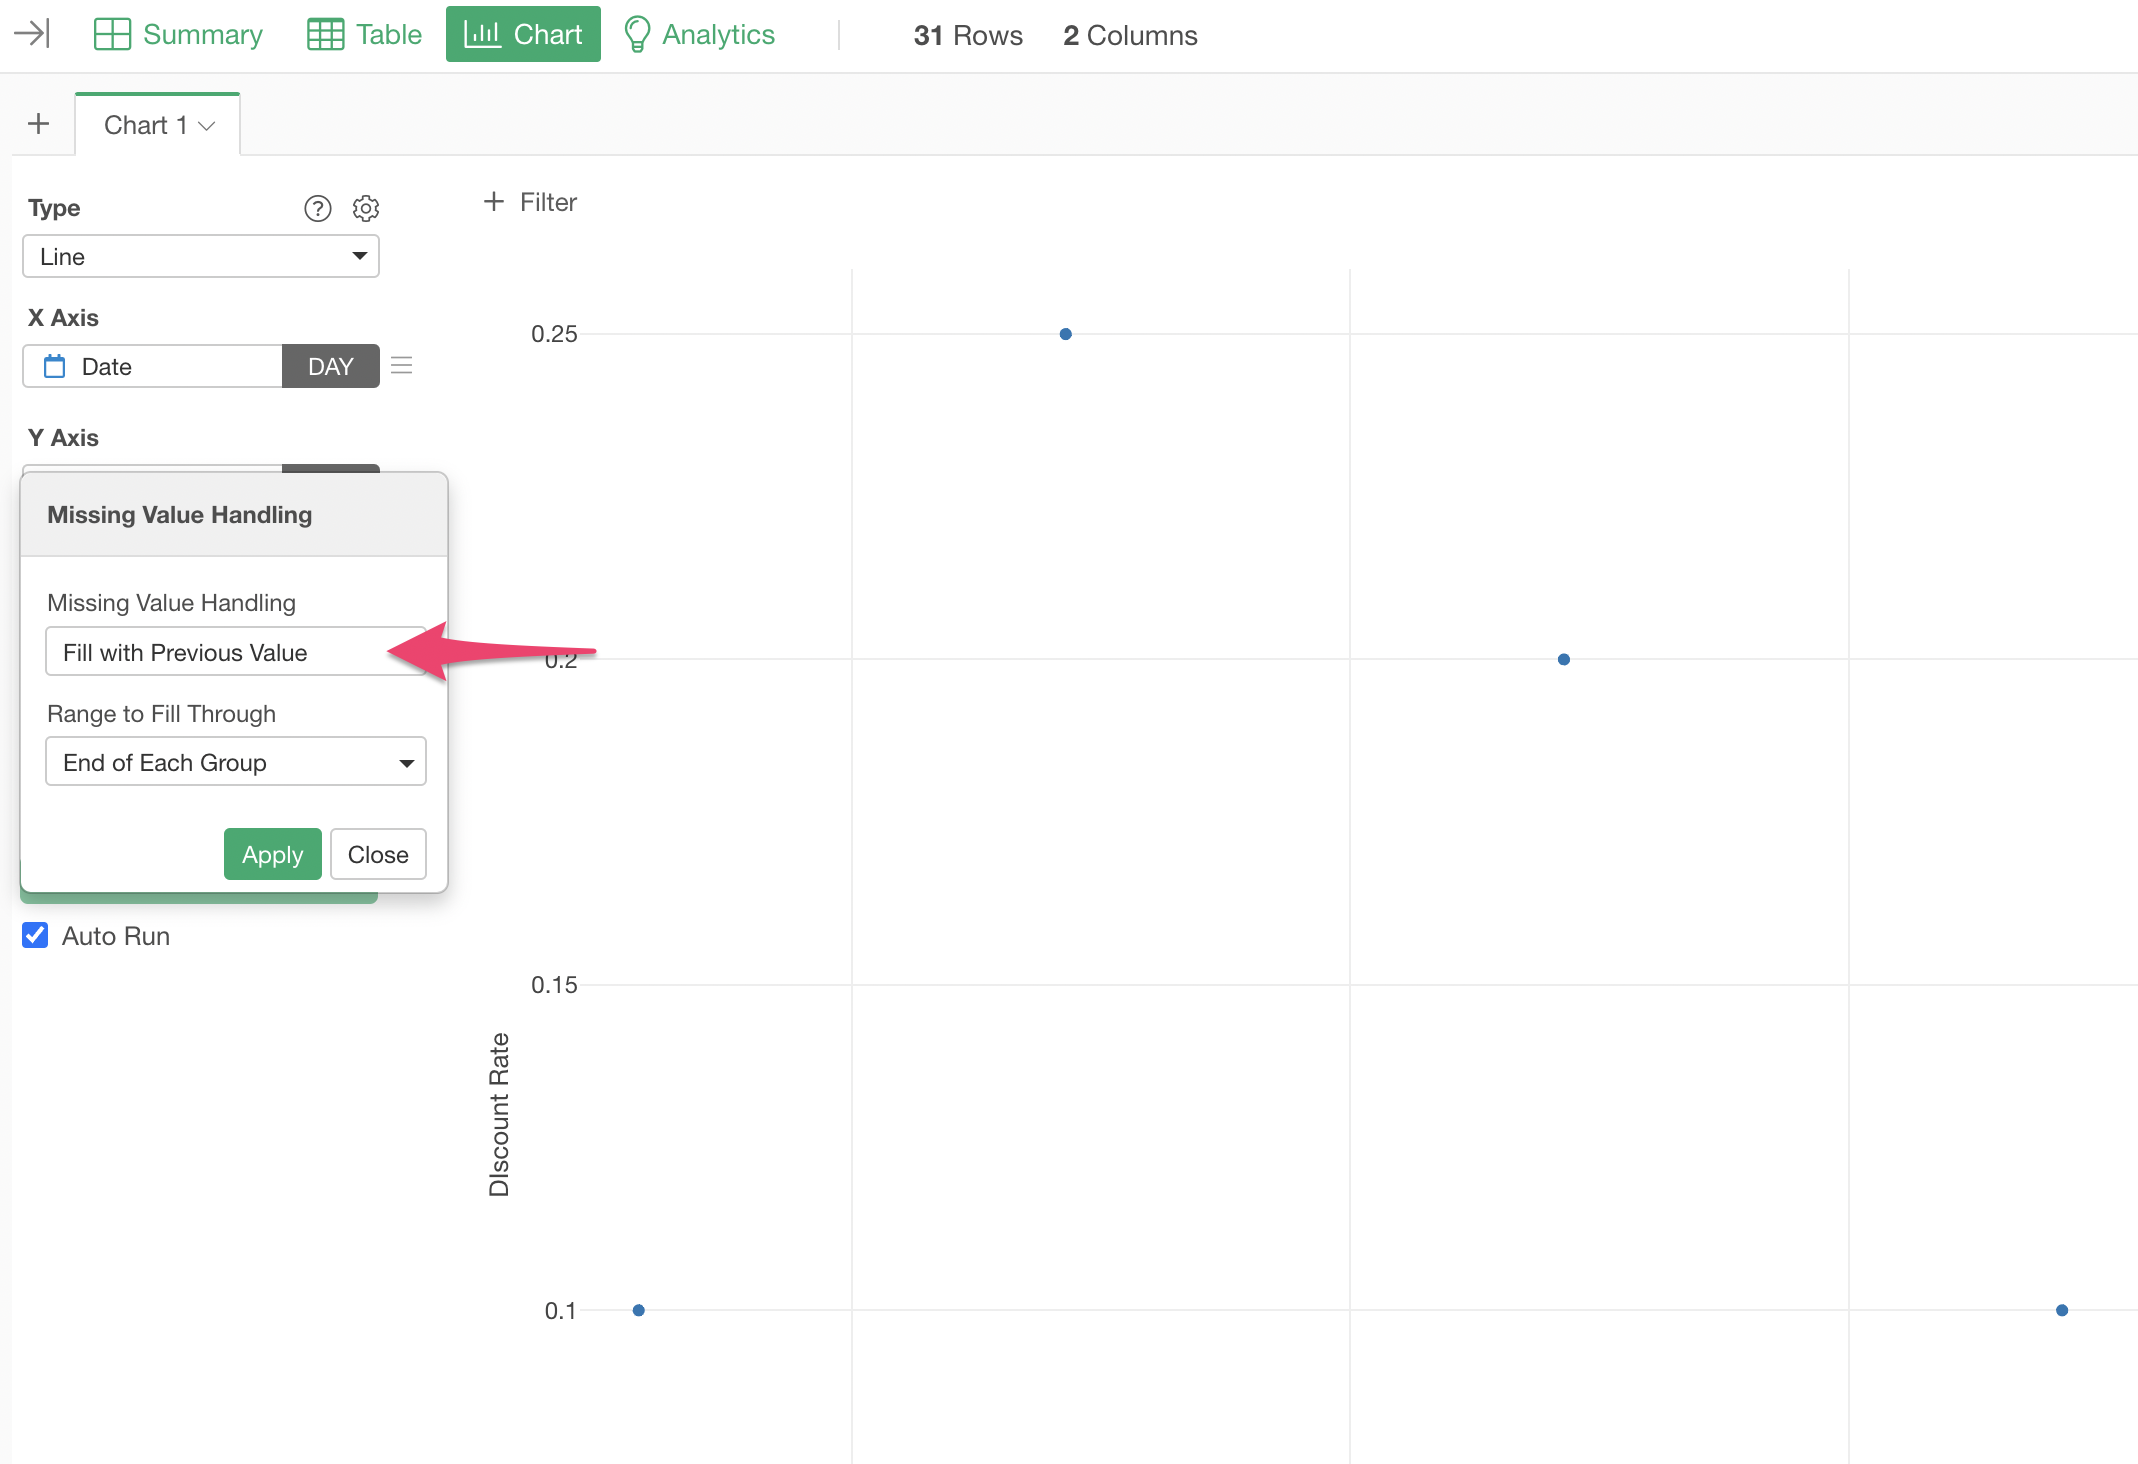
For missing value handling, select “Fill with Previous Value.”
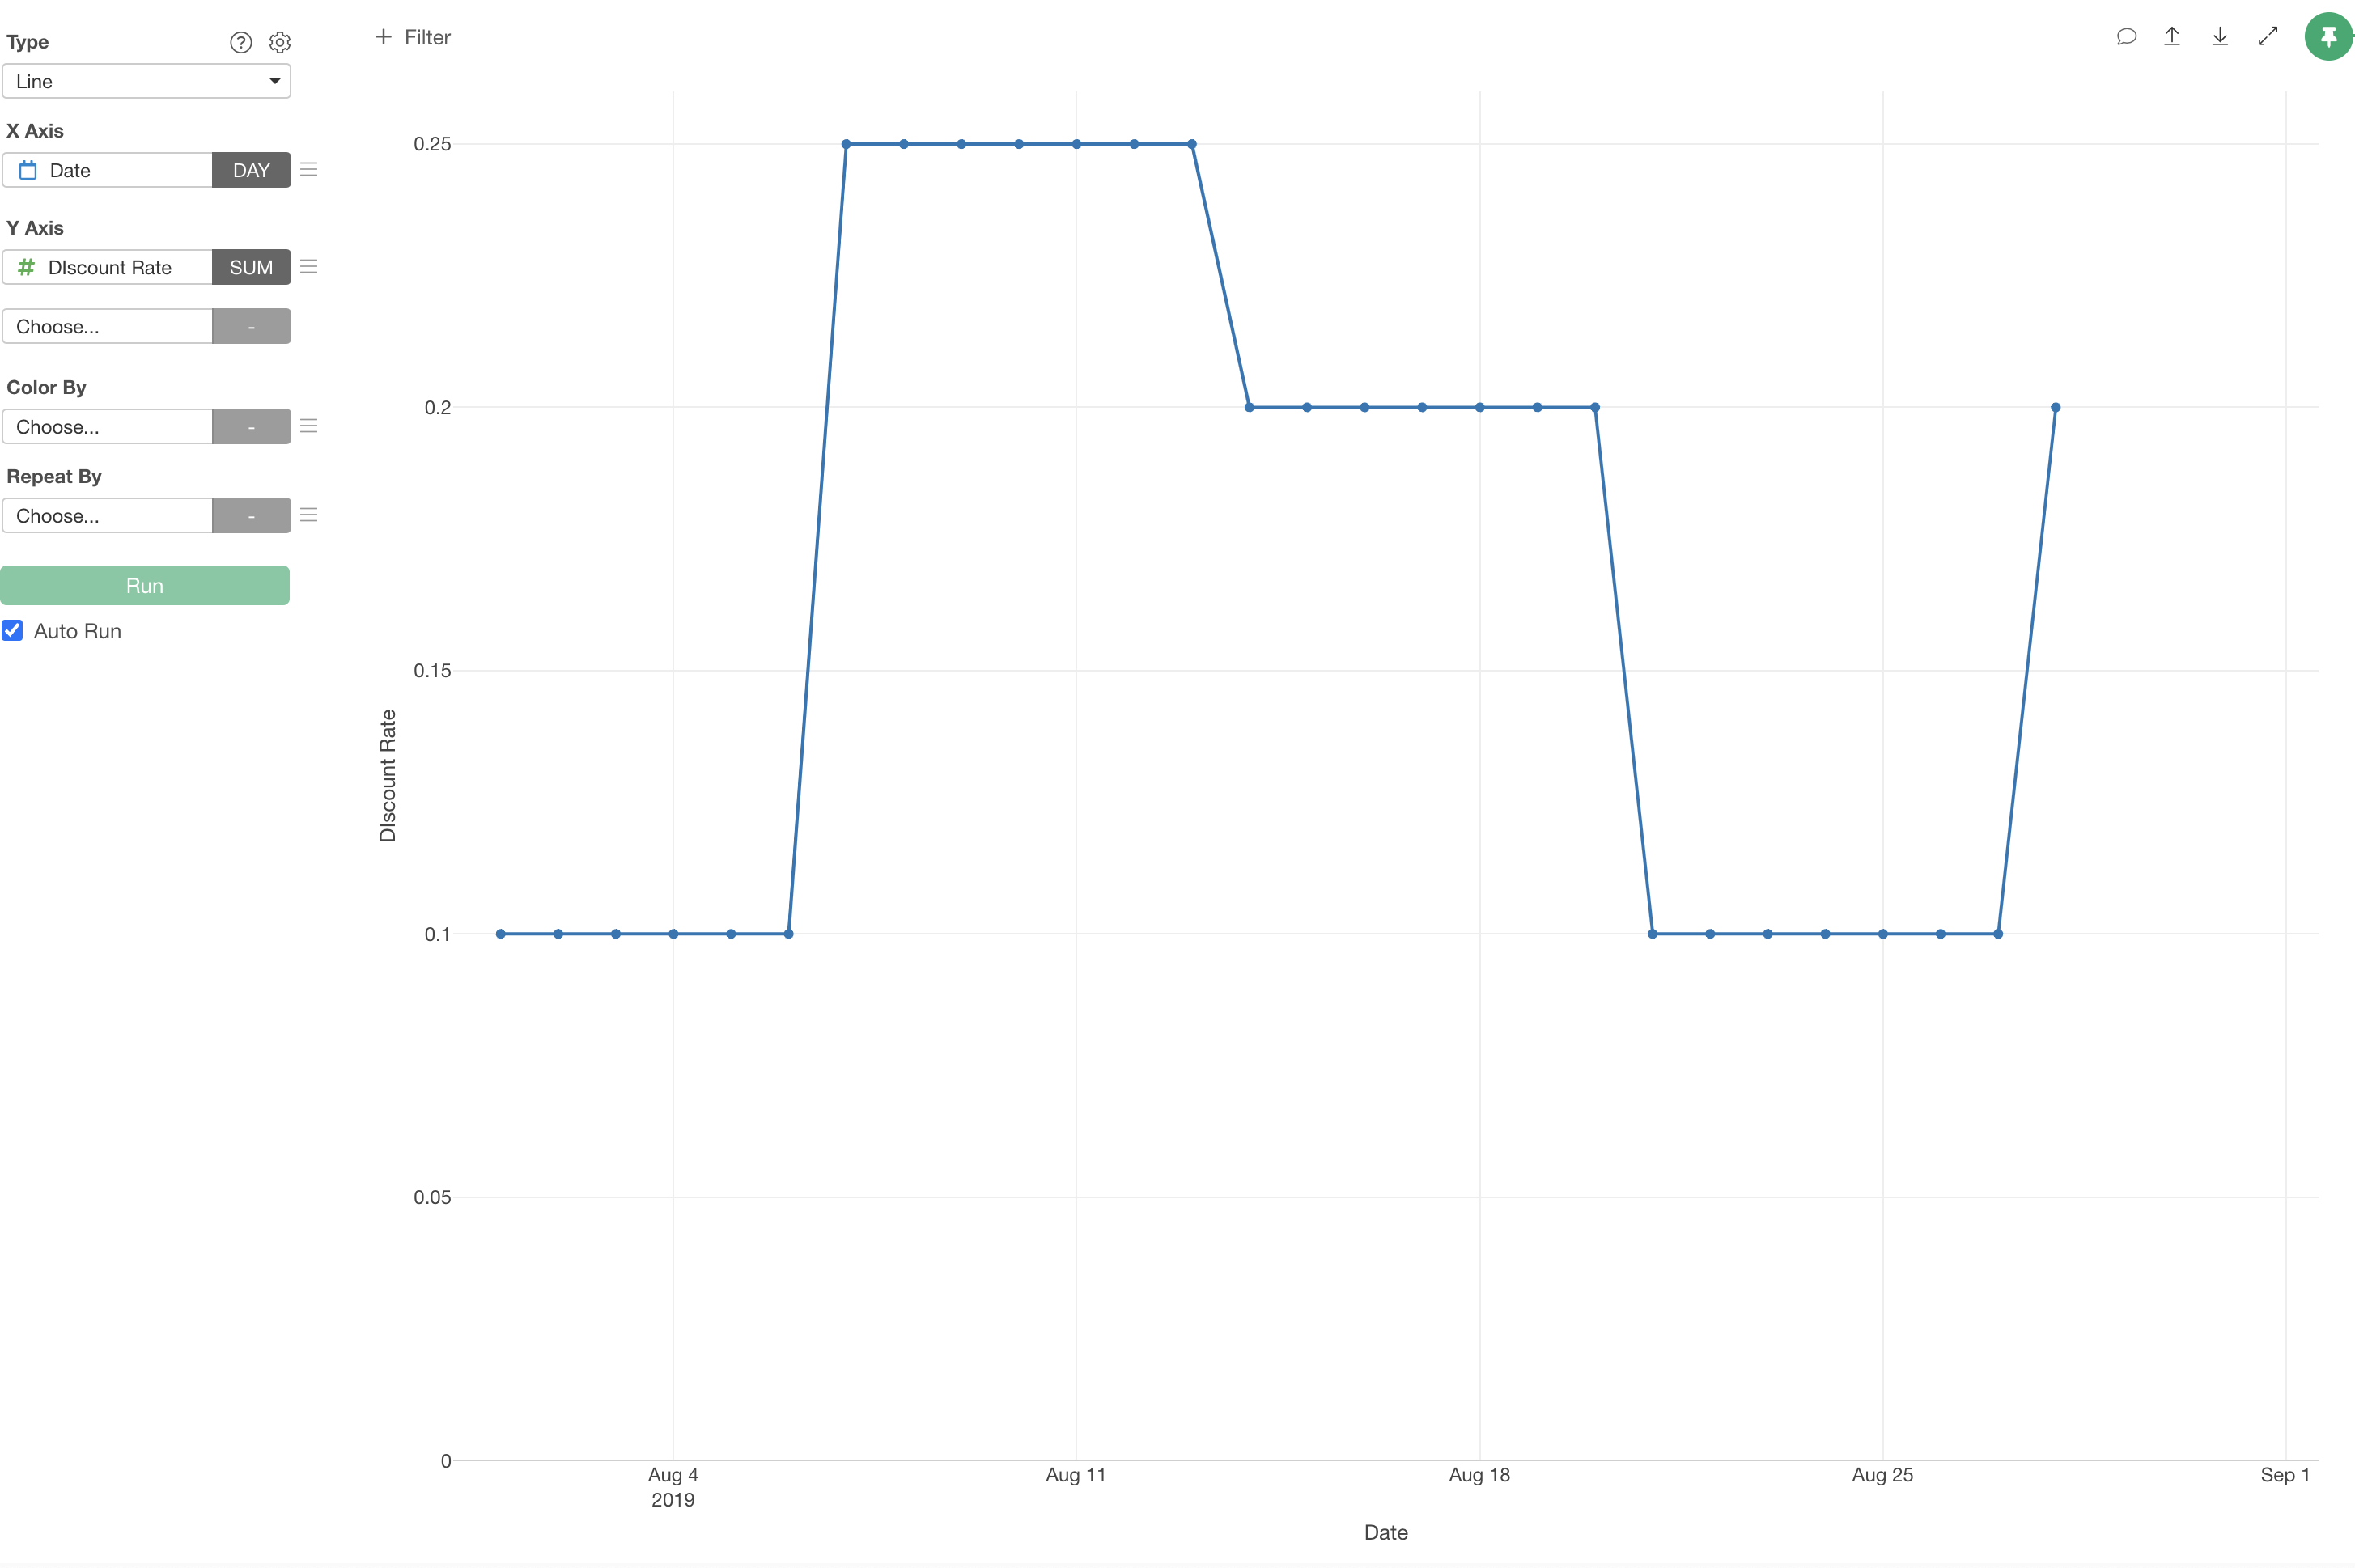
This creates a chart similar to the one we made earlier.
Replace Missing Values with Values from Another Column
Let’s say we have a service that requires membership registration, and we want to know which pages users view before signing up.
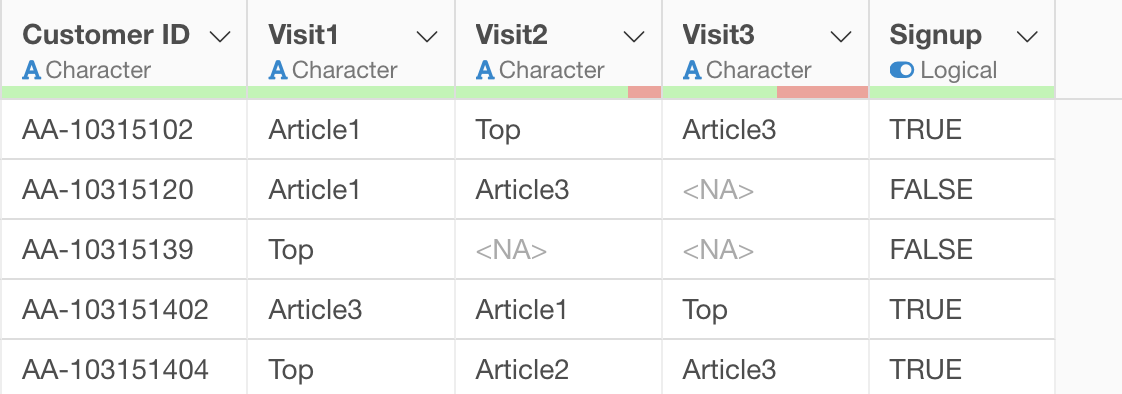
However, some users view fewer sites - some sign up immediately after viewing the TOP page, while others sign up after viewing several sites.
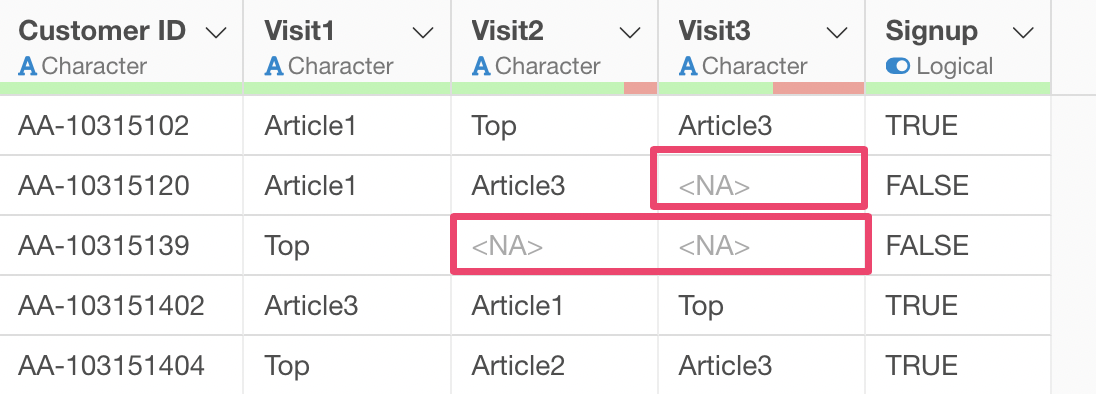
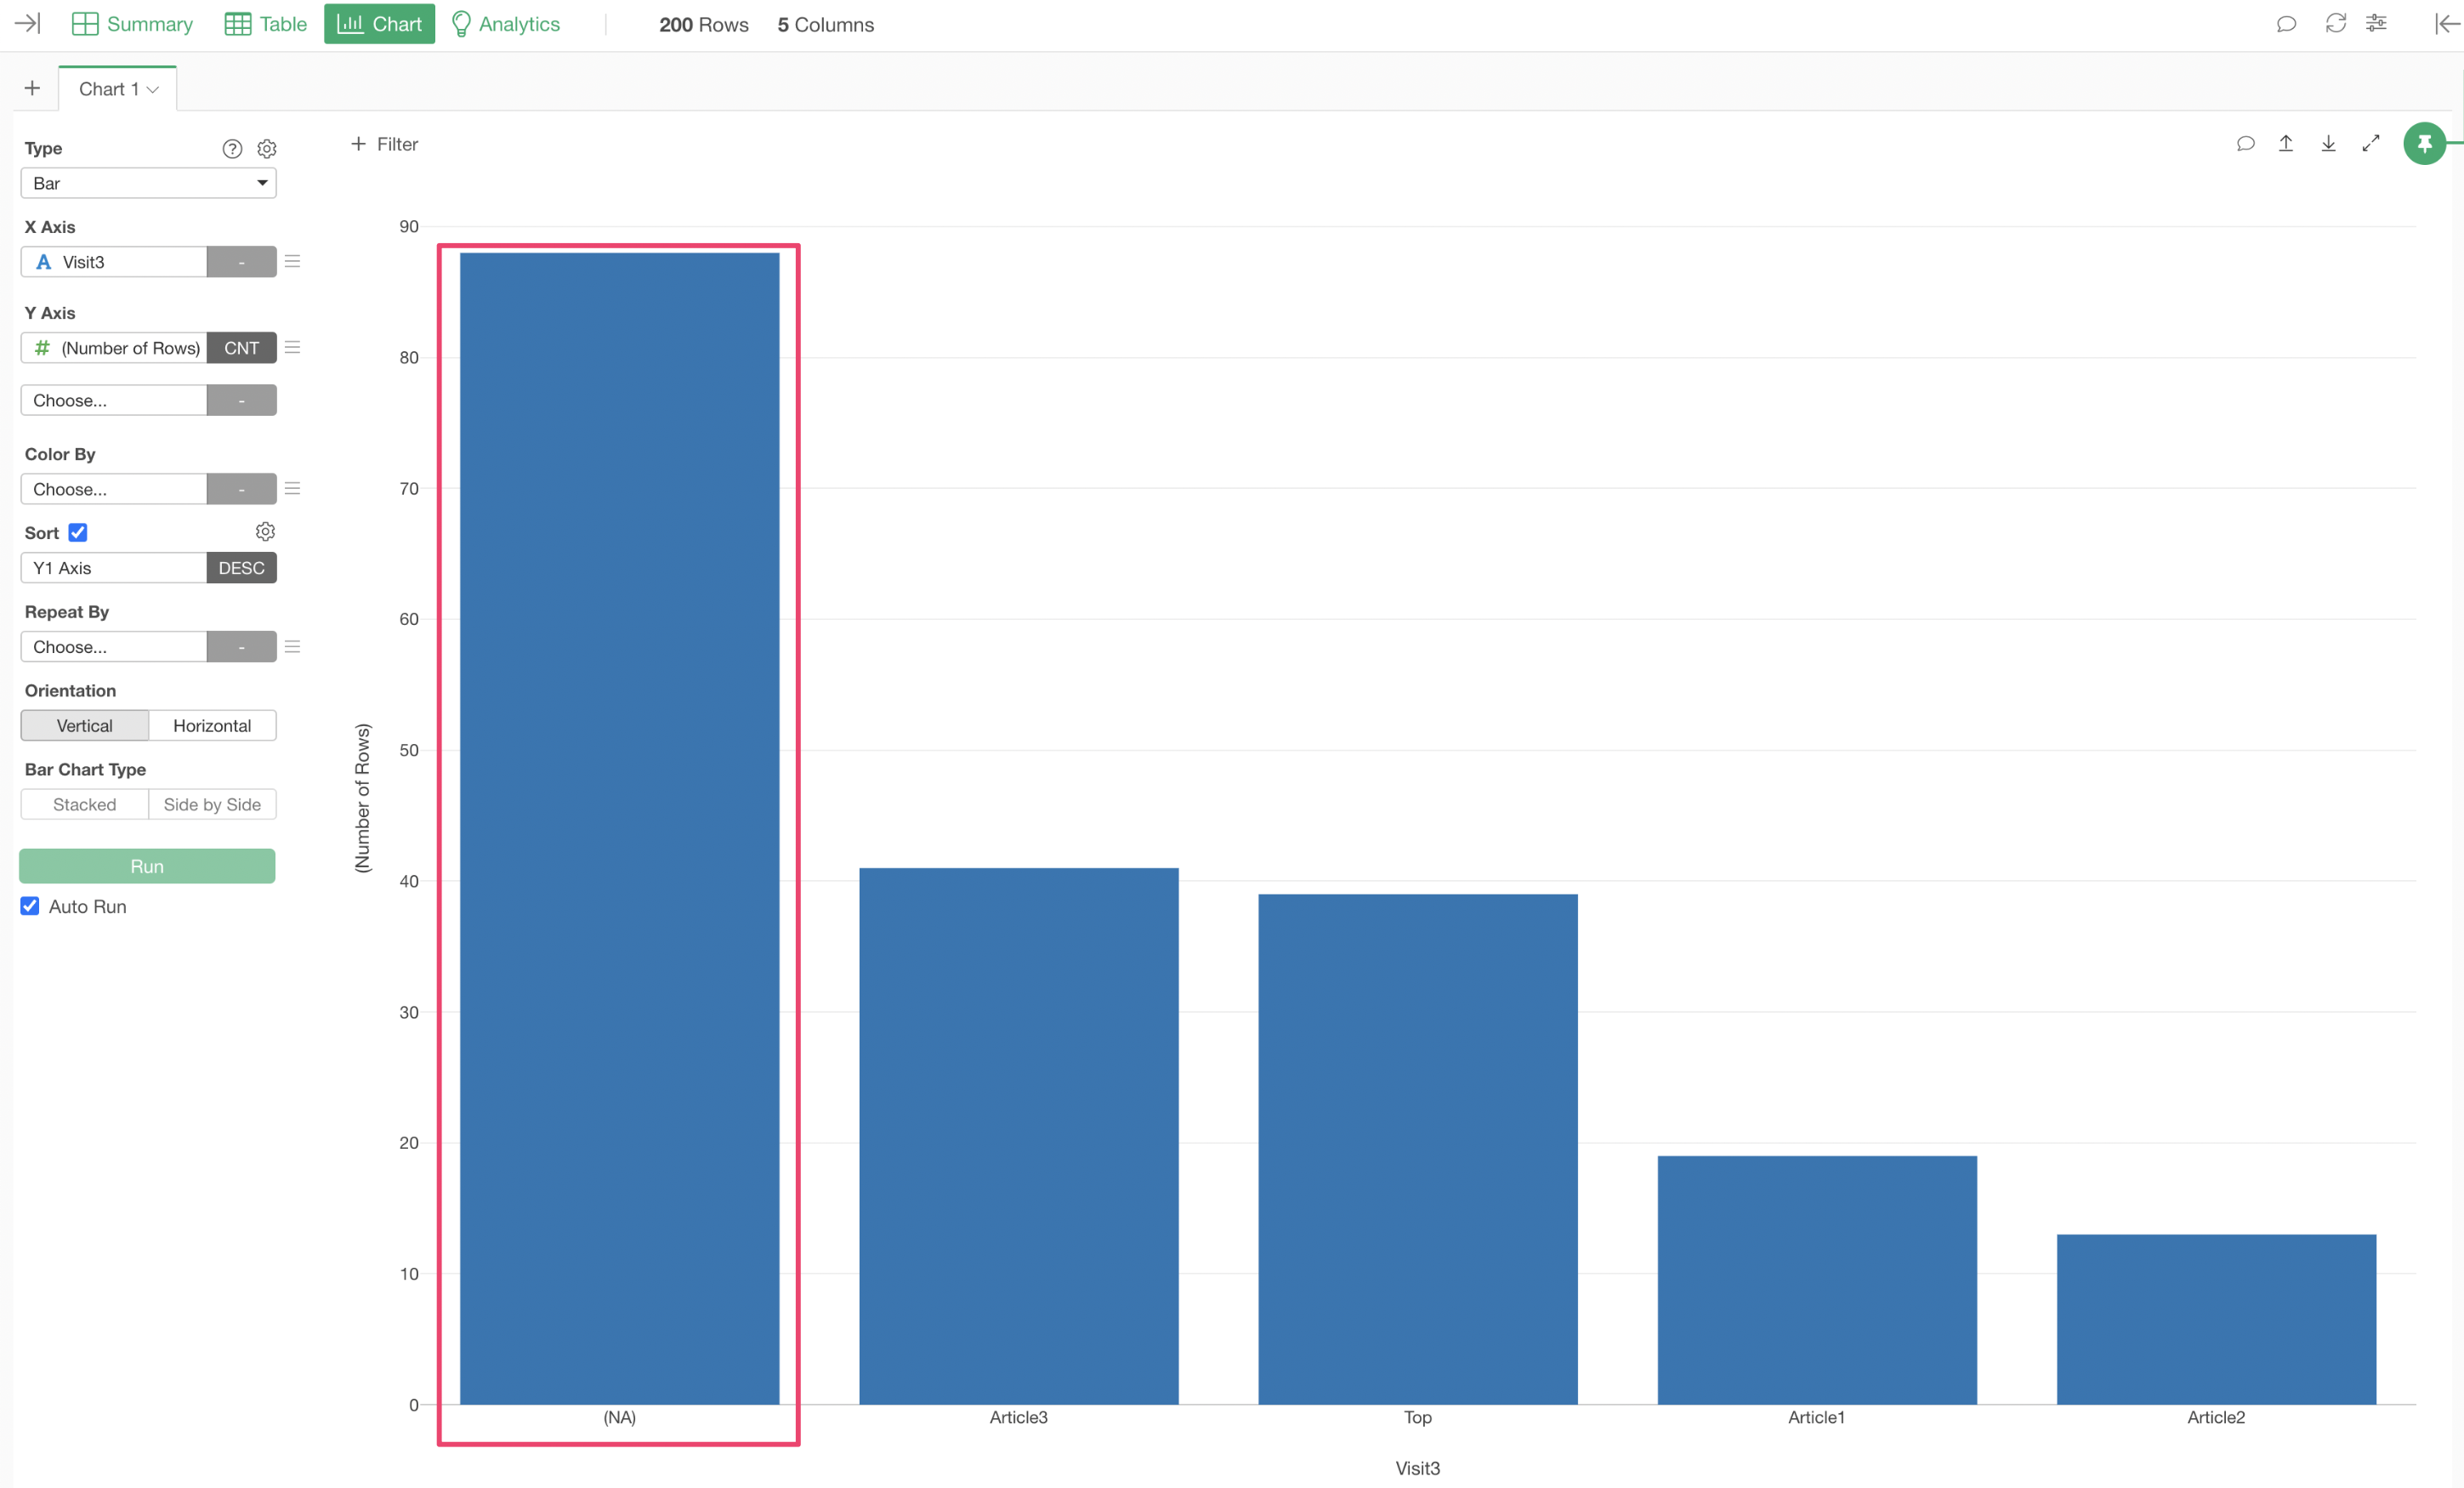
Currently, we cannot identify which pages were viewed before signup, and visualizing this in a bar chart doesn’t provide meaningful information.
To capture data about the site viewed immediately before signup, we need to fill missing values in “Visit3” with values from “Visit2”, and if “Visit2” has missing values, fill them with values from “Visit1”.
This is where “Fill Missing Values with Values from Another Column” comes in handy.
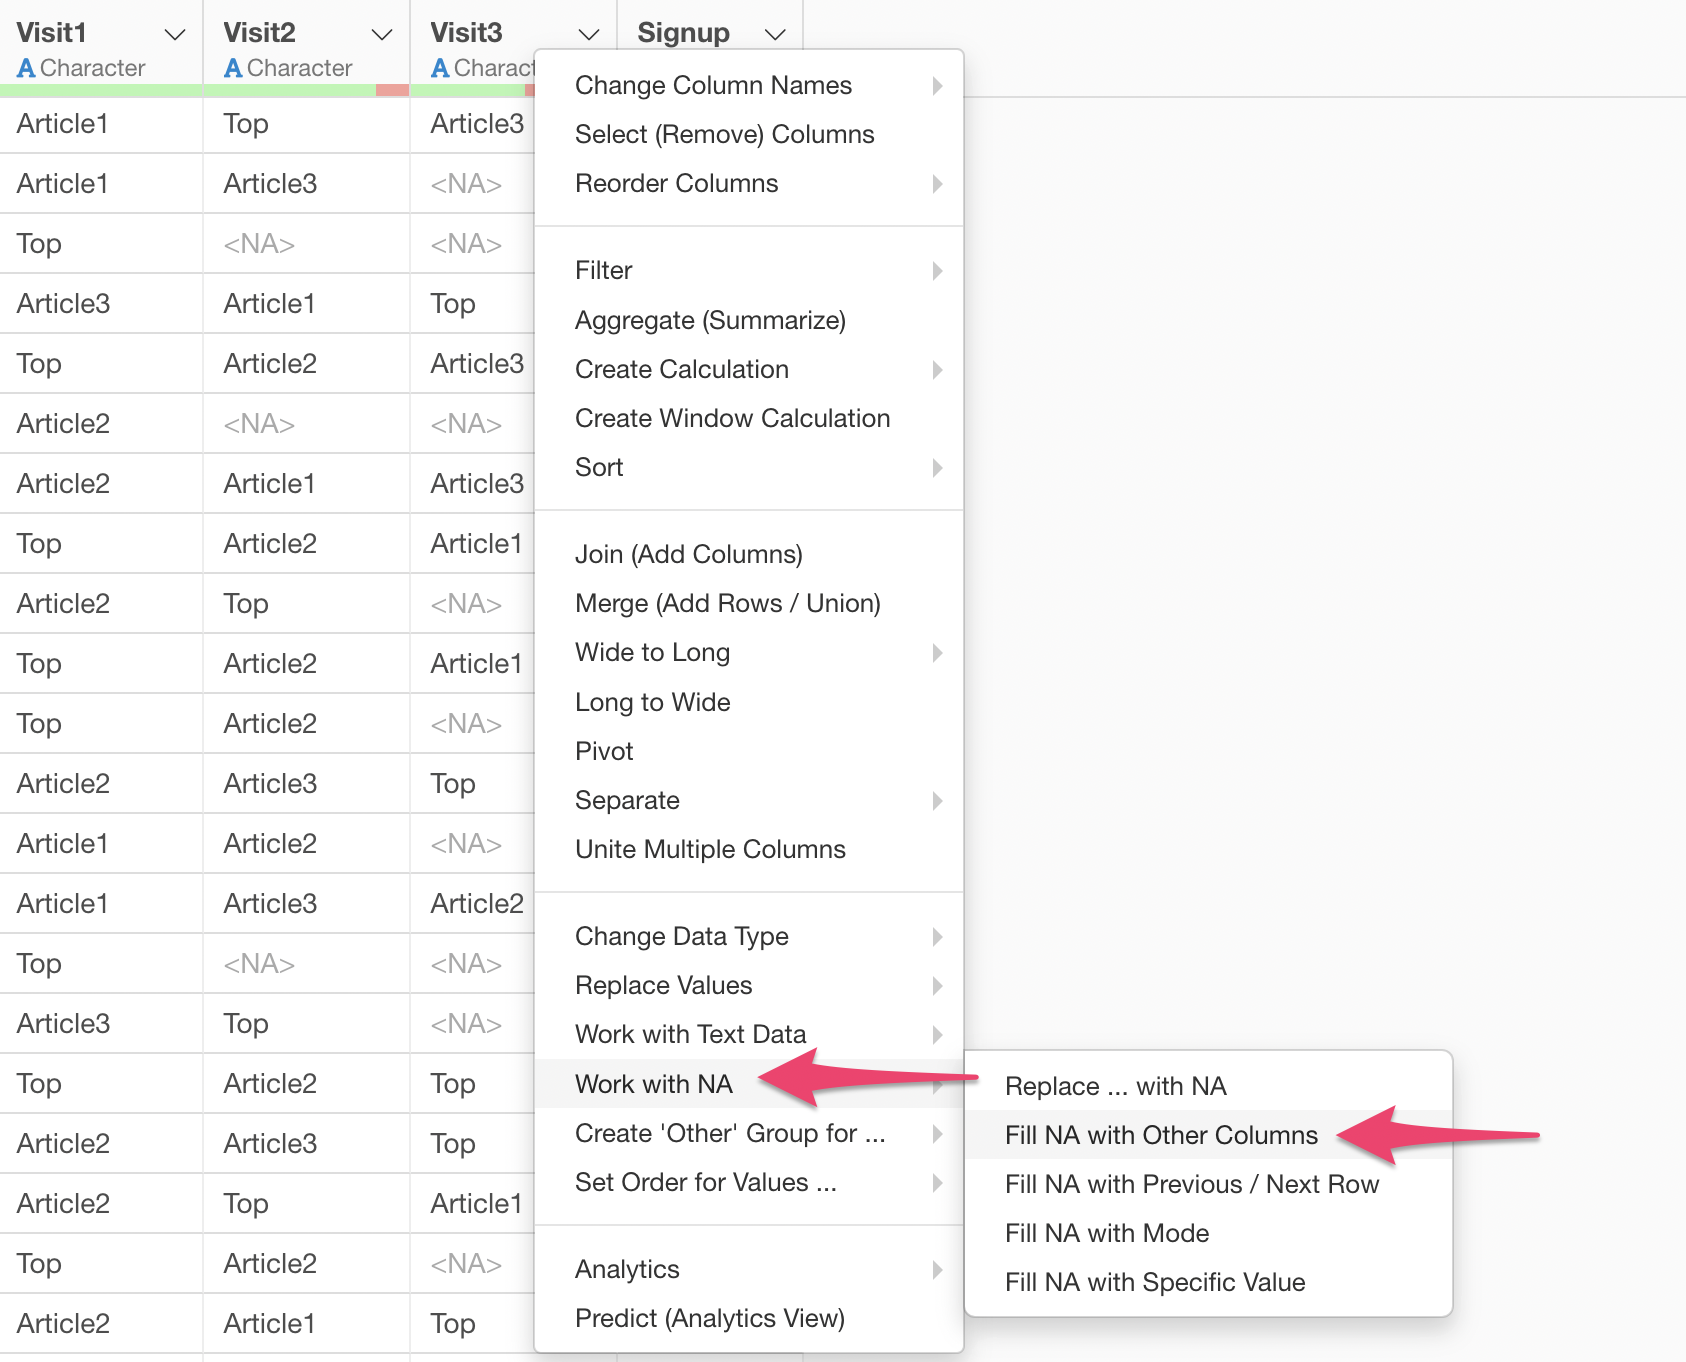
From the column header menu, select “Missing Value (NA) Operations” and then “Fill NA with Values from Another Column.”
A dialog opens with the coalesce function already in the
calculation editor.
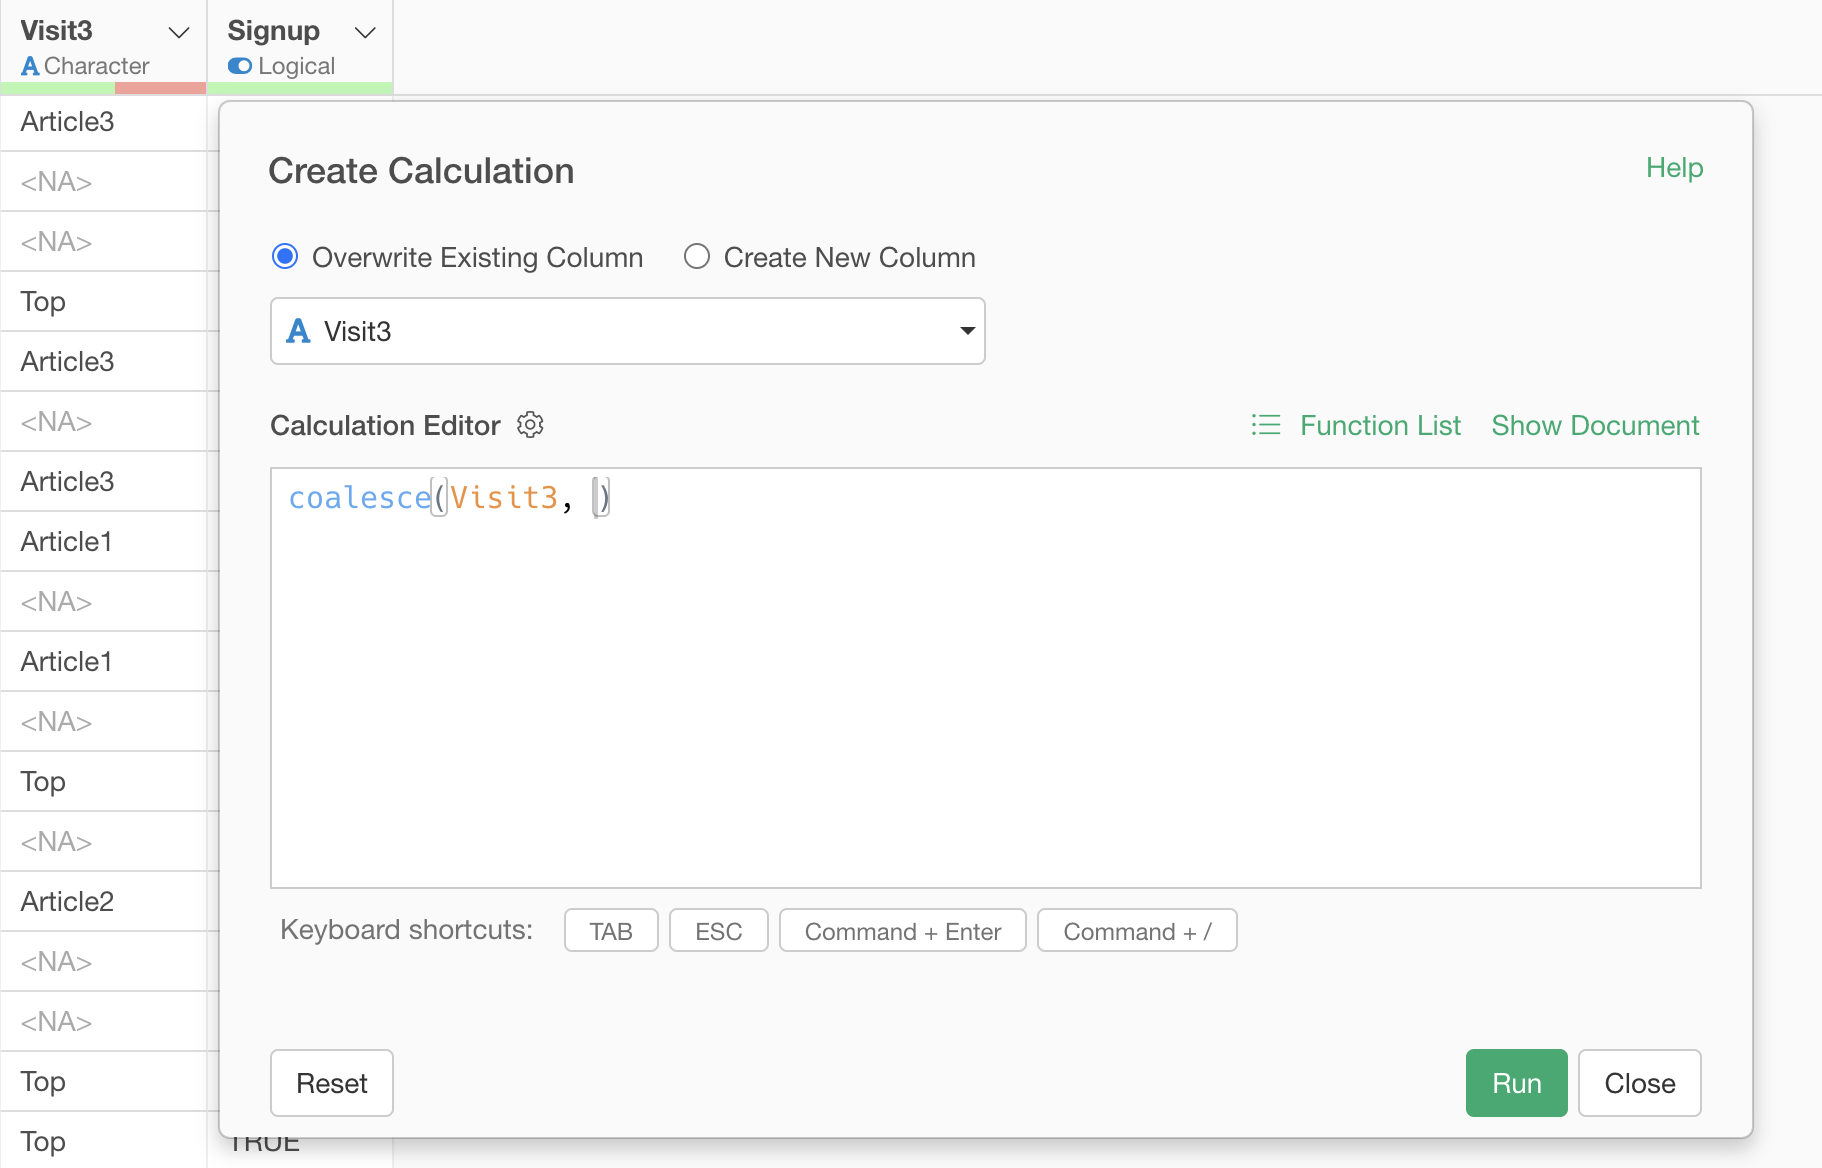
The coalesce function fills missing values (NA) with specified values when provided as arguments.
coalesce("column to process missing values", "value to fill")Furthermore, instead of specifying a direct value, you can specify a column name to fill with values from that column.
coalesce("column to process missing values", "column containing values to fill with")We’ll use this method of specifying column names.
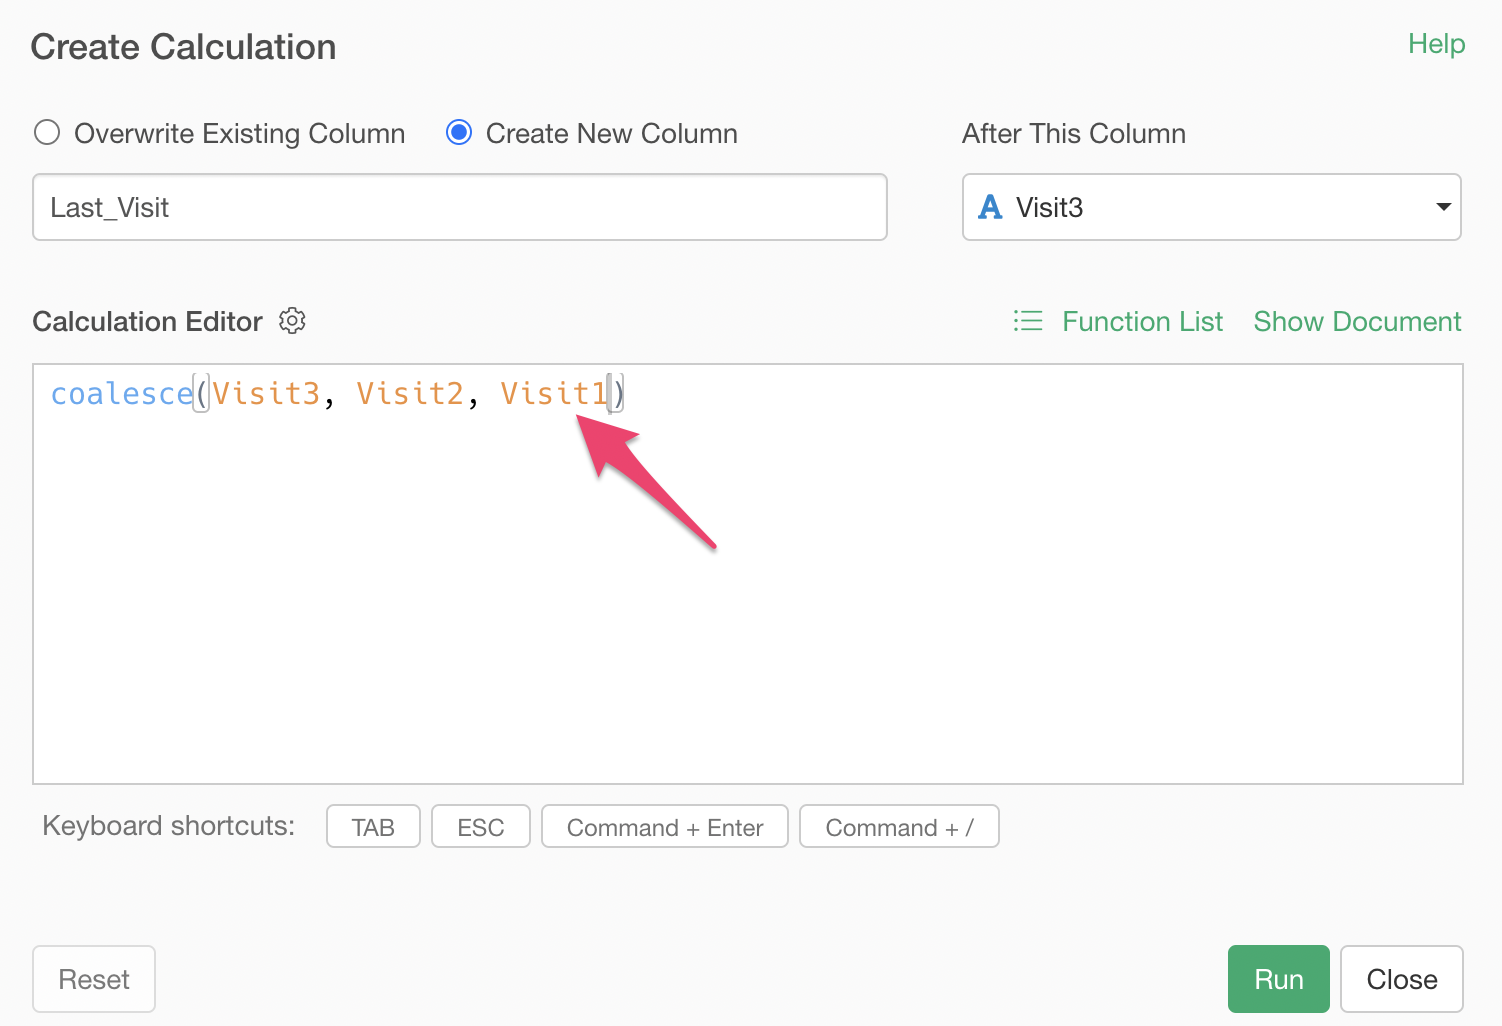
To understand how the coalesce function works, let’s specify only “Visit3” as an argument.
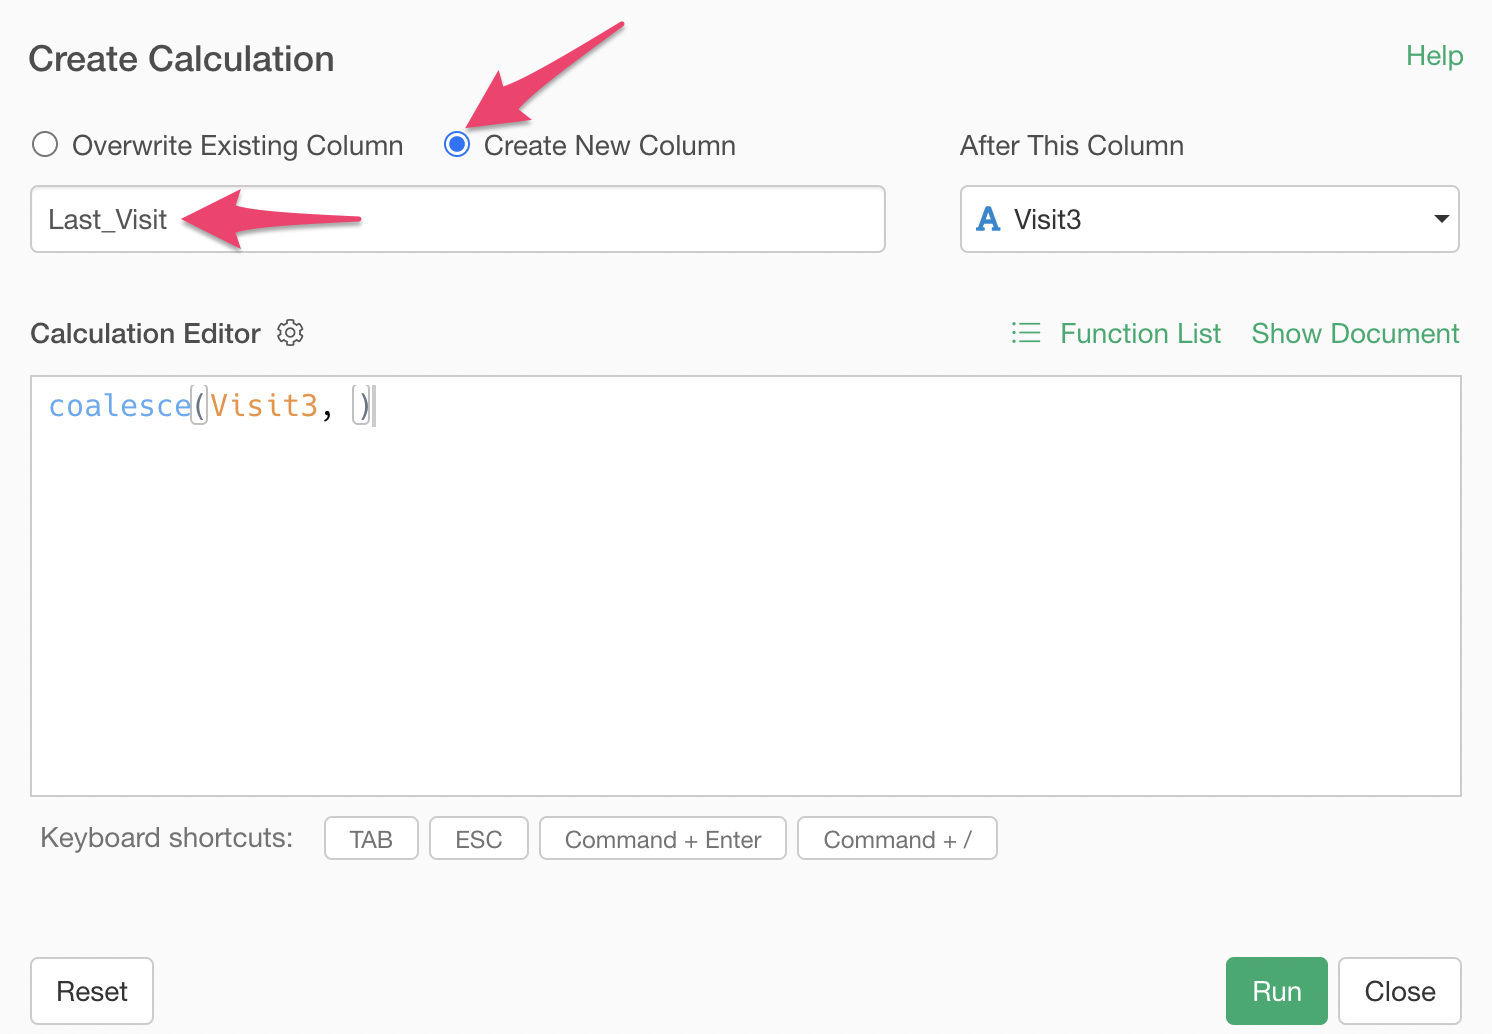
Create a new column named “Last_Visit” and execute.
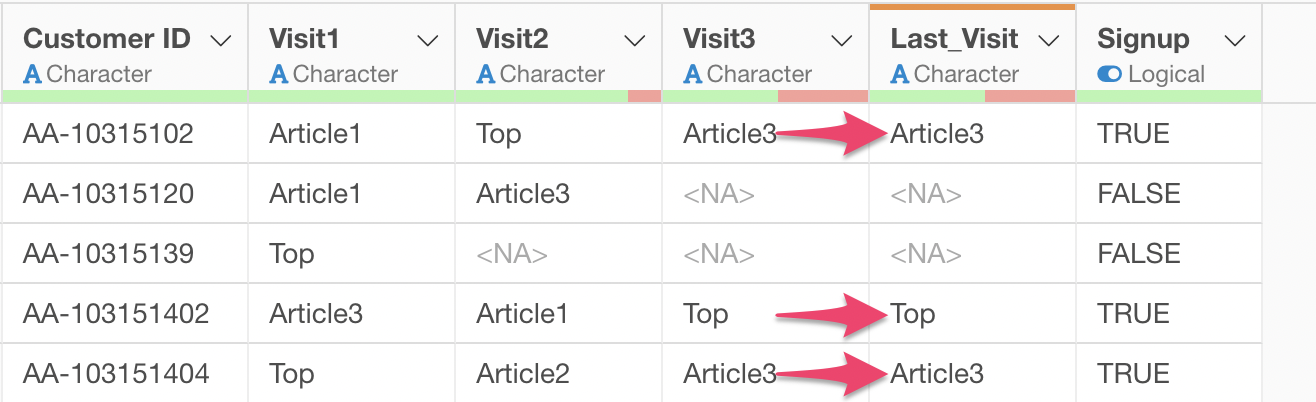
The newly created “Last Visit” column contains the values from “Visit3”. If “Visit3” has missing values, “Last Visit” will also have missing values.
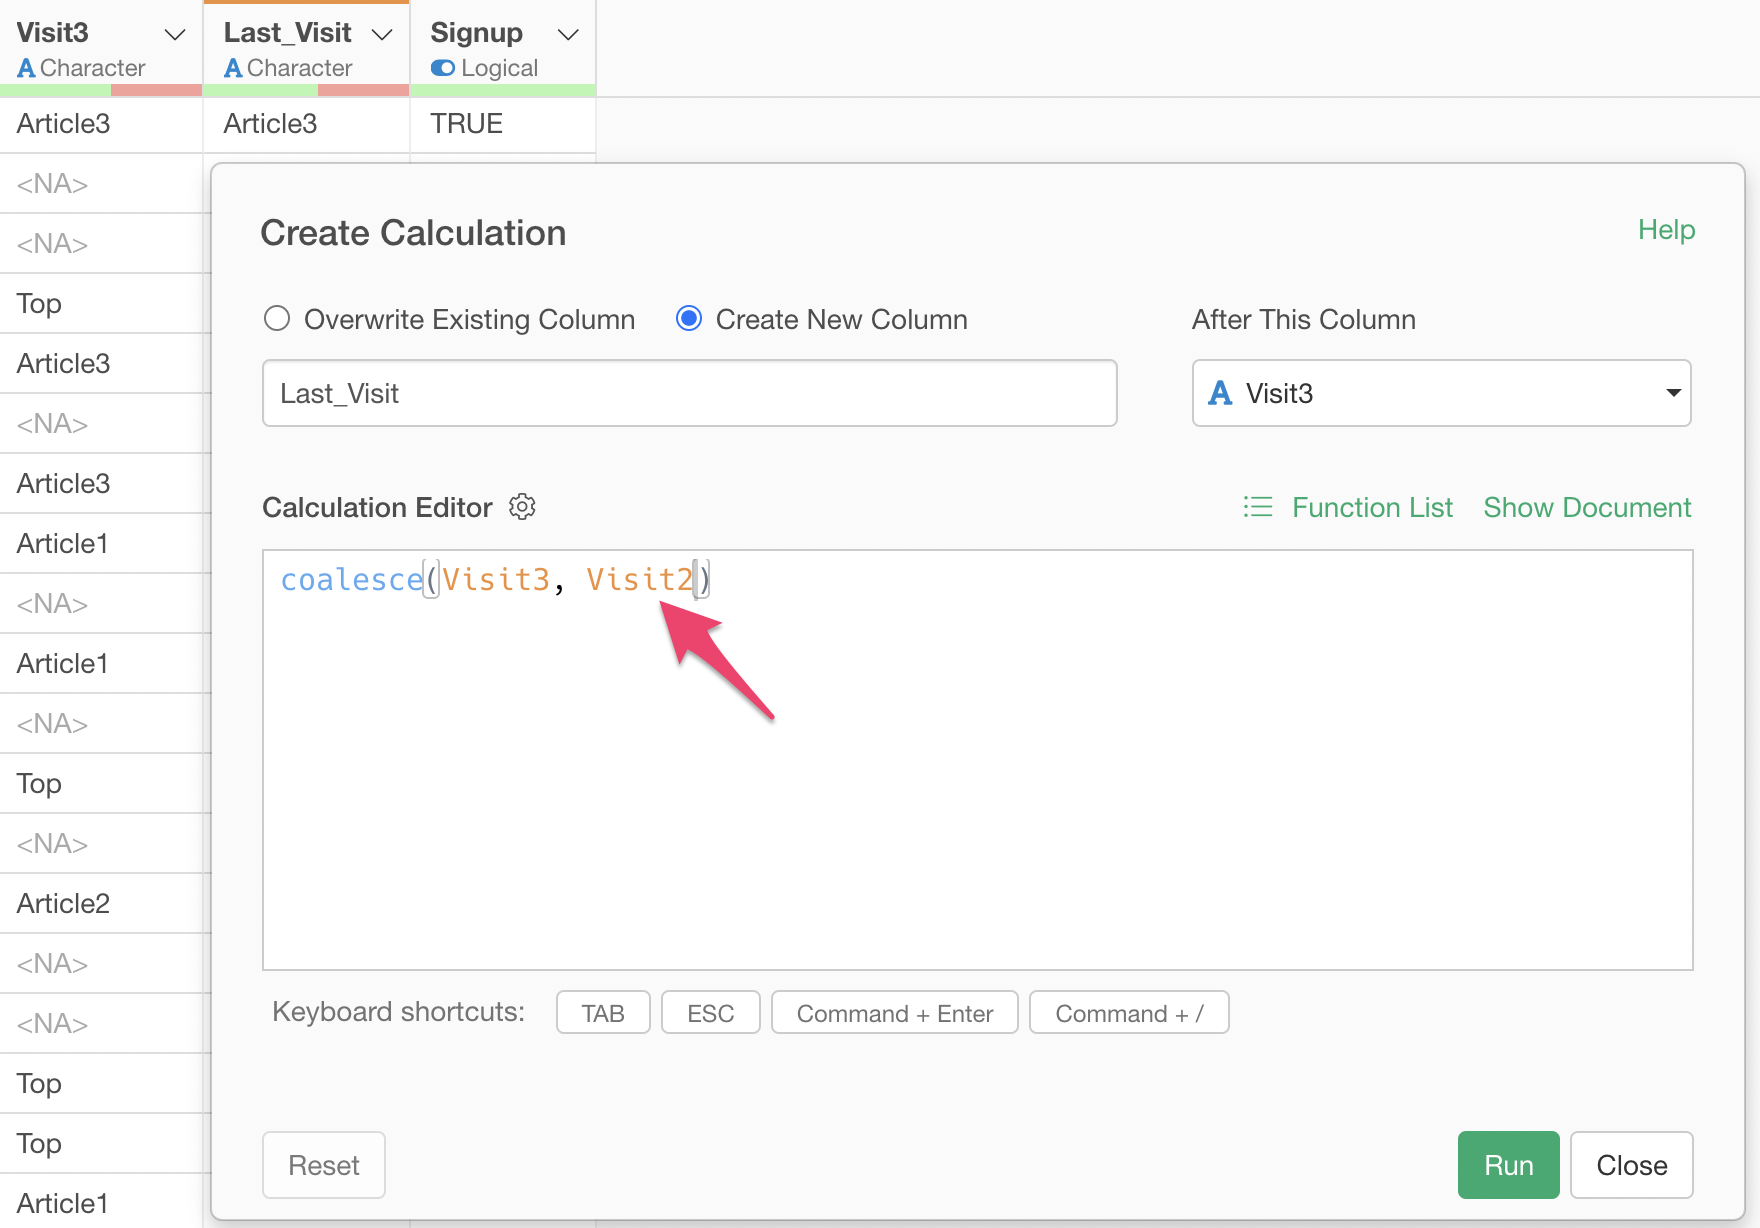
If “Visit3” has missing values, we want to fill them with values from “Visit2”, so open the previous step, enter a comma (,) followed by “Visit2”, and execute.
We’ve successfully filled missing values in “Visit3” with values from “Visit2”.
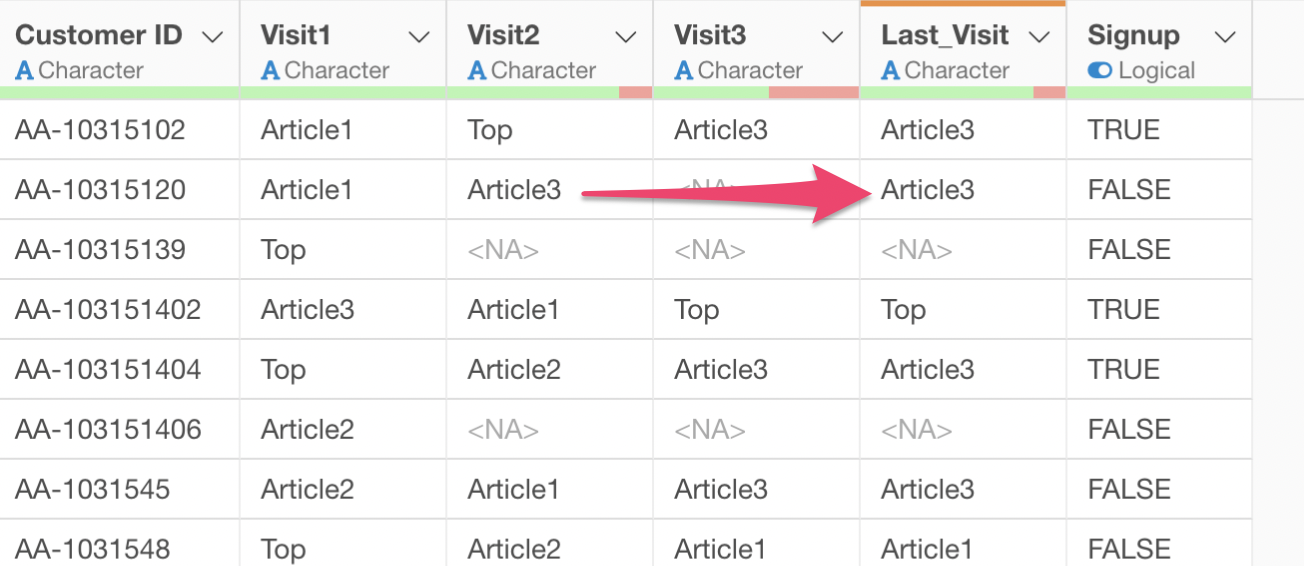
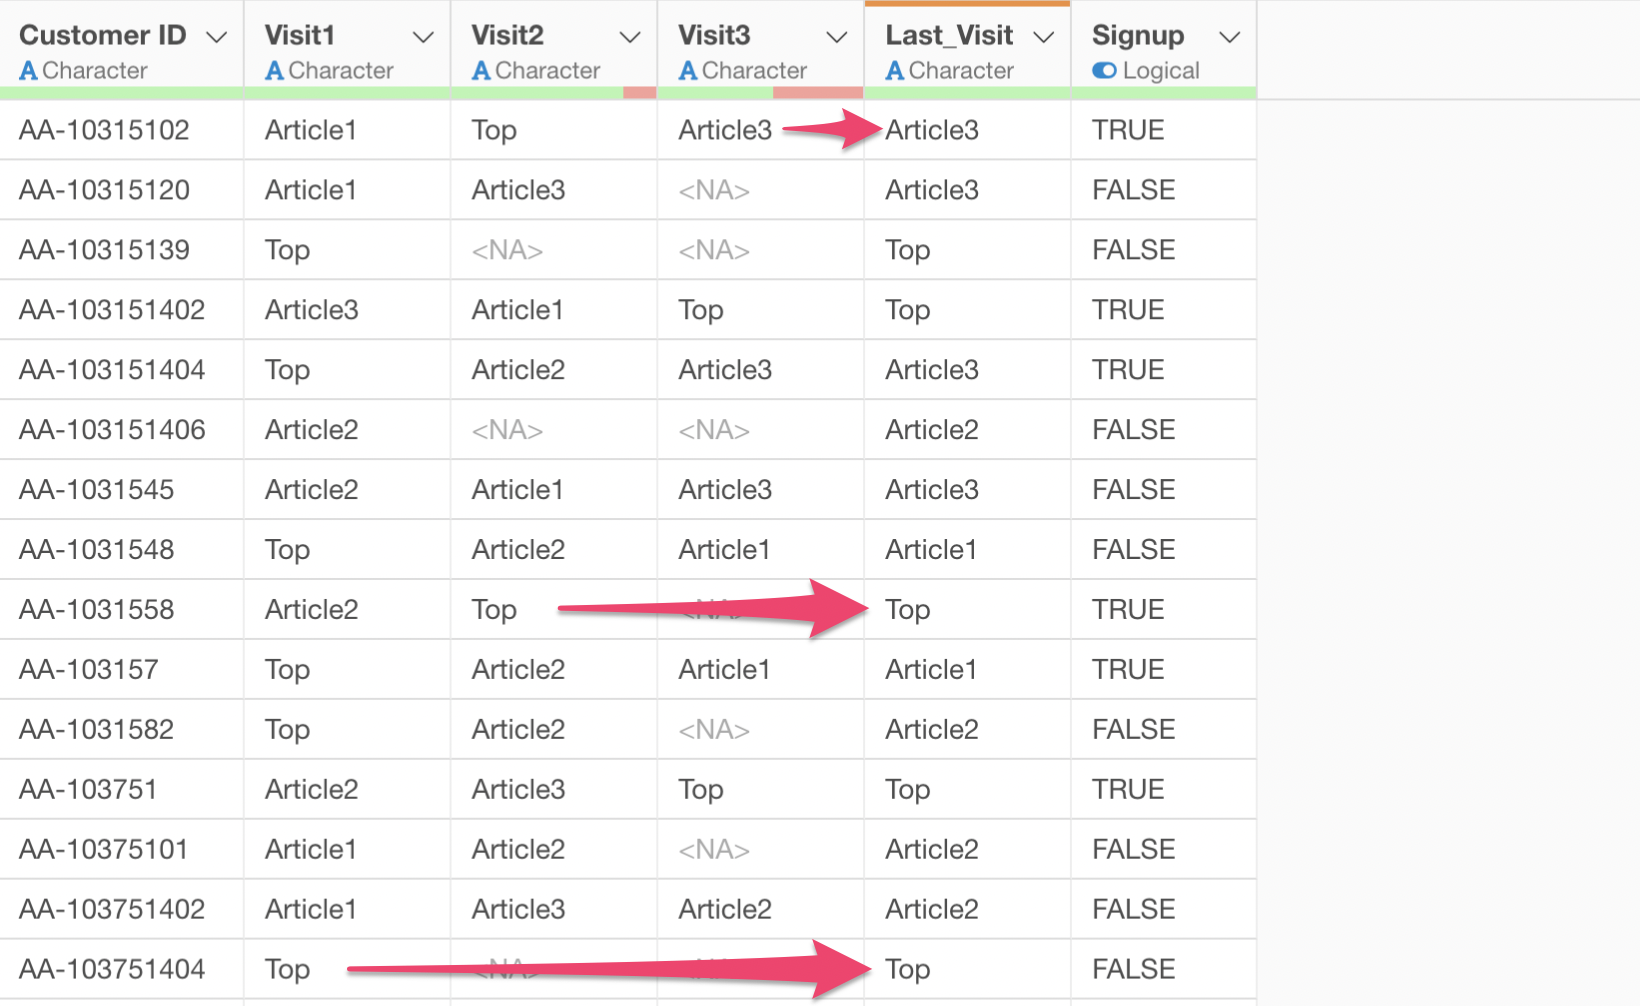
Next, similar to before, to fill missing values in “Visit2” with values from “Visit1”, enter a comma (,) followed by “Visit1” in the calculation editor and execute.
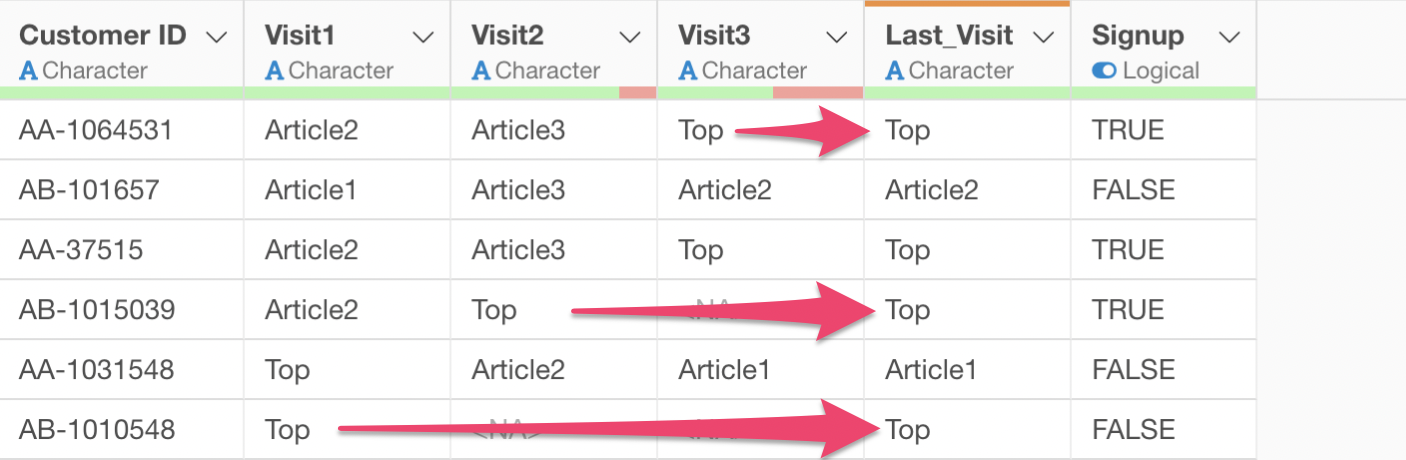
Looking at the table view, we’ve successfully filled missing values with values from another column - specifically, the site visited previously - allowing us to create data about the pages viewed before signup.
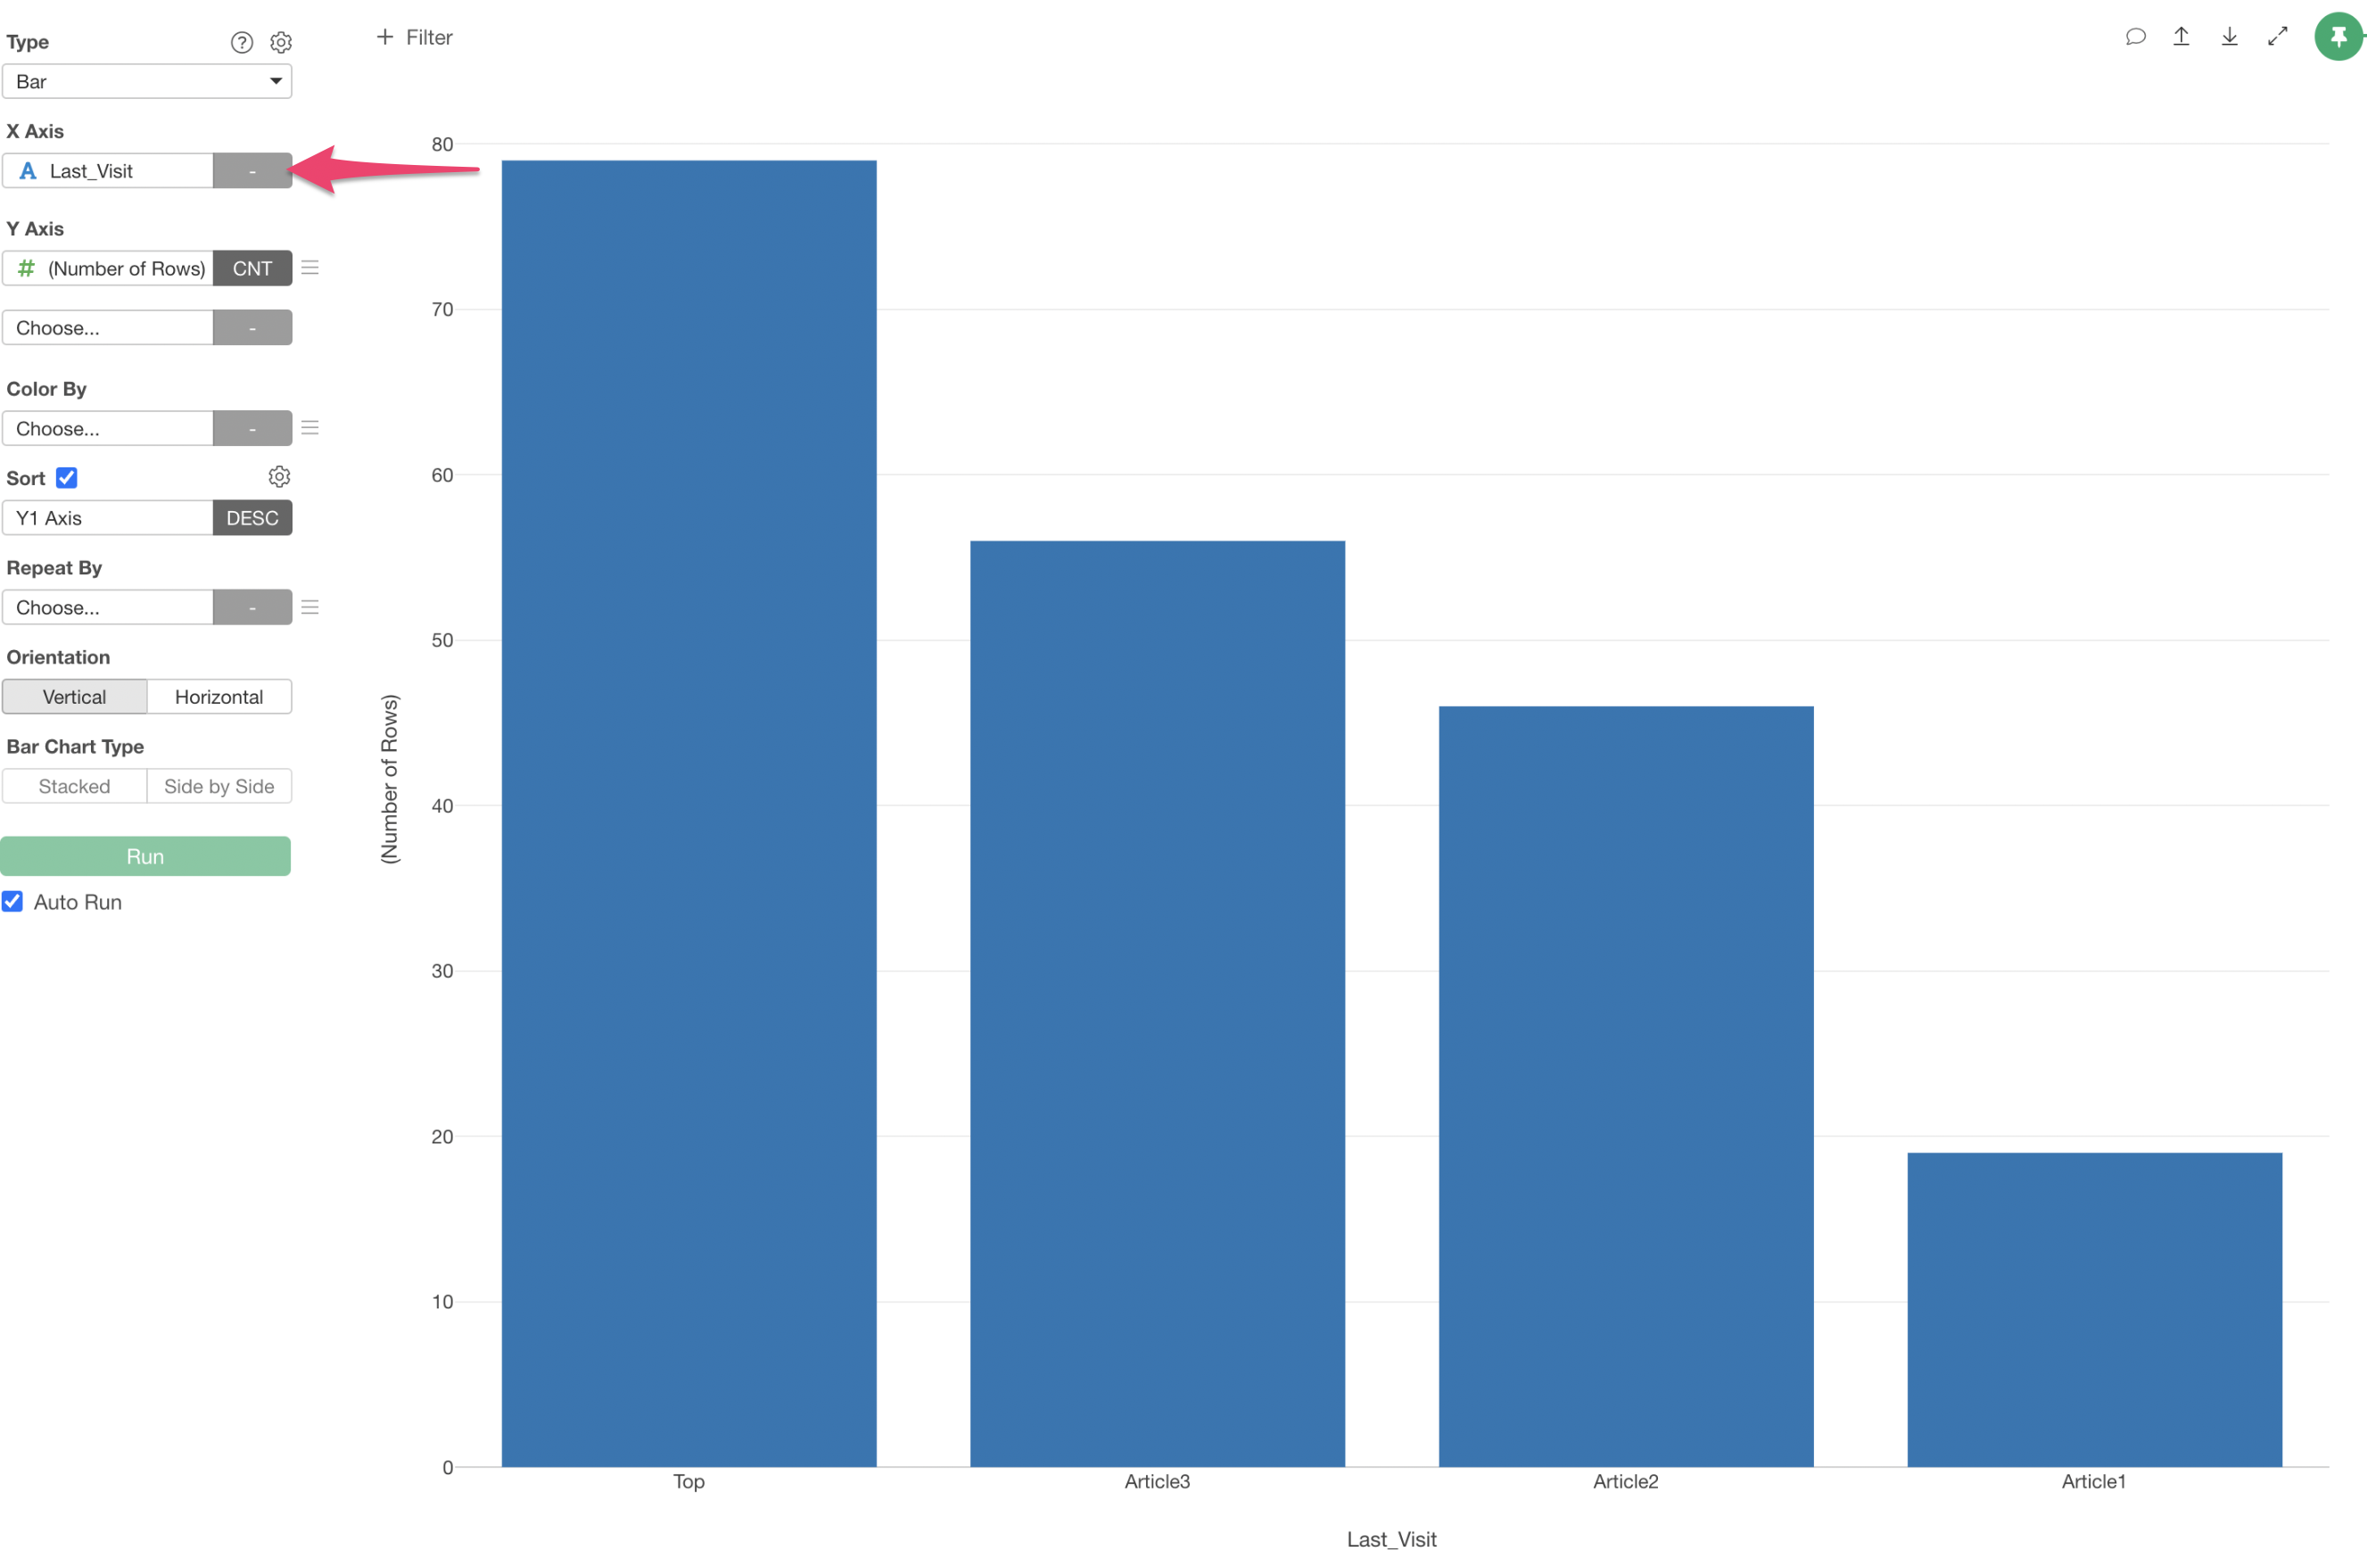
When we visualize this by selecting the created “Last Visit” for the X-axis in a bar chart, we can see that the Top page is the most common site viewed immediately before signup.