How to Fix Common Exploratory Server Problems
How to Locate Log Files
While looking into problems, we might ask you to send log files, especially the one from Scheduler when looking into scheduling issue. Here is how to locate log files.
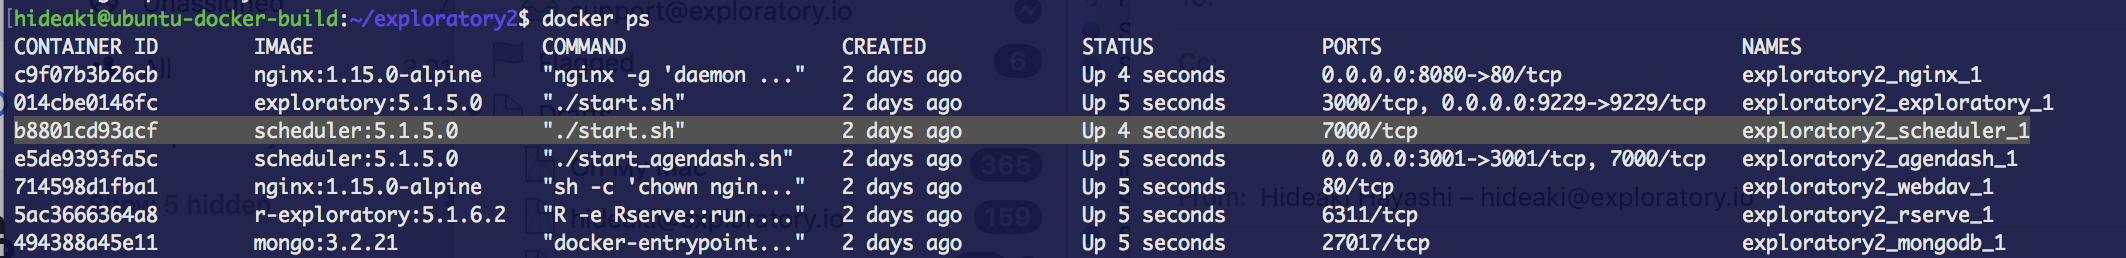
- Identify container IDs. Run
docker ps. and find container ID of scheduler, with IMAGE name that starts with “scheduler” and COMMAND “./start.sh”. In the case of following screenshot, b8801cd93acf is the first 10 characters of the scheduler container ID.

- The scheduler log should be at the following location. (Replace <Scheduler Container ID> part with actual container ID.)
/var/lib/docker/containers/<Scheduler Container ID>/<Scheduler Container ID>-json.log
How to Check Status of Scheduled Jobs
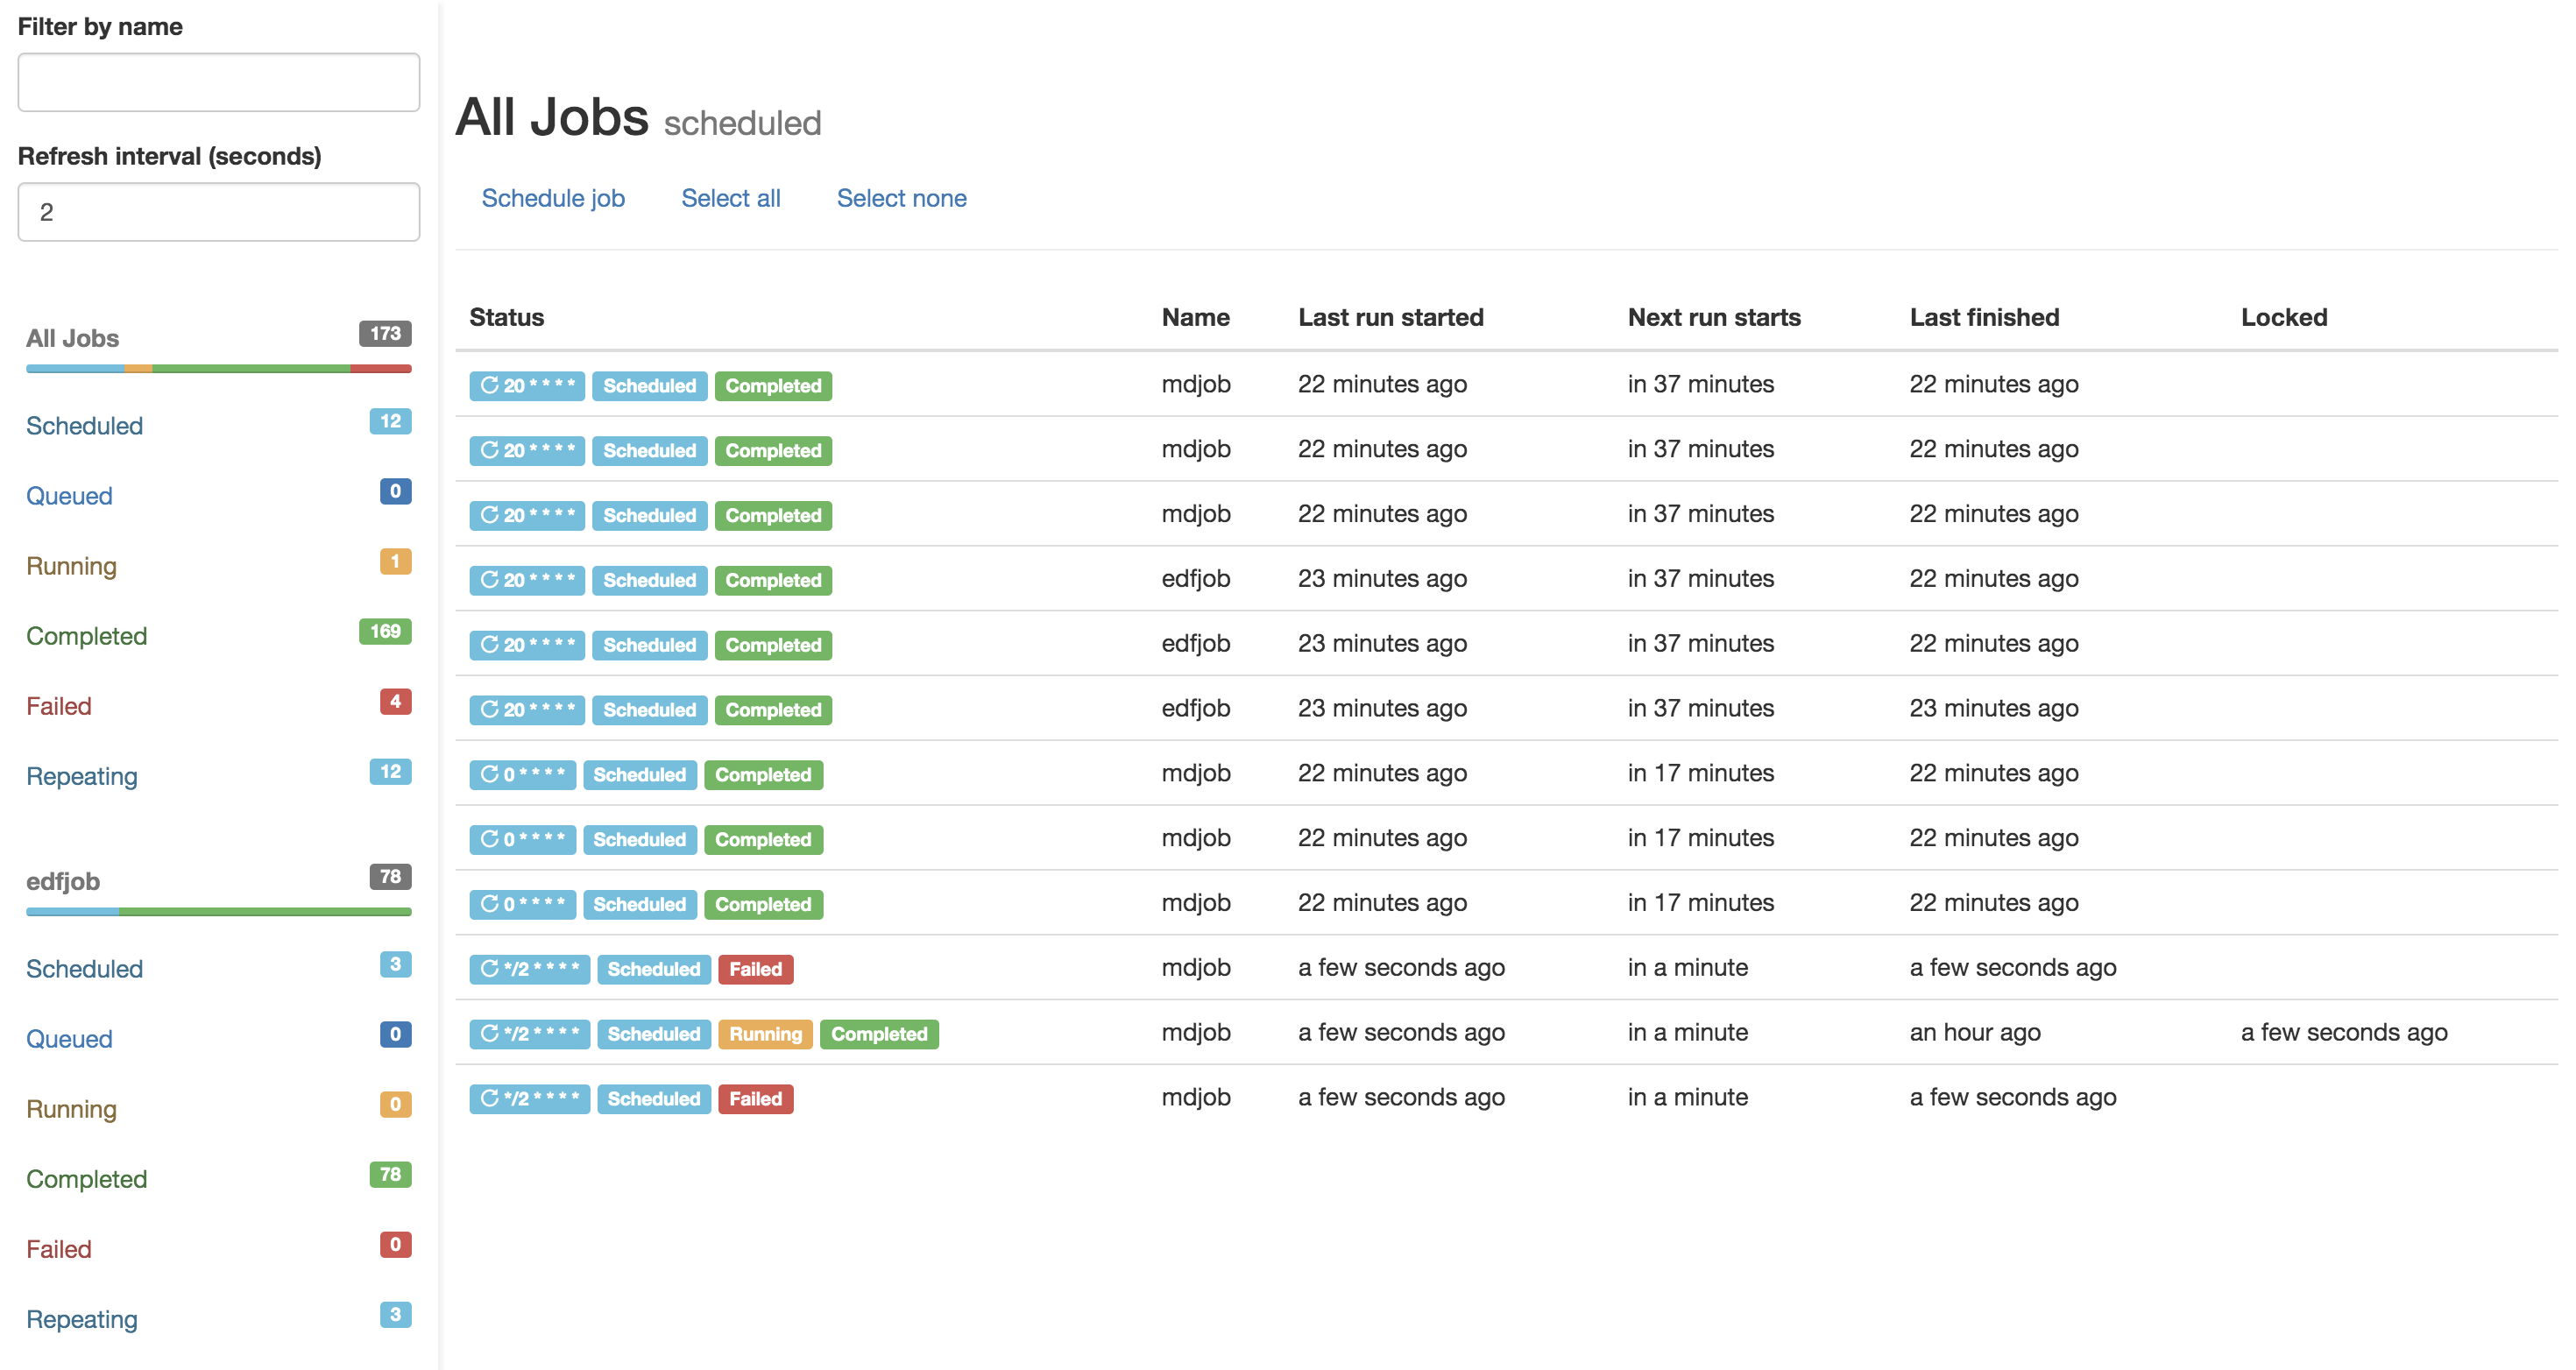
If you are an Admin user, you can click the “Admin” menu on the top right corner to open the Admin page. You can select the “Schedules” menu in the Admin page to check status of scheduled jobs.
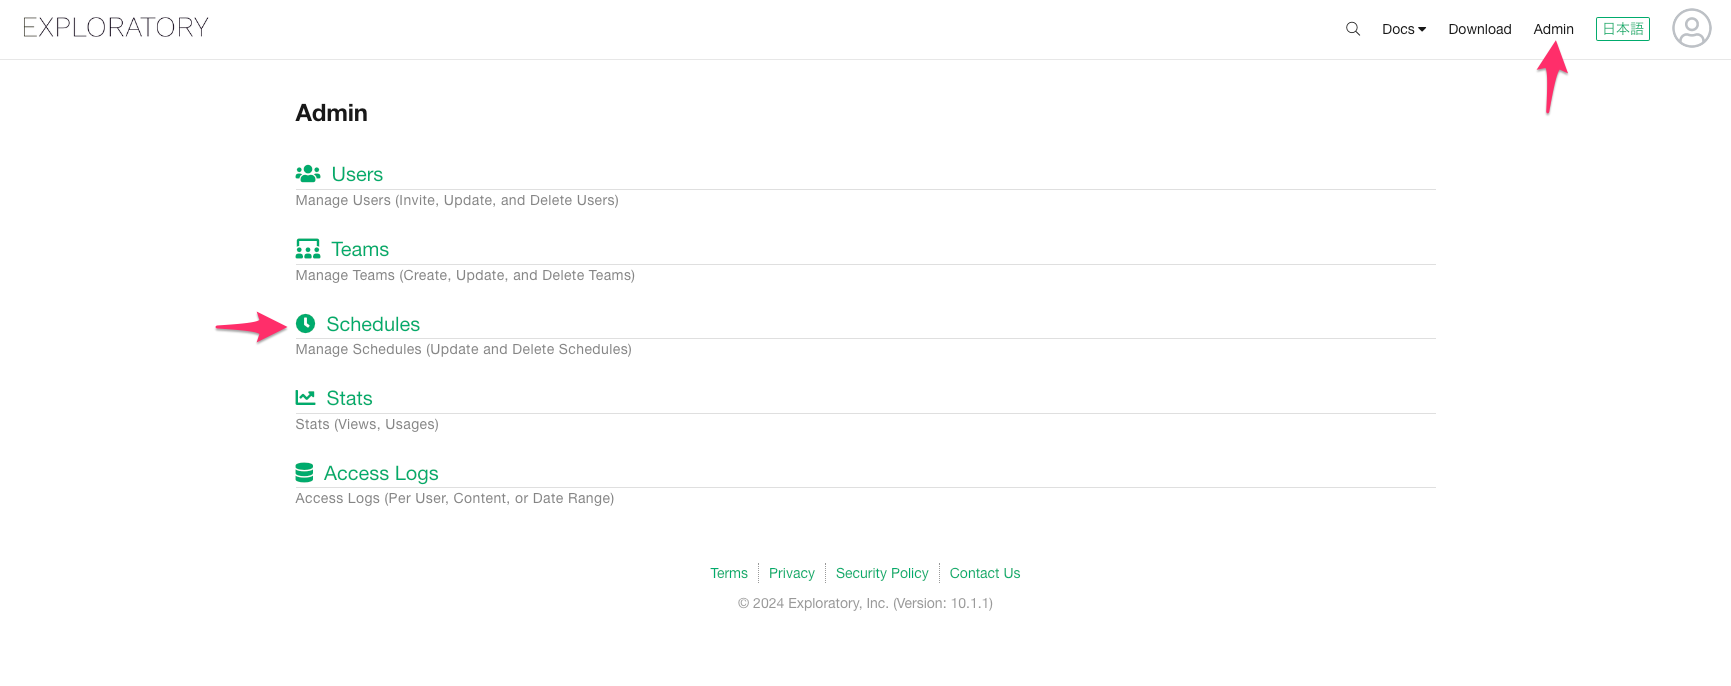
For Username/password to authenticate, use the email and password for your account on Exploratory Server.
Errors While Starting Up Exploratory Server
Problem: Error about ‘repository does not exist’ at ‘docker-compose up’
You got error message similar to the following, when you try to start
Exploratory Server with docker-compose up -d command.
Solution
Most likely this is because docker images for Exploratory Server is not properly loaded. The popular root cause is an insufficient disk space. Please make sure that you have enough disk space and run the following command in the Installation Guide again.
Problem: Error about “Cannot connect to the Docker daemon” or “permission denied while trying to connect to the Docker daemon” at ‘docker-compose up’
When trying to start the Exploratory Server using the
docker-compose up -d command, you may encounter an error
such as:
- “Cannot connect to the Docker daemon”
- “Permission denied while trying to connect to the Docker daemon”
Solution
These errors typically occur when the Docker service is not running on your Linux system. Please refer to this community post to learn how to start the Docker service. Once Docker is running, try starting the Exploratory Server again.
Problem: Error about failing to ‘start shim’ at ‘docker-compose up’
You got error message similar to the following, when you try to start
Exploratory Server with docker-compose up -d command.
Solution
Your docker service might be in a problematic state. Try restarting docker service with the following command.
Problem: Error ‘getaddrinfo(“mongodb”) failed’ at ‘docker-compose up’
You tried to start Exploratory Server with the
docker-compose up -d command, but it doesn’t become
accessible from a browser, and you see an error message similar to the
following in the log.
Solution
Your docker service might be in a problematic state. Try restarting docker service with the following command.
Problem: Error about the insufficient disk space.
Running the docker-compose up -d command may fail if the
system does not have enough disk space.
Solution
Delete unnecessary files on your system to free up disk space. If you have upgraded the Exploratory Server before, you can save disk space by deleting unnecessary Exploratory Server Docker images.
Errors While Accessing Exploratory Server
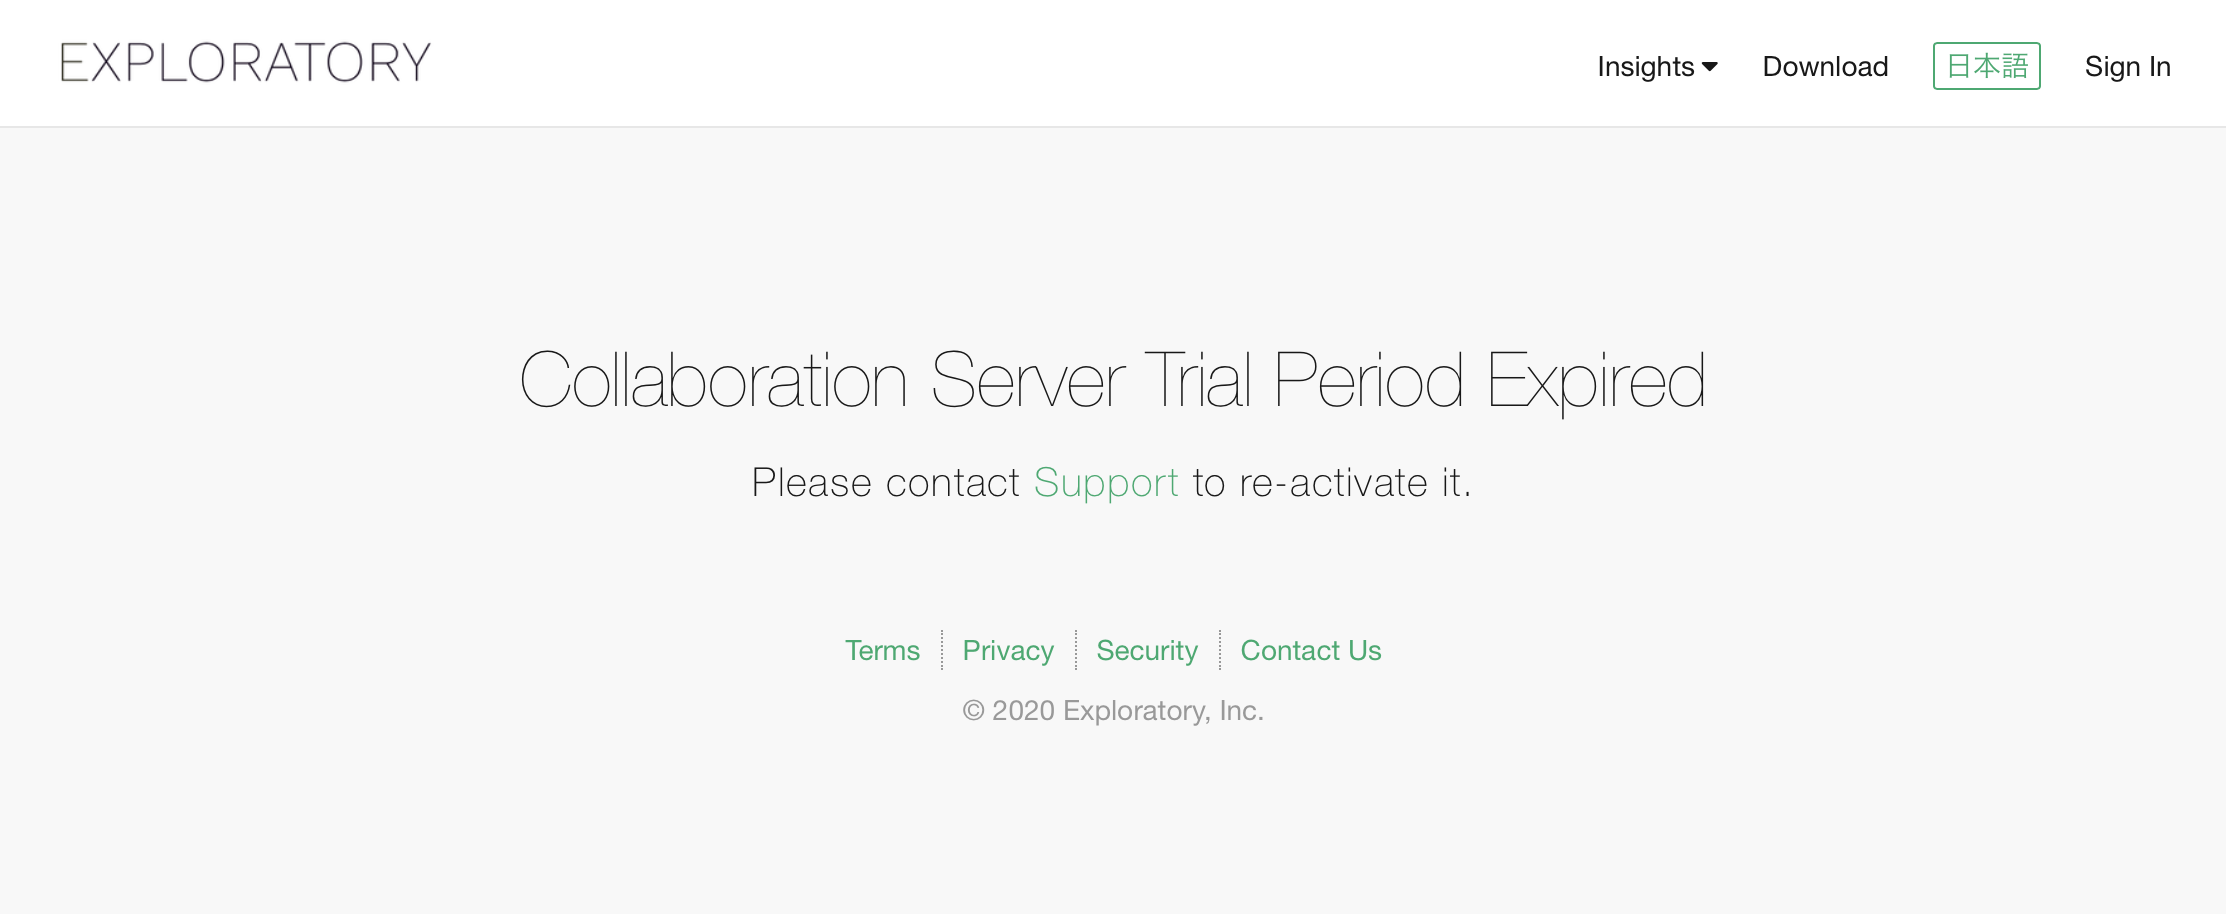
Problem
A screen that tell the trial period has ended, even though you have set up a still valid license key.
Solution
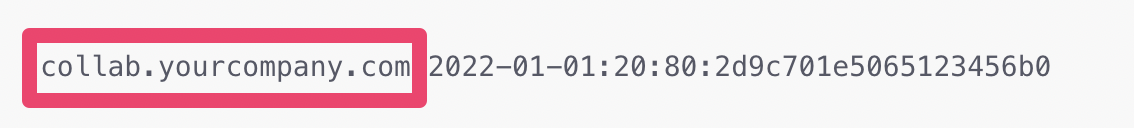
A license key has an IP address or a hostname in it, like the following examples.
Example of a license key 1 (With an IP address) :
Example of a license key 2 (With a hostname) :
They need to correspond with the IP address or hostname in the URL you type in to the web browser. If you need to access the Exploratory Server with an IP address or hostname that is different from what is in the license key, please contact support.
Problem
The browser accessing the Exploratory Server cannot load and display anything.
Solution
This usually means some network problem between your browser and the Collaboration server.
Many possible reasons could cause it, but one of them is that the IP addresses the Docker assigns to the Docker Containers of the Exploratory Server conflict with something else. You can control the range of IP addresses (subnet) the Docker assigns by adding the following additional configuration to the docker-compose.yml. In the following example, the Docker will assign the IP addresses ranging from 192.168.100.0 to 192.168.100.255.
Problem
When you search the insight, you see the error “Failed to Fetch the Data. Please Reload and Try Again.” even after reloading the page.
Solution
It can happen if the database doesn’t have enough indexes. You can create indexes to solve the problem.
- Identify the MongoDB Docker container ID. Run
docker psand find container ID with IMAGE name that starts with “mongo”. In the case of following screenshot,494388a45e11is the container ID.
- Run the following command to connect to the container. (Replace <Container ID> part with actual container ID.)
- Run the following command to connect to the MongoDB database.
- Run the following command to create indexes in the MongoDB.
db.notebooks.createIndex({"updatedAt" : -1})
db.notebooks.createIndex({"numlikes" : -1})
db.notebooks.createIndex({"views" : -1})
db.notebooks.createIndex({"downloads" : -1})
db.notebooks.createIndex({"viewStats.last7Days" : -1})
db.notebooks.createIndex({"viewStats.thisWeek" : -1})
db.notebooks.createIndex({"viewStats.lastWeek" : -1})
db.notebooks.createIndex({"viewStats.lastMonth" : -1})
db.notebooks.createIndex({"viewStats.last30Days" : -1})
db.notebooks.createIndex({"viewStats.last365Days" : -1})
db.notebooks.createIndex({"viewStats.thisYear" : -1})
db.notebooks.createIndex({"viewStats.lastYear" : -1})
db.notebooks.createIndex({"viewStats.allTime" : -1})
db.notebooks.createIndex({"viewStats.thisMonth" : -1})
Problems about using Parameters/Show Details on Published Dashboard, Chart, Data, etc.
Problem: Starting the Interactive Mode fails with an error “Error in download.file(….” on an insight that used to work before.
You may see an error like
Error in download.file("http://.... when you start the
Interactive Mode or Show Details session on an insight that used to work
before. It happens when the internal temporary directory becomes
full.
Solution
You can assign a volume to /tmp folder instead of using
the tmpfs to fix the problem. Here is how.
- Open the
docker-compose.ymlin the Exploratory Server installation folder. - Find the
rservesection. - Add the
volumessection (2 lines) at the same level wheretmpfsis. - Comment out the whole
tmpfssection (usually 3 lines) by adding “#” sign at the beginning of each line.
The example of the rserve section after the fix is the
following.
 rserve:
   image: r-exploratory:7.0.9
    #tmpfs:
    #  # exec is necessary to run prophet successfully.
    #  - /tmp:exec   tmpfs:
    volumes:
      - ./tmp:/tmp
Once the change is done, restart the server to make the change effective.
Problem: Starting or Updating the Parameter fails with an error “Processing might have failed due to the large data size.”.
If you are getting an error like
Processing might have failed due to the large data size.
when you try to update the parameter of the published content even if
you have enough memory on the server, this could be because the
Exploratory Server doesn’t have enough memory allocation.
Solution
You can increase the memory allocation of the Exploratory Server to solve the problem. Please see the note for details.
Problem: Interactive Mode is Taking Too Long to Start
If all pooled R connections are in use, starting Interactive Mode can take a long time. This often happens when there are many users accessing Interactive Mode simultaneously.
Solution
You can increase the max pool size of the R connections. Here is how.
- Open the
docker-compose.ymlin the Exploratory Server installation folder. - Locate the
environmentsection under theexploratorysection. - Add
EXPL_RSERVE_POOL_MAX_SIZEwith a higher value. The default size is 5, but you can try increasing it to 20 or 30, depending on your system specifications.
The config file example is following.
Once the change is done, restart the server to make the change effective.
Problems about Google Analytics, Google Sheets, Google BigQuery, Salesforce, and other OAuth Data Sources.
Problem: When trying to access OAuth data sources like Google Analytics from the desktop, it results in “Access blocked: Authentication error 400: invalid_request”.
This error will be displayed if you access to your Exploratory Server (Hosted or On-Premise) and the OAuth configuration on the Exploratory server is not completed.
Solution
Please follow the How to Configure OAuth for Exploratory Collaboration Server to Connect to Google Sheets, Analytics, and BigQuery.
Problem:When I try to use a Salesforce data source, it doesn’t transition to the authentication screen.
When trying to connect to Salesforce from Exploratory Desktop, the browser launches but it doesn’t transition to the Salesforce authentication screen.
Solution
Please follow theHow to Configure Exploratory Server (Hosted/On-Premise) to Connect to Salesforce. Ensure to Uncheck the “Require Proof Key for Code Exchange (PKCE) Extension for Supported Authorization Flows”
Problems about Running/Scheduling Data Refresh of Published Dashboard, Data, etc.
Problem: Date of Dashboard, etc. is still old after refresh
Date of Dashboard, etc. is still old after data refresh has run.
Solution
Please check that the clock of your server is not out of sync.
If the problem seems to be happening because of other causes, please contact support.
Problem: After refresh, the content of the Data tab disappears
After refreshing data, the content of the Data tab disappears like the following screenshot.
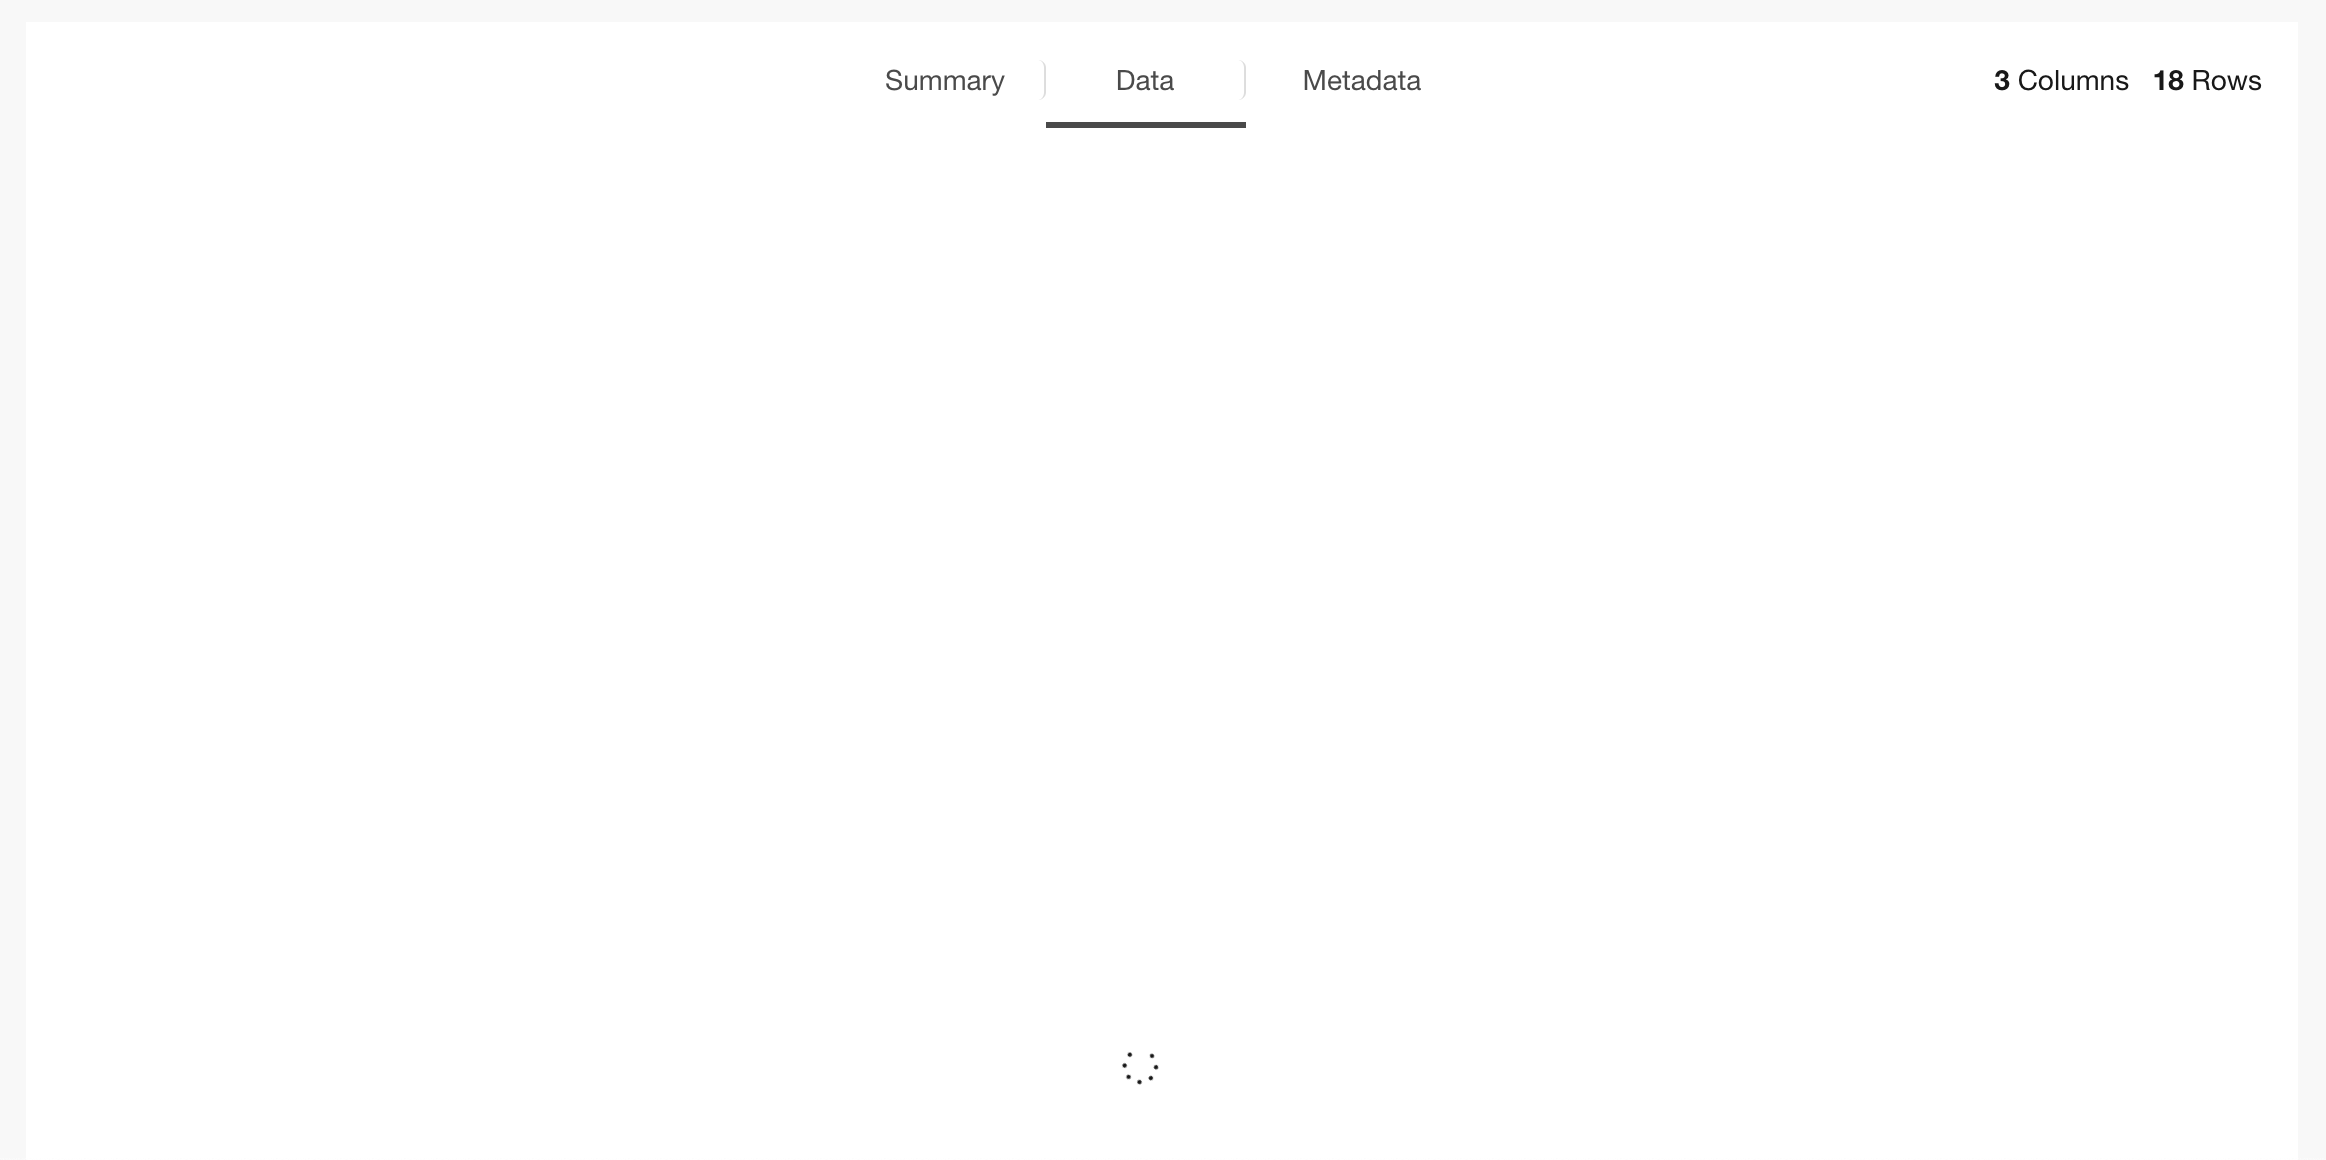
Solution
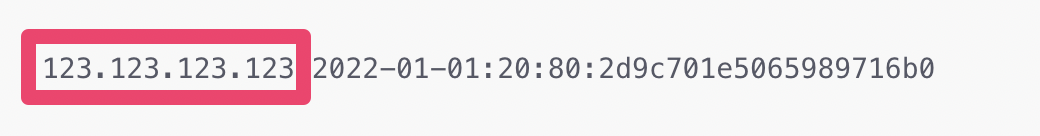
We have seen a case where the owner of some of the sub-directories of the rdata directory under the exploratory directory, which is created by expanding the distribution file, was wrongly set to root, like the directory surrounded by the red line in the example screenshot below. It was breaking flow of data within Exploratory Server, which resulted in this problem.
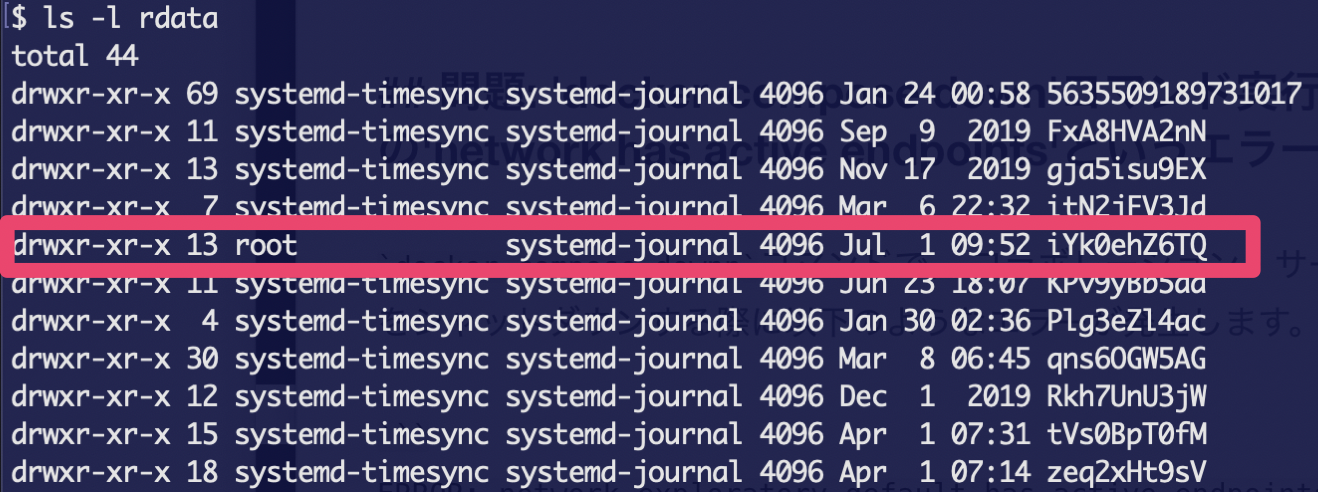
This can be fixed by deleting the directory with the wrong owner.
Please be careful not to delete a wrong directory or file while you try this operation. If you are not sure, please contact support.
Problem: Scheduling fails if you schedule an insight including Pivot Table or Summarize Table created on the desktop version 6.12 or earlier.
Scheduling fails If you use the Exploratory Server version 7.0 (and above) and schedule an insight including Pivot Table or Summarize Table created on the desktop version 6.12 or earlier.
Solution
It happens because of the R version incompatibility. You can fix it by republishing the insight from the Exploratory Desktop 7.0 or above.
Problem: Scheduling fails with an error “Processing might have failed due to the large data size.”.
If the scheduling fails with an error like
Processing might have failed due to the large data size.
even if you have enough memory on the server, this could be because the
R engine doesn’t have enough memory allocation.
Solution
You can increase the memory allocation of the Exploratory Server to solve the problem. Please see the note for details.
Problem: Scheduling fails with the error “Error in curl::curl_fetch_memory(url, handle = handle) : Timeout was reached: [webdav] Operation timed out after 30001 milliseconds”
If you schedule an insight that takes a long time to refresh, it
fails with the error
Error in curl::curl_fetch_memory(url, handle = handle) : Timeout was reached: [webdav] Operation timed out after 30001 milliseconds.
Solution
If you are using version 7.0 and above, You can increase the timeout
by setting a longer timeout with the EXPL_HTTP_TIMEOUT
parameter in the docker-compose.yml configuration file. You
can specify the timeout duration in seconds. For
example, if you want to set it to 1 hour, you can set 3600.
Here is how.
- Open the
docker-compose.ymlin the Exploratory Server installation folder. - Find the
rservesection. - Add the
- EXPL_HTTP_TIMEOUT=3600line under theenvironmentsub-section of therservesection. Ifenvironmentdoesn’t exist, add it too.
The example of the rserve section after adding the
parameter is the following.
 rserve:
   image: r-exploratory:7.0.9
   tmpfs:
     # exec is necessary to run prophet successfully.
     - /tmp:exec
   environment:
     - EXPL_HTTP_TIMEOUT=3600
Once the change is done, restart the server to make the change effective.
If it doesn’t solve the problem, please contact support.
Problem: Scheduling fails with the error “cannot popen ‘/usr/bin/which ’uname’ 2>/dev/null’, probable reason ‘Cannot allocate memory’”.
Scheduling an insight fails with the error
"cannot popen '/usr/bin/which 'uname' 2>/dev/null', probable reason 'Cannot allocate memory'".
It typically happens right after installing a new server or upgrading
the server.
Solution
You can add a parameter privileged: true under the
rserve section in the docker-compose.yml
config file. Here is how.
- Open the
docker-compose.ymlin the Exploratory Server installation folder. - Find the
rservesection. - Add the
privileged: trueline under therservesection.
The example of the rserve section after adding the
parameter is the following.
 rserve:
   image: r-exploratory:7.0.9
   tmpfs:
     # exec is necessary to run prophet successfully.
     - /tmp:exec
   privileged: true
Once the change is done, restart the server to make the change effective.
If it doesn’t solve the problem, please contact support.
Problem: Thumbnails for charts, dashboards, etc. are not updated even though the schedule is successful.
If thumbnails for charts, dashboards, etc. are not being updated despite the schedule running successfully, it’s possible that the process responsible for capturing the thumbnails is failing due to a timeout. Please check the logs for the following message:
Solution
You can work around this issue by adding the
EXPL_SCHEDULER_SCREENSHOT_CAPTURE_TIMEOUT parameter to the
scheduler section in your docker-compose.yml
file.
- Open the
docker-compose.ymlfile located in your Exploratory Server installation folder. - Locate the
schedulersection. - Under the
environment:subsection, add the following line:EXPL_SCHEDULER_SCREENSHOT_CAPTURE_TIMEOUT=60000The value60000is in milliseconds, which equals 60 seconds (1 minute).
The updated configuration file should look like this:
Once the change is done, restart the server to make the change effective.
If it doesn’t solve the problem, please contact support.
Problem: Scheduling fails with an error “Processing might have failed due to the large data size.”.
If you are getting an error like
Processing might have failed due to the large data size.
when you schedule the published content even if you have enough memory
on the server, this could be because the Exploratory Server doesn’t have
enough memory allocation.
Solution
You can increase the memory allocation of the Exploratory Server to solve the problem. Please see the note for details.
Problem: Data re-import works on Exploratory Desktop, but errors occur When scheduled on the Exploratory Server.
If you can re-import data on Exploratory Desktop but encounter errors when scheduling on the server, it might be because the database being used as the data source does not allow requests from the Exploratory server.
Solution
You can resolve this issue by whitelisting the IP address of the Exploratory server in your database. For more details, please refer to this guide.
Errors While Shutting Down Exploratory Server
Problem: Error ‘network has active endpoints’ at ‘docker-compose down’
You got error that looks like following, when you try to shut down
Exploratory Server with docker-compose down.
Solution
- Check the status of docker network referred to in the error message.
This should give output like following.
[
    {
        "Name": "exploratory_default",
                ...
        "Containers": {
            "014cbe0146...": {
                "Name": "exploratory_exploratory_1",
                ...
            },
            "494388a45e...": {
                "Name": "exploratory2_mongodb_1",
                ...
            },
                        ...
        },
        ...
    }
]
The parts like “014cbe0146…” ae IDs of containers. We need them at the next step.
- Remove containers with following command.
With the container IDs from the previous step, run the following command to remove containers.Or if the above does not work, run the following.
Repeat it for each container attached to the erroring network.
- Try shutting down Exploratory Server again with
docker-compose down.
Problems in Updating Configuration of Exploratory Server
Problem: Configration Change about administrator account (e.g. email) made in docker-compose.yml or exploratory_config.yml does not seem to be taking effect
You modified administrator account info, such as email address, in docker-compose.yml or exploratory_config.yml. But after restarting the Exploratory Server, the change does not seem to be taking effect.
Solution
The admin account info in docker-compose.yml or exploratory_config.yml is only used for the initial account creation at the installation of Exploratory Server, and changes made on it is ignored after the installation is once done.
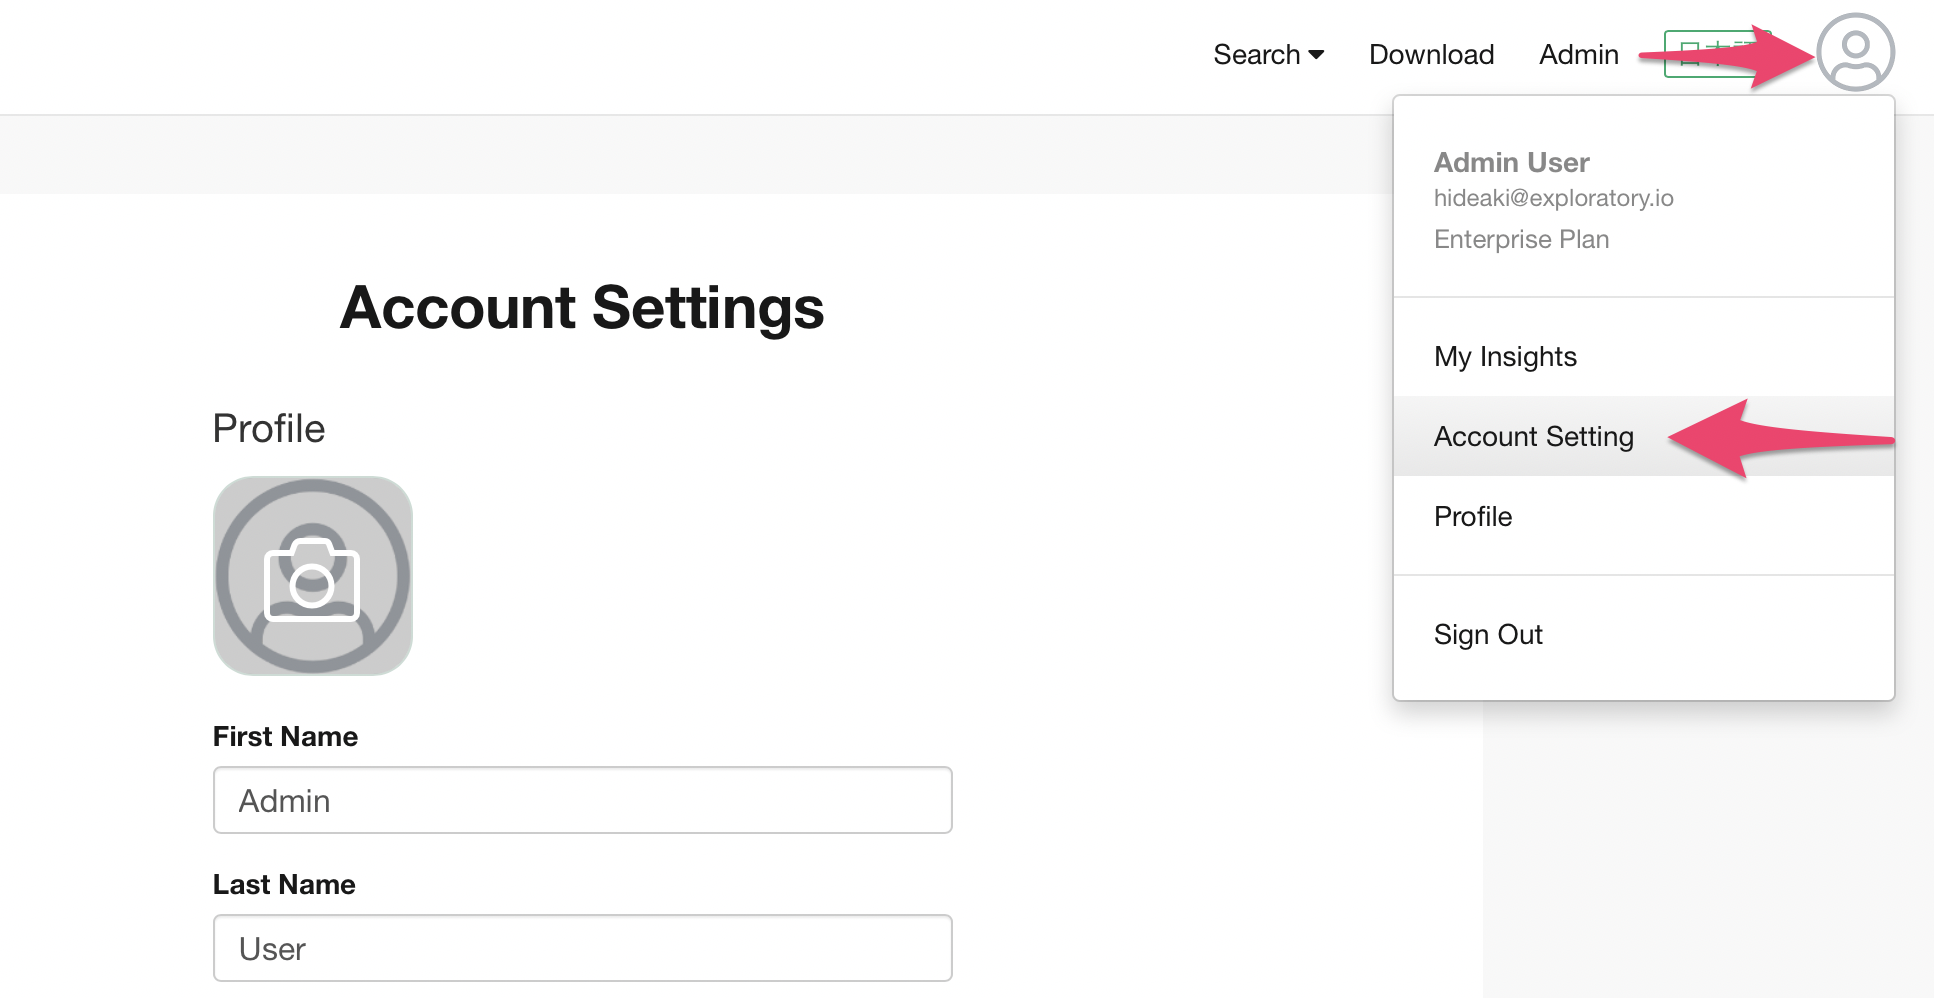
To modify admin account info after the installation, login to the admin account from a browser, and update the info at the “Account Settings” page.
Problems in Using Exploratory Desktop Connected to Exploratory Server
Problem: Error dialog is displayed when trying to use Exploratory Desktop connecting to a Exploratory Server, after connecting to exploratory.io with Exploratory Public
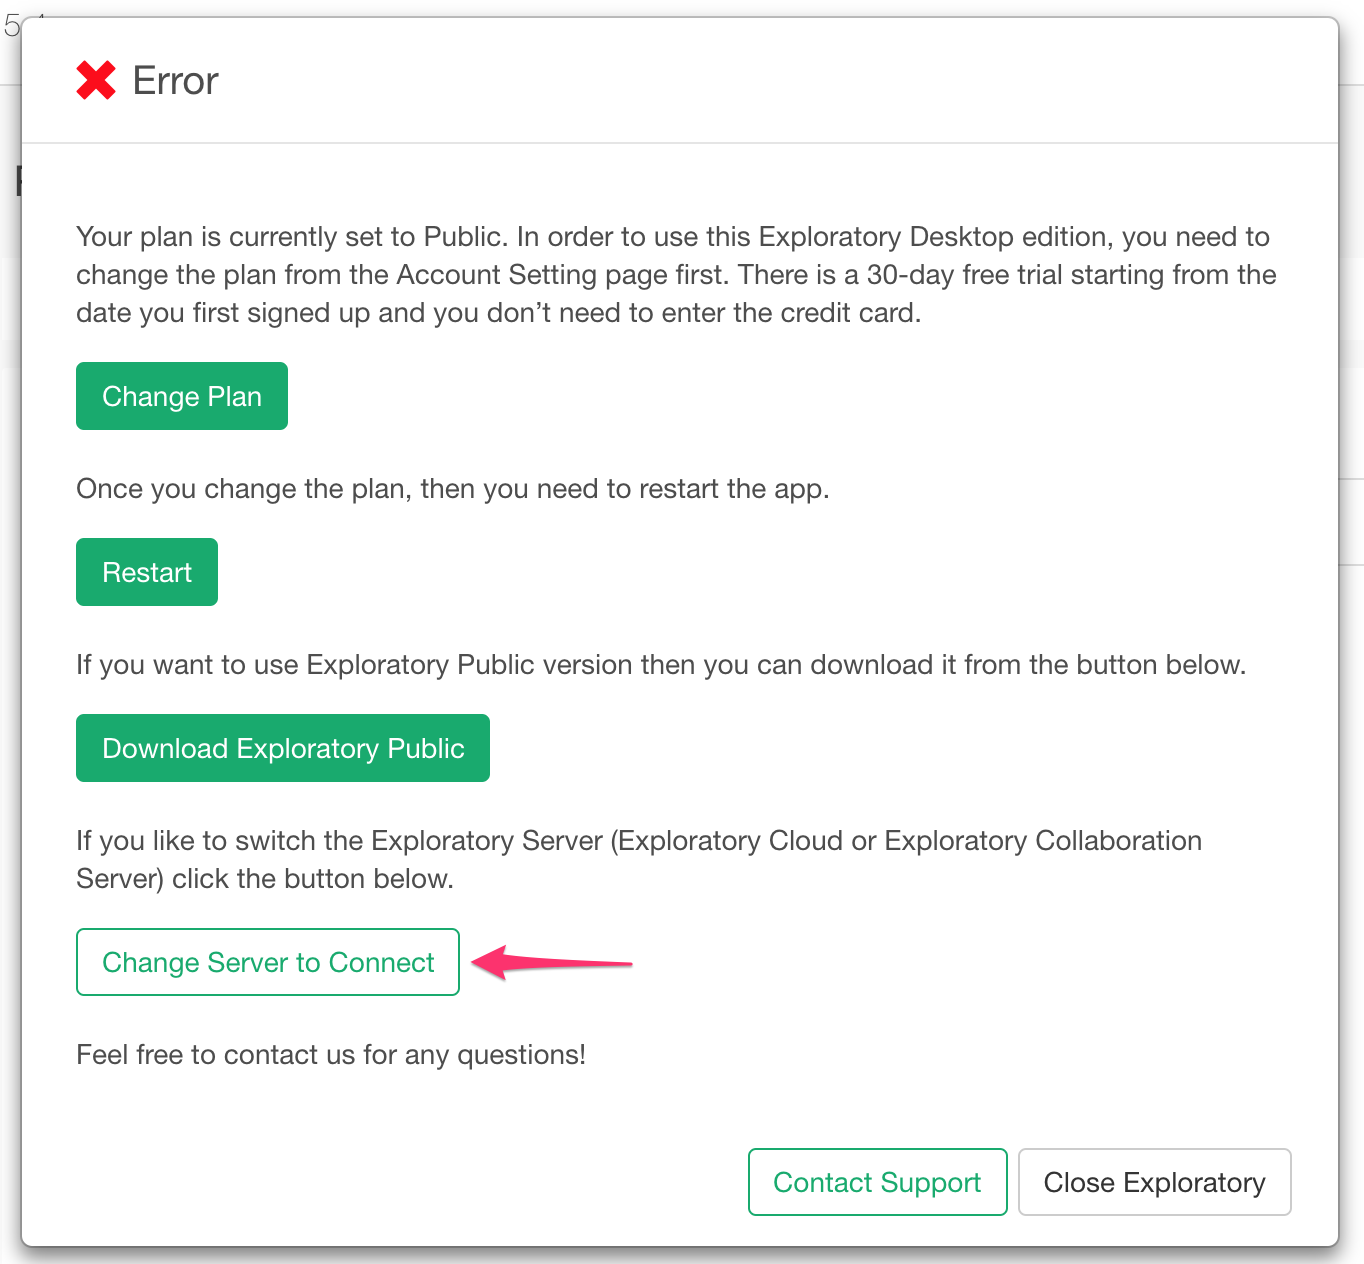
When you login to Exploratory Public, Exploratory Public records where it connected to (exploratory.io) in the repository of Exploratory. From then on, when you open the Exploratory Desktop to connect to the Exploratory Server, it reads these saved information from the Repository and it tries to connect to exploratory.io, which results in the showing of Error Dialog, because users with Public Plan are not allowed to use Exploratory Desktop.
Solution
To connect to the Exploratory Server, click the “Change Server to Connect” button on the Error Dialog.
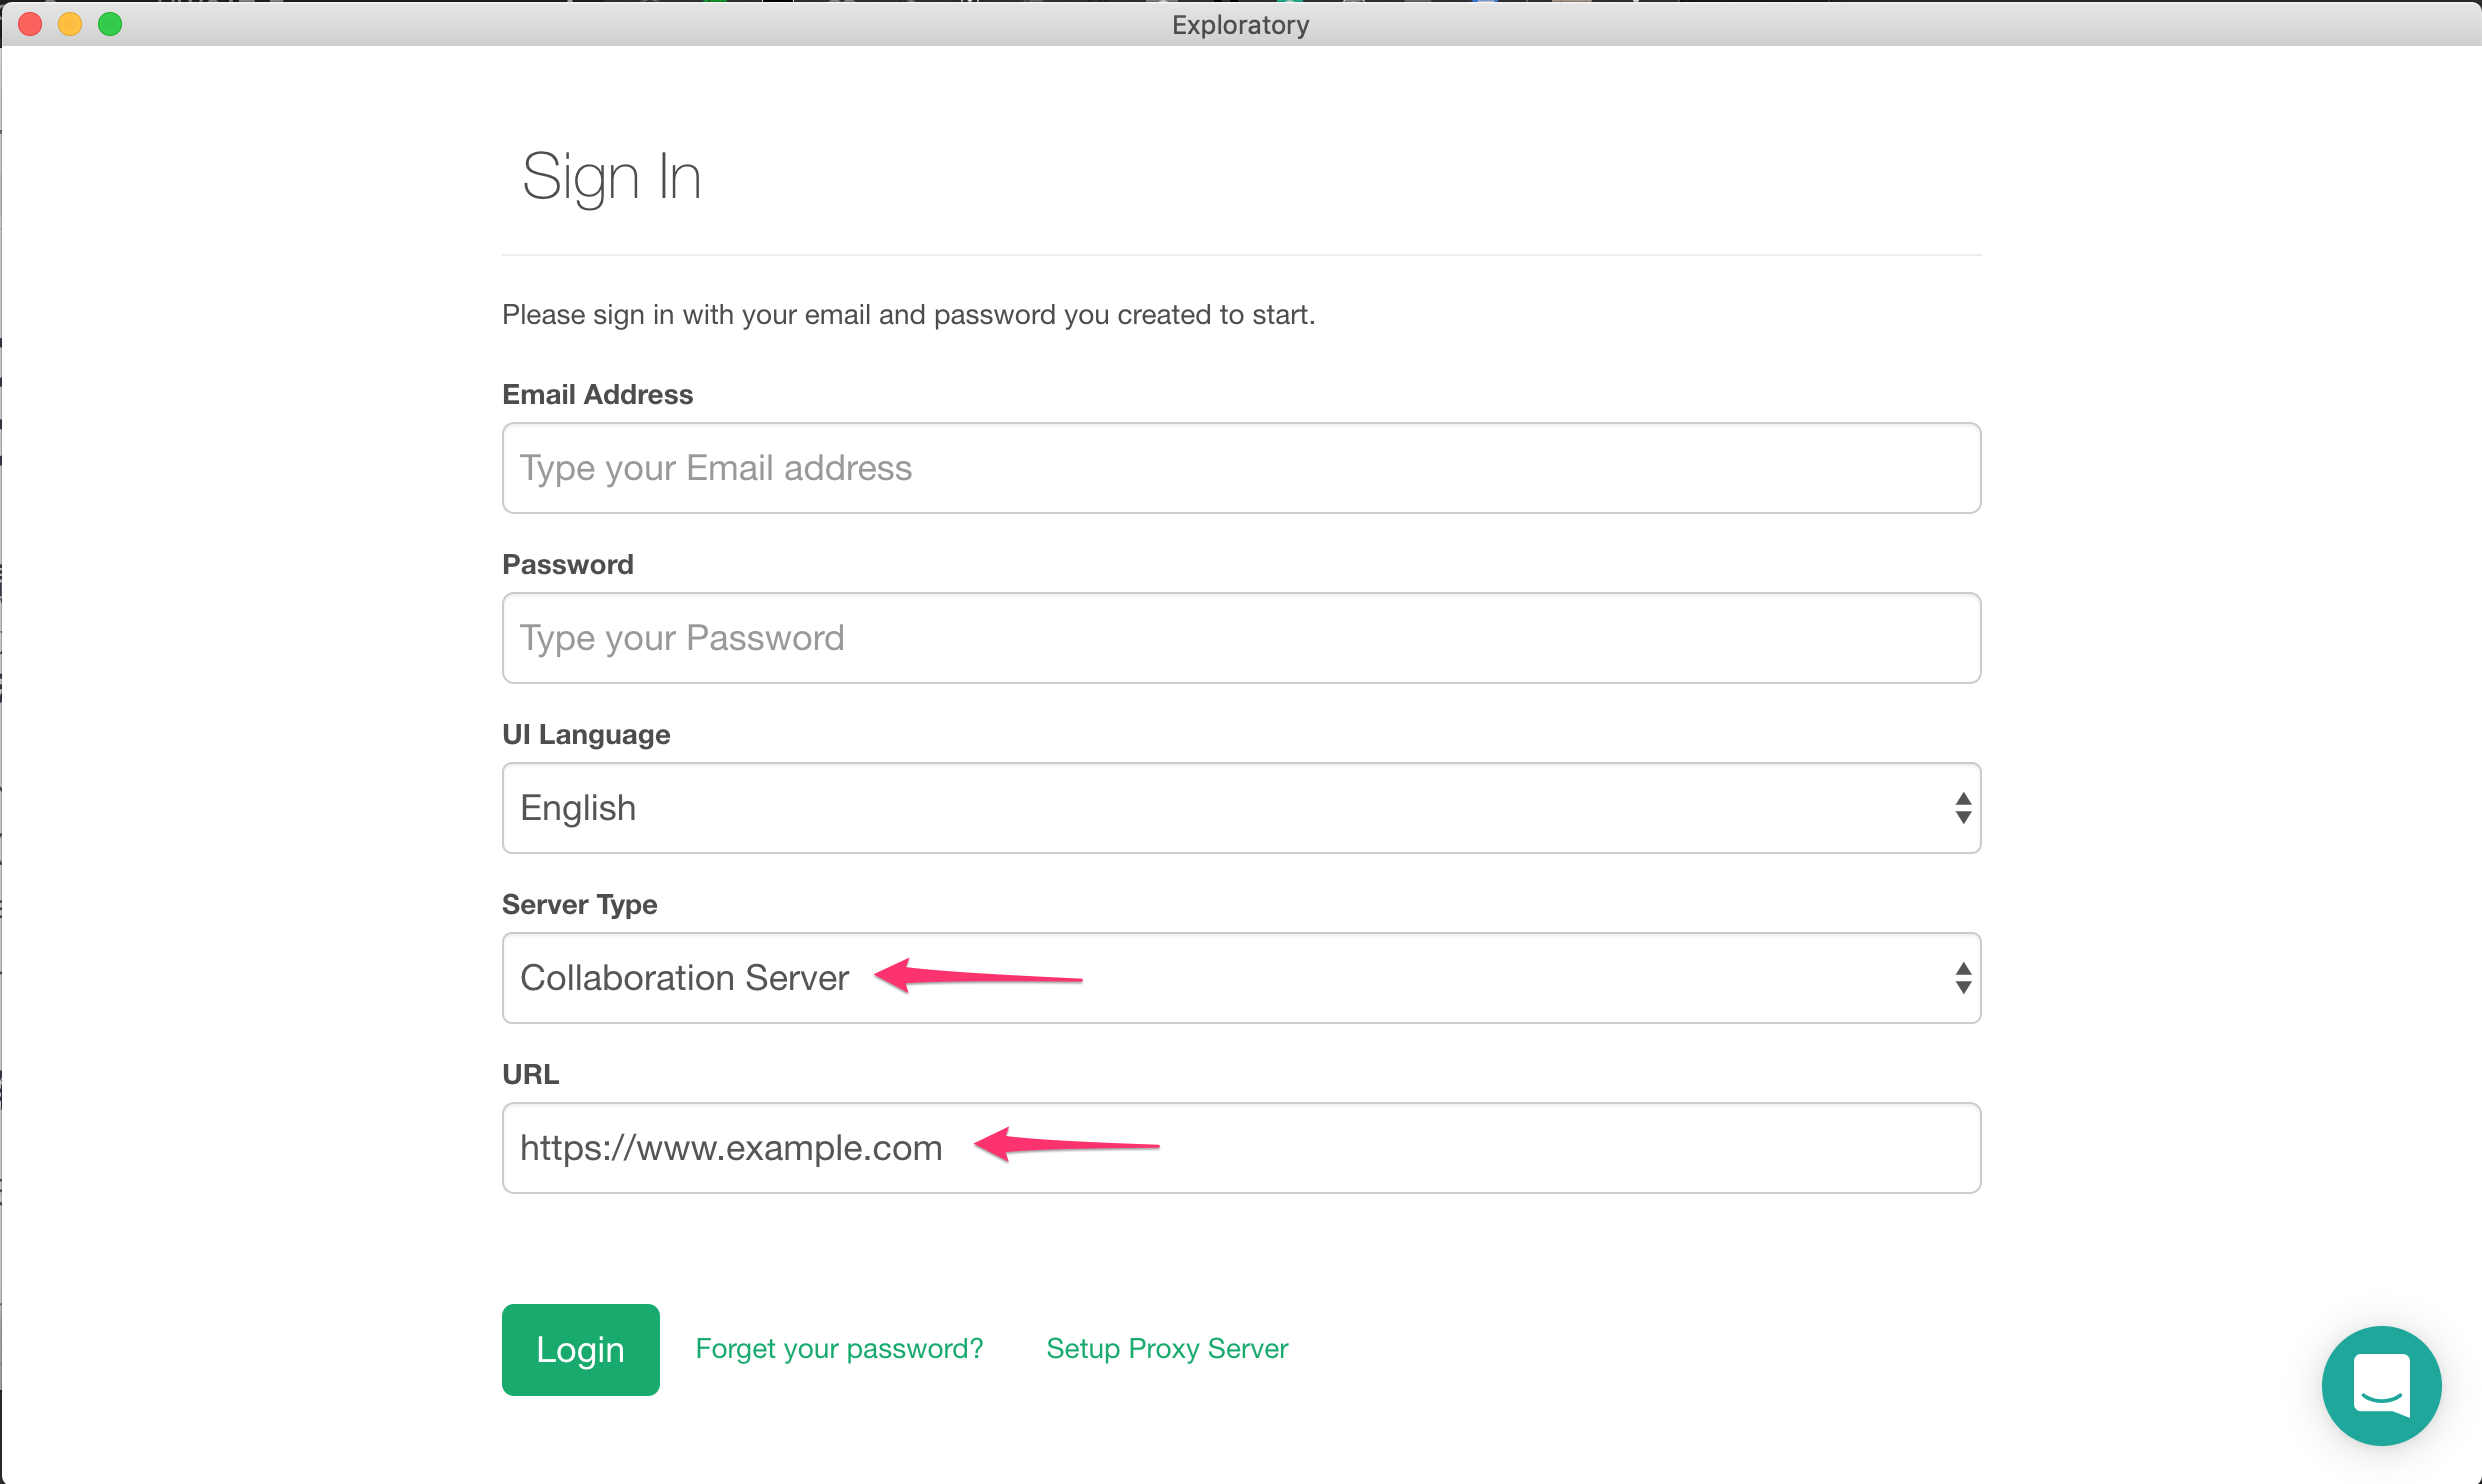
This will open up the Login screen like below. Change the Server Type to “Exploratory Server” and enter the URL of the Exploratory Server, email address, and password, and click the Login button to connect to the Exploratory Server.
Problem: Authentication error when trying to switch the server to exploratory.io
I usually use Exploratory Desktop connecting to our Exploratory Server, but when I try to switch the server to exploratory.io, I get an authentication error.
Solution
An account on exploratory.io is a different, separate account from the account on your Exploratory Server. You need to have an account on exploratory.io to use Exploratory Desktop while connecting to exploratory.io.
If you are an “Author” user of your Exploratory Server, we can add a license for the same period as your Exploratory Server to your exploratory.io account. Please contact support for adding the license to your exploratory.io account.
Problems in Publishing Insight to Exploratory Server from Exploratory Desktop
Problem: Error that reads “504 Gateway Time-out” is displayed
When publishing Insight, such as Data, Chart, or Dashboard, from Exploratory Desktop to Exploratory Server, especially when dealing with larger data, error message that looks like the following is displayed.
Solution
This error happens when Nginx web server, which receives request from Exploratory Desktop and pass it to the backend, determines that the response from backend is taking too much time, and times out.
By default, the timeout is 60 seconds, but it can be configured to a longer time to avoid the error.
The default.conf file under the exploratory directory is the configuration file for Nginx. You can configure the timeout by adding proxy_read_timeout parameter in the “location” section under the “server” section, like the following example.
In the following example, the timeout is set to 600 seconds.
Example of default.conf file content
Problem: Publishing error due to the insufficient disk space.
Publishing insights may fail if the system does not have enough disk space.
Solution
Delete unnecessary files on your system to free up disk space. If you have upgraded the Exploratory Server before, you can save disk space by deleting unnecessary Exploratory Server Docker images.
Problems with Exploratory Server Logs
Problem: The log files are removed after restarting the Exploratory Server.
If you restart the Exploratory Server, the system cleans up your old log files by default.
Solution
You can customize the logging destination by updating the configuration file to make logs persistent. You can take a look at this note for details.
Problem: I need to know when/who created, accessed or updated the insights, users and teams.
It is hard to know when and who created, accessed or updated insights, users, and teams from the HTTP access log.
Solution
From version 8.0 of the Exploratory Server, you can find the insight, user and team events in the log file. Please see note for details.
Issues with OAuth Data Sources such as Google Analytics, Google Sheets, Google BigQuery, and Salesforce
Problem: When trying to access OAuth data sources such as Google Analytics from the desktop, errors like “Access blocked: Authentication error 400: invalid_request”, “Access blocked: This app’s request is invalid. Cannot log in.”, or “Error 400: redirect_uri_mismatch” appear.
These errors appear if the connection destination is Exploratory Server (hosted or on-premise) instead of exploratory.io, and OAuth settings have not been completed.
Solution
Please follow the steps in How to Connect to Google Sheets, Analytics, BigQuery with OAuth on Exploratory Server (Hosted or On-Premise) to configure OAuth.