You can quickly get the currency exchange rate data that is hosted by Alpha Vantage by calling an API from the tidyquant (R package) with R Script data source option in Exploratory.
Alpha Vantage provides a set of REST APIs to get various financial data. And one of the data types is the currency exchange rate (Forex) data.

Luckily, there is a R package 'tidyquant' that provides a R interface for those APIs, and this means you can directly call the tidyquant API to get the currency exchange rate data.
1. Get API Key
In order to get the data from Alpha Vantage you need a free API key for yourself. You can get it from their website.
2. Call API in R Script Data
Select 'R Script' from the data frame menu.

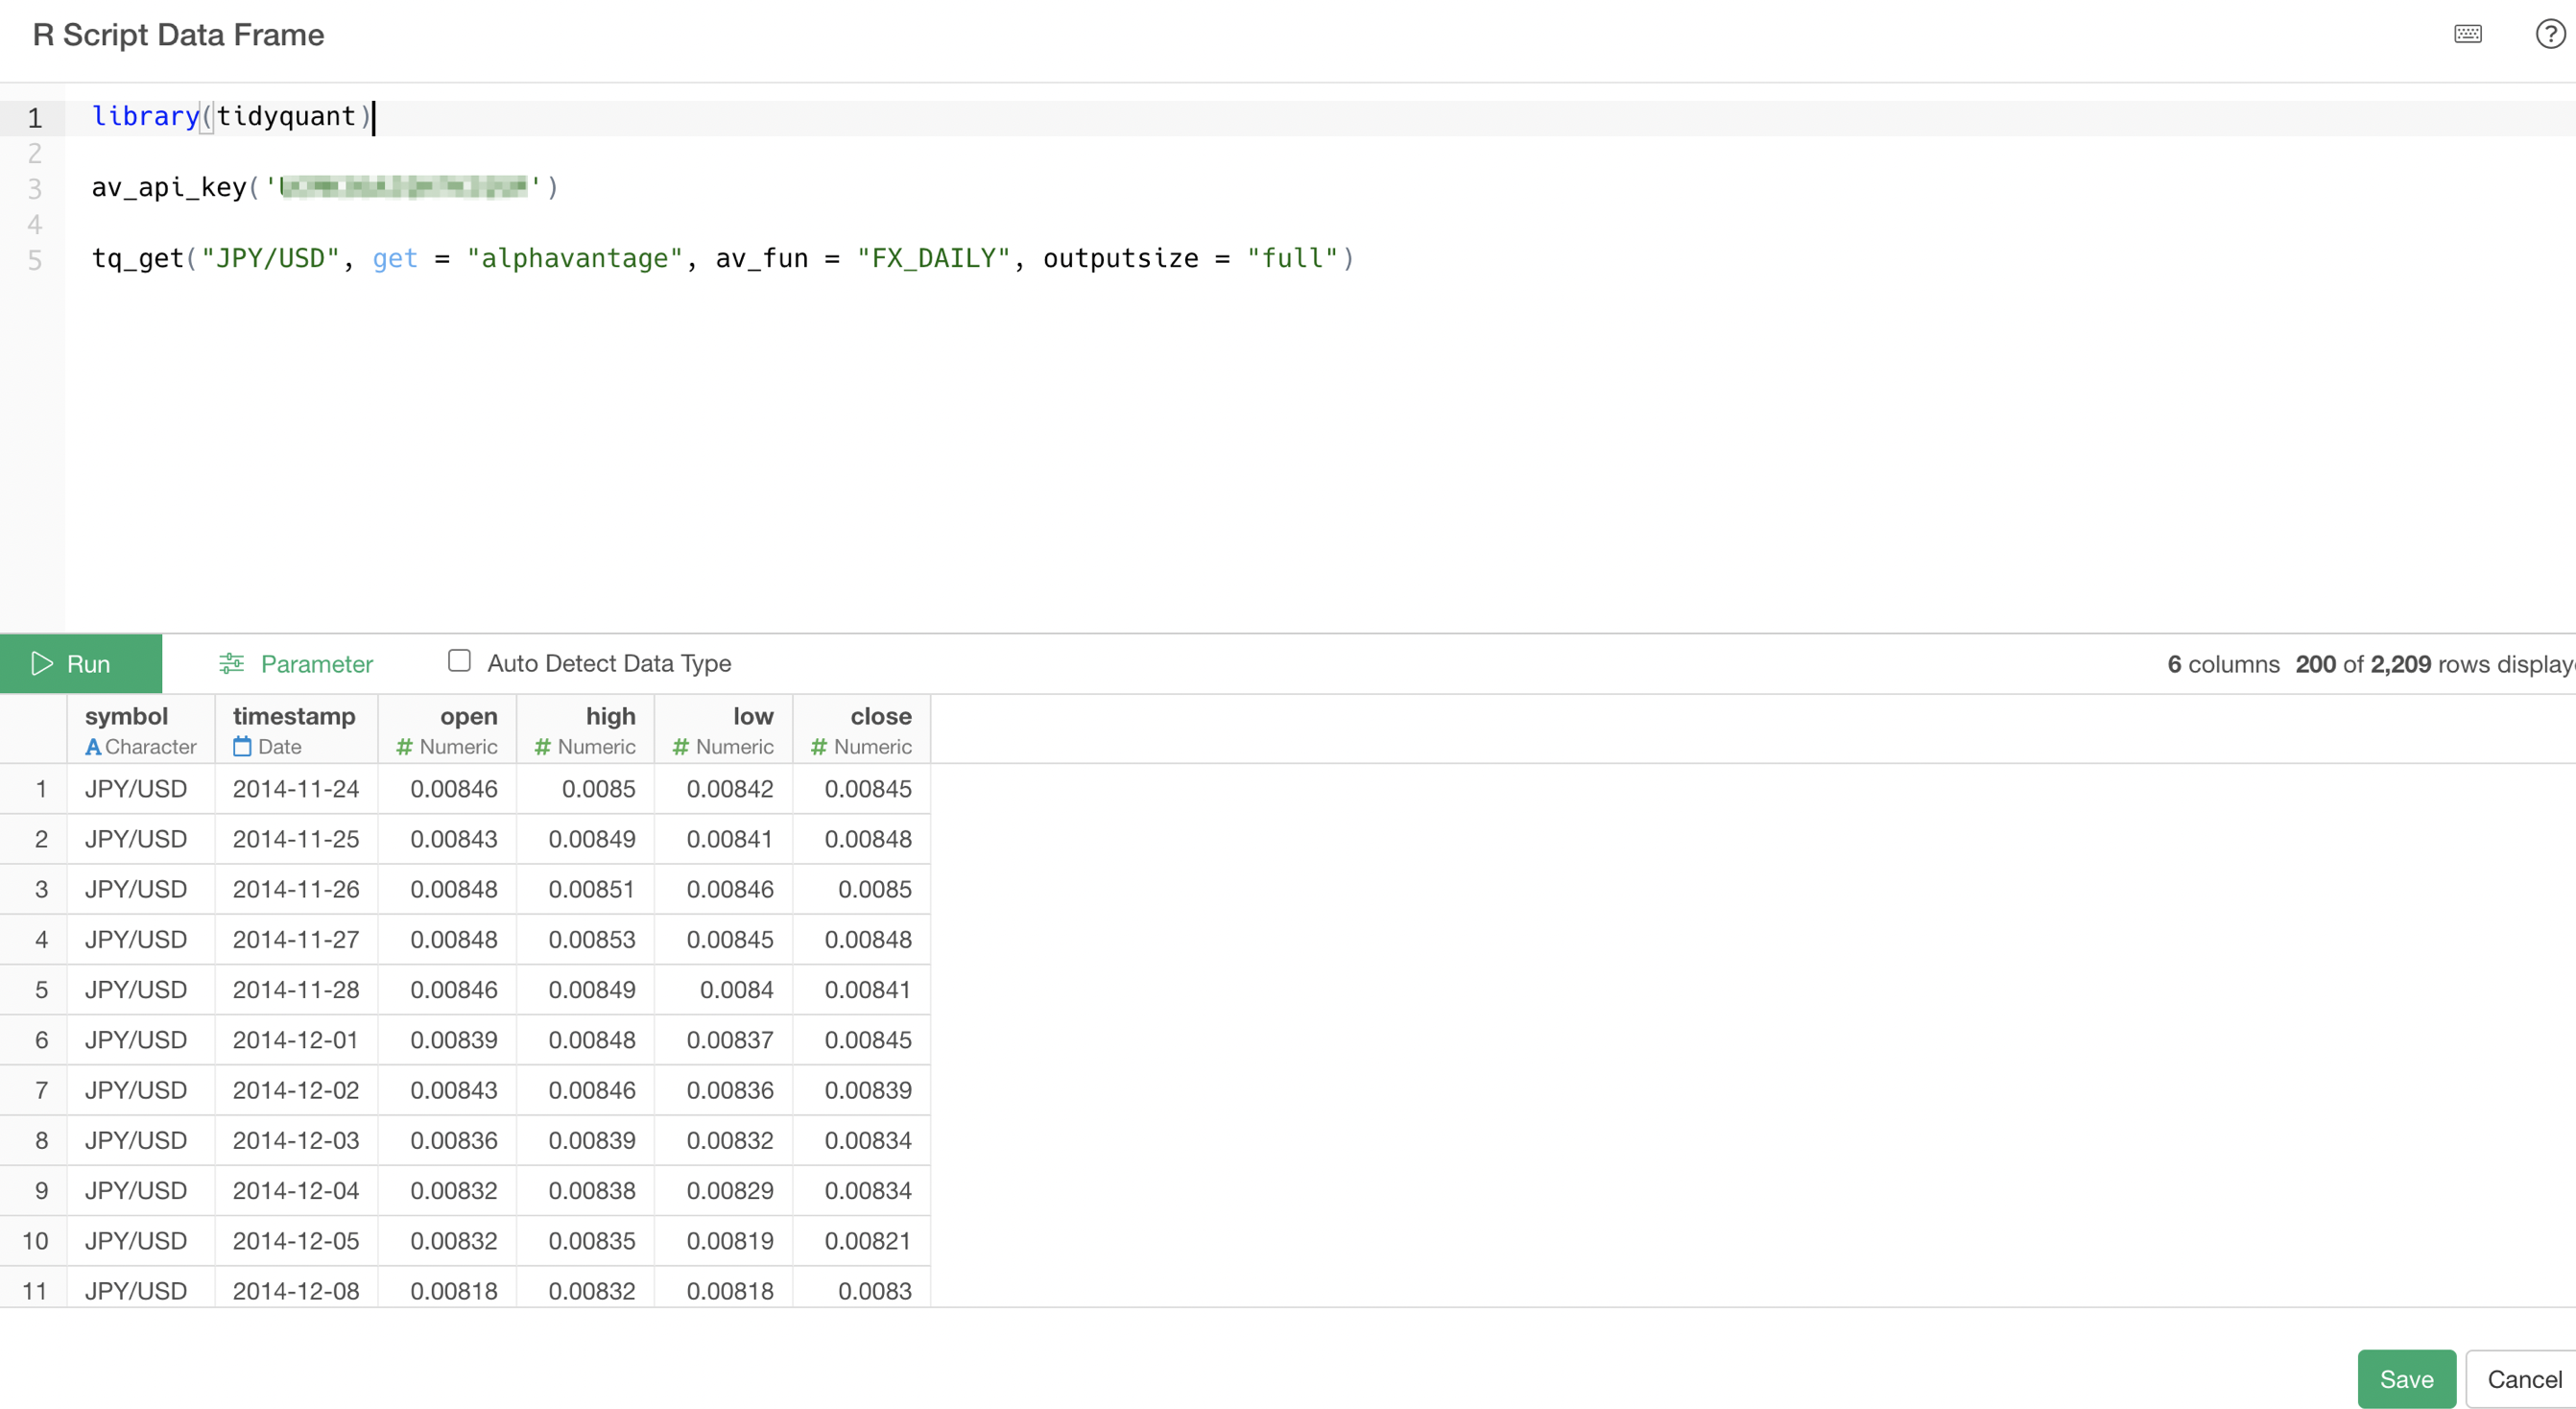
And type the following code.
library(tidyquant)

av_api_key('<your api key>')

tq_get("JPY/USD", get = "alphavantage", av_fun = "FX_DAILY", outputsize = "full")
The first line is to load the tidyquant package into the session. This will allow you to call the tidyquant functions.
The second line is to set your Alpha Vantage's API Key.
The third line is calling a function 'tq_get()' to get the currency exchange rate data. I'm using 'JPY/USD' to get the exchange rate for Japanese Yen and US Dollar'.
You can find the currency code list at the end of this note.
You can check the tidyquant reference document for more details on the functions.
3. Preview and Import
You can click on the Run button to preview the data.
If the data looks good, click on the Save button at the right hand side bottom to import the data.
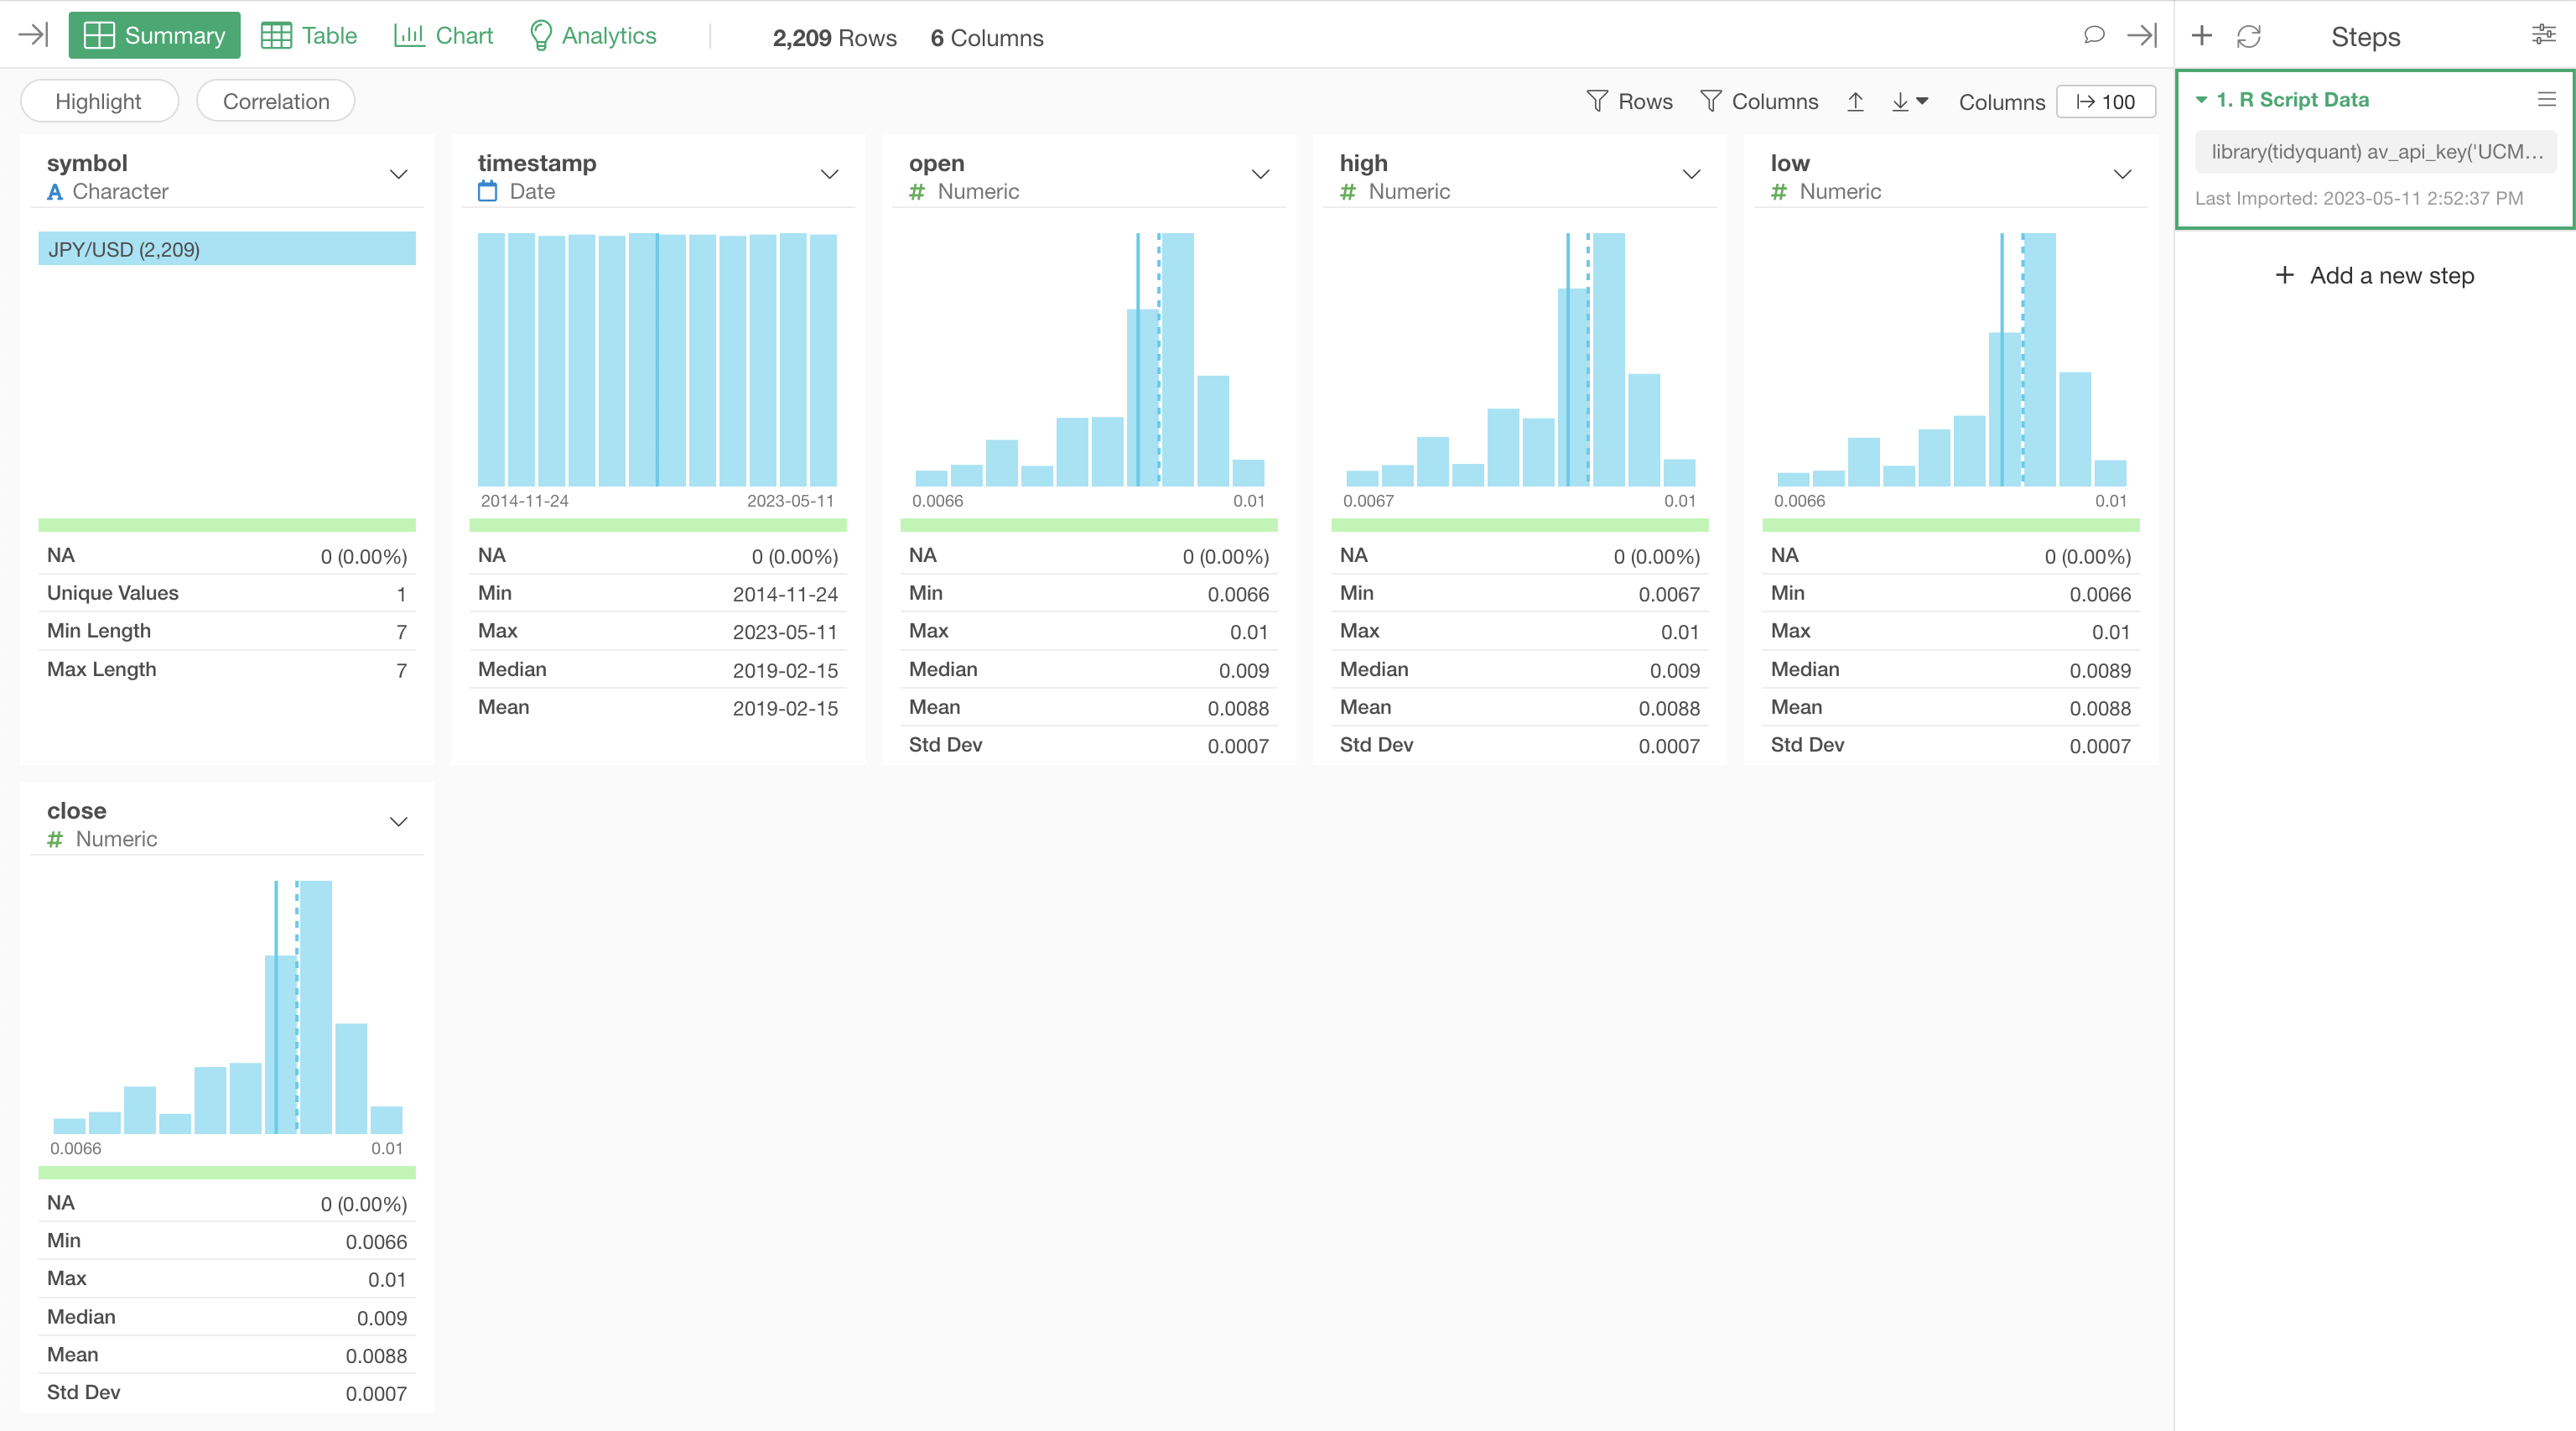
This is how it looks in Summary View.
And here's in Table View.

Get Multiple Exchange Rates Data Together
Now, here's a cool thing. You can get multiple exchange rates together by passing the exchange rate codes in the same function call.
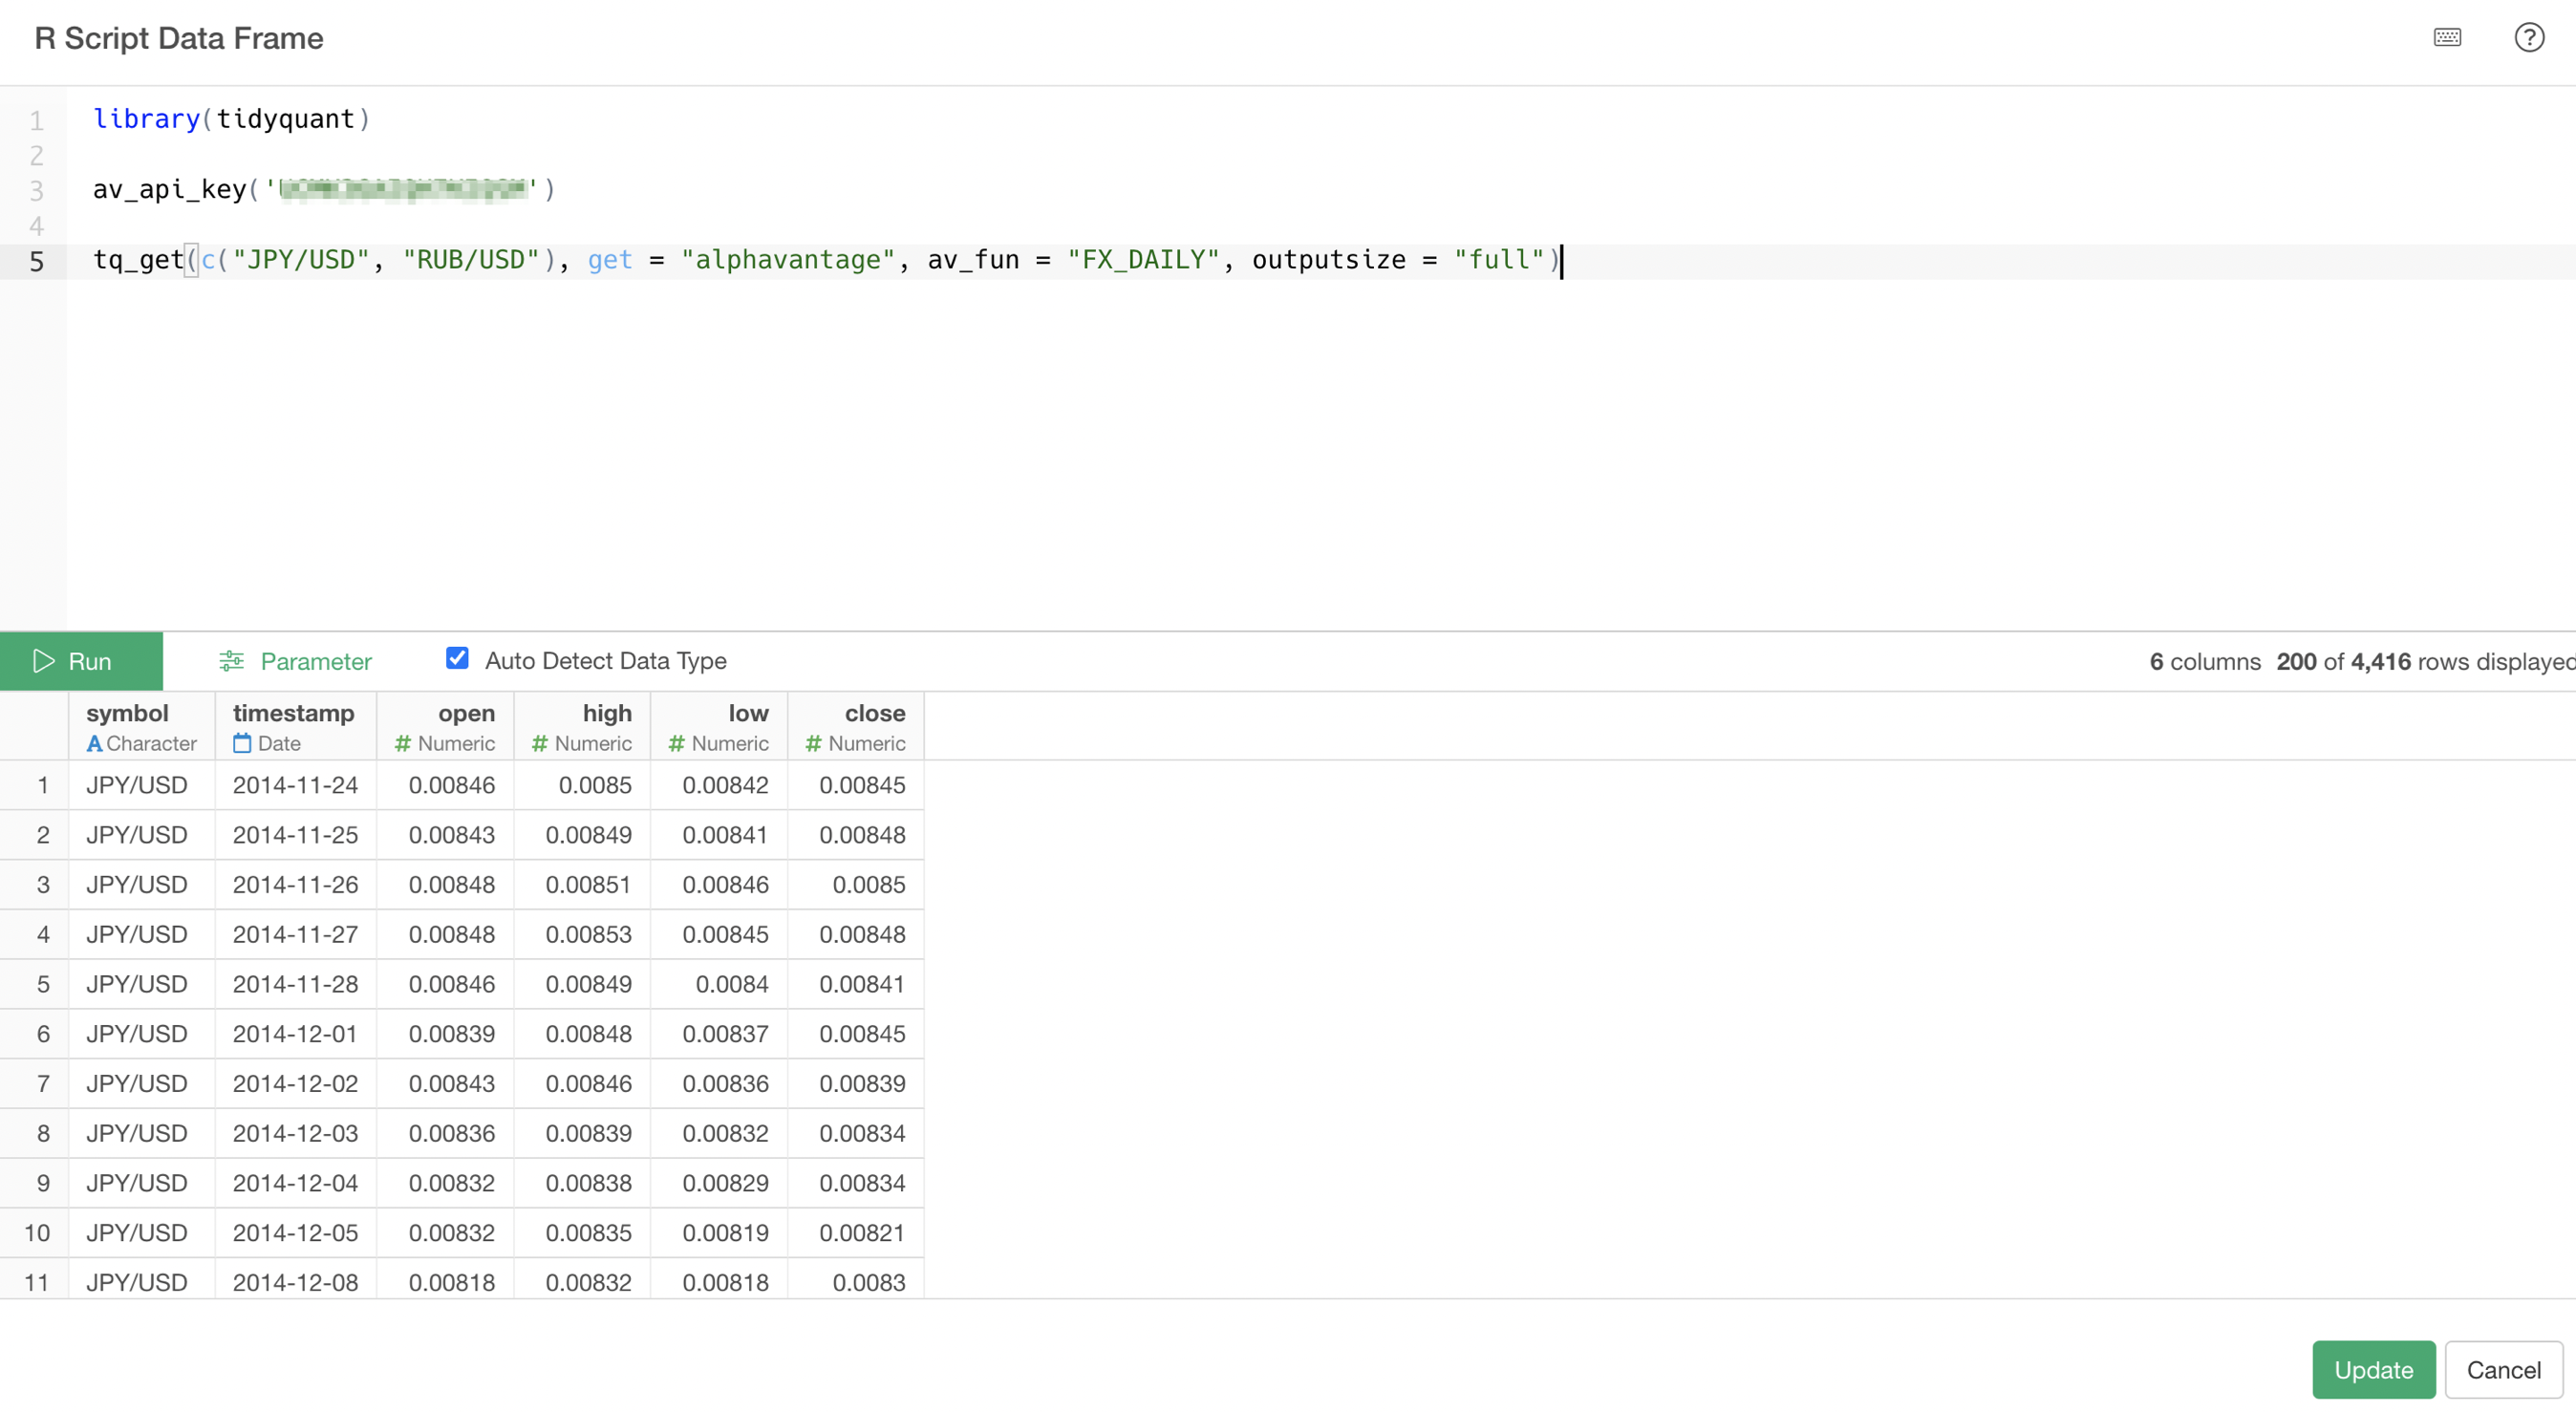
Let's say you want to get both 'Japanese Yen against US Dollar' and 'Russian Ruble against US Dollar', you can pass 'JPY/USD' and 'RUB/USD' like below.
tq_get(c("JPY/USD", "RUB/USD"), get = "alphavantage", av_fun = "FX_DAILY", outputsize = "full")Note that you want to use 'c()' function which lists multiple character data entries in R.
Once you import the data, you will see multiple exchange rates data being imported by checking the 'symbol' column.

Visualize Data
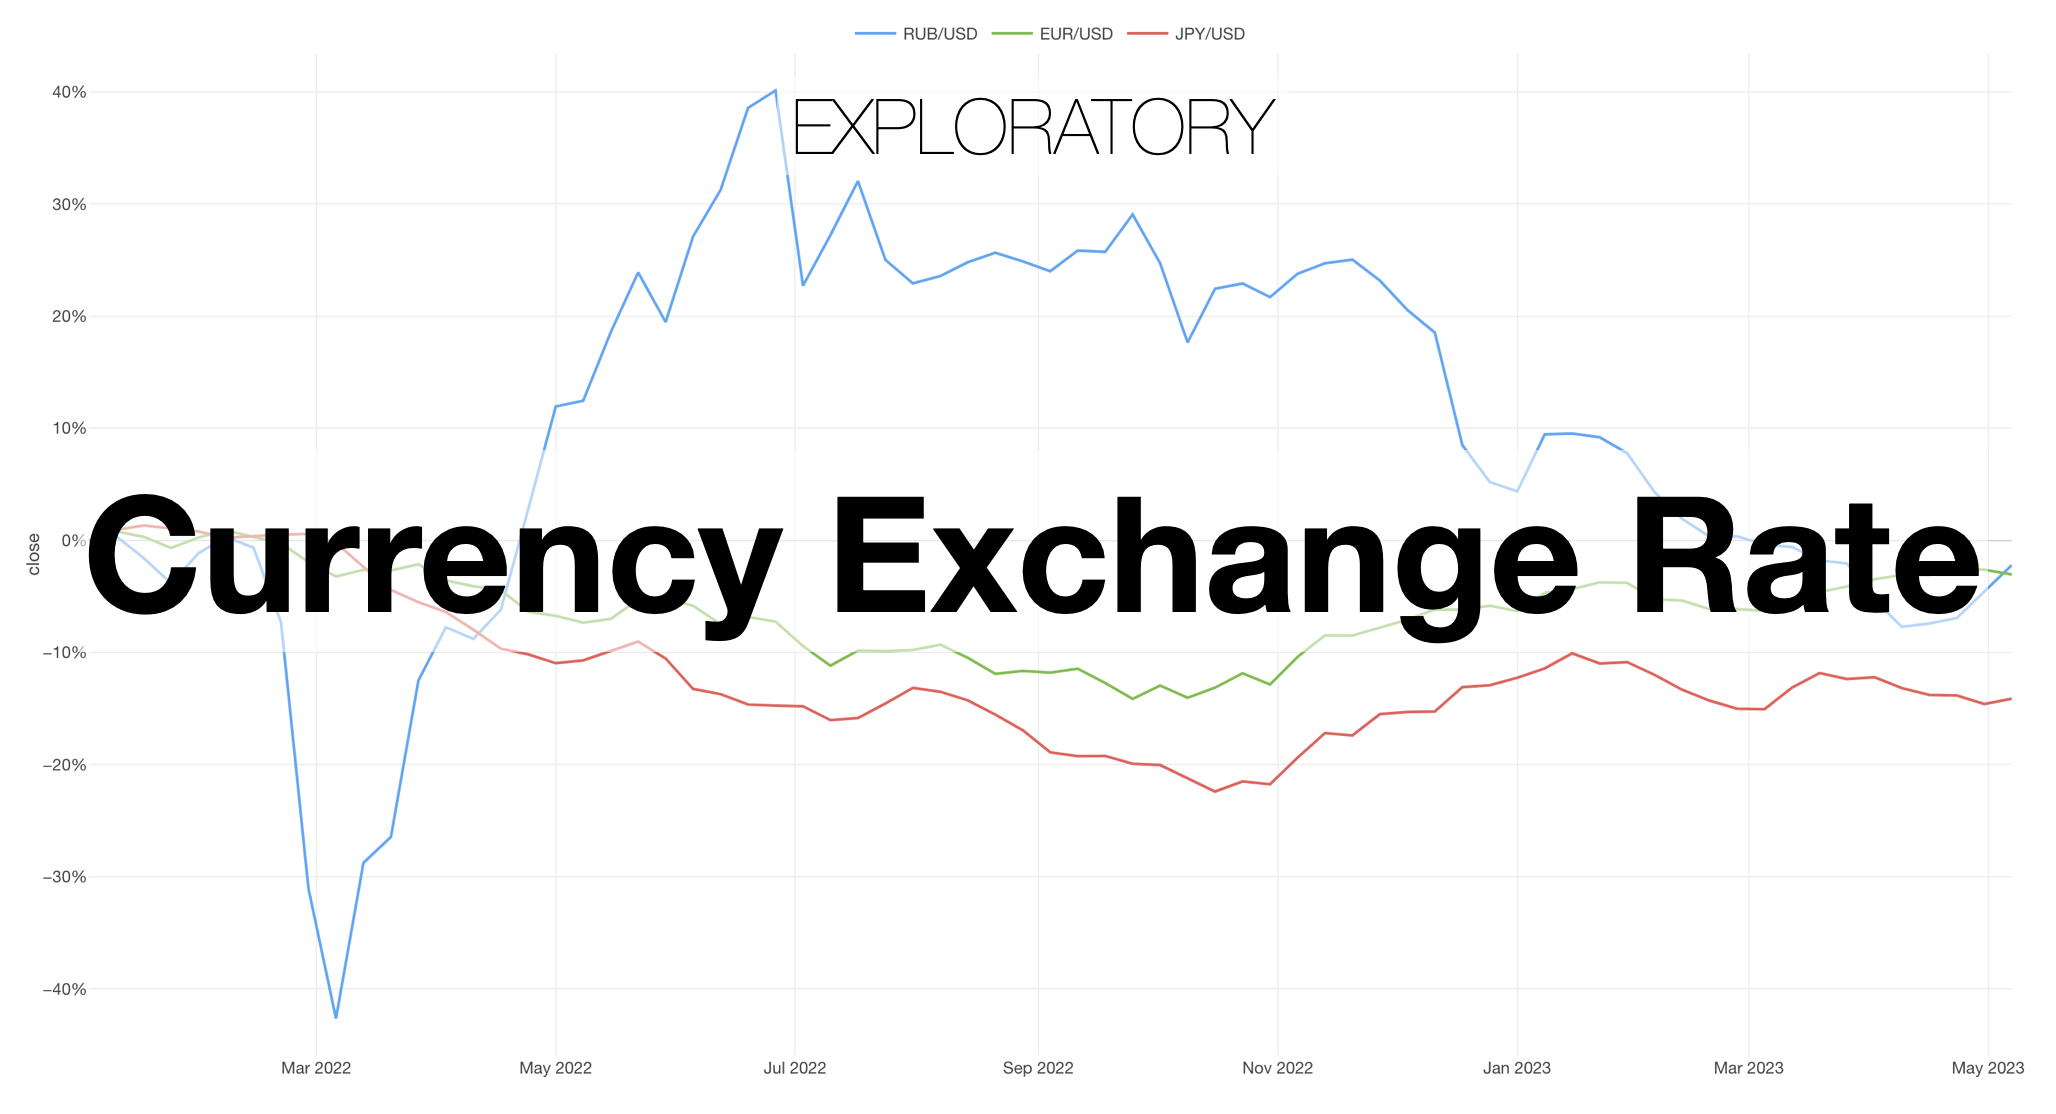
Once the data is in you can visualize the trend in various ways.
Here, I've created a chart to see how much the exchange rates have changed for Japanese Yen, Euro, and Russian Ruble against US dollar since the beginning of 2022.

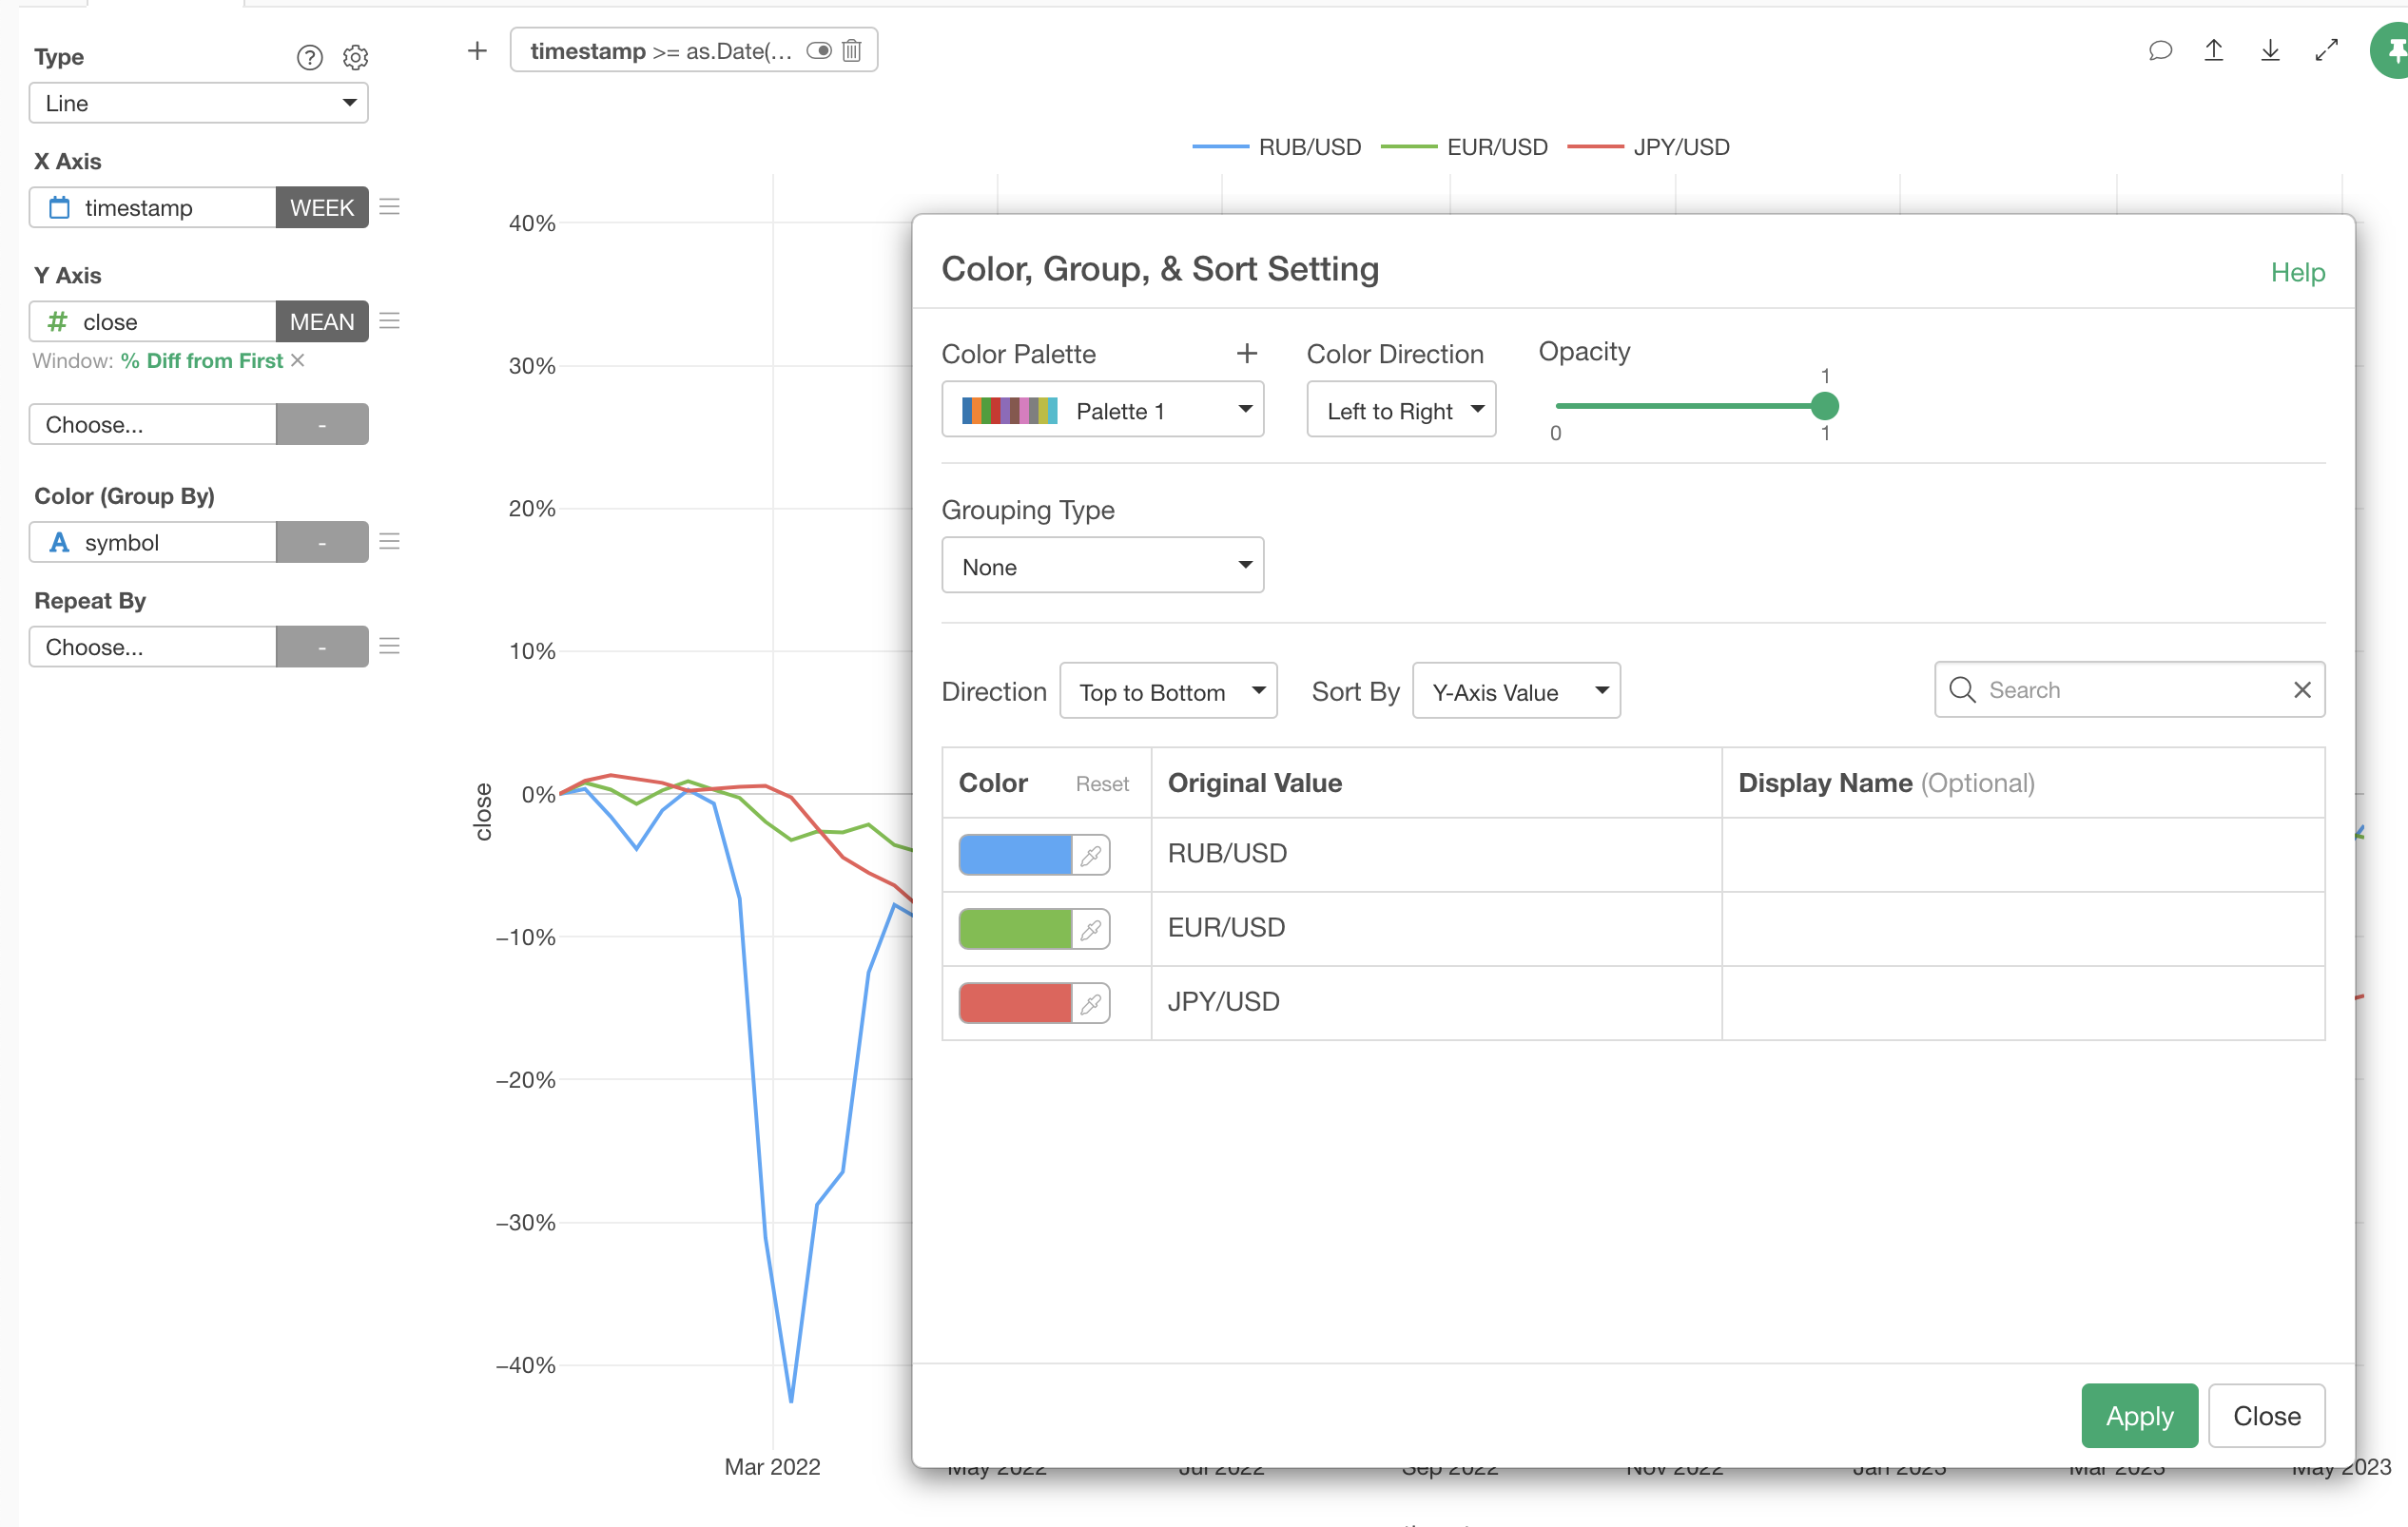
I've created a filter to limit the data only after '2022-01-01'.

And I've used a '% of Difference from First' of the Window Calculation family.
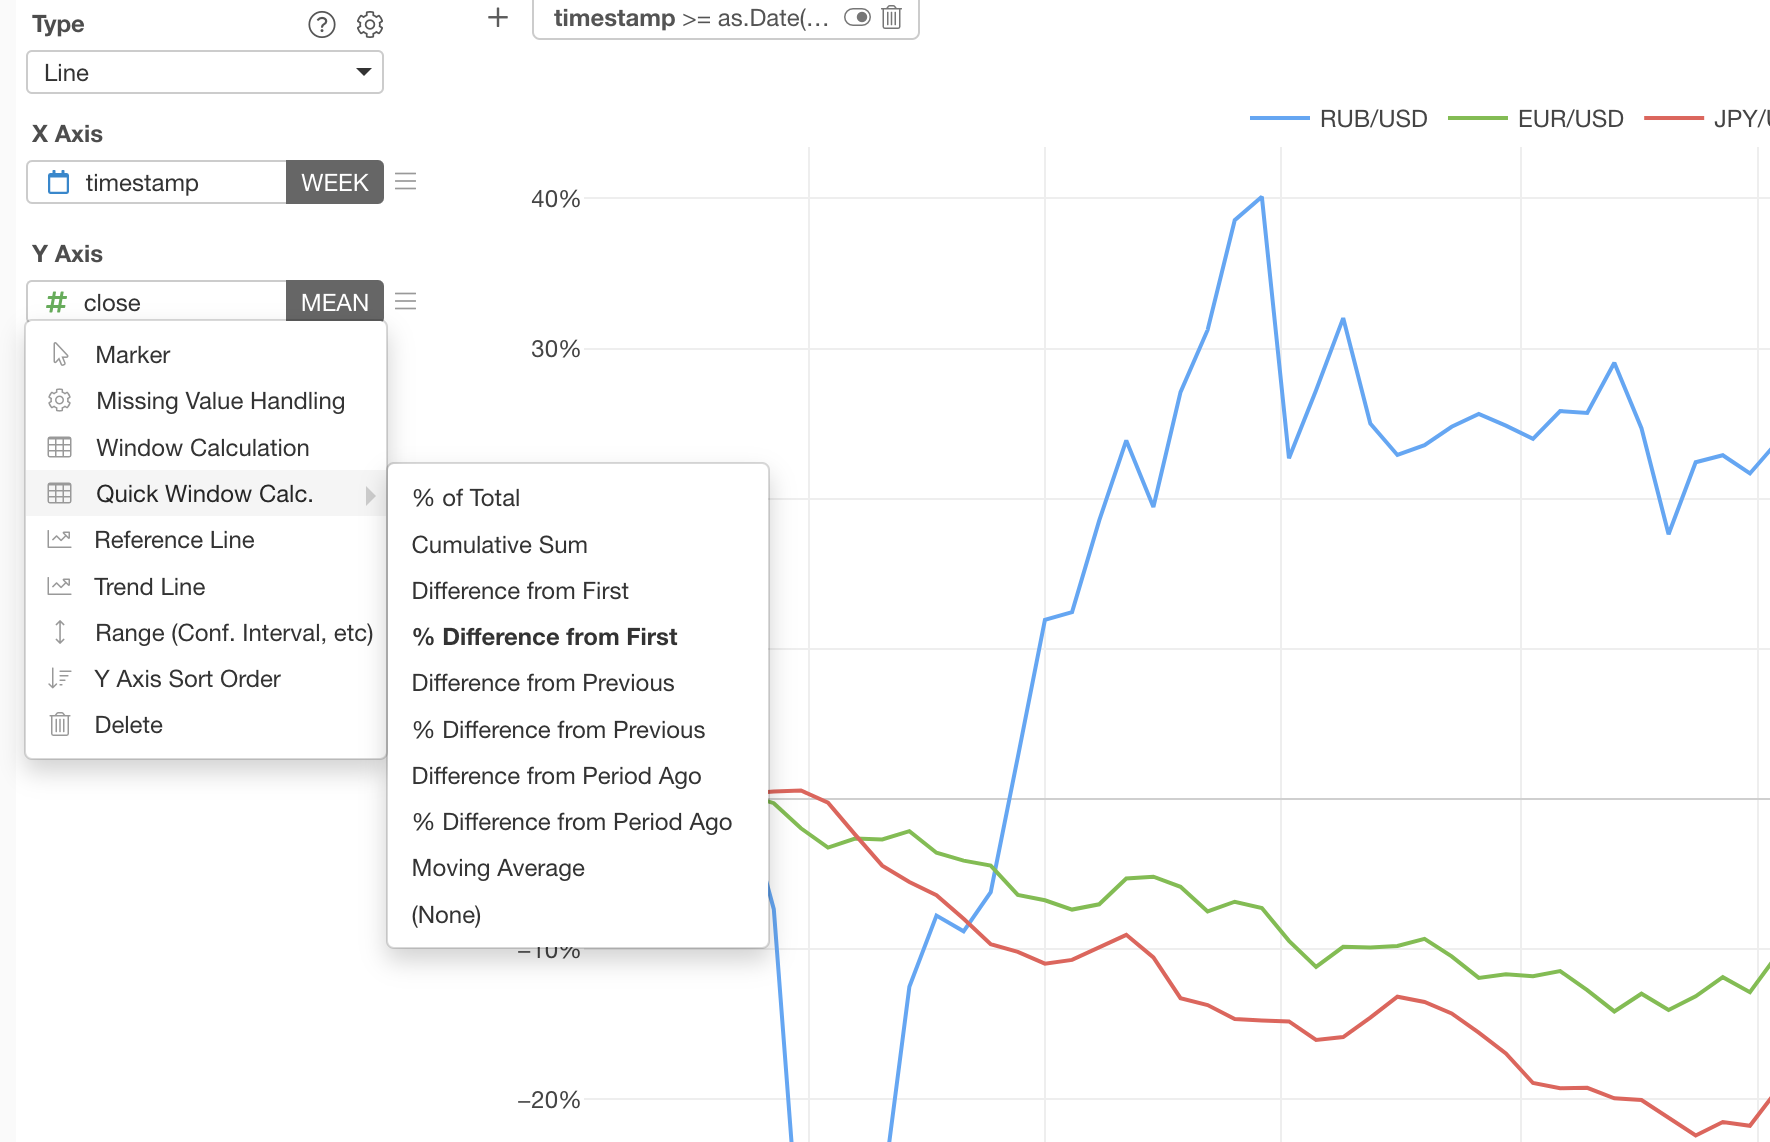
And lastly, I've assigned specific colors to those 3 currencies.