How to Import GeoJSON Files into Exploratory and Use Them in Map Charts
By default, Exploratory supports maps for various countries around the world, U.S. states, and Japanese prefectures, among other administrative divisions.
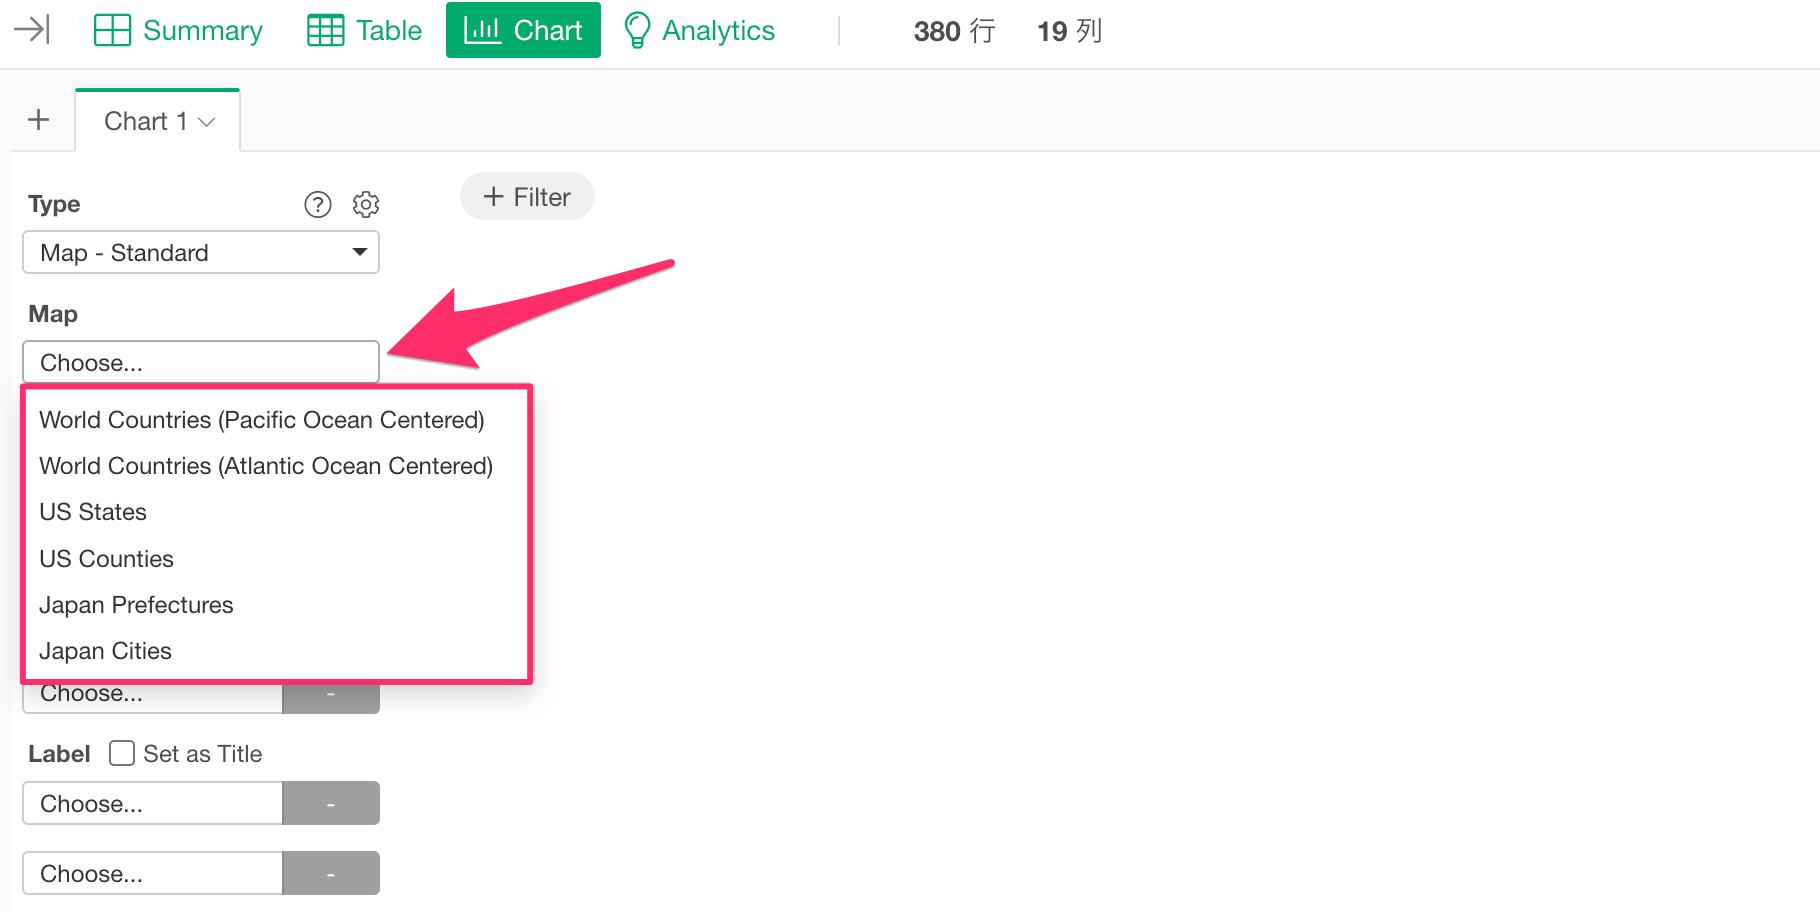
However, since there are diverse countries and regions globally, there are cases where you may want to visualize information using regional divisions that are not supported by default.
In such cases, you can import a GeoJSON file (a file format for representing spatial data such as geographical boundaries and coordinates in JSON format) into Exploratory. This allows you to import maps of countries or regions not supported by default and use them as maps to visualize administrative divisions or geographical boundaries for those areas.
In this section, we will introduce how to import and use GeoJSON files in Exploratory.
Importing GeoJSON Files
To use a GeoJSON file, open any data frame, go to the Chart view, and select “Map - Extension” as the type.
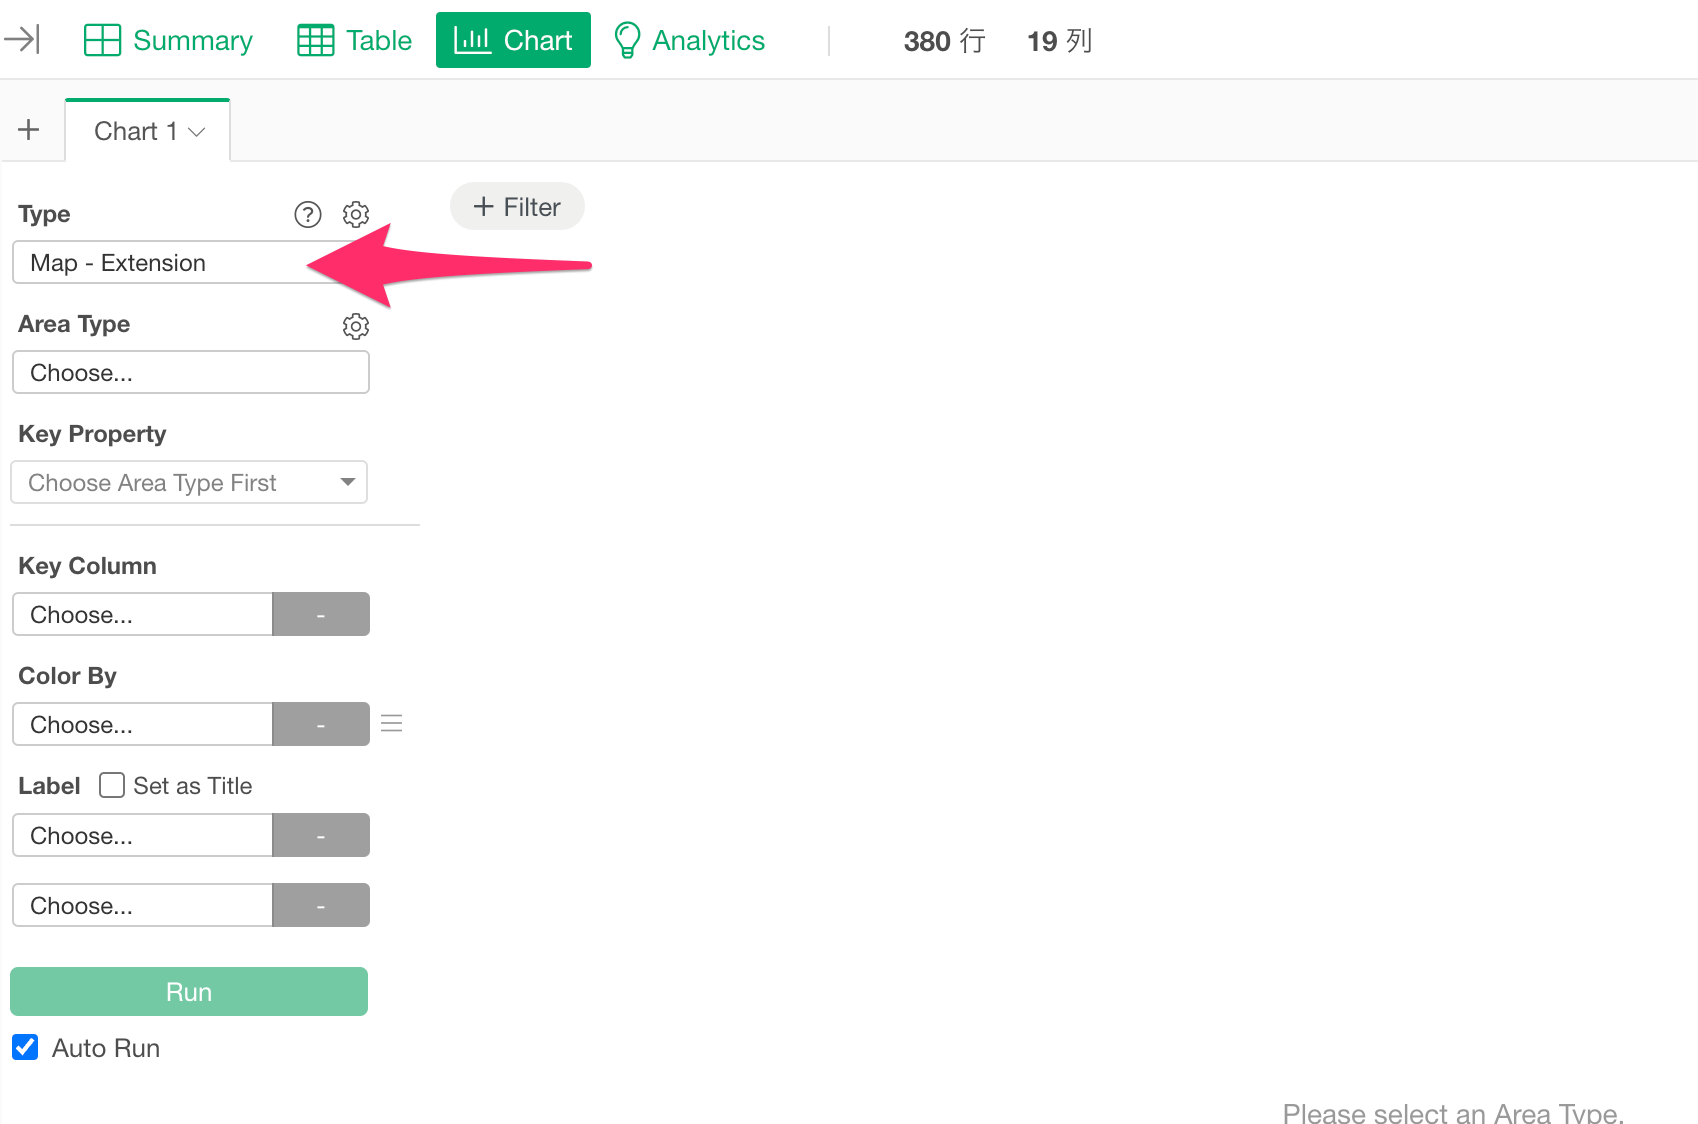
Next, click the gear icon next to the Area Type.
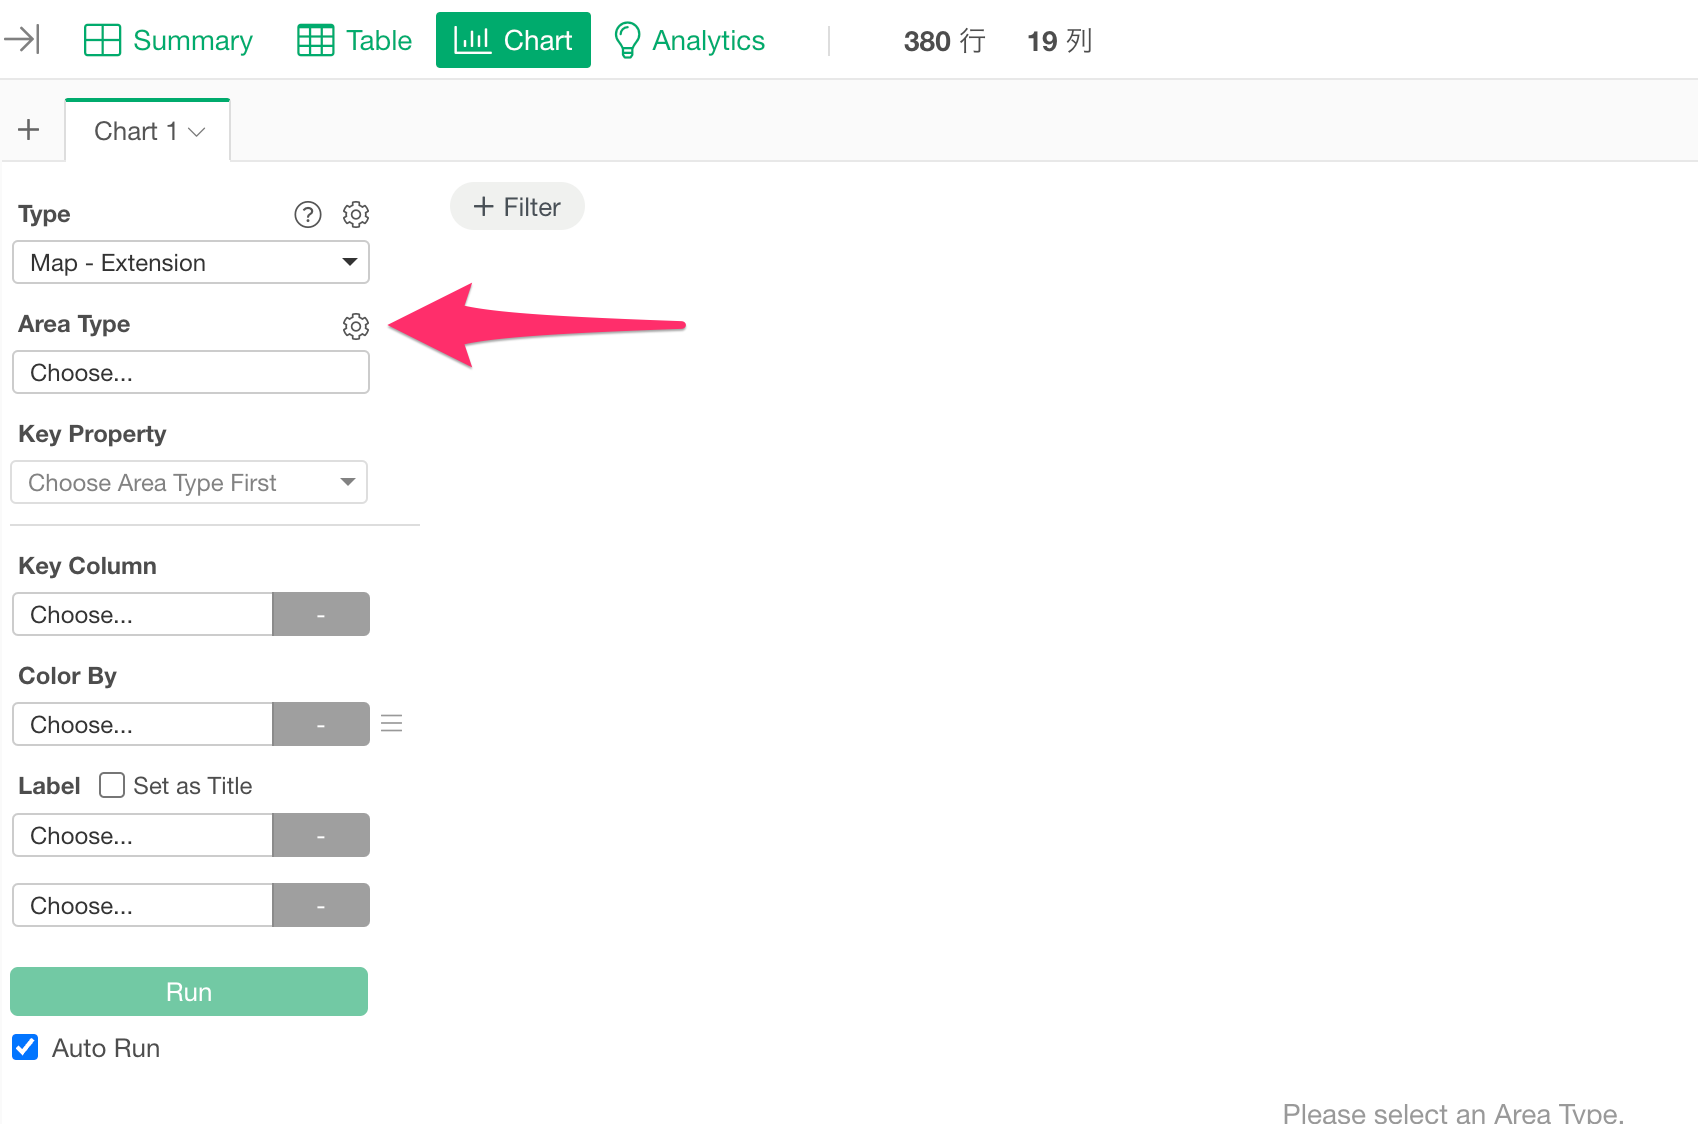
This will open the Extension dialog, where you can add a new map.
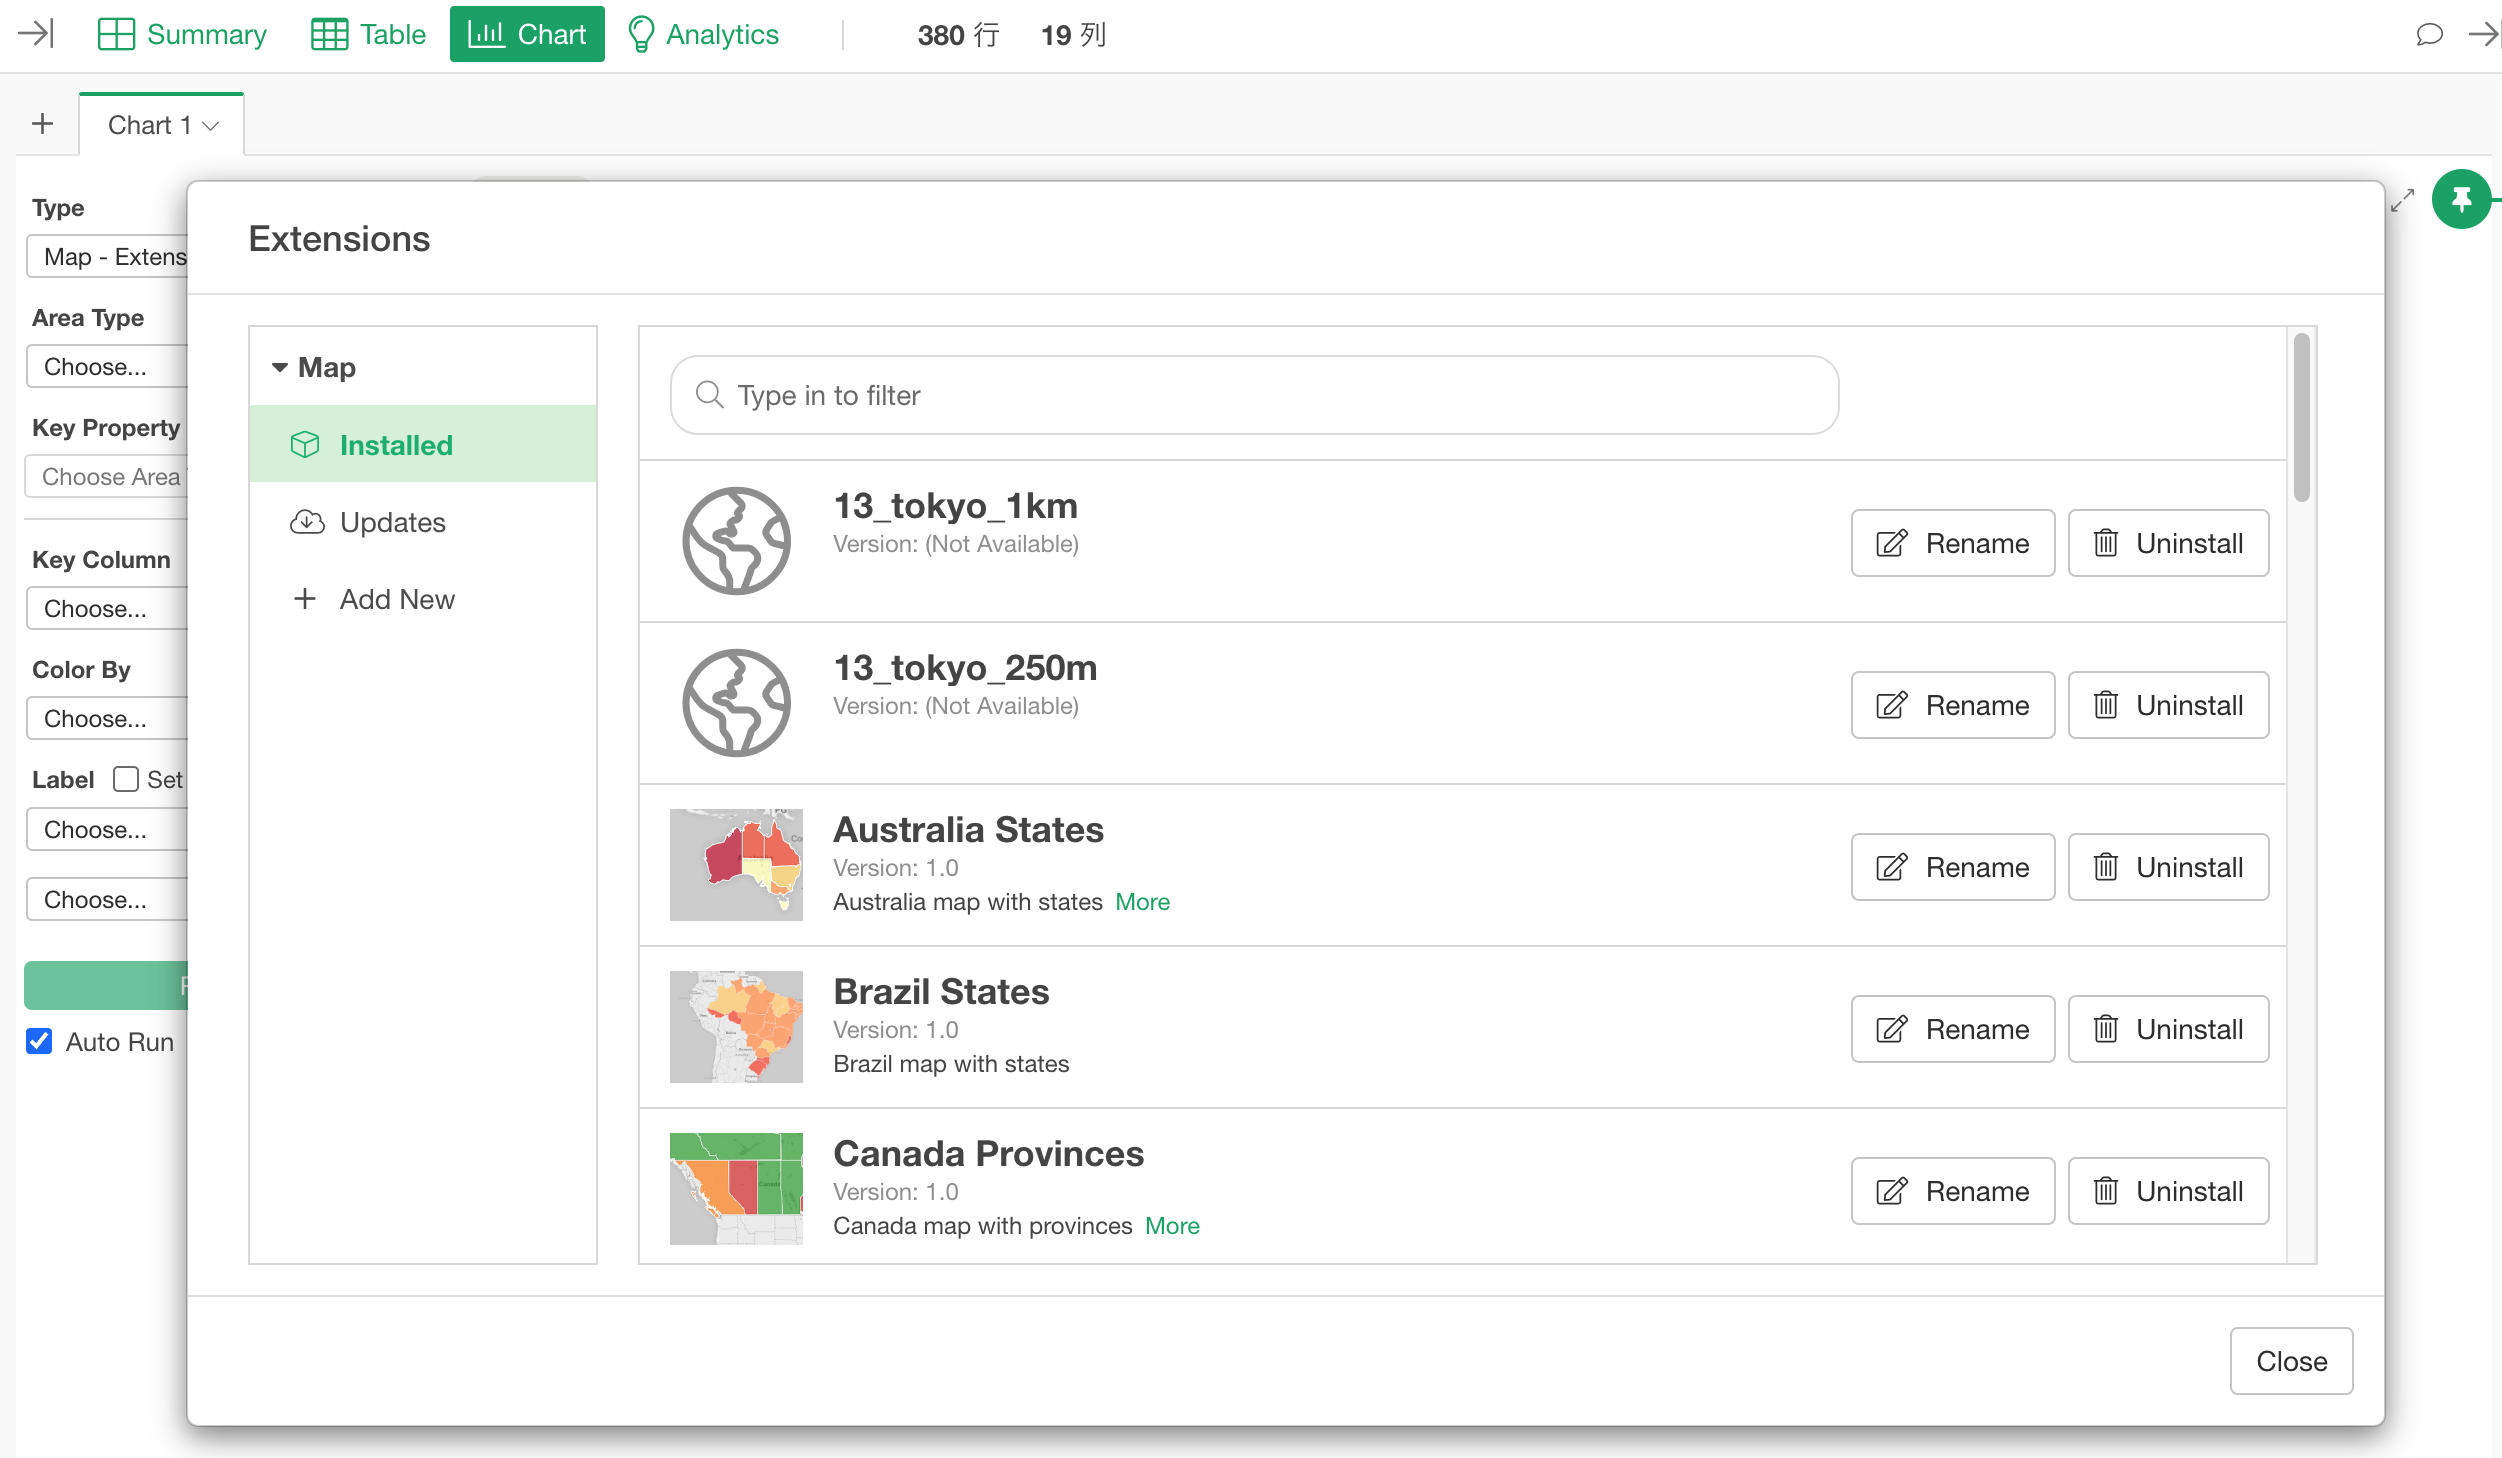
By default, map information is displayed under “Installed.” If nothing has been installed yet, this area will be empty.
To add a new map, click the “Add New” button.
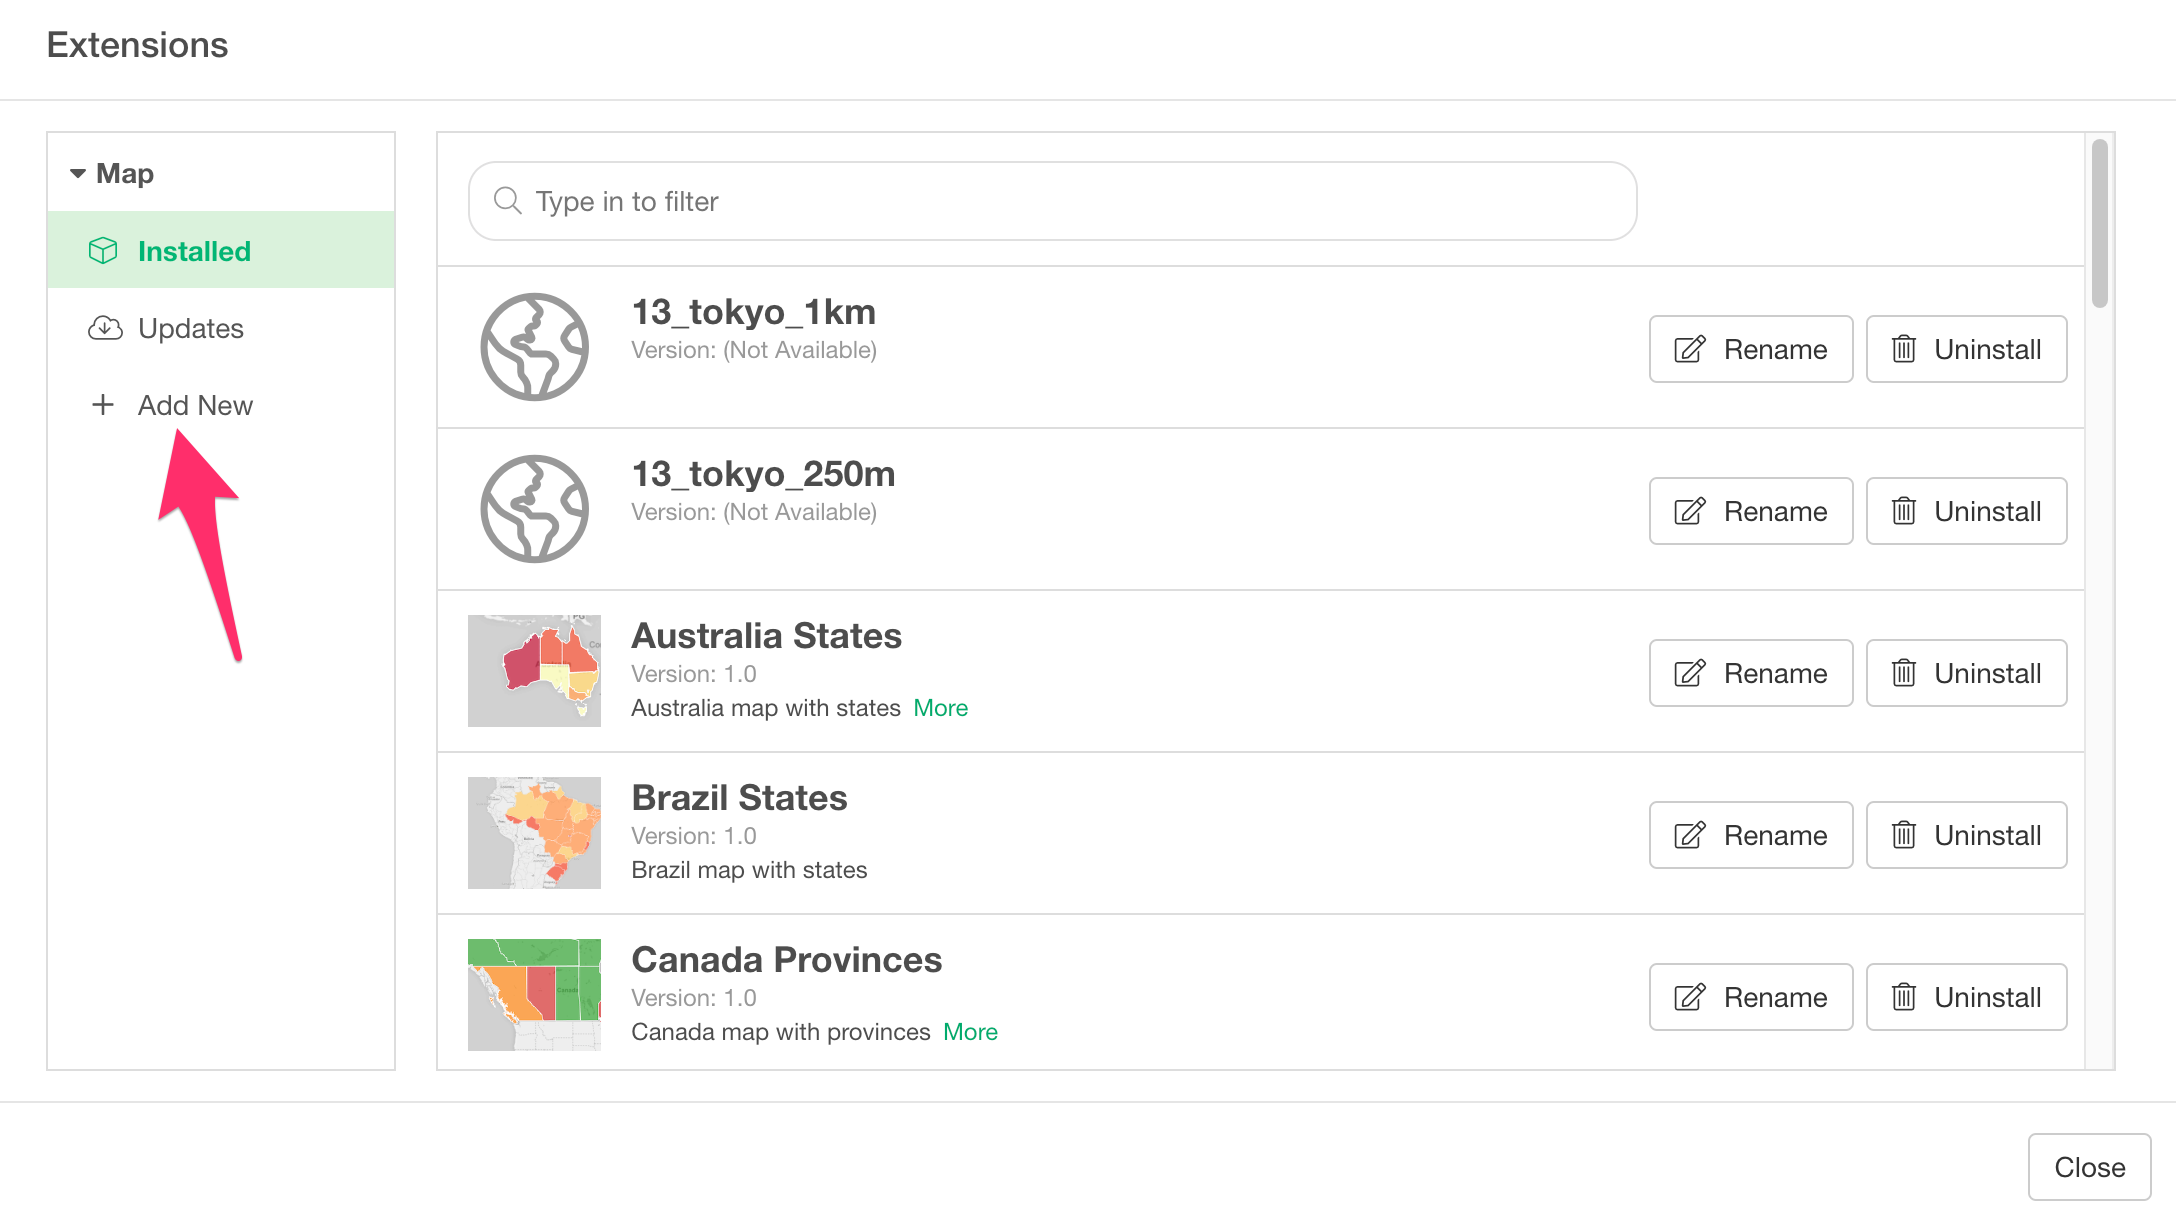
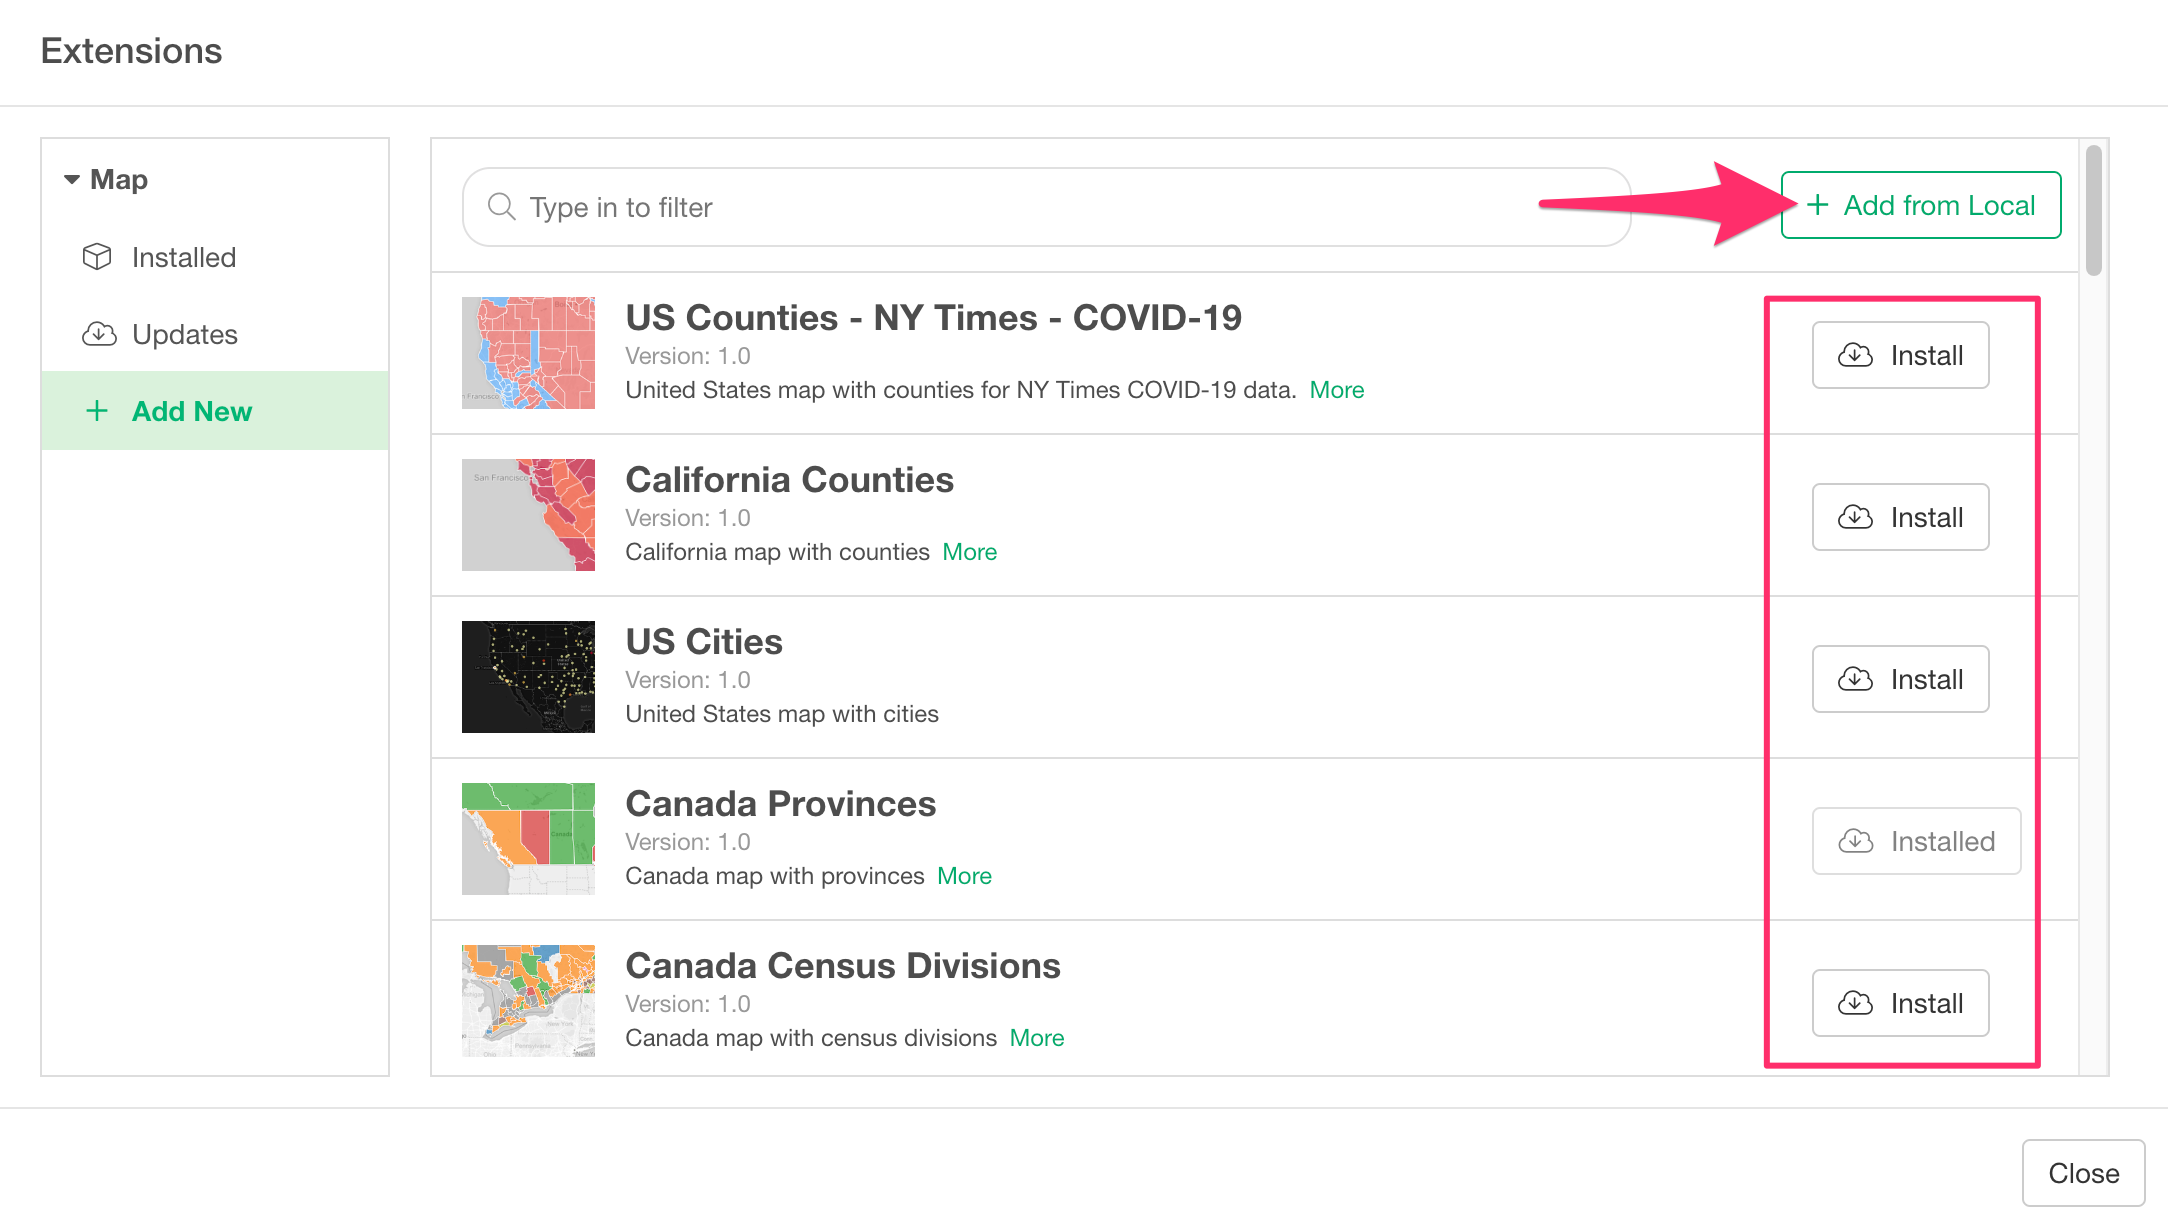
Clicking the “Add New” button will switch the screen, allowing you to select and add map information hosted by Exploratory or a GeoJSON file from your local machine.
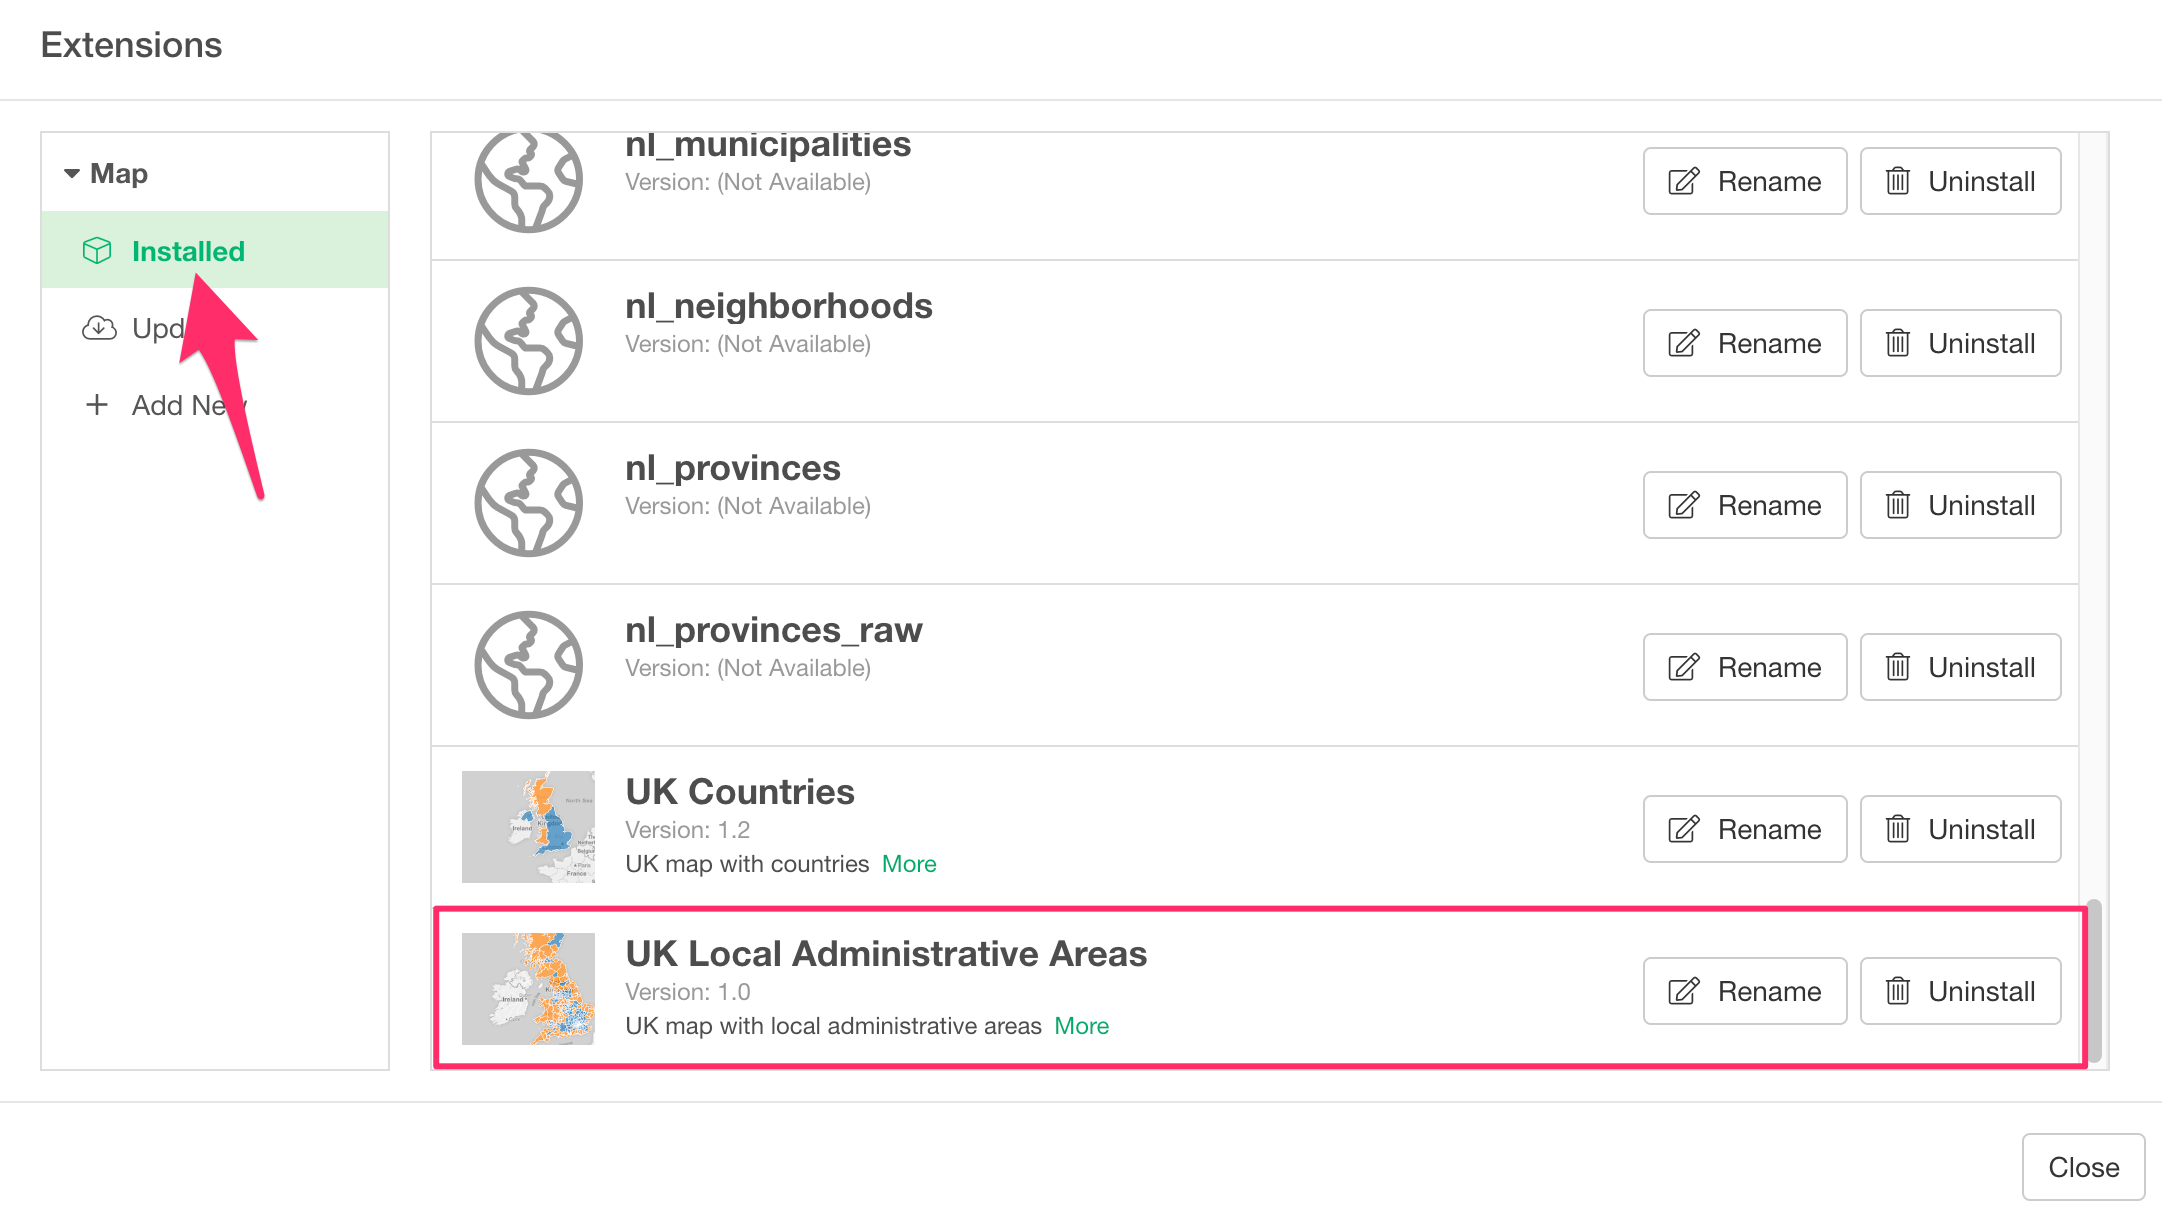
For example, if you want to import a map of UK administrative divisions hosted by Exploratory, click the “Install” button for the UK administrative divisions, and the data will be imported.
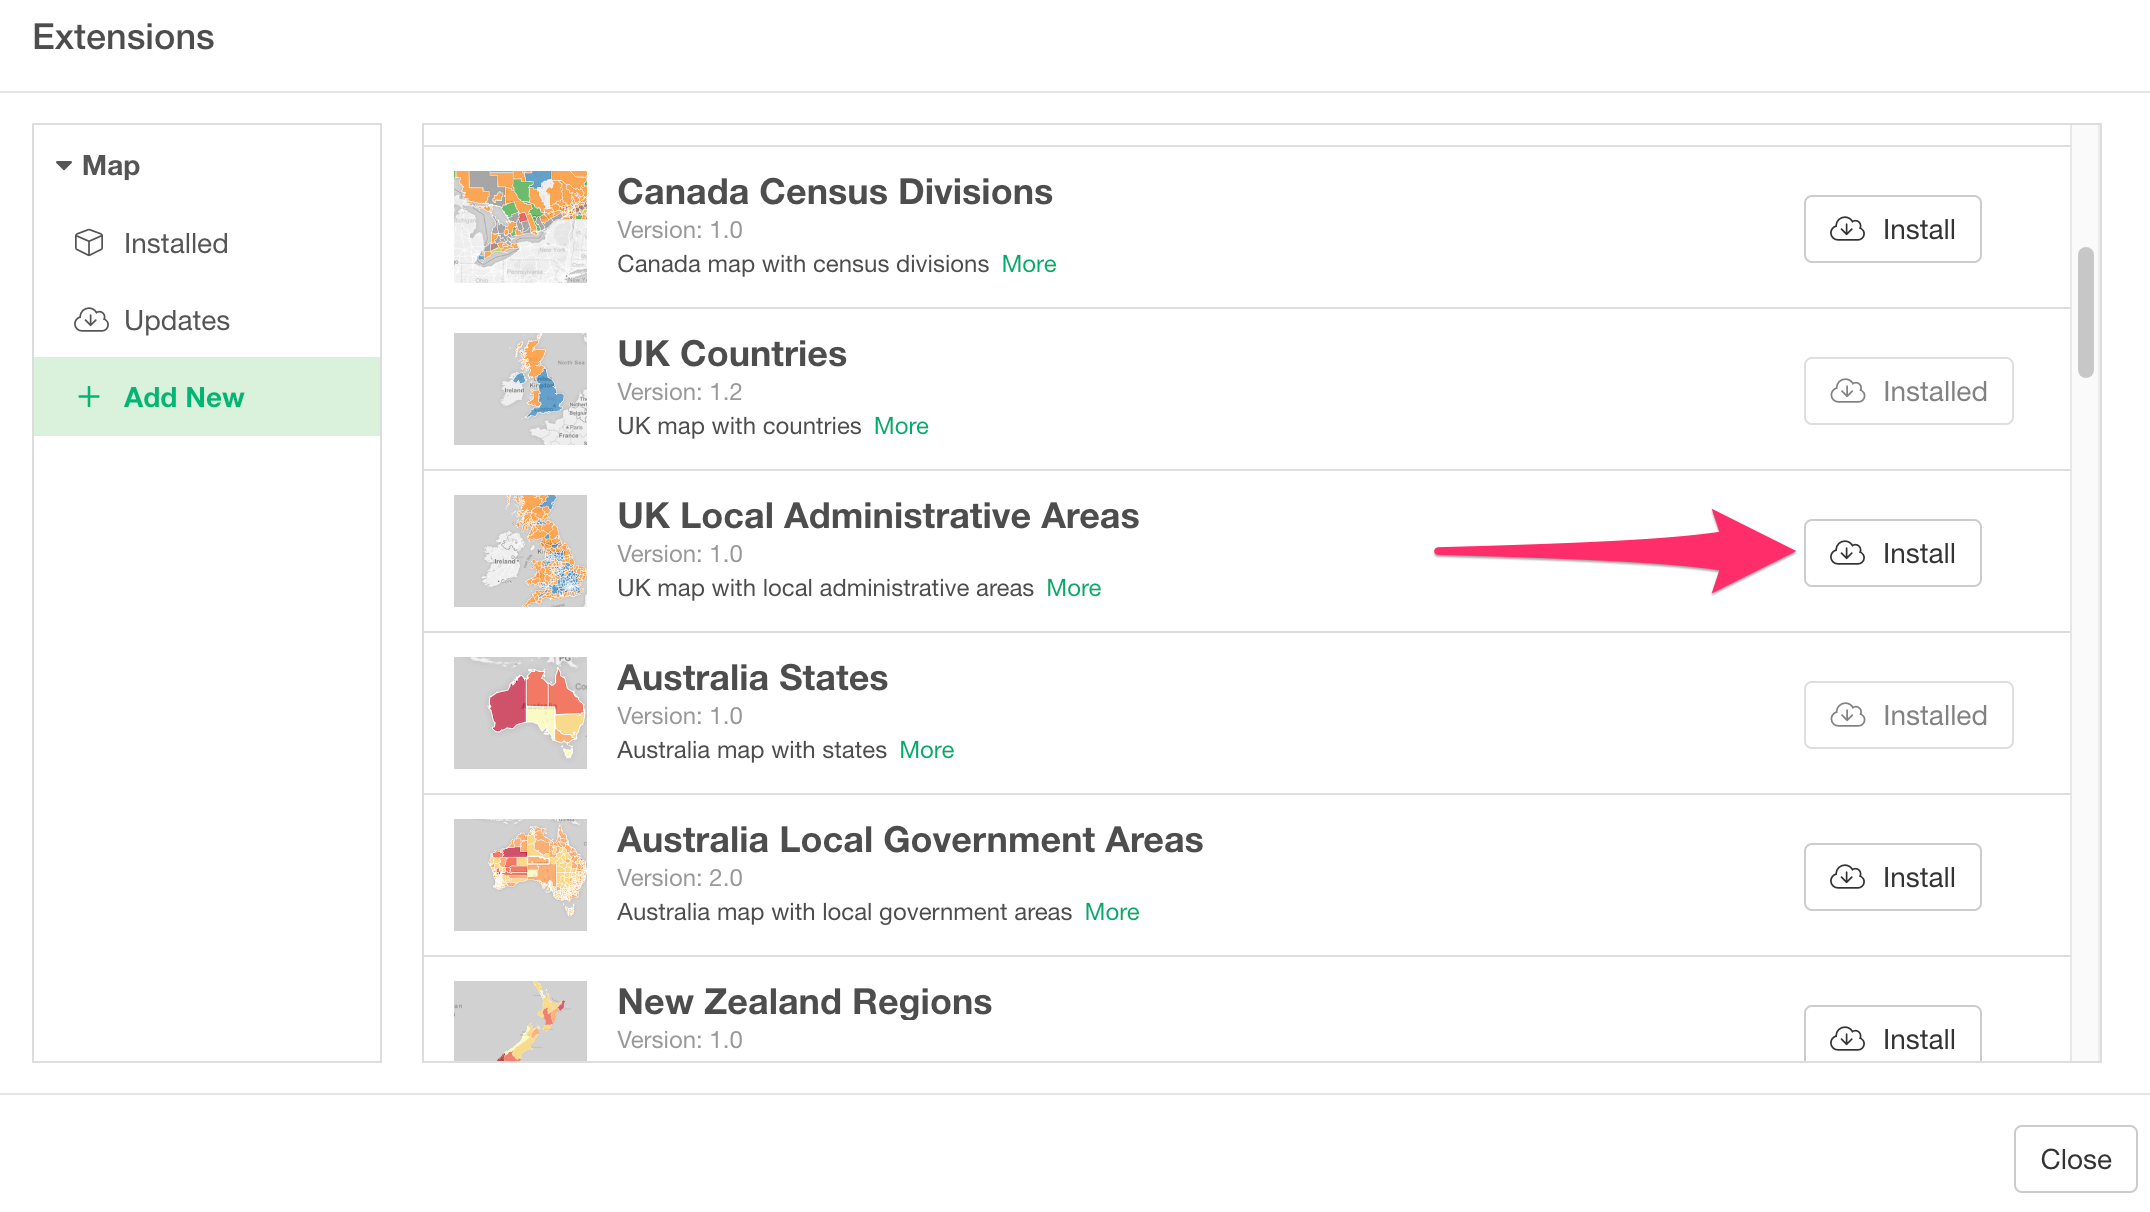
Once the UK administrative division data is imported, the map will appear under the “Installed” section.
Visualizing Geographical Information Using Imported GeoJSON Files
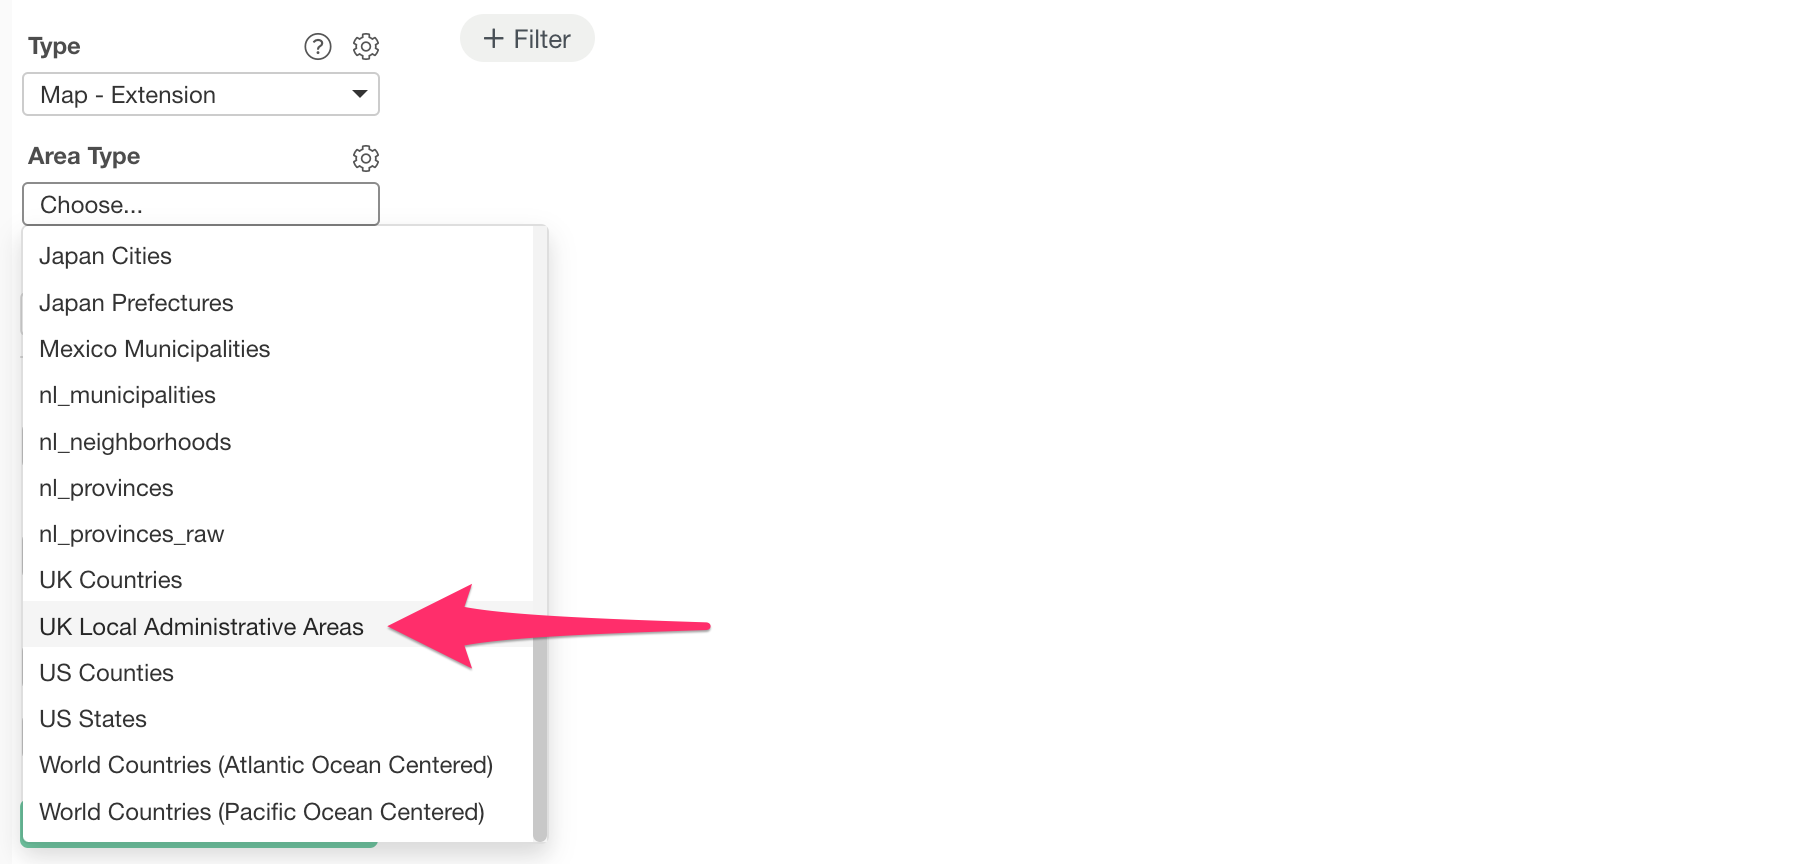
After closing the Extension dialog, the imported map information will be available in the Area Type dropdown.
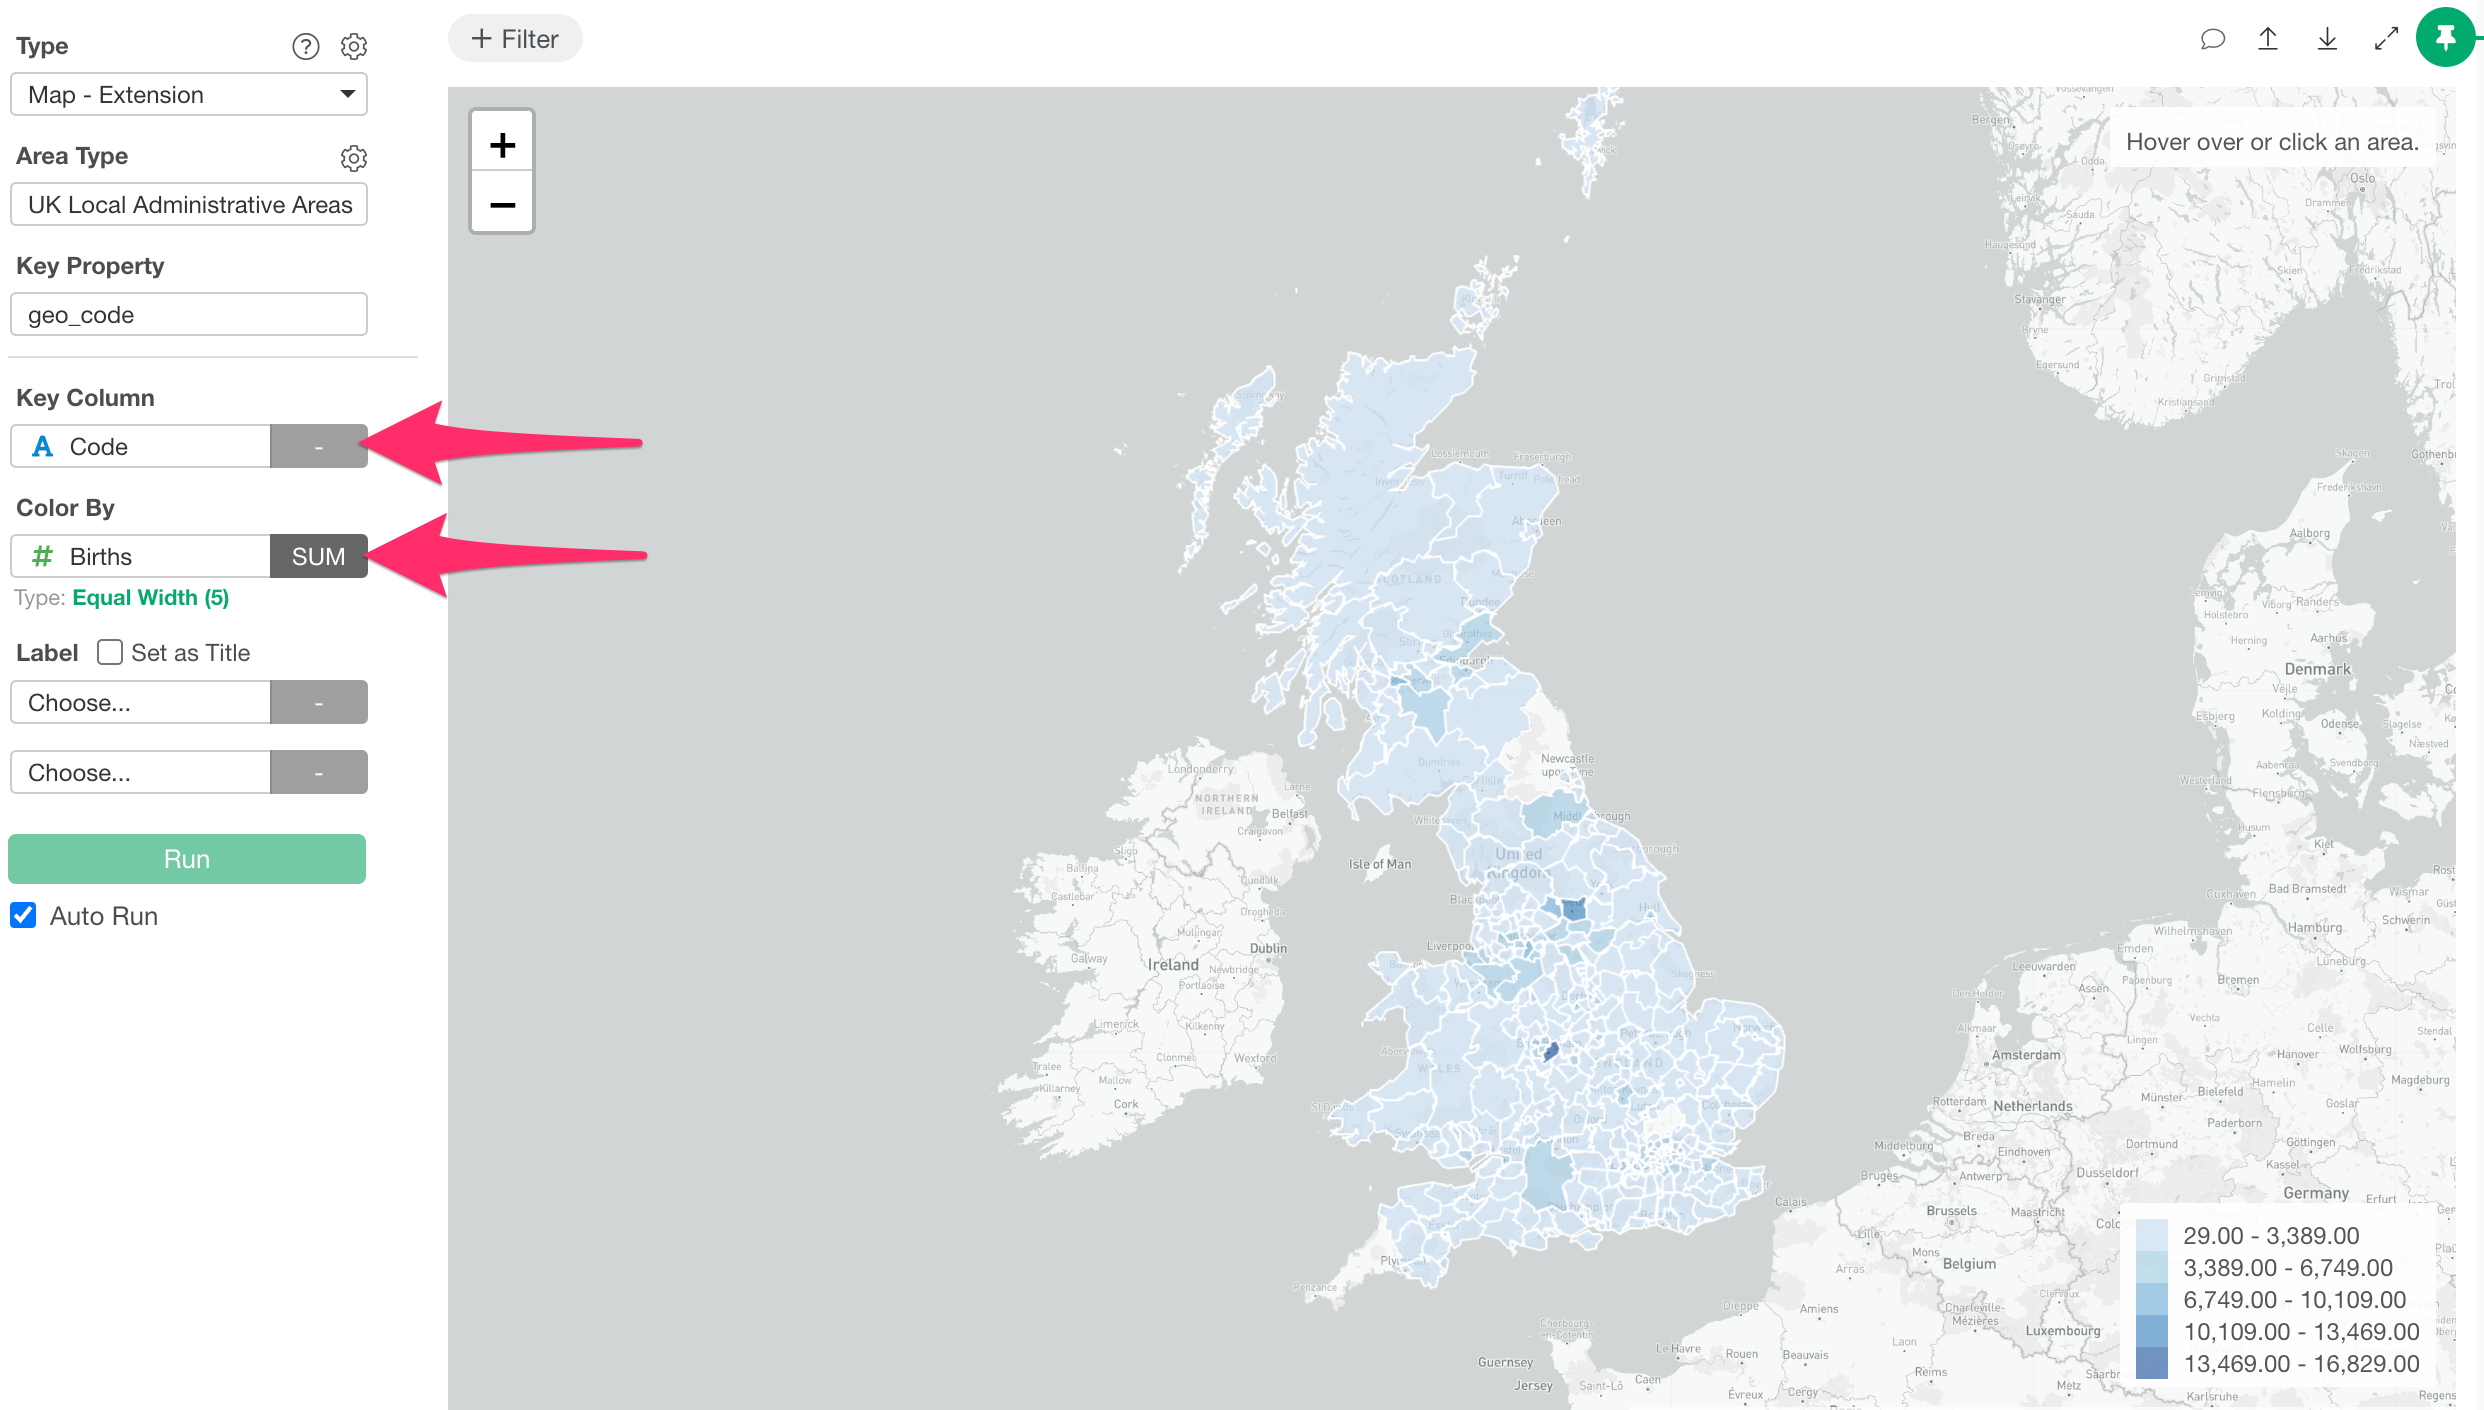
In the Key Property, you specify the key information defined in each GeoJSON file used to visualize geographical information.
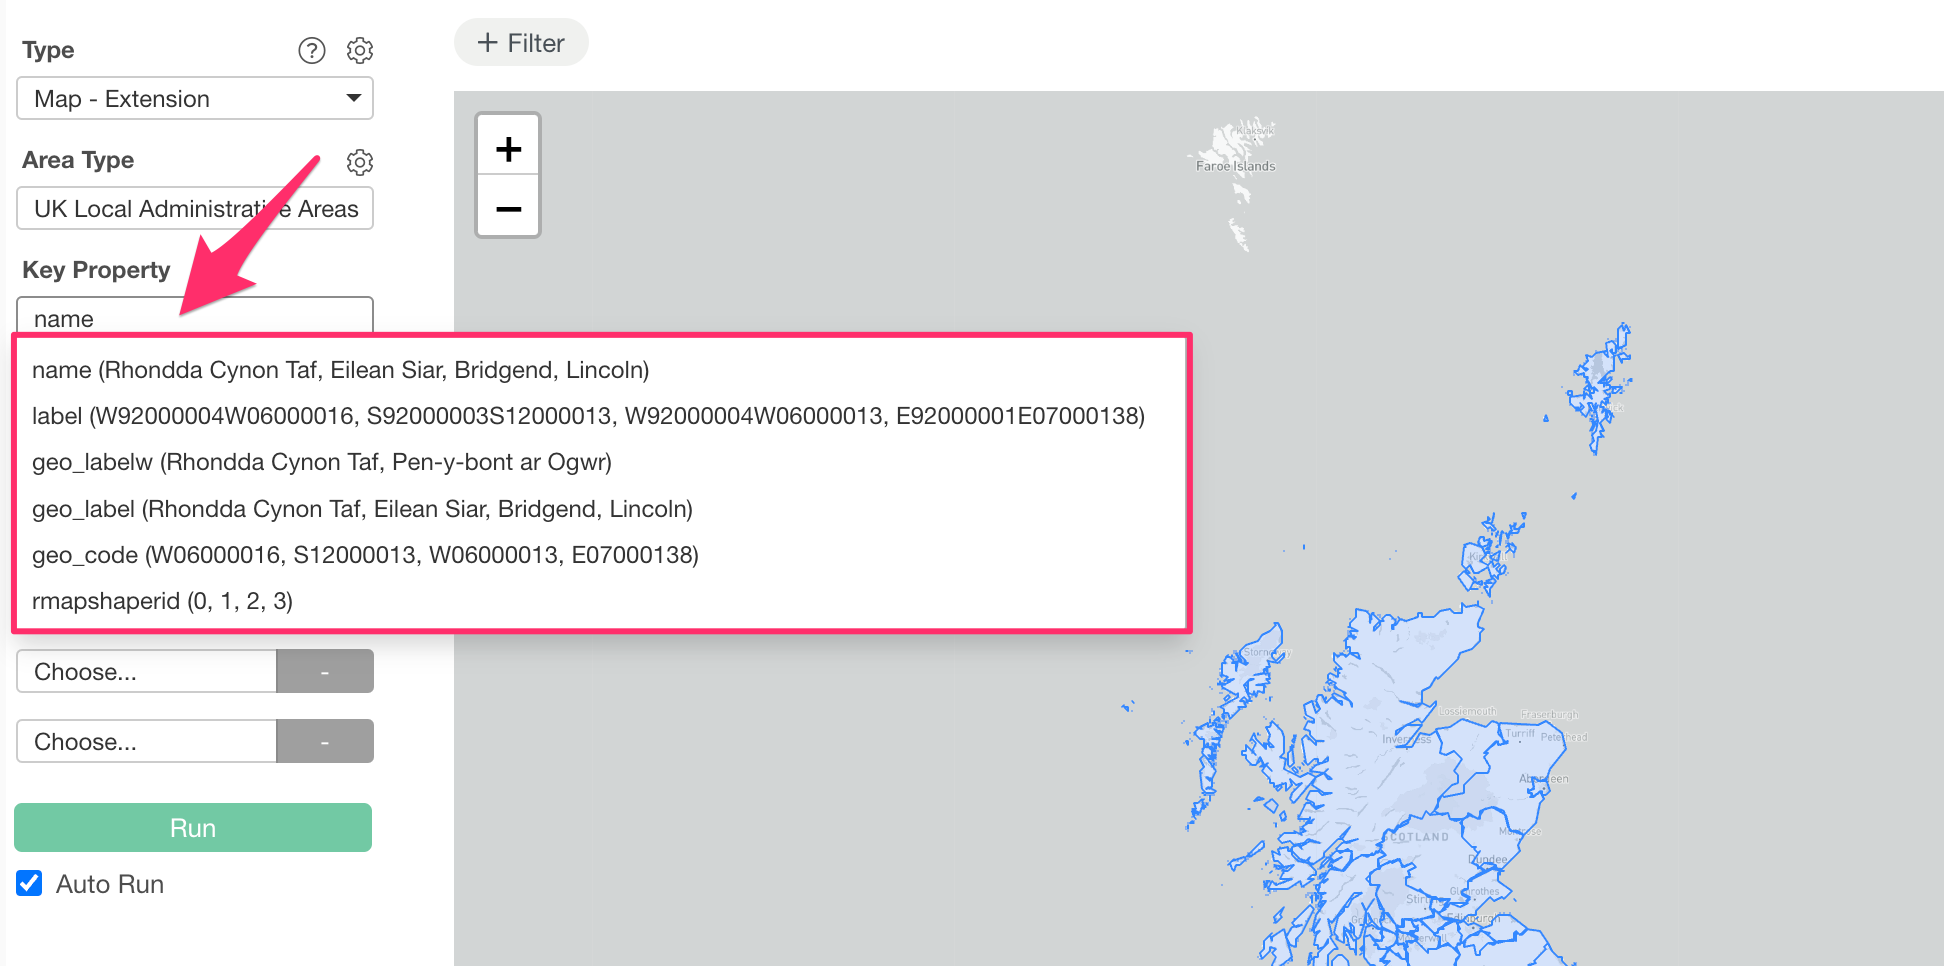
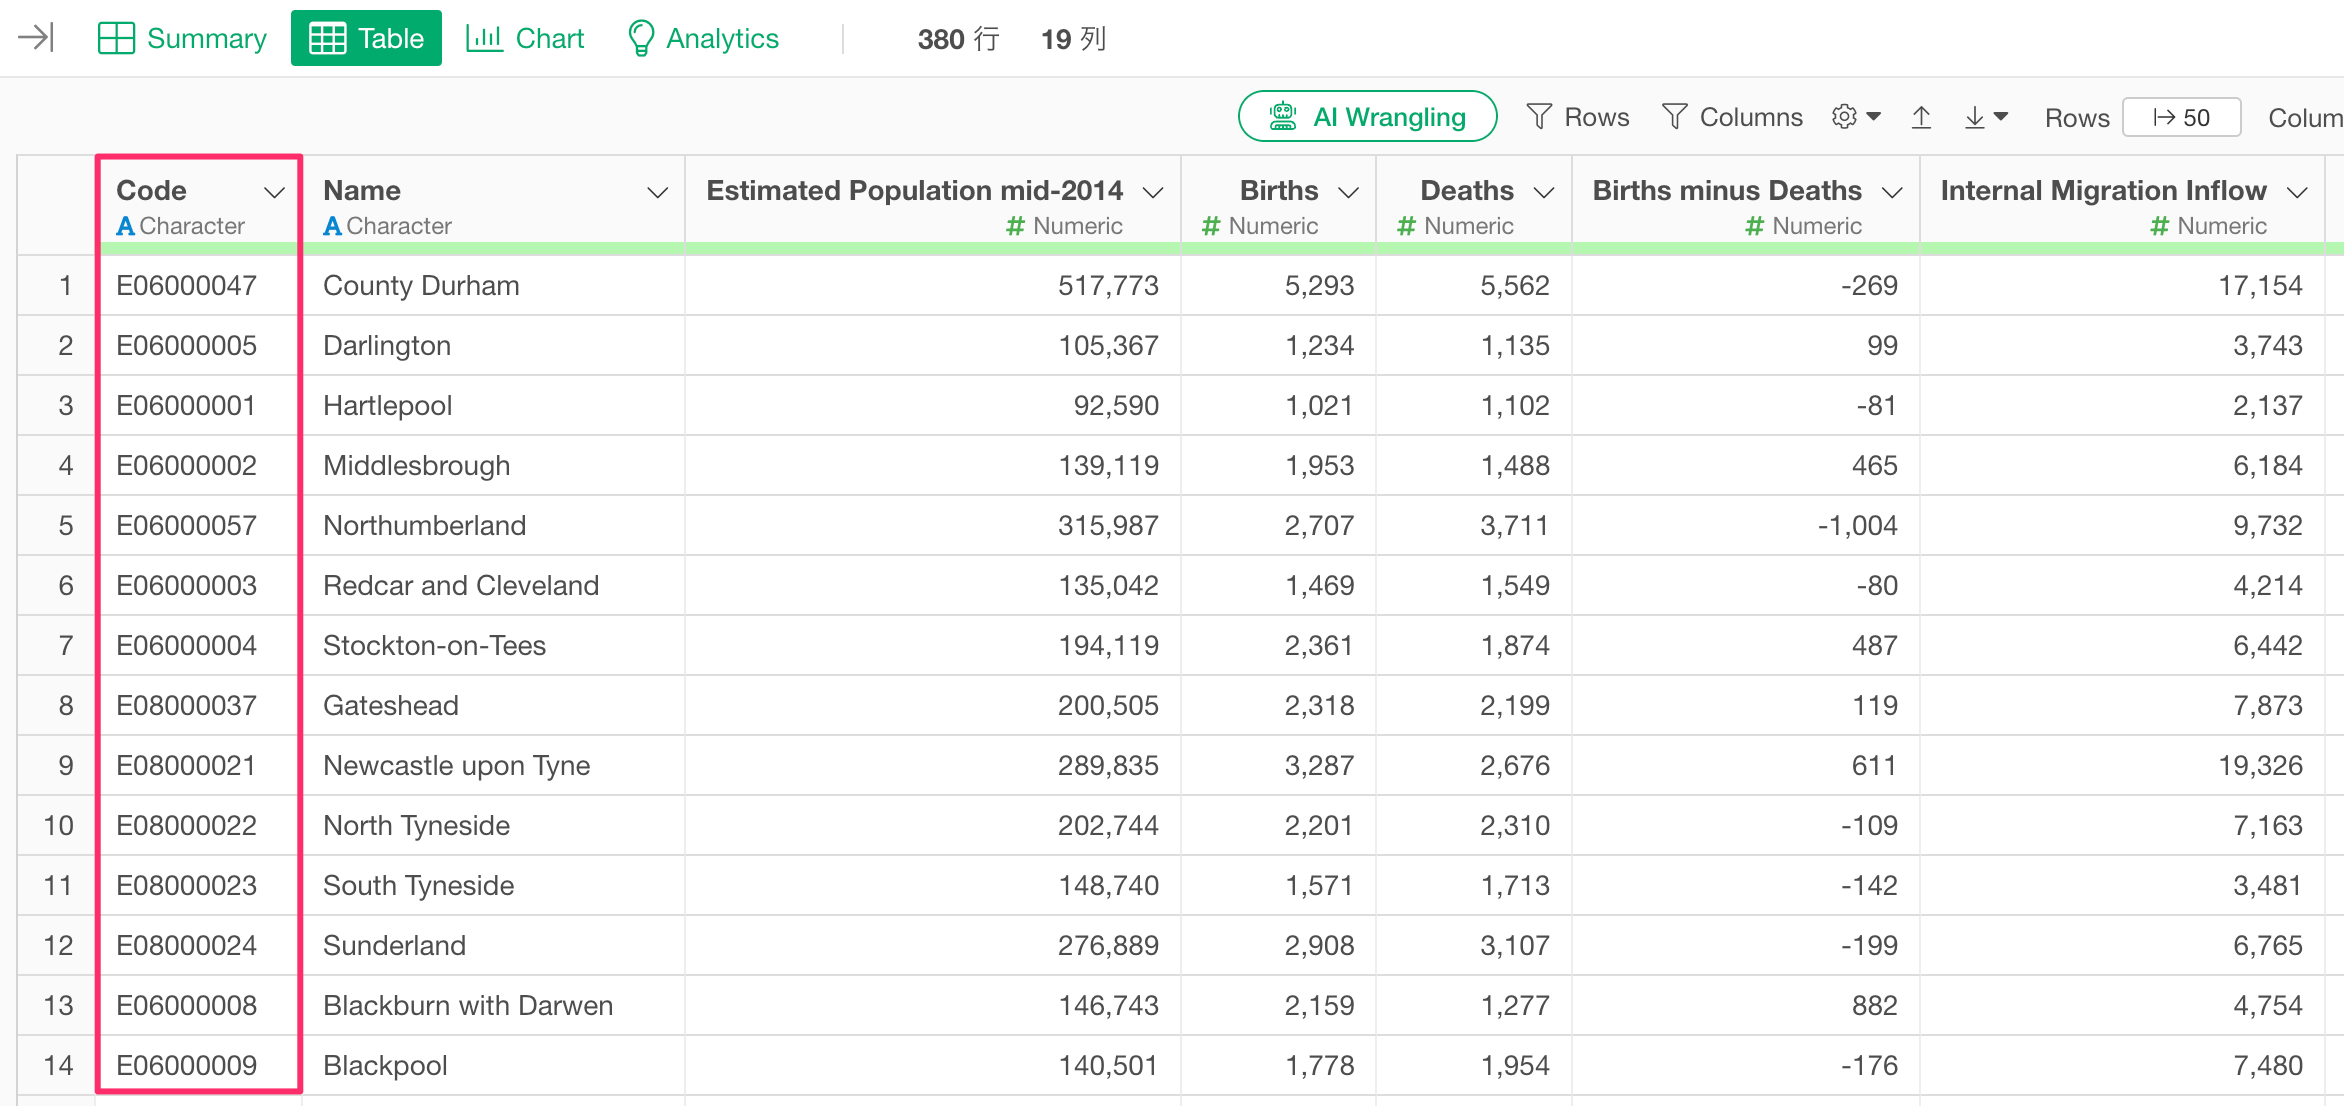
For example, suppose you have administrative division codes in your data (in this case, the key is “geo_code”) and you want to visualize geographical information based on that data.
In such a case, select “geo_code” for the Key Property.
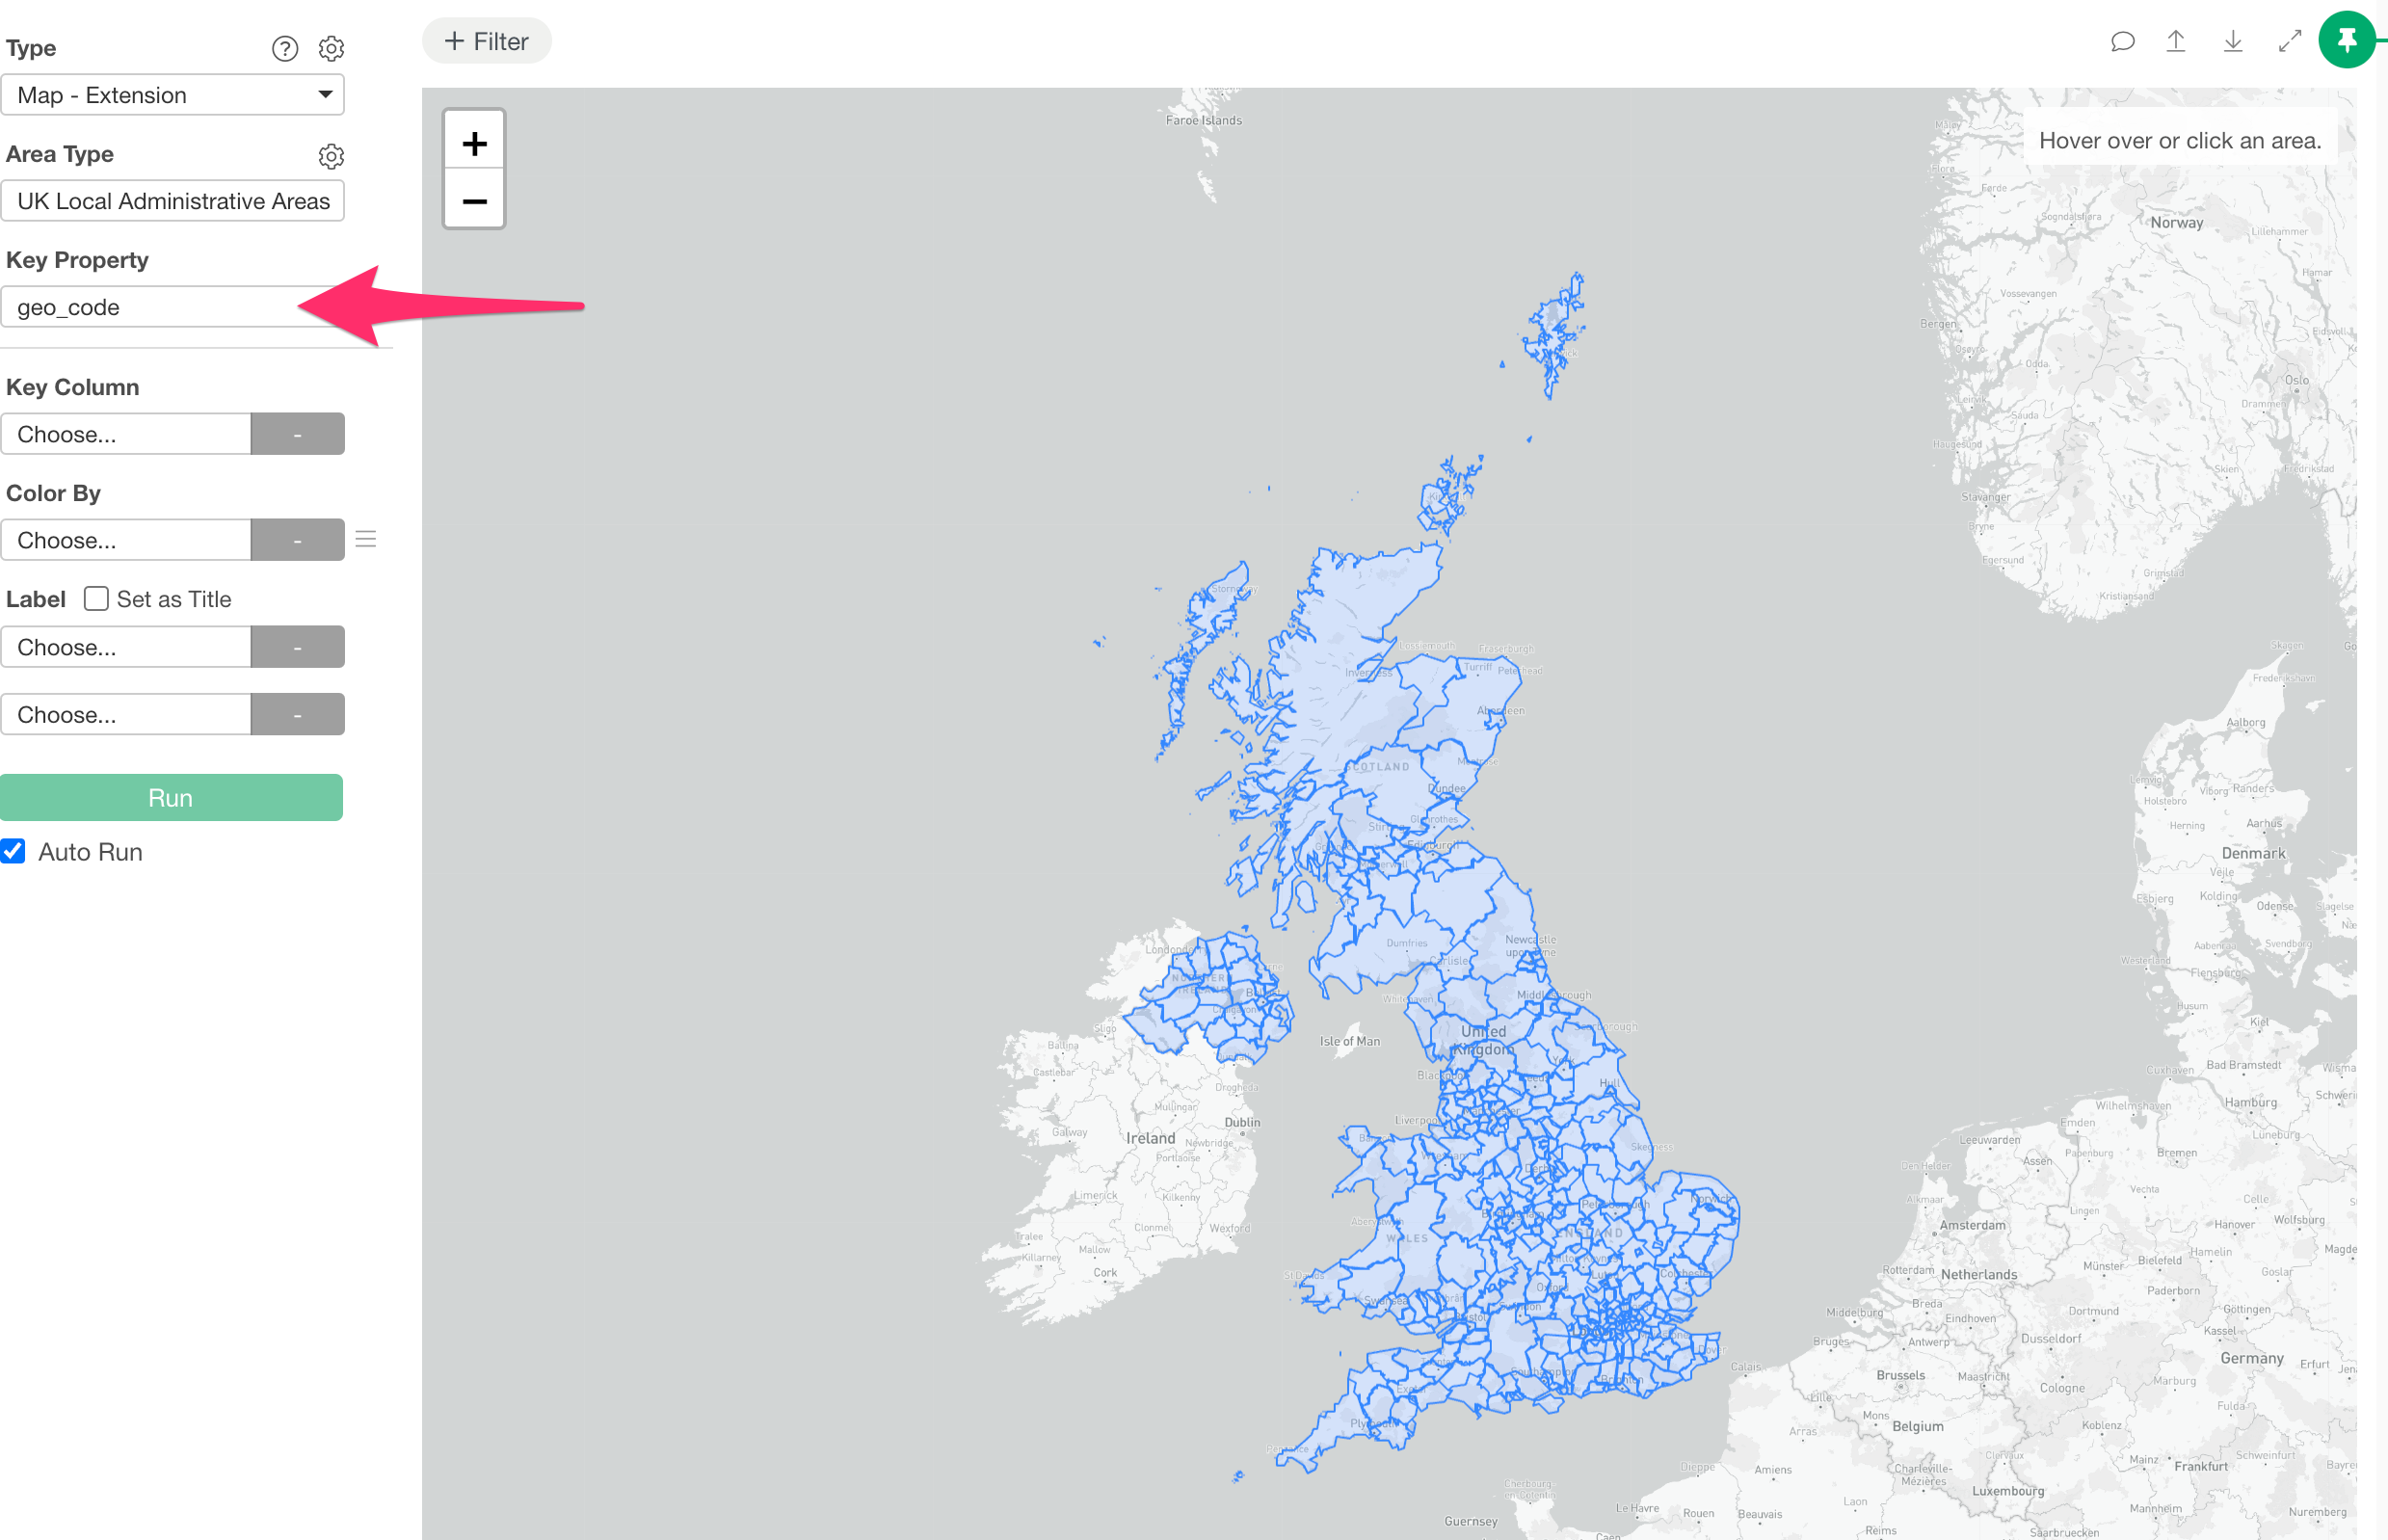
The geographical boundaries will then be displayed on the map based on the GeoJSON definitions.
Next, by specifying the column corresponding to the set Key Property in the “Key Column” and selecting any column for “Color By,” the information for each geographical division will be rendered based on the selected GeoJSON and the specified column.