How to Perform Automatic Variable Selection Using Stepwise Method in Exploratory
The stepwise method is a technique that automatically adds or removes variables based on statistical criteria (primarily AIC) to explore the optimal combination of variables.
It is useful for determining “which variables (features) to use” to
improve the accuracy of predictive models. Since Exploratory’s standard
features do not support the stepwise method, you can perform variable
selection using the stepwise method by using the R
package MASS in the “Note” feature.
Details of the Stepwise Method
There are three main approaches to the stepwise method. The R script used in this guide adopts the “Both” direction.
- Forward Selection: Starting from an empty model, variables that contribute most to the prediction are added one by one.
- Backward Elimination: Starting with all variables included, unnecessary variables are removed one by one.
- Both (Stepwise / Both): A combination of adding and removing variables to find the model that minimizes AIC (Akaike Information Criterion).
Installing Required Packages
First, install the package required to perform the stepwise method.
Select “Manage R Packages” from the project menu.
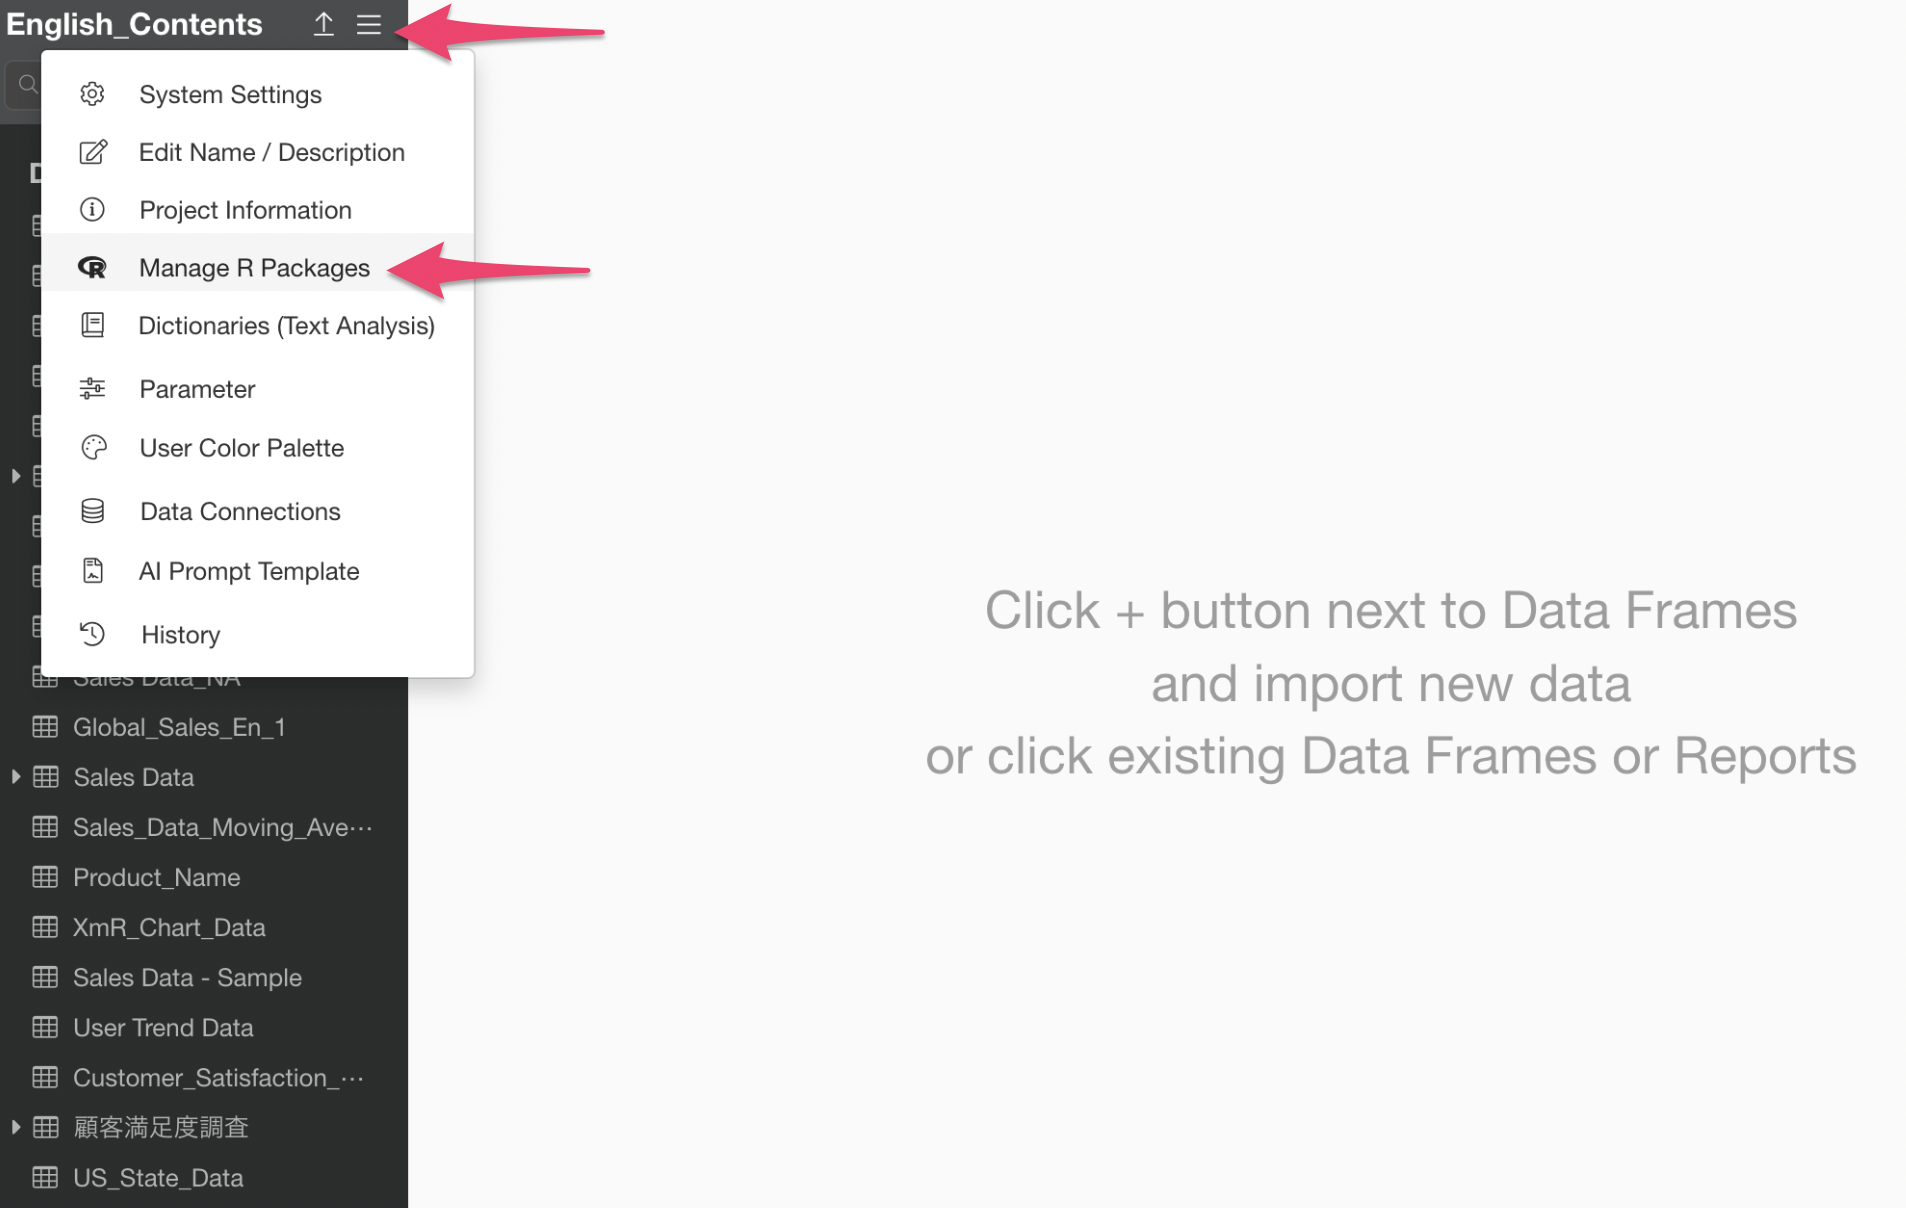
The R Package Management dialog will appear. Click “Install Packages” and then install the “MASS” package.

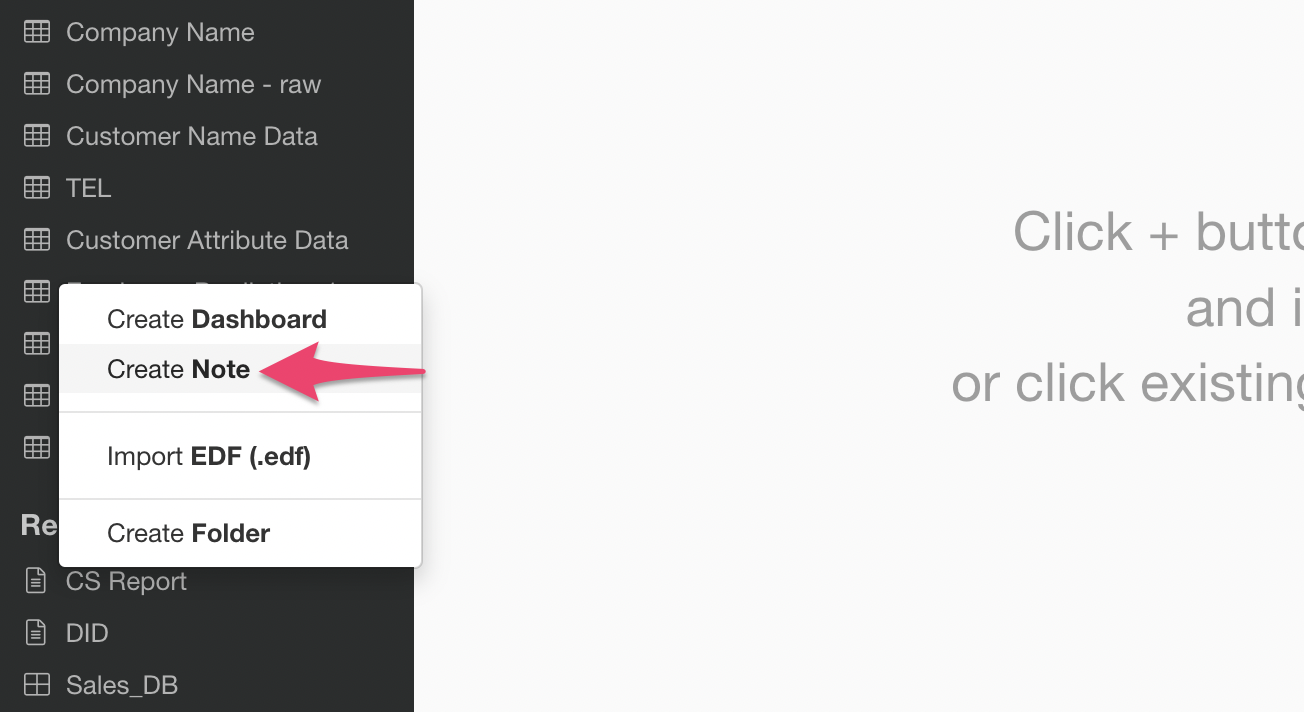
Creating a Note
Select “Create Note” from the report’s plus button.
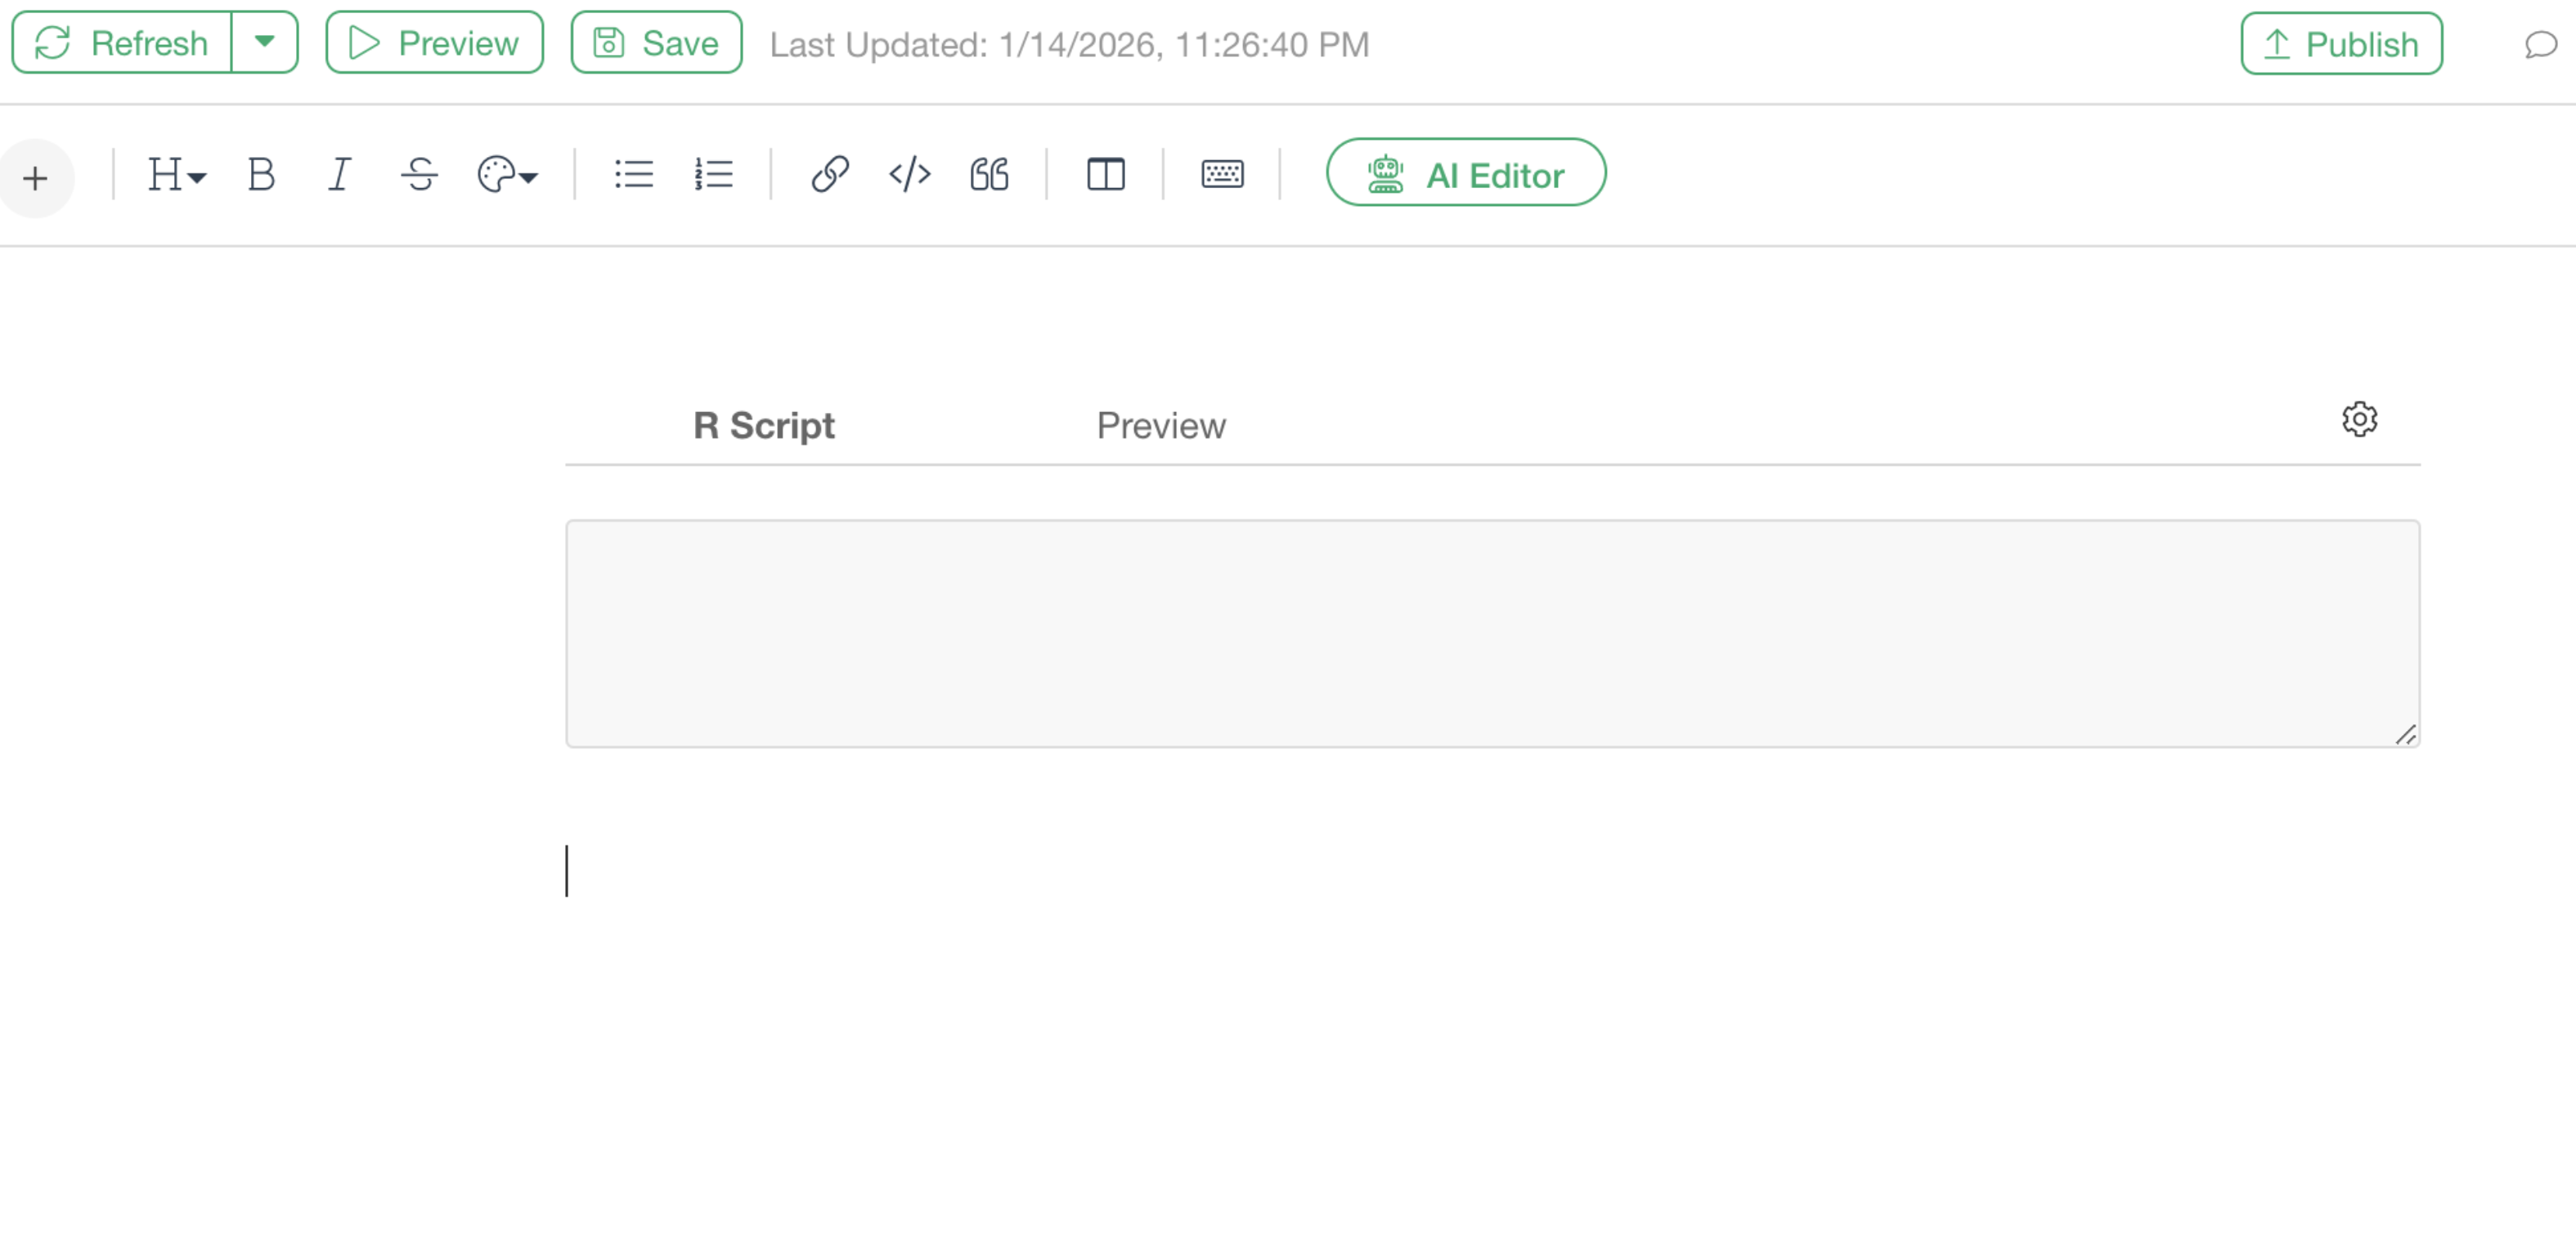
Once the Note window opens, click the “R Code” button from the plus button in the upper left.

A code block for writing R scripts has been added.
Executing the Stepwise Method
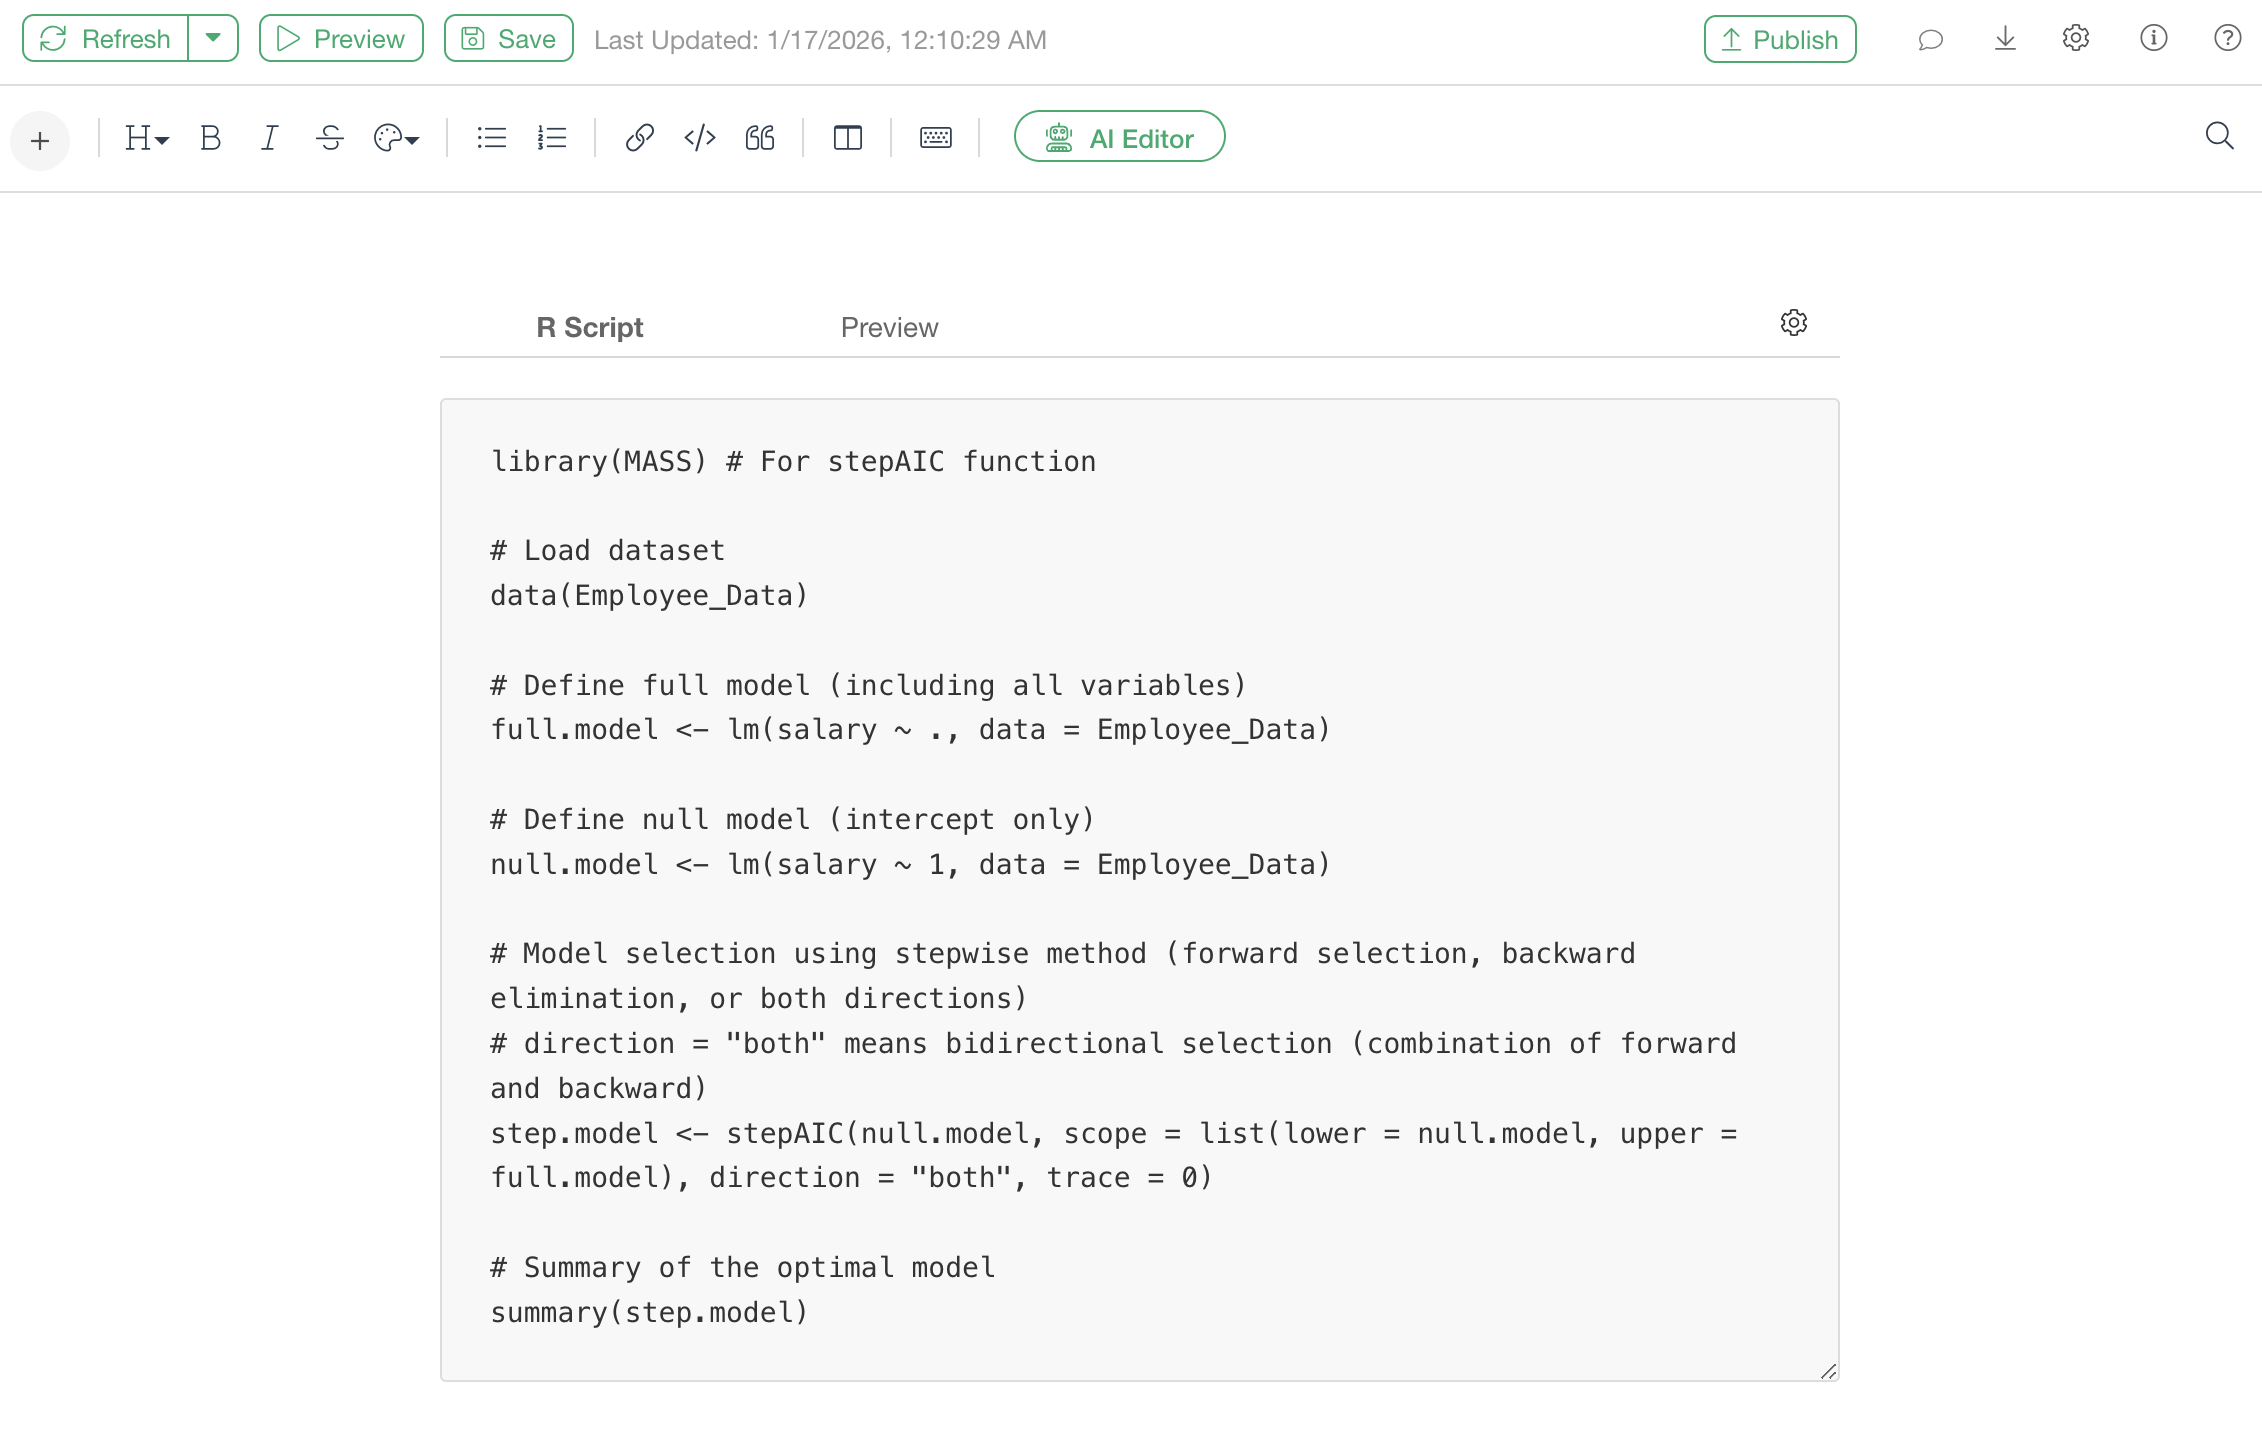
Use the following R script.
library(MASS) # For stepAIC function

# Load dataset
data(Employee_Data)

# Define full model (including all variables)
full.model <- lm(Salary ~ ., data = Employee_Data)

# Define null model (intercept only)
null.model <- lm(Salary ~ 1, data = Employee_Data)

# Model selection using stepwise method (forward selection, backward elimination, or both directions)
# direction = "both" means bidirectional selection (combination of forward and backward)
step.model <- stepAIC(null.model, scope = list(lower = null.model, upper = full.model), direction = "both", trace = 0)

# Summary of the optimal model
summary(step.model)
Executing this R script will display a summary of the finally selected model (coefficients, P-values, R-squared, etc.).
Changes When Analyzing Your Own Data
When applying the sample code above to your own data, change the following parts.
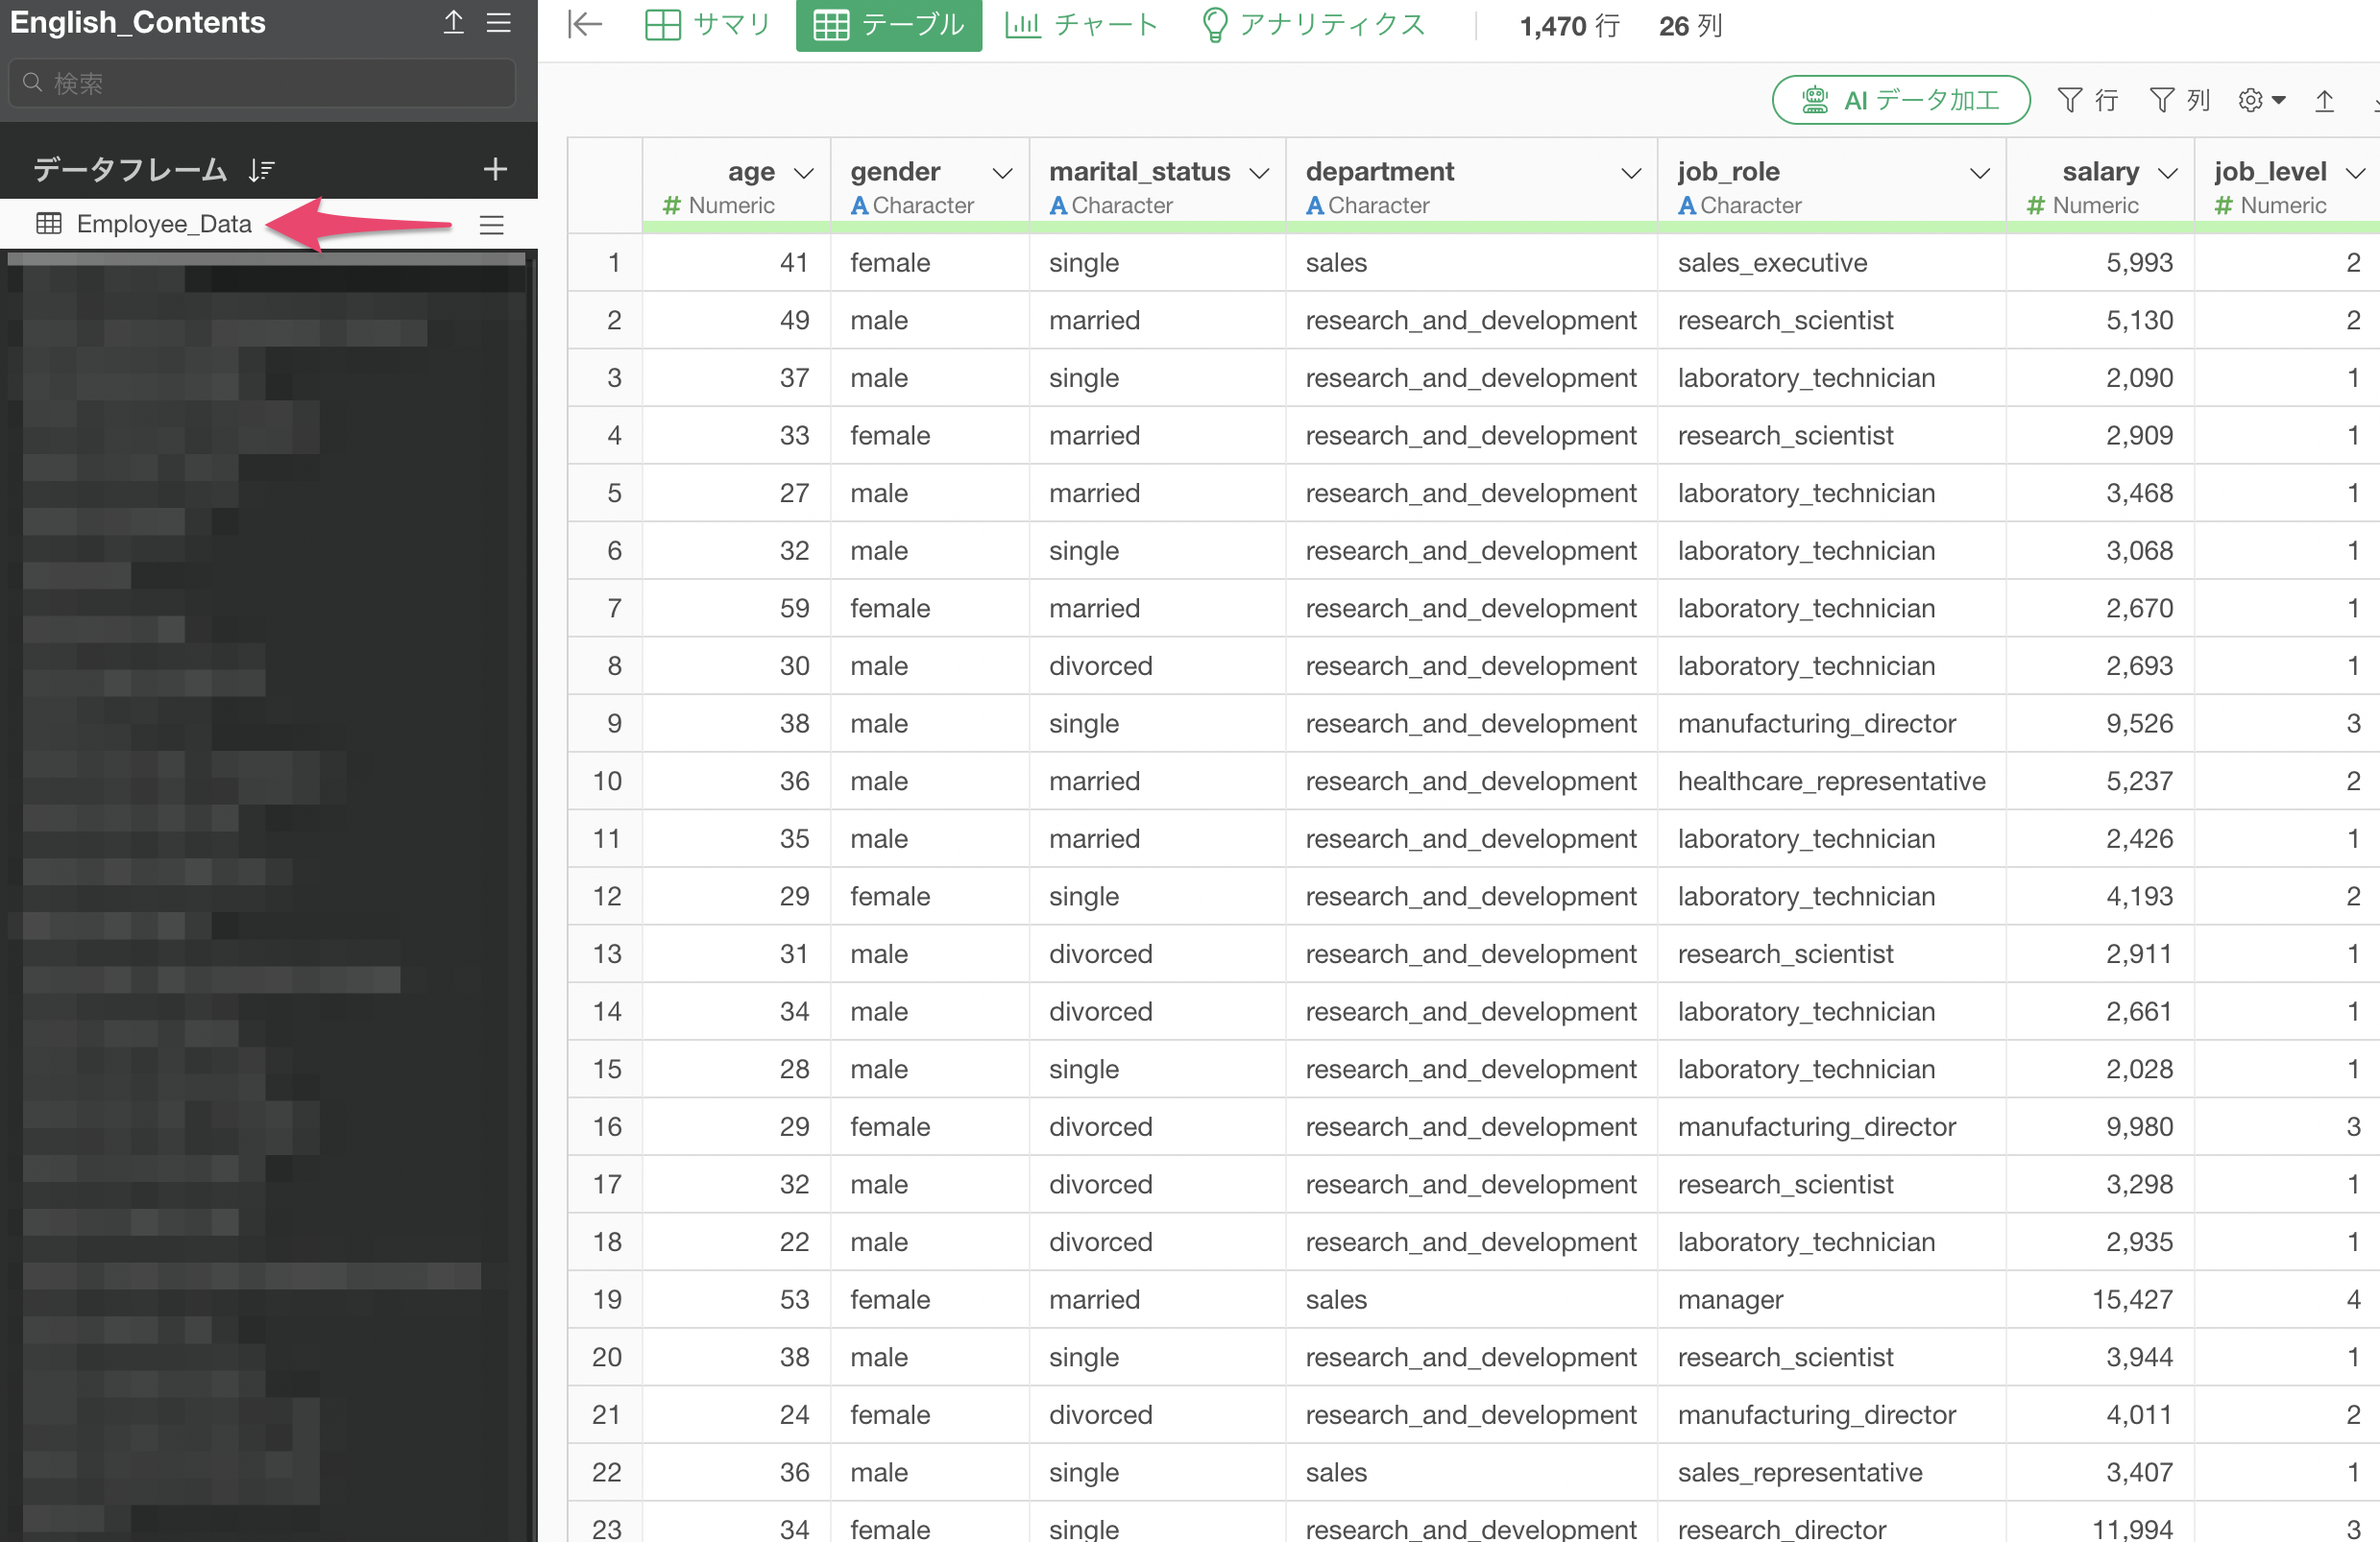
1. Specifying the Data Frame Name
Change: data parameter of the
lm() function
# Example: If the data frame name is "Employee_Data"

full.model <- lm(salary ~ ., data = Employee_Data)
null.model <- lm(salary ~ 1, data = Employee_Data)

# Example: If the data frame name is "Sales_Data"

full.model <- lm(sales ~ ., data = Sales_Data)
null.model <- lm(sales ~ 1, data = Sales_Data)
2. Specifying the Objective Variable Name
Change: Left side of the equation in the
lm() function (left side of the tilde ~)
# Example: If the objective variable is "salary"

full.model <- lm(salary ~ ., data = Employee_Data)
null.model <- lm(salary ~ 1, data = Employee_Data)

# Example: If the objective variable is "sales"

full.model <- lm(sales ~ ., data = Sales_Data)
null.model <- lm(sales ~ 1, data = Sales_Data)
3. Adjusting the Detail Level of Output
Change: trace parameter of the
stepAIC() function
# Display the selection process in detail

trace = 1

# Do not display the selection process (results only)

trace = 0
How to Read the Results
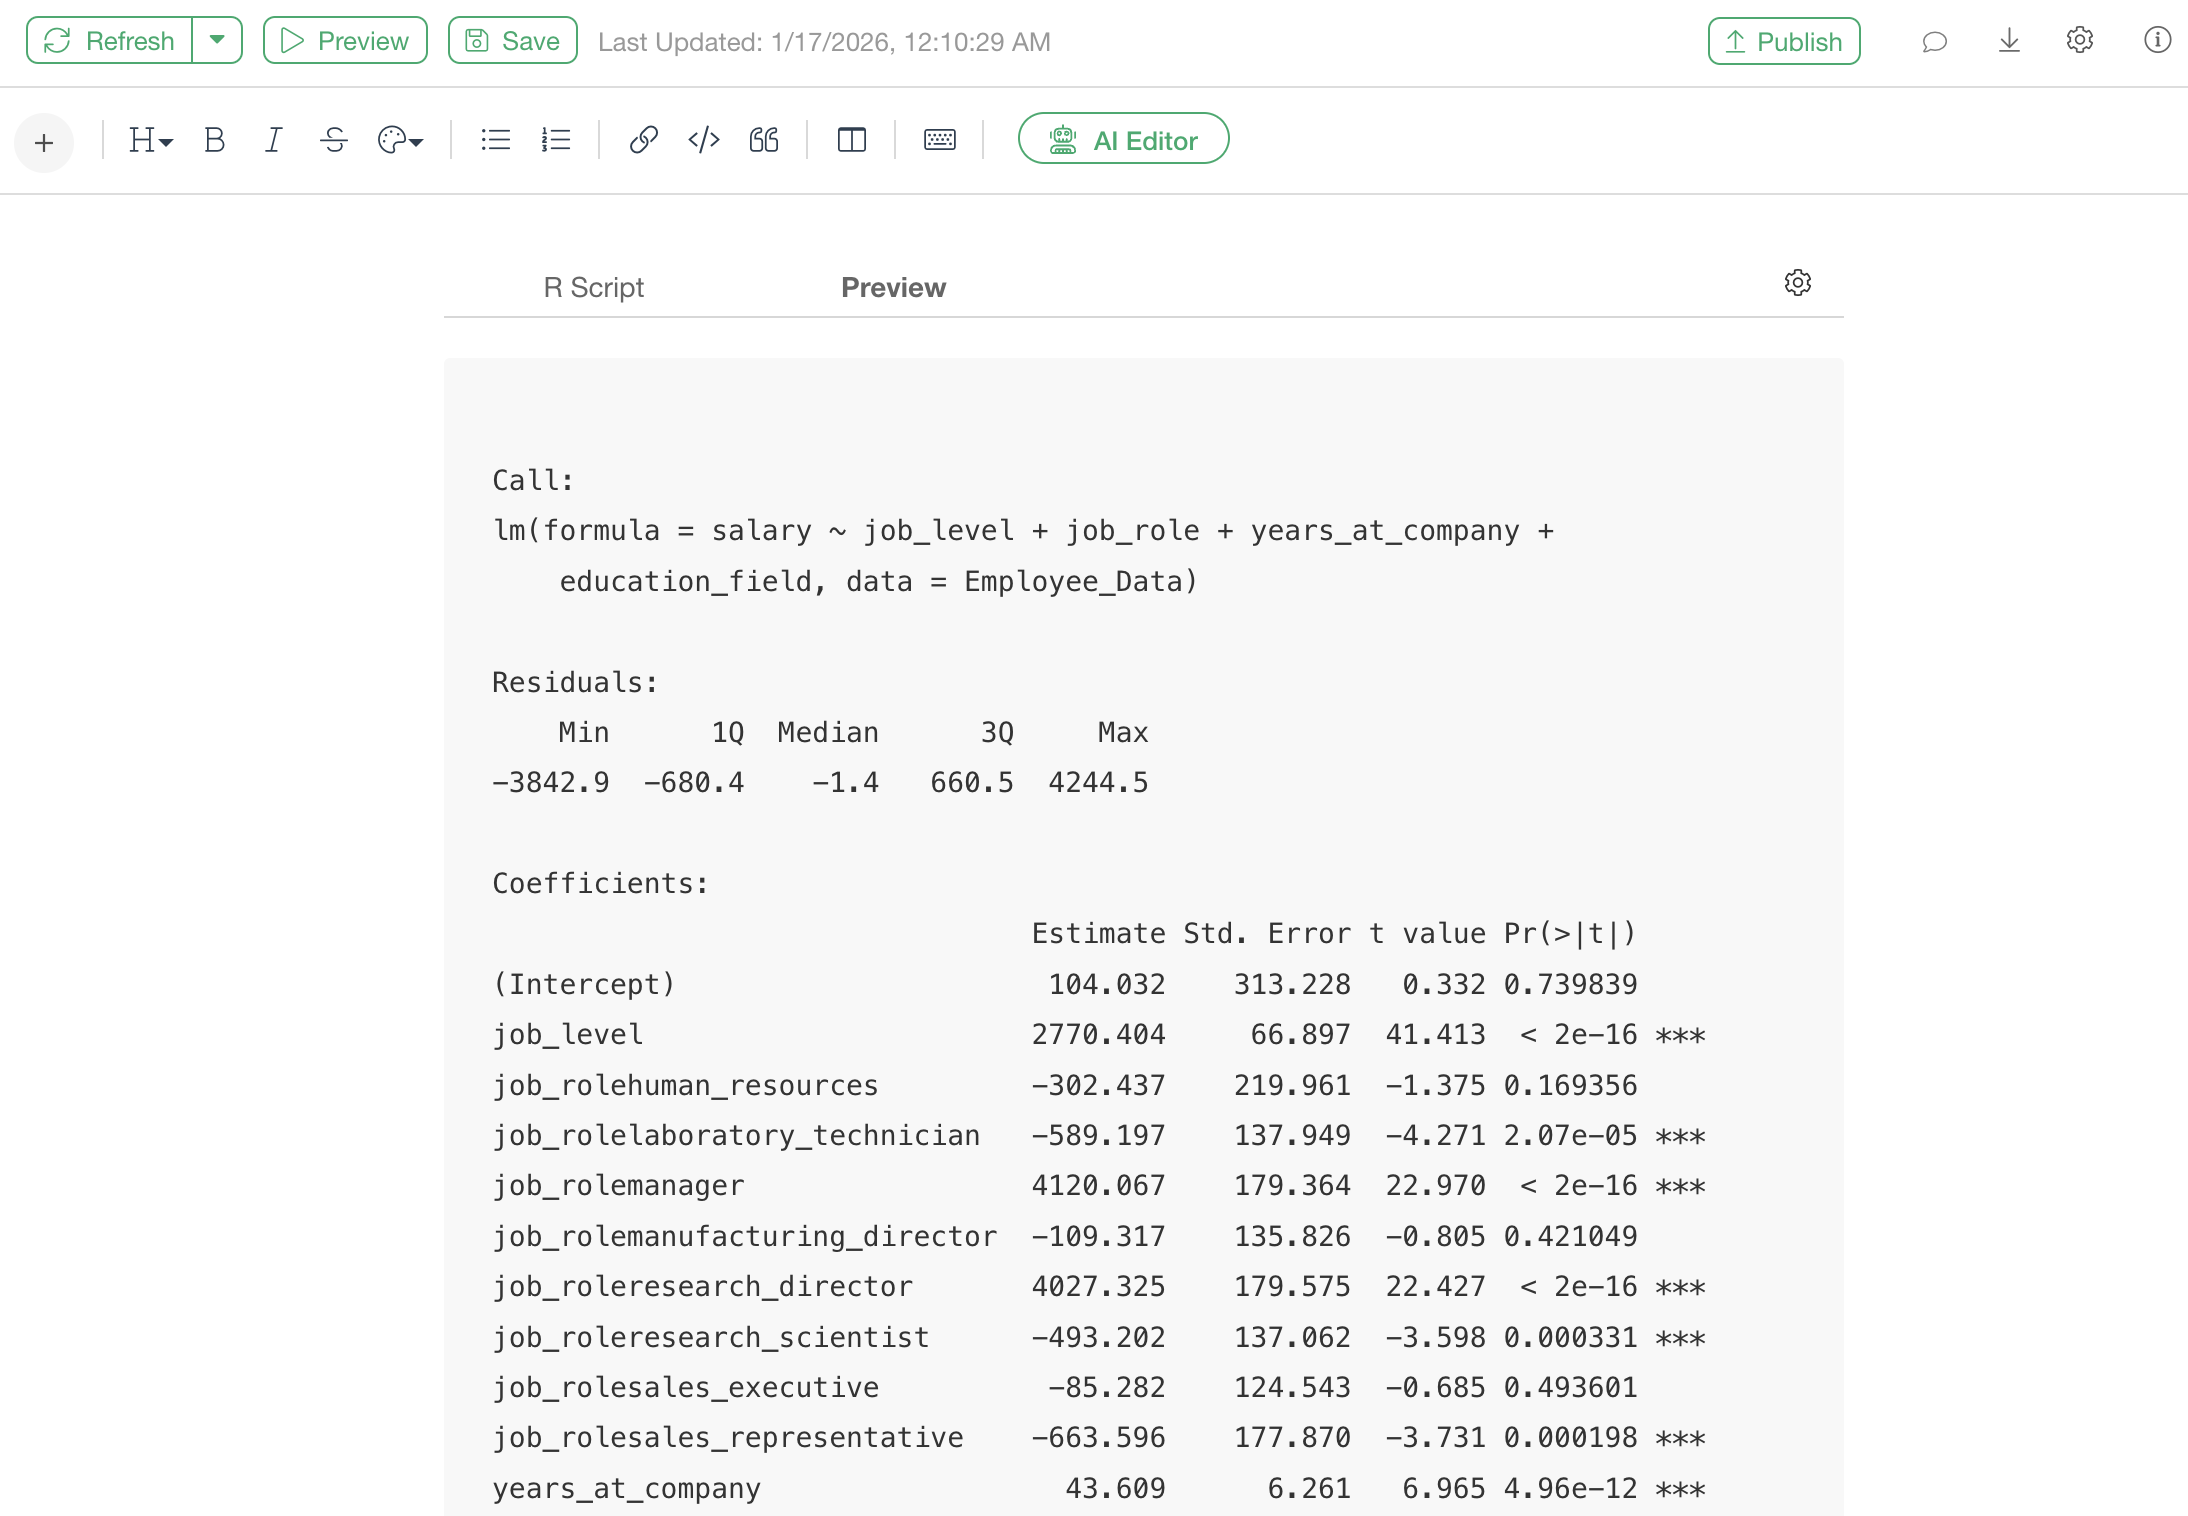
The summary() result after performing the stepwise
method includes the following information.
Call:
lm(formula = salary ~ job_level + job_role + years_at_company +
    education_field, data = Employee_Data)

Residuals:
    Min      1Q  Median      3Q     Max
-3842.9  -680.4    -1.4   660.5  4244.5

Coefficients:
                                Estimate Std. Error t value Pr(>|t|)
(Intercept)                      104.032    313.228   0.332 0.739839
job_level                       2770.404     66.897  41.413  < 2e-16 ***
job_rolehuman_resources         -302.437    219.961  -1.375 0.169356
job_rolelaboratory_technician   -589.197    137.949  -4.271 2.07e-05 ***
job_rolemanager                 4120.067    179.364  22.970  < 2e-16 ***
job_rolemanufacturing_director  -109.317    135.826  -0.805 0.421049
job_roleresearch_director       4027.325    179.575  22.427  < 2e-16 ***
job_roleresearch_scientist      -493.202    137.062  -3.598 0.000331 ***
job_rolesales_executive          -85.282    124.543  -0.685 0.493601
job_rolesales_representative    -663.596    177.870  -3.731 0.000198 ***
years_at_company                  43.609      6.261   6.965 4.96e-12 ***
education_fieldlife_sciences     -41.594    266.362  -0.156 0.875932
education_fieldmarketing          -7.758    284.097  -0.027 0.978218
education_fieldmedical           -47.951    267.372  -0.179 0.857693
education_fieldother            -128.264    288.996  -0.444 0.657235
education_fieldtechnical_degree   43.573    279.769   0.156 0.876256
---
Signif. codes:  0 '***' 0.001 '**' 0.01 '*' 0.05 '.' 0.1 ' ' 1

Residual standard error: 1125 on 1454 degrees of freedom
Multiple R-squared:  0.9435,    Adjusted R-squared:  0.9429
F-statistic:  1618 on 15 and 1454 DF,  p-value: < 2.2e-16
The part
Call: lm(formula = salary ~ job_level + job_role + years_at_company + education_field, data = Employee_Data)
indicates the optimal variables that minimize AIC (Akaike Information
Criterion) using the stepwise method.
Common Errors and Solutions
Error in library(MASS) : there is no package called ‘MASS’
- Cause: The
MASSpackage is not installed. - Solution: Follow the steps in the “Installing Required Packages” section to install the package.
Error: object ‘Employee_Data’ not found
- Cause: A data frame with the specified name does not exist, or the spelling is incorrect.
- Solution: Check that the data frame name in your project exactly matches the name in the script.
Summary
The stepwise method is a technique that automatically selects
variables to include in a predictive model based on statistical criteria
(AIC). While Exploratory’s UI does not have a direct stepwise method
menu, it can be performed using the R MASS package within
the Note feature.
This method allows for automatic optimal variable selection within Exploratory.