How to Perform Brand Analysis Using NBD Dirichlet Model
The NBD Dirichlet model is a probabilistic model used to analyze consumer purchasing behavior, particularly widely used in the marketing field. This model helps understand consumer purchase frequency and brand selection patterns, aiding in demand forecasting and marketing strategy development.
The NBD (Negative Binomial Distribution) model analyzes how many times consumers purchase a specific brand within a certain period. This model is suitable for capturing variations in purchase frequency.
Meanwhile, the Dirichlet distribution models consumer choice behavior when selecting from multiple brands. This enables estimation of selection probabilities for each brand.
The NBD Dirichlet model combines these two models, allowing simultaneous analysis of both consumer purchase frequency and brand selection. This enables more accurate evaluation of market share and customer loyalty for each brand.
This model is utilized in consumer goods and services market analysis for understanding consumer behavior and optimizing marketing strategies.
1. How to Install R Package
To run the NBD/Dirichlet model, we use the NBDdirichlet package.
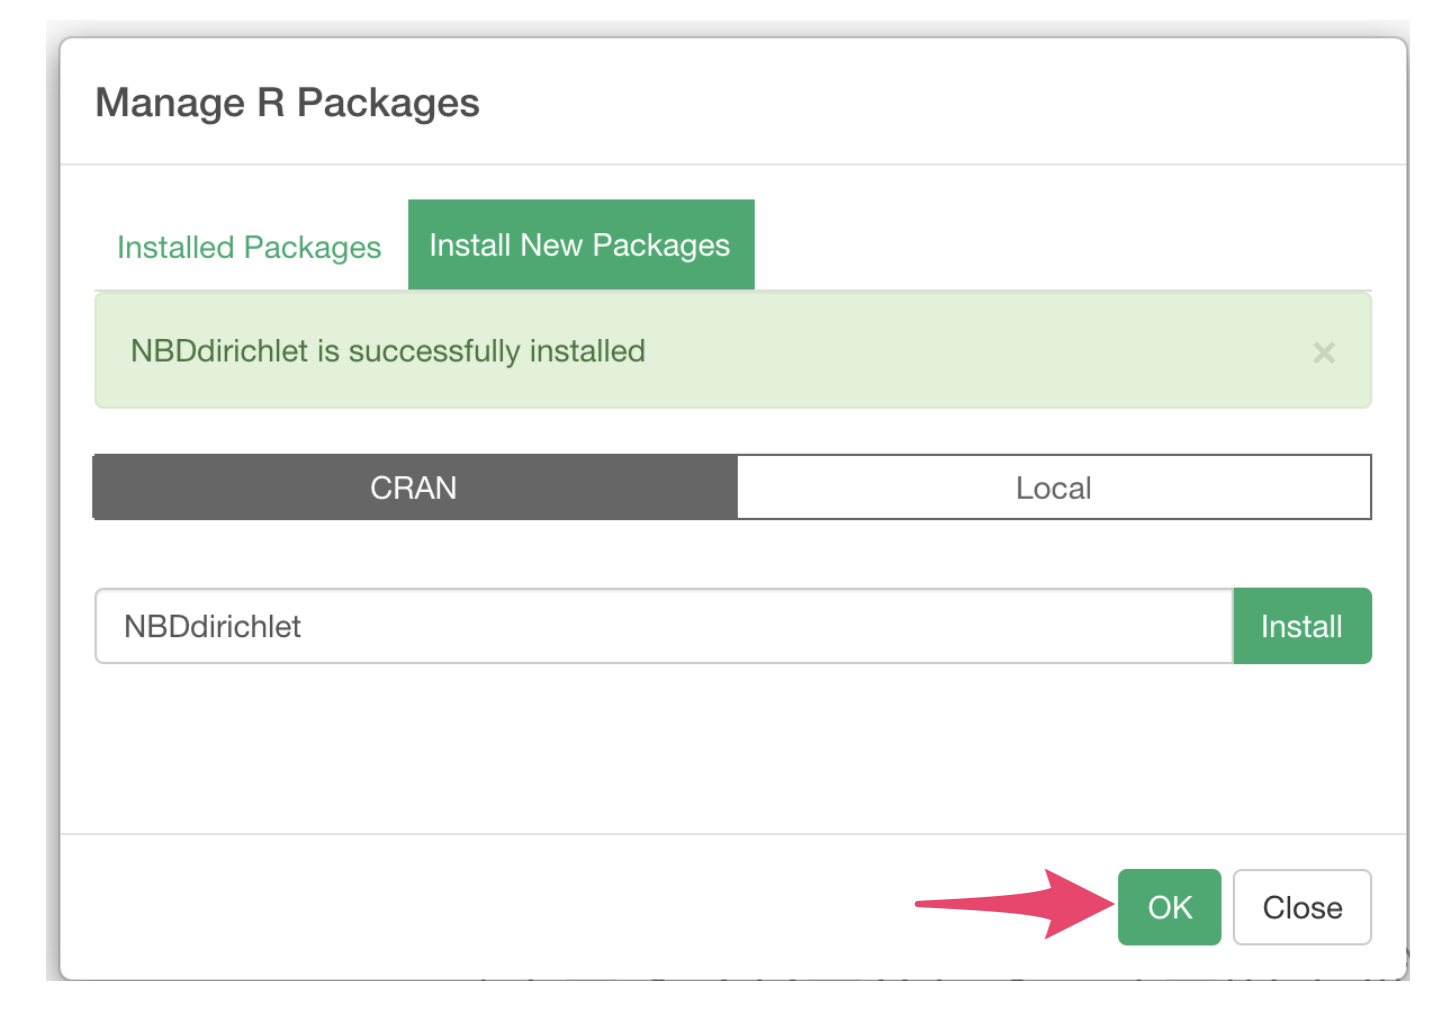
Select "Manage R Packages" from the project menu.
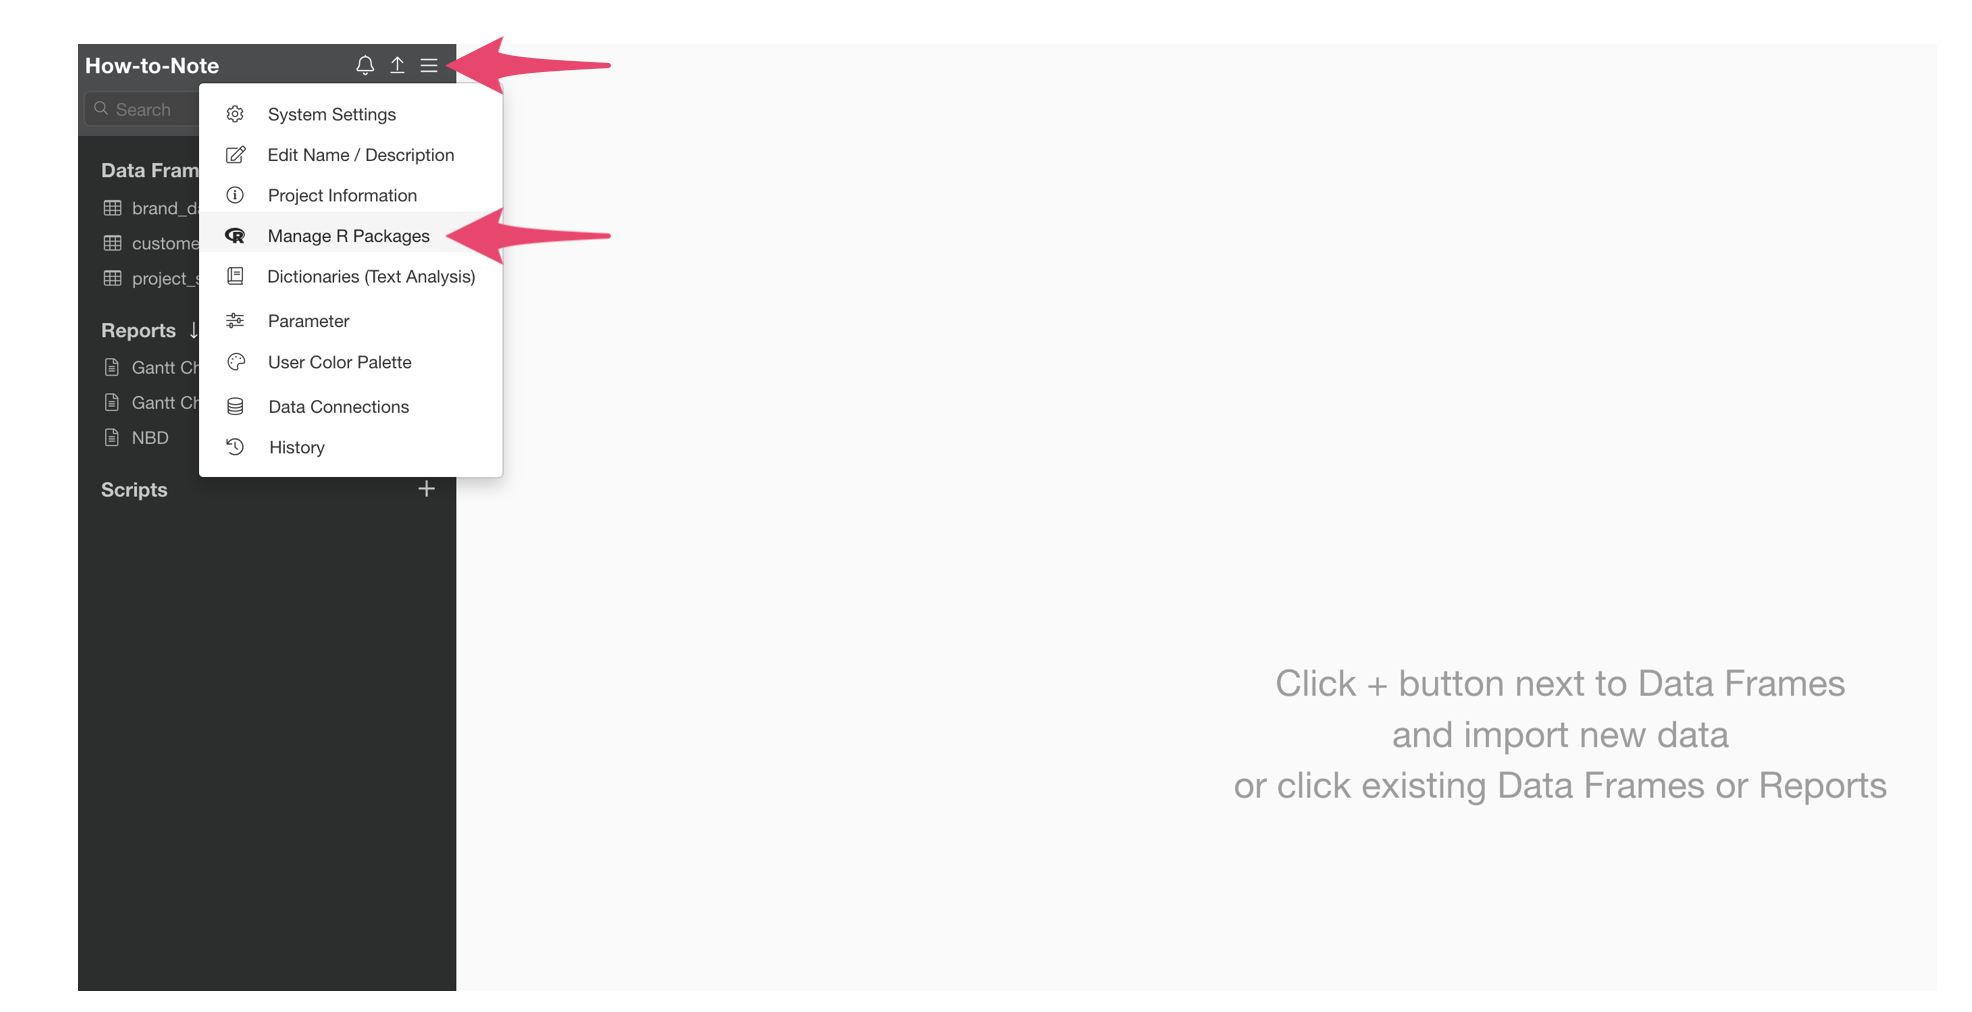
When the R Package Management dialog opens, select "Install Package," enter "NBDdirichlet" and click the install button.
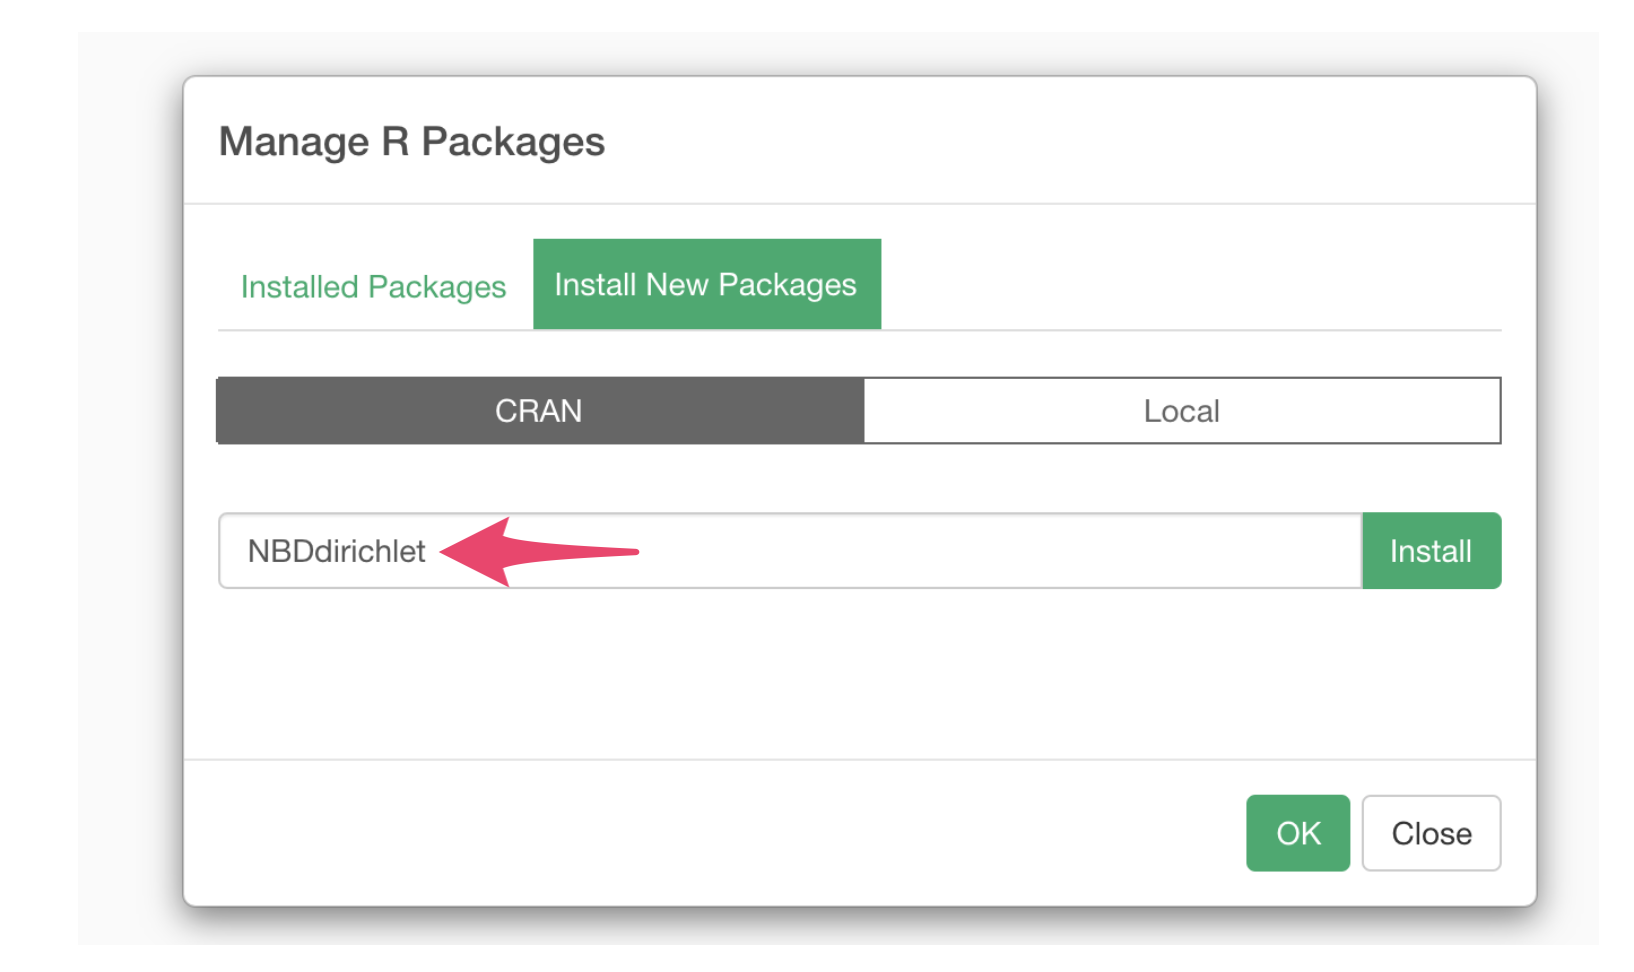
When you see the message "NBDdirichlet is successfully installed," click OK.
2. Data to Use
We will use "brand_data" for this analysis. The data can be downloaded from here.
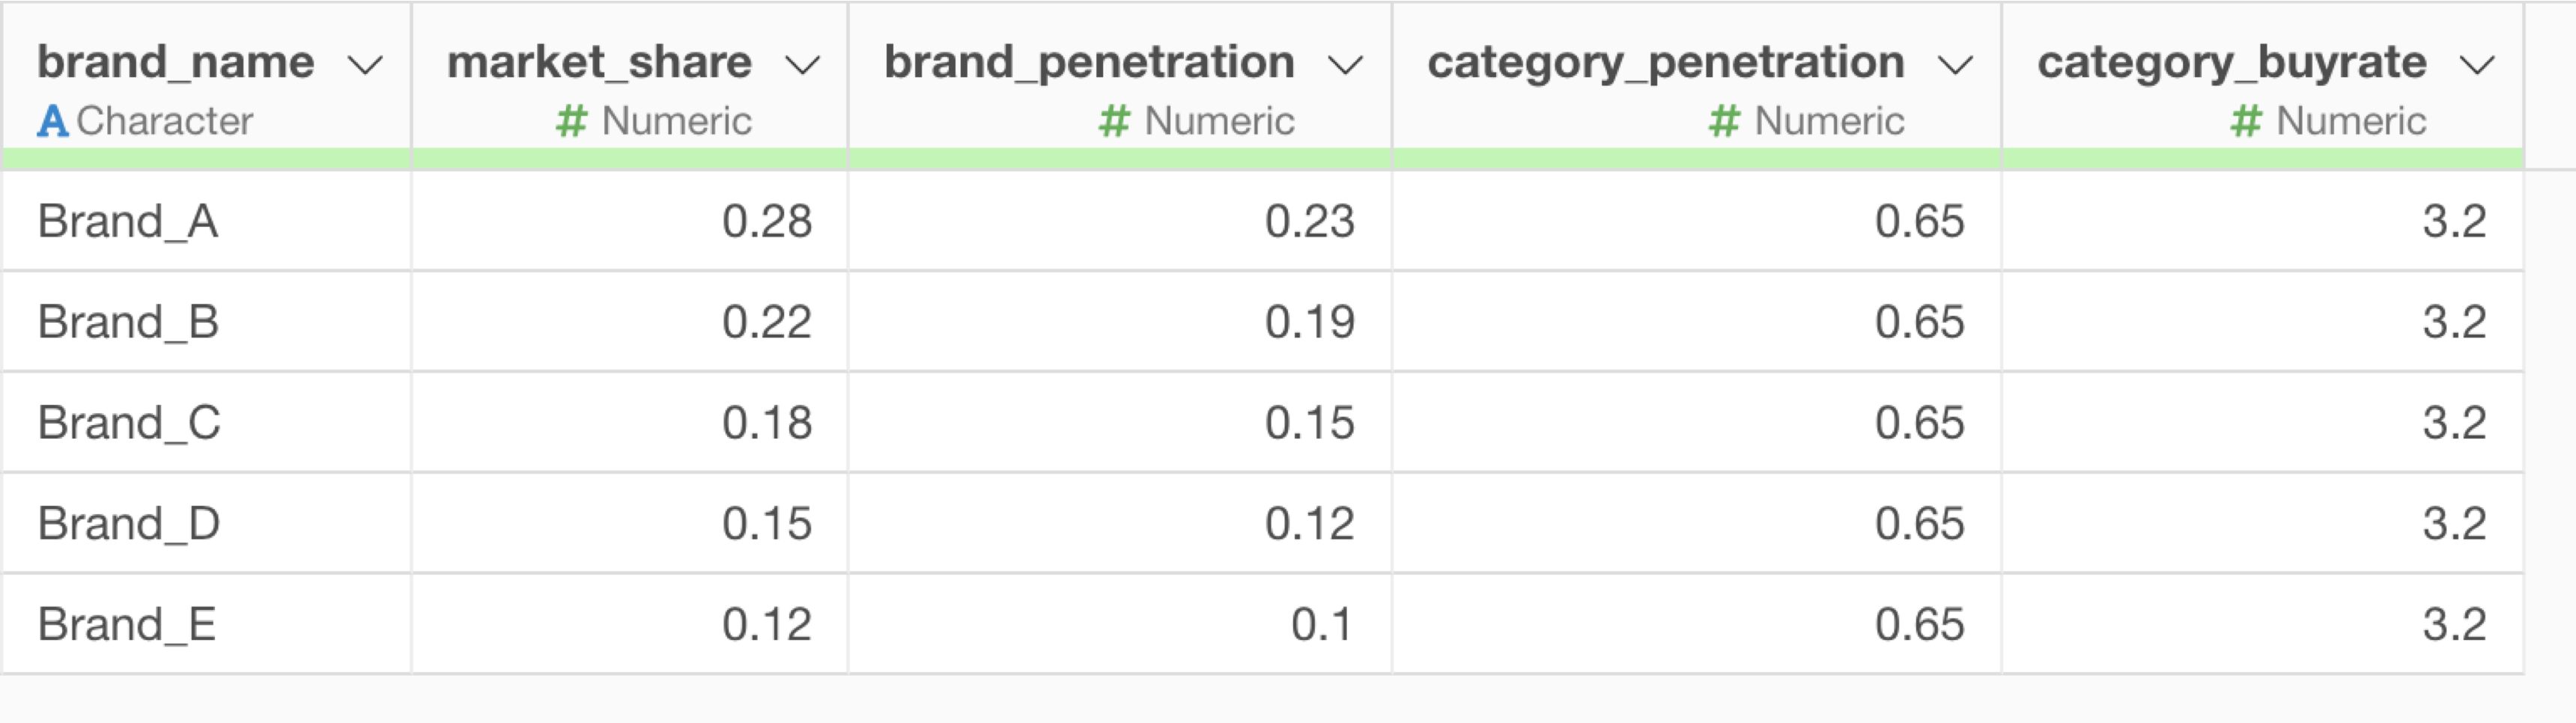
In this data, each row represents one brand, and the columns contain the following data:
- brand_name: Brand name
- market_share: Market share
- brand_penetration: Brand penetration rate
- category_penetration: Category penetration rate
- category_buyrate: Category purchase frequency
To run the NBD Dirichlet model, the following data structure is required:
- Brand name (string)
- Market share for each brand (sum should be 1)
- Penetration rate for each brand (range 0-1)
- Category penetration rate (range 0-1)
- Category purchase frequency (positive real number)
When using your own data, please note the following:
- Data should contain all necessary columns as explained above
Verify numerical data is within appropriate ranges
- Brand penetration and category penetration should be between 0 and 1
Verify the sum of market shares equals 1
3. Running the NBD/Dirichlet Model
Click the + button on the right side of the report and select "Create Note".
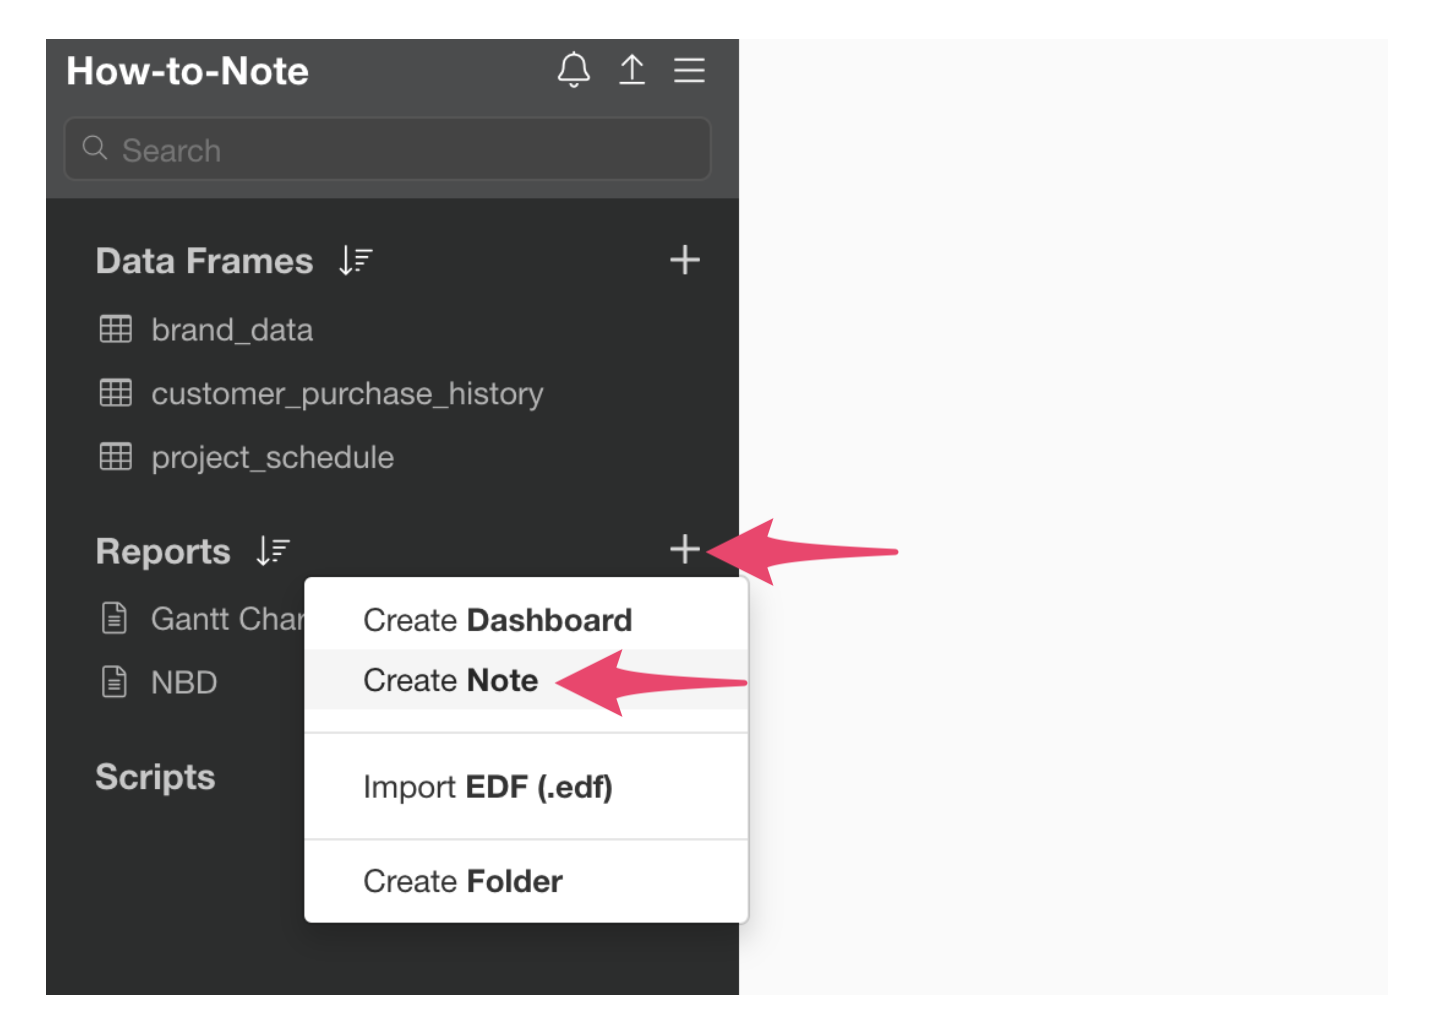
This will open the note window.

Since we need to write R script to run the NBD/Dirichlet model, select "R Script" from the note's plus button.
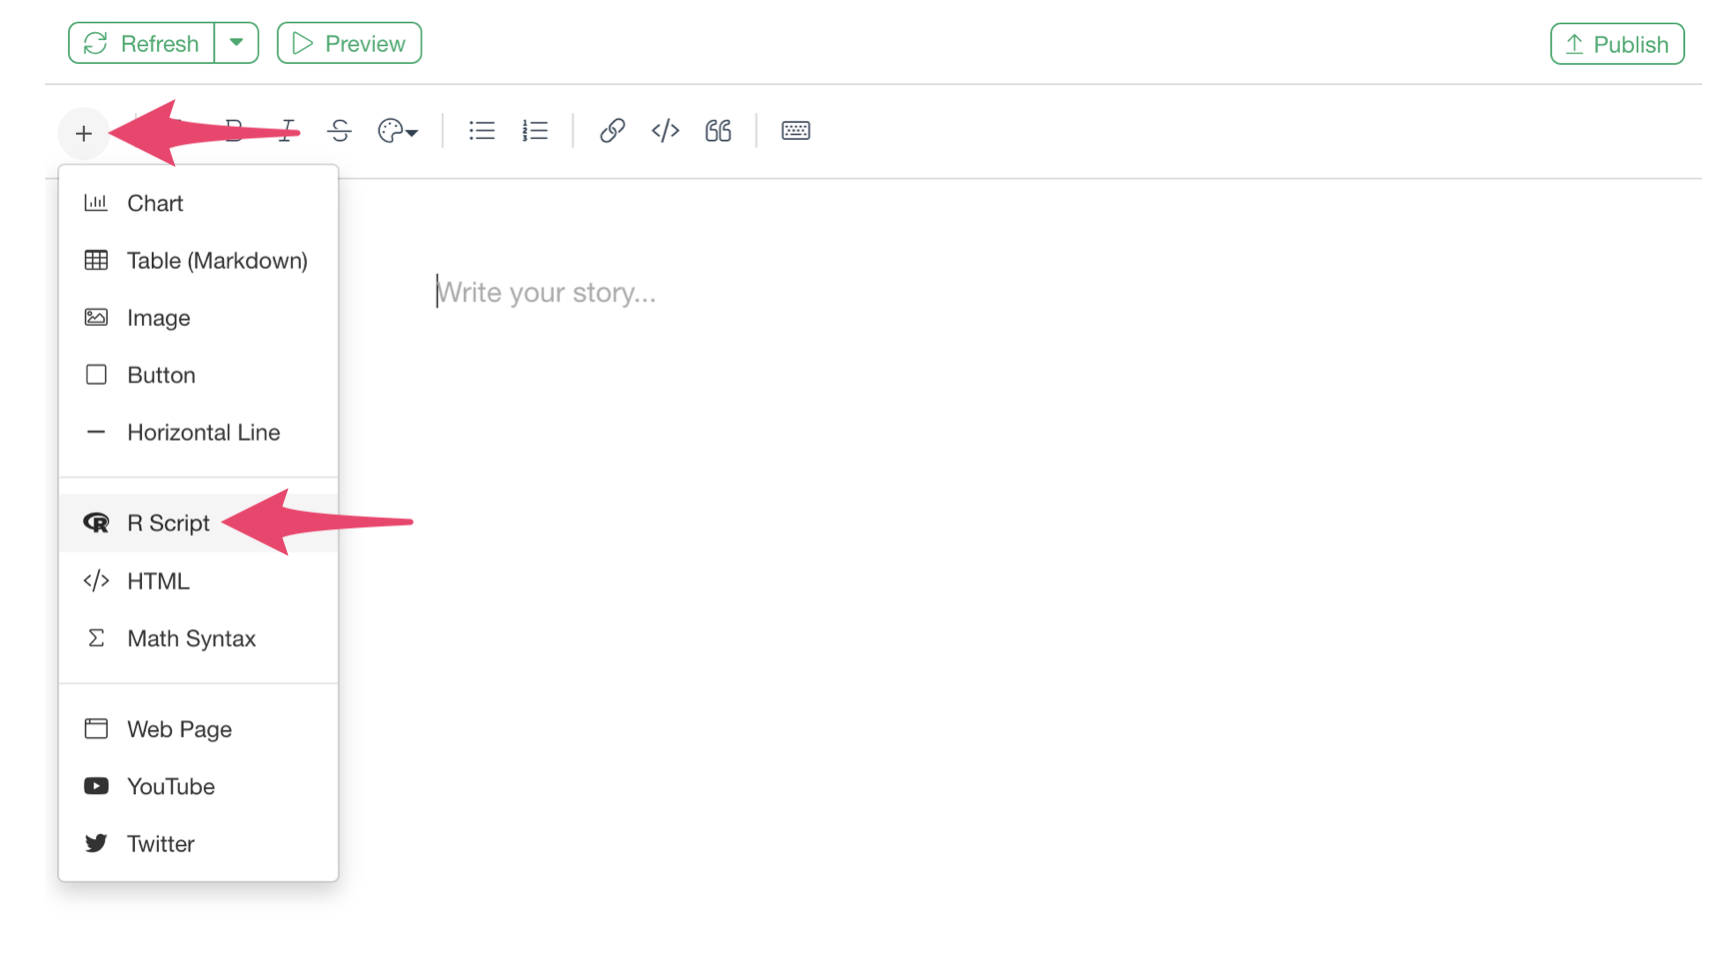
This adds an R script code block to the note.
Copy and paste the following script into this R script.
# Load package
library(NBDdirichlet)

# Extract required parameters from brand_data
cat.pen <- brand_data$category_penetration[1]  # Same value in all rows, so we can take from any row. Here we specify row 1.
cat.buyrate <- brand_data$category_buyrate[1]  # Same value in all rows, so we can take from any row. Here we specify row 1.
brand.share <- brand_data$market_share
brand.pen.obs <- brand_data$brand_penetration
brand.name <- brand_data$brand_name

# Execute Dirichlet model
dobj <- dirichlet(
   cat.pen,
   cat.buyrate,
   brand.share,
   brand.pen.obs,
   brand.name
)
summary(dobj)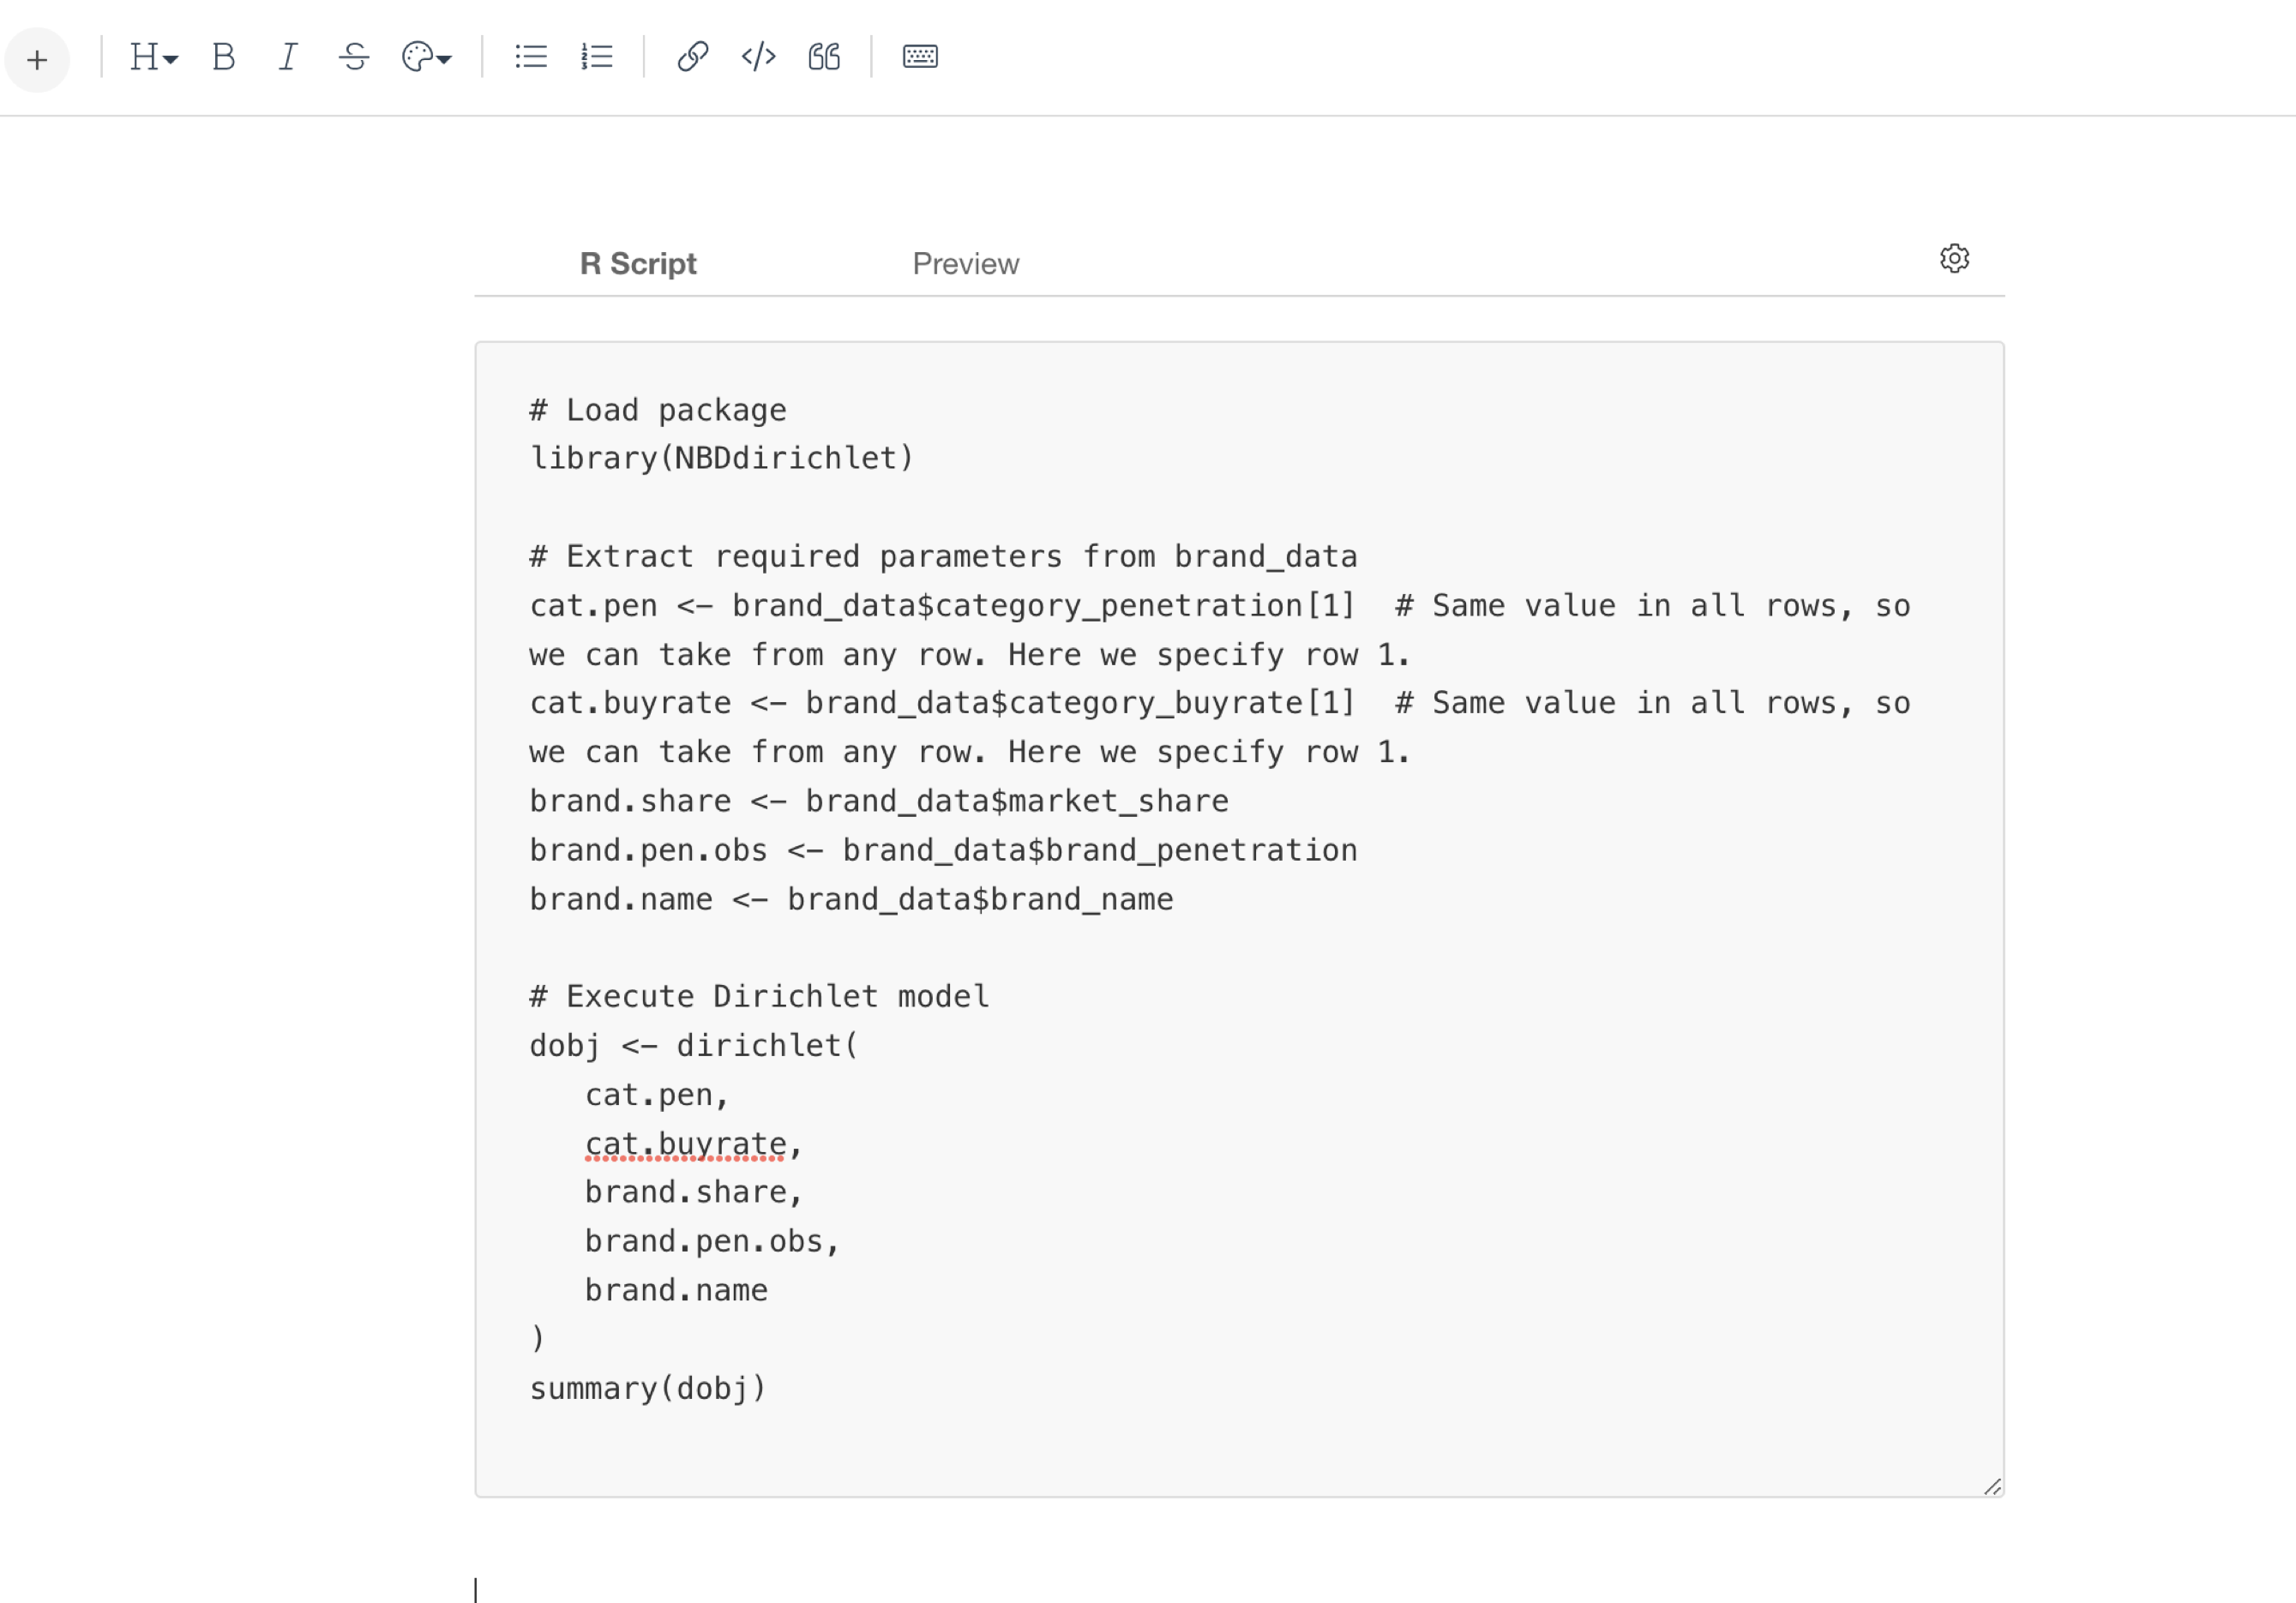
After pasting the R script, click the "Preview" button.
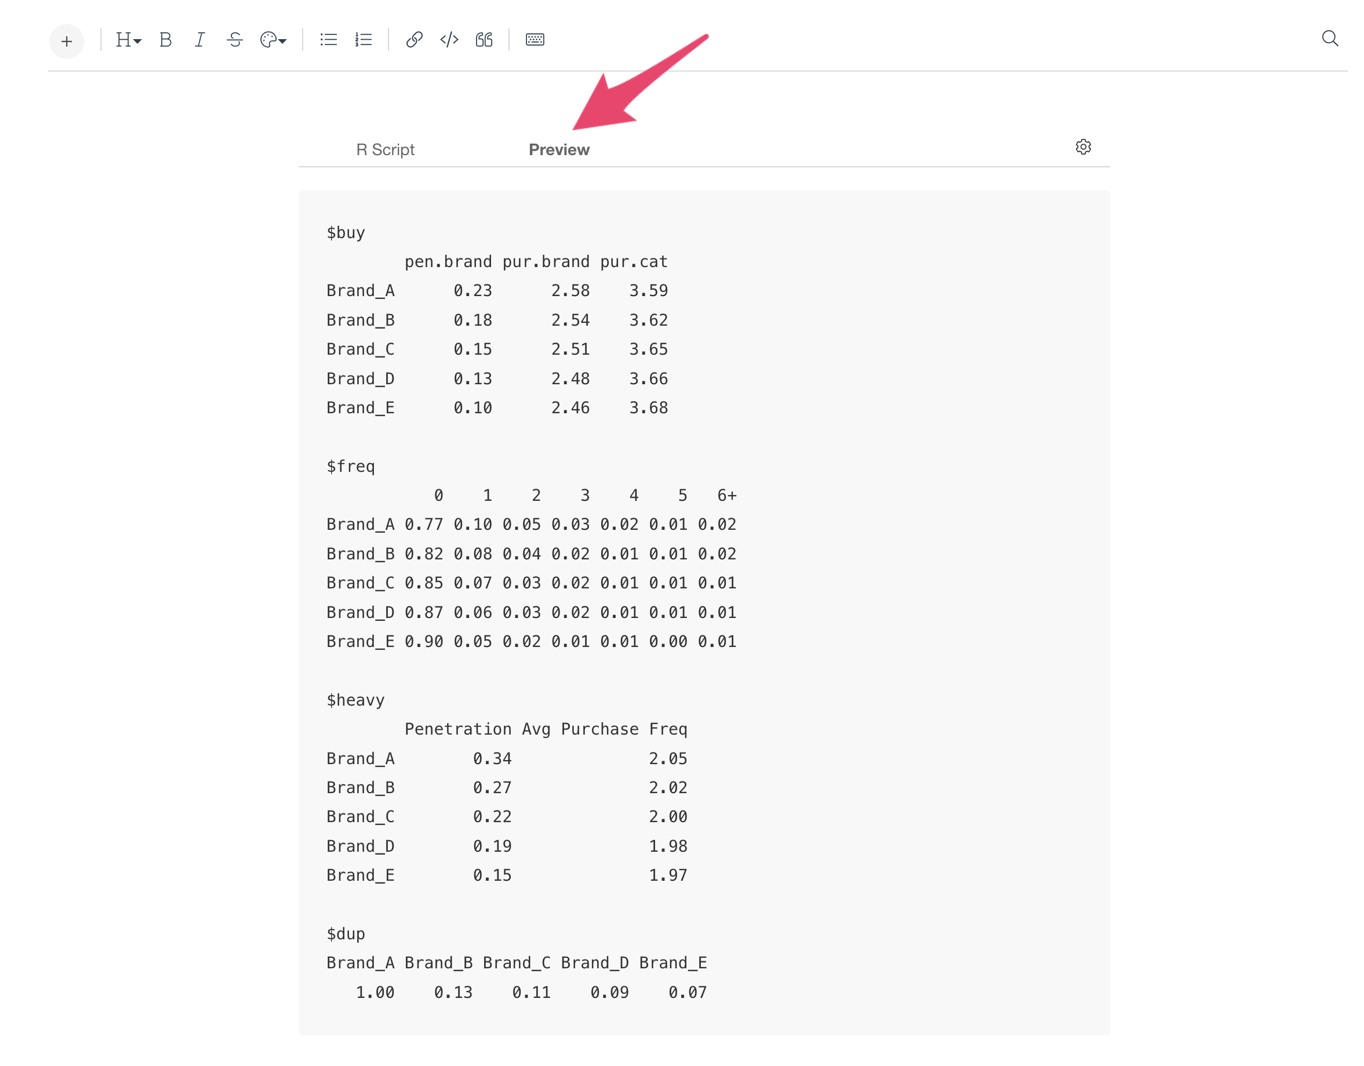
When you preview, the following results will be displayed. The interpretation of results is also described on page 11 of the official documentation.
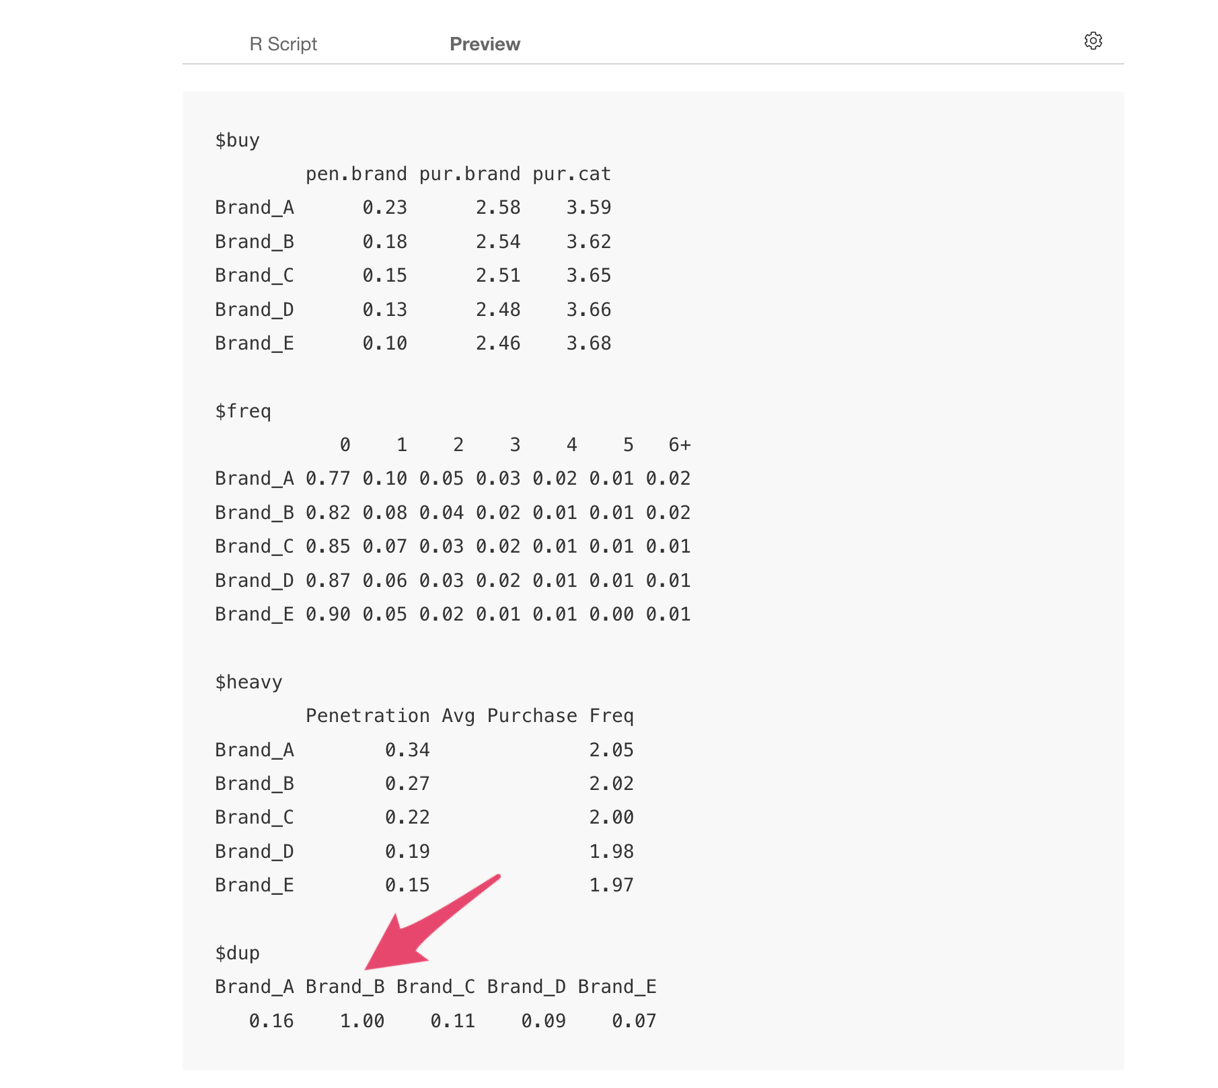
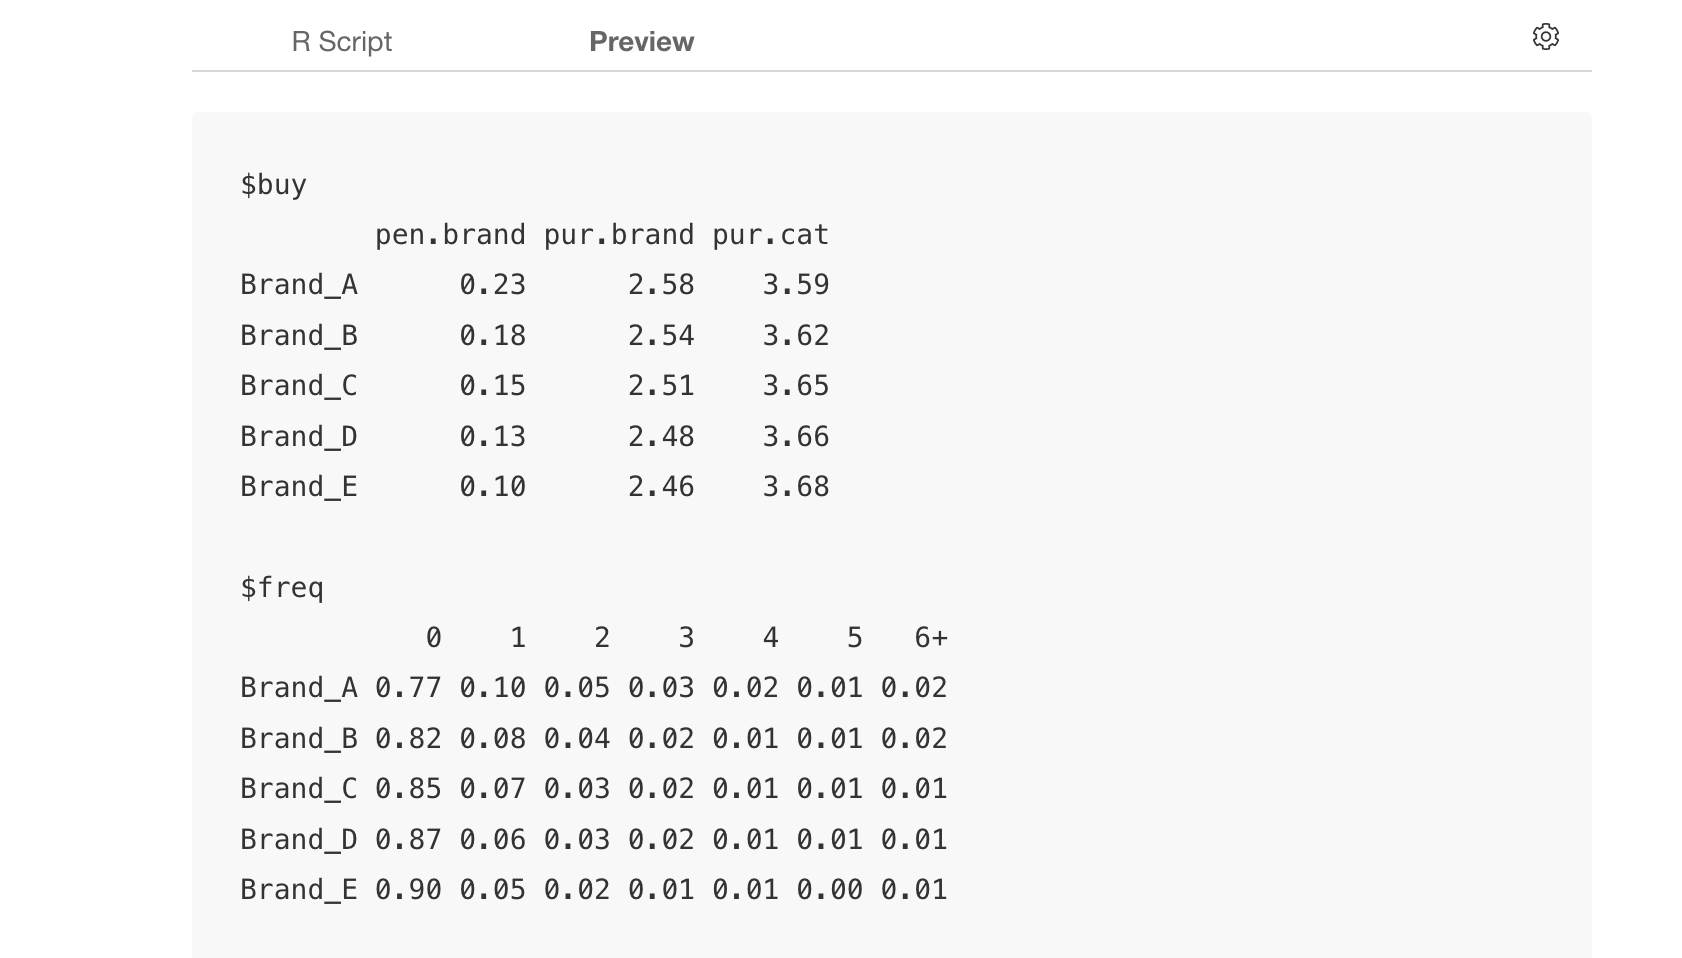
1. buy (Basic Purchase Metrics)
- pen.brand: Theoretical brand penetration rate
- pur.brand: Purchase rate for that brand
- pur.cat: Market purchase rate by buyers of that brand
2. freq (Purchase Frequency Distribution)
Value at 0 shows the proportion of non-purchasing customers
- Example: Brand_A has 77% non-purchasers
Values from 1 to 6+ show the proportion of customers who made that number of purchases
- Example: 10% of Brand_A customers made one purchase, 2% made six or more purchases
3. heavy (Heavy User Analysis)
- Penetration: Theoretical brand penetration rate among high-frequency purchasers
- Avg Purchase Freq: Average purchase frequency among high-frequency purchasers
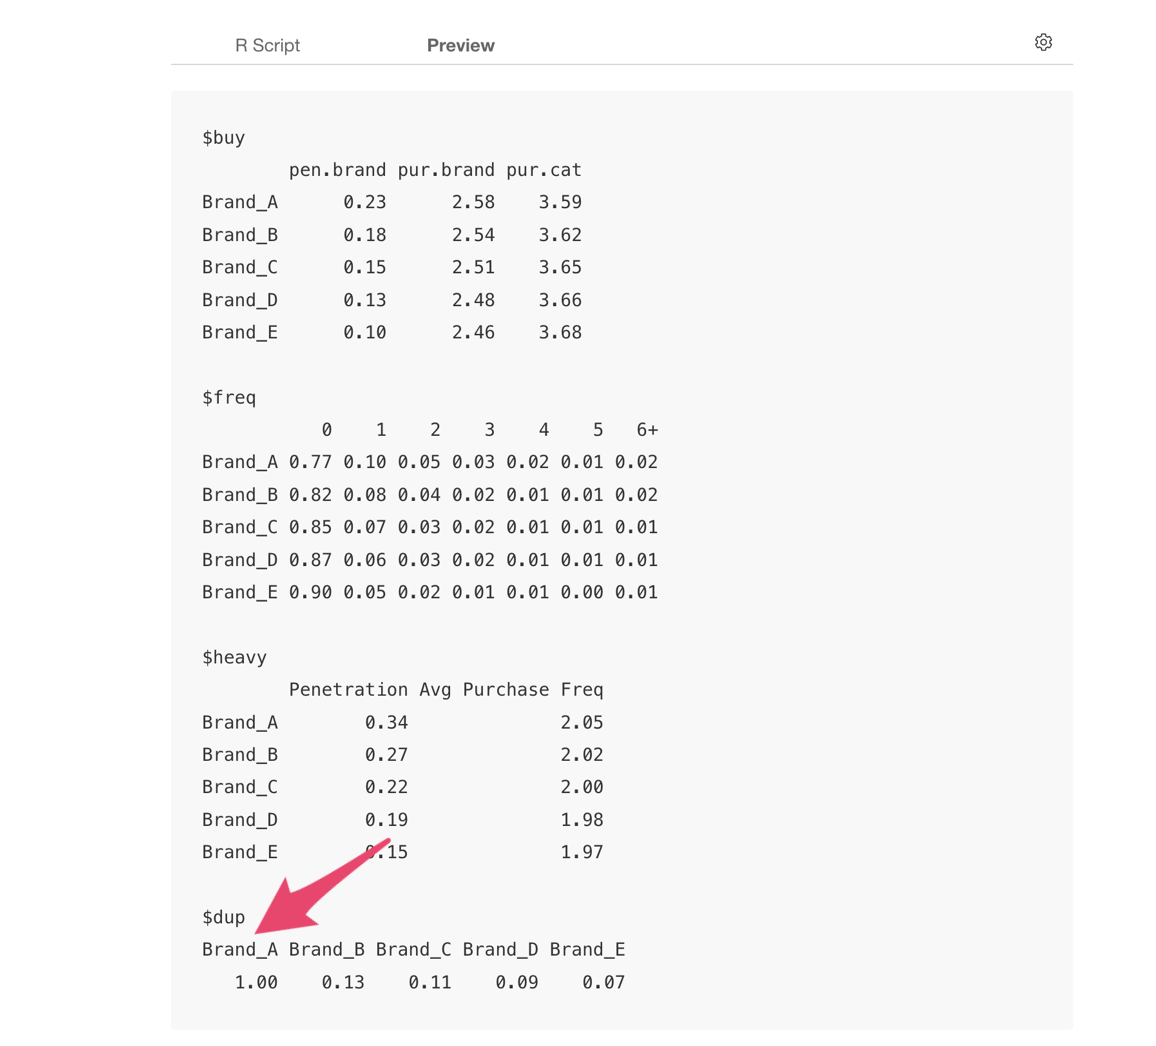
4. dup (Brand Purchase Overlap)
The proportion of brand purchasers who also buy other brands
- Example: 13% of Brand_A purchasers also buy Brand_B
By combining these metrics, you can understand brand positioning in the market and consumer purchase behavior patterns.
Specifying the Base Value for dup (Brand Purchase Overlap)
For dup, which shows the proportion of brand purchasers who also buy other brands, the default uses the first value (Brand_A in this case) as the base, calculating the proportion of Brand_A buyers who also buy Brand_B.
To change this base value and view different results, specify dup.brand=2 when outputting results with summary. Using dup.brand=2 will use the second value (Brand_B in this case) as the base for results.
summary(dobj, dup.brand=2)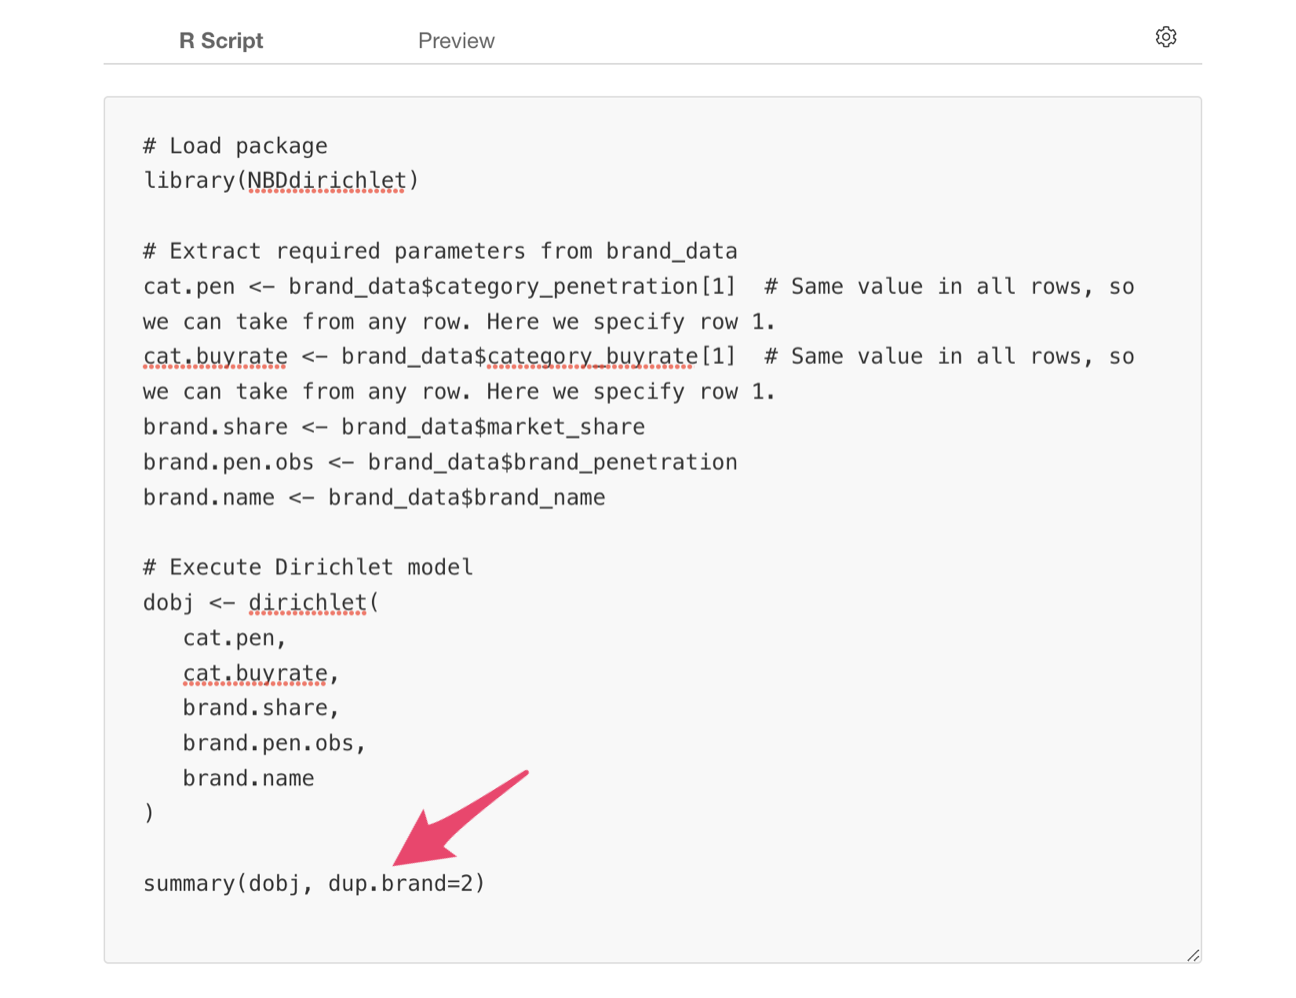
This allows you to see the proportion of Brand_B purchasers who also buy other brands.