How to Quickly Change Marker Shapes from the Y-Axis Menu
Starting from Exploratory Desktop v14.5, a marker shortcut has been added to the Y-axis column dropdown for Scatter plots, Line charts, and Bar charts, allowing you to switch marker types instantly.
How to Use
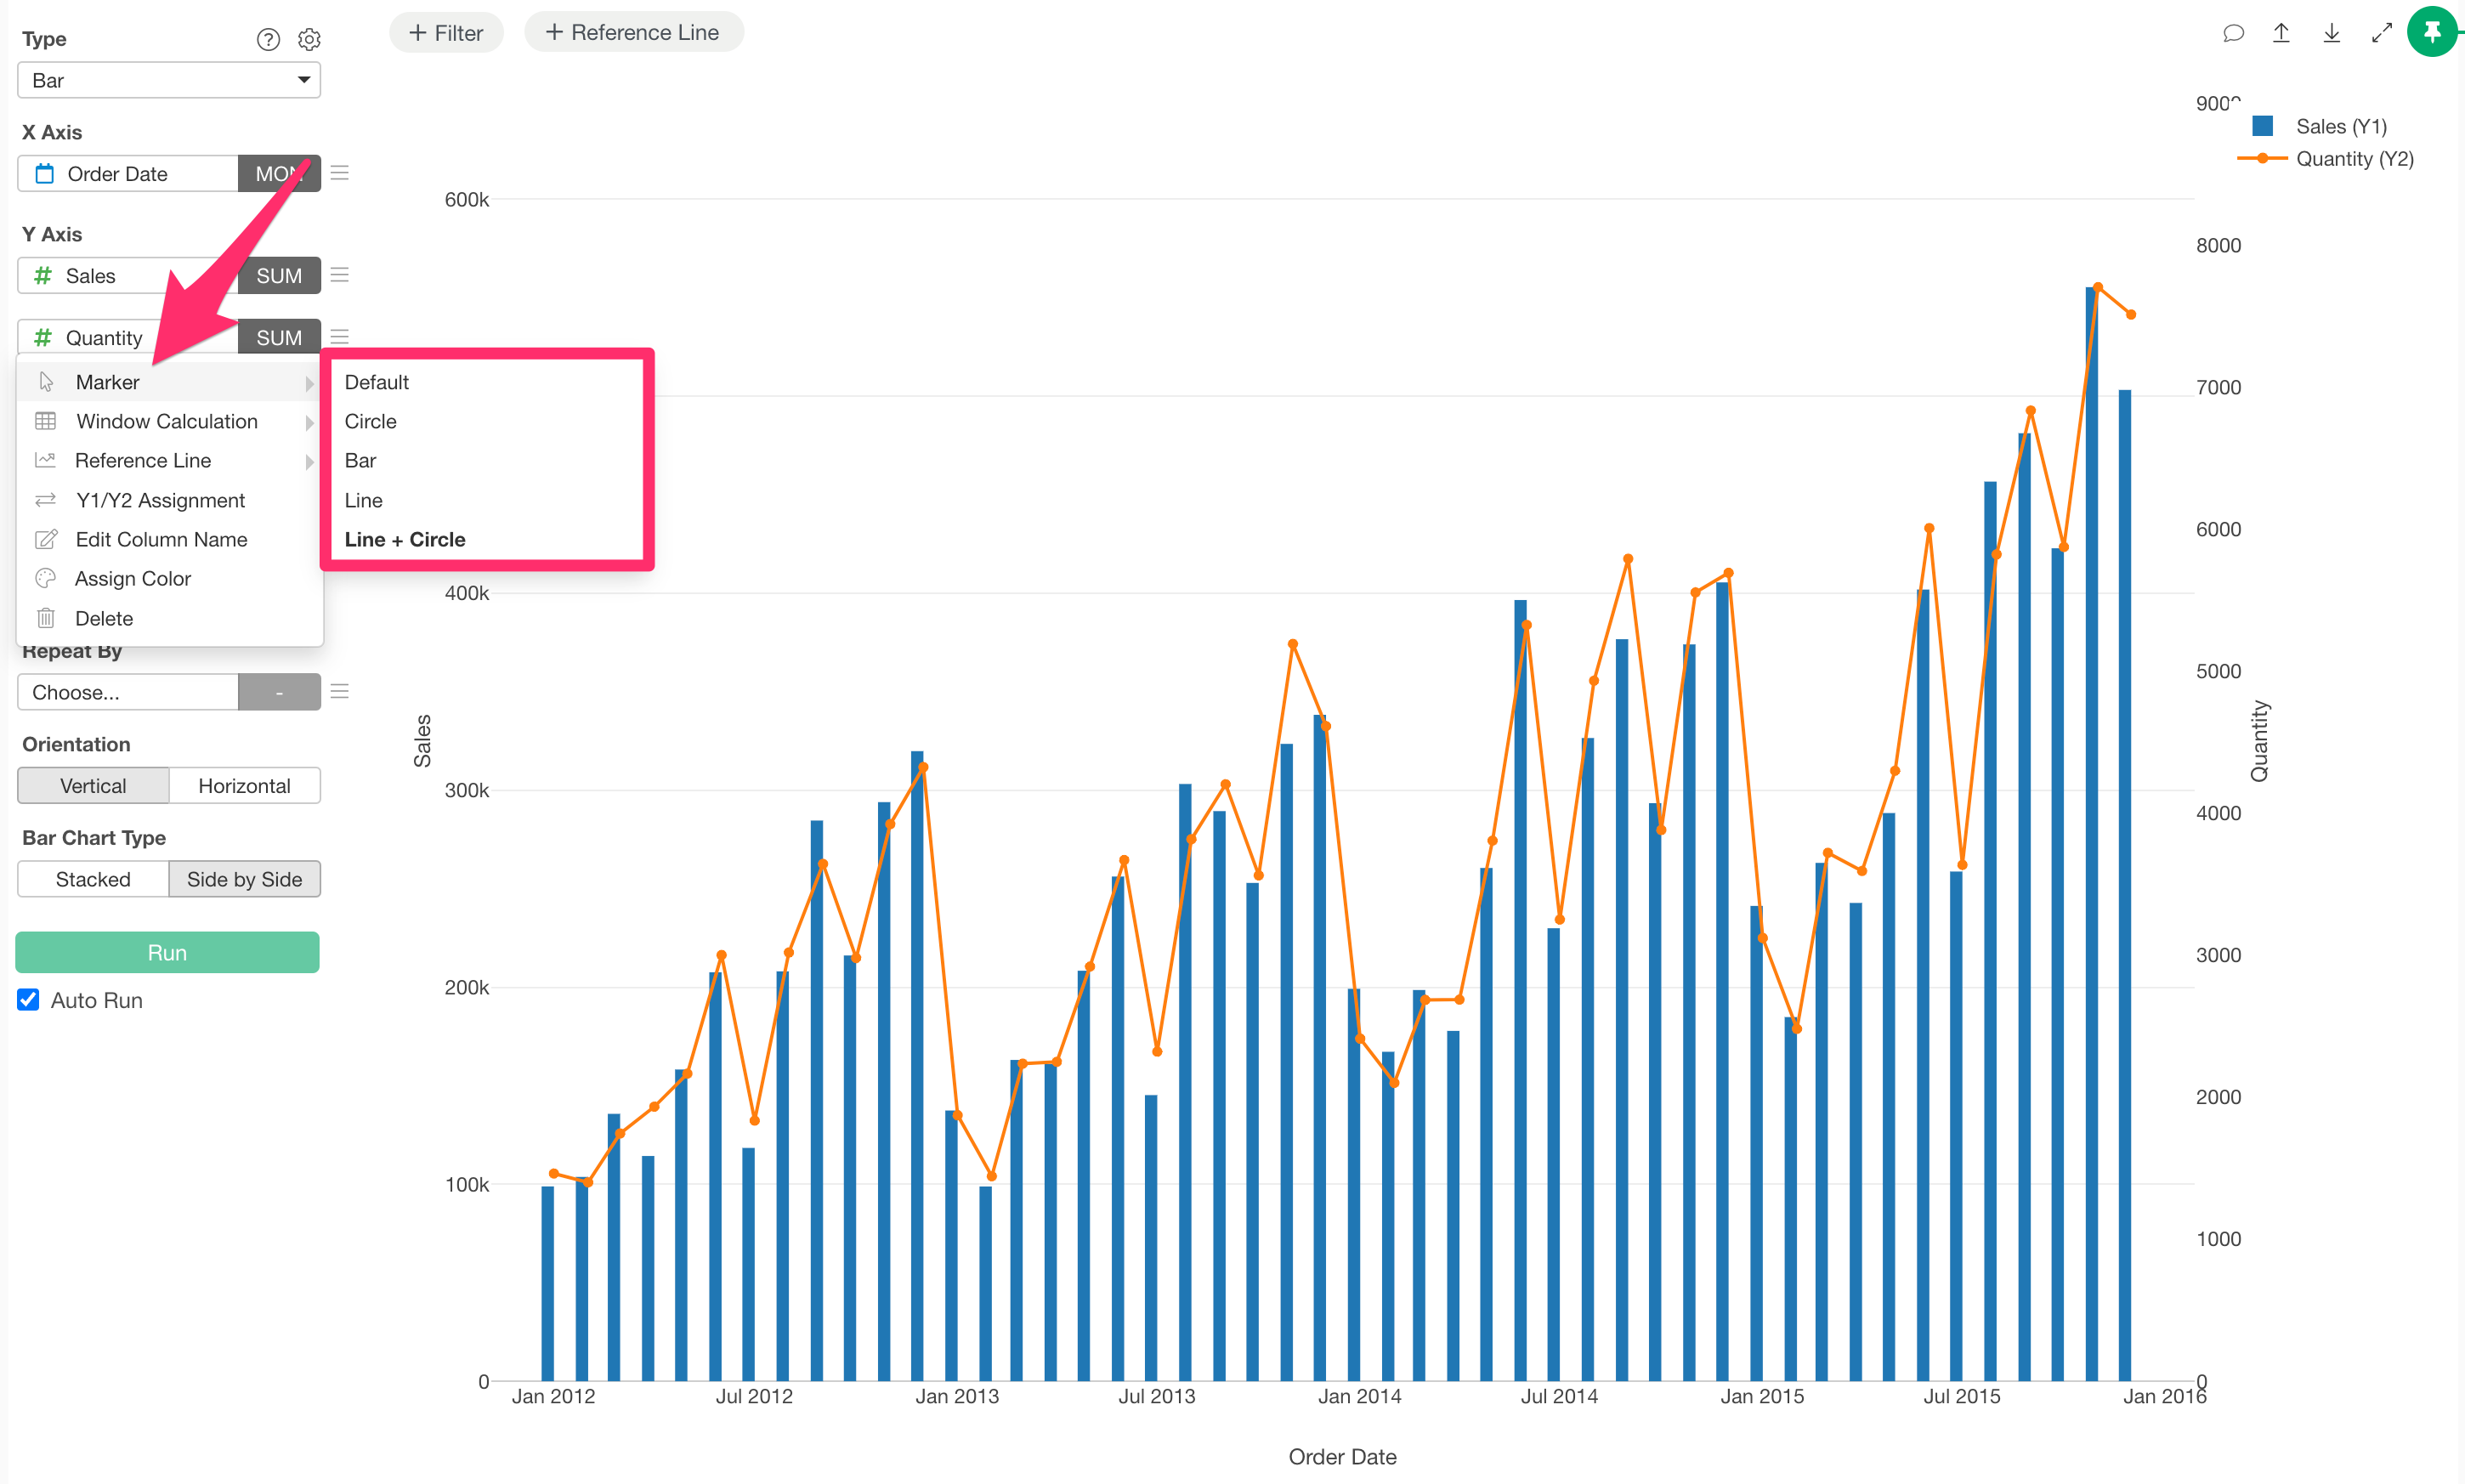
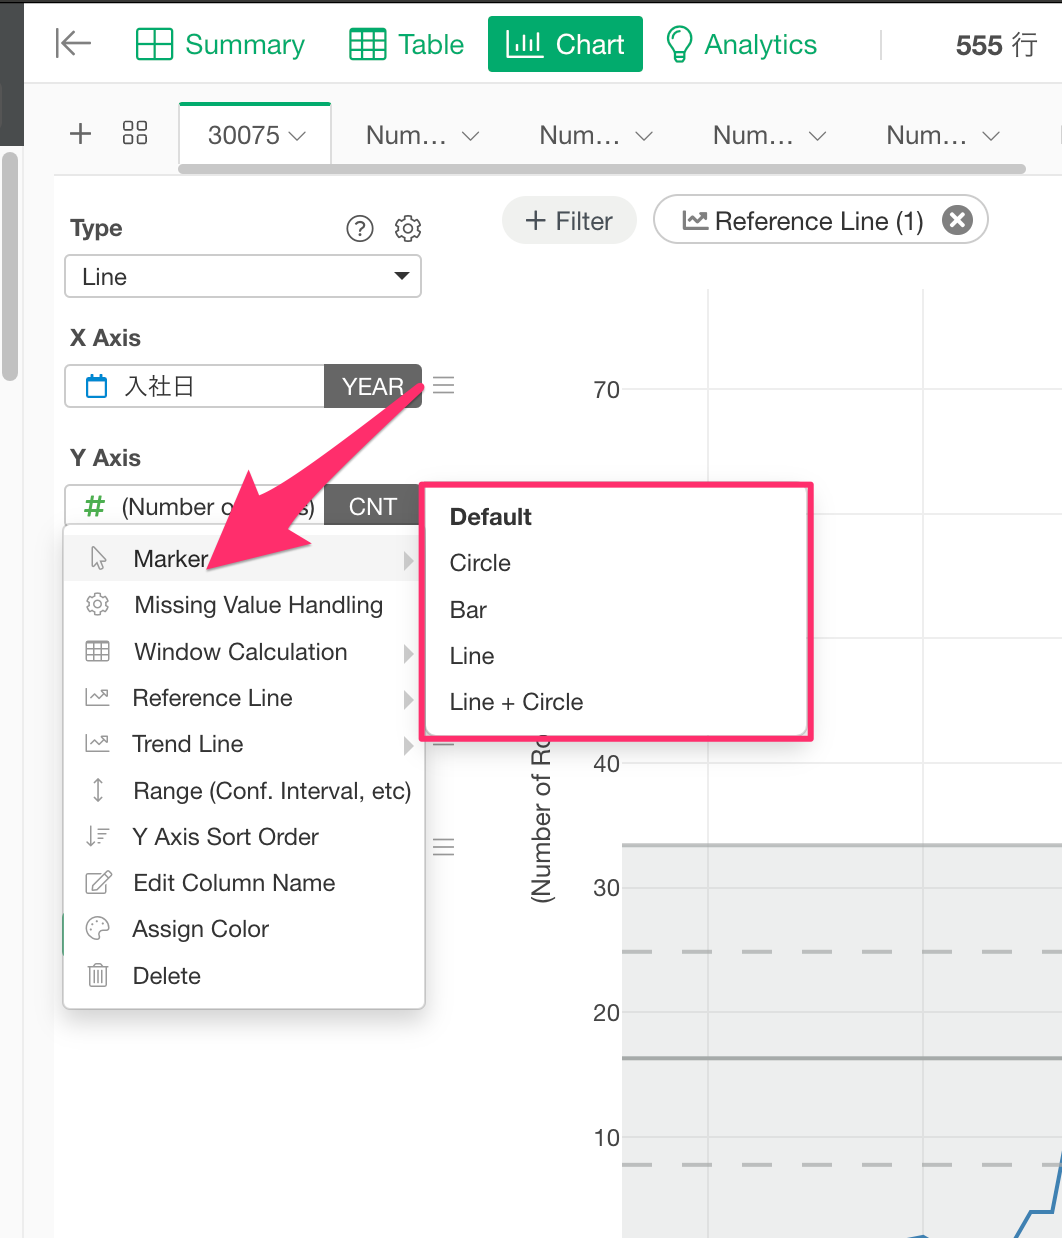
In a Scatter plot, Line chart, or Bar chart, click on the Y-axis column dropdown.
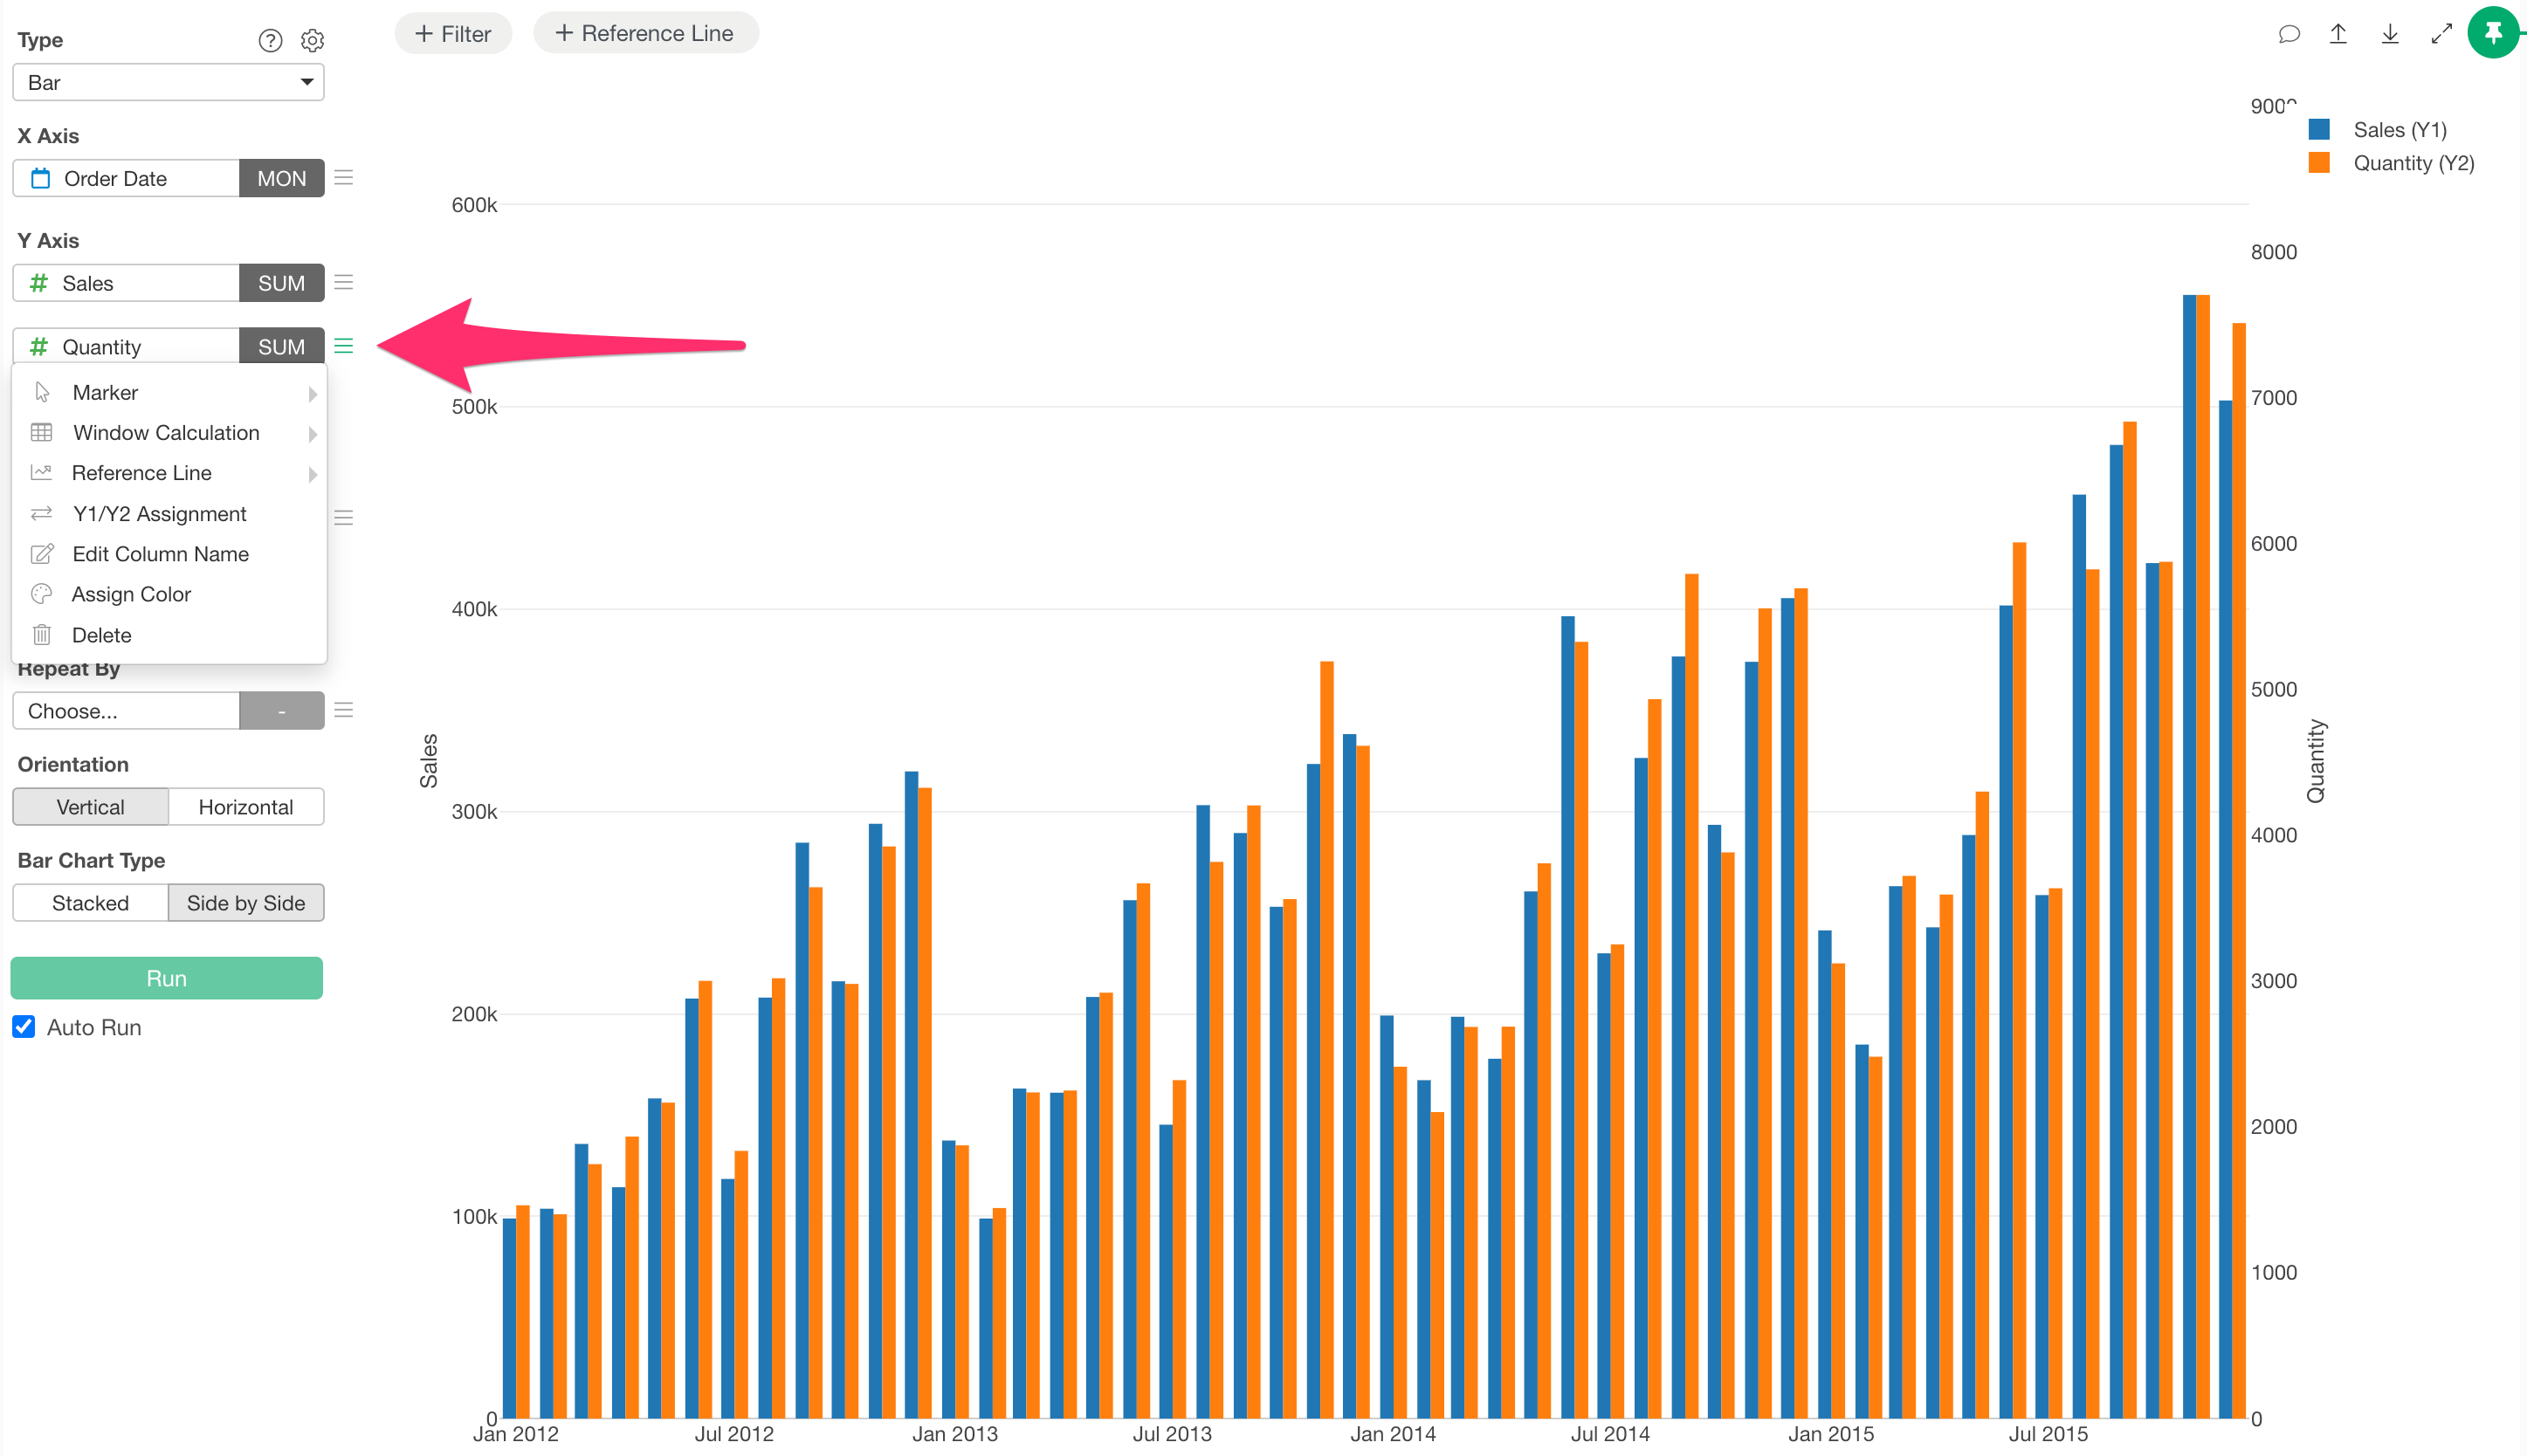
At the top of the dropdown, you will see marker shape shortcuts labeled “Marker.” Select and apply your desired marker to easily change its shape.