How to Run Chronbach's Alpha in Exploratory
Chronbach’s Alpha is a way to measure the internal consistency of a questionnaire or survey.
What is 'internal consistency'? You ask.
**Internal consistency **means that how well your survey questions measures what you want to measure. The higher the internal consistency, the more confident you can be that your survey questions are measuring what you intended.
Chronbach’s Alpha, which calculates the pairwise correlations between questions in a survey, or between variables in your data set.
It returns an alpha score with ranges between 0 and 1. The higher the value is the more reliable the survey is.
The following table shows you how you can interpret the alpha score.
| Cronbach’s Alpha | Internal consistency |
|---|---|
| 0.9 ≤ α | Excellent |
| 0.8 ≤ α < 0.9 | Good |
| 0.7 ≤ α < 0.8 | Acceptable |
| 0.6 ≤ α < 0.7 | Questionable |
| 0.5 ≤ α < 0.6 | Poor |
| α < 0.5 | Unacceptable |
Running Chronbach's Alpha in Note
The easiest way to run the Chronback's Alpha test is to use an 'alpha' function from the psych R package, which is installed as part of Exploratory's installation.
Here's a sample code.
library(psych)

data = Beer_Survey %>% select(COST, SIZE)

alpha(data)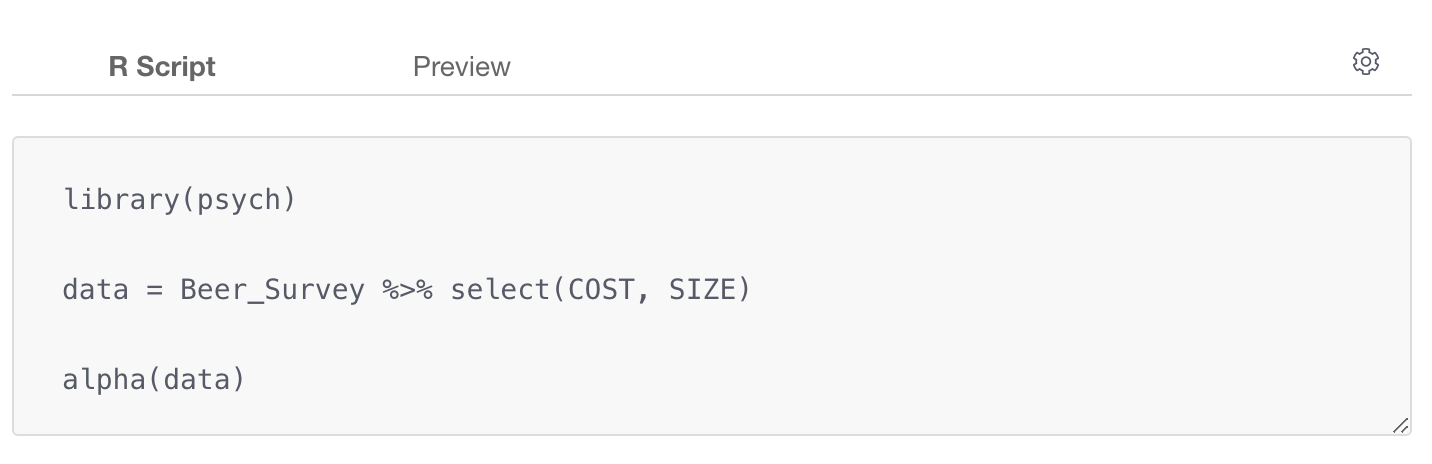
The first line is loading the psych package into the Note so that you can call any functions from the package.
The second line is specifying a data frame that should be available inside the same project, then selecting which columns to use. The result of the column selection is stored in the data frame called 'data'. This 'data' can be any name of your preference.
The third line is calling the function 'alpha' and passing the data frame that was setup at the second line.
You can click on the Preview tab to see the result.
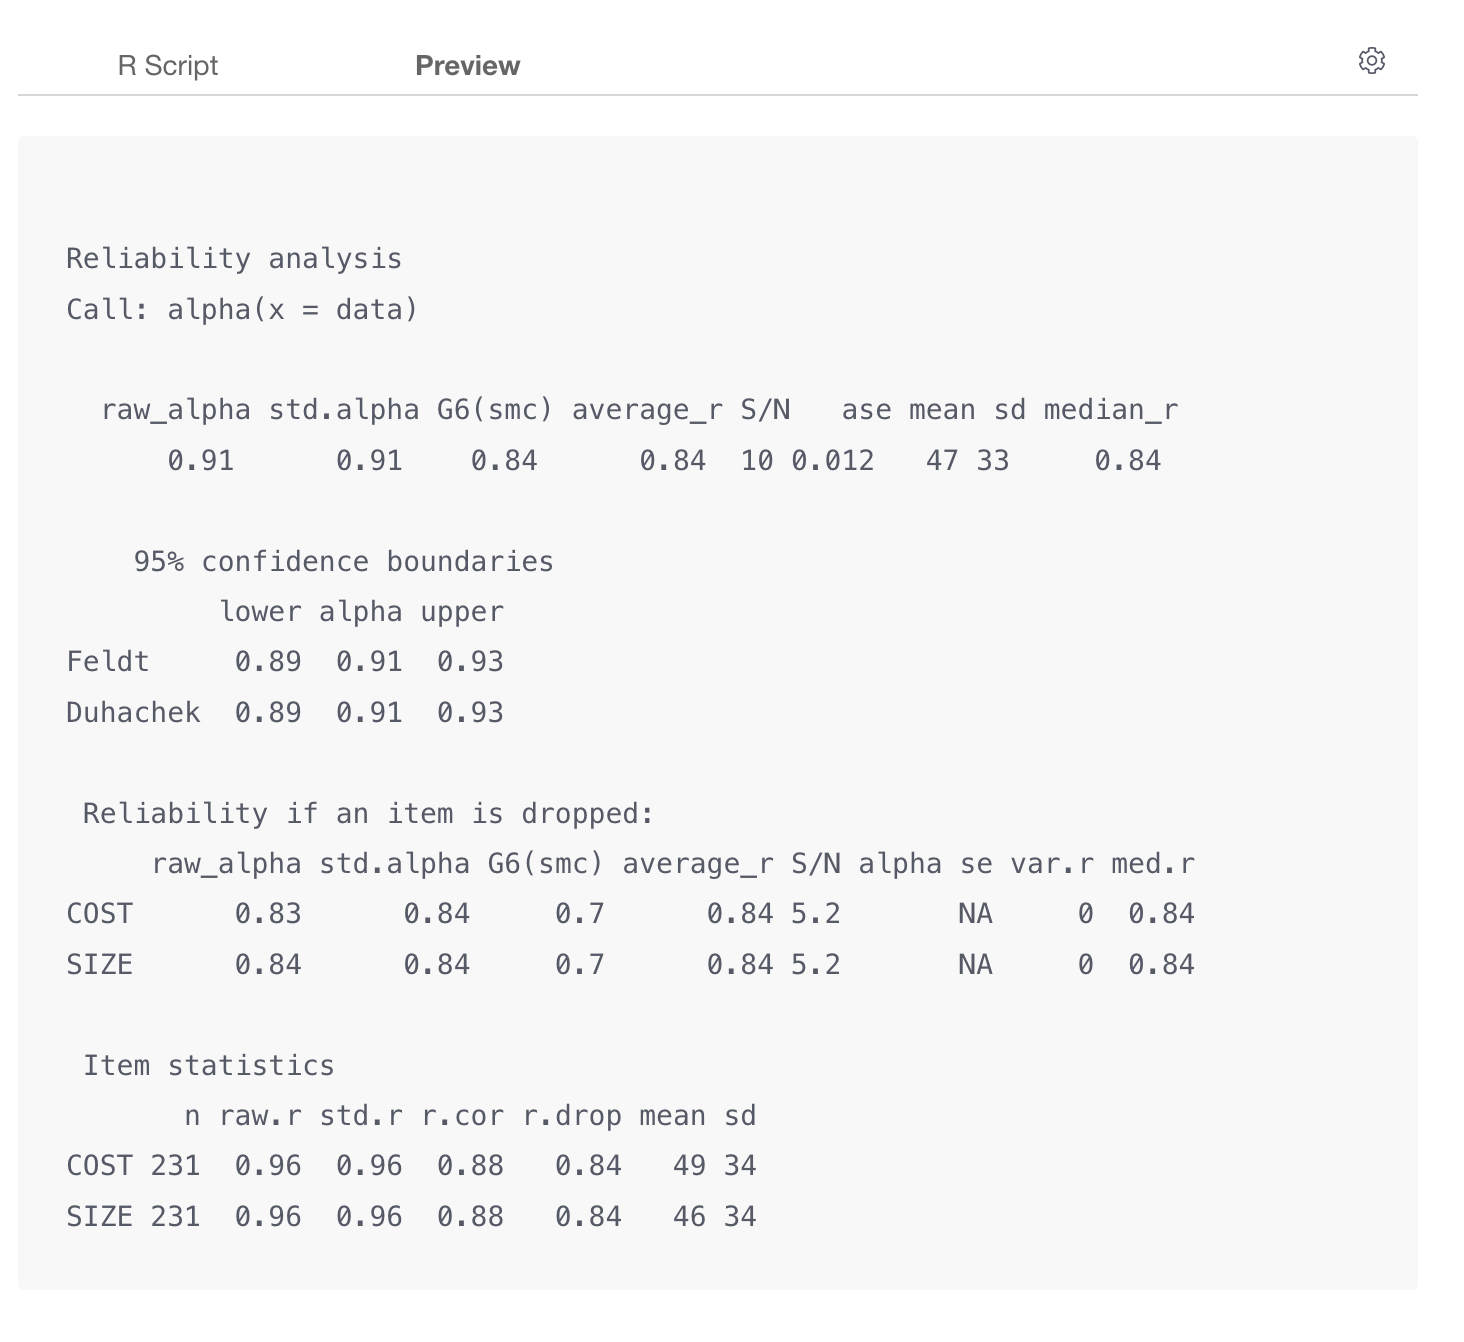
The alpha score is 0.91, so we can interpret it that the internal consistency is excellent for these two questions.
Preview or Publish
When you preview the Note by clicking on the Preview button at the top or publish it by clicking on the Publish button at the top, only the result will be shown without the code nor the tabs of 'R Script' or 'Preview.
In fact, the following is the result of the above R code.
Reliability analysis
Call: alpha(x = data)

  raw_alpha std.alpha G6(smc) average_r S/N   ase mean sd median_r
      0.91      0.91    0.84      0.84  10 0.012   47 33     0.84

    95% confidence boundaries
         lower alpha upper
Feldt     0.89  0.91  0.93
Duhachek  0.89  0.91  0.93

 Reliability if an item is dropped:
     raw_alpha std.alpha G6(smc) average_r S/N alpha se var.r med.r
COST      0.83      0.84     0.7      0.84 5.2       NA     0  0.84
SIZE      0.84      0.84     0.7      0.84 5.2       NA     0  0.84

 Item statistics
       n raw.r std.r r.cor r.drop mean sd
COST 231  0.96  0.96  0.88   0.84   49 34
SIZE 231  0.96  0.96  0.88   0.84   46 34