How to Run Tukey's HSD Test on Exploratory
Tukey's HSD Test (also known as Tukey's range test) is used to find between which pairs of samples significant differences lie, among 3 or more samples.
As of version 6.0, Exploratory does not have Analytics View for Tukey's HSD test, but we can run it by calling R's TukeyHSD function using Custom R Steps.
I will explain how to to it in this Note.
Data
Let's use R's default warpbreaks data for example. This data has number of broken warps (the lengthwise threads of fabrics) under conditions of different types of wool (A and B) and different strength of tension (High, Middle, Low) during weaving fabrics.
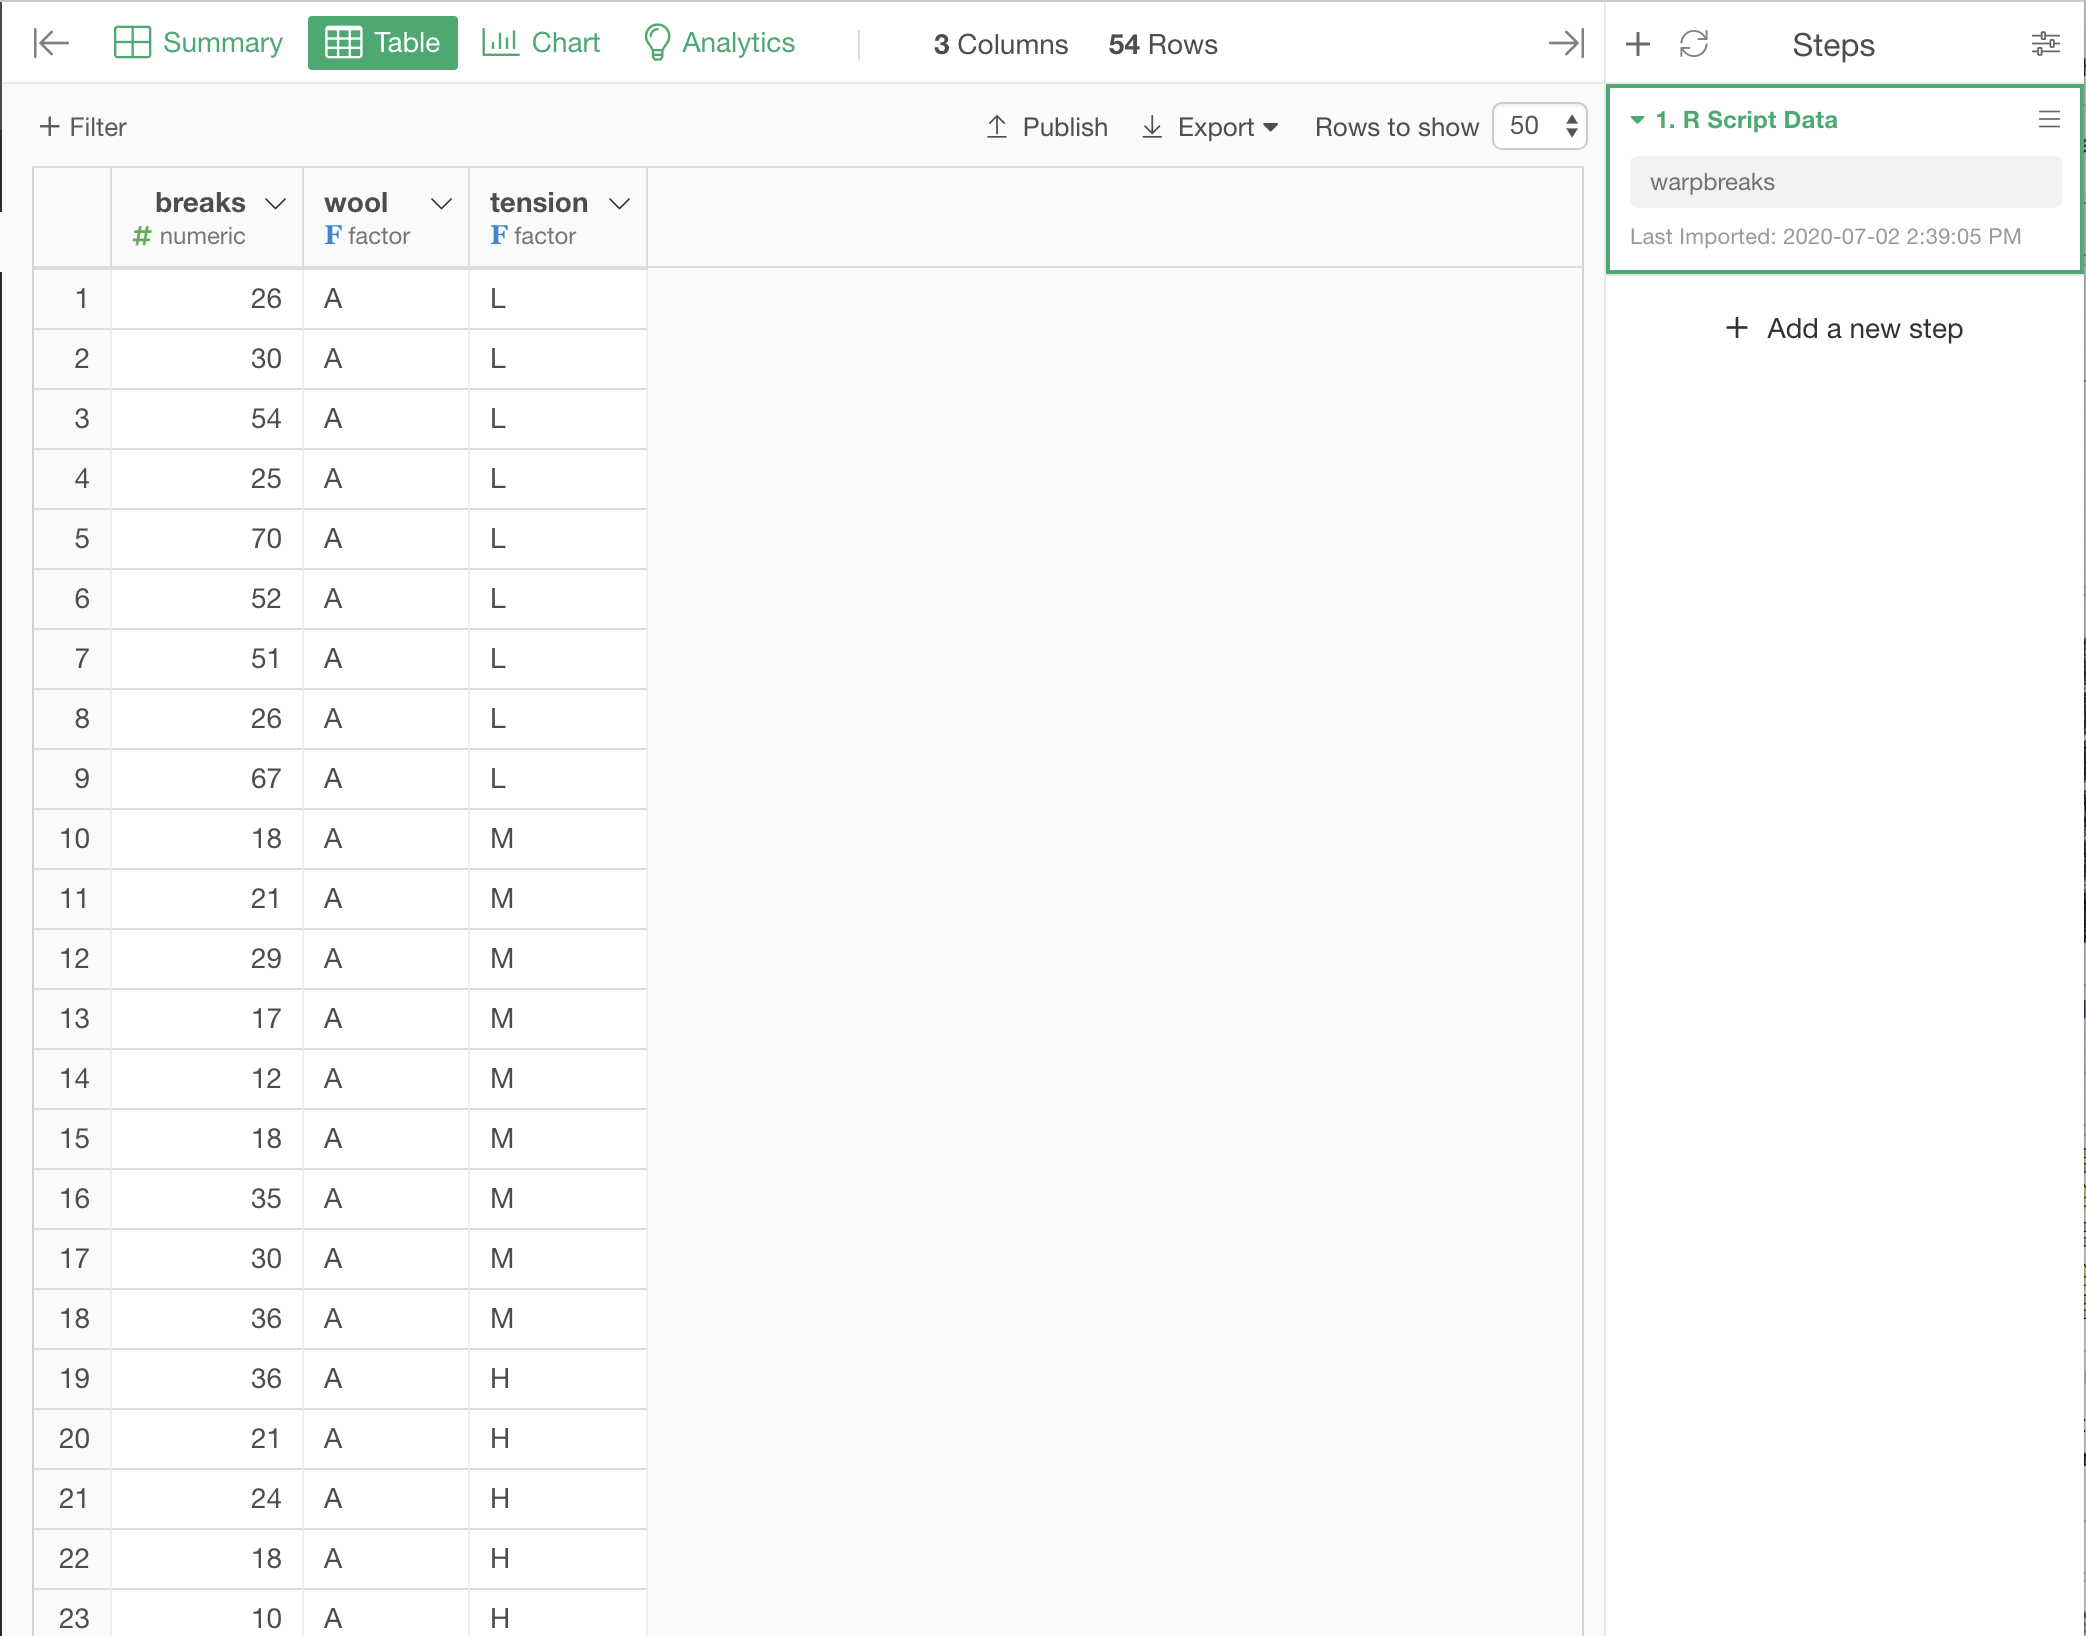
Let's find out if there are significant differences in number of broken warps between pairs of different tensions (e.g. between High and Middle, or between Middle and Low).
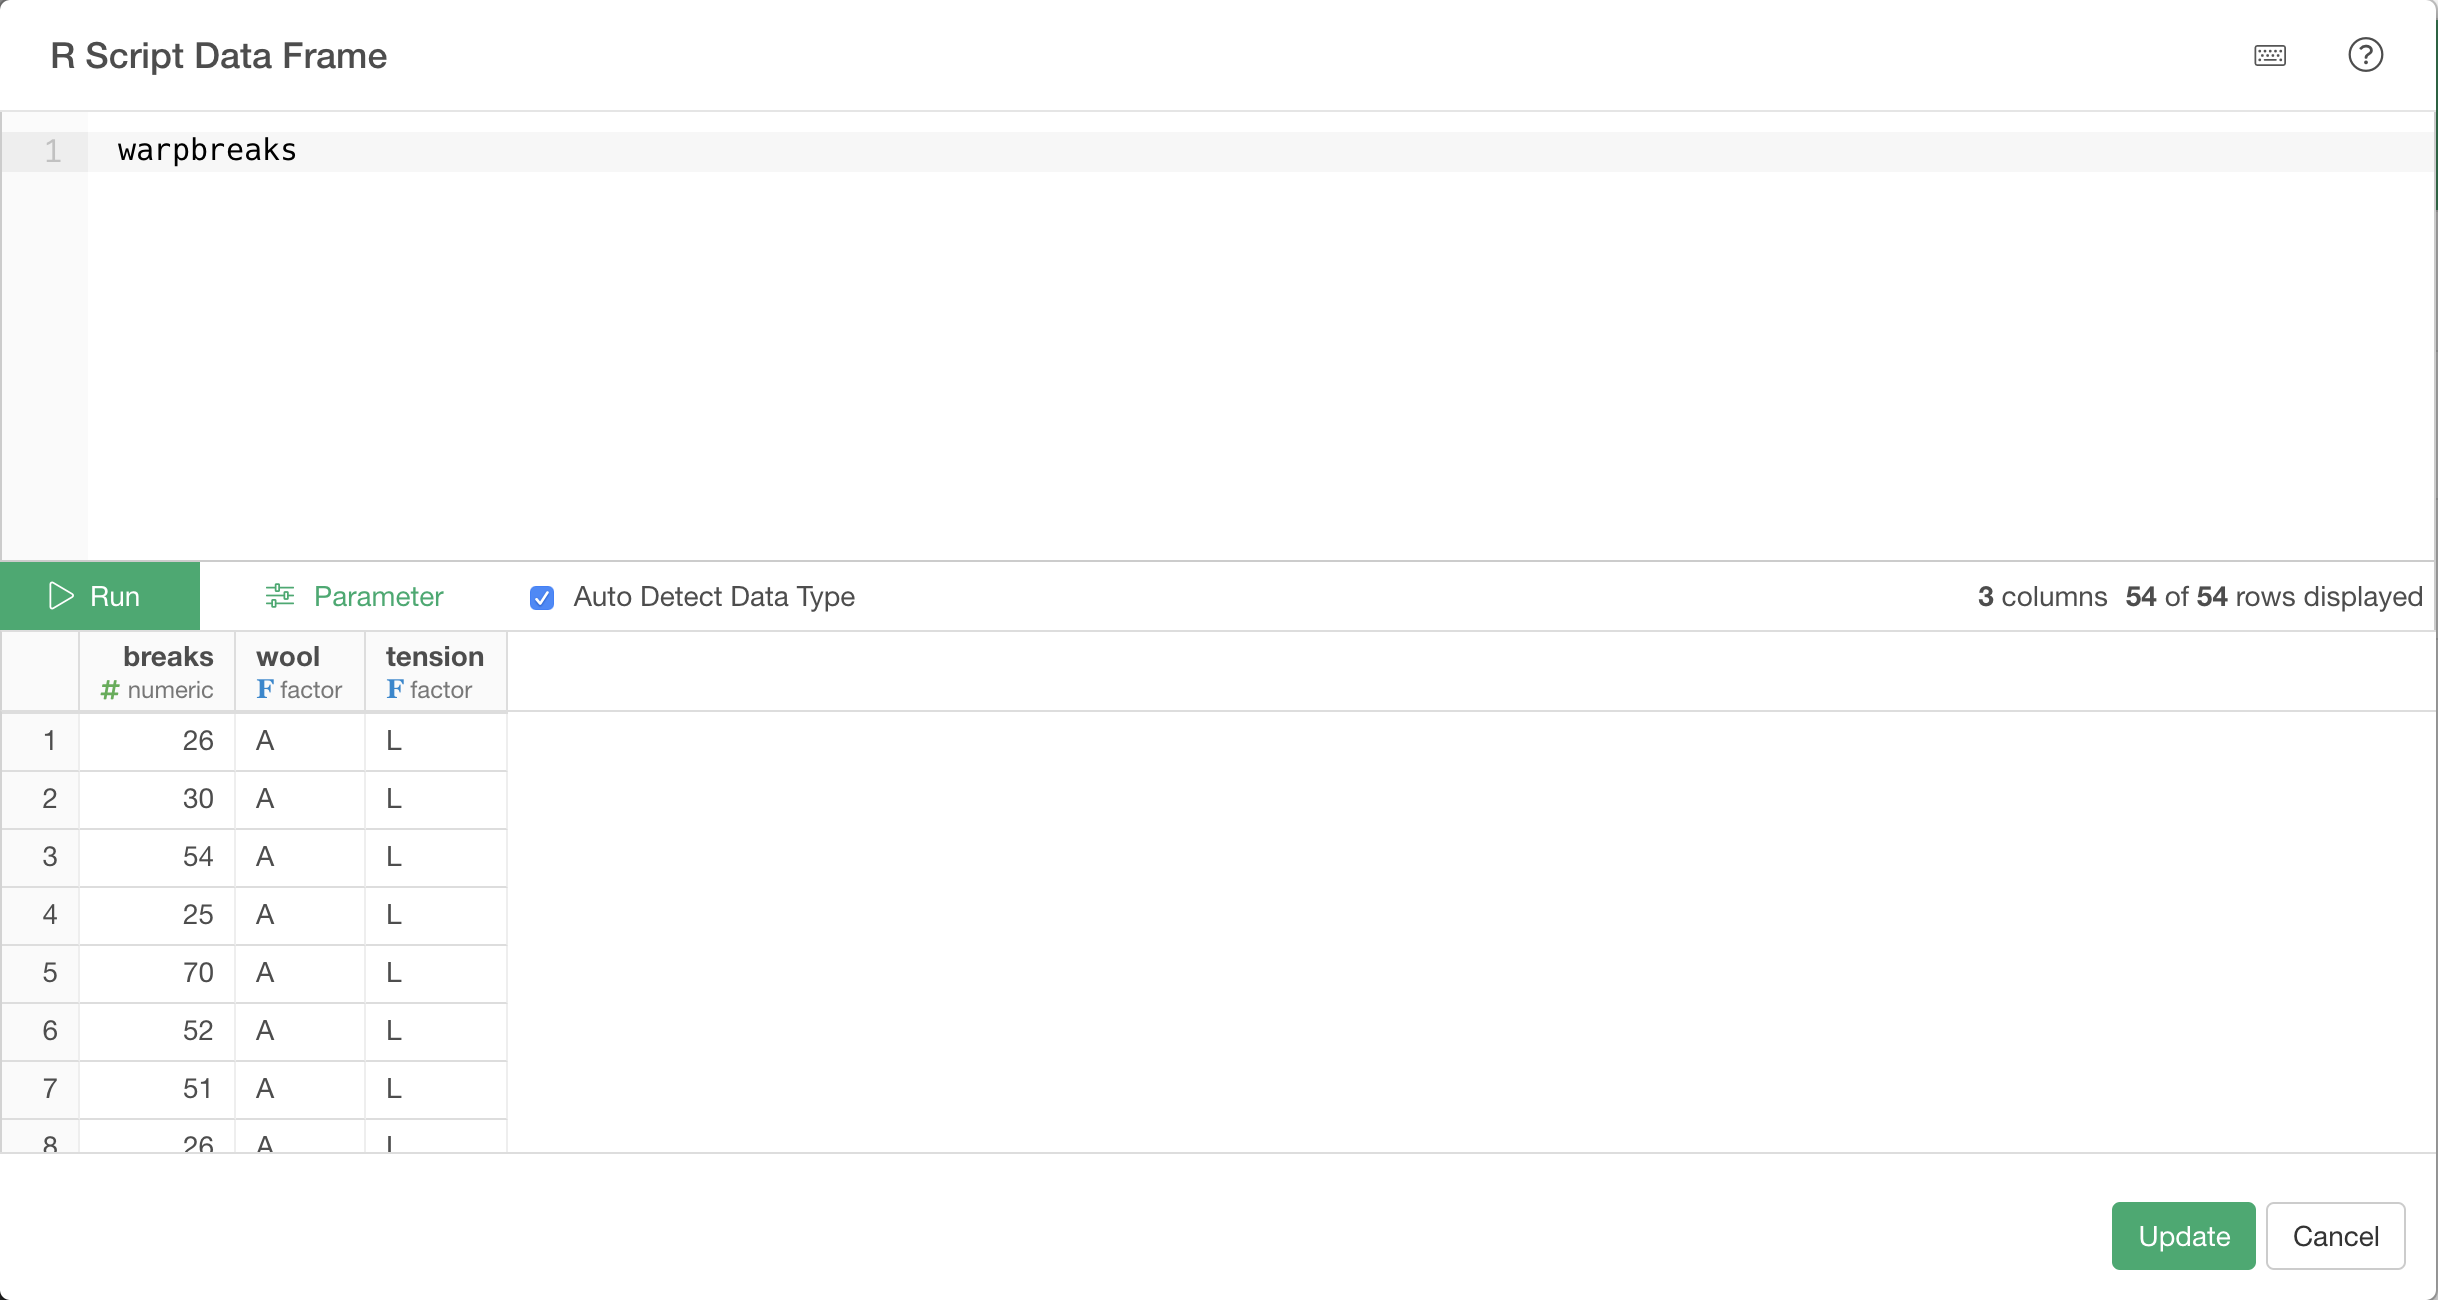
The data frame with this data can be created by loading it from R as an R Script Data Frame.
Create Model Object for the Test
Now let's run Tukey's HSD test.
Add a Custom R Command step with the following script, creating a data frame with a columb named model.
do(model=TukeyHSD(aov(breaks ~ tension, data = .), "tension", ordered = TRUE))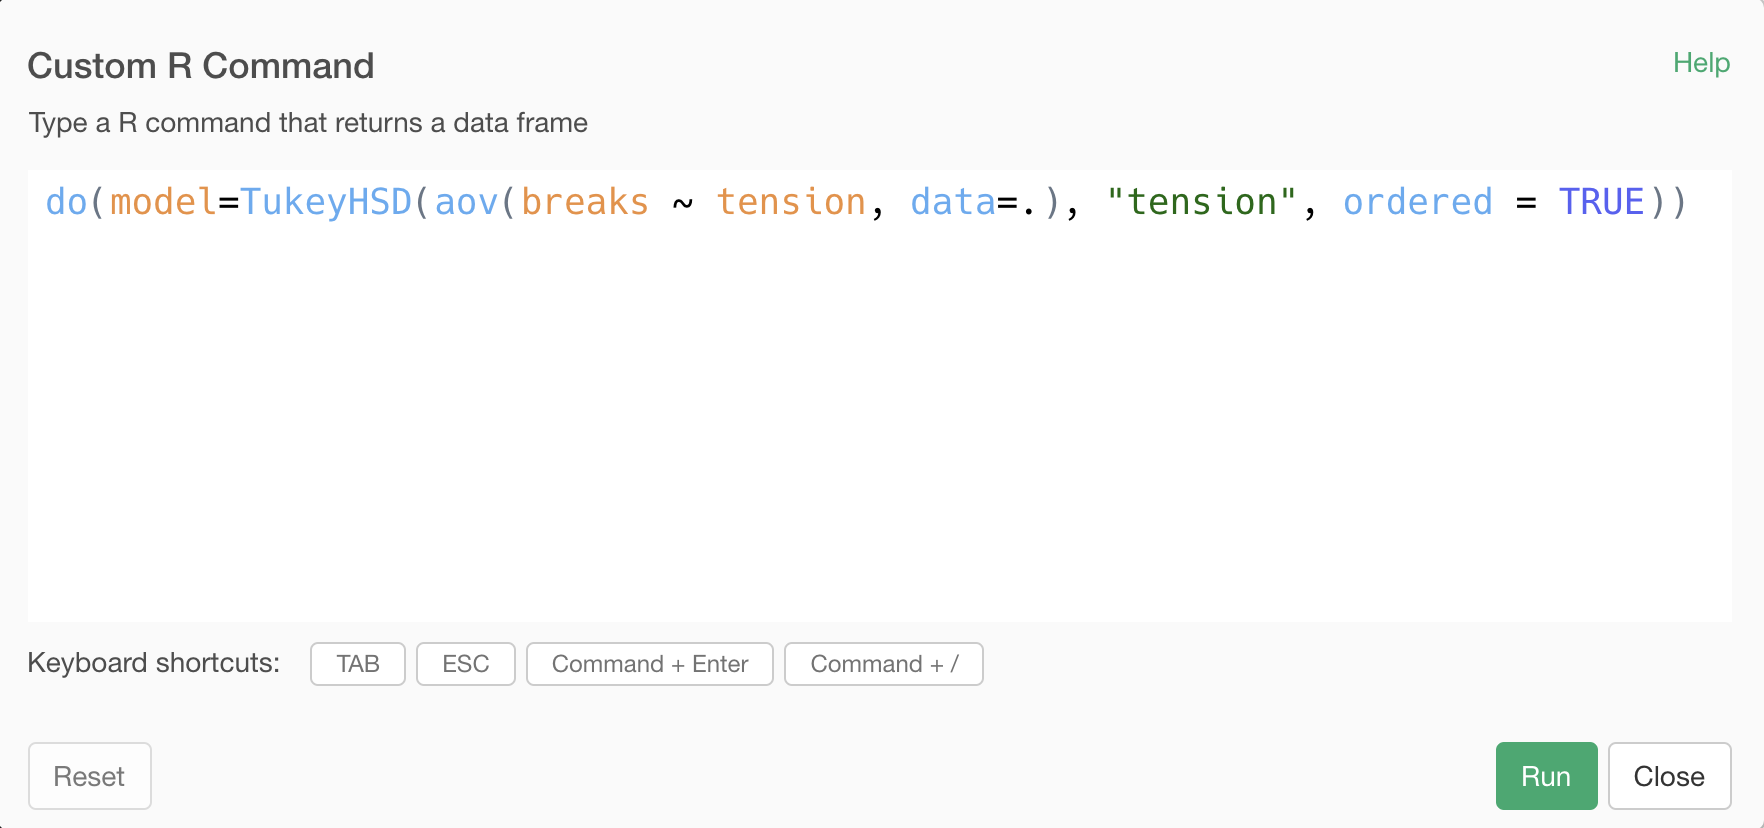
The . in the above script means the original data frame. It is creating a model object for Tukey's HSD test run on the original data frame, and storing it as the model column of the resulting data frame.
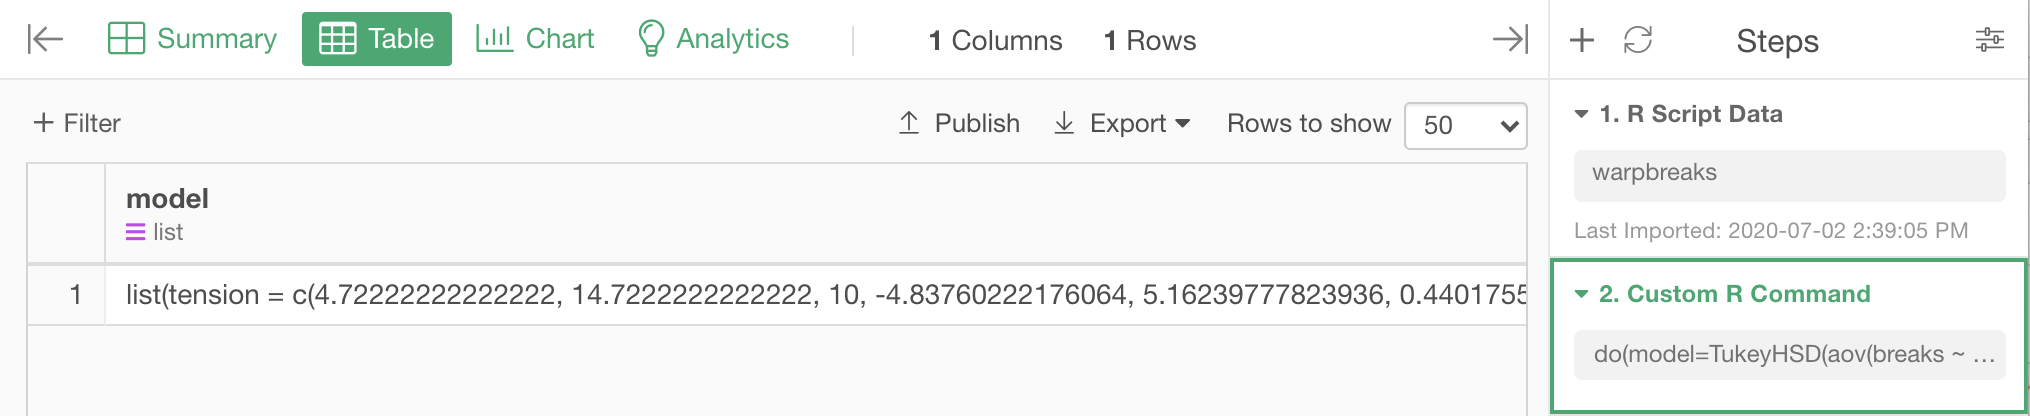
The model column, as its value, has a model object, which holds the result of the test.
Extract Test Results by broom's tidy command
To retrieve test result, add another Custom Step with the following command.
model_info(model, output="variables")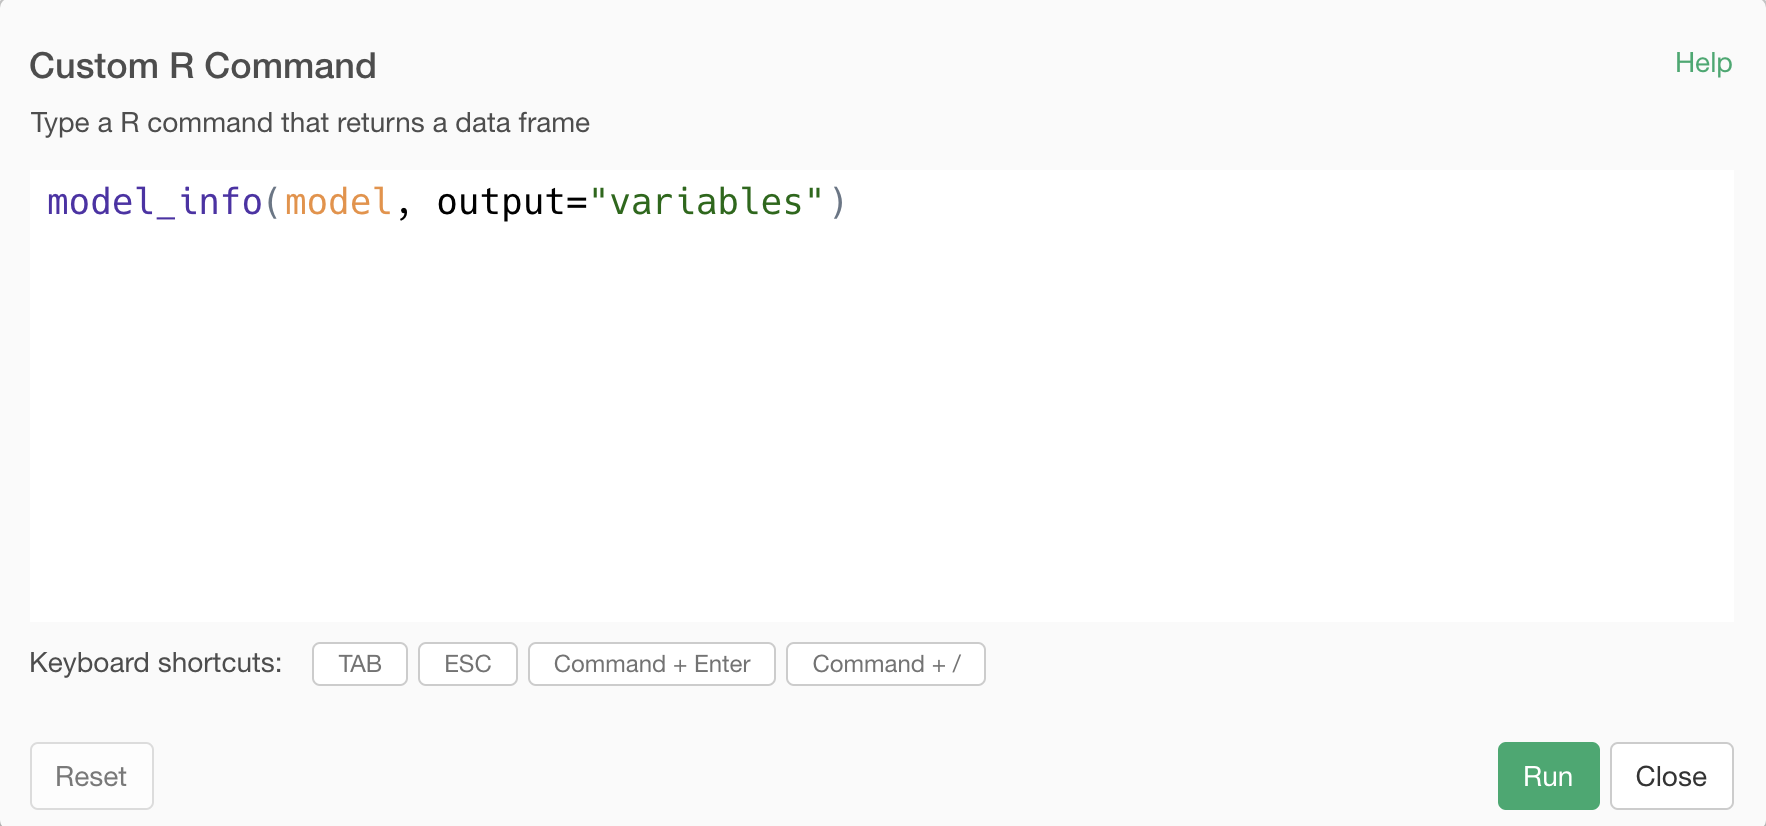
tidy_rowwise is Exploratory's function that calls tidy function for models stored in a column of a data frame. tidy is a function from a R package called Broom. Broom package contains a various set of functions that help you work with statistical / machine learning models easily by converting them into a tidy format. tidy function extracts the model summary information and put it in a data frame.
This creates a step which has the result as a data frame like following.
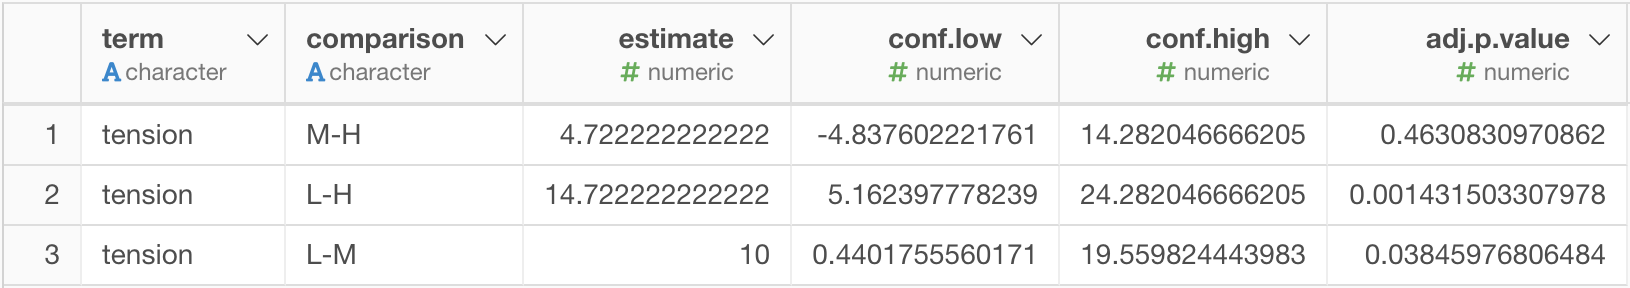
In this case, P value (adj.p.value column) is below 0.05 between low tension and other 2 strength of tension (L-M and L-H). This means applying low tension makes difference, but we can't say there are significant differences between midium tension and high tension (H-M).
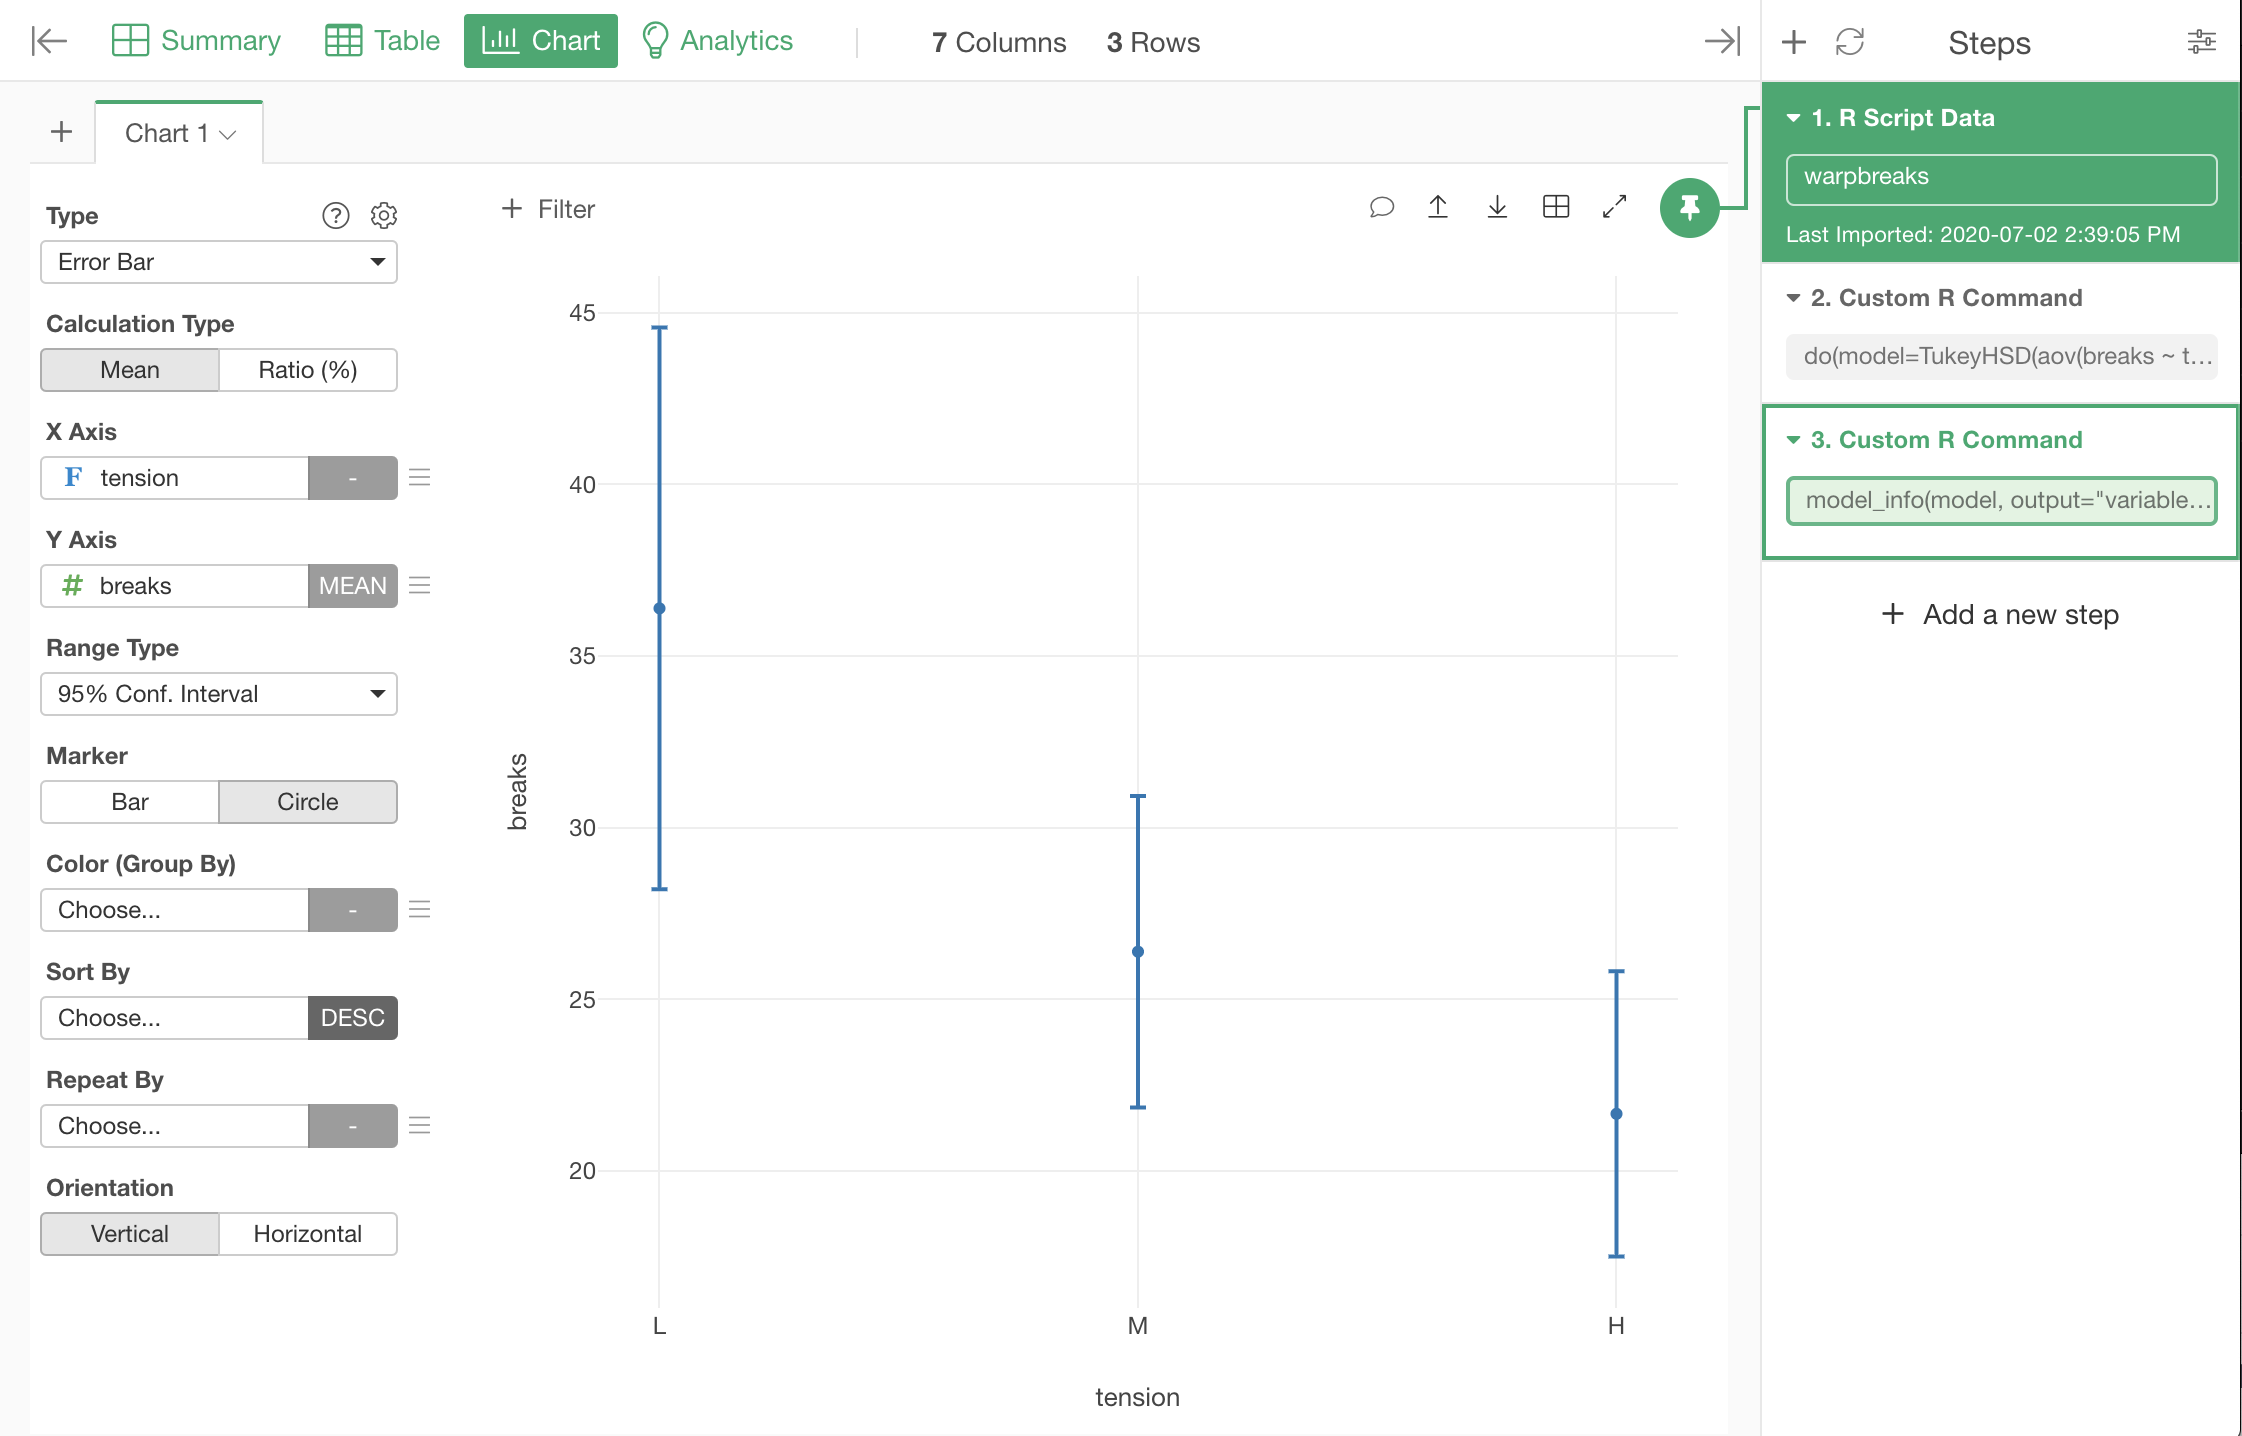
Looking at the data with error bars, we can see that the result of the test corresponds with how the 95% confidence intervals of number of broken warps for each tension overlap, or do not overlap.
R's TukeyHSD function we used internally runs Tukey-Kramer method, which is an improved version of Tukey's HSD test, so that it can handle samples of different sizes. In this example, the sizes of different tensions were the same, but this function can handle the samples of different sizes the same way.