How to Set Value Order
This note introduces how to “set value order”.
There is a data type called “Factor (ordered category)” which assigns intrinsic ordinal relationship information to Character type.
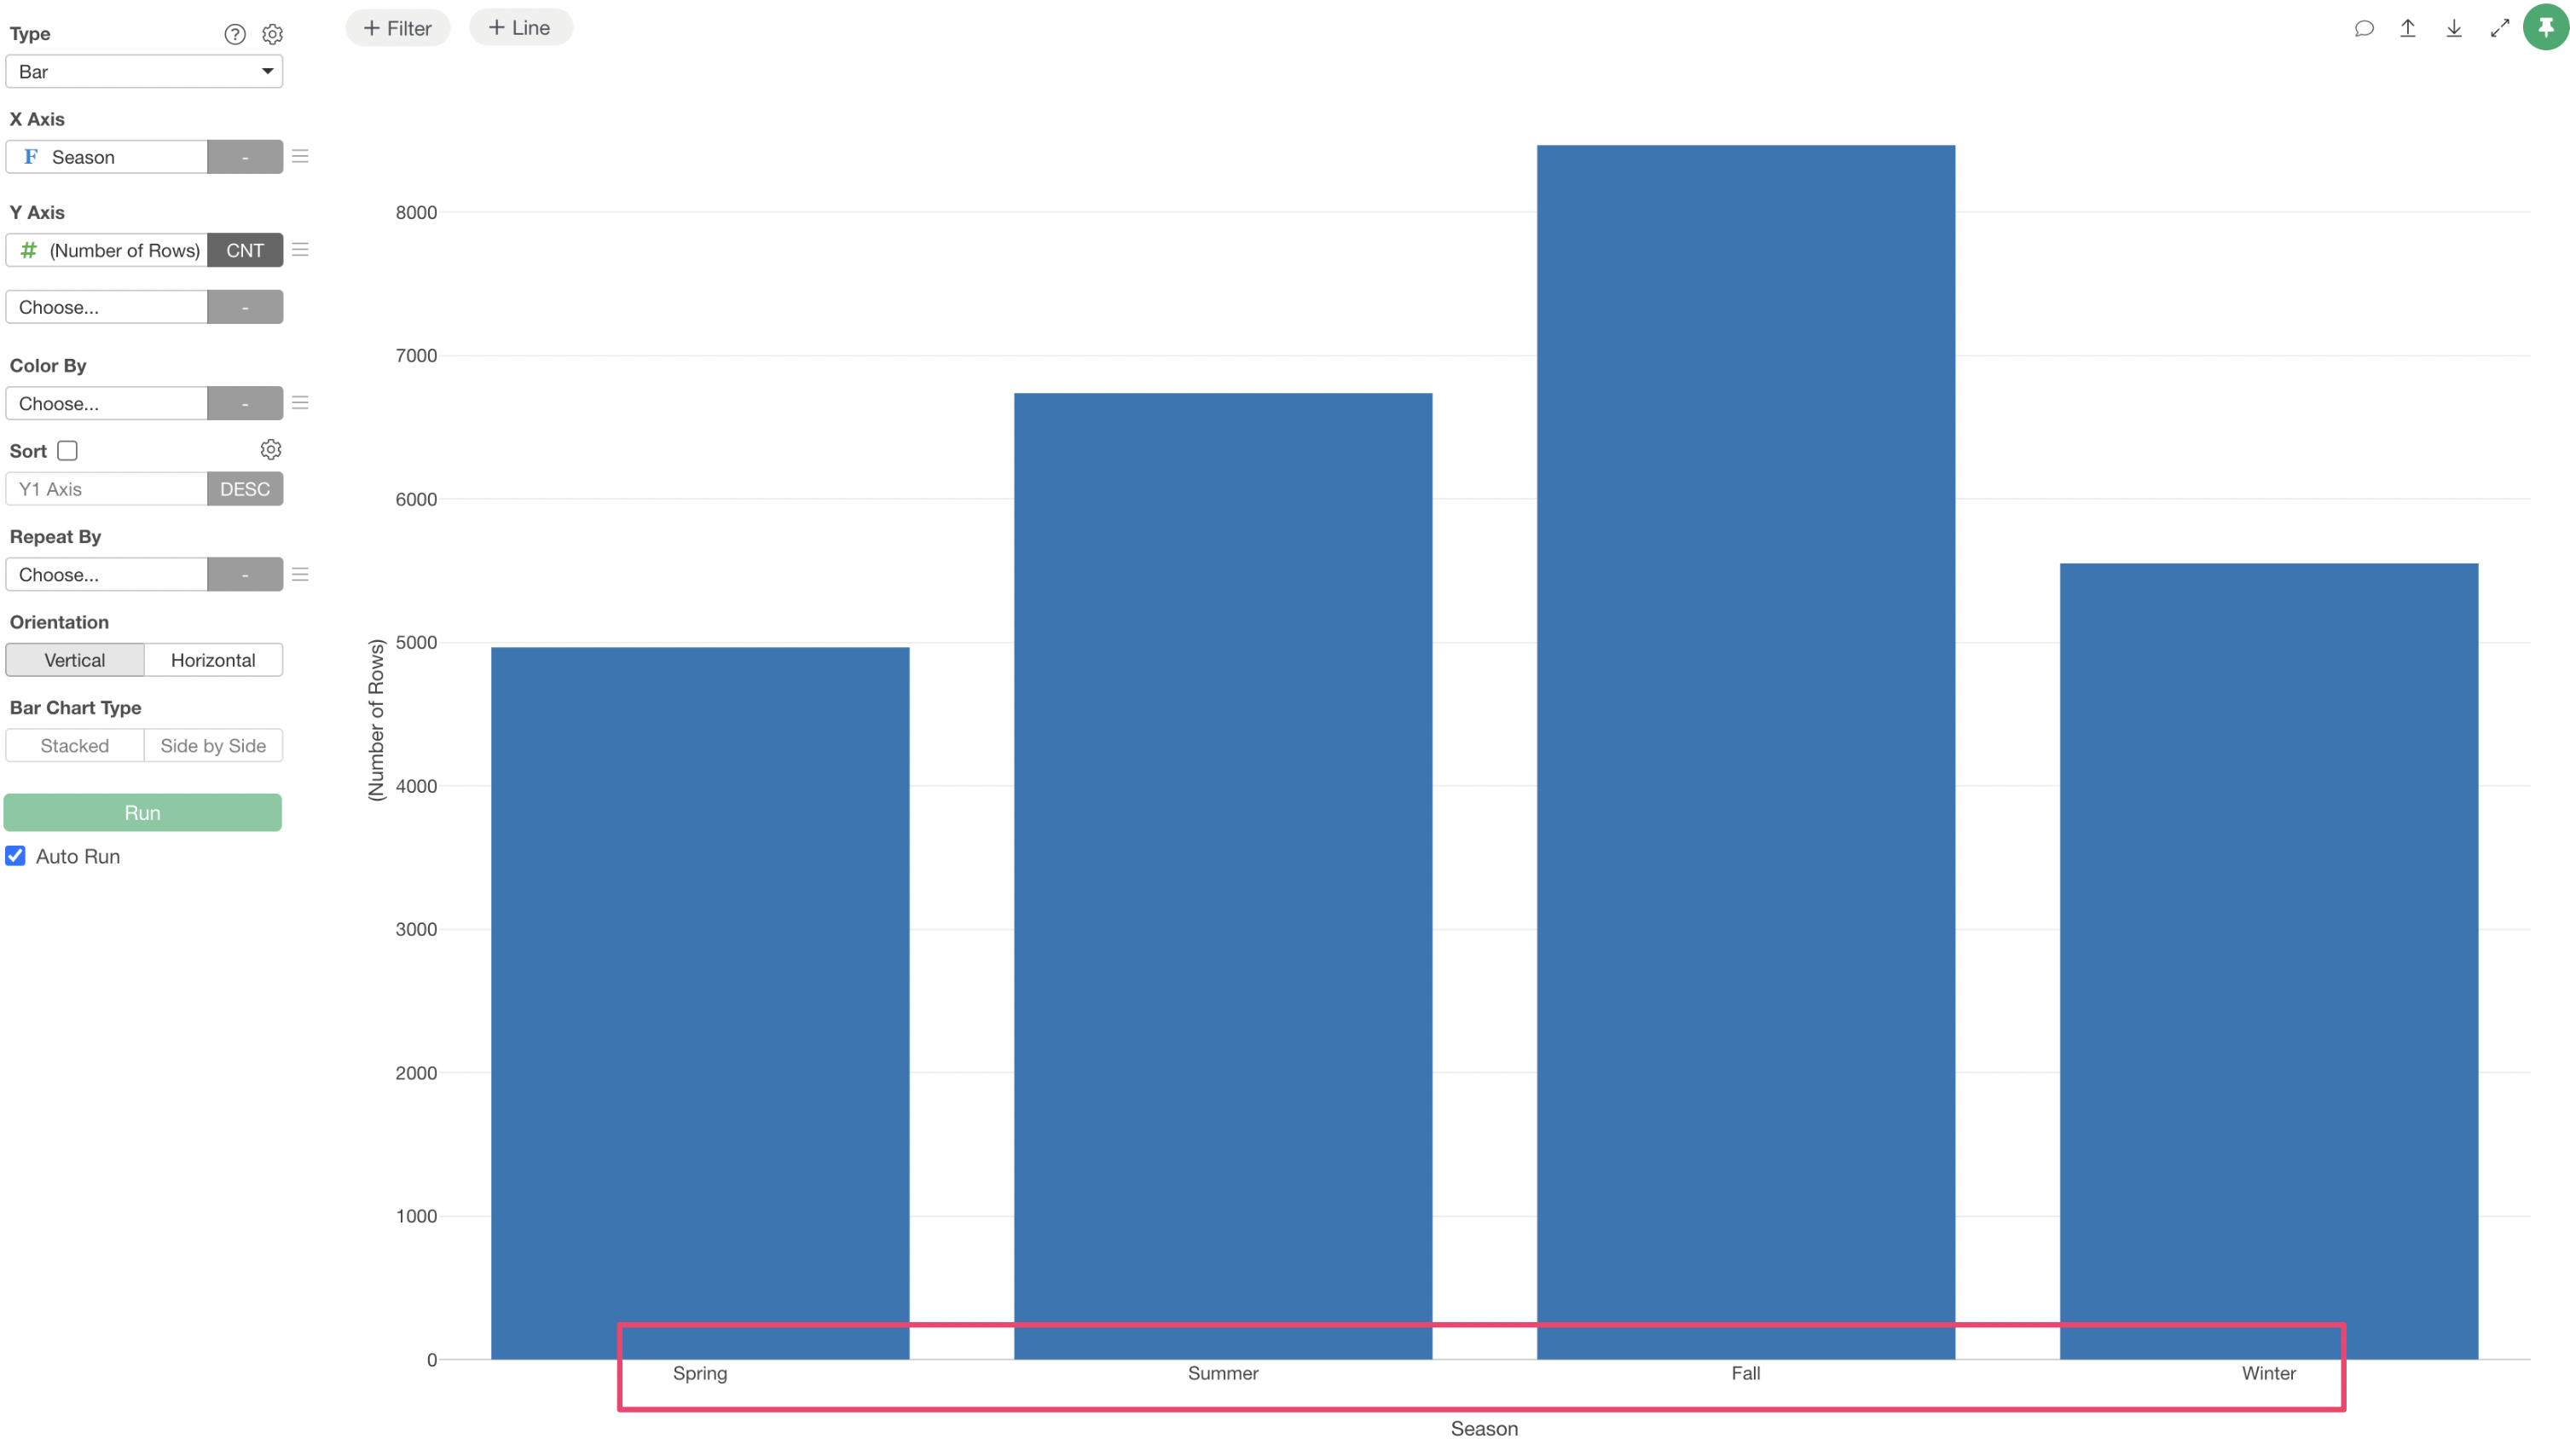
There are many advantages to using Factor type data. For example, one of the most obvious benefits is that when visualizing Factor type data with an internal ordinal relationship, such as “Spring - Summer - Autumn - Winter”, categories can be arranged based on their internal ordinal relationship.
The information about the order (sequence) assigned to each category is called a “level”. The level of the first category is “1”, and the level increases as the order progresses.
5 Ways Set Order for Values
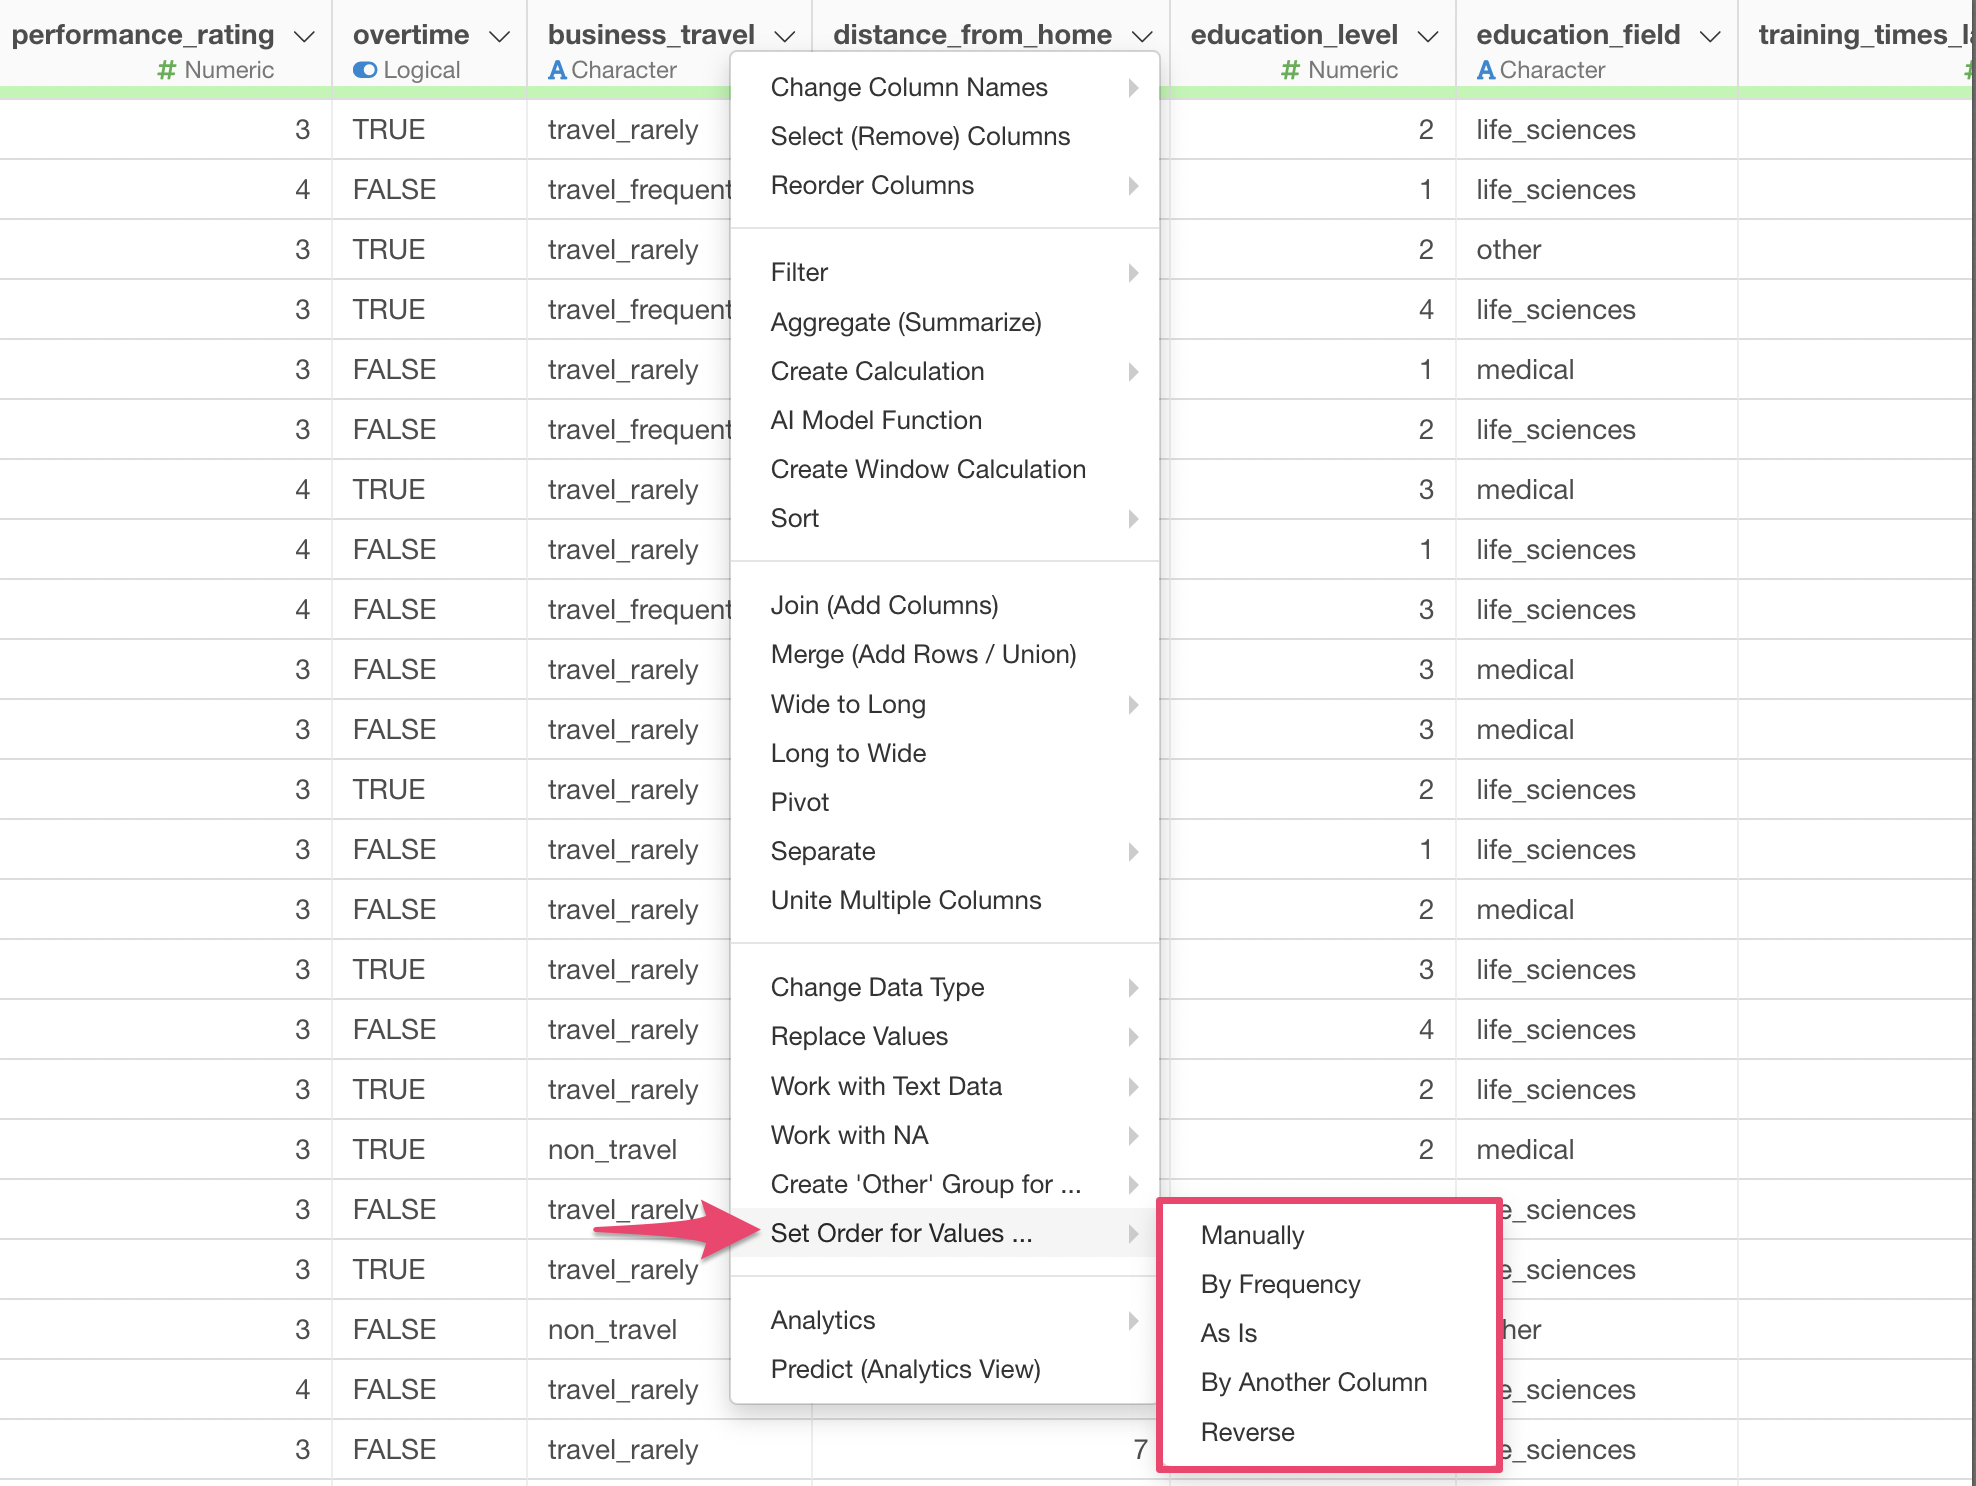
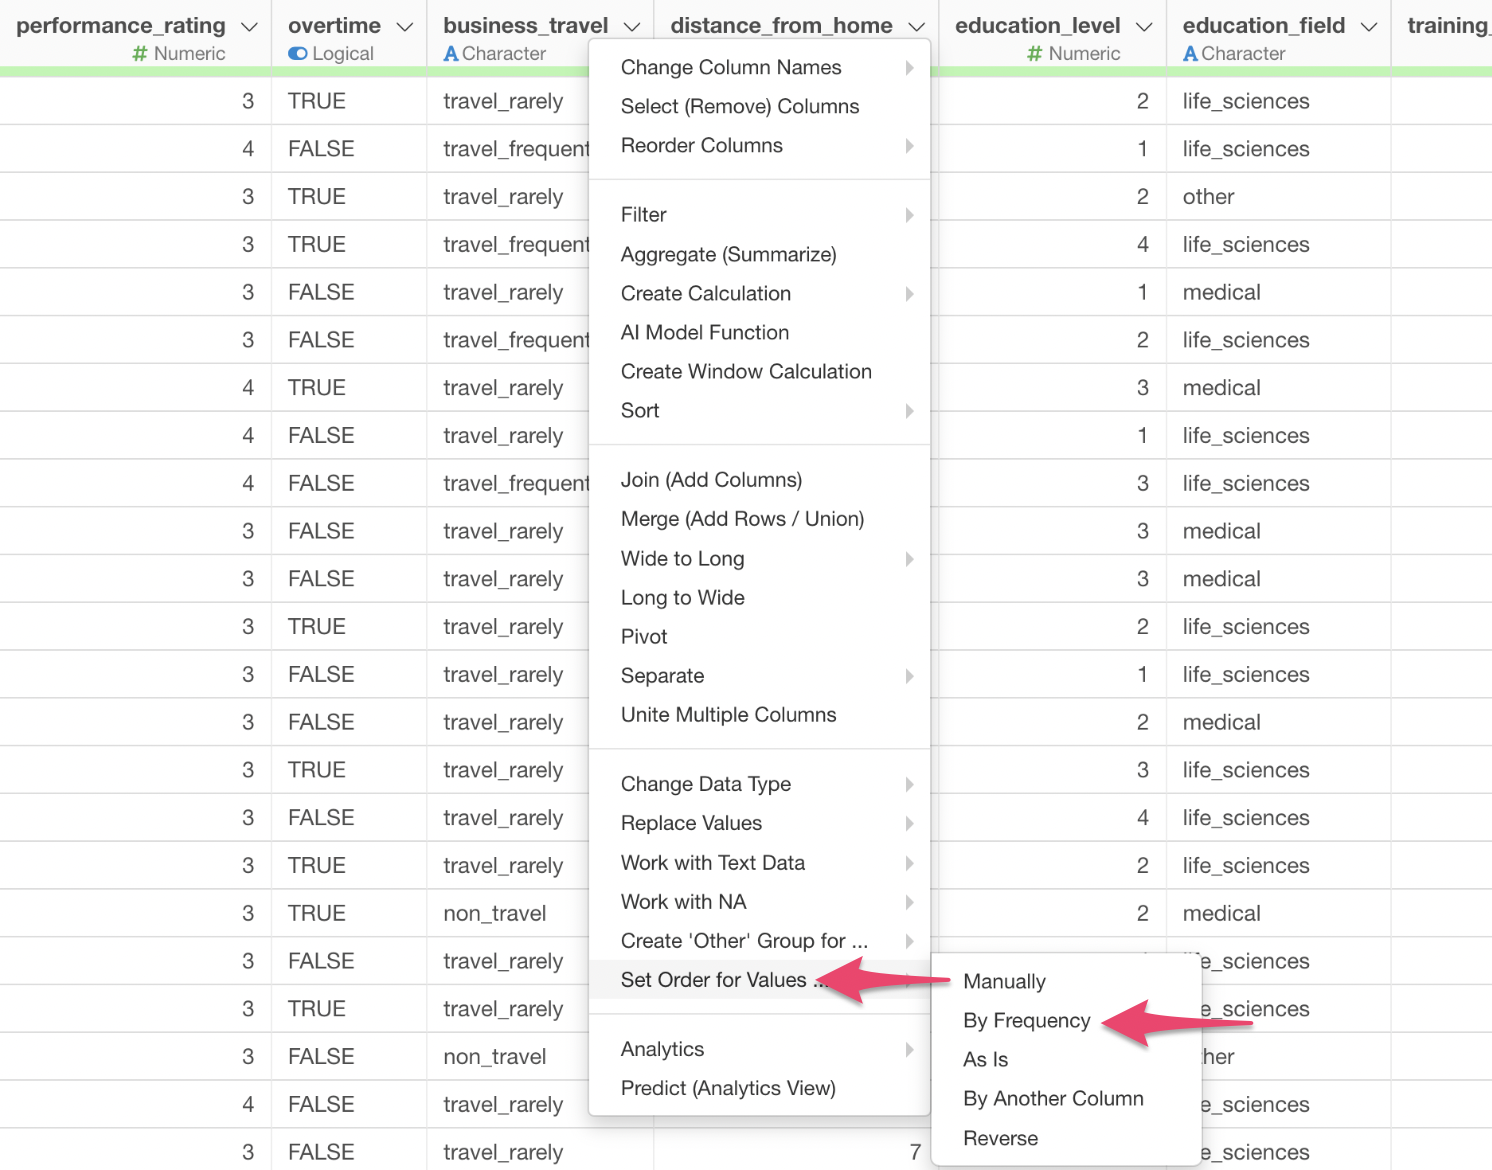
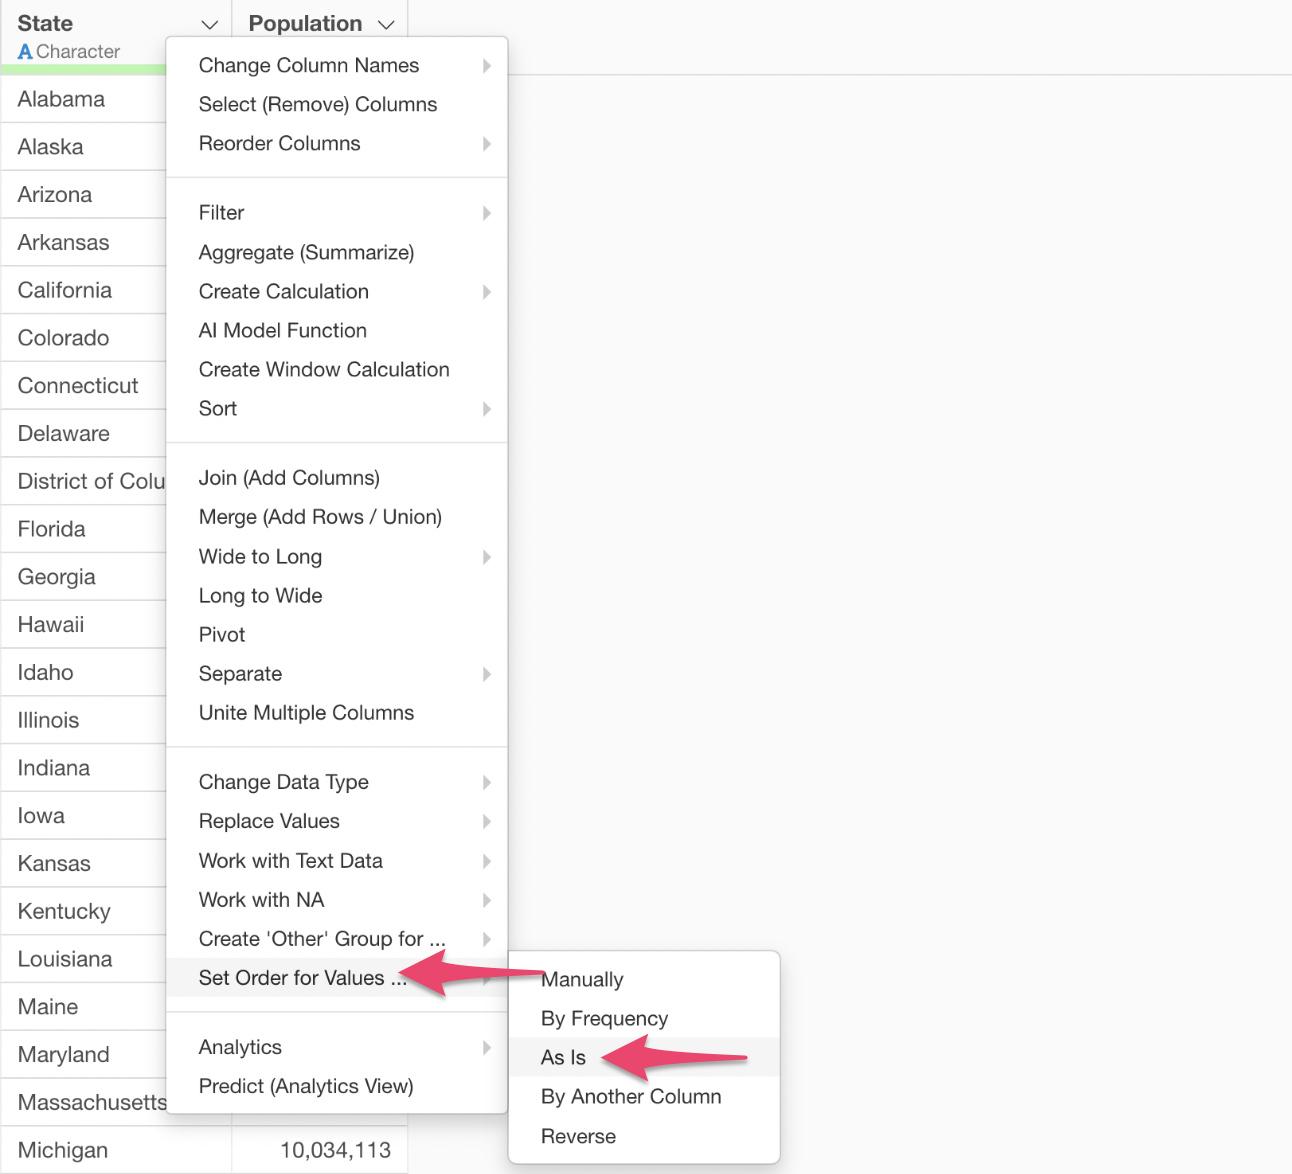
When setting the order of values, you can choose from the following five methods from the UI.
- Manually
- By Frequency
- As Is (Original Data Order)
- By Another Column
- Reverse
Select Values Manually
In “Select Values Manually”, you set the order of categories yourself.
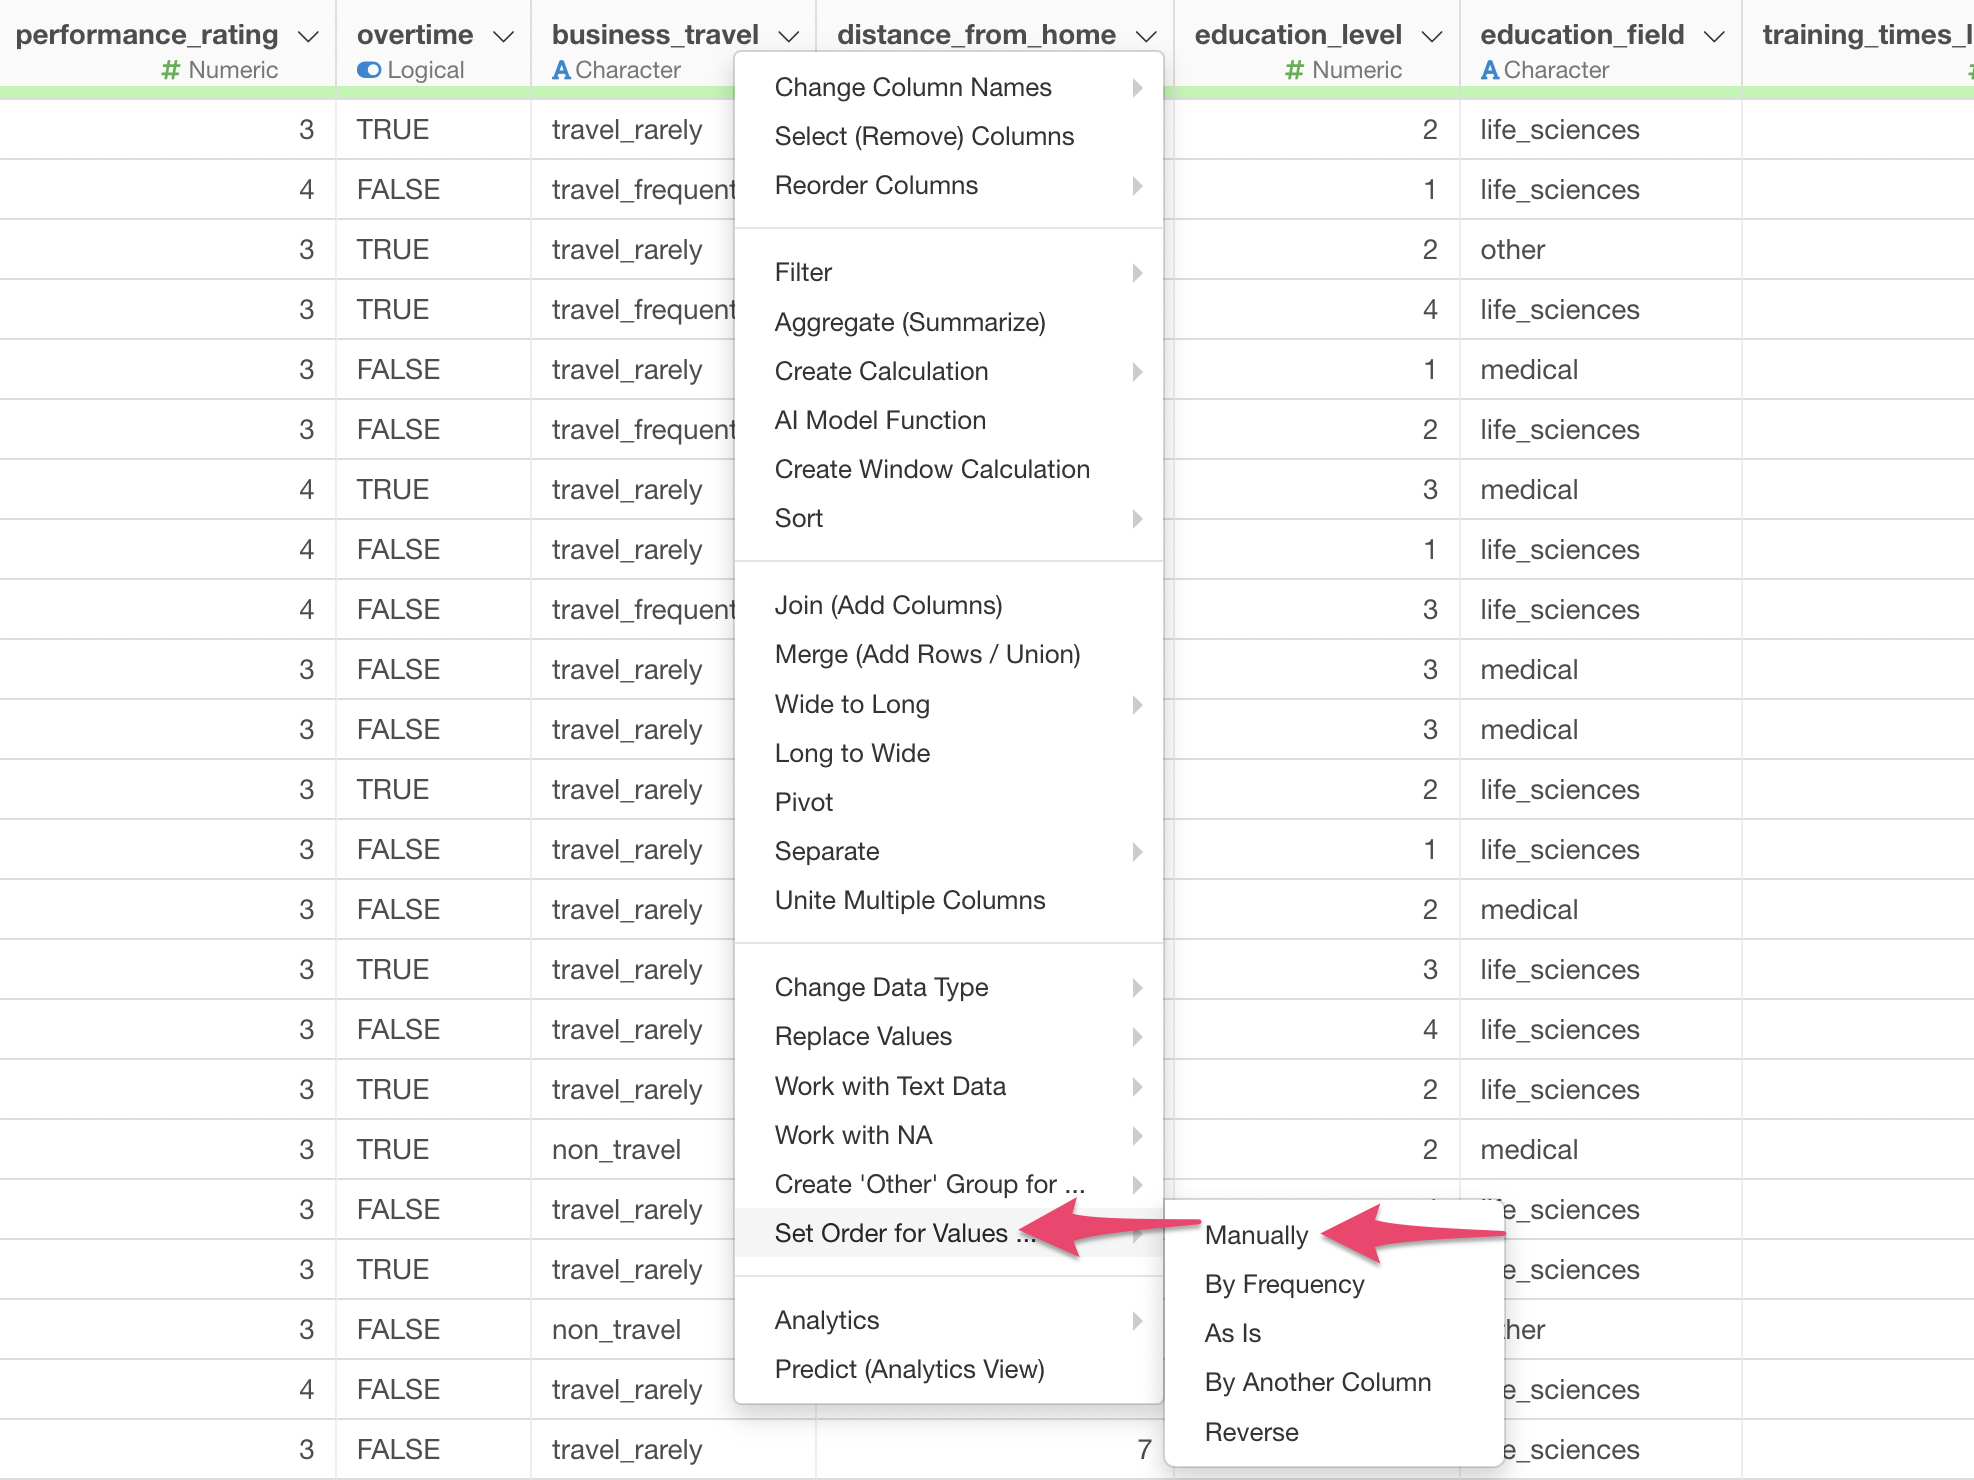
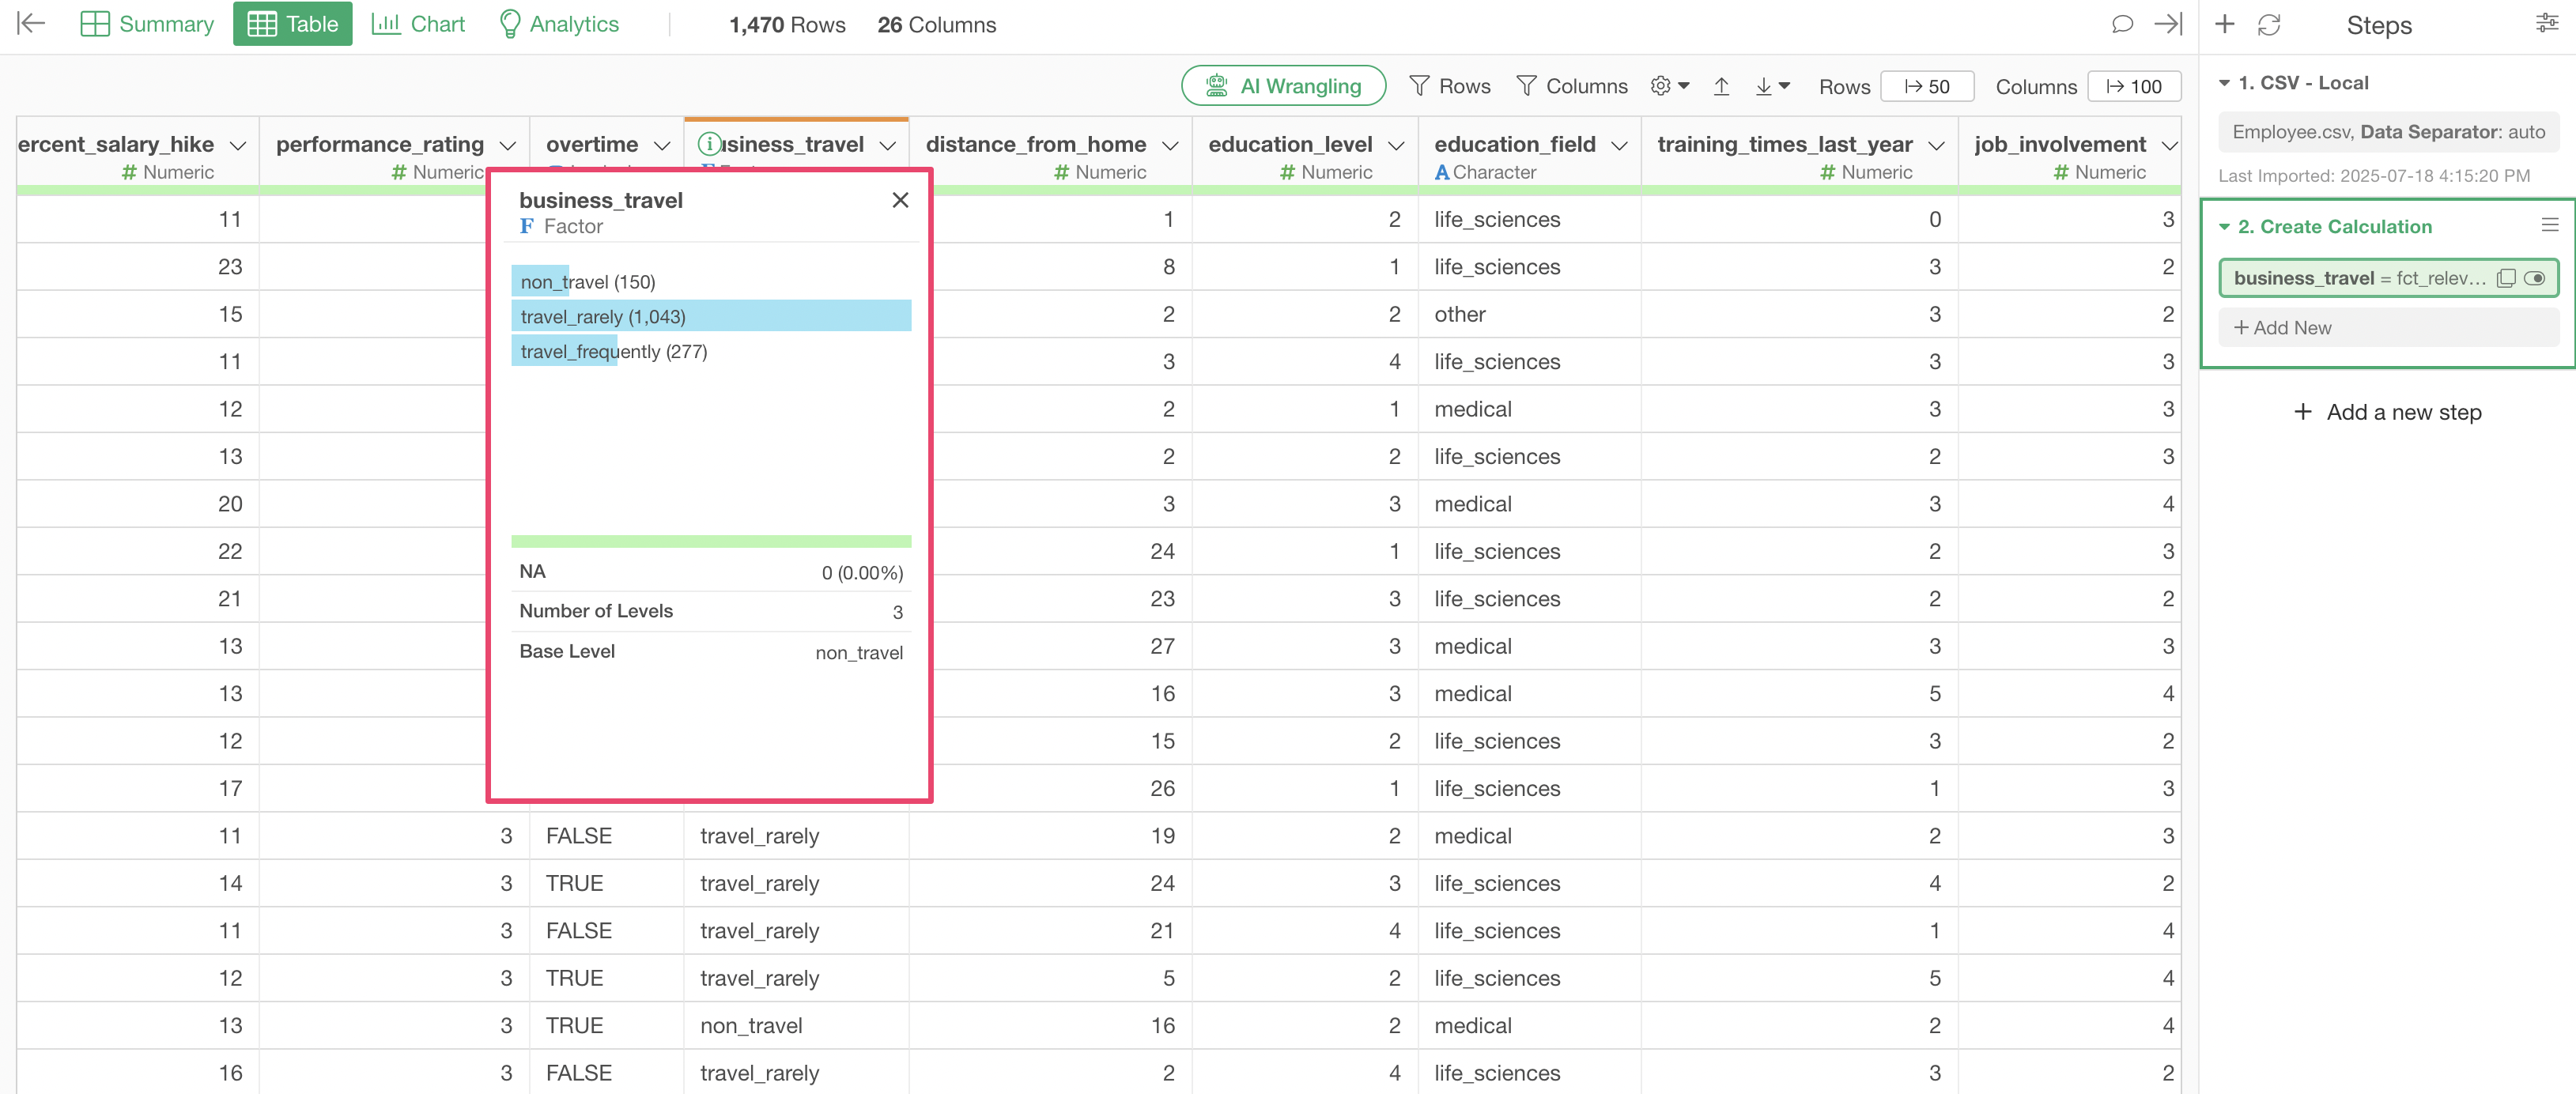
Selecting “Set Order for Values” -> “Manually” from the Column Header Menu of a Character type column will display the “Create Calculation” dialog below.
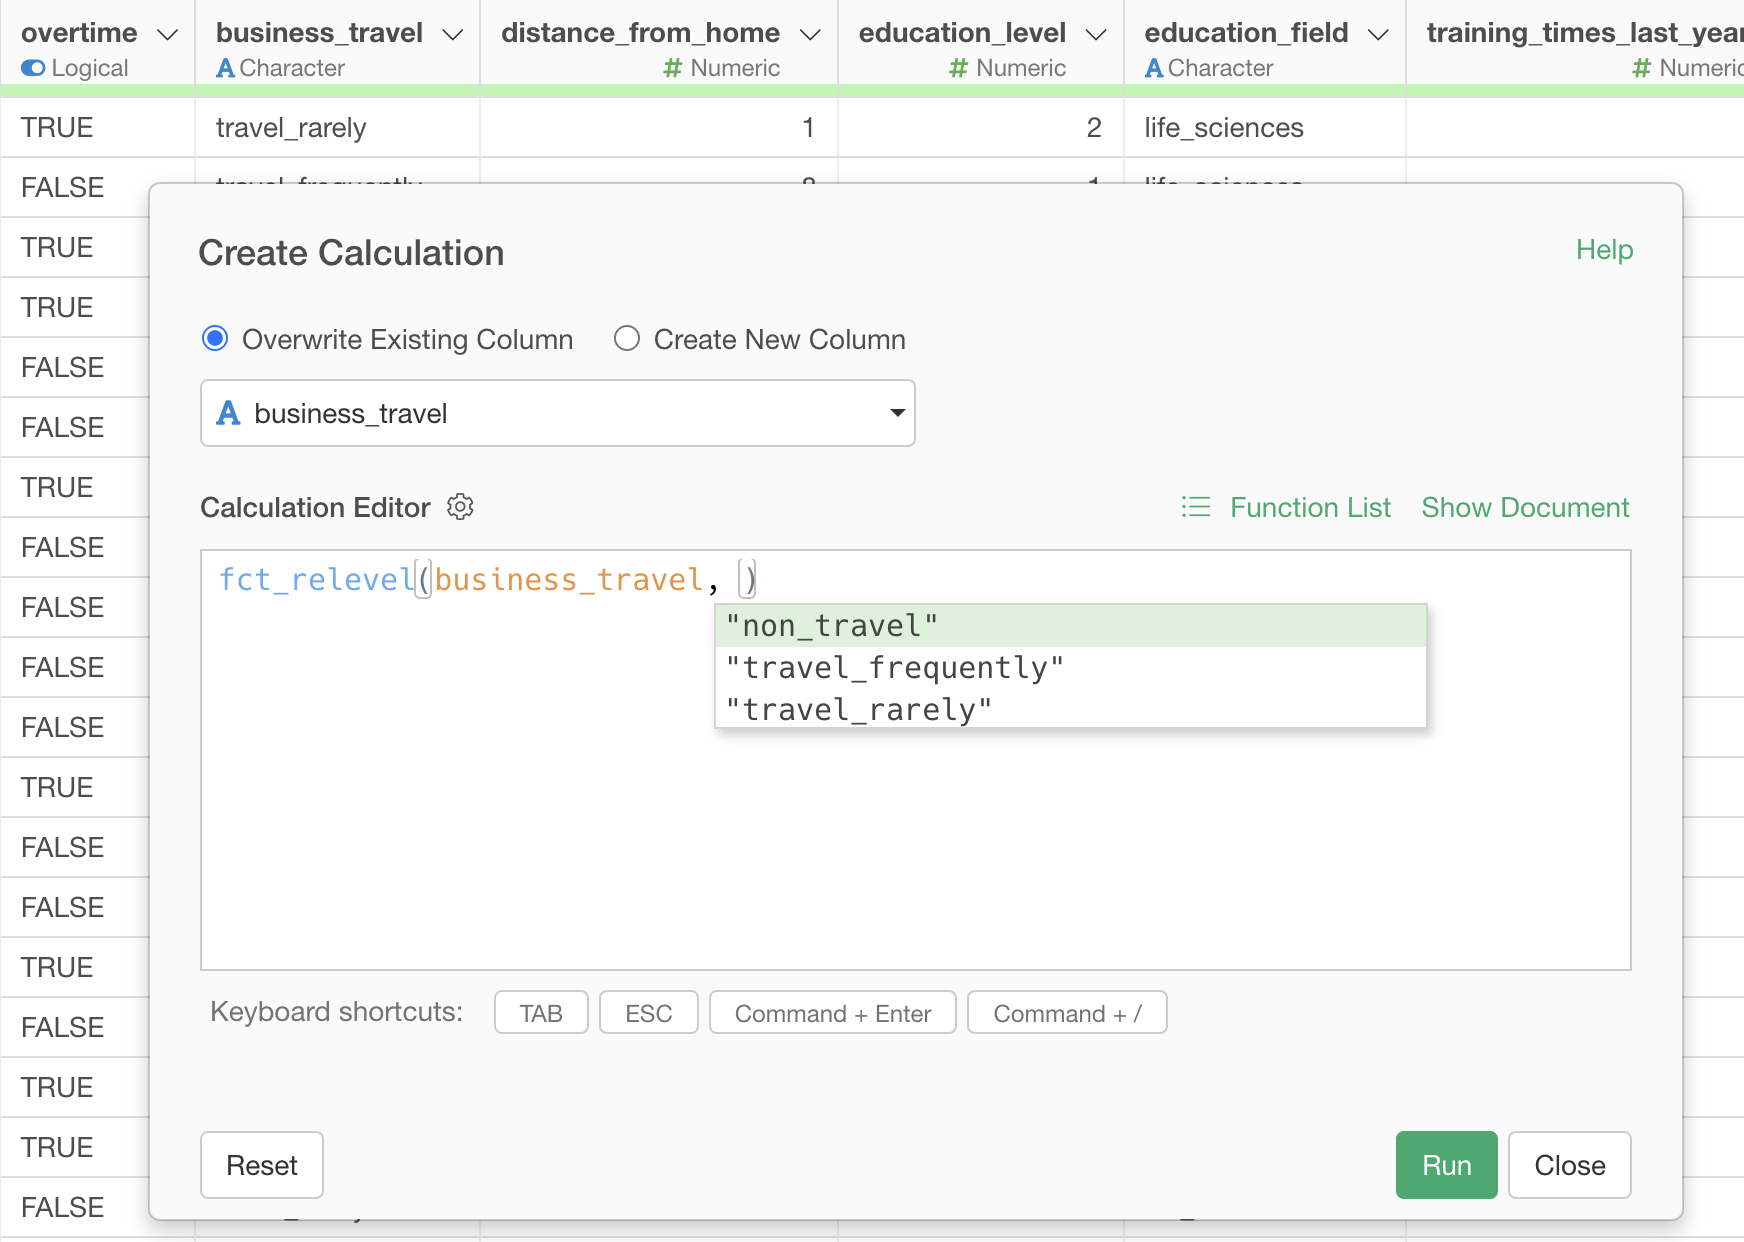
The fct_relevel function entered in the calculation
editor is a function for manually setting the order.
In this dialog, you can set the order of categories from the lowest level.
For example, the following is an example of setting the order “None”, “Sometimes”, “Frequently” for a column named “Business Trip Frequency”.
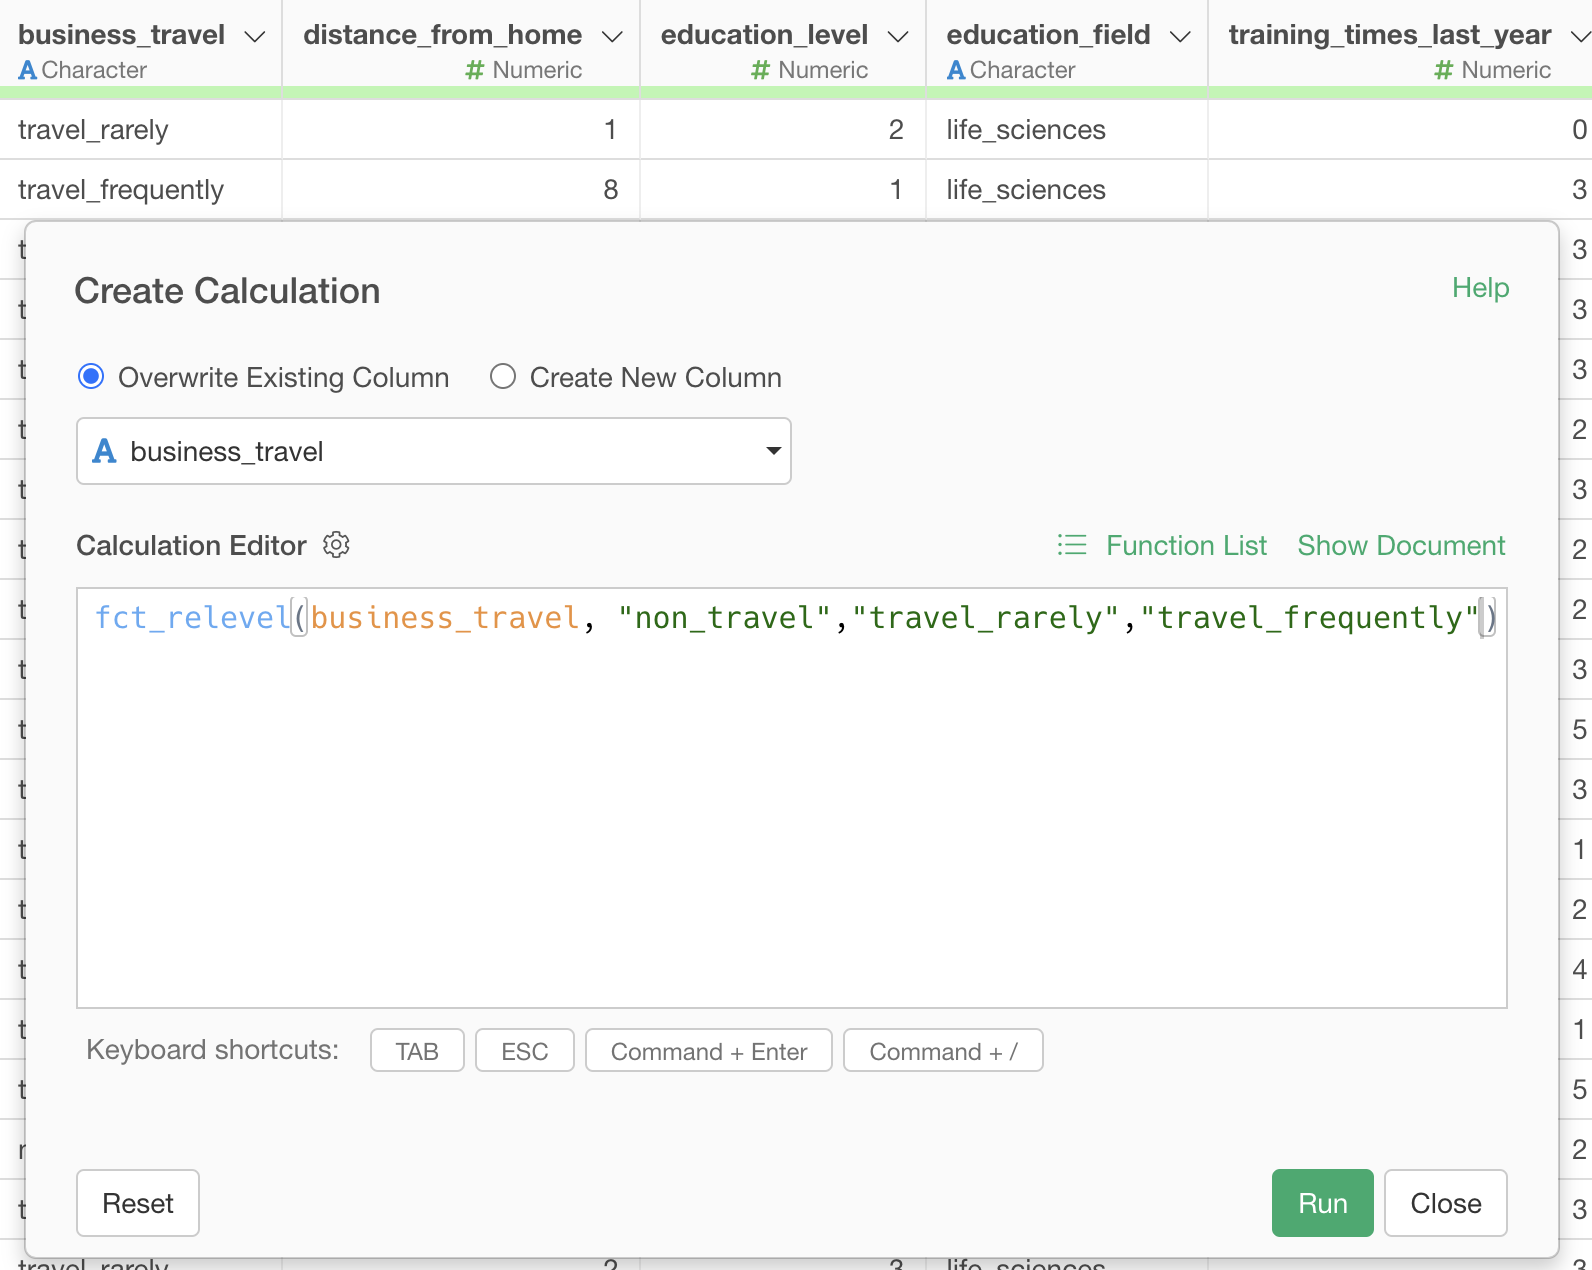
This allows you to assign levels in the order you specify.
Based on Value Frequency
In “Based on Value Frequency”, the order of categories is automatically set based on the frequency of appearance of each category.
Selecting “Set Order for Values” -> “By Frequency” from the Column Header Menu of a Character type column will display the “Create Calculation” dialog as shown below.
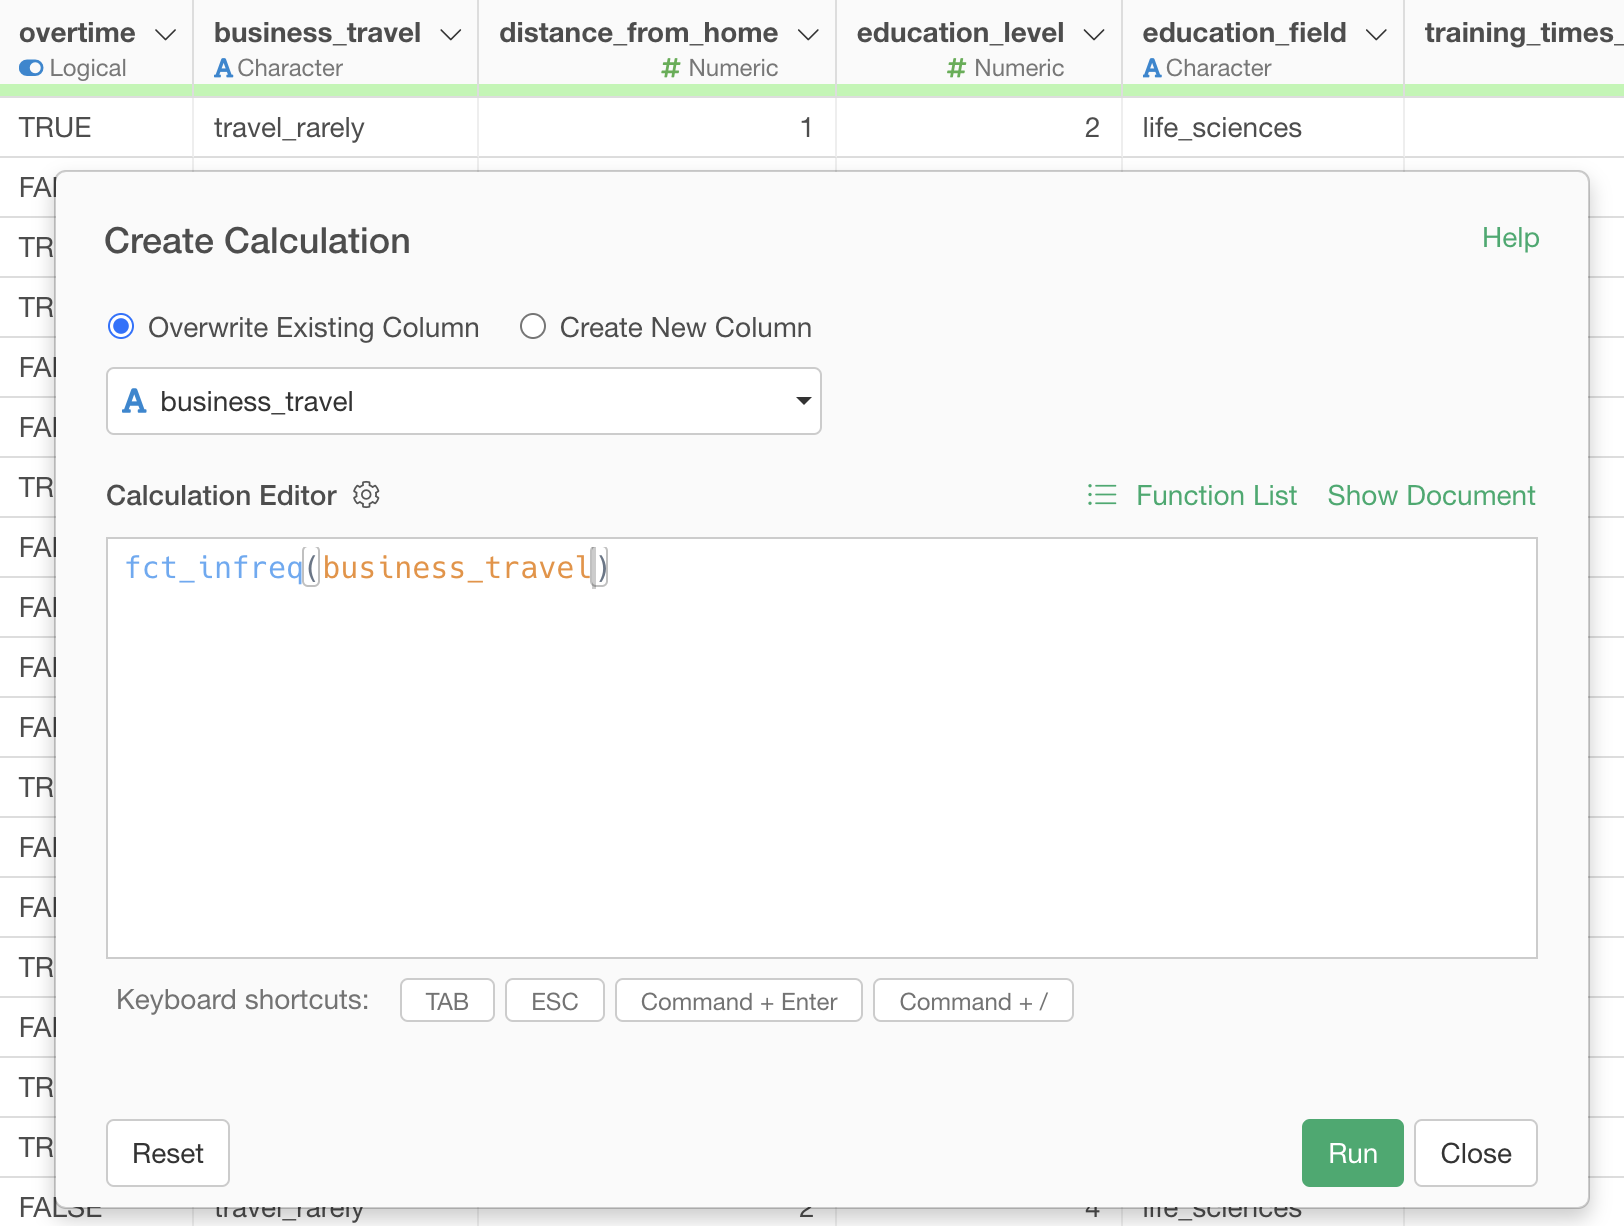
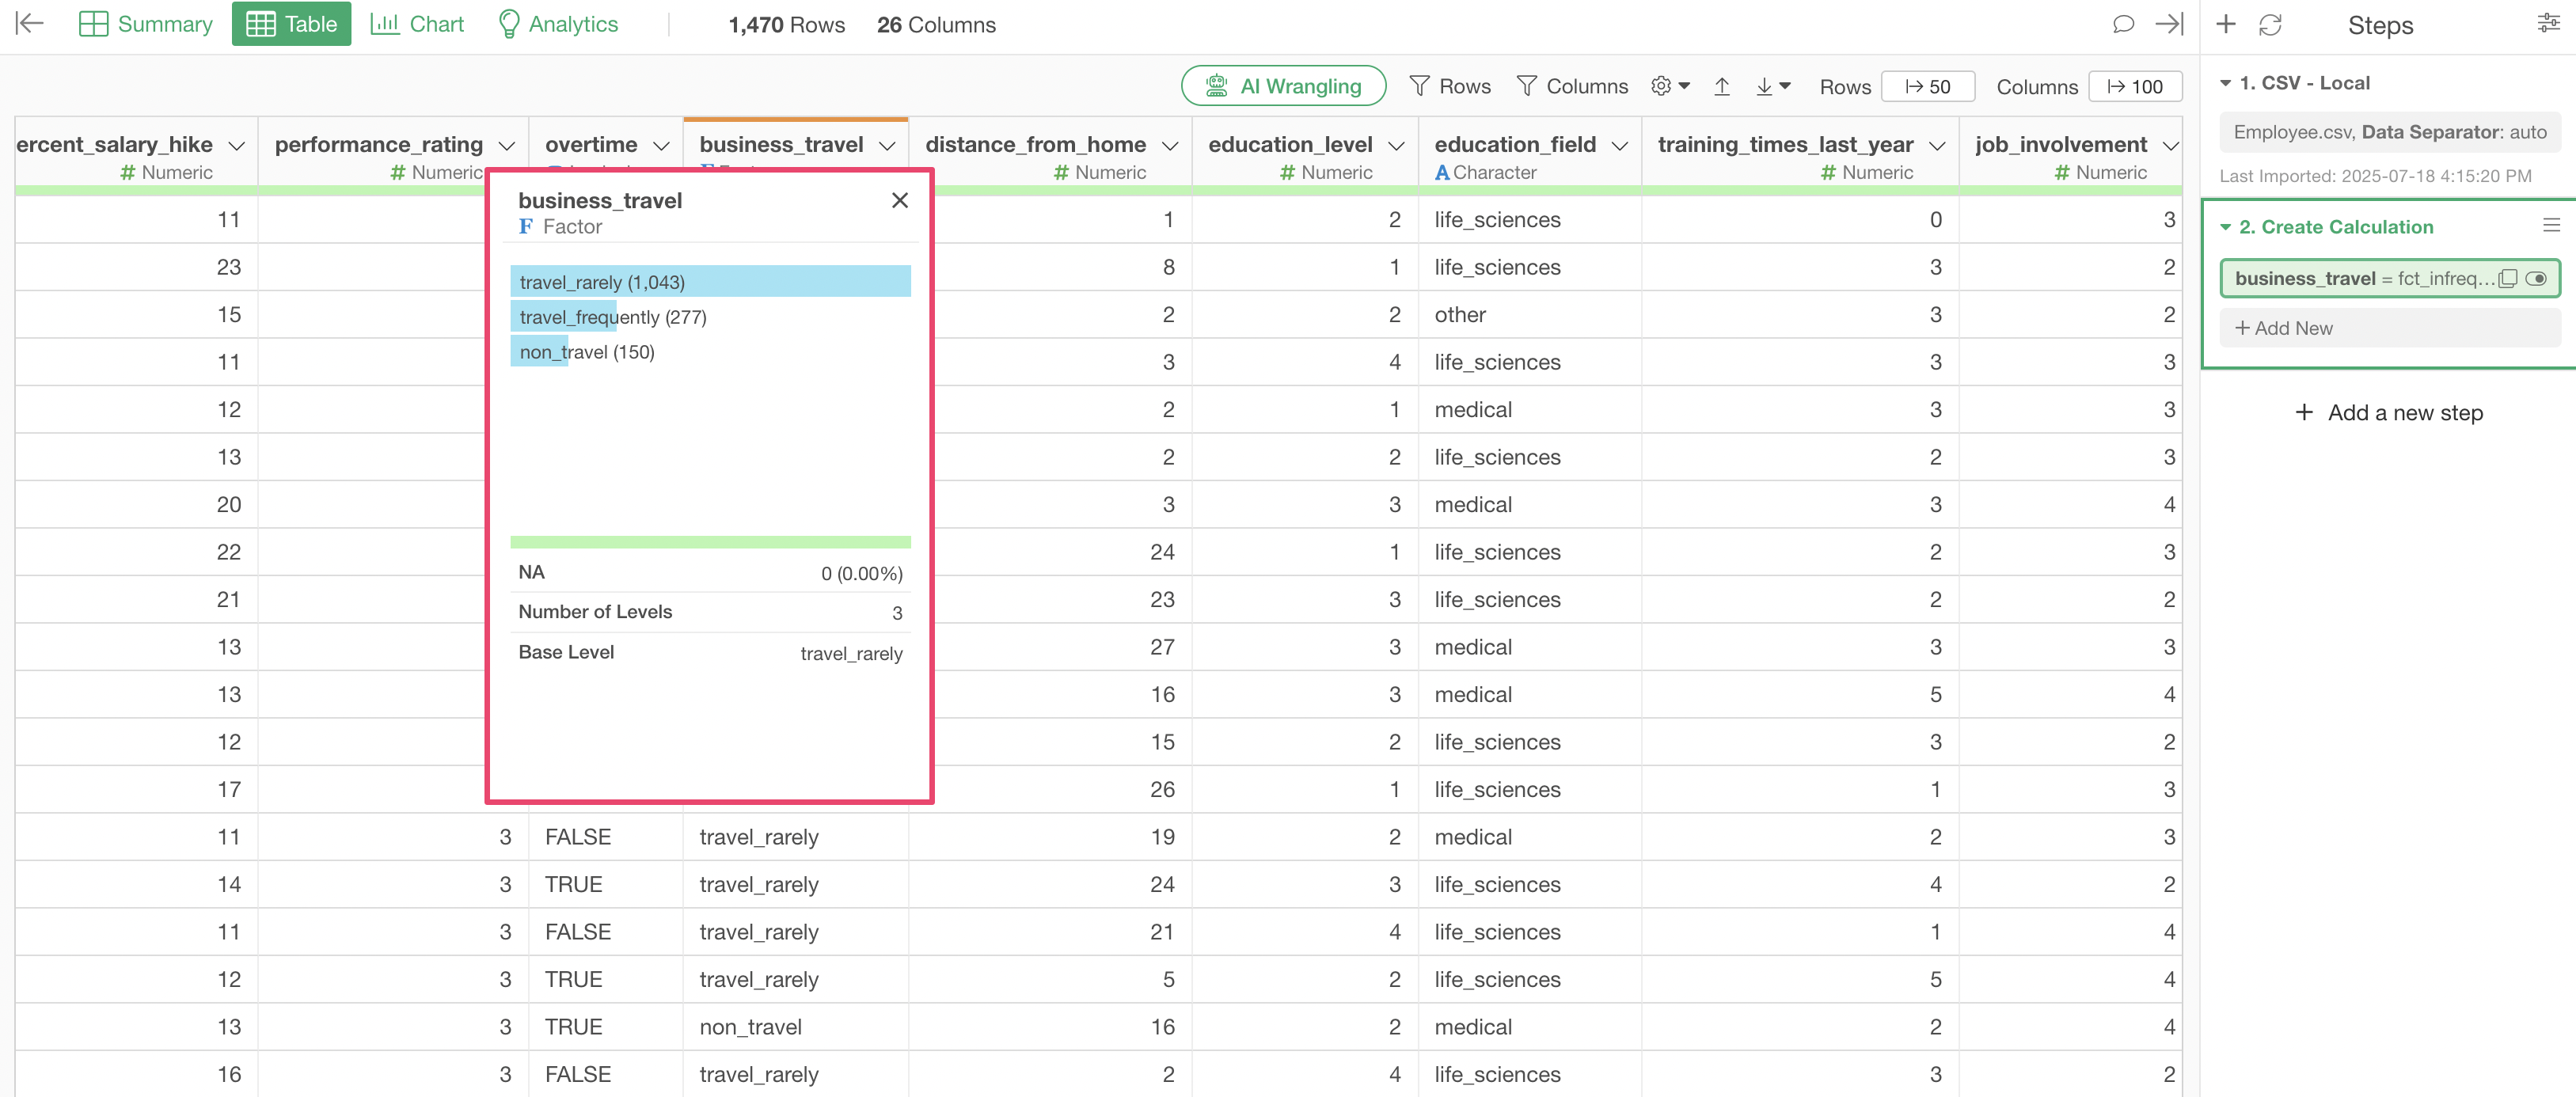
The fct_infreq function is a function that sets the
order based on the frequency of categories within the column specified
in the function. Let’s briefly introduce how this function sets the
order.
This allows us to order the results based on frequency.
Original Data Order
In “Original Data Order”, the order of categories is set based on the current sorting order of the data.
Selecting “Set Order for Values” -> “As Is” from the Column Header Menu of a Character type column will display the “Create Calculation” dialog as shown below.
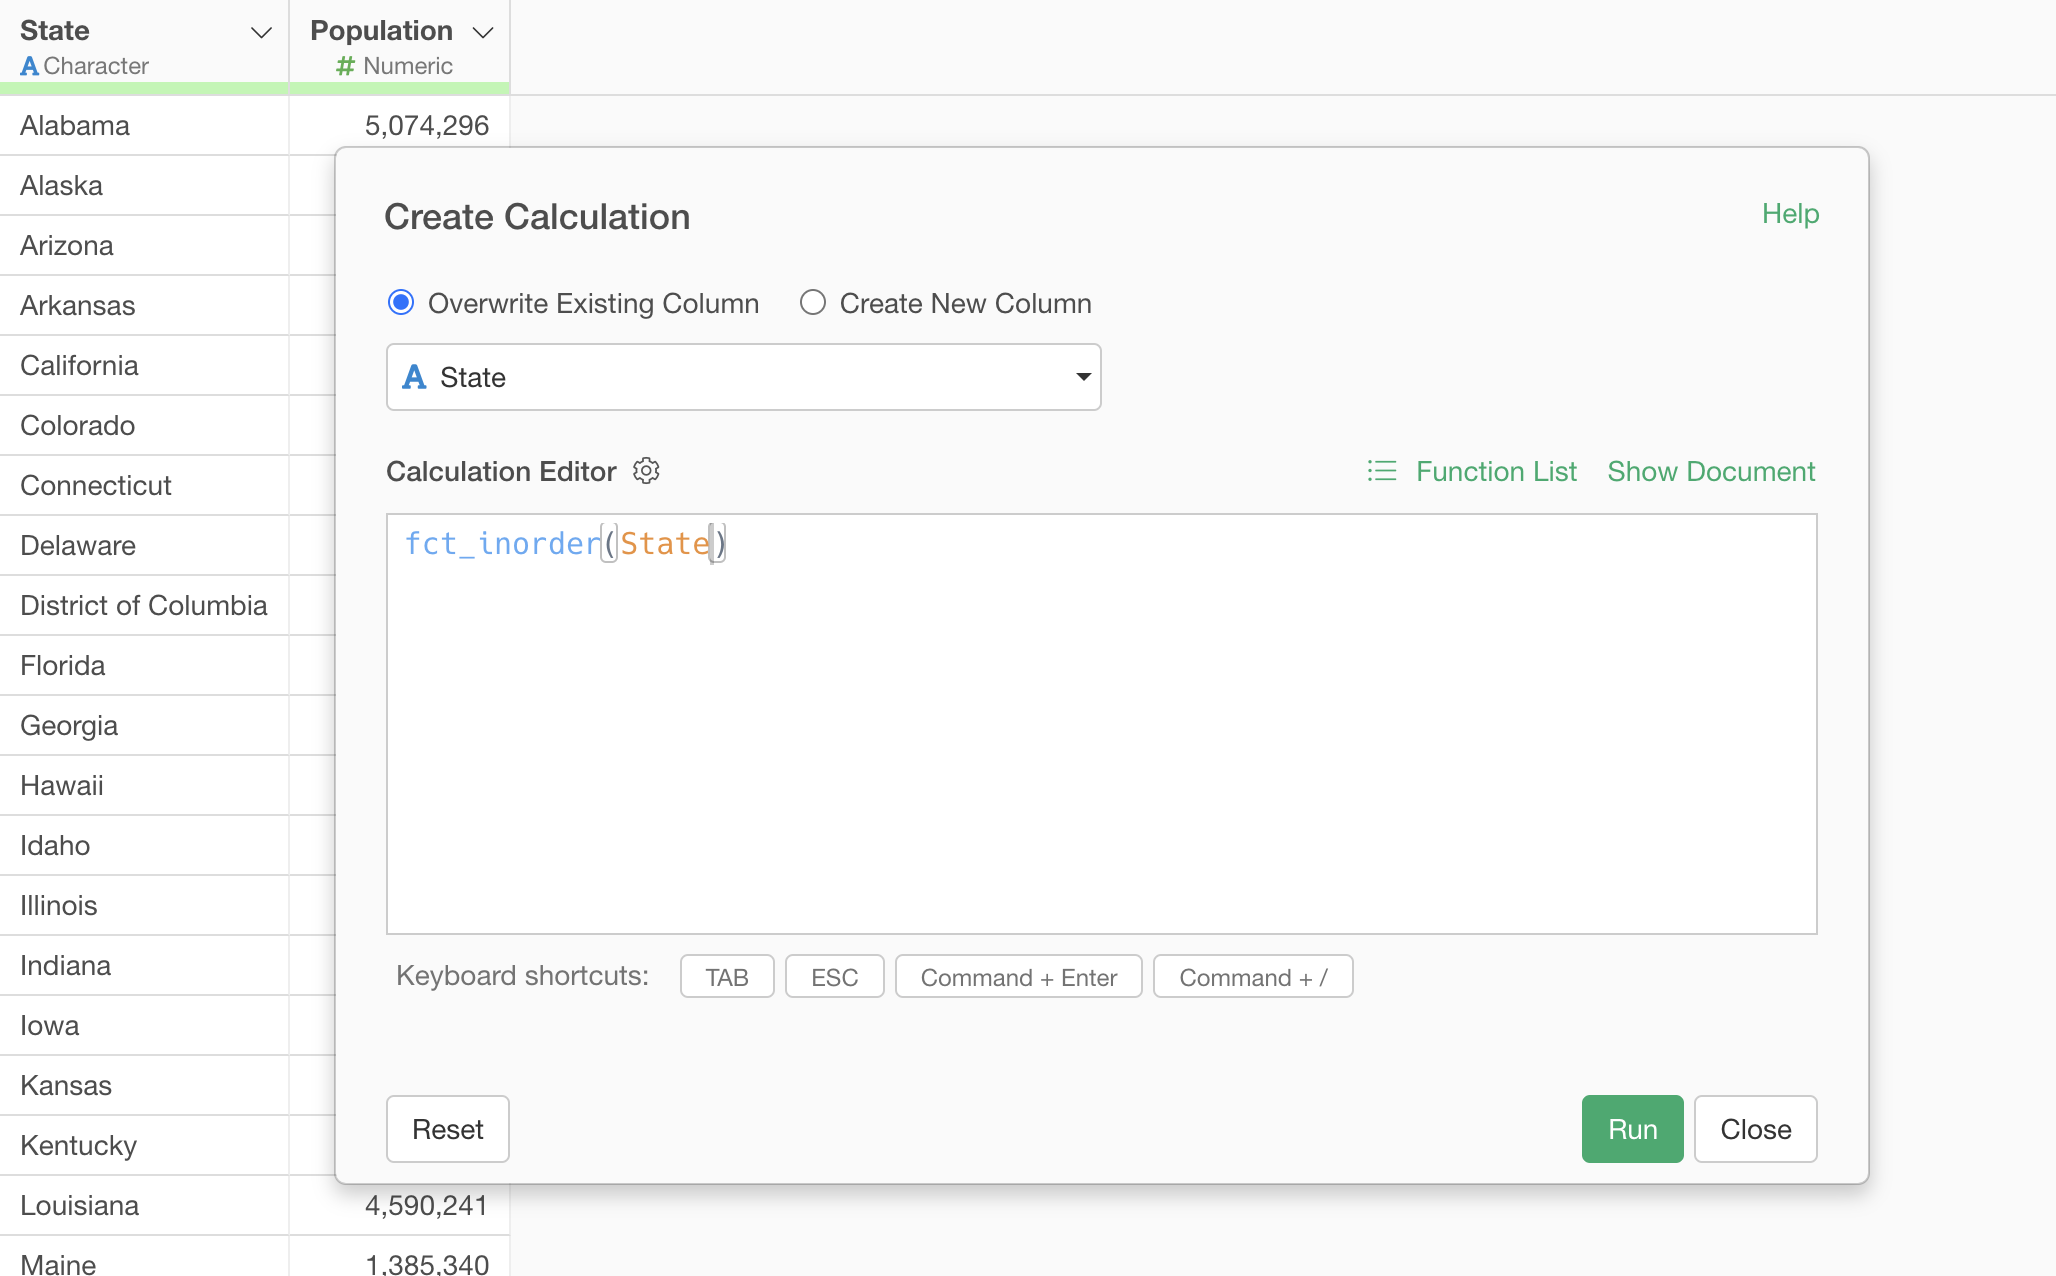
The fct_inorder function is a function that sets the
order of categories based on the current sorting order of the data. For
example, in the case above, the order for “State” will be set based on
the current sorting order of the “State” column in the data.
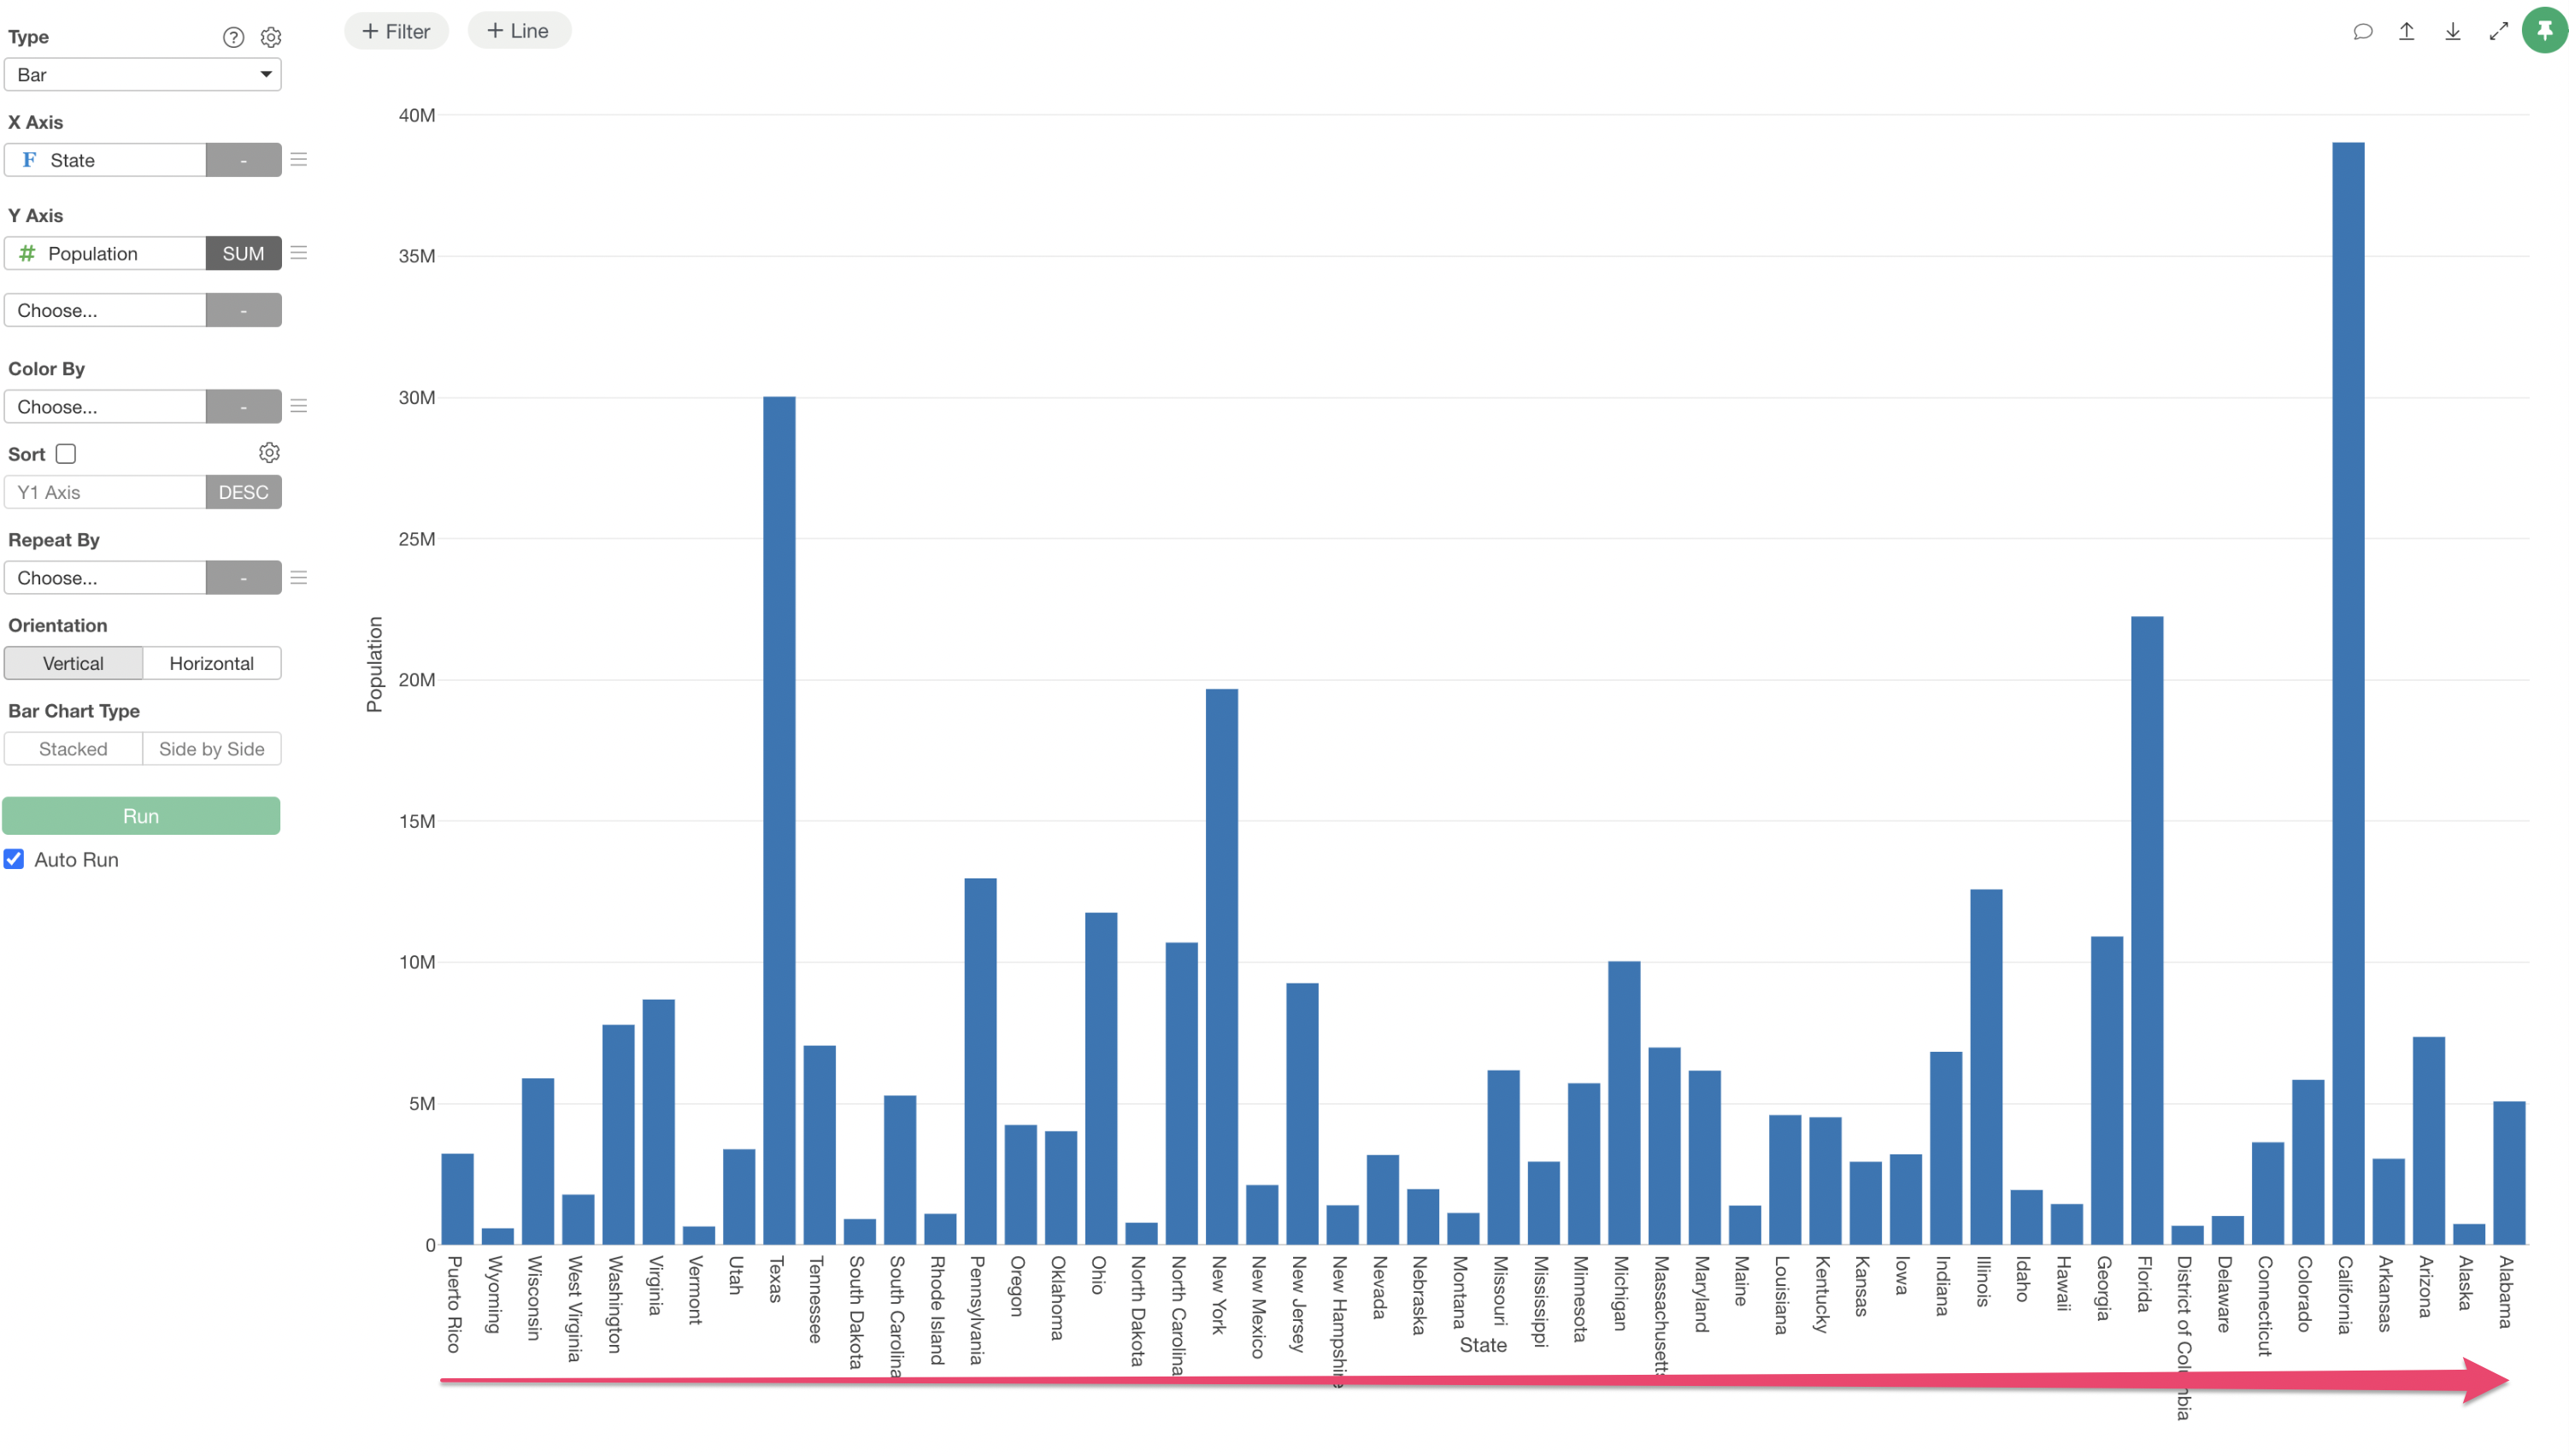
Let’s introduce a specific use case using data where each row represents a U.S. State and is sorted by State code.
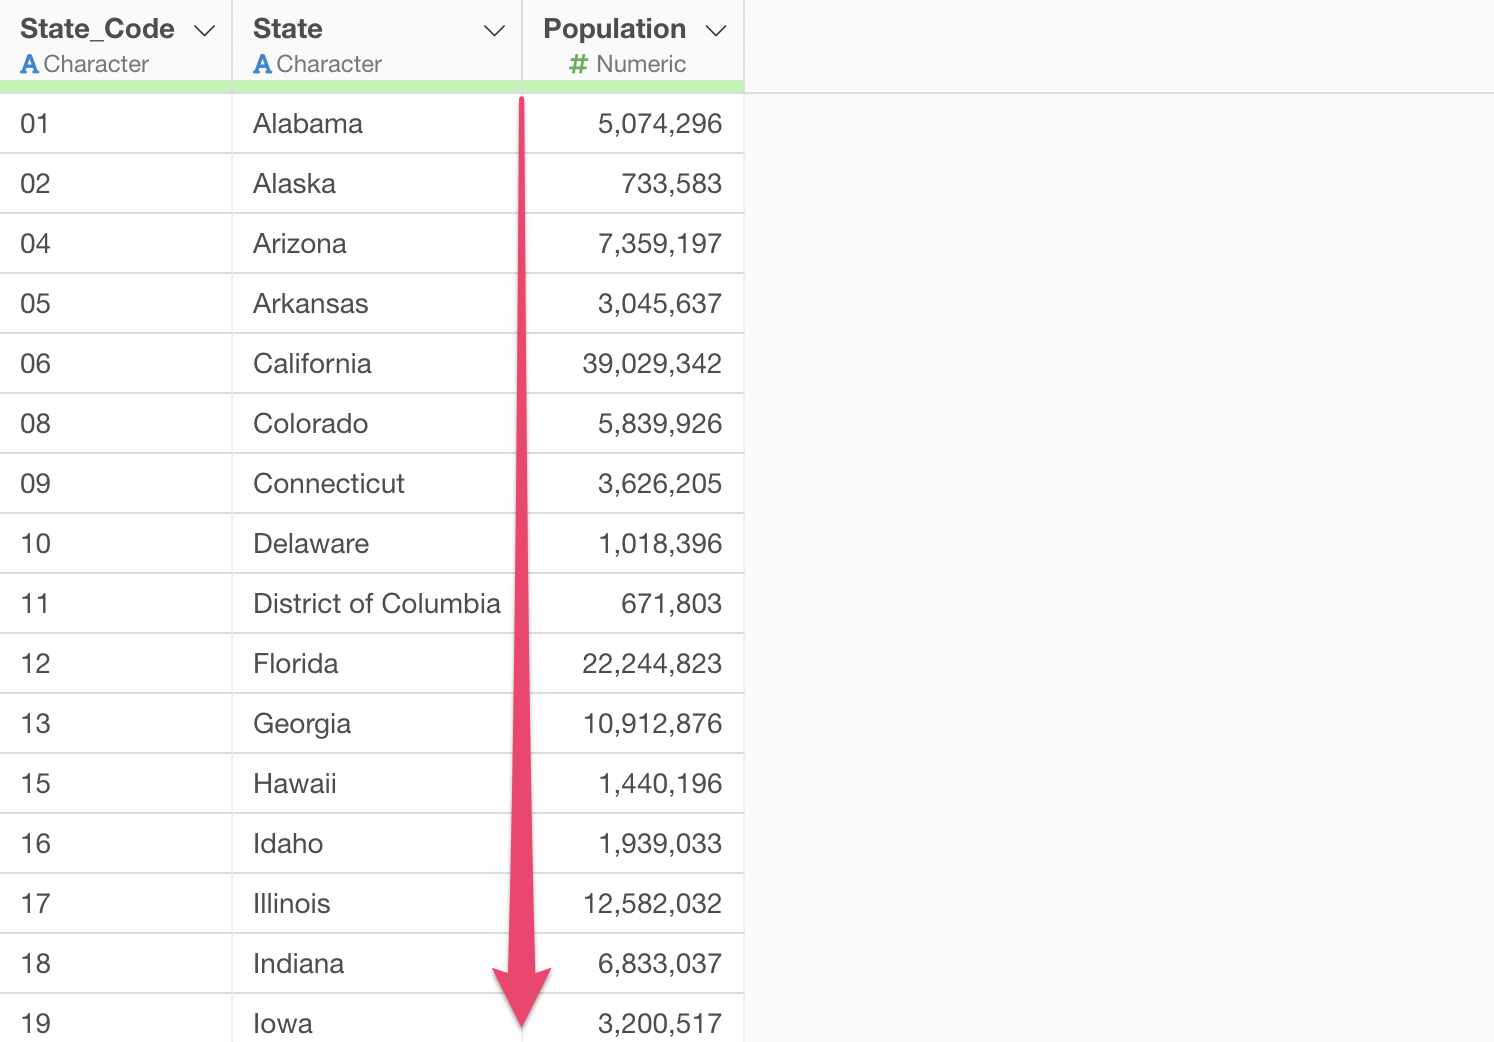
When you want to create a chart using this data, sorted by State code, you need to establish an ordinal relationship for the State column.
Fortunately, since this data is already sorted by State code, we can add the desired ordinal relationship by setting it based on the data’s current sorting order.
Based on Another Column’s Value
In “Based on Another Column’s Value”, the order of categories is set based on the “values” of another column.
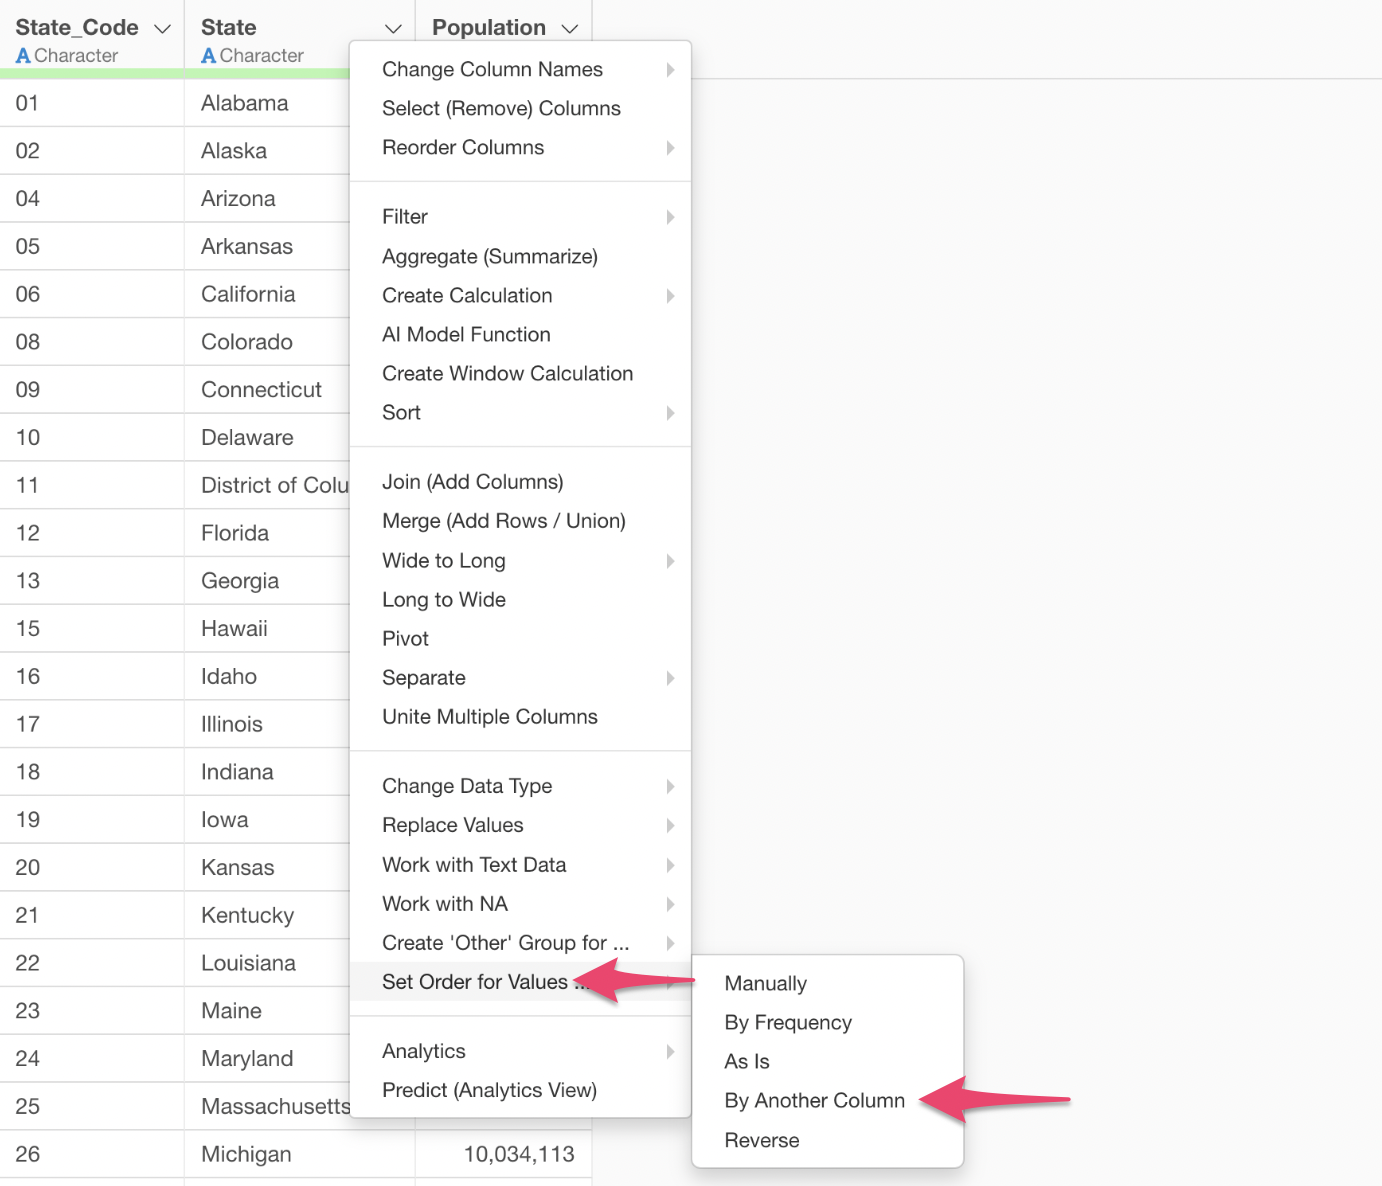
Selecting “Set Order for Values” -> “By Another Column” from the Column Header Menu of a Character type column will display the “Create Calculation” dialog as shown below.
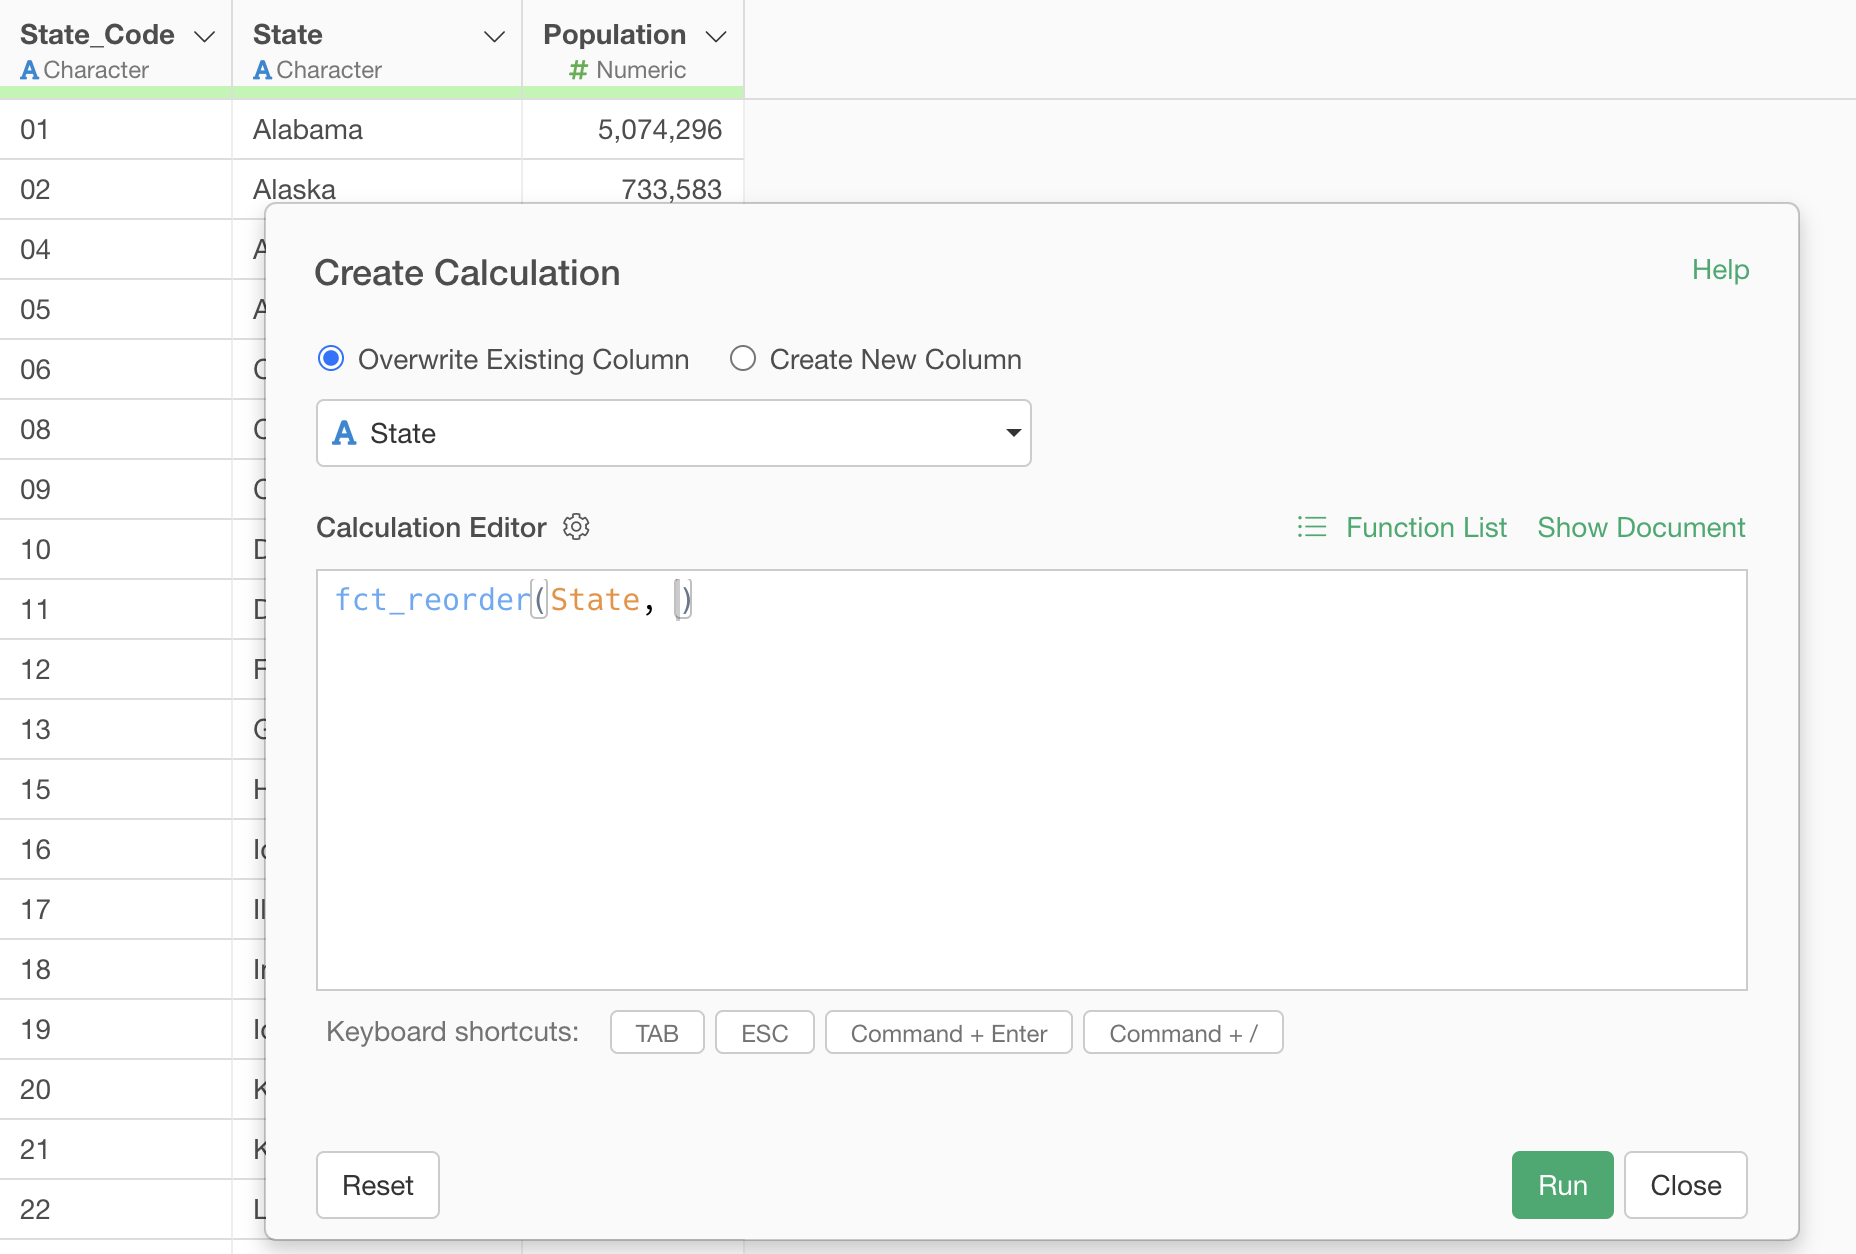
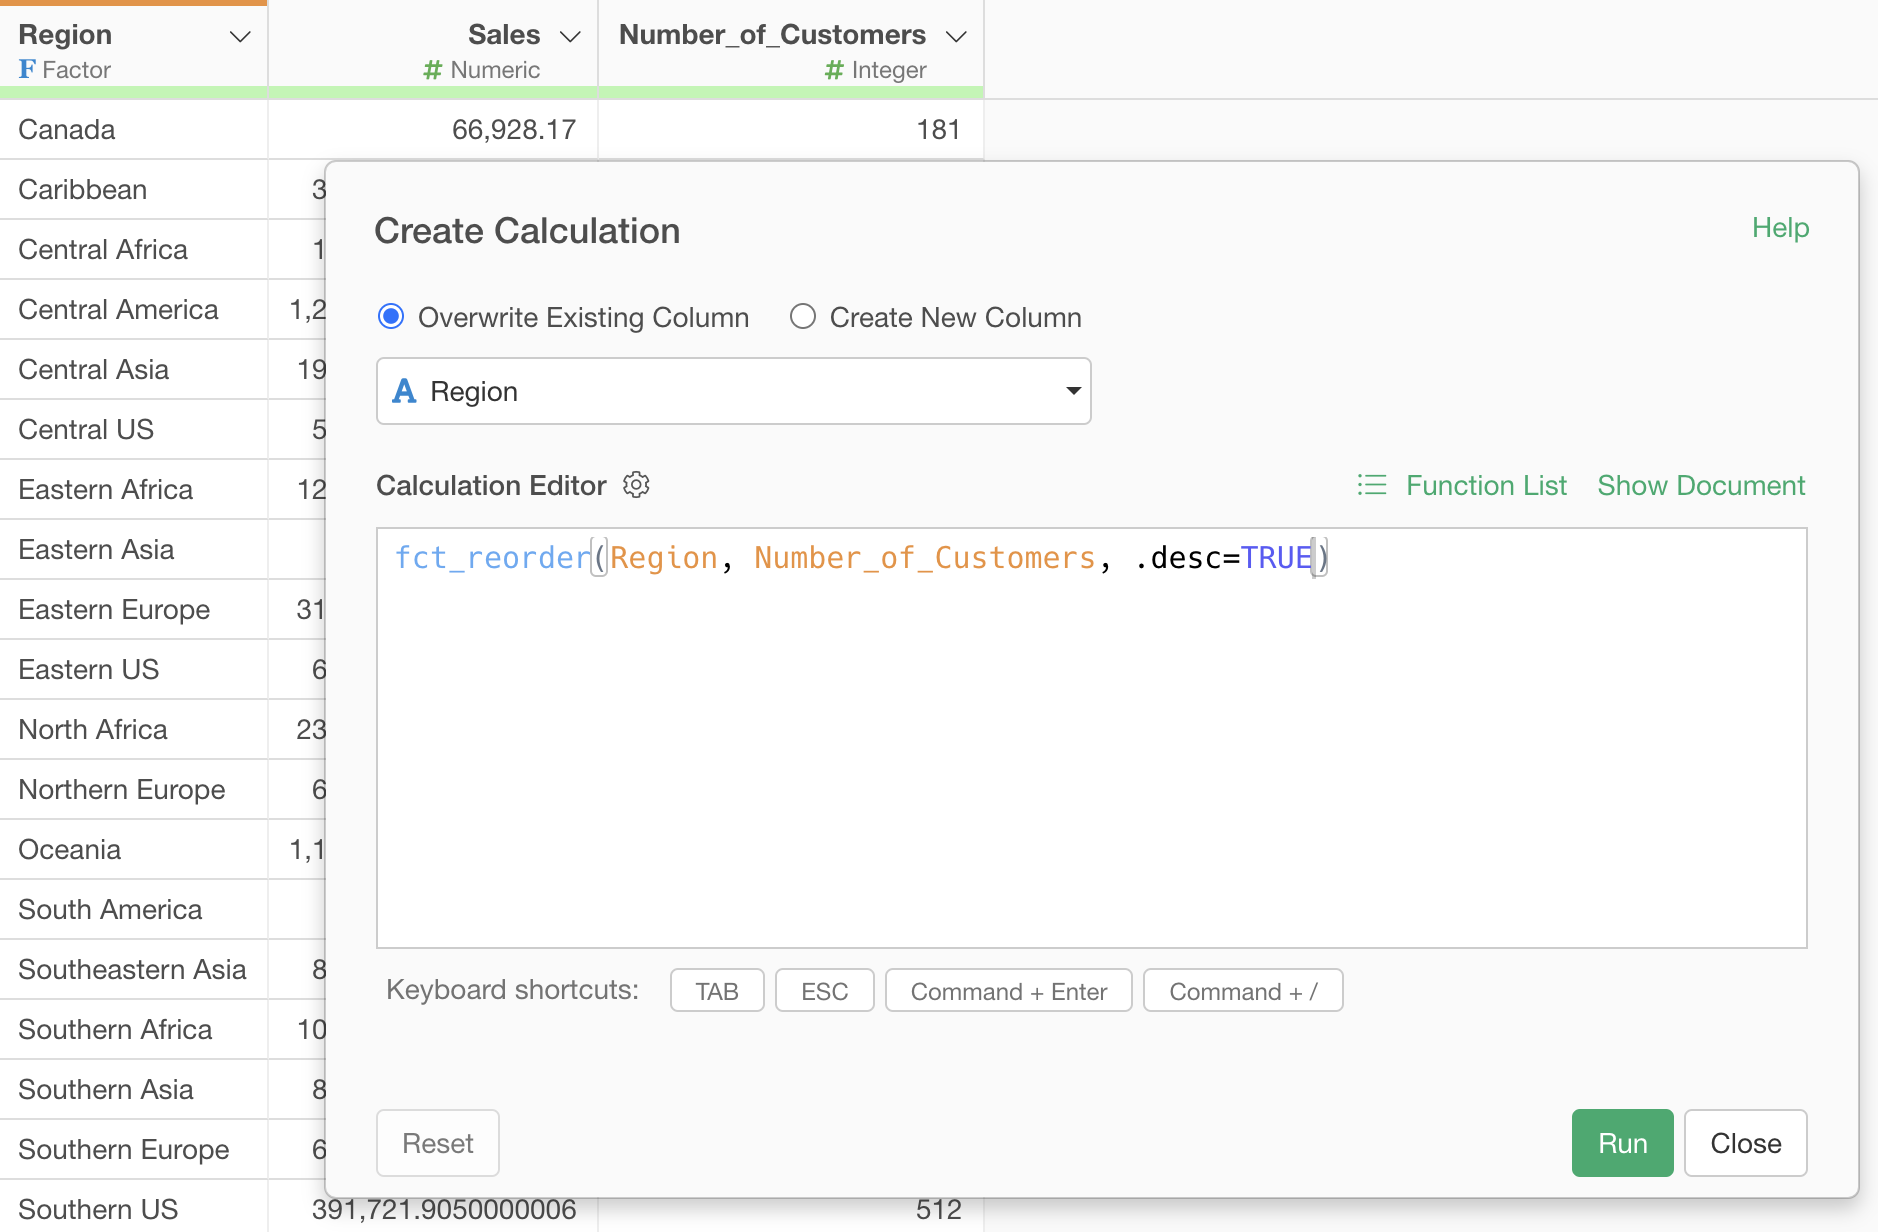
The fct_reorder function is used to set the order of
categories based on the values of another column, and it is written as
fct_reorder(column_to_order, column_to_determine_order).
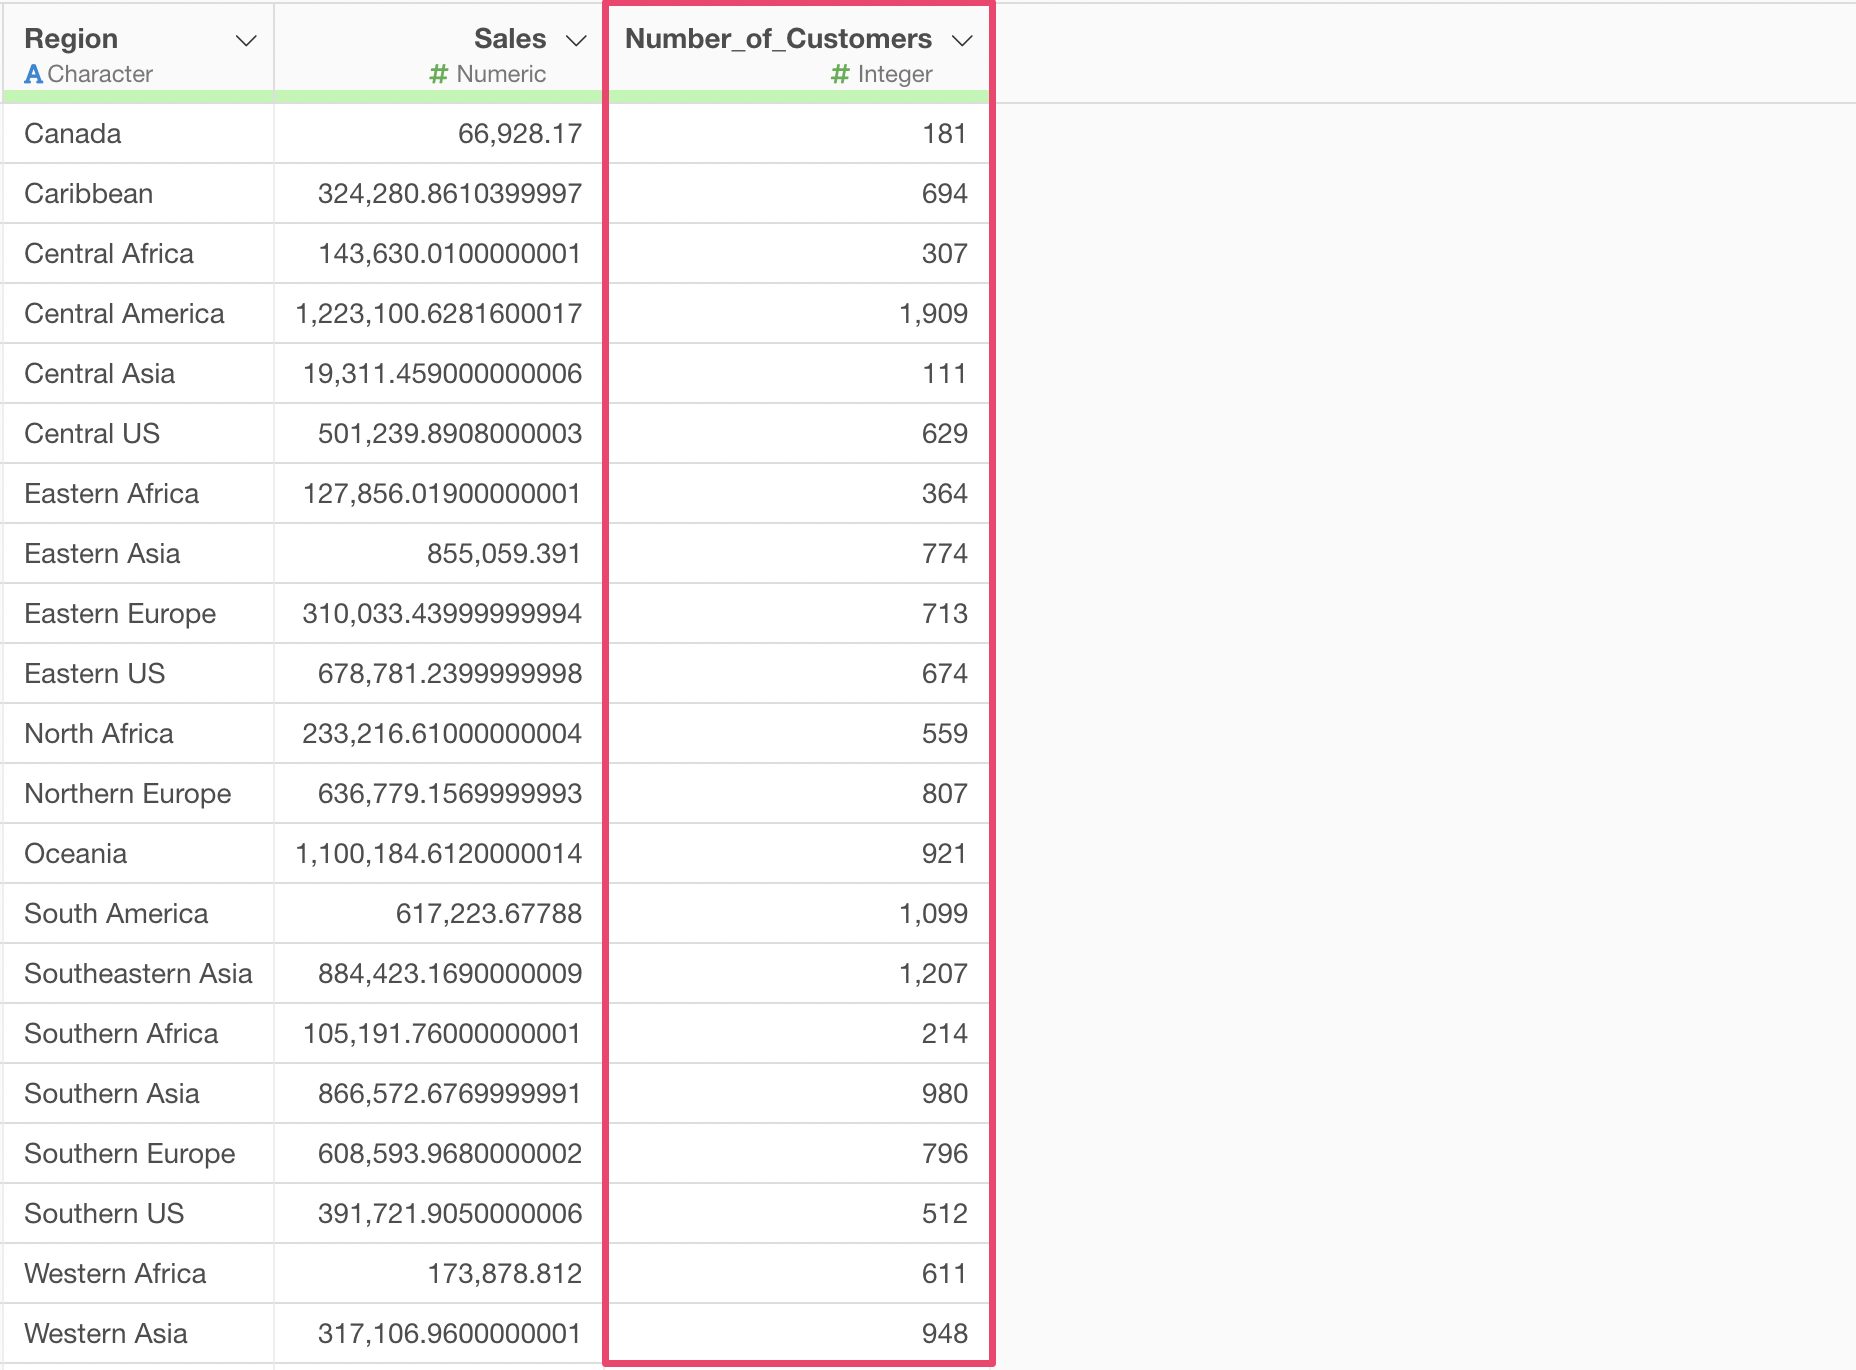
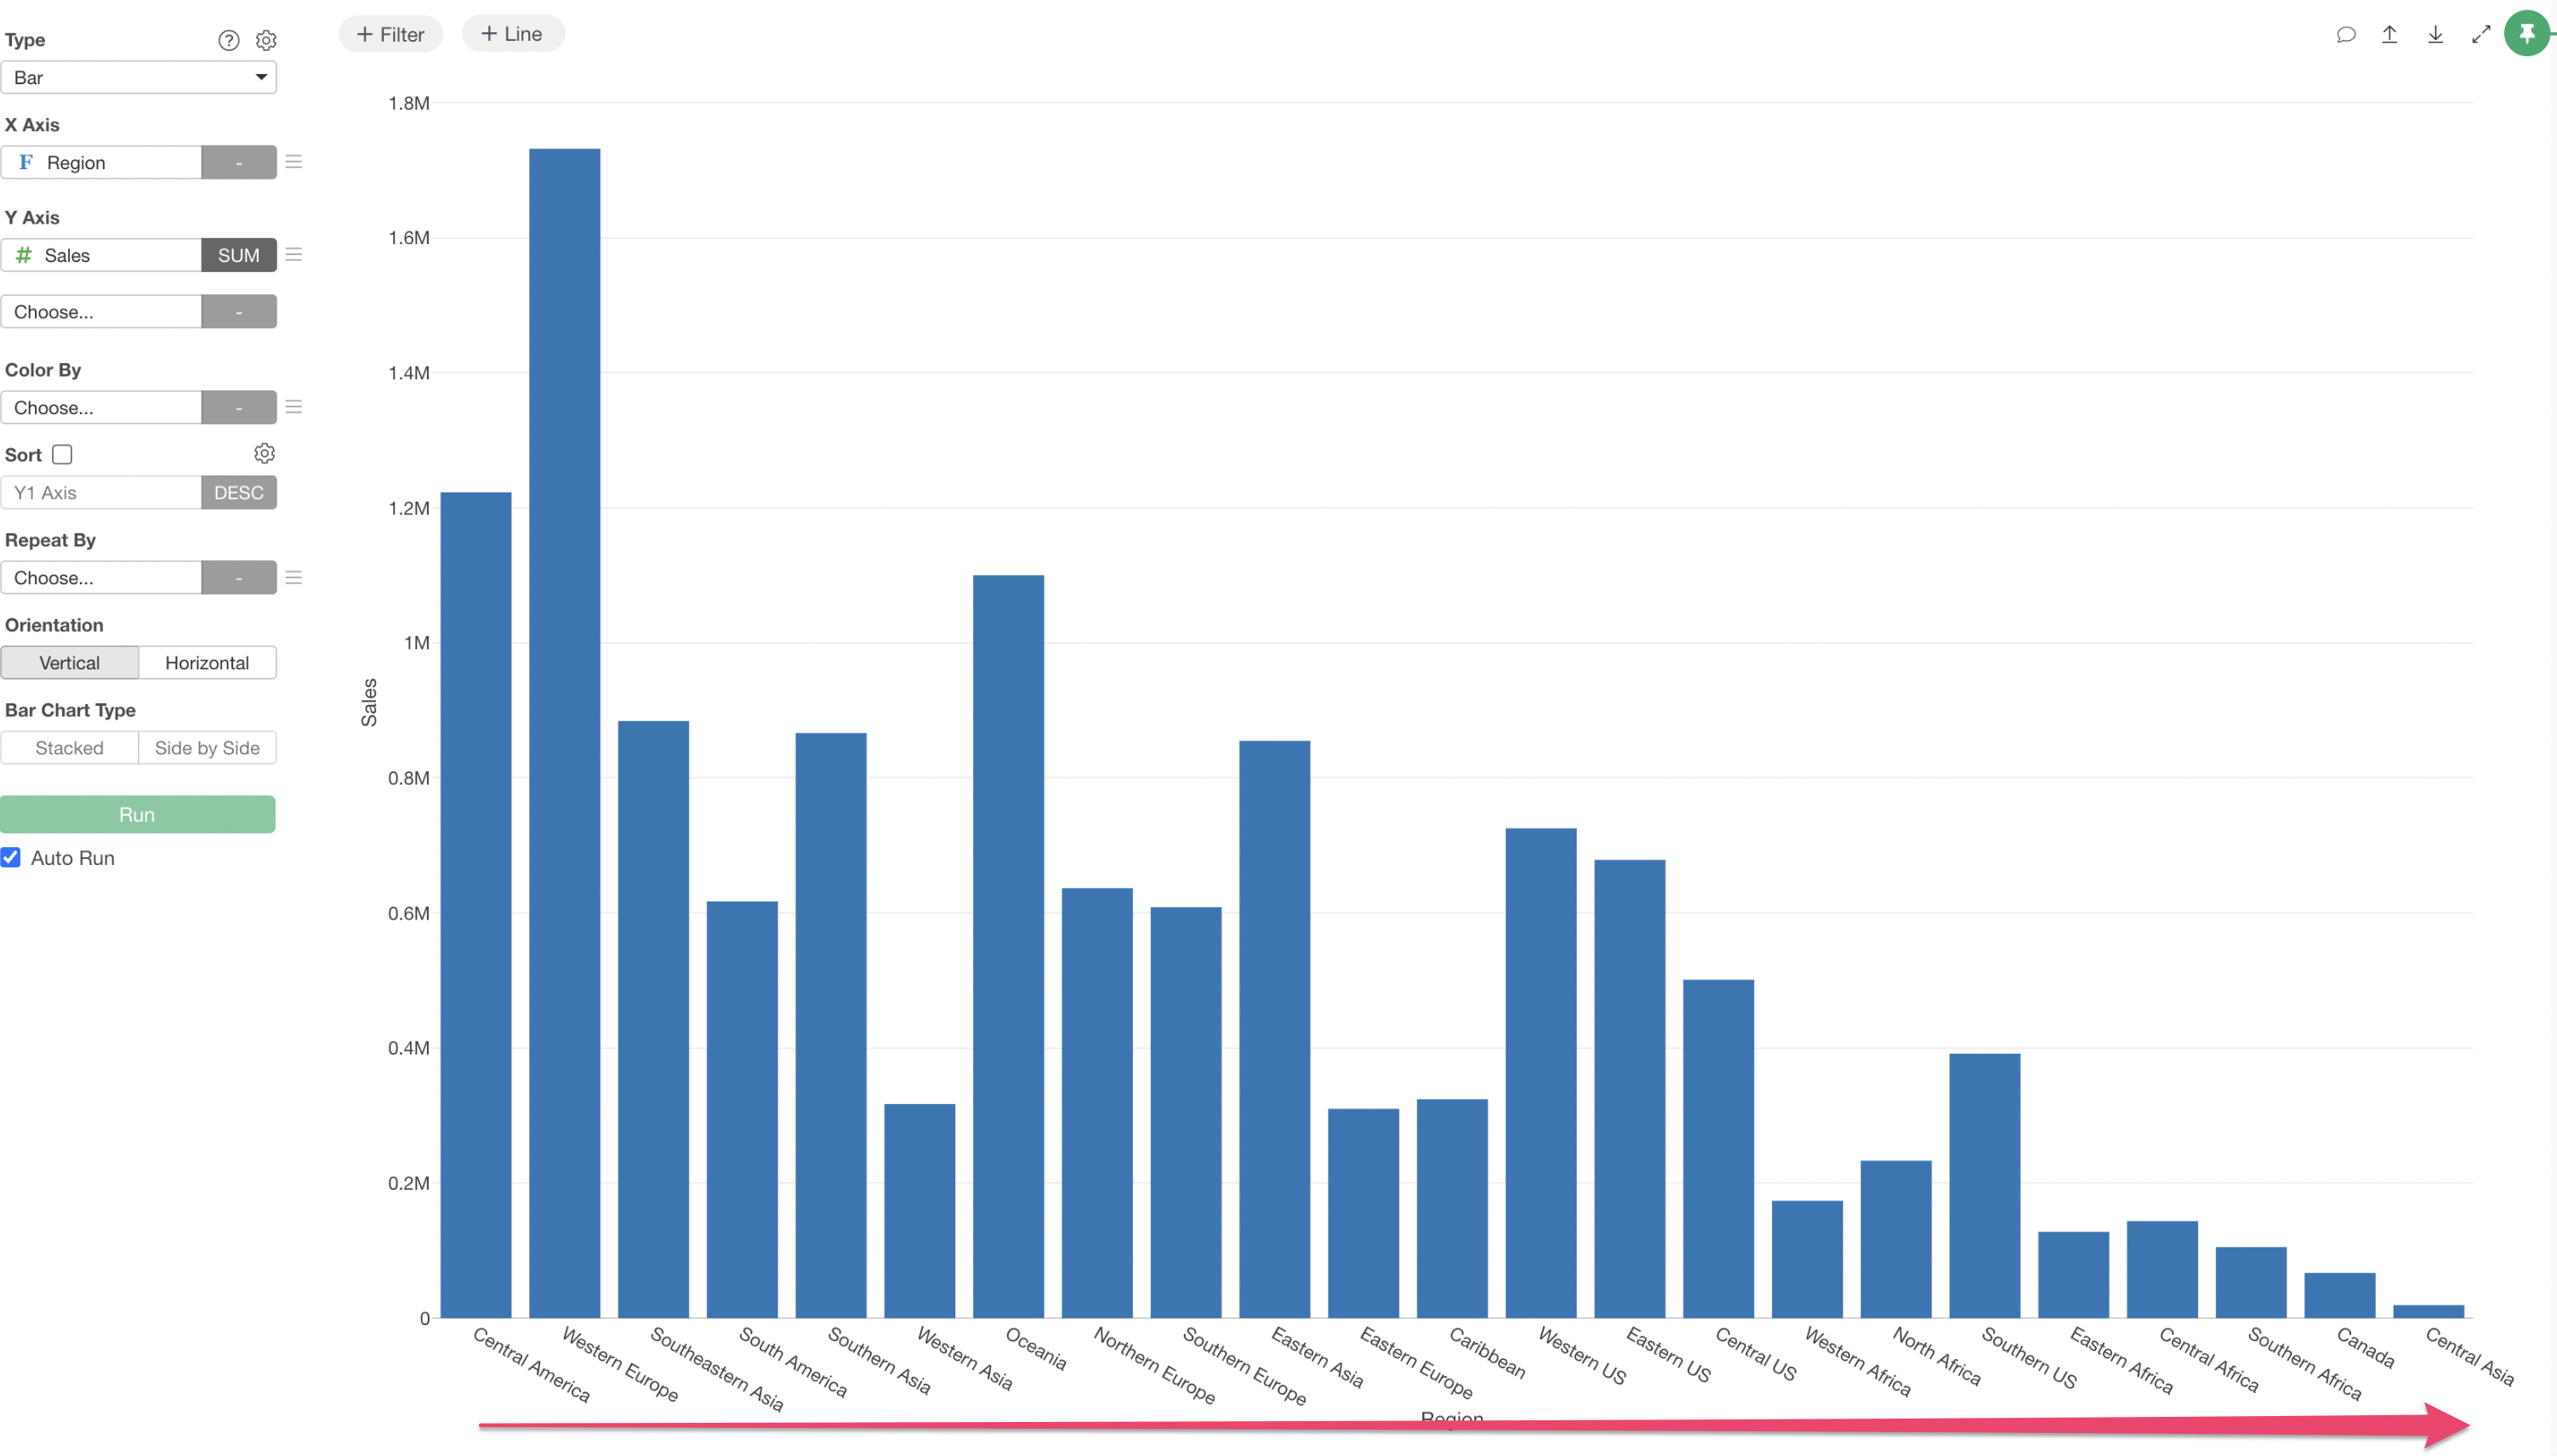
For example, the following data shows one row representing one Region.
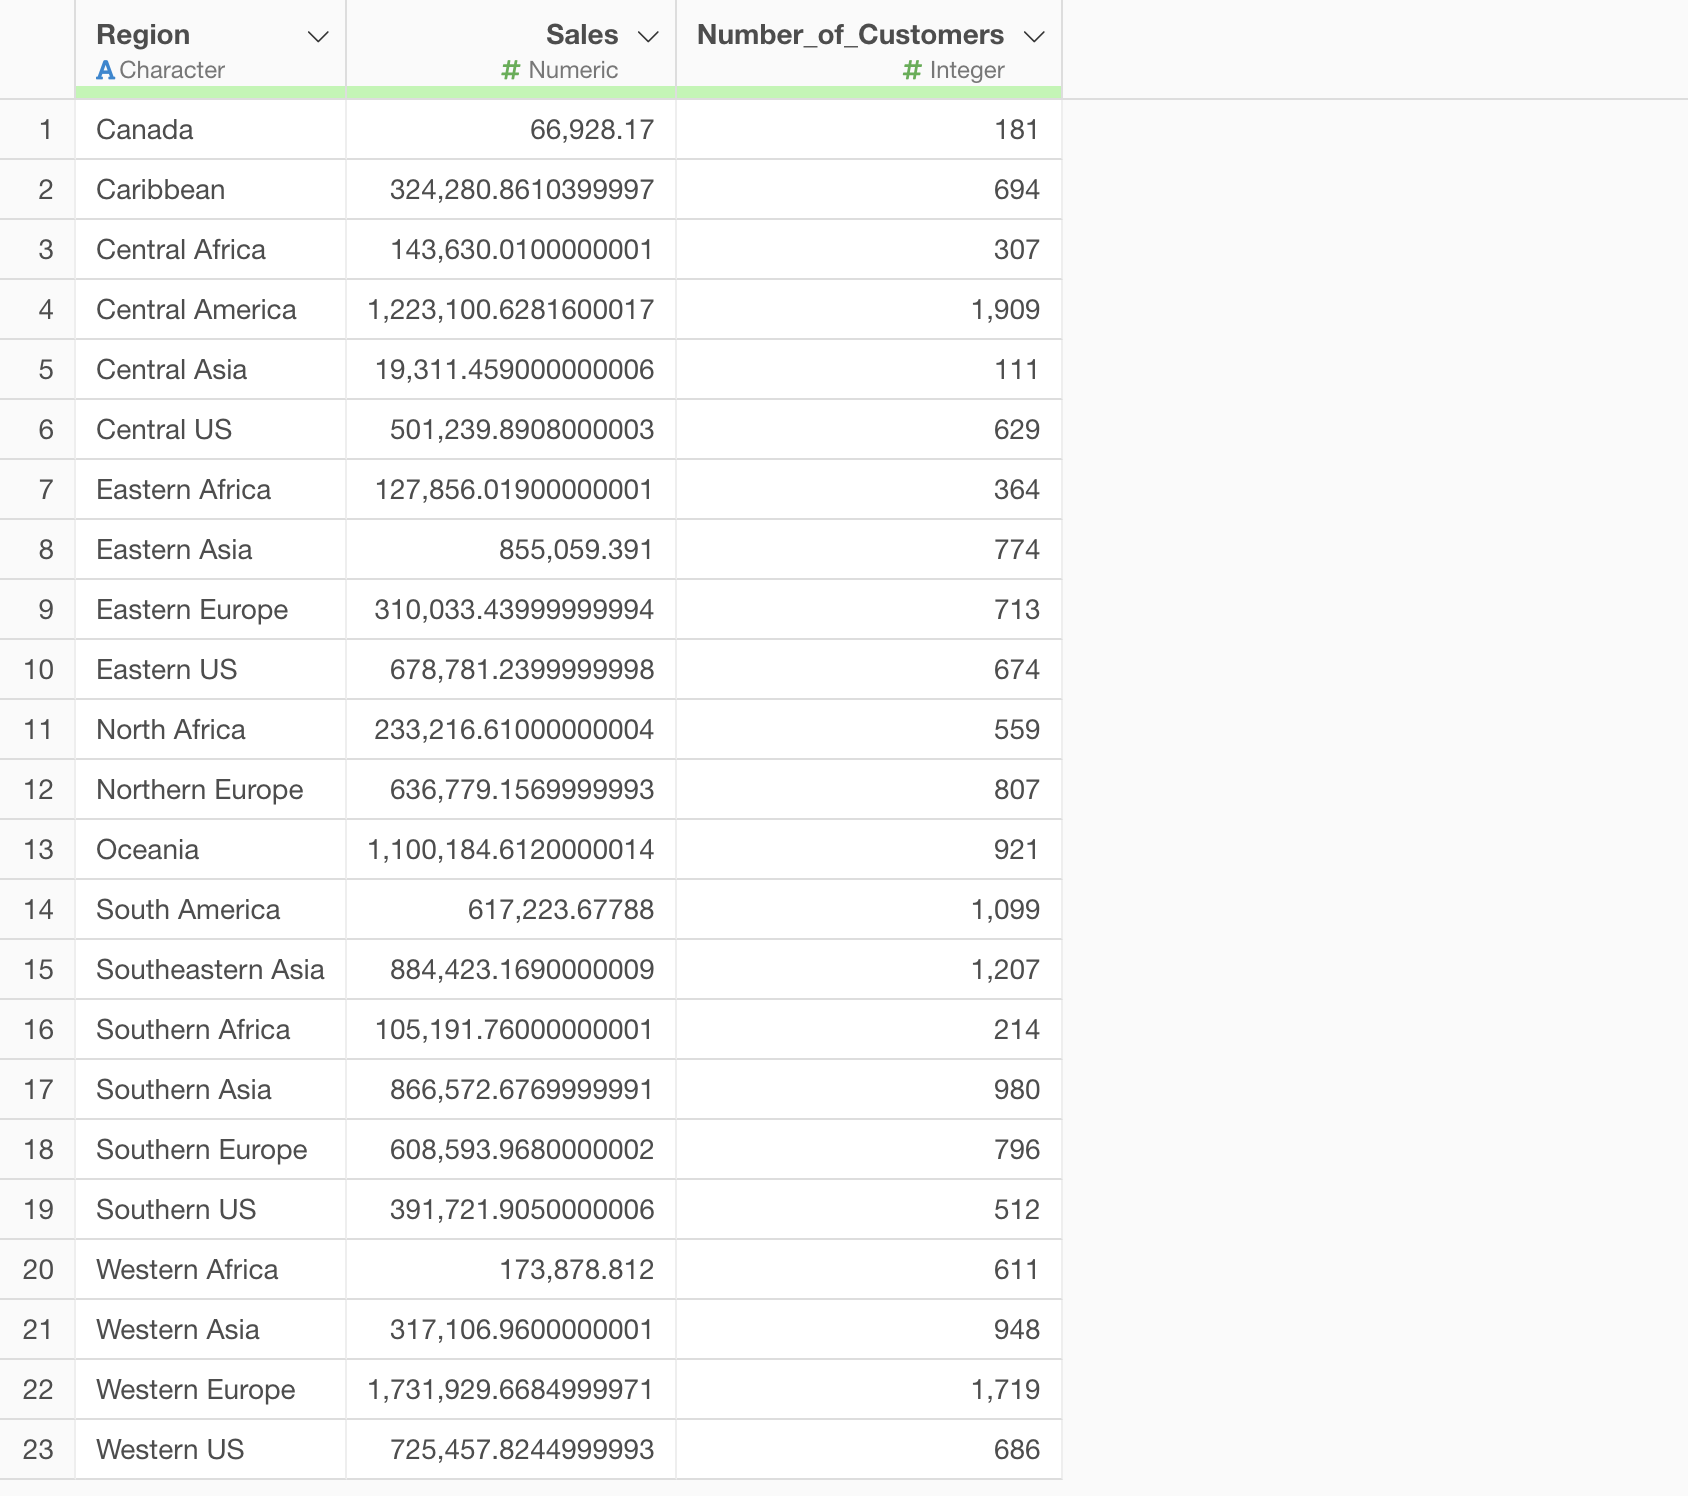
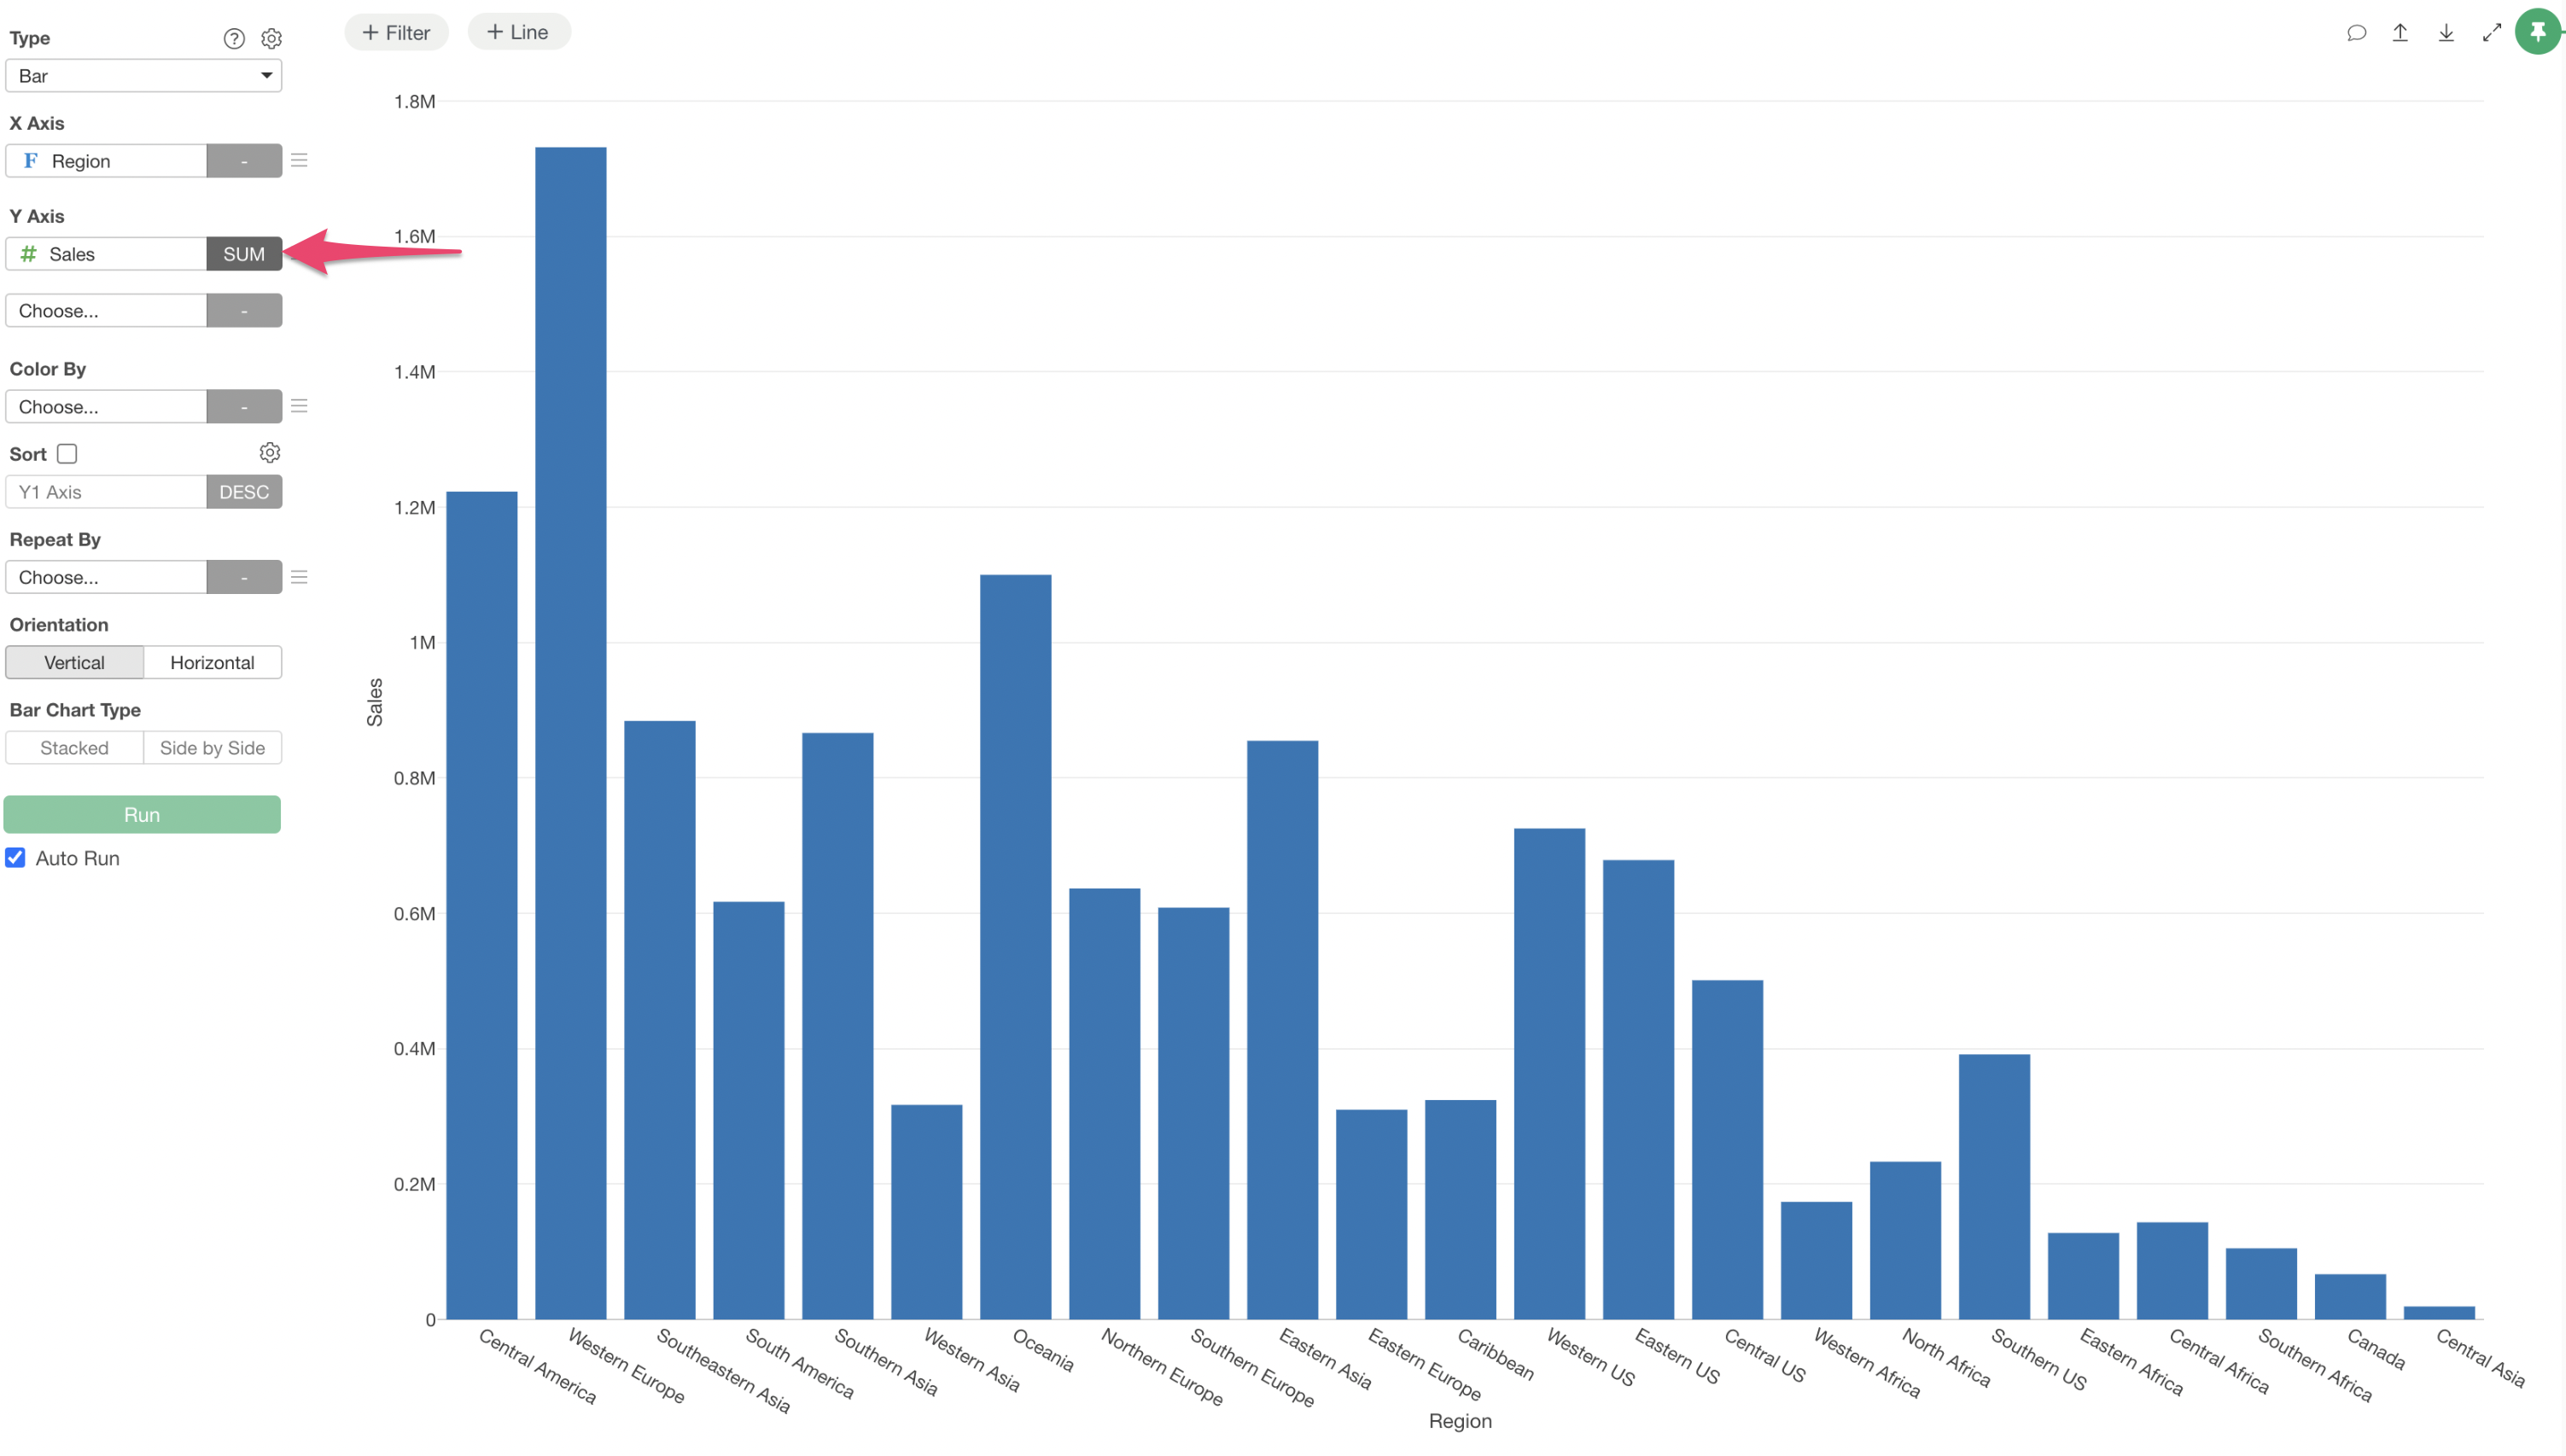
A chart is created to compare Sales by Region, with Sales assigned to the Y-axis.
However, let’s say you want to sort the Regions in descending order of “Number_of_Customers”.
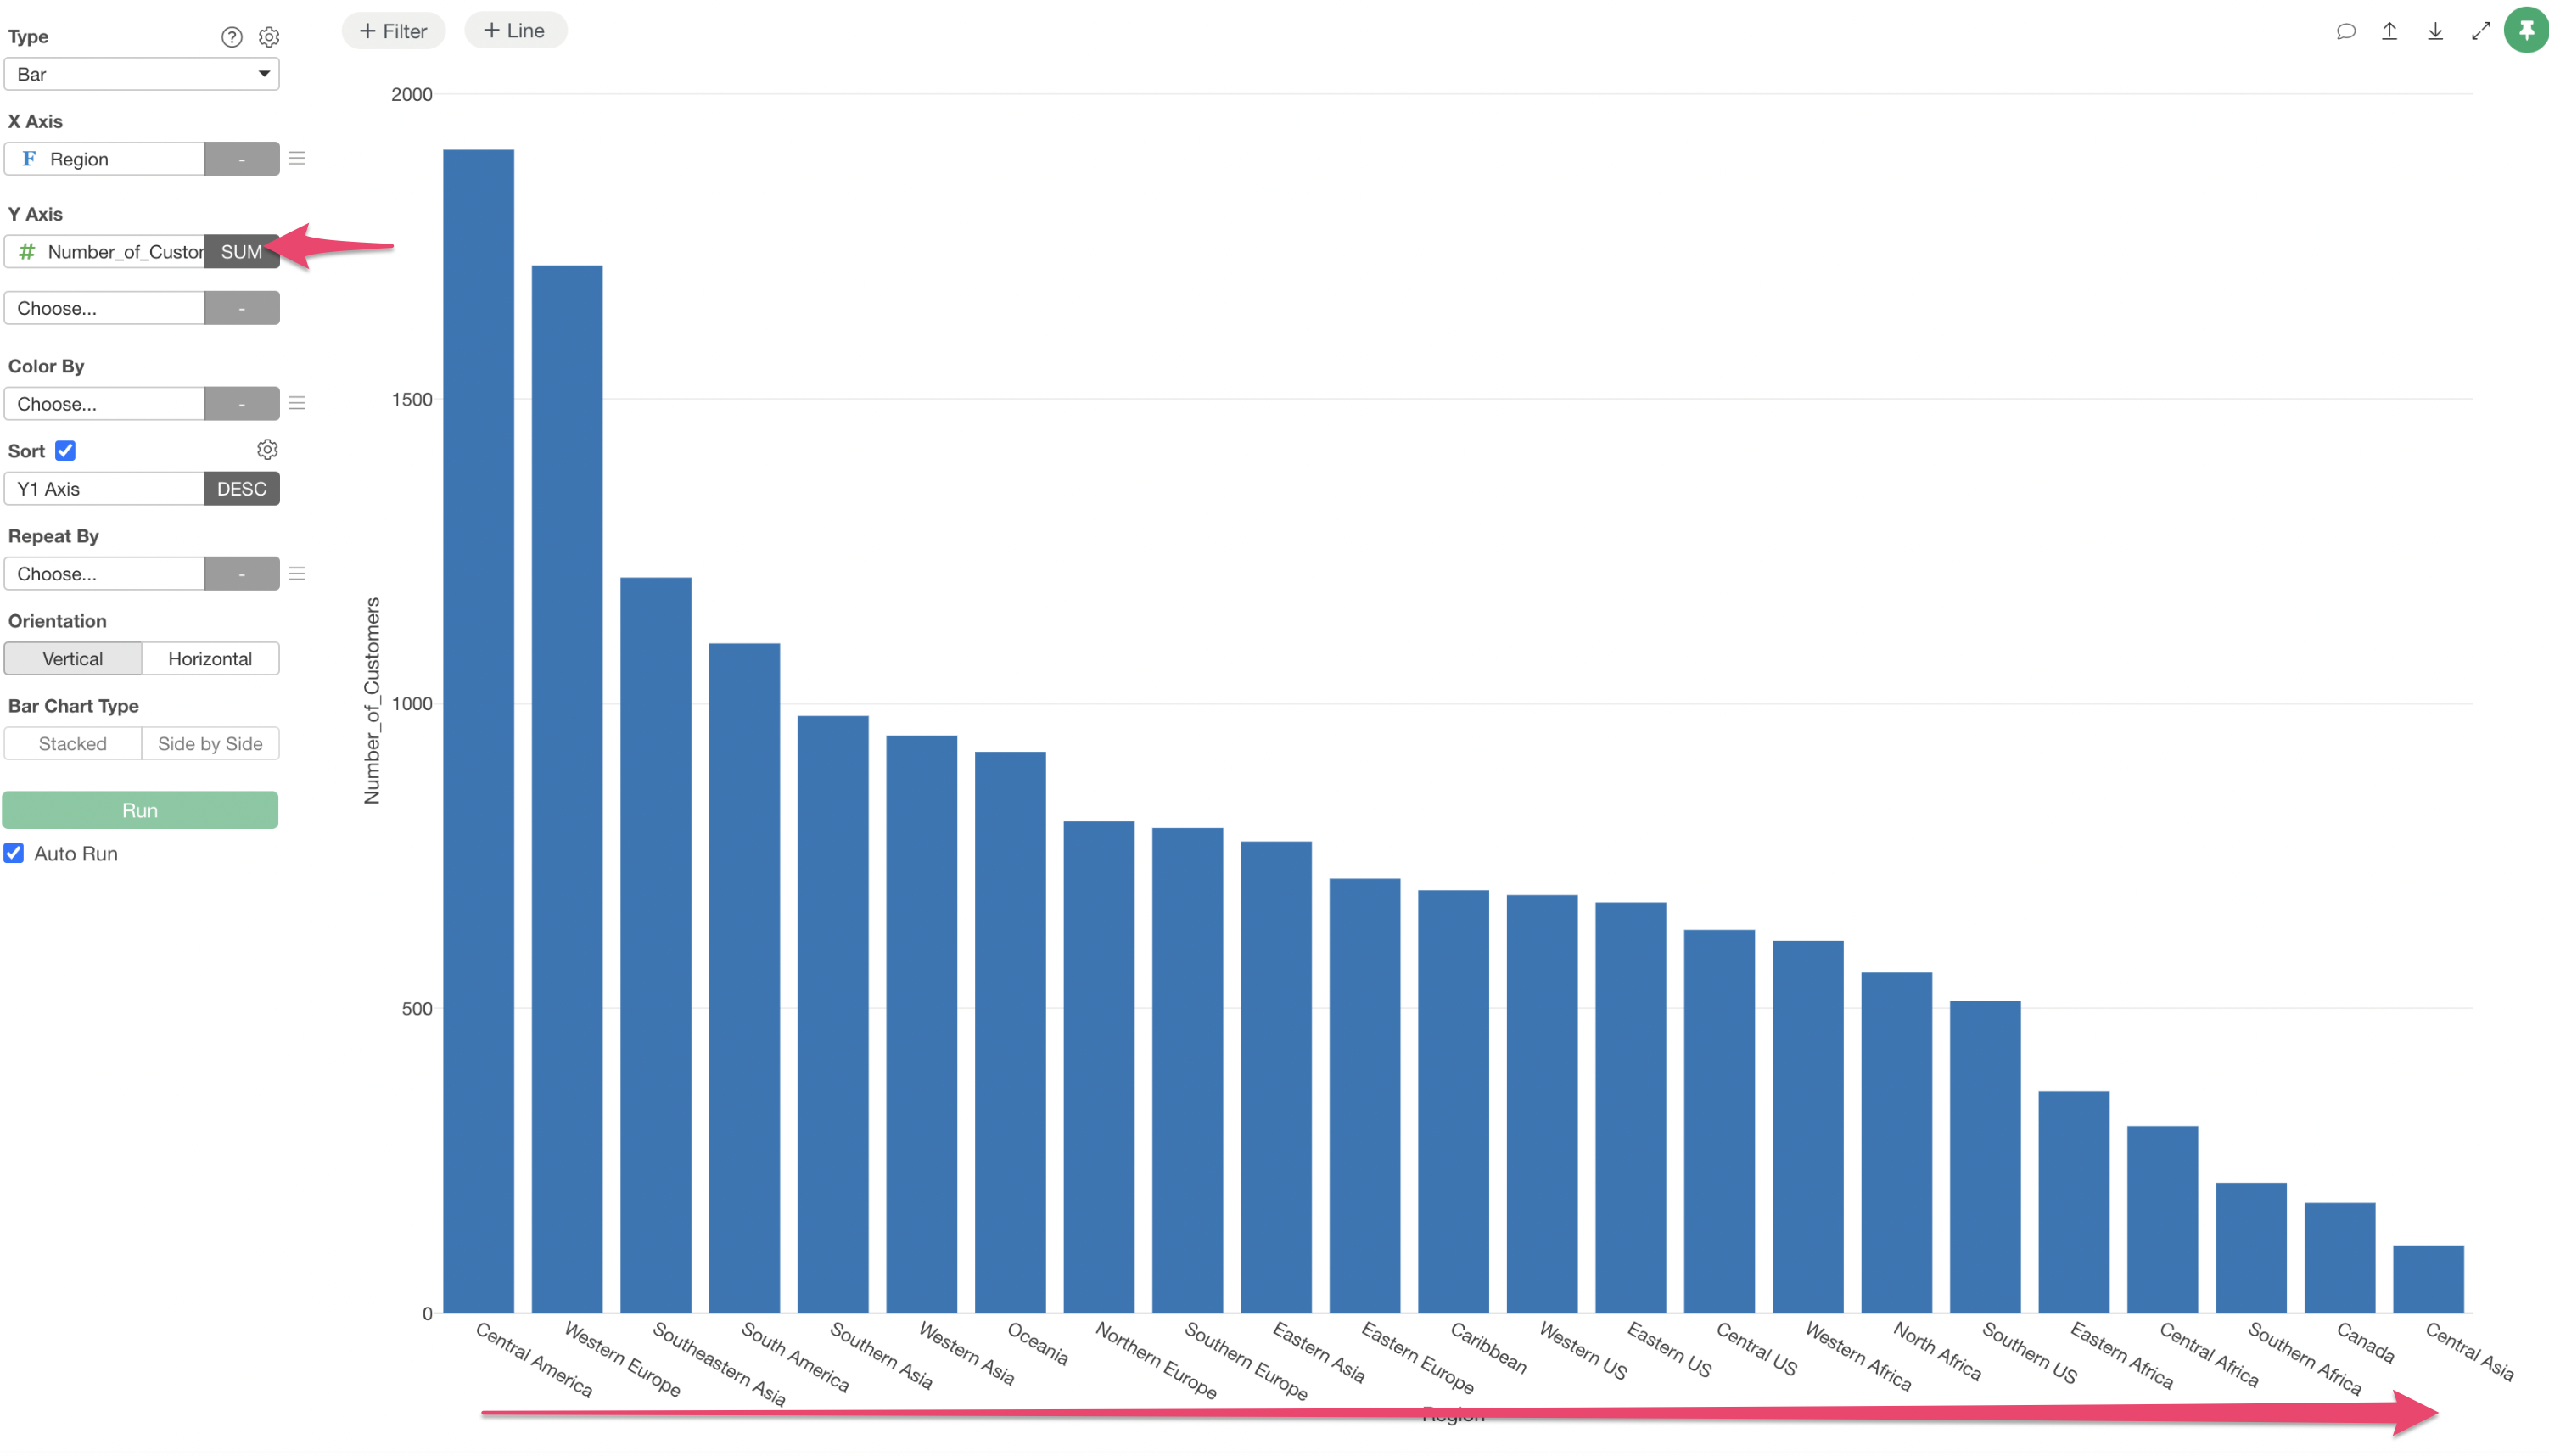
In such a case, by using “Based on Another Column’s Value”, you can set the order based on the magnitude of values in another column, “Number_of_Customers”.
Using such data, if you write
fct_reorder(Region, Number_of_Customers, .desc = TRUE), you
can set the category order for Region in descending order of
Number_of_Customers.
This allows you to display Regions in descending order of Number_of_Customers while still visualizing Sales on the Y-axis.
Reverse Order
“Reverse Order” is used to reverse an already established order for a Factor type.
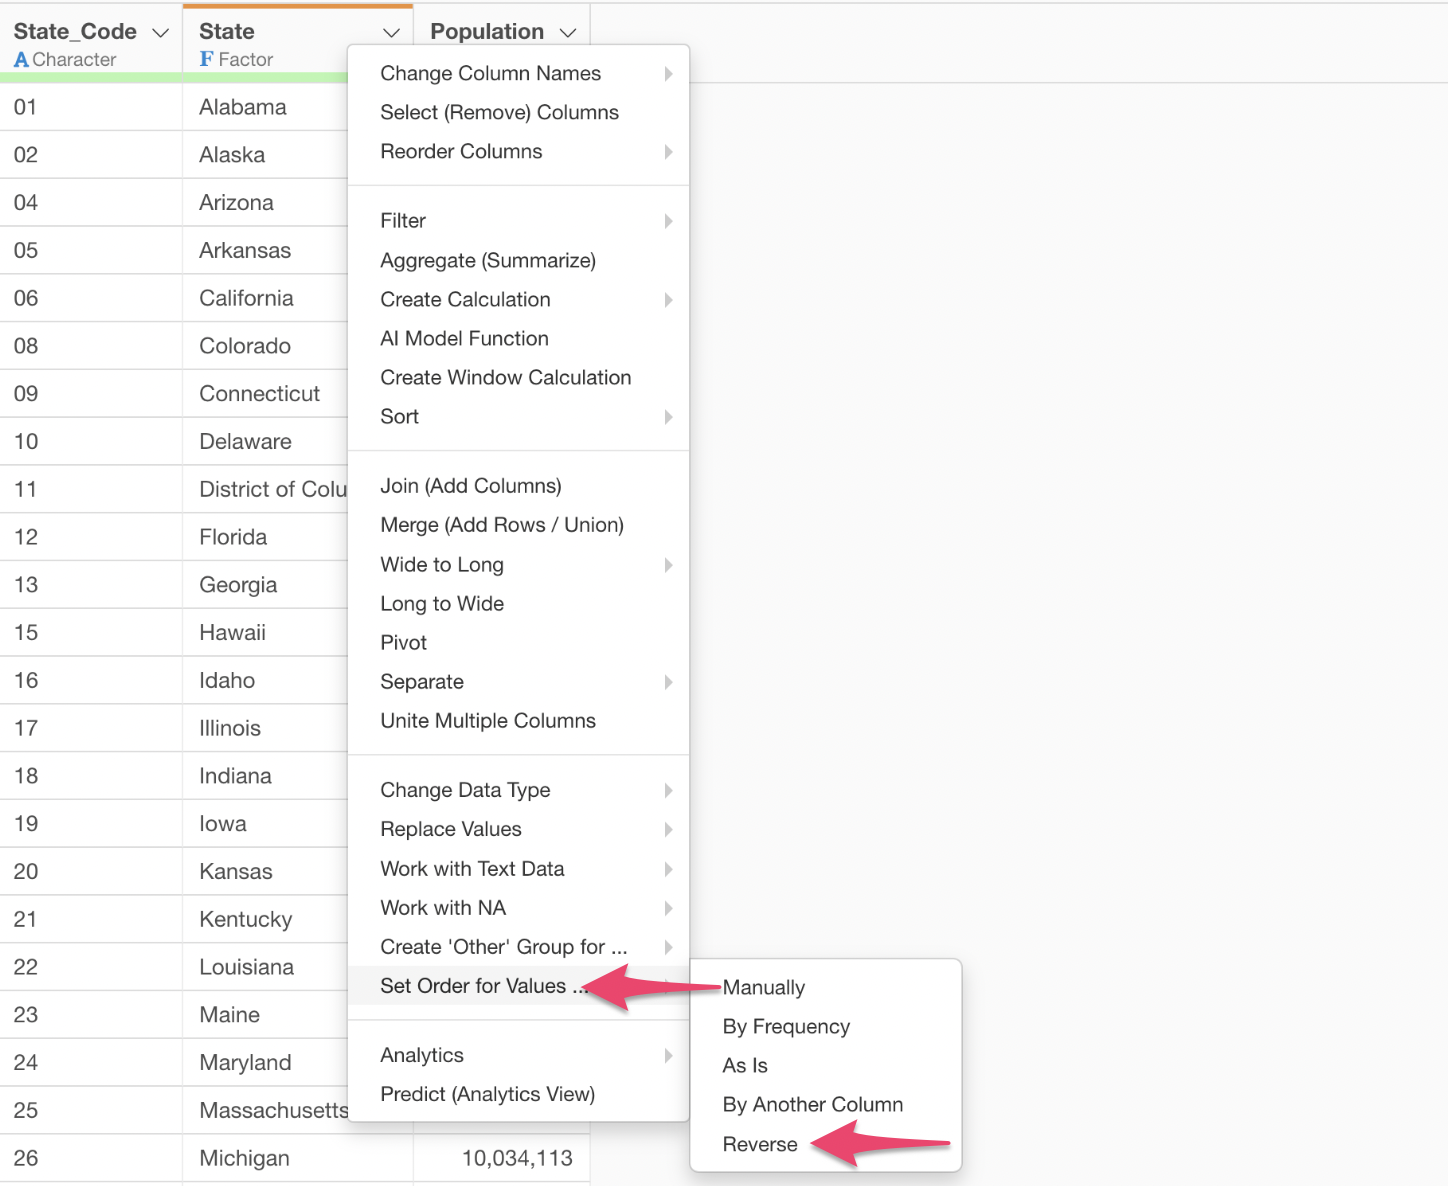
Selecting “Set Order for Values” -> “Reverse” from the Column Header Menu of a Factor type column will display the “Create Calculation” dialog as shown below.
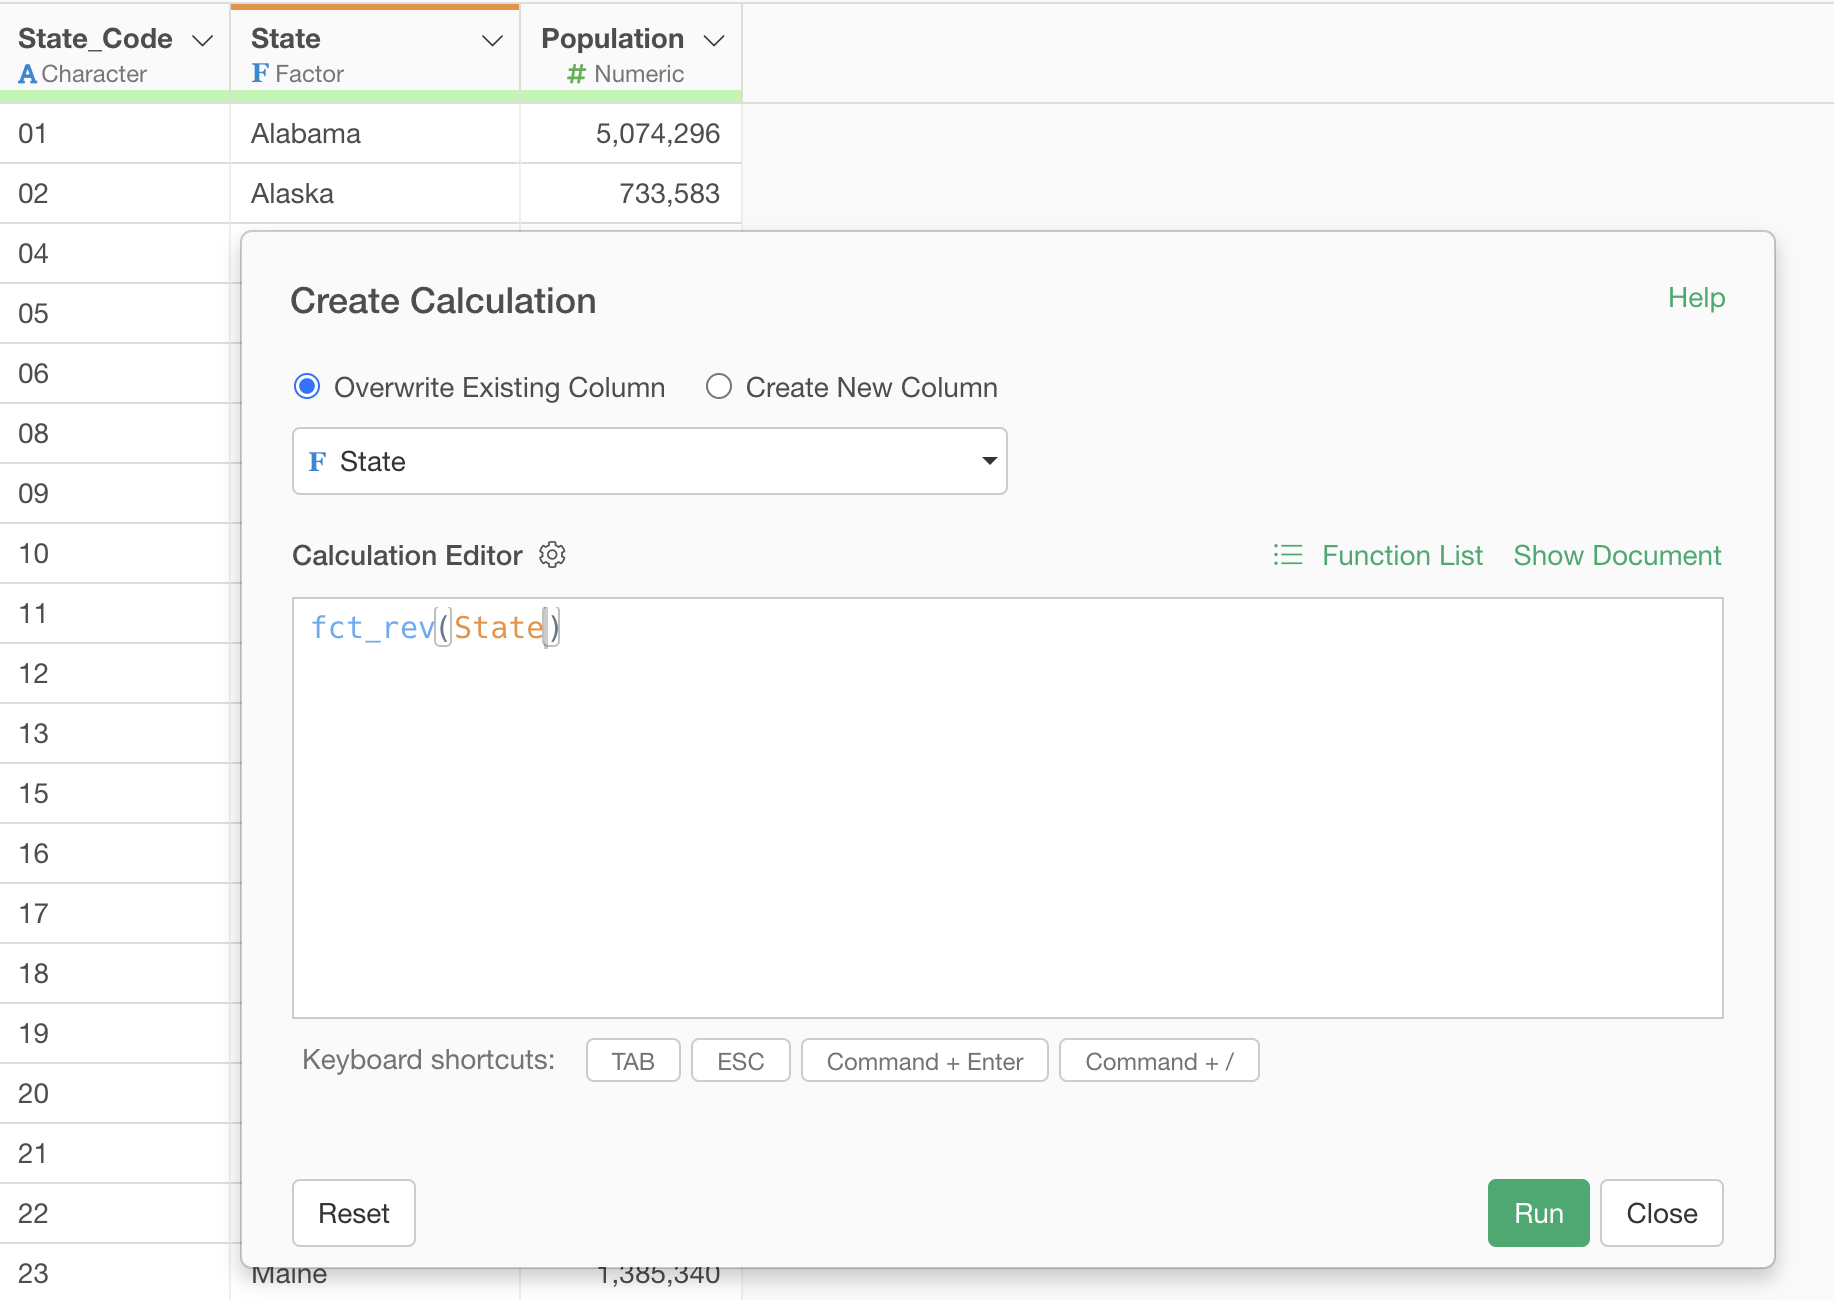
The fct_rev function is a function that reverses the
currently set order of the target column.
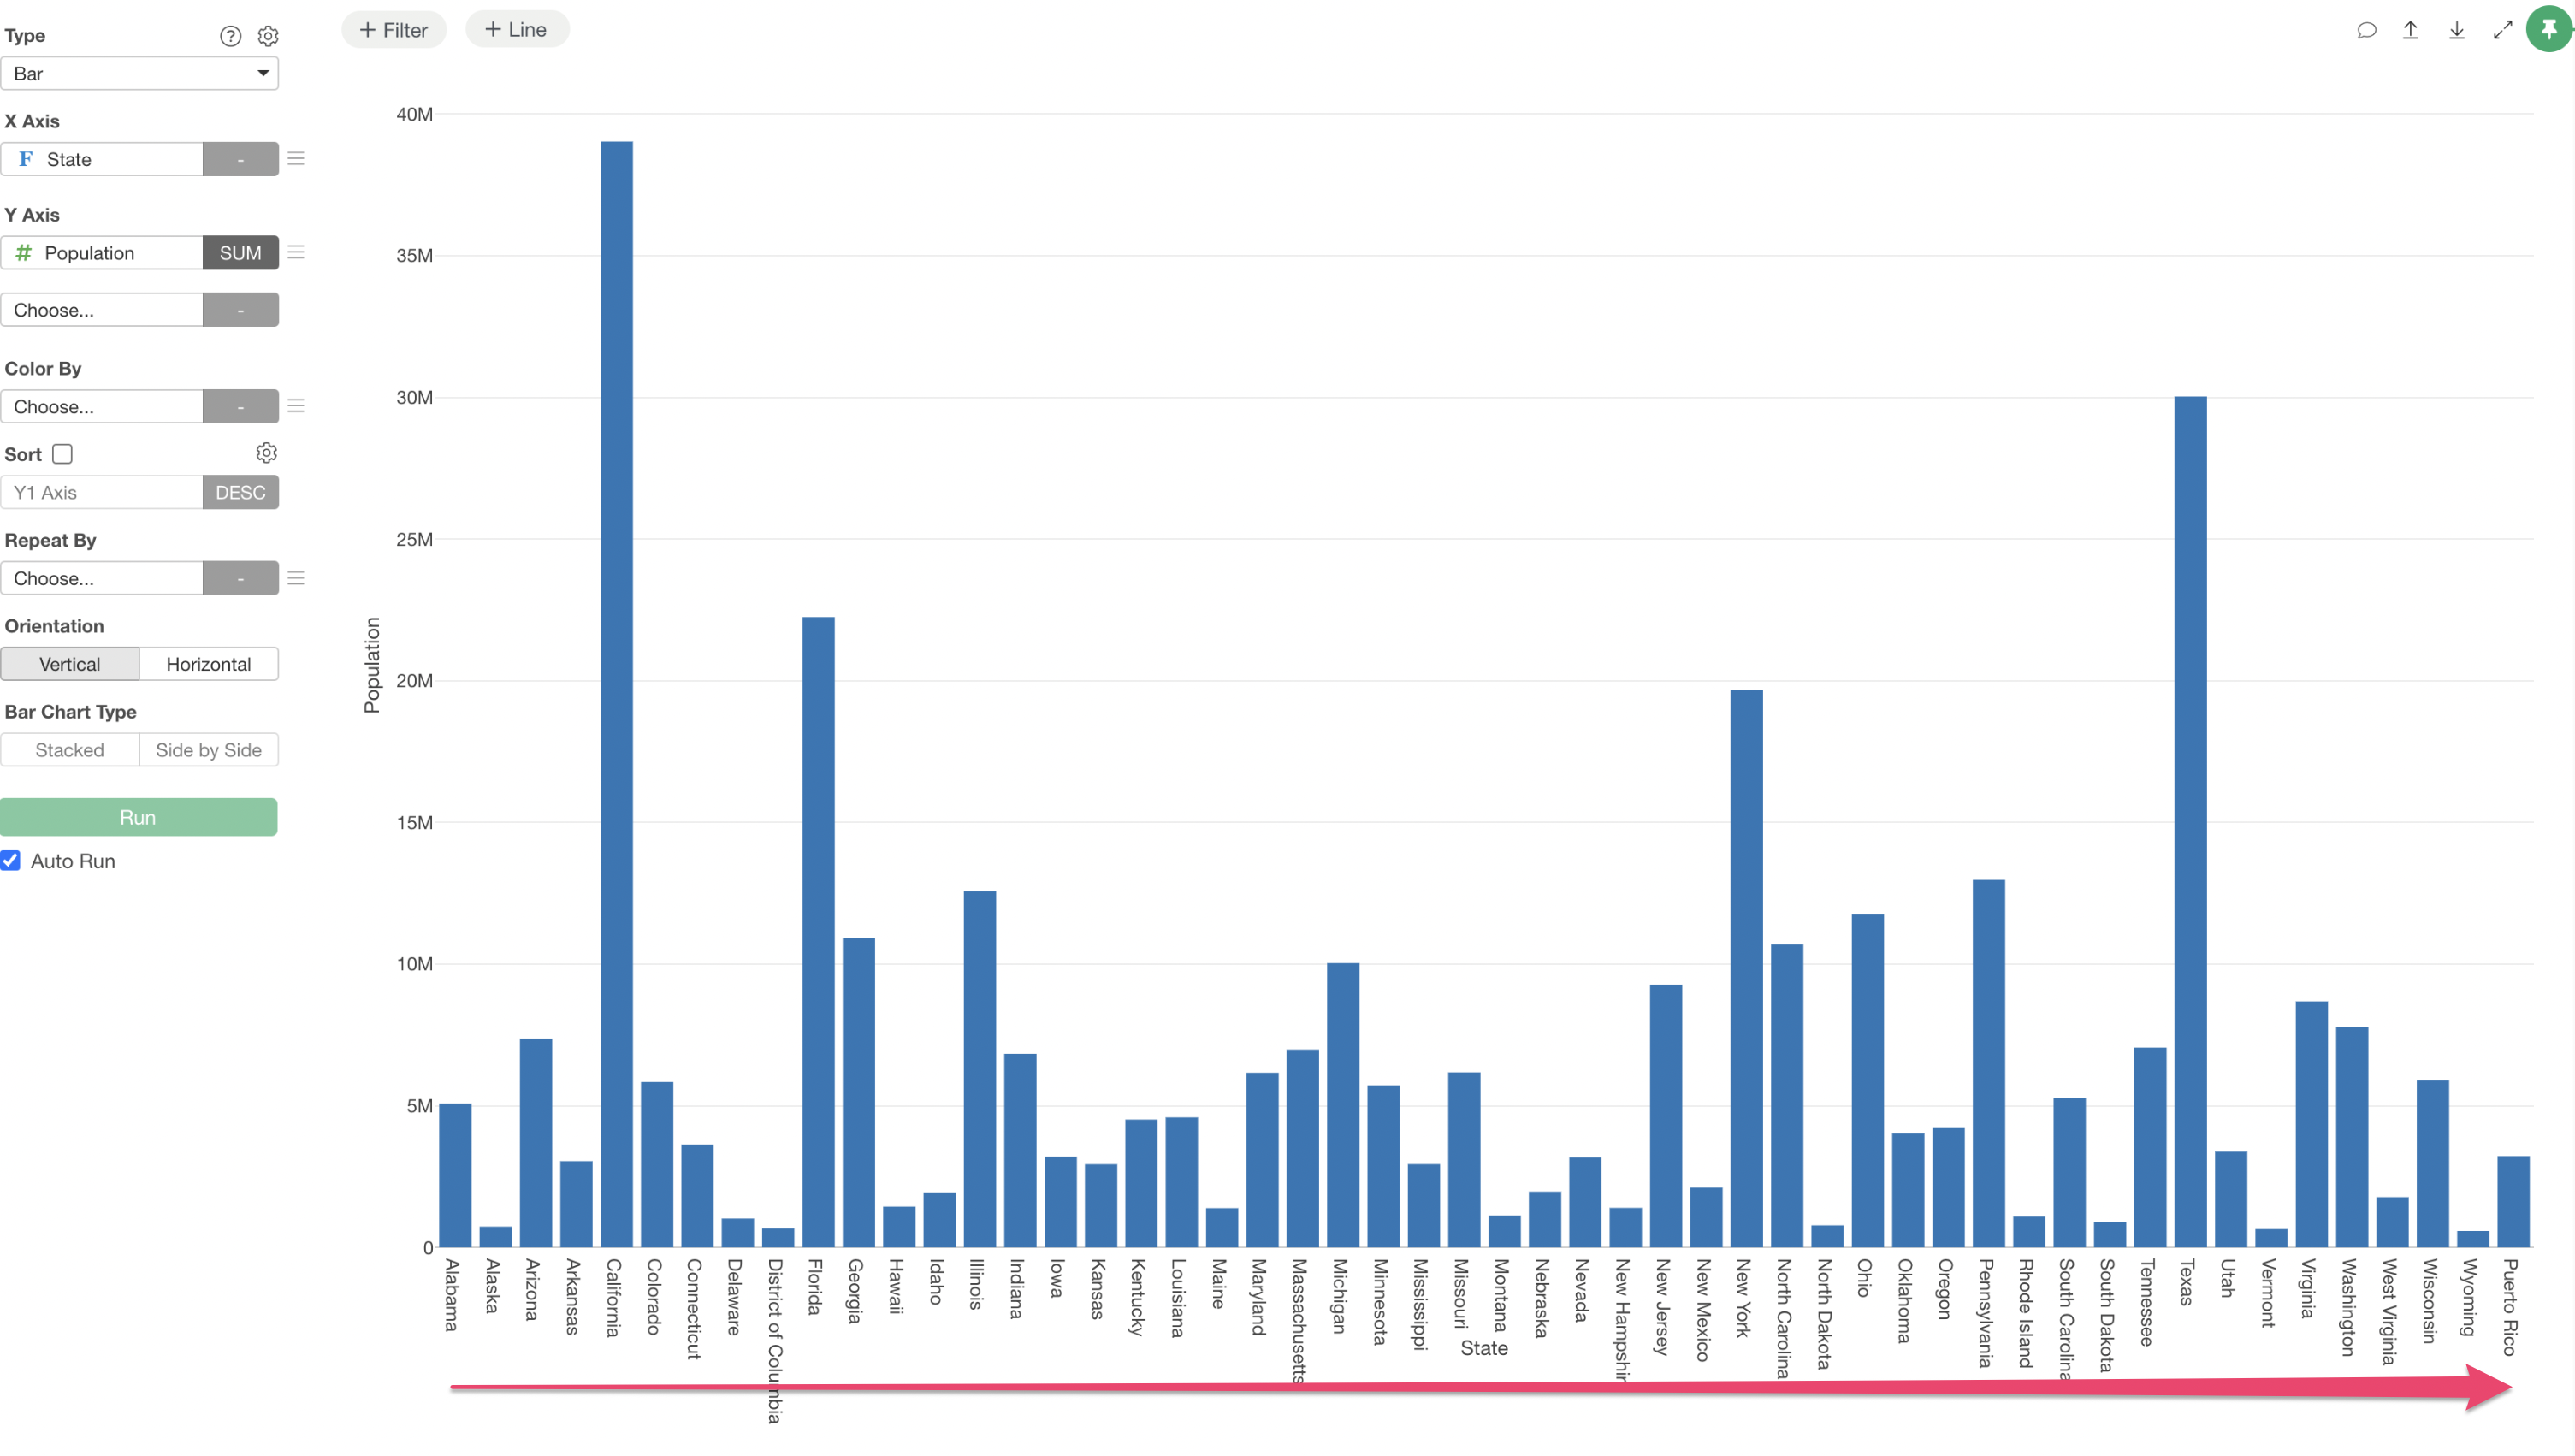
For example, the following data shows one row representing a U.S. State, sorted by State_Code.
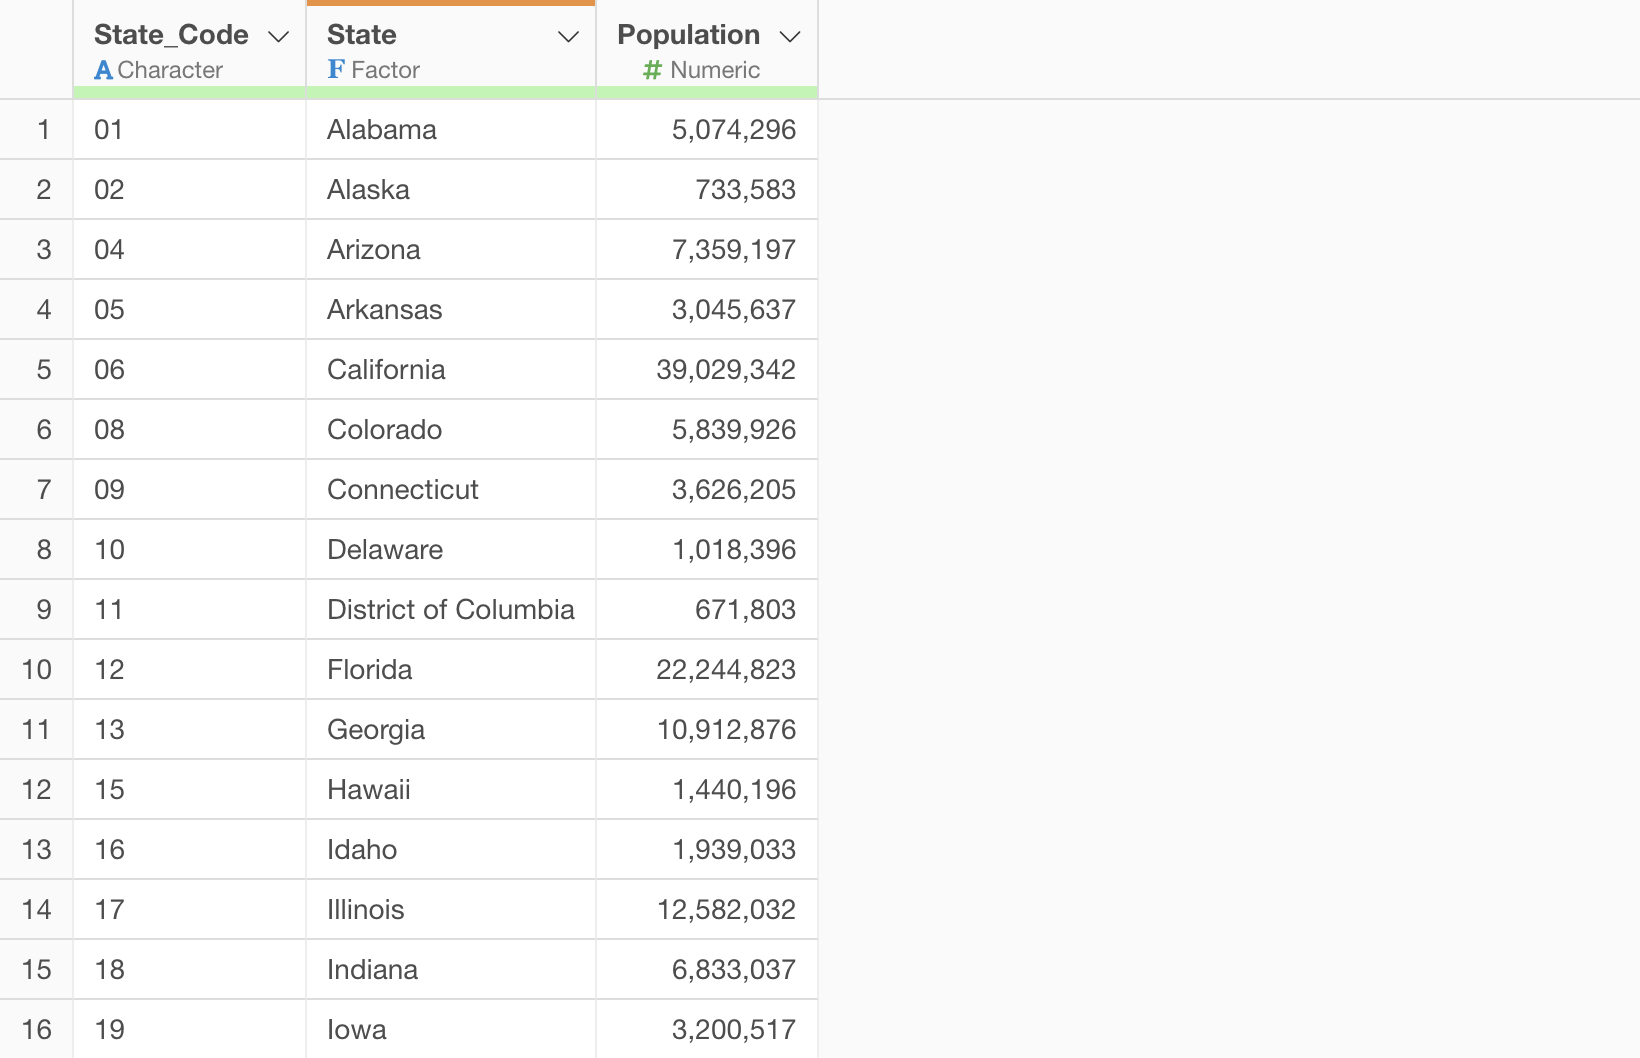
In this data, State is a Factor type, and the order is set by State_Code.
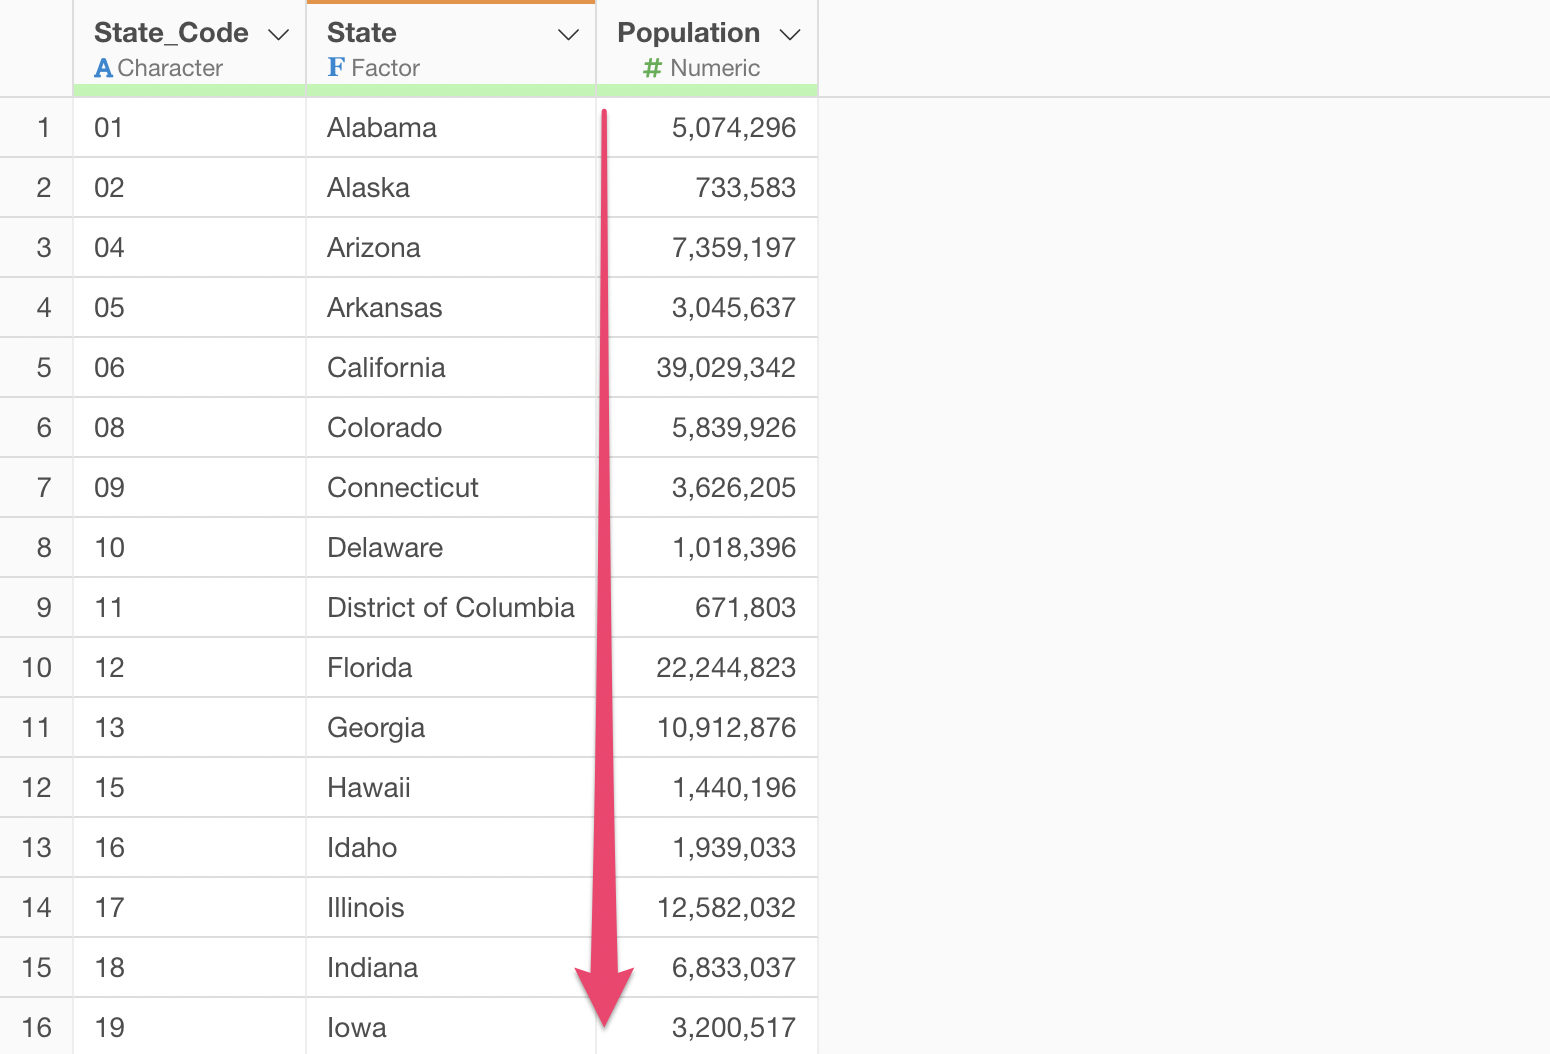
When visualizing the Population for each State using such data, it can be done in the order of State_Code.
On
the other hand, let’s say you want to visualize it in reverse order of
State_Code.
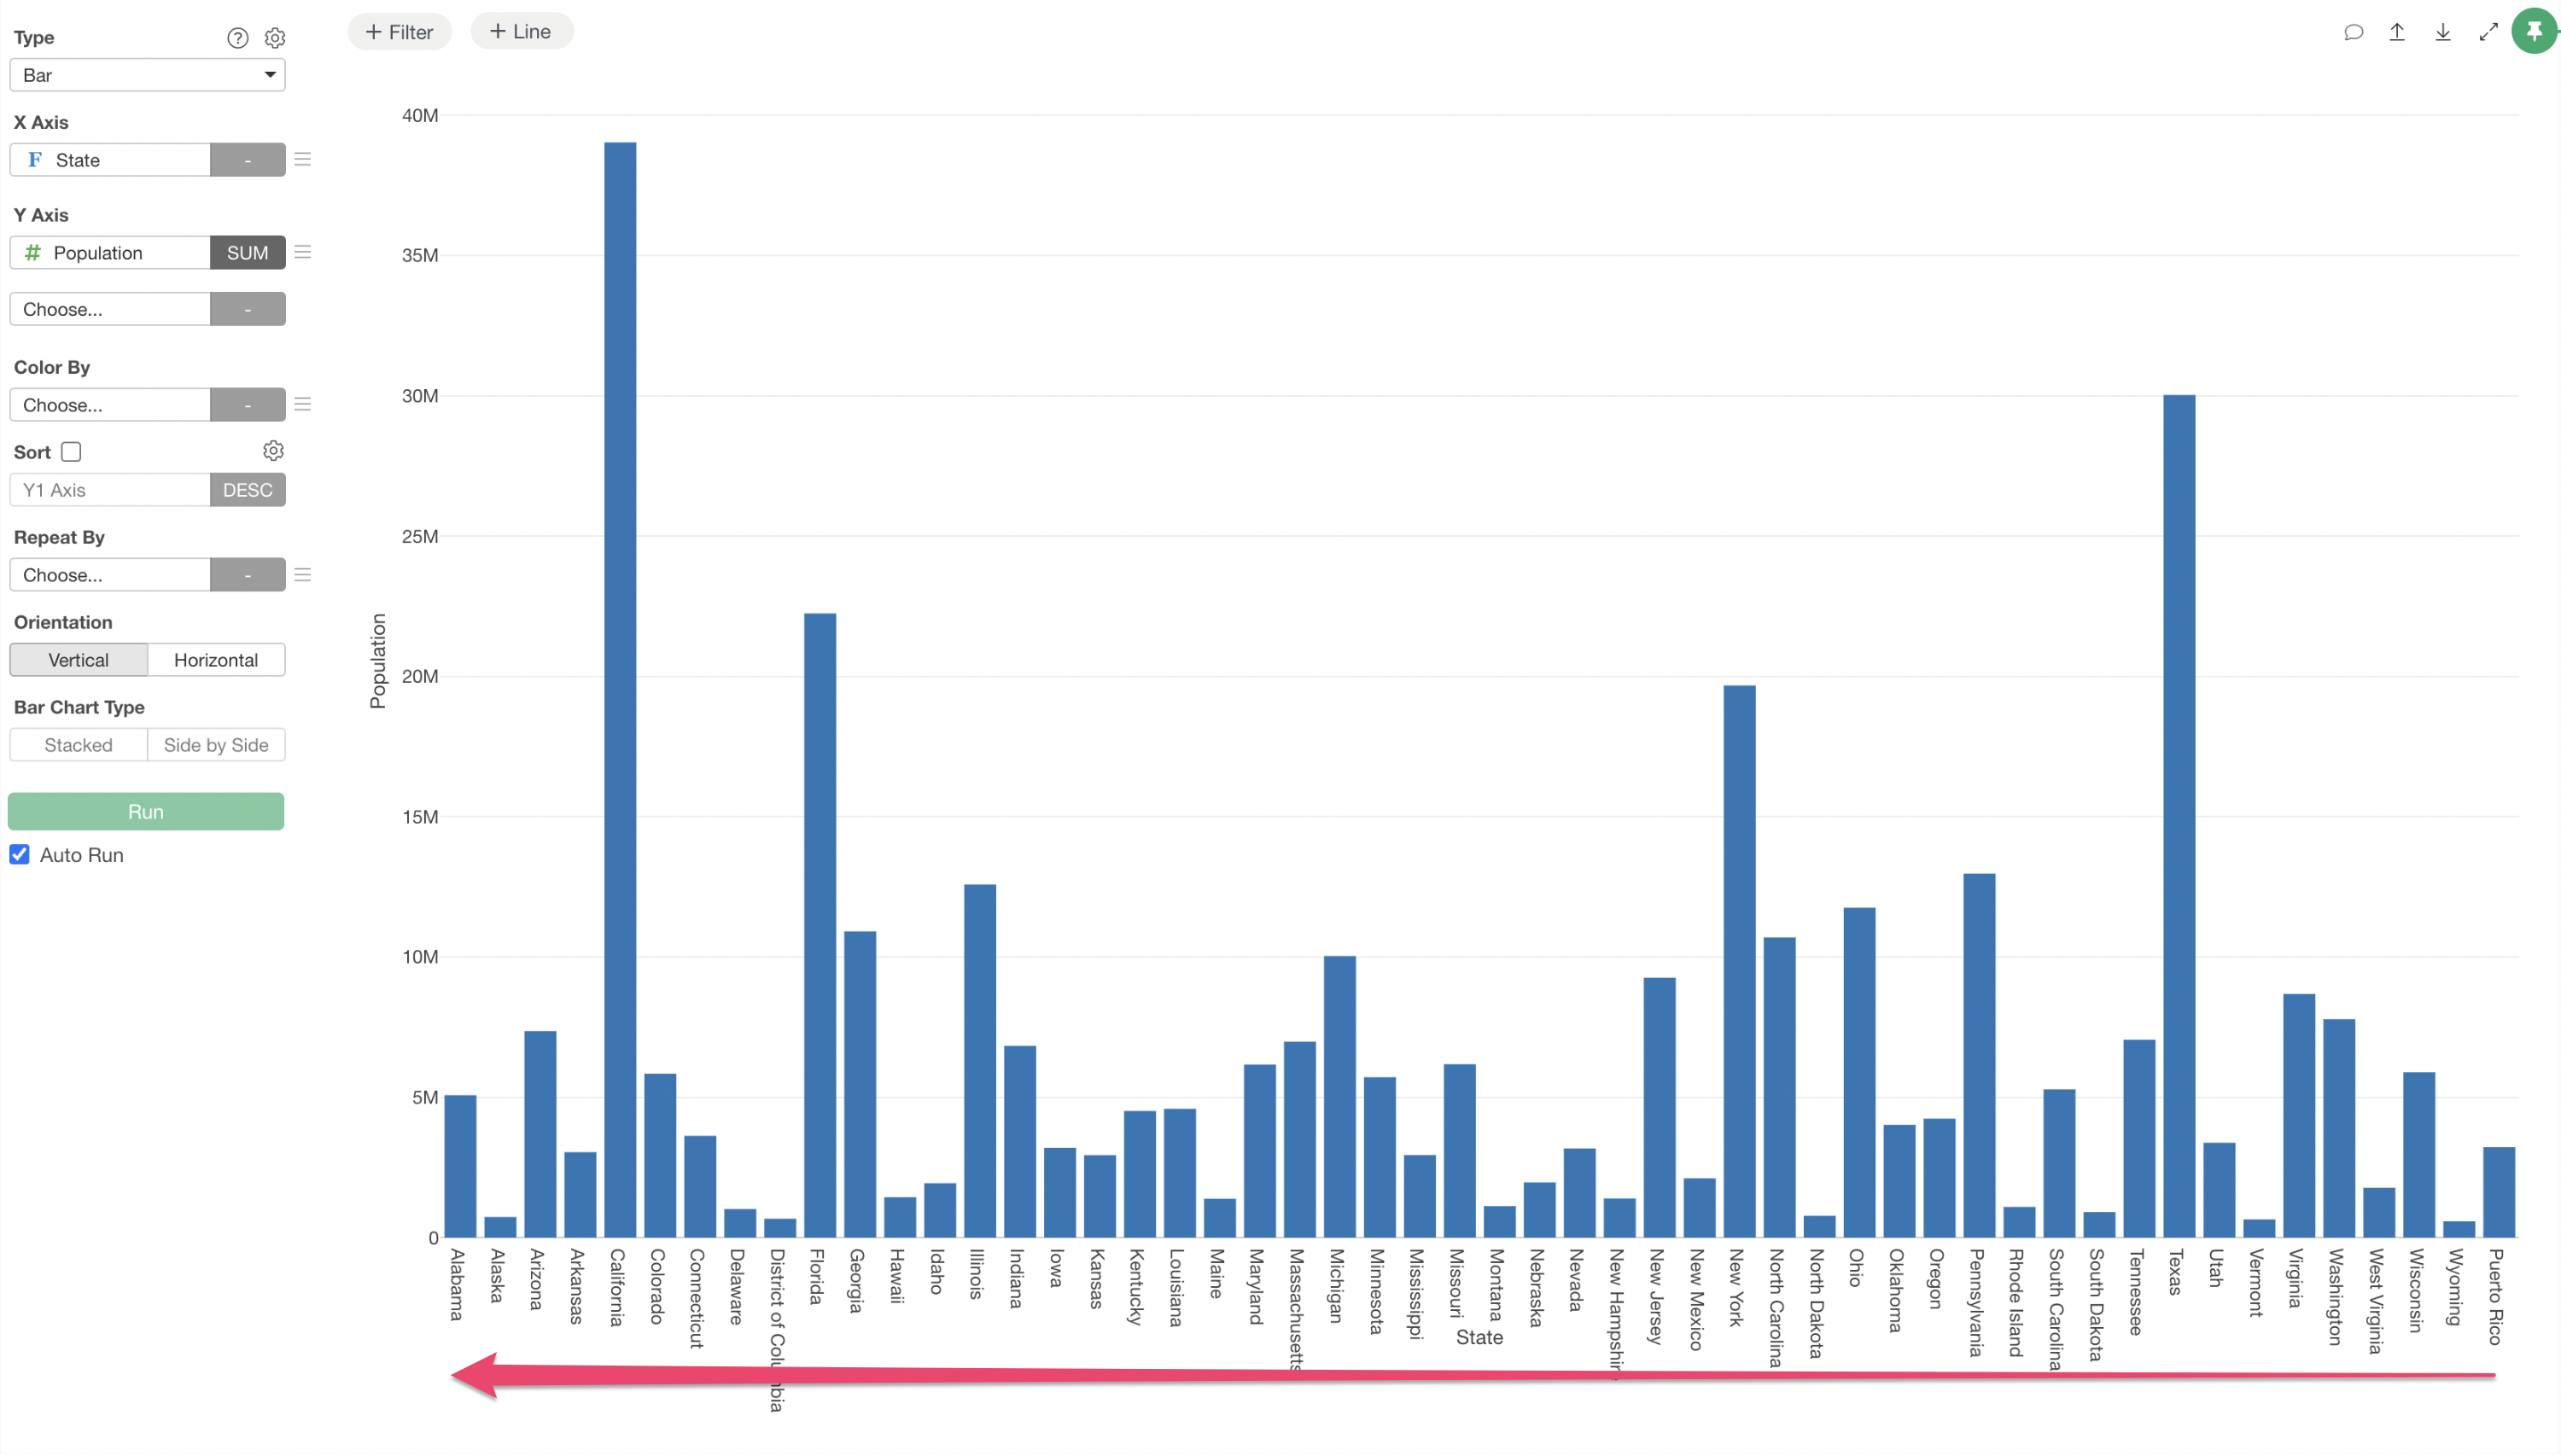
In such a situation, by using the fct_rev function, you
can change the data to the desired content.