How to Specify the Axis Display Range (Period) When Assigning a Date Column to a Scatter Plot
Starting from Exploratory Desktop v14.5, when you select a Date or POSIXct (Date-Time) type column for the X-axis or Y-axis of a scatter plot, you can now specify the axis display range (period) in the chart settings.
This is useful when you want to display a specific fixed period, regardless of whether data exists for that entire timeframe.
How to Use
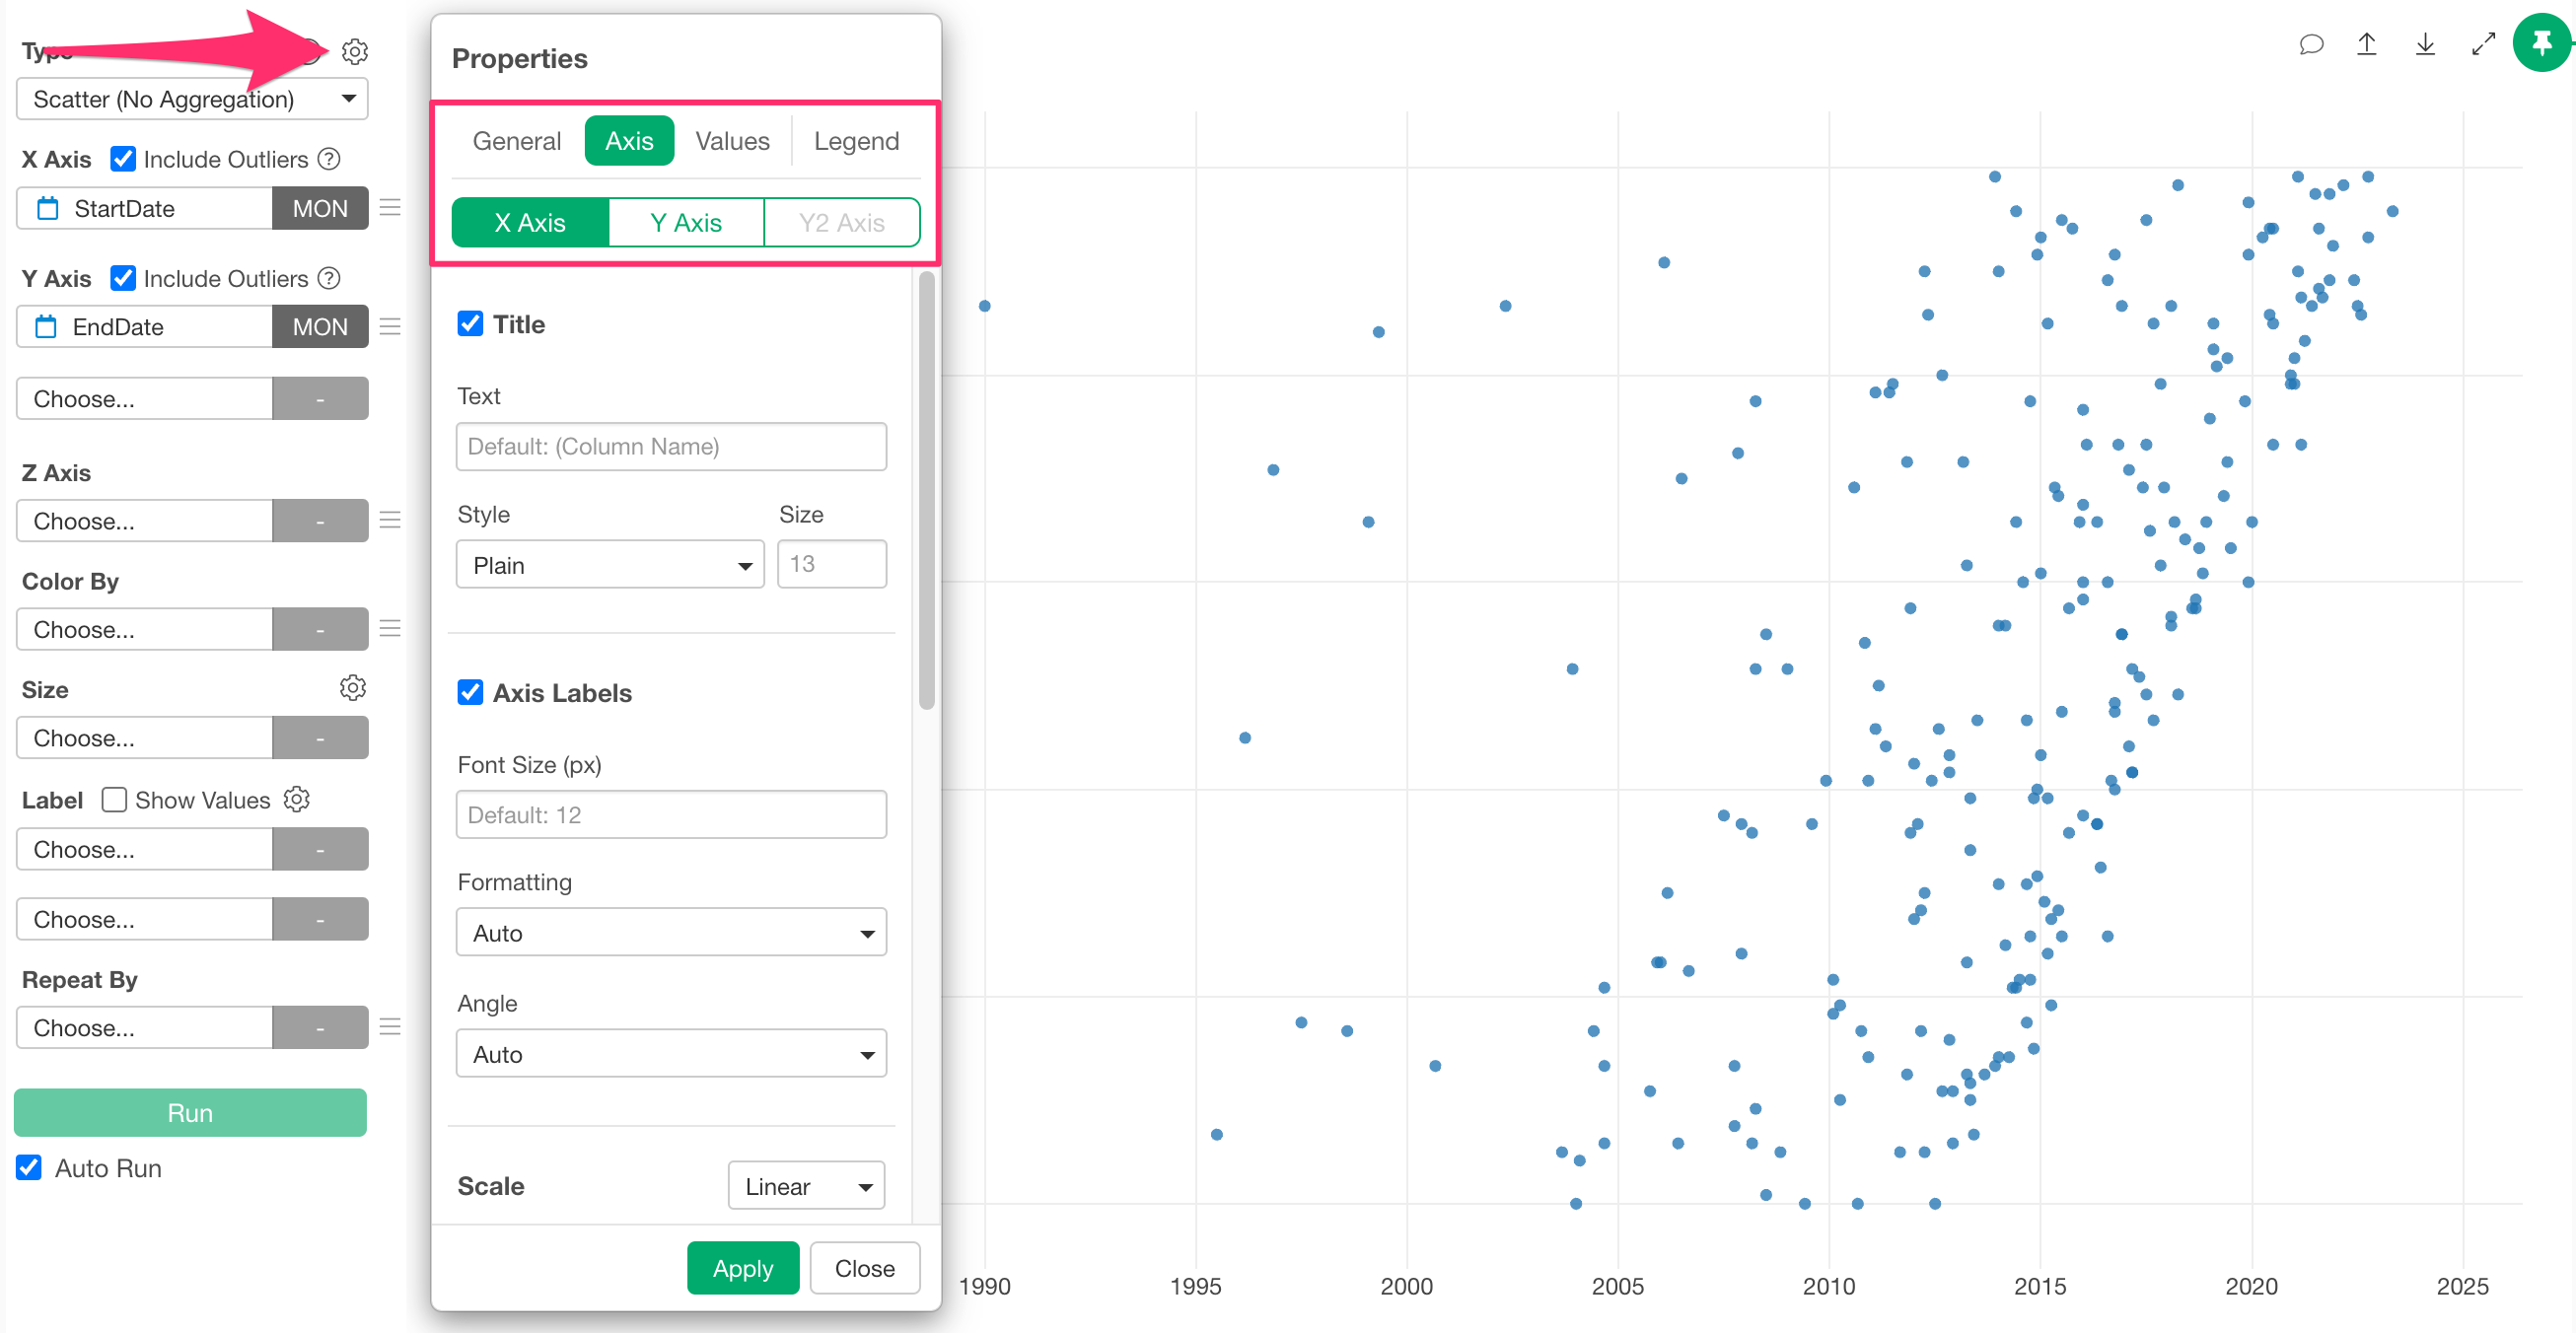
Assign a date column to the X-axis or Y-axis in a scatter plot, open the chart settings, and navigate to the Axis tab for the axis where you want to specify the range.
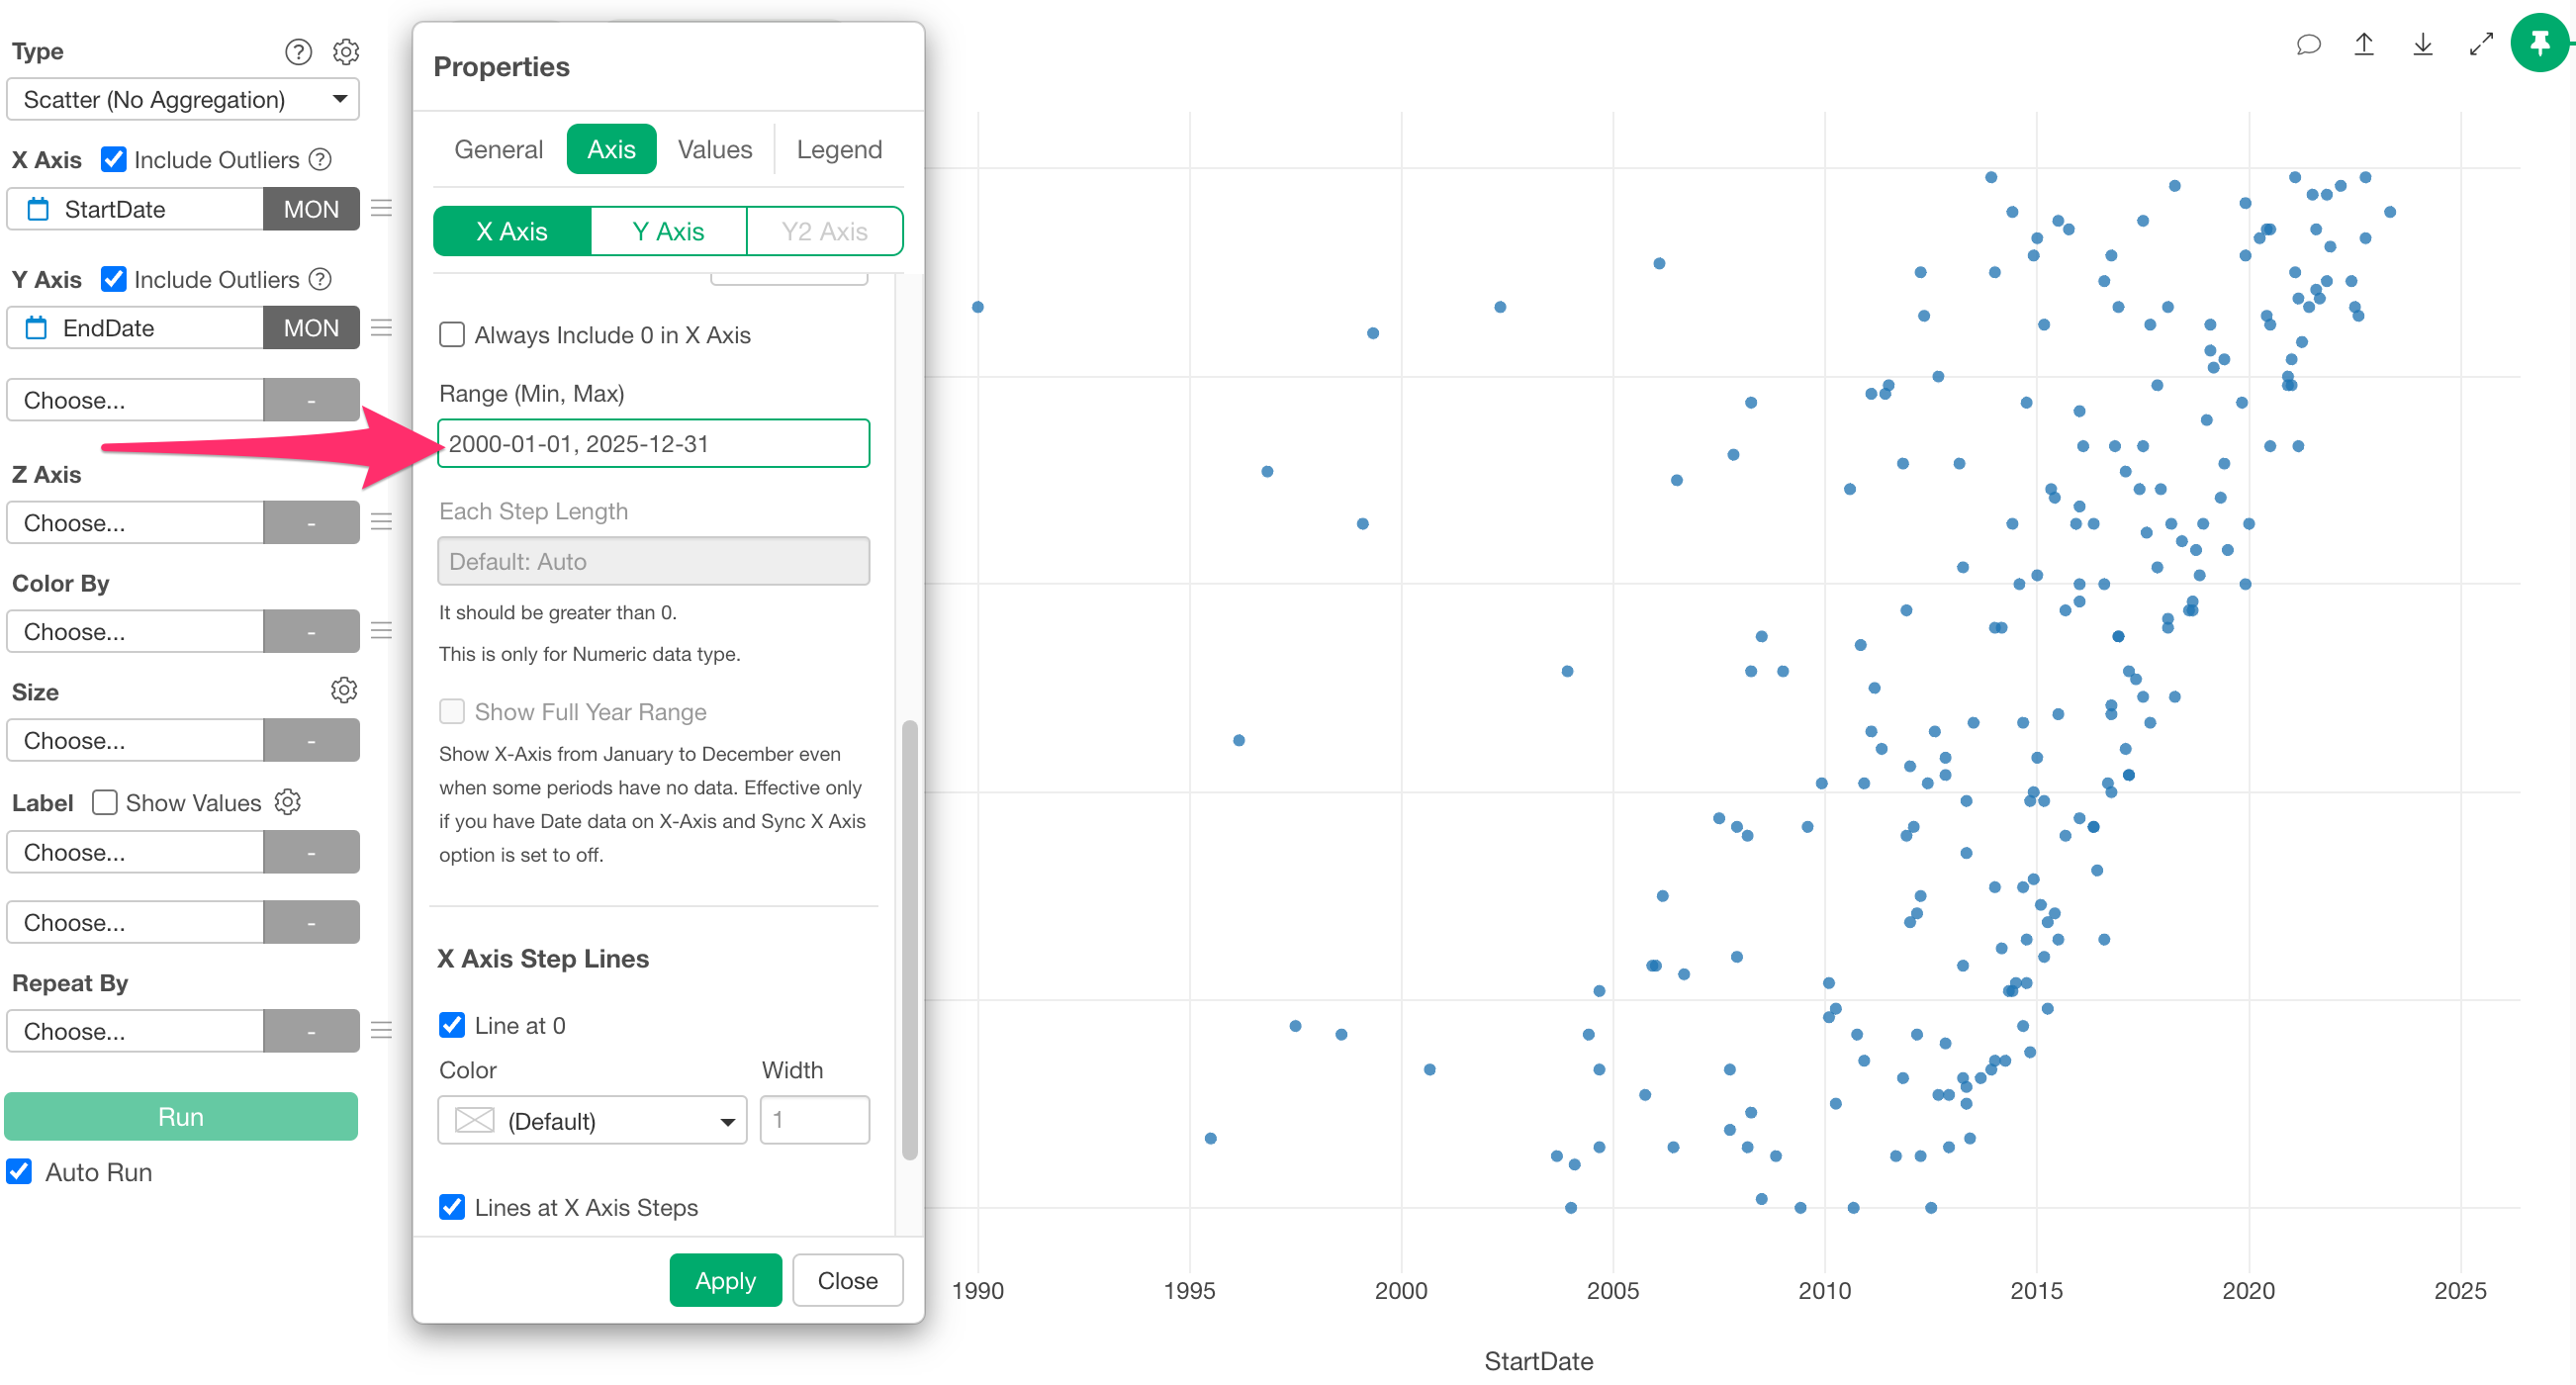
In the Axis tab, the “Axis Range” field will be displayed. Enter the
date range separated by a comma and apply it. (Example:
2000-01-01, 2025-12-31)
The X-axis range will then be set according to the specified content.
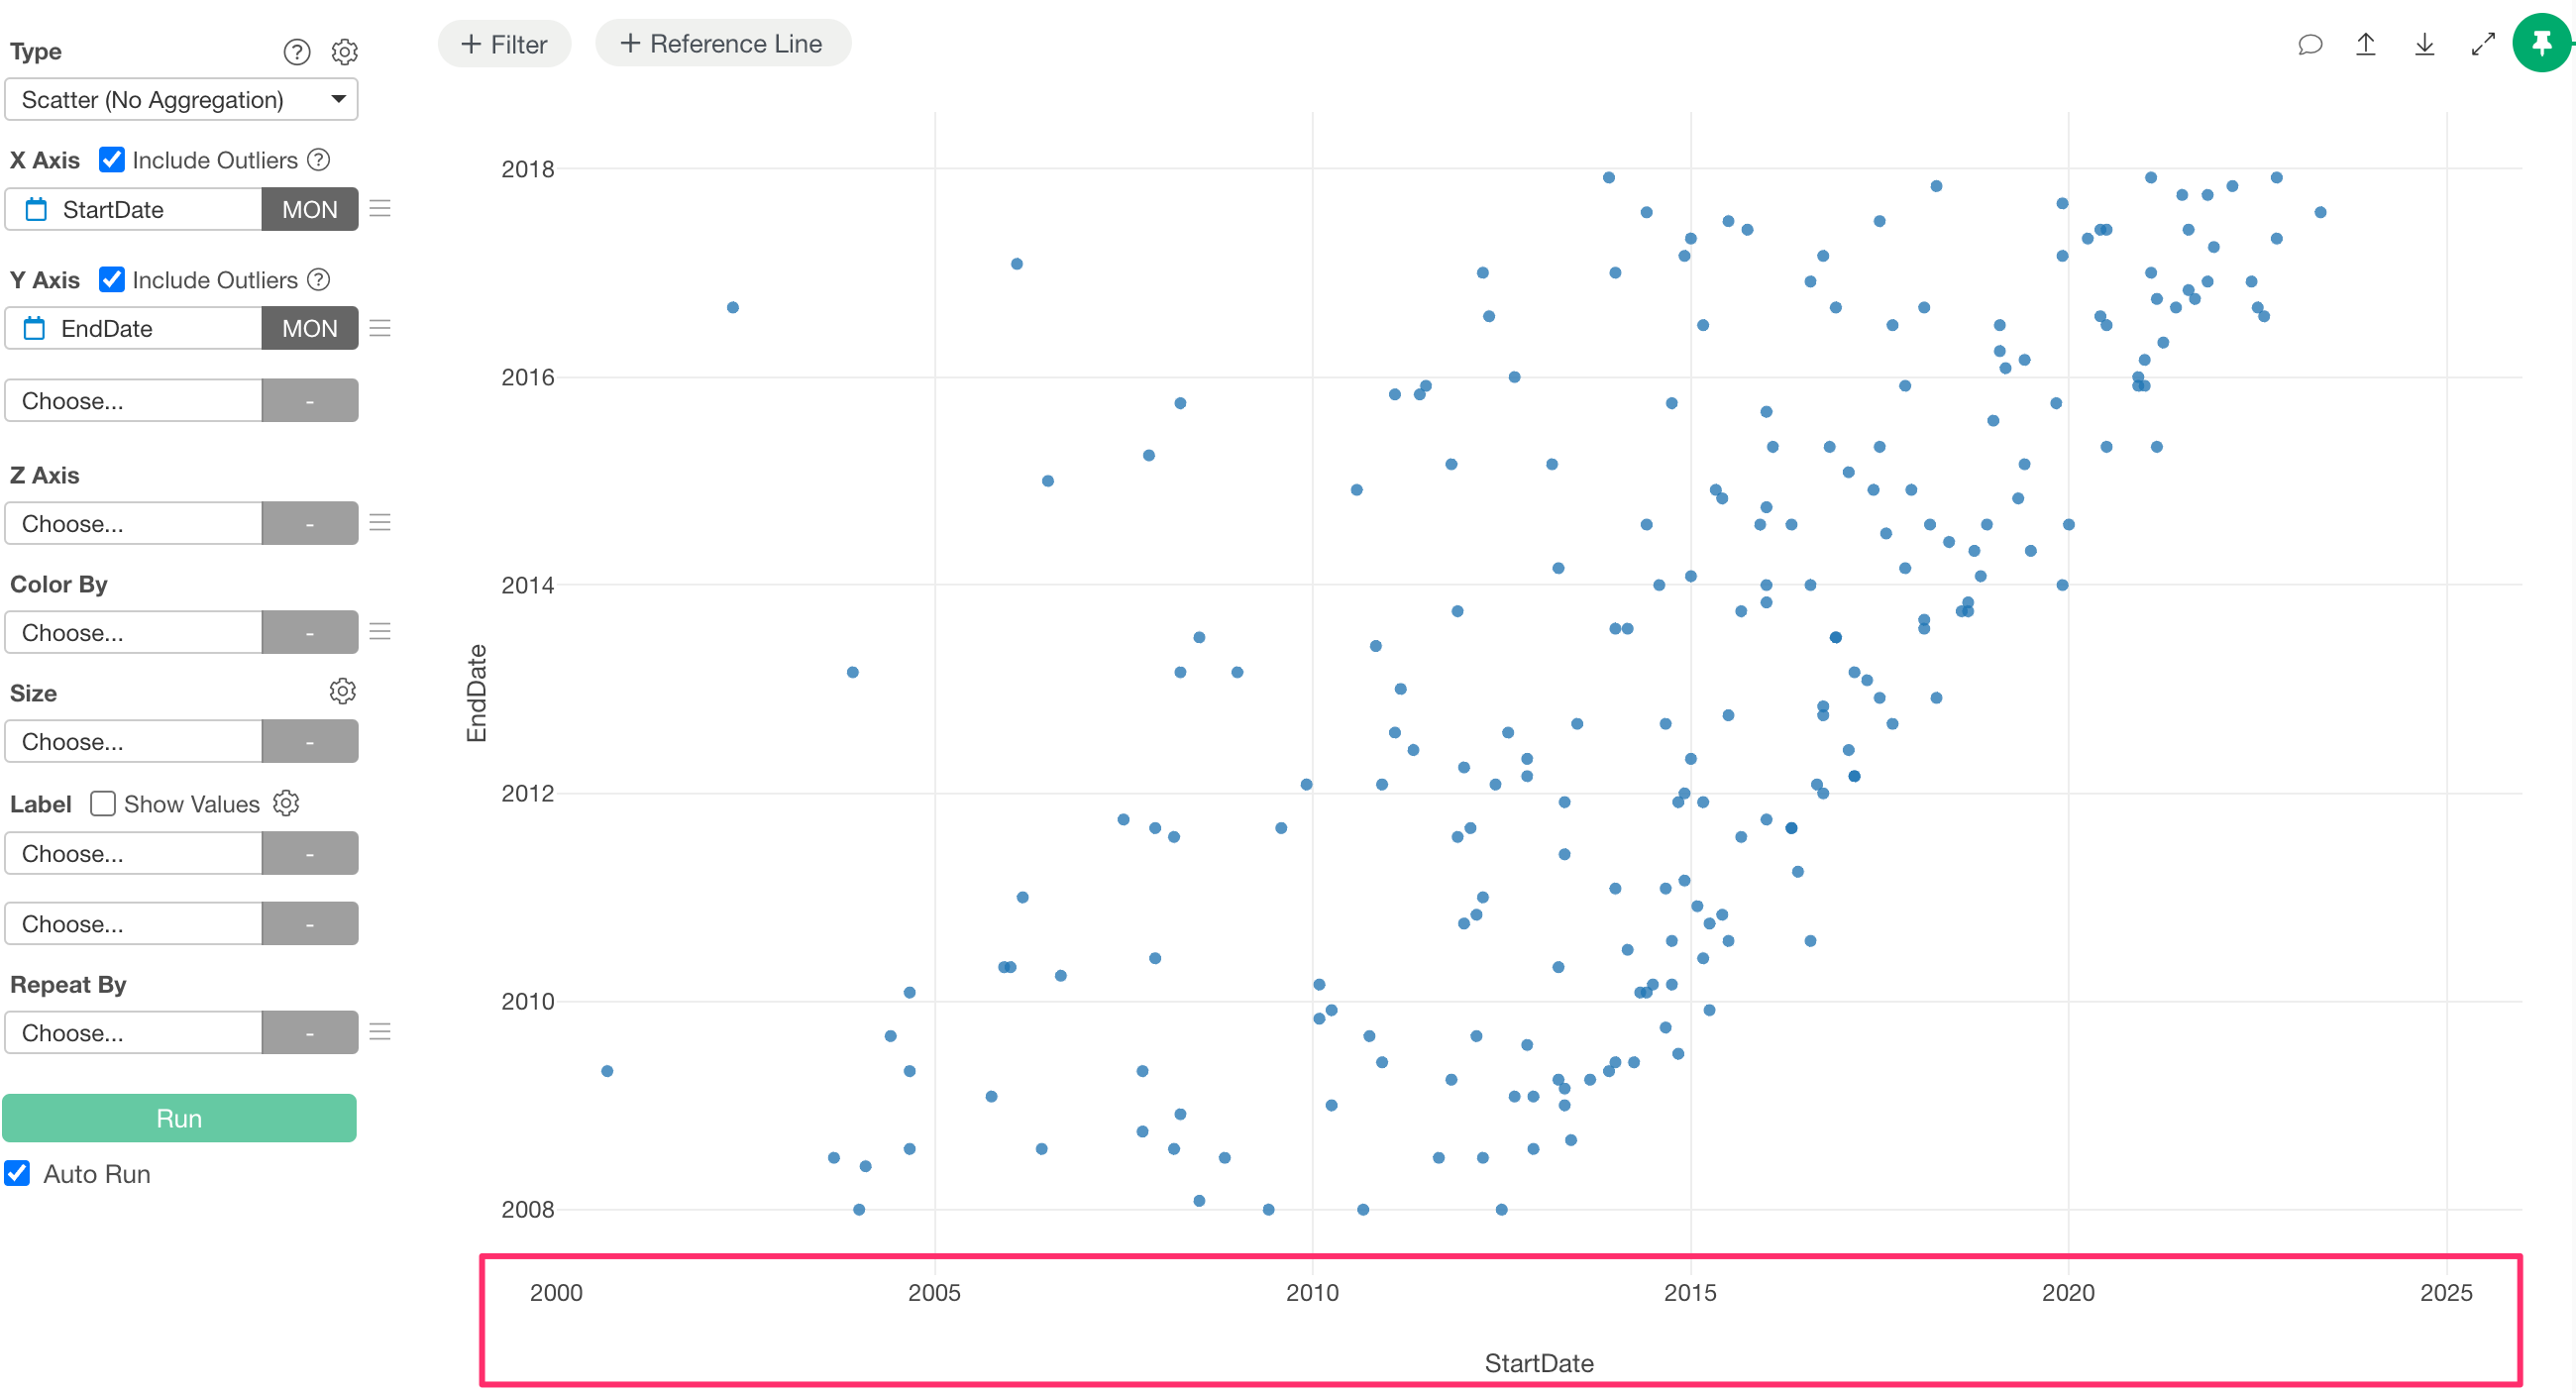
The entire entered period is rendered as the axis, and even if there are dates within that period that have no data, it will not affect the display of the axis.