How to Aggregate (Summarize) with Conditions
In Chart, you can summarize data conditionally, which means you can create your own conditions for the data to be summarized. This is similar to 'SUMIF' function, except that there are many various types of functions that are embedded inside the chart so it's easy to use!
Here's a quick how-to video!
Step by Step Instruction

1. Create a Summarize Table
First, let's create a simple summarize table the following setting to see the sales by region.
- Group by: Region
- Value: Sales (SUM)

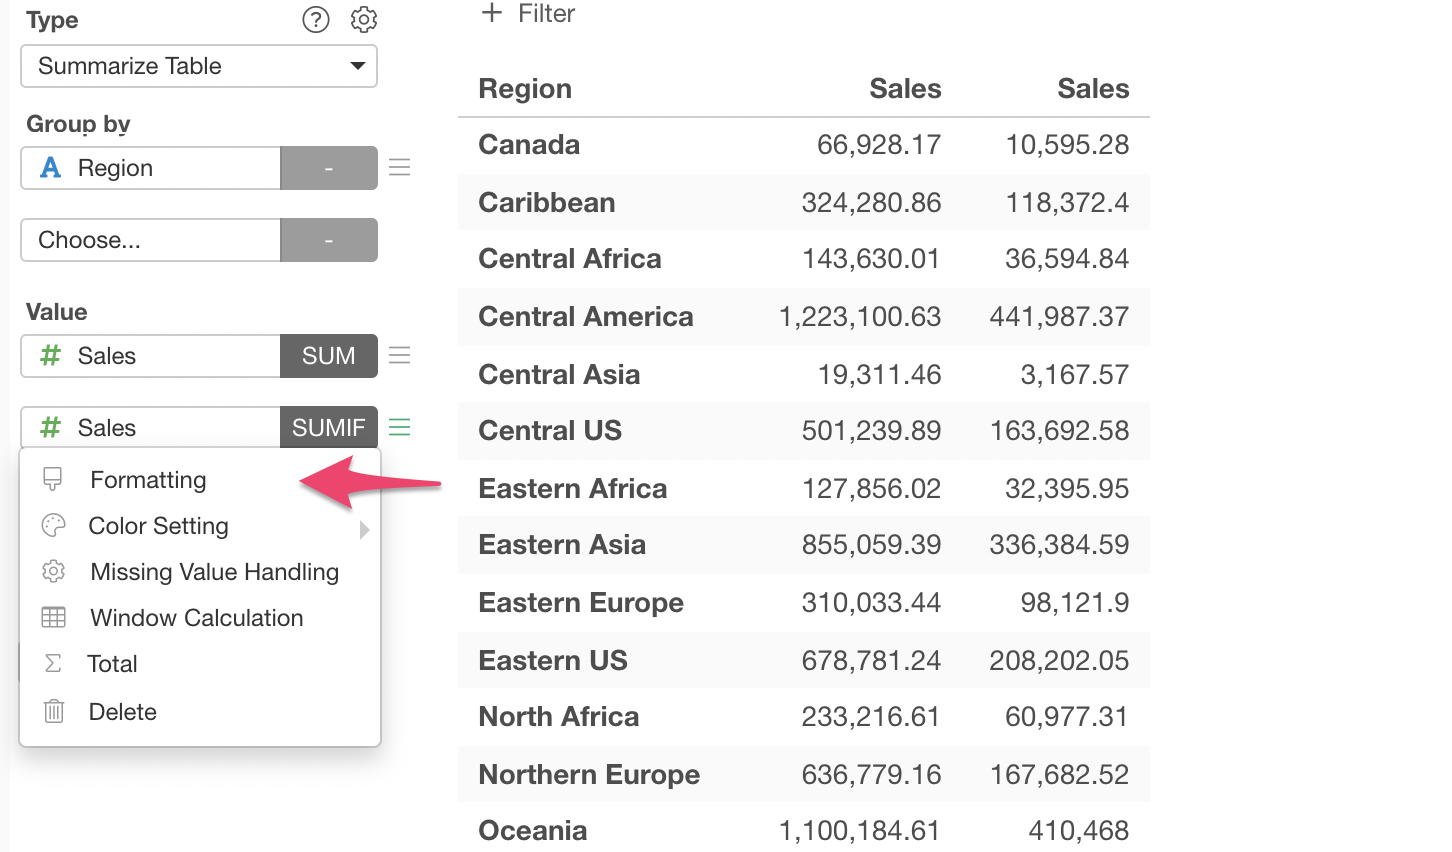
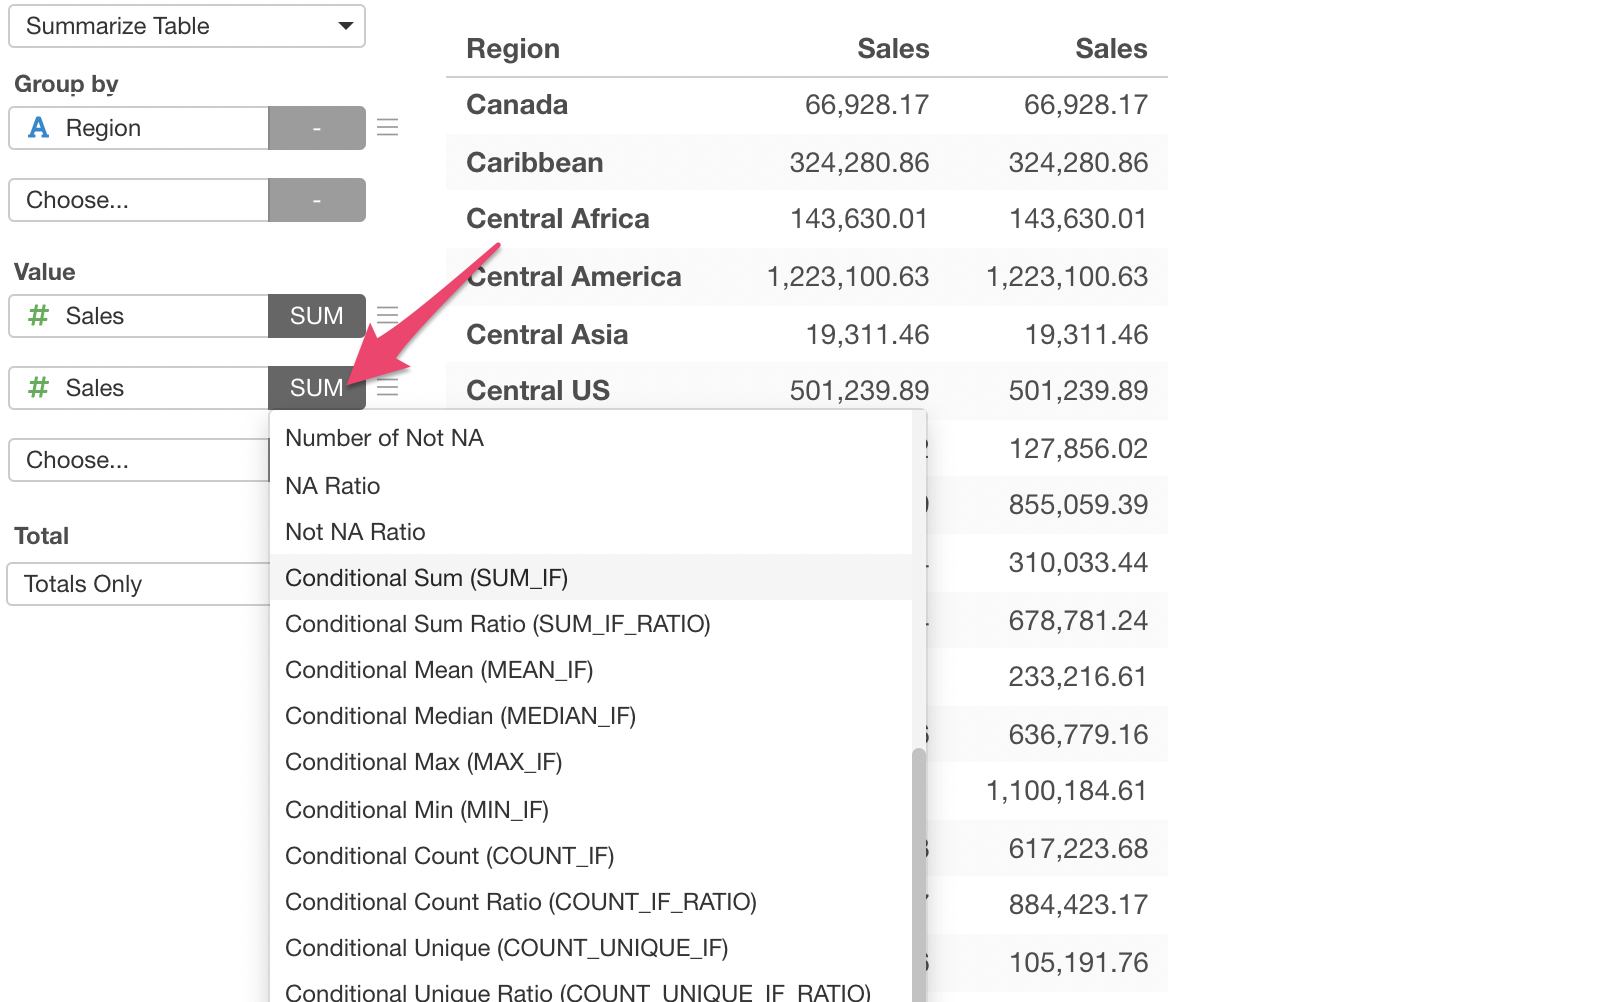
2. Use Conditional Summarize Functions
Now, let's say we want to add another column to summarize the total sales for 'Furniture' category by each region.
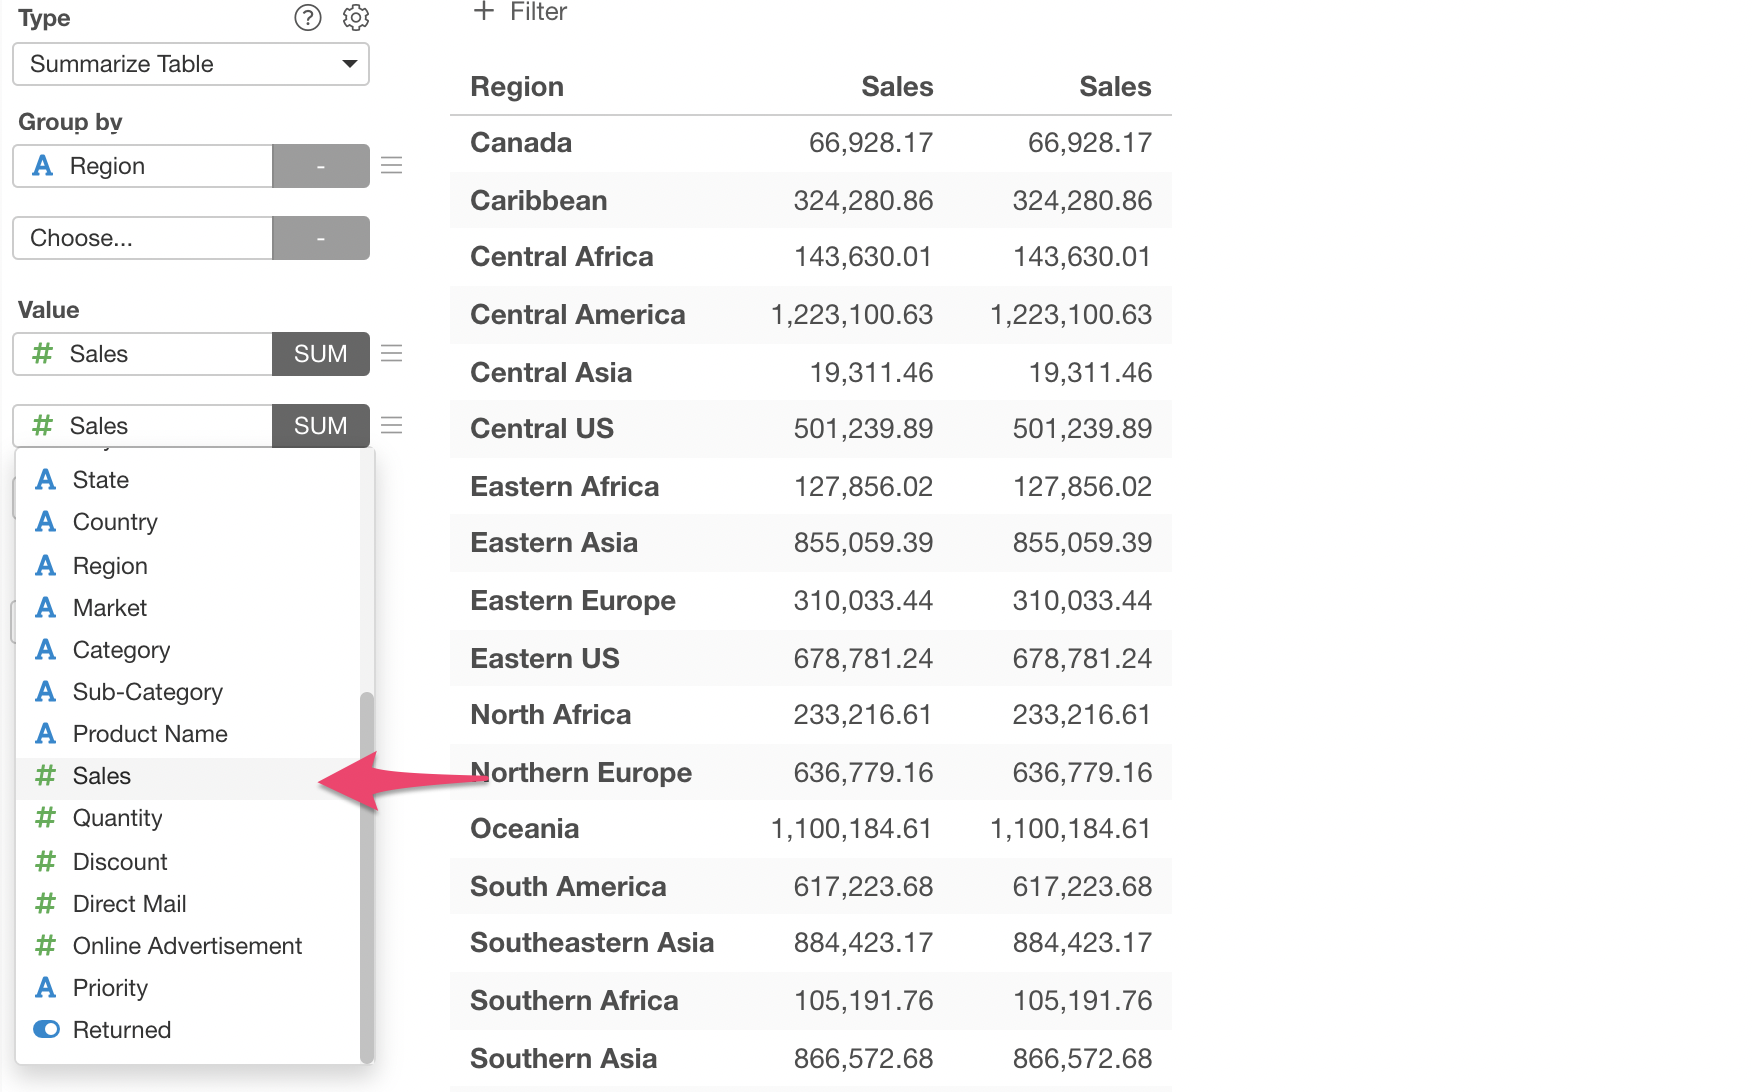
Add another Value column by selecting 'Sales' column.
Click the summarize function box and select 'Conditonal Sum (SUM_IF)' from the list.
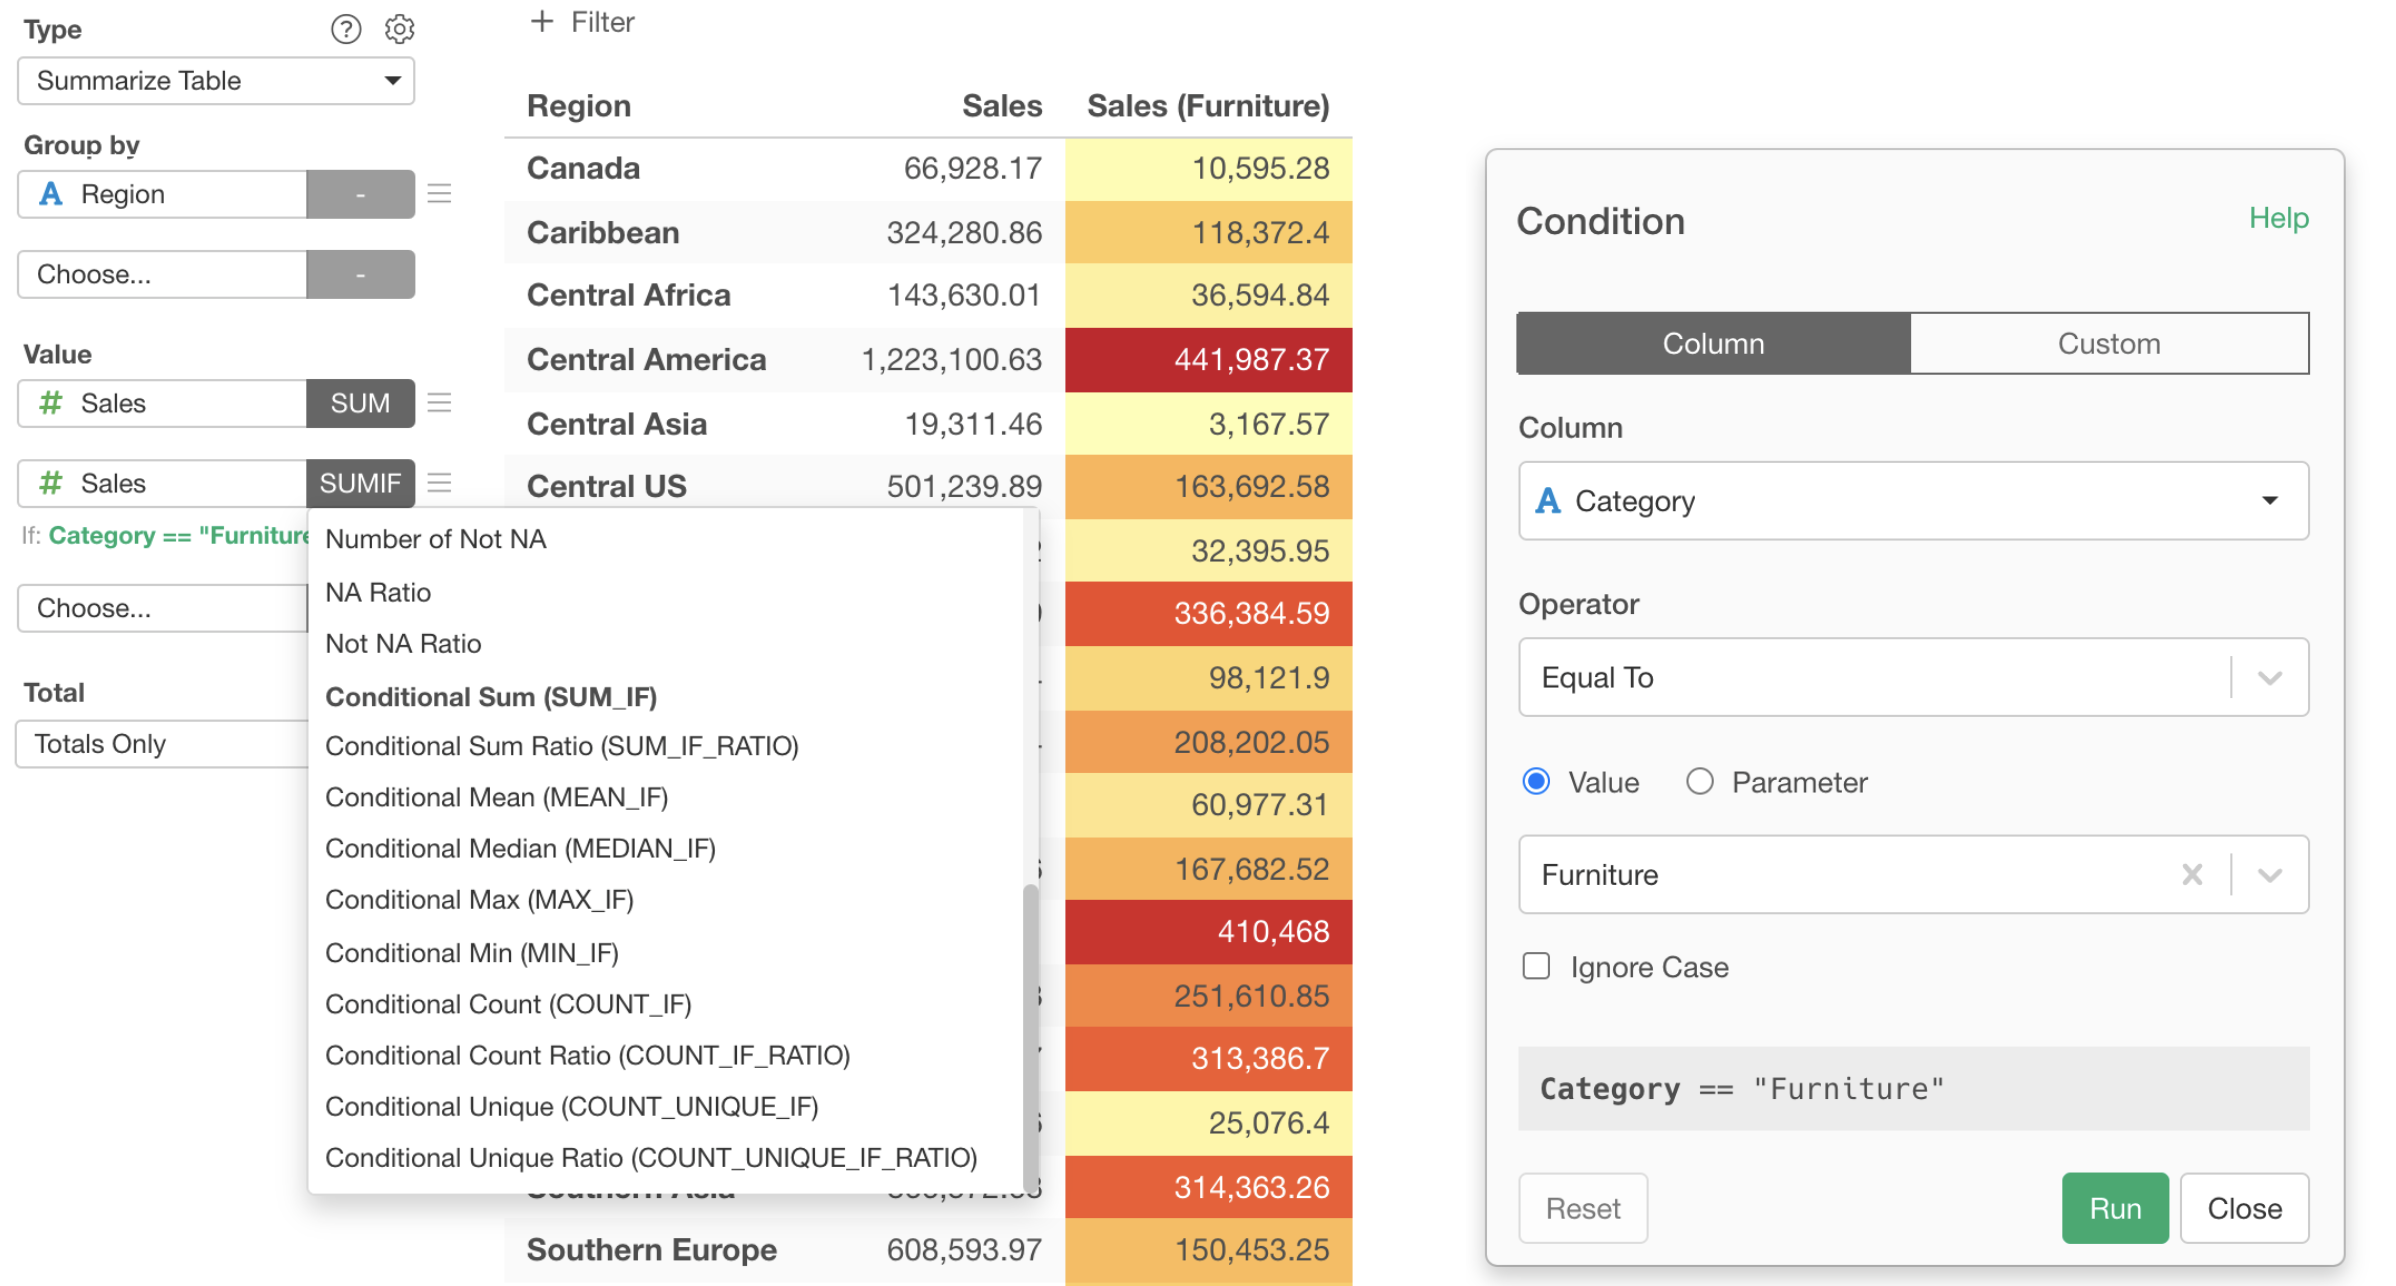
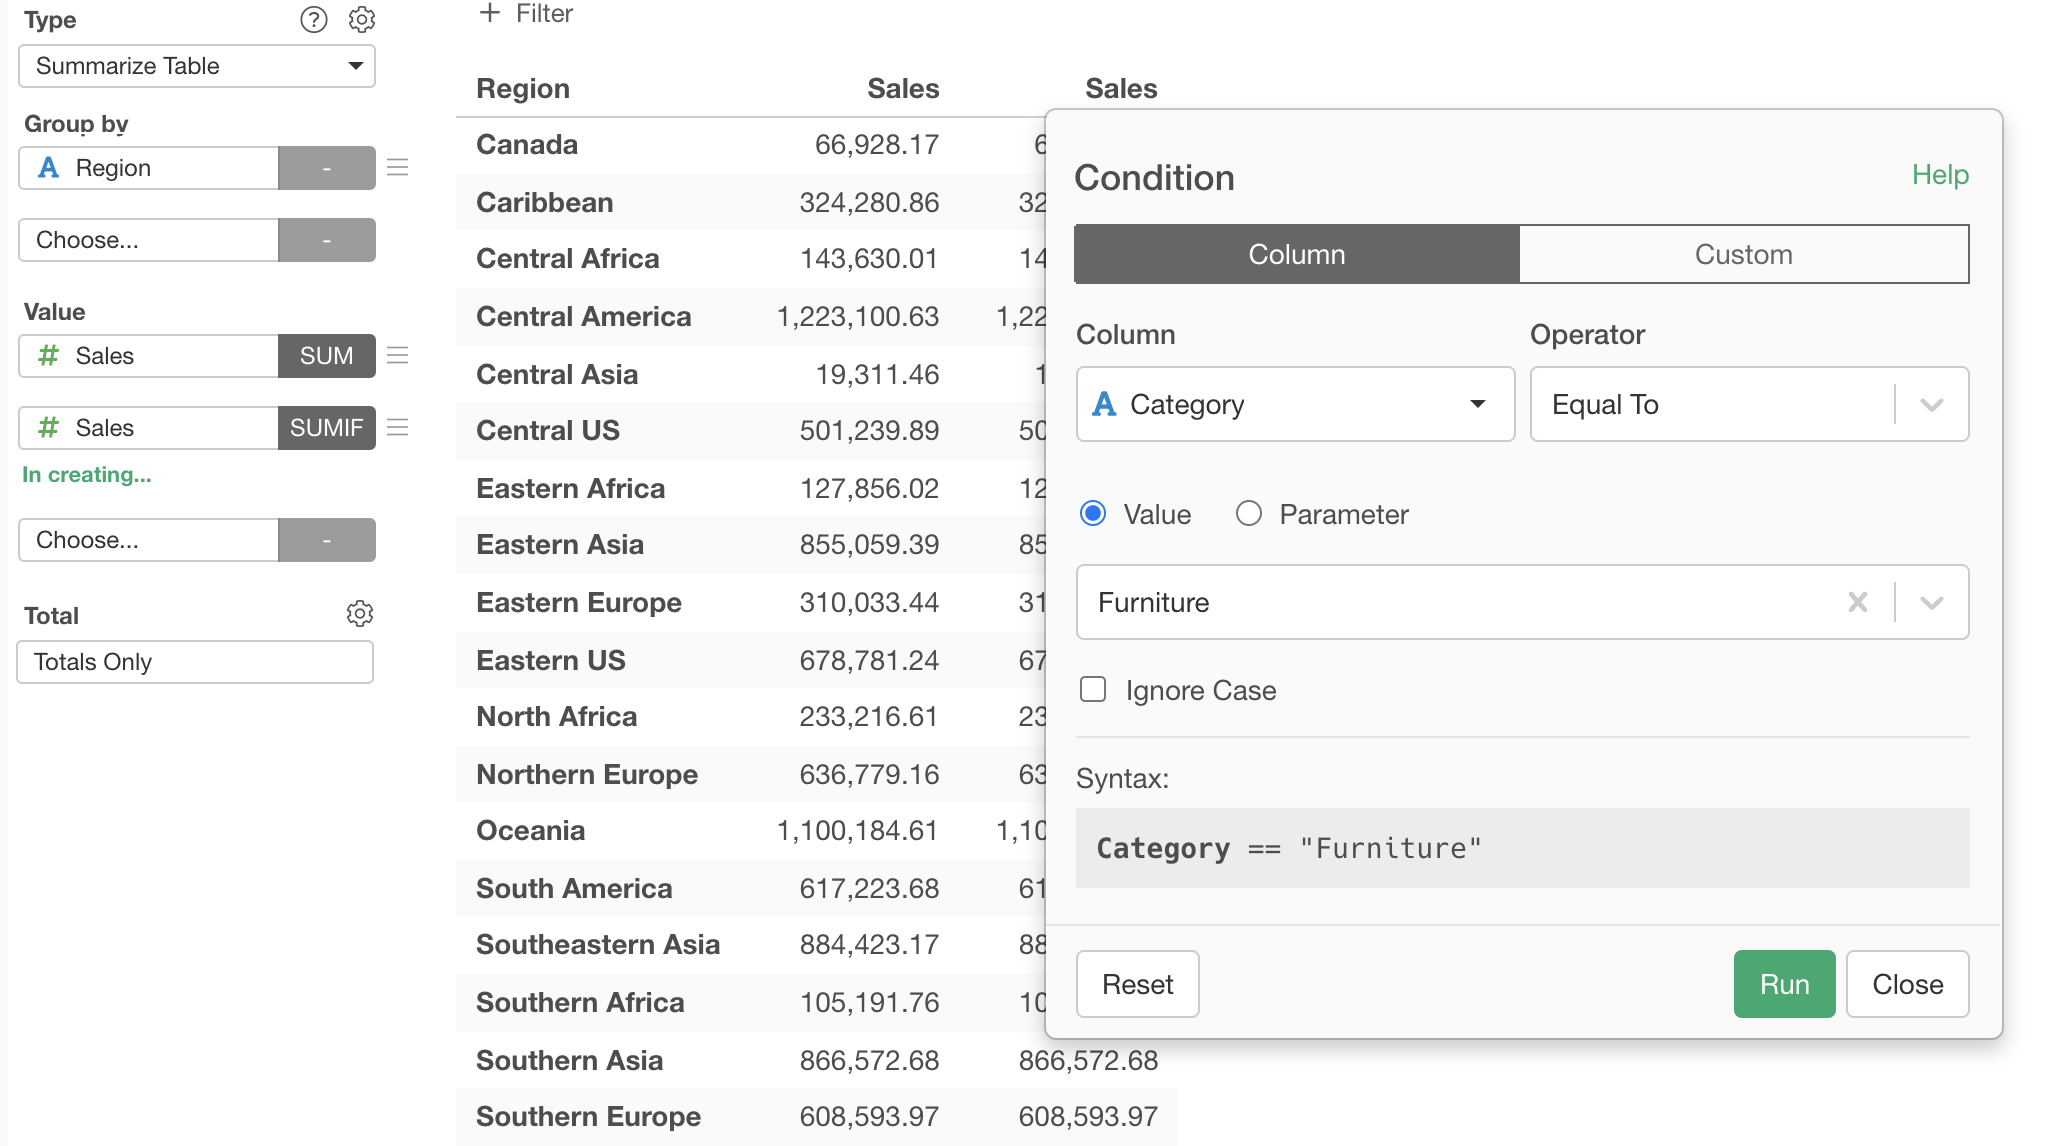
It will automatically open a dialog where you can setup the condition.
Select the following items.
- Column: Category
- Operator: Equal To
- Value: Furniture
And click Run button.
Now the second 'Sales' column is showing the sum of Furniture sales.
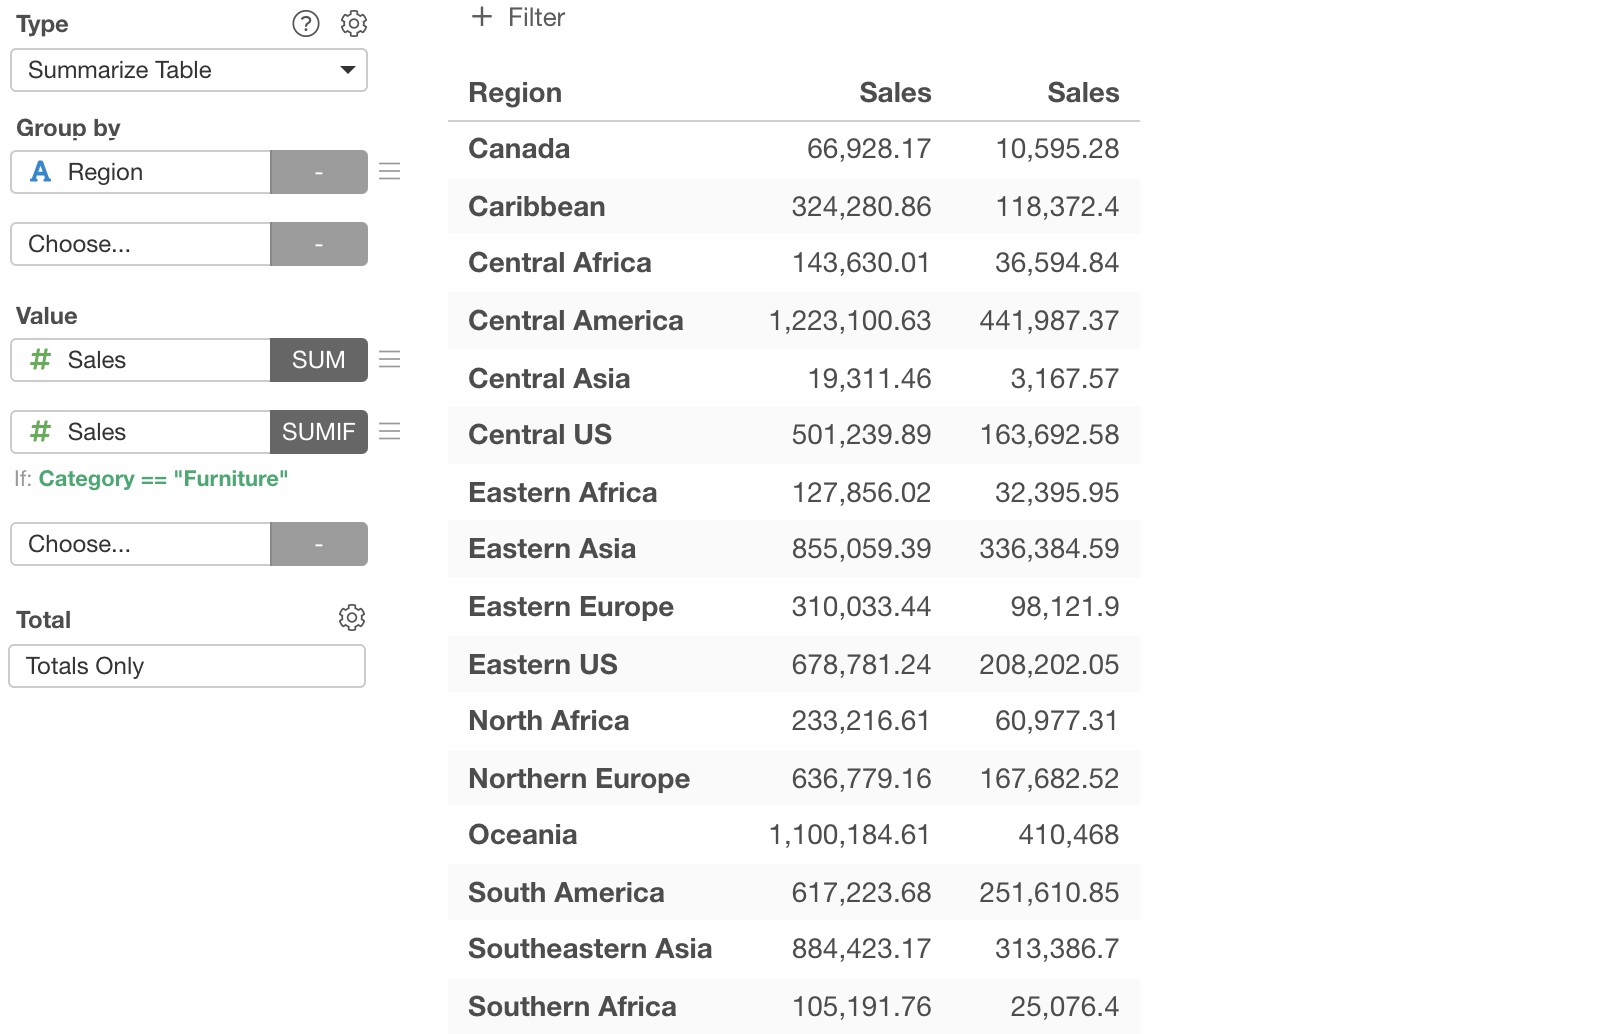
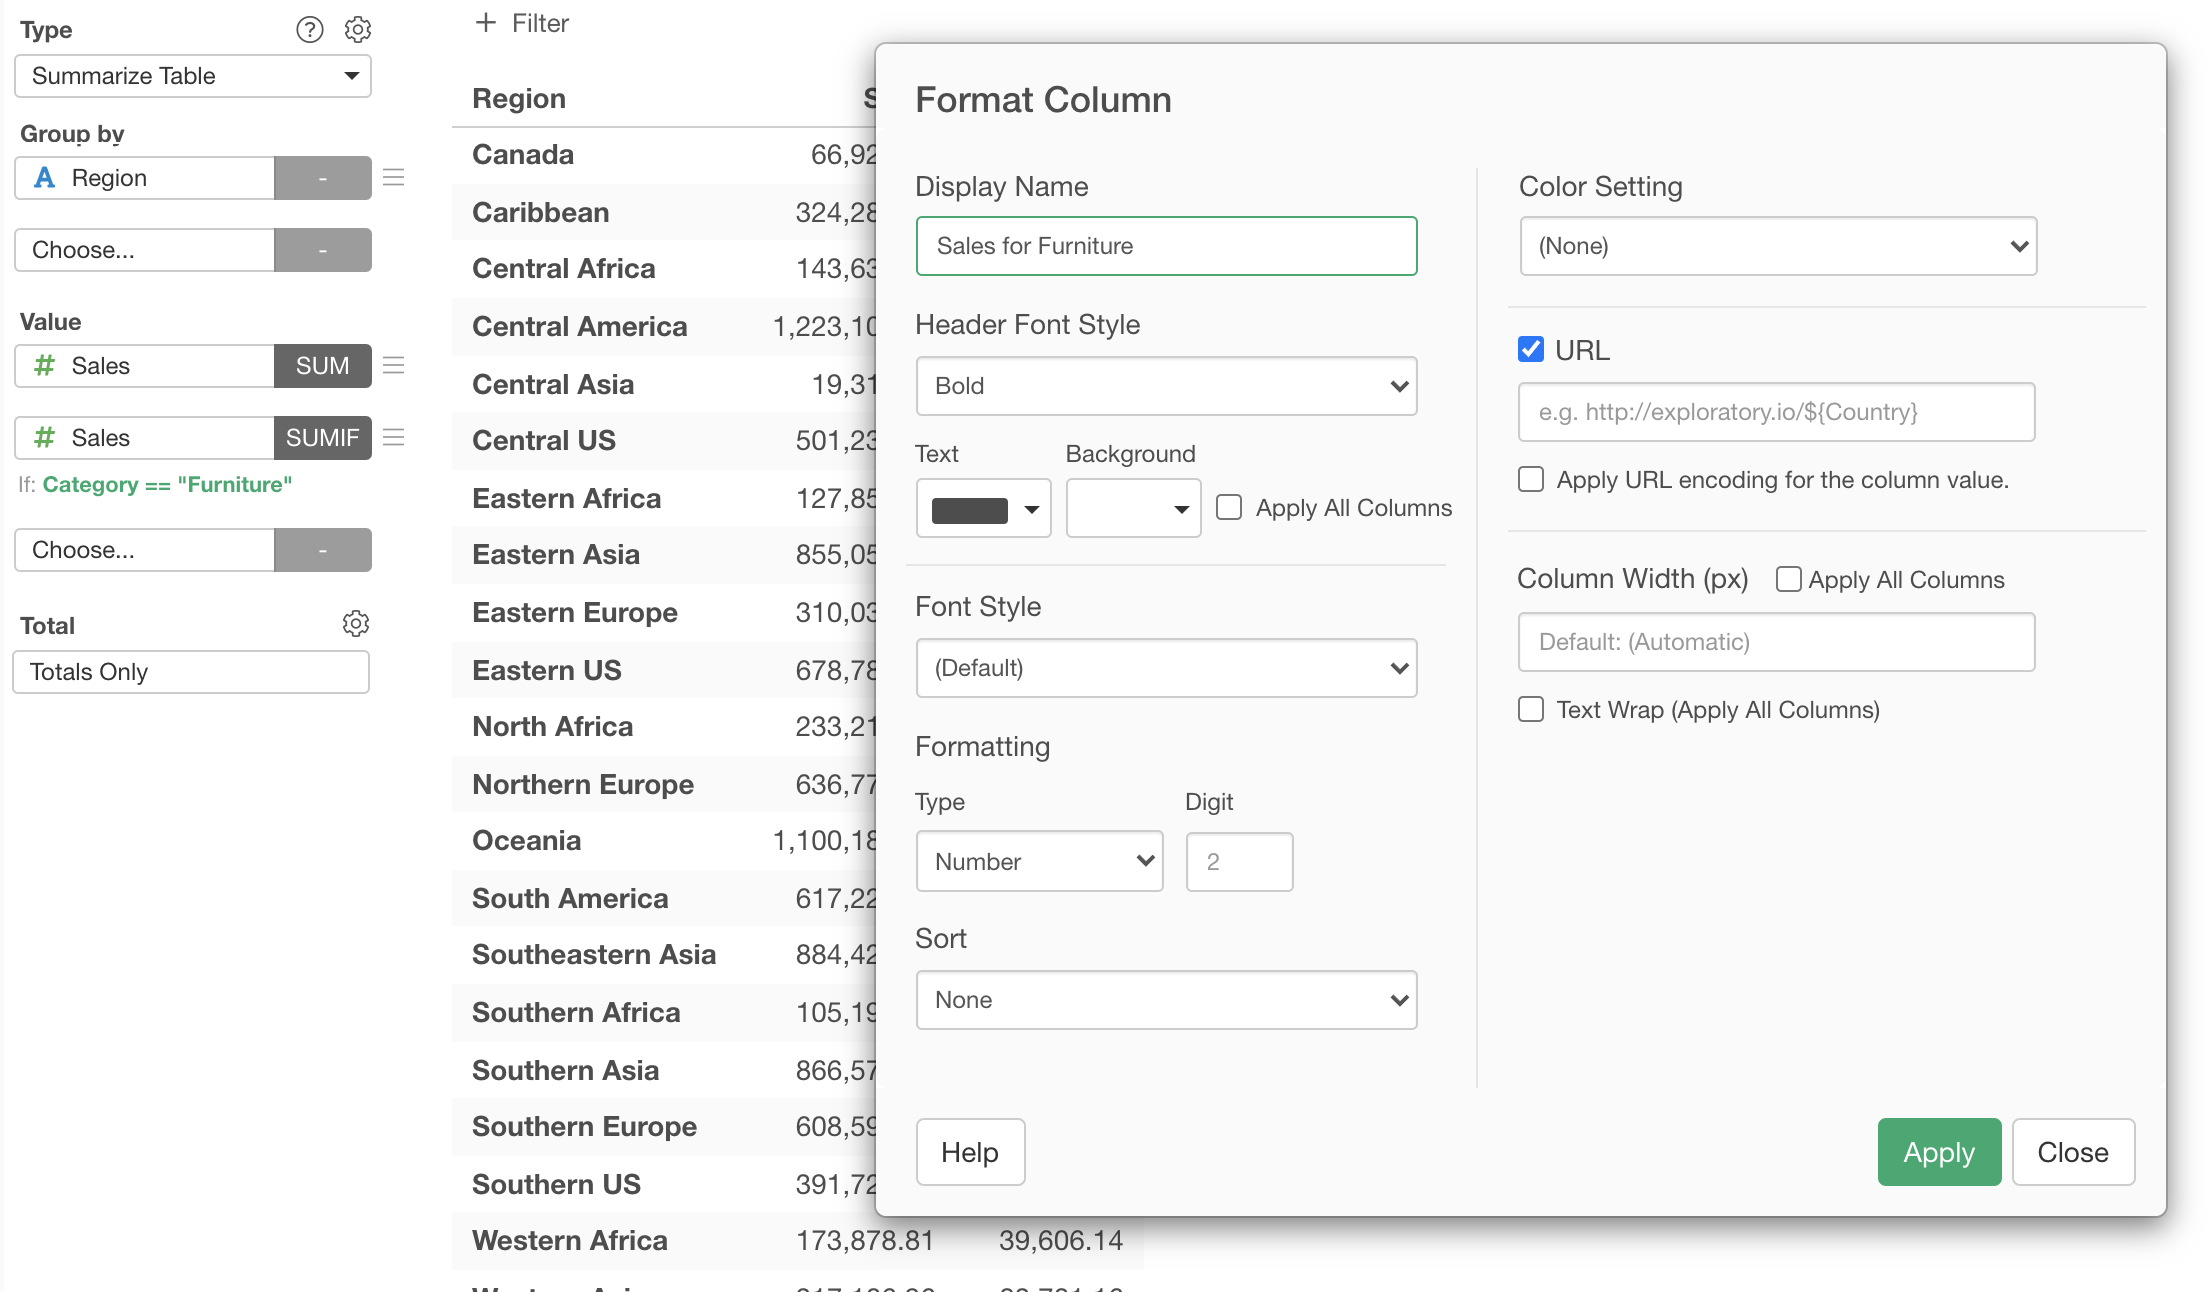
If you want to change the column name you can do so from the 'Format' menu.