How to Use Custom Calculations in Charts and Summarize Tables
In Exploratory, you can use Custom calculations to perform customized aggregations for the following cases:
Charts that Perform Internal Aggregation
- Pivot Table – Values
- Summarize Table – Values
- Bar – Y Axis
- Line – Y Axis
- Area – Y Axis
- Pie / Donuts – Values
- Scatter (With Aggregation) – X Axis, Y Axis, Color, Size
- Error Bar – Y Axis
- Map – Standard – Color, Size
- Map – Extension – Color
- Map – Long/Lat – Color, Size
- Map – Heatmap – Color
- Heatmap – Color
- Contour – Color
- Number – Values
Summarize Dialog
This note explains how to use Custom calculations.
Using Custom Calculations in Charts
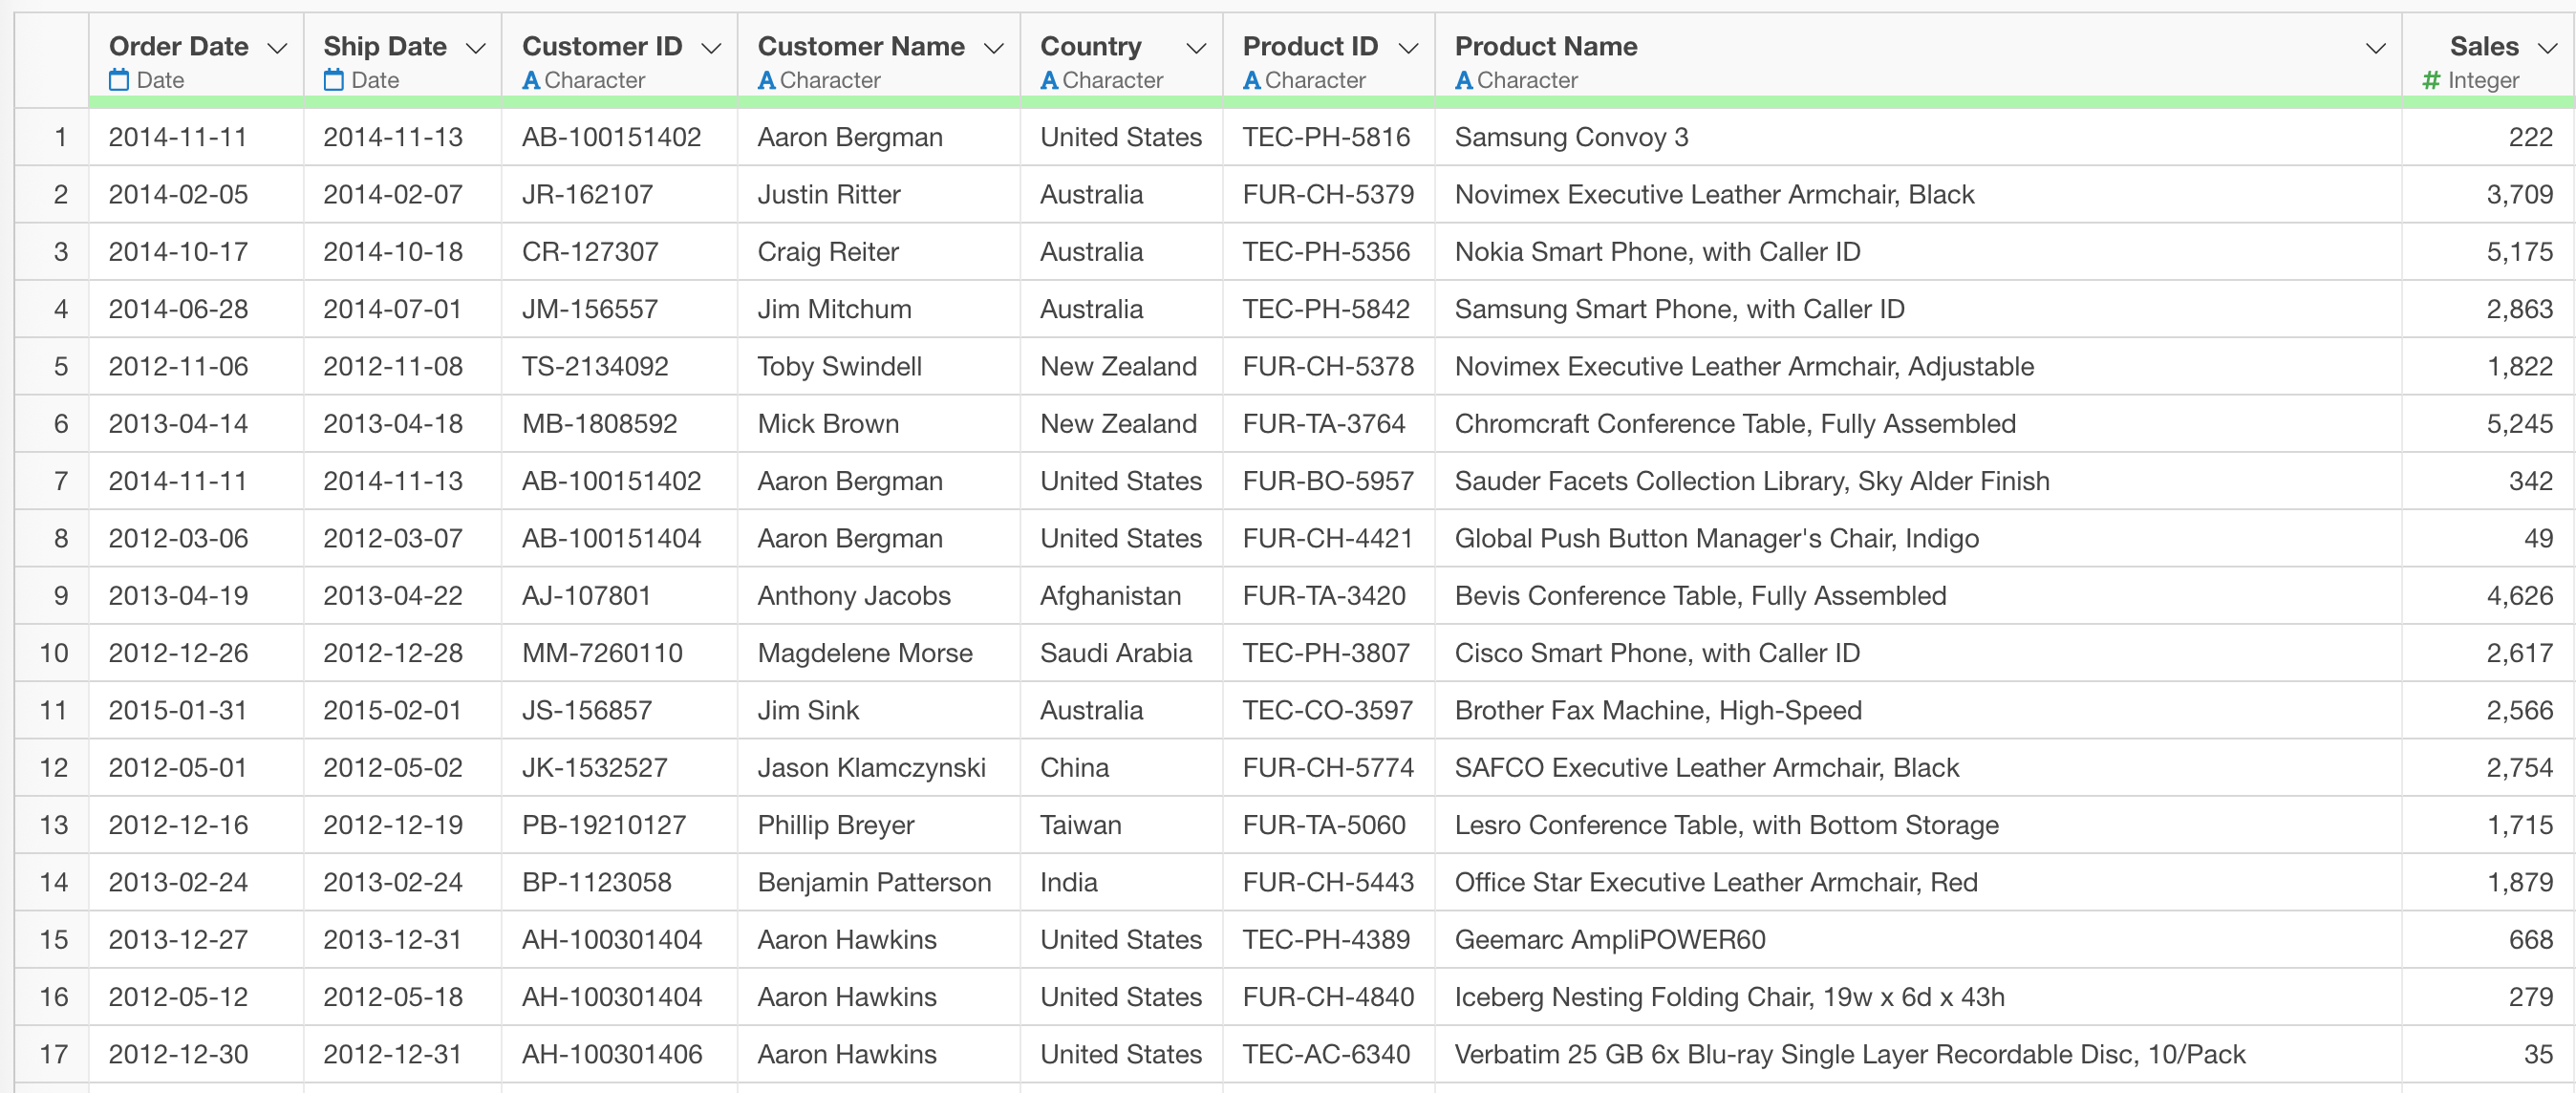
In this example, each row represents a single order detail, with columns containing the country of sale, sales amount, and other order information.
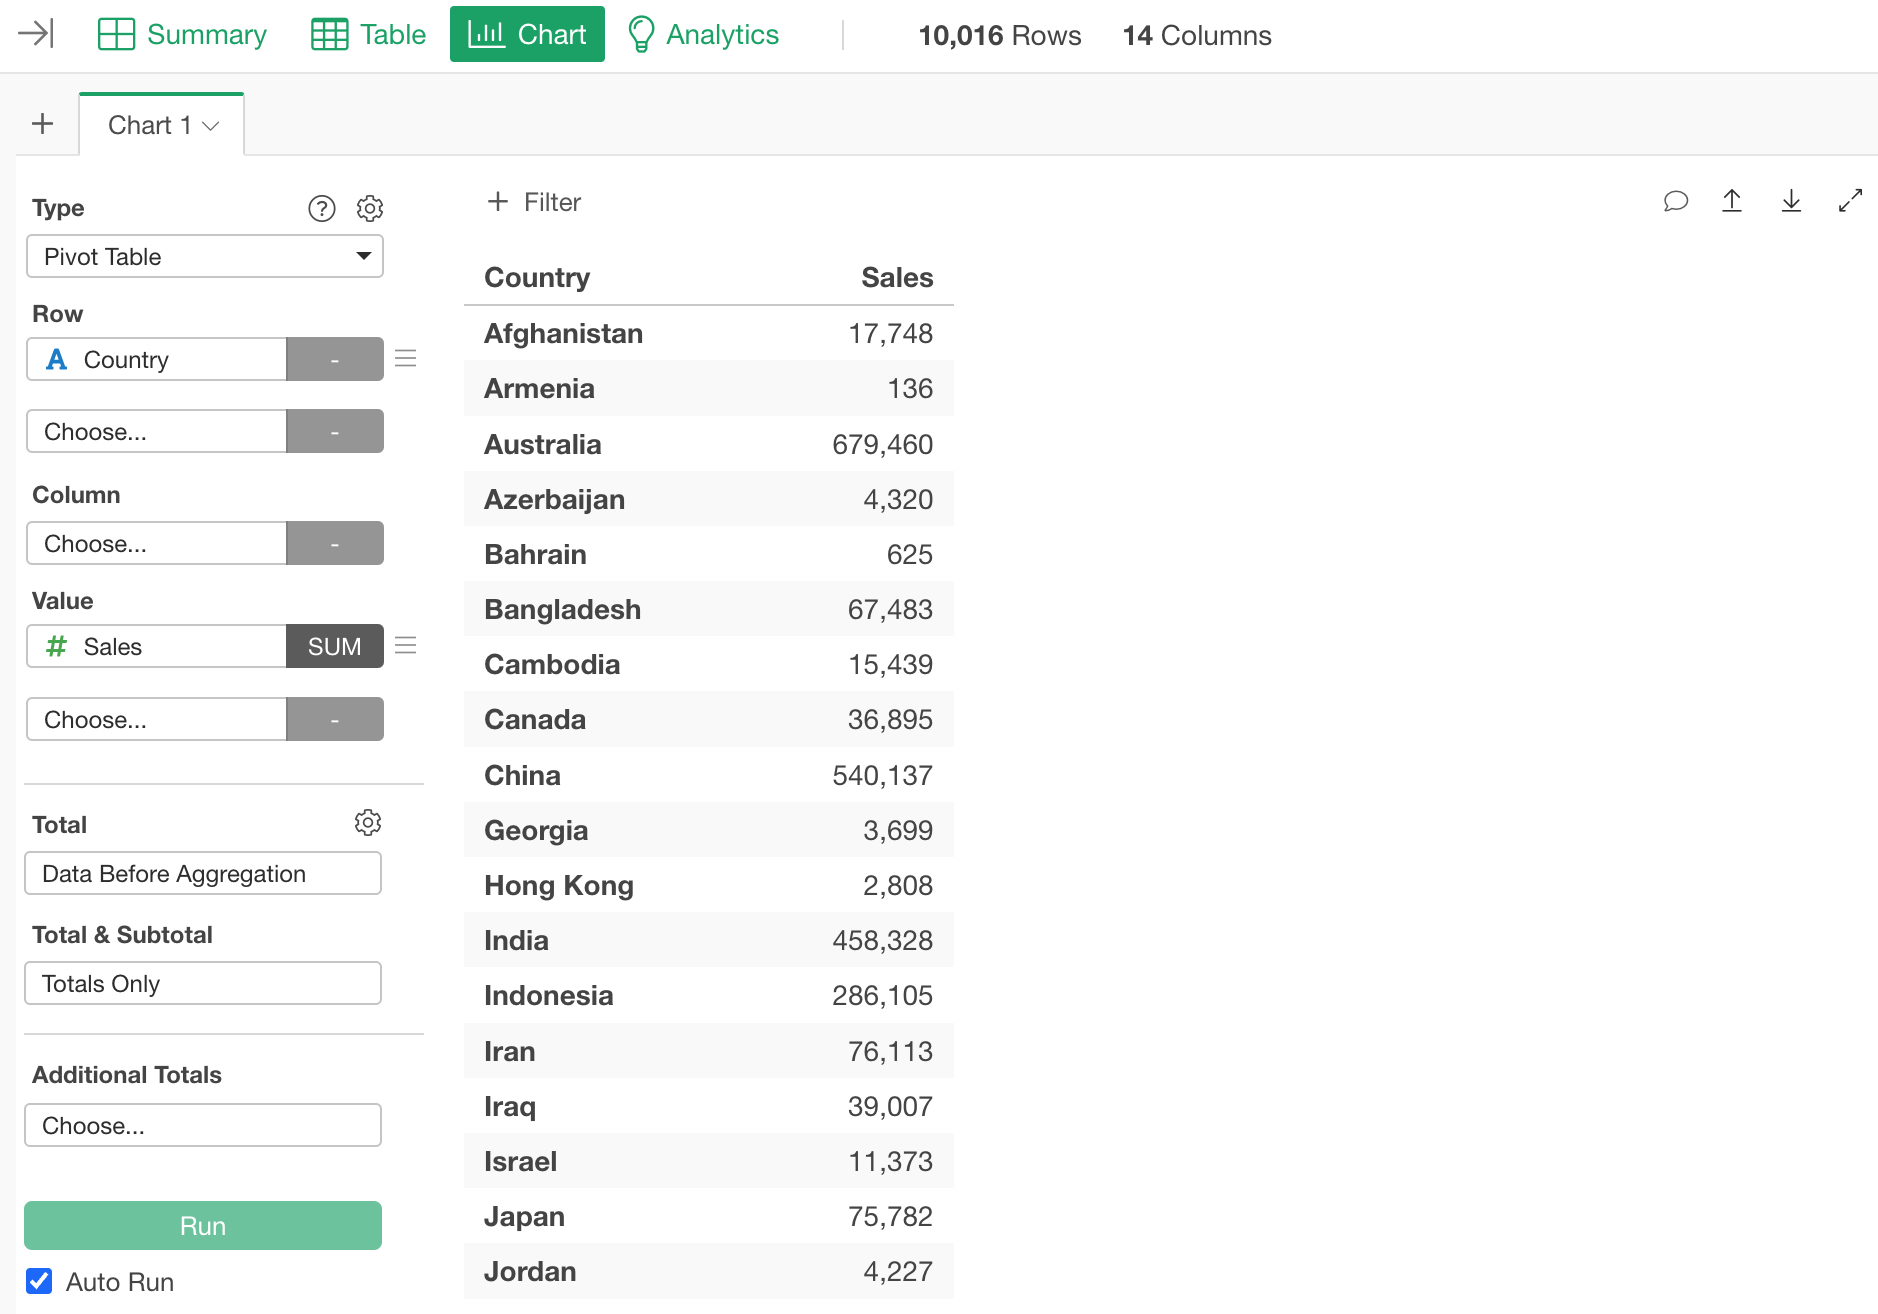
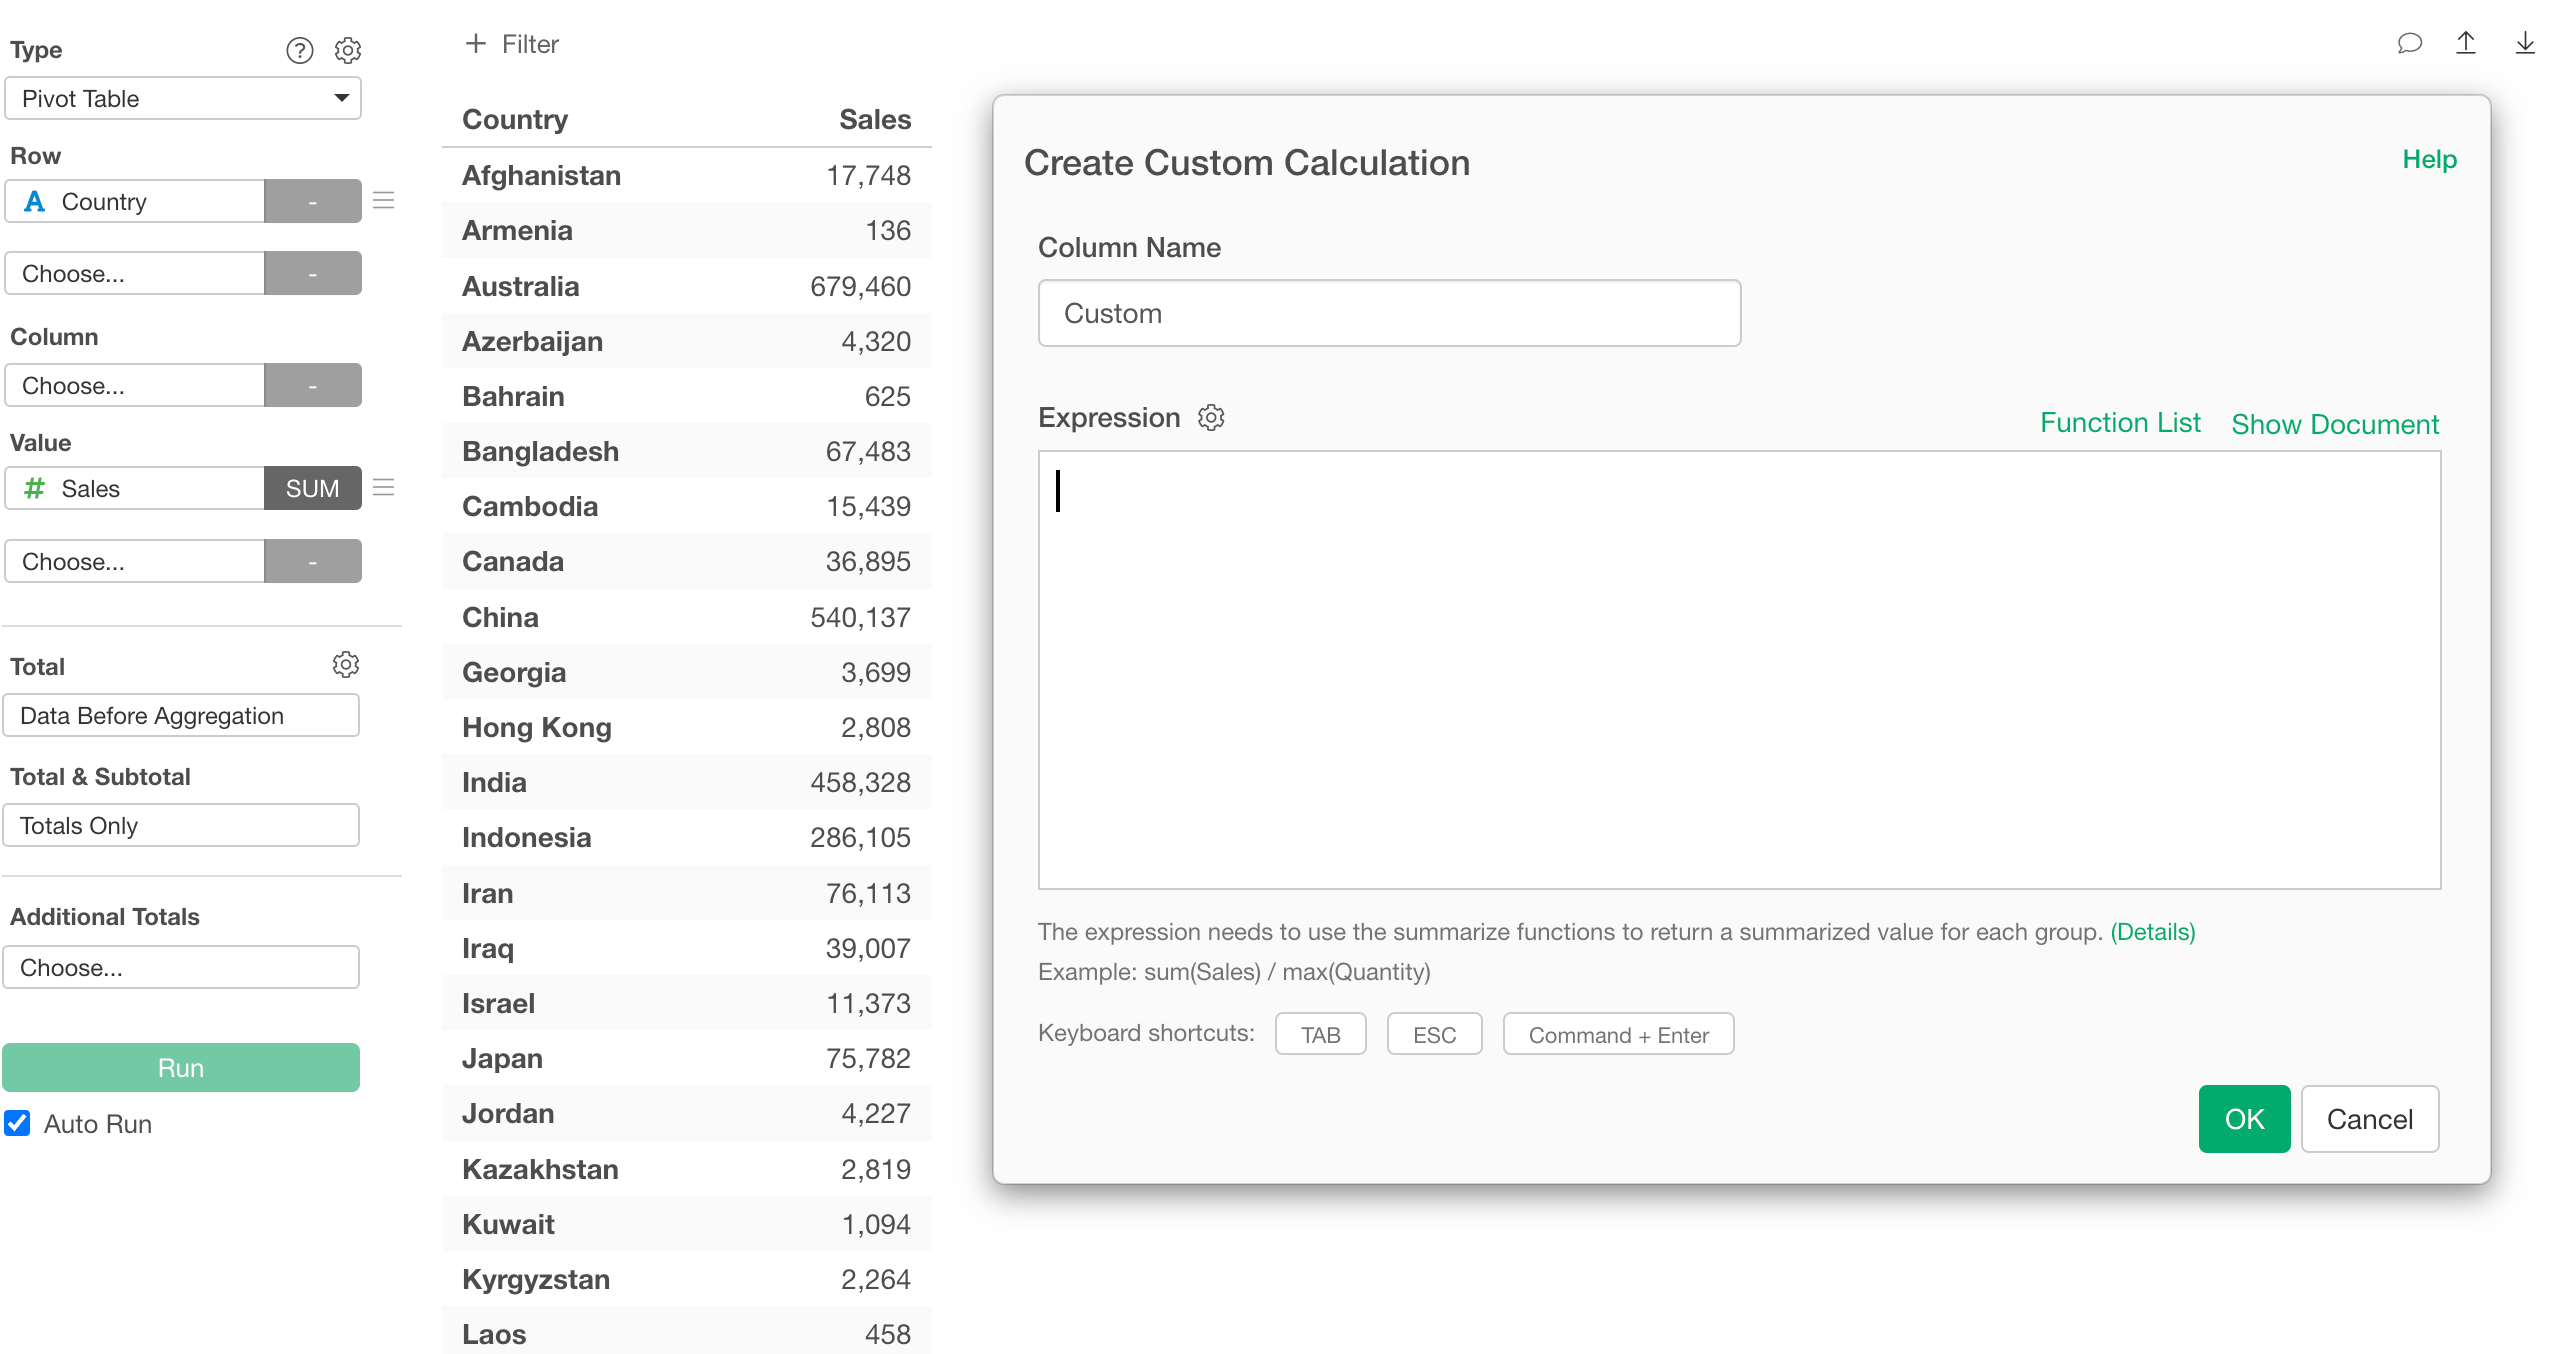
Using a pivot table, you can display the total sales amount for each country like this:
Since the aggregated sales values here include consumption tax, let’s say you want to show the total sales amount before tax is added.
By using a Custom calculation, you can perform this calculation directly in the chart without modifying the original data.
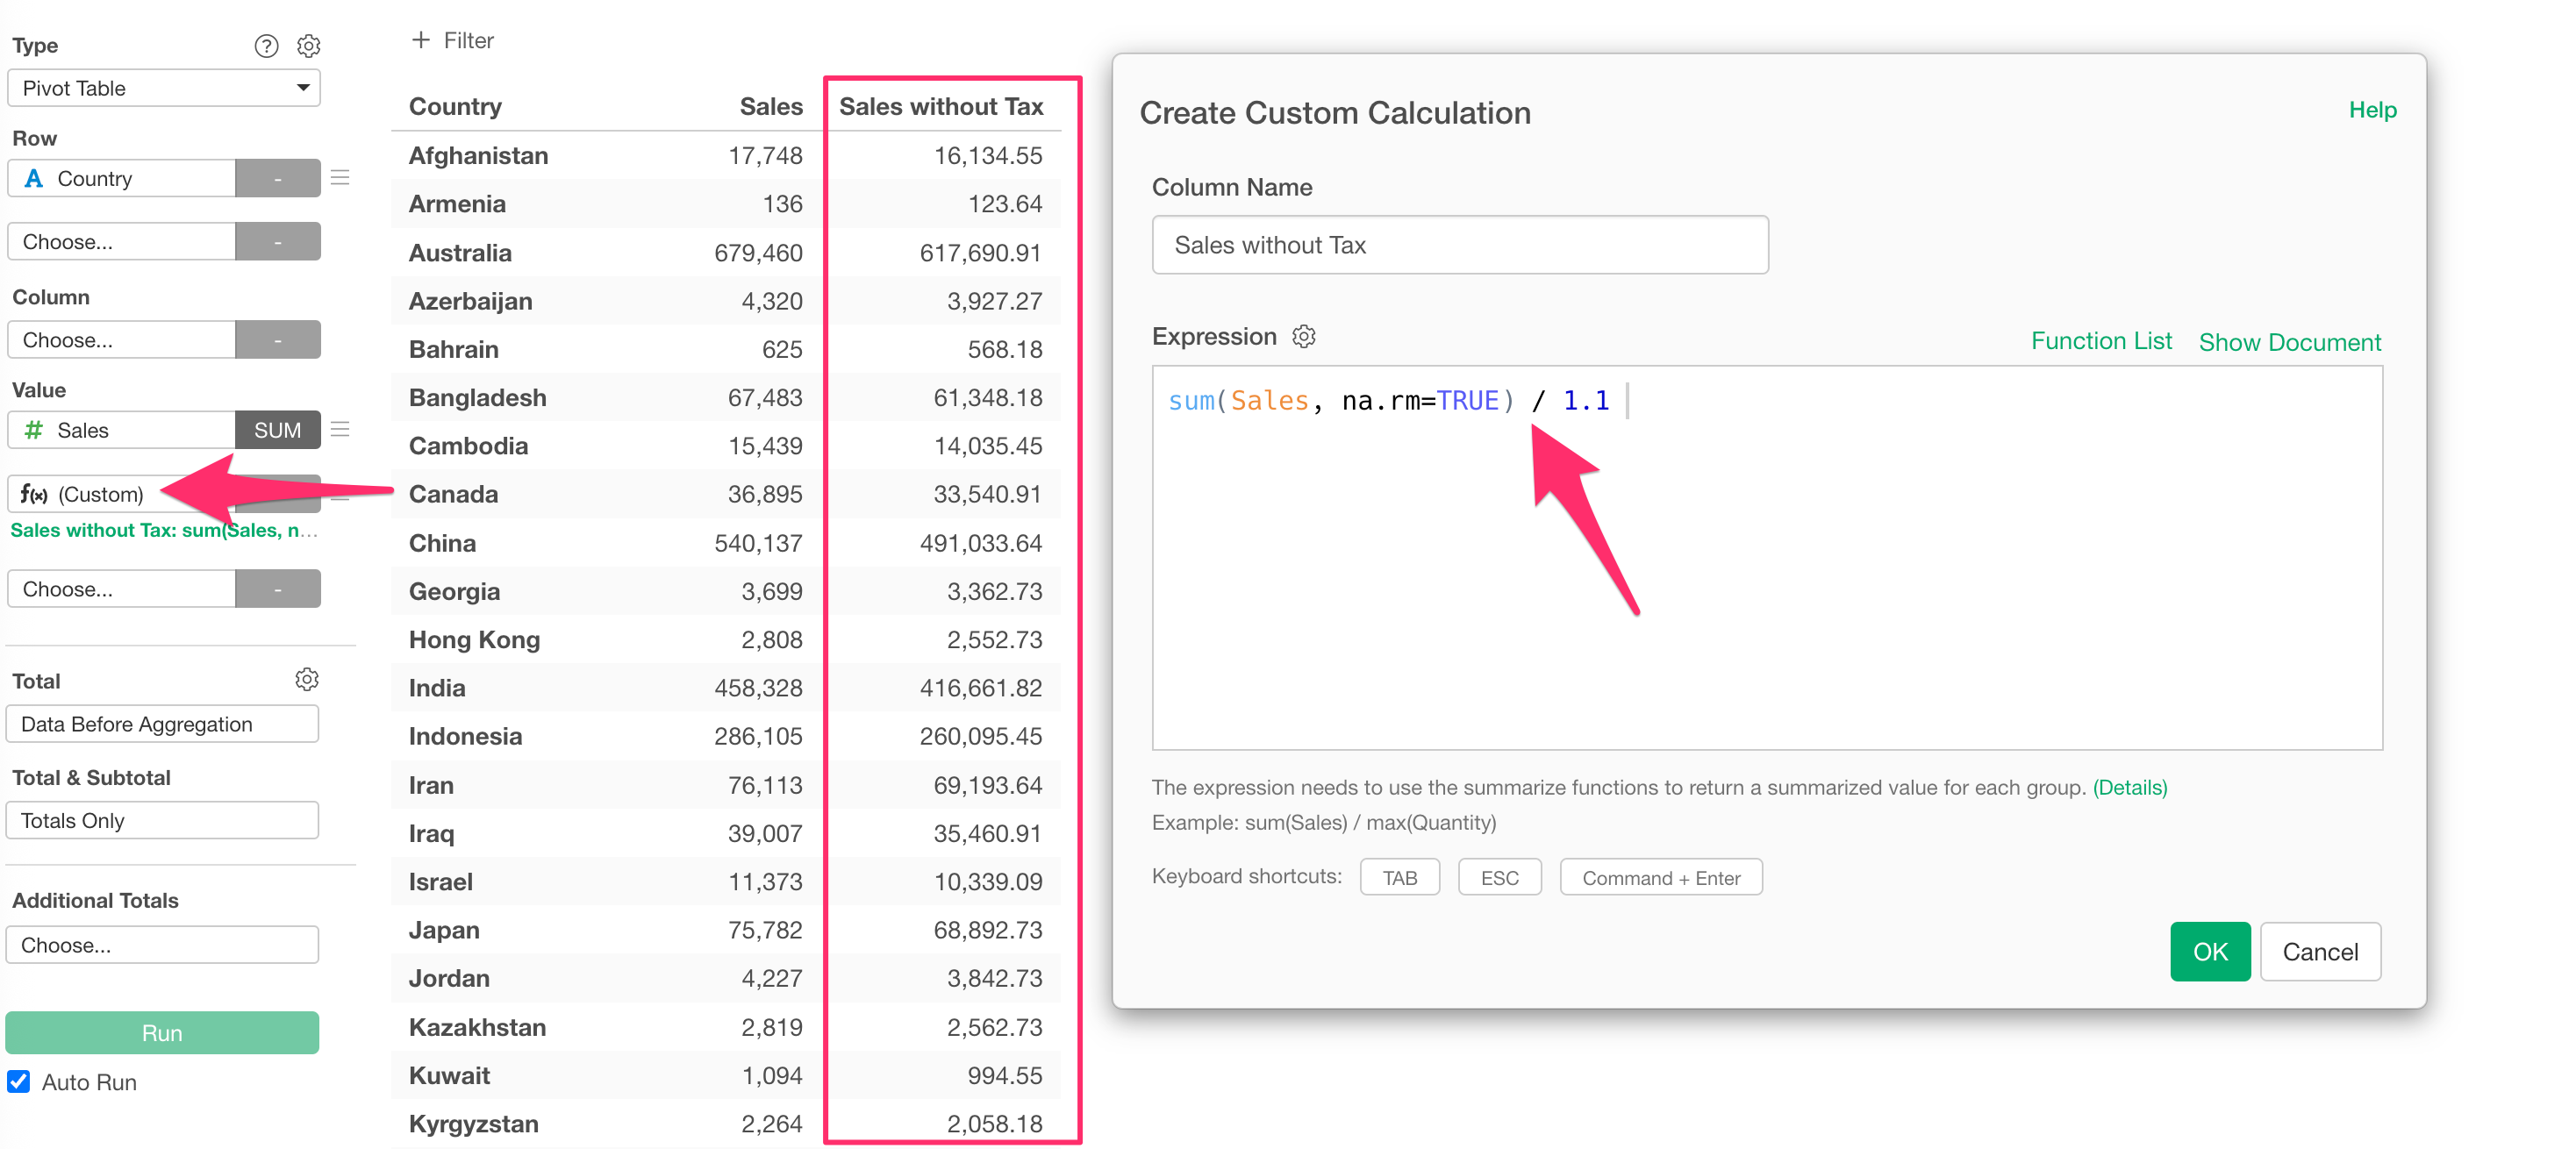
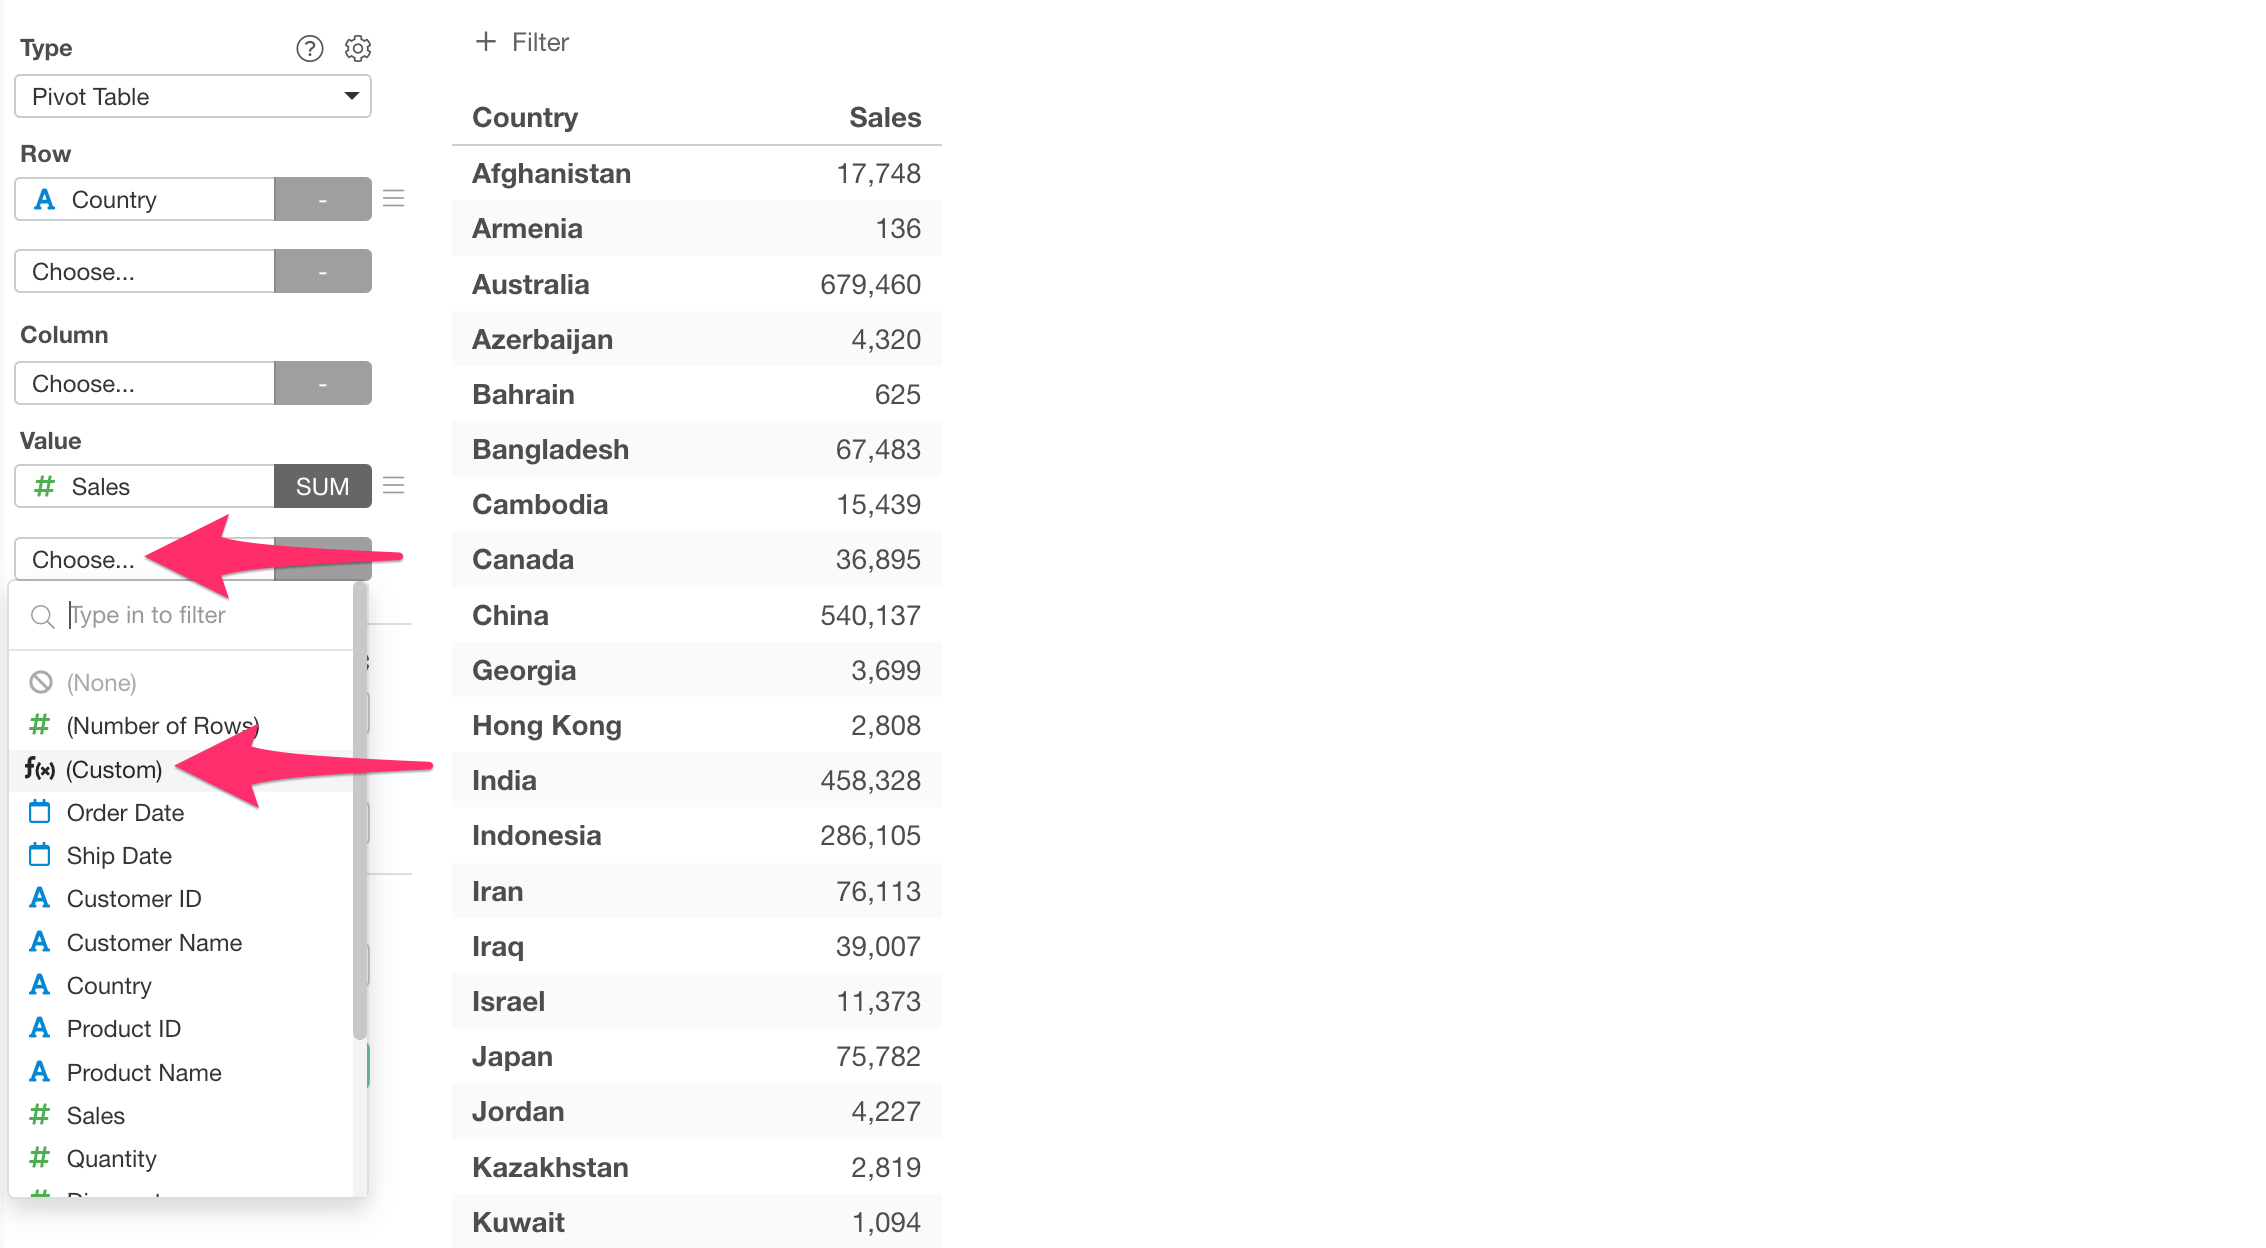
First, select Custom for the second value.
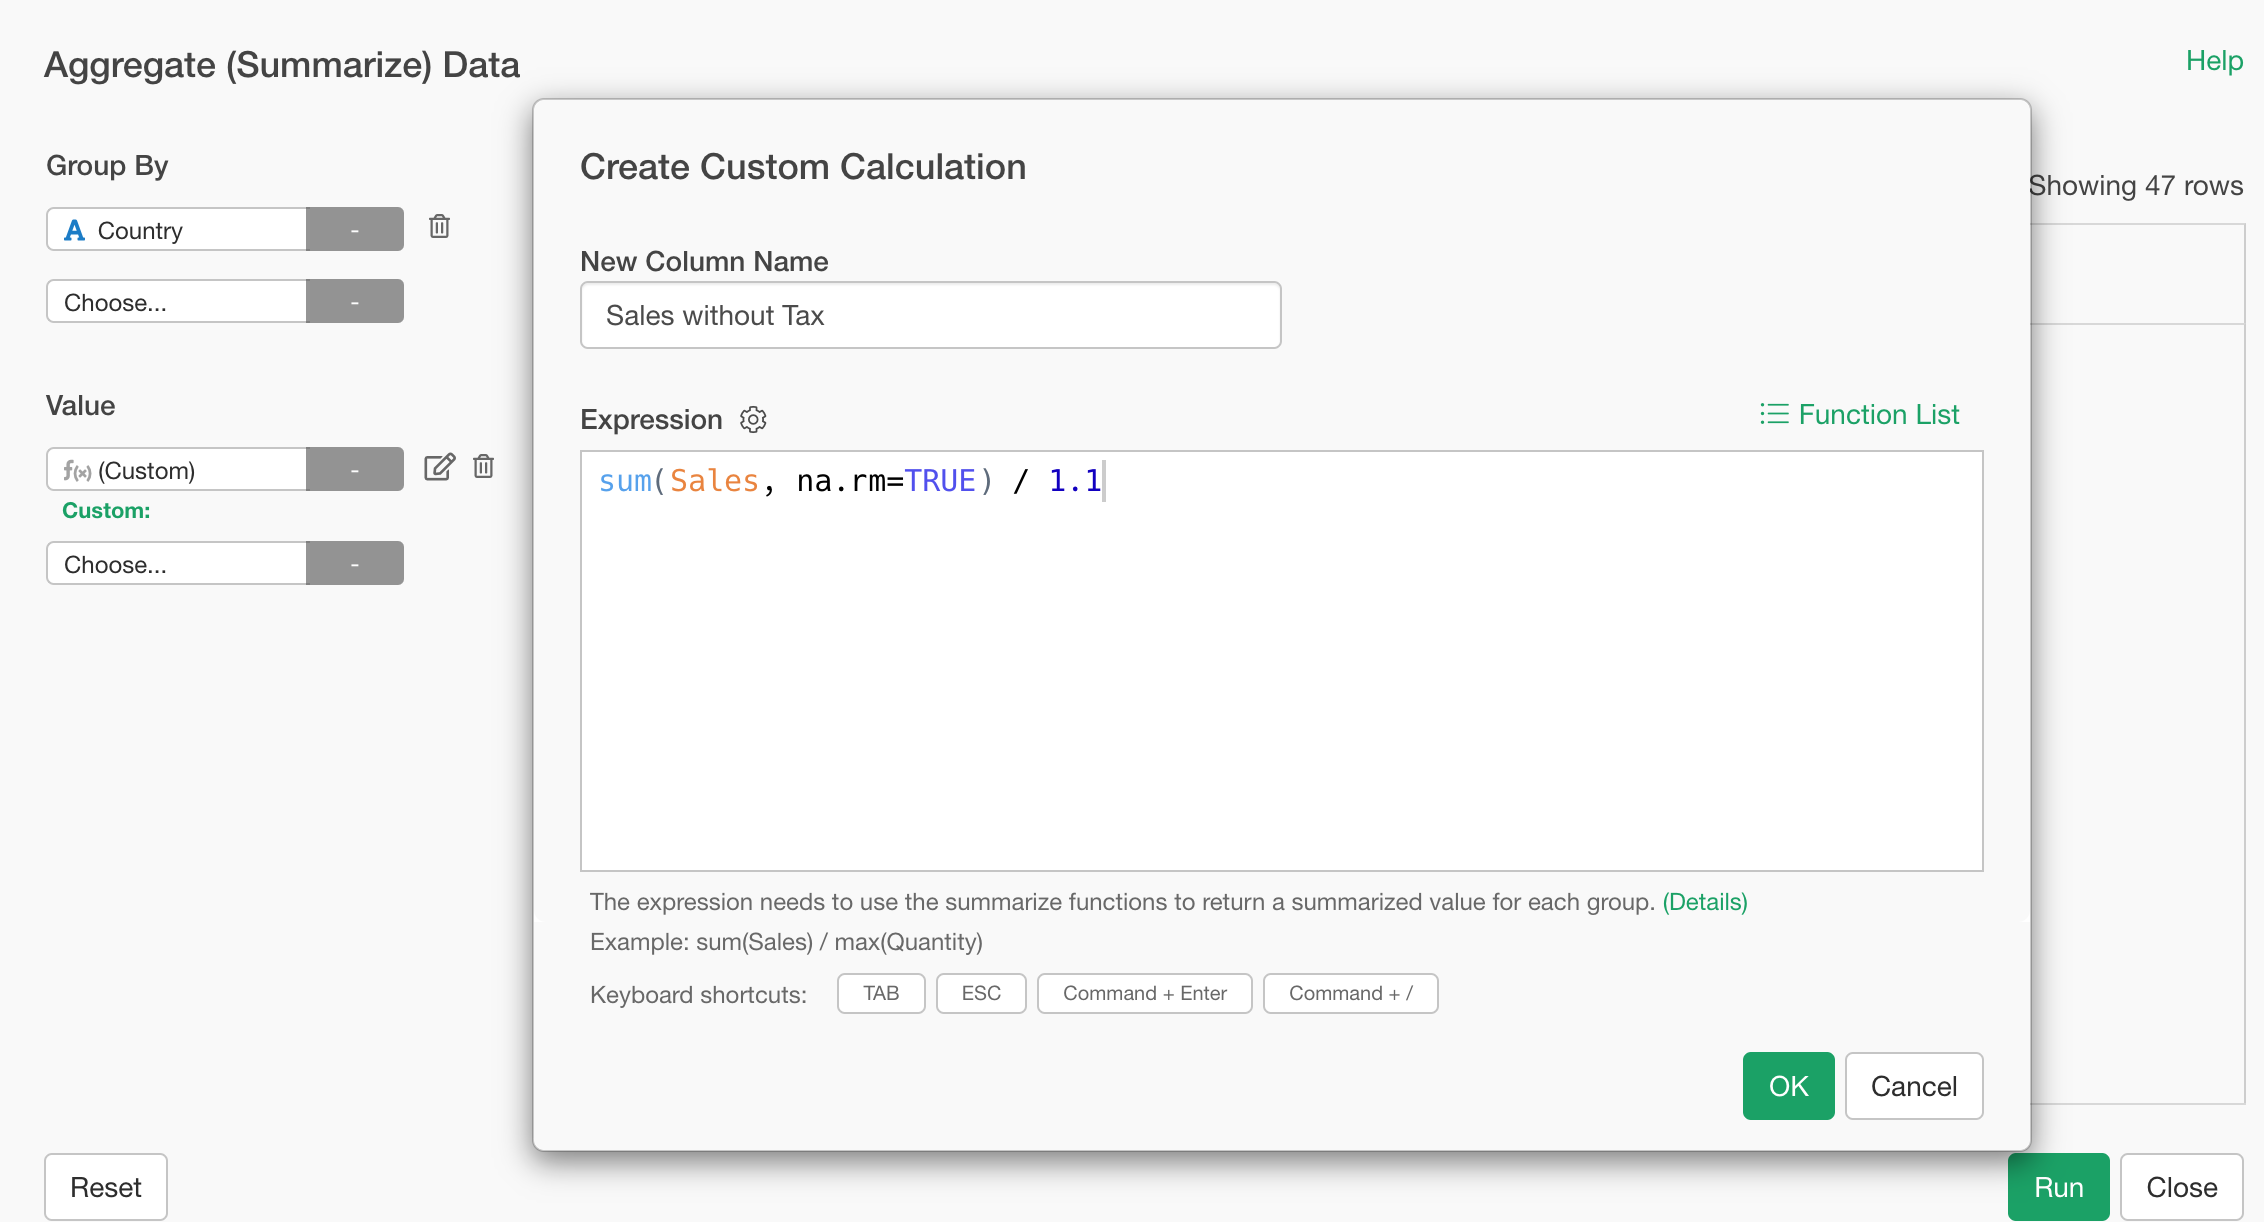
A Custom Calculation dialog will open.
In the formula field, you can write various calculation formulas using the R language.
In this case, to get the total sales amount before a 10% consumption tax was added, you simply sum all sales values and divide by 110% (1.1).
The formula would be:
sum(Sales, na.rm=TRUE) / 1.1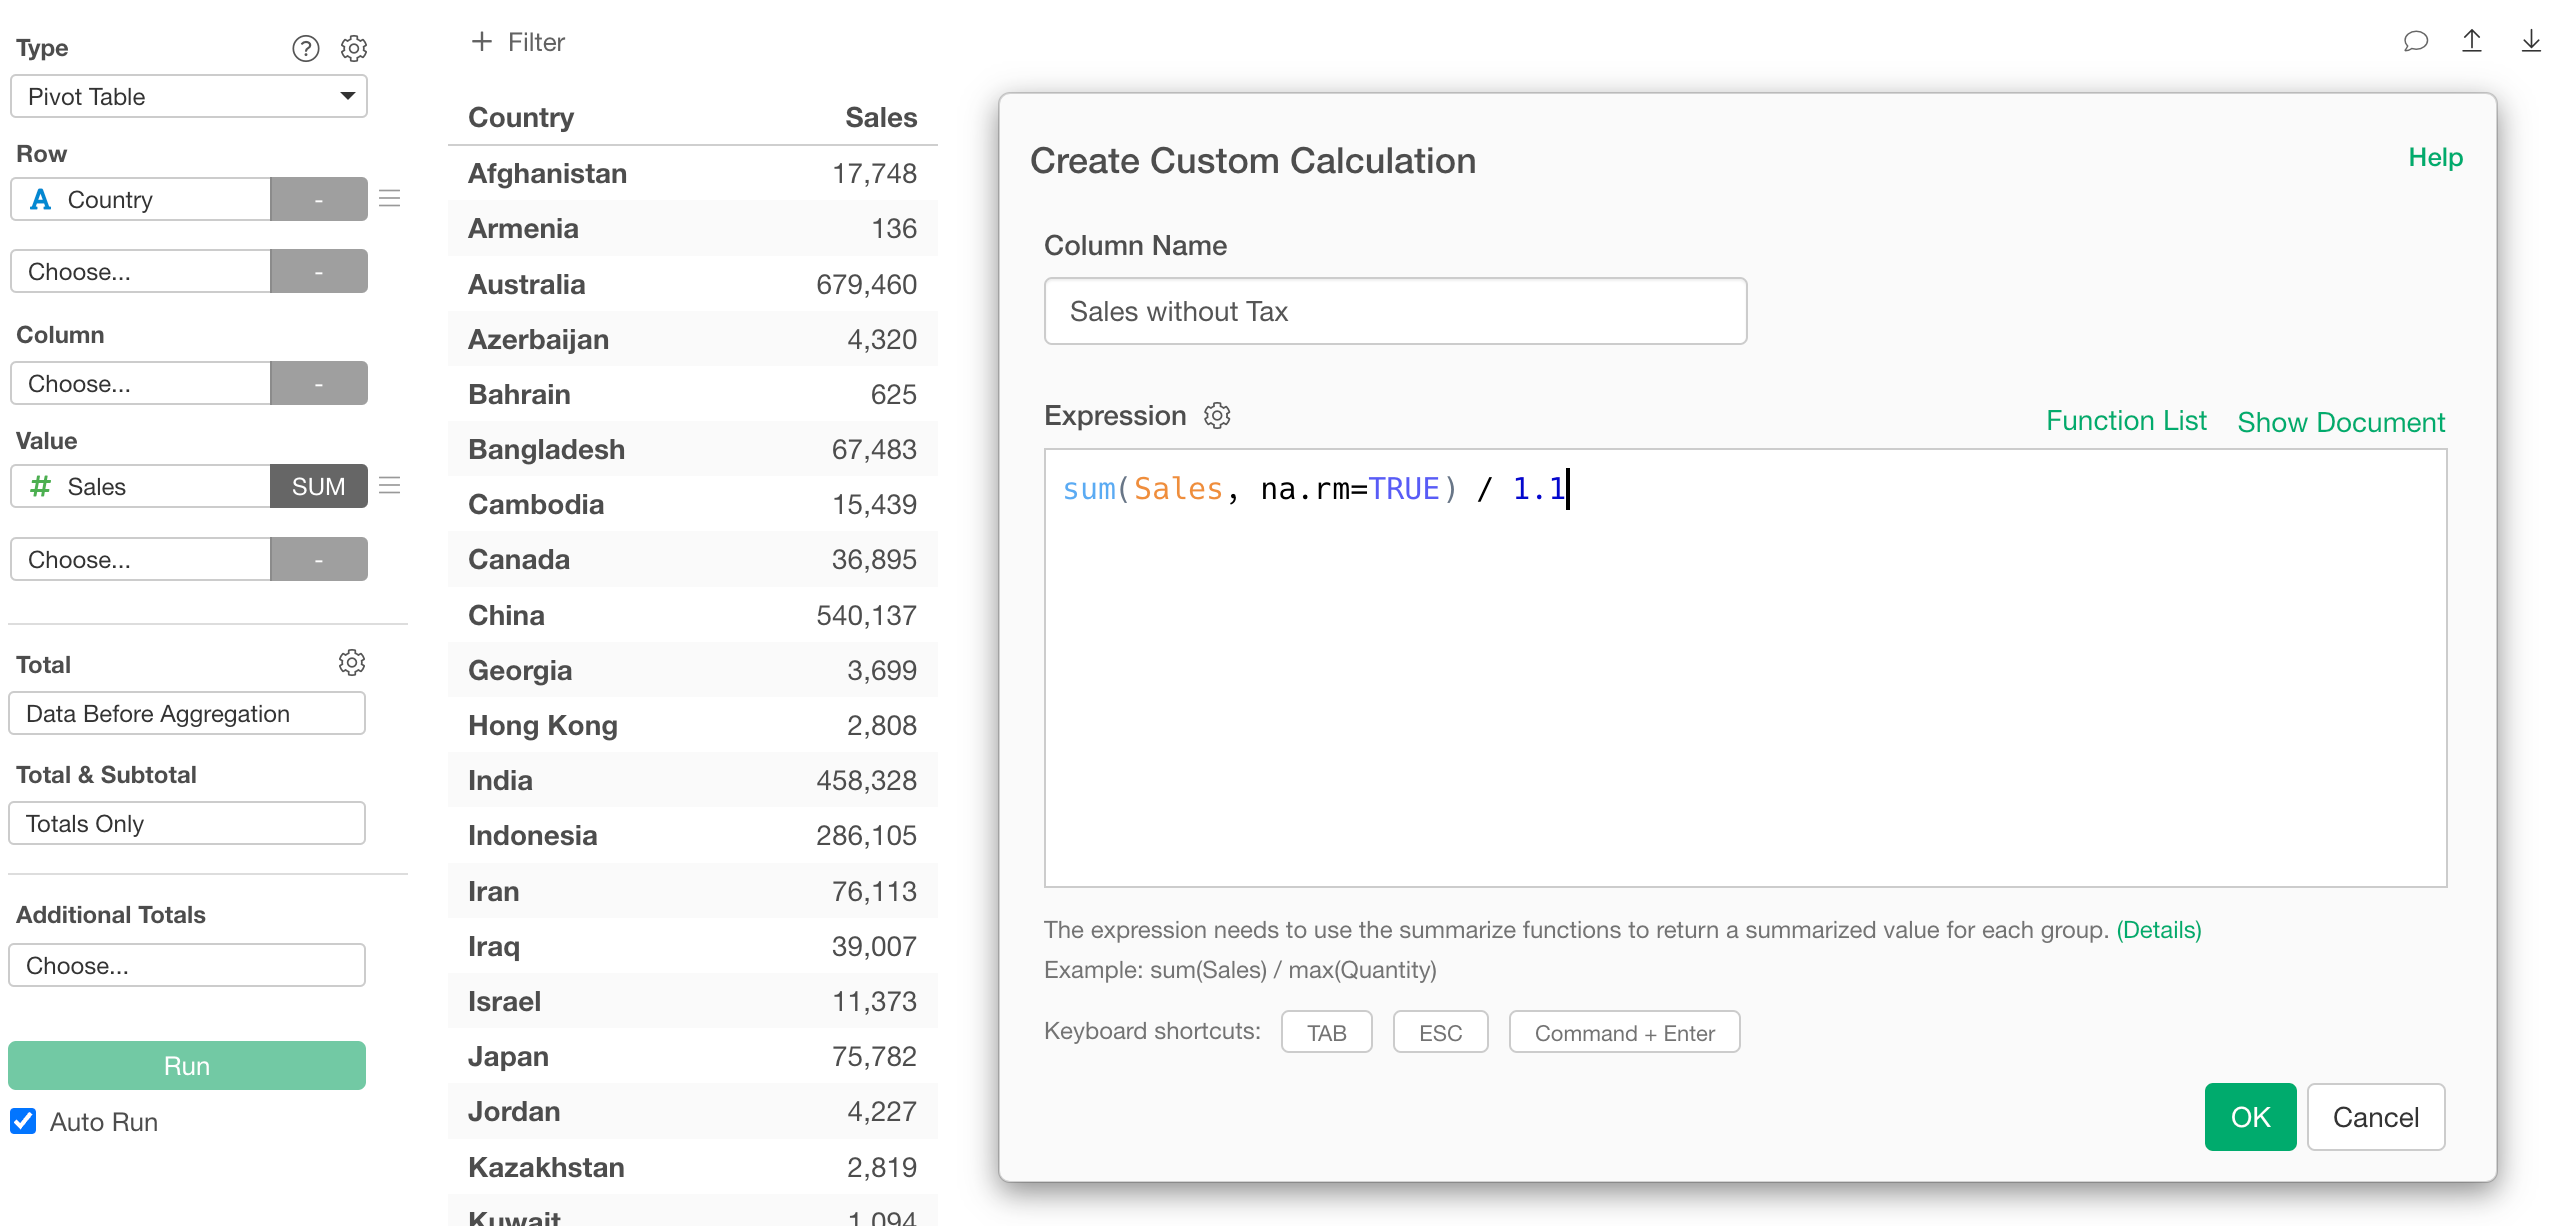
We will introduce the na.rm argument later in the
“Rules” section.
Once your formula is ready, click OK.
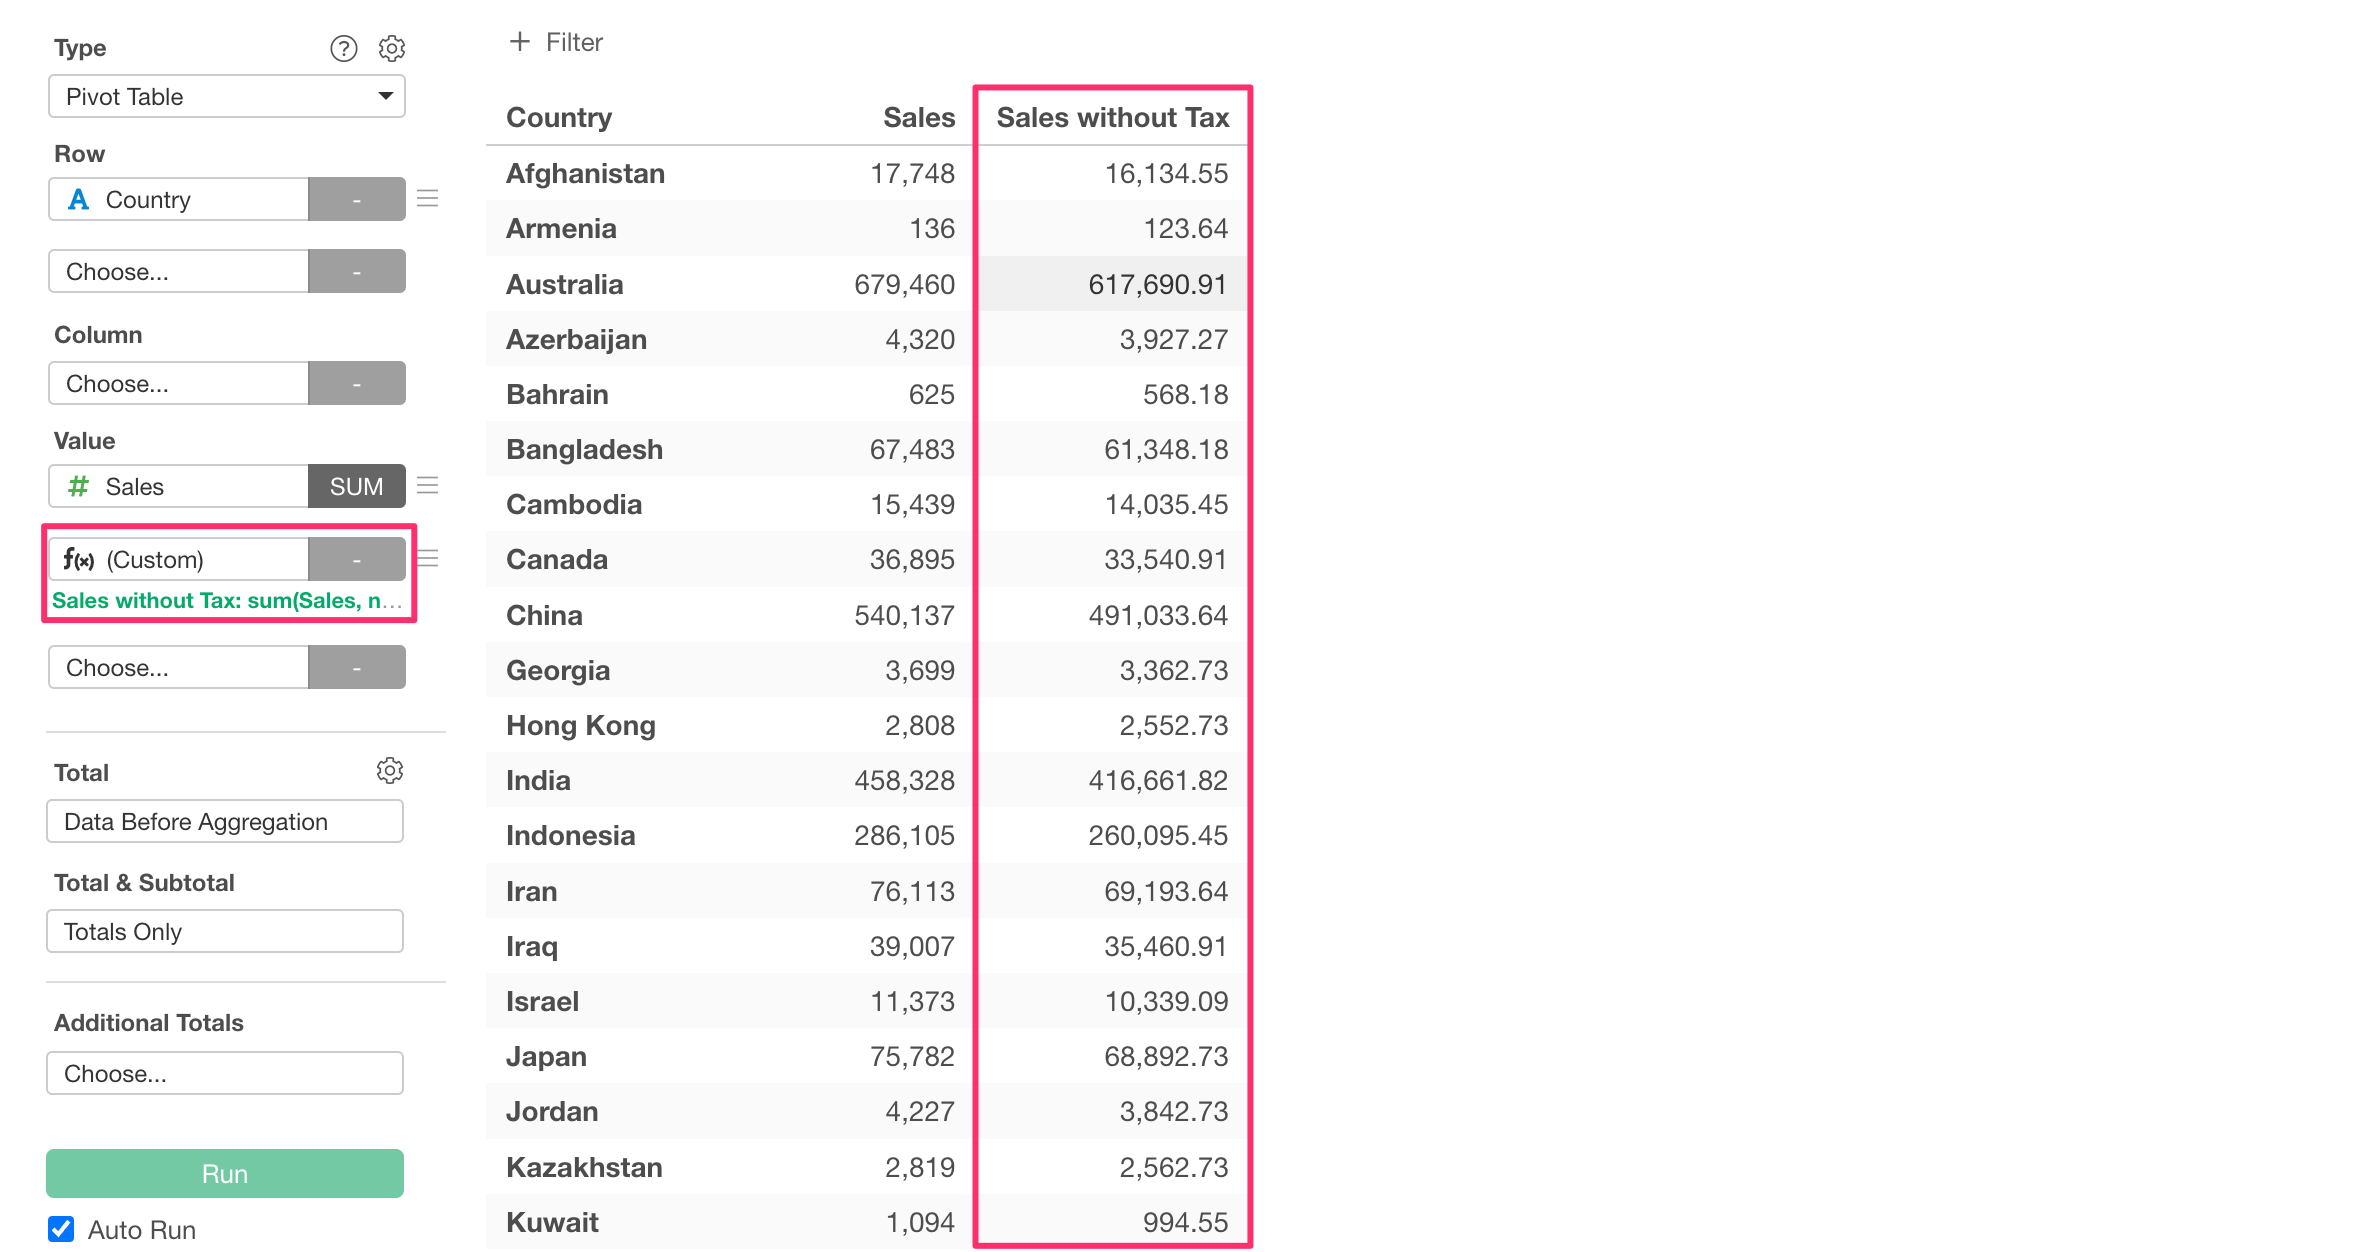
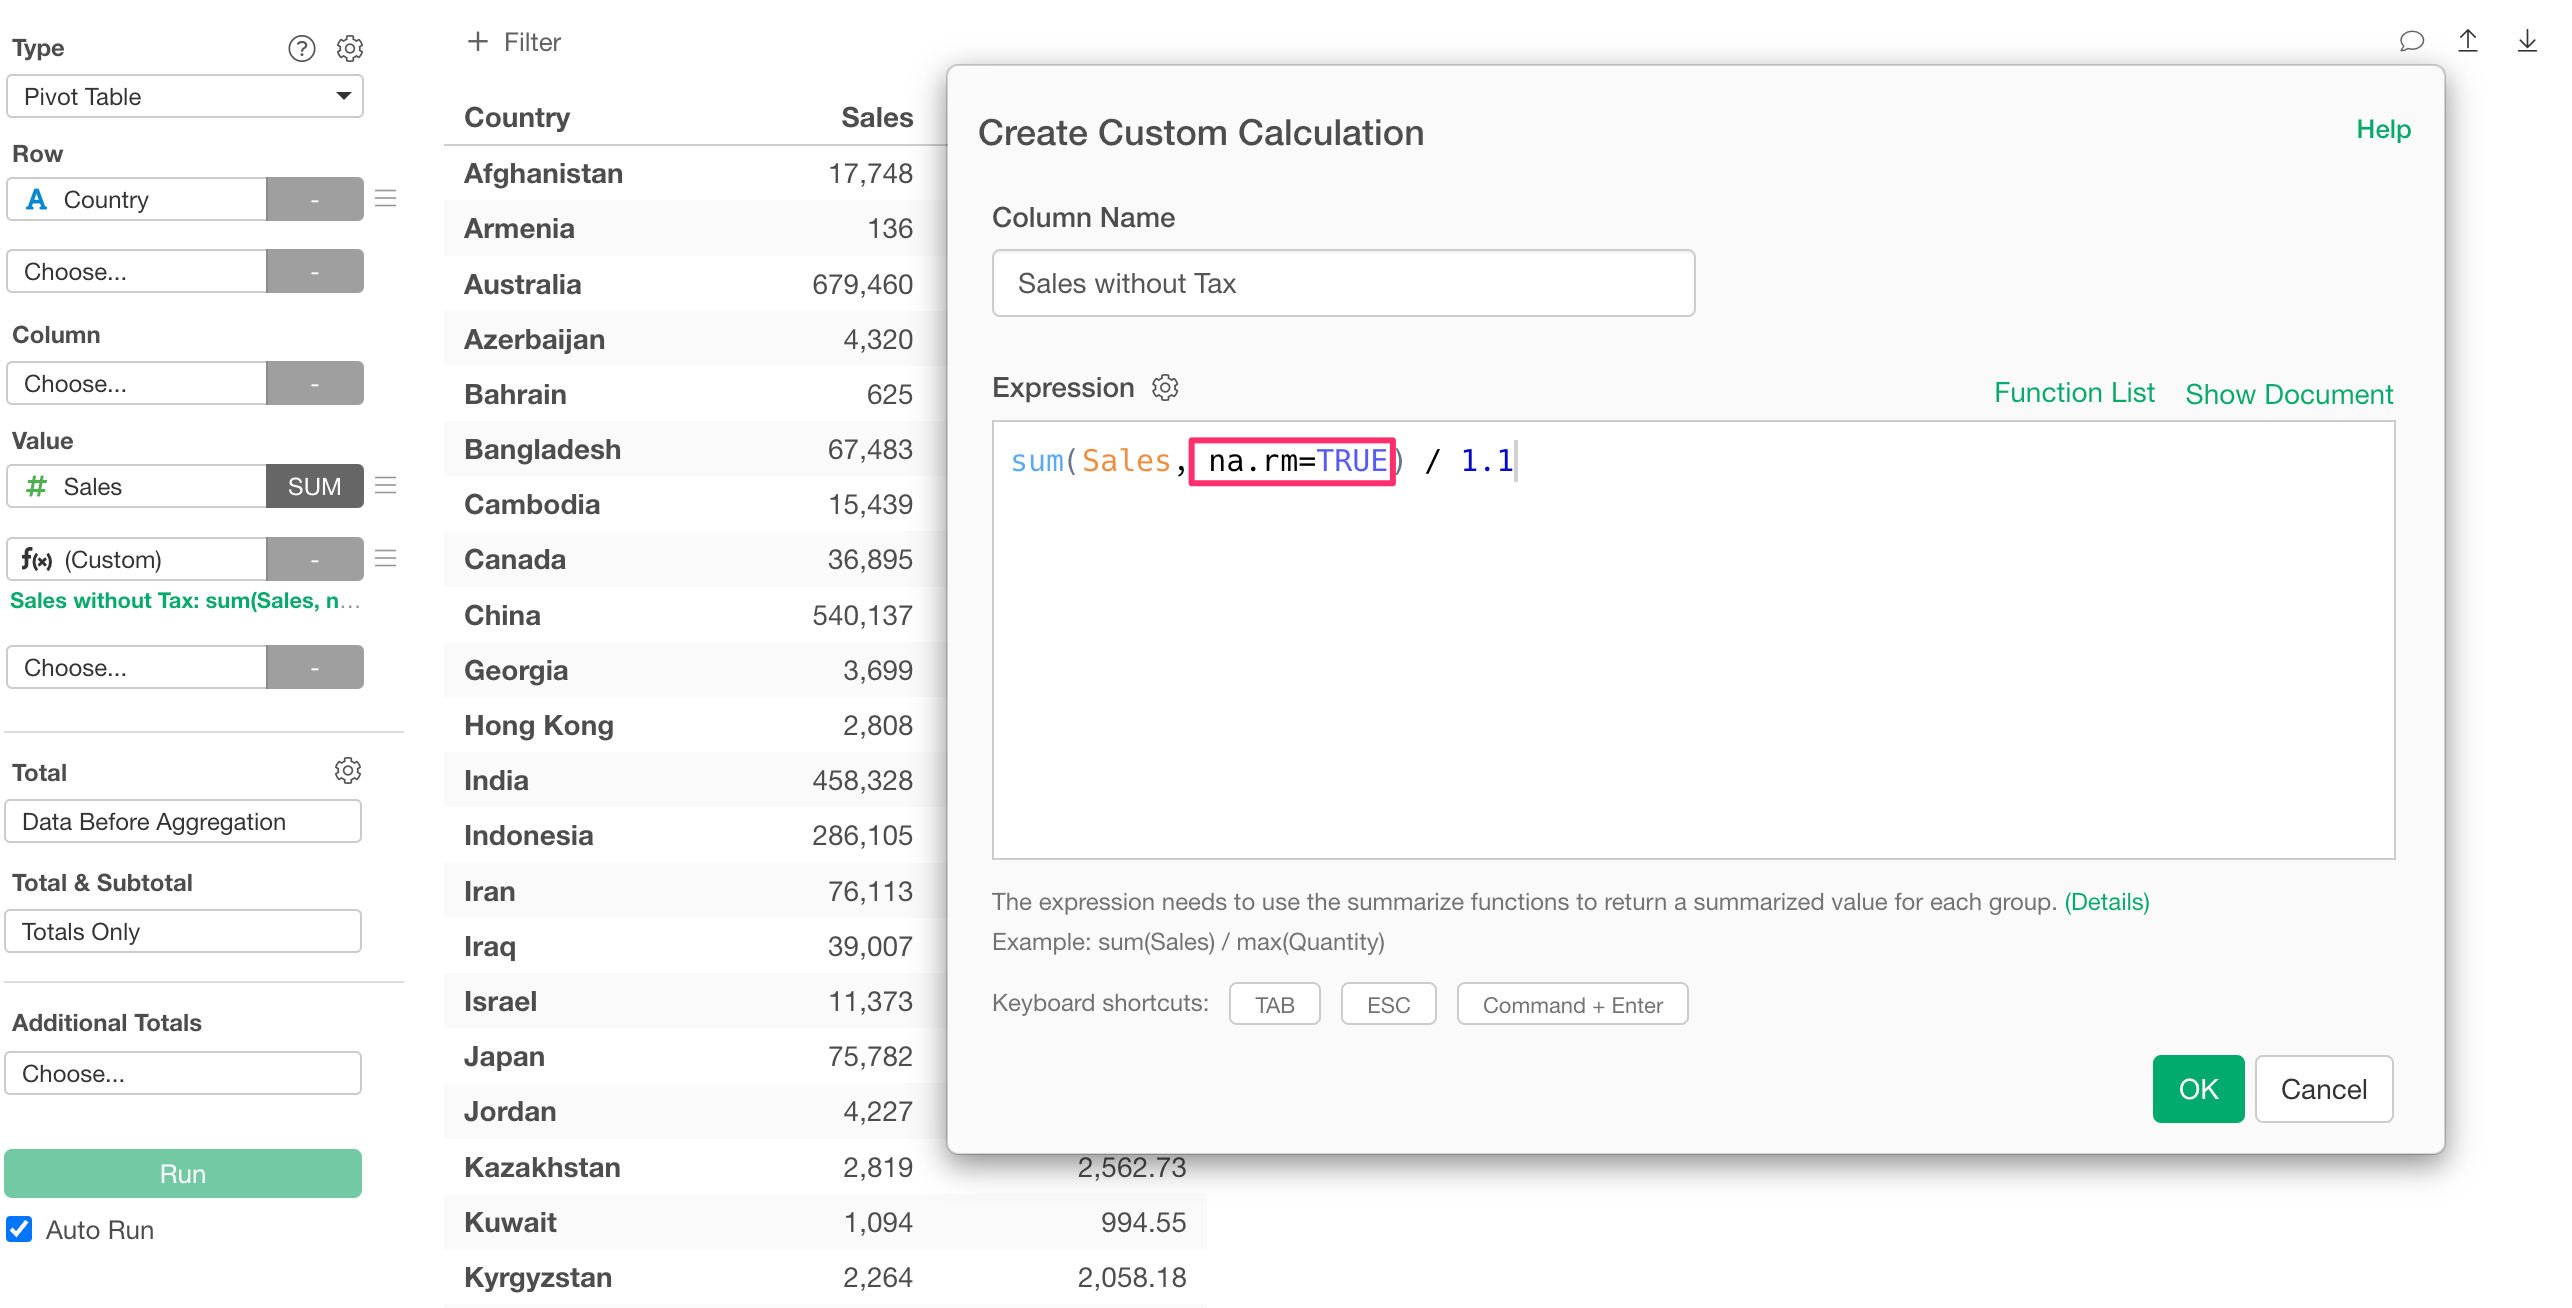
A new column will appear in the pivot table showing the total sales amount without the 10% tax.
Using Custom Calculations in the Summarize Dialog
To use a custom calculation in the Summarize dialog, select Custom in place of an actual column under Values.
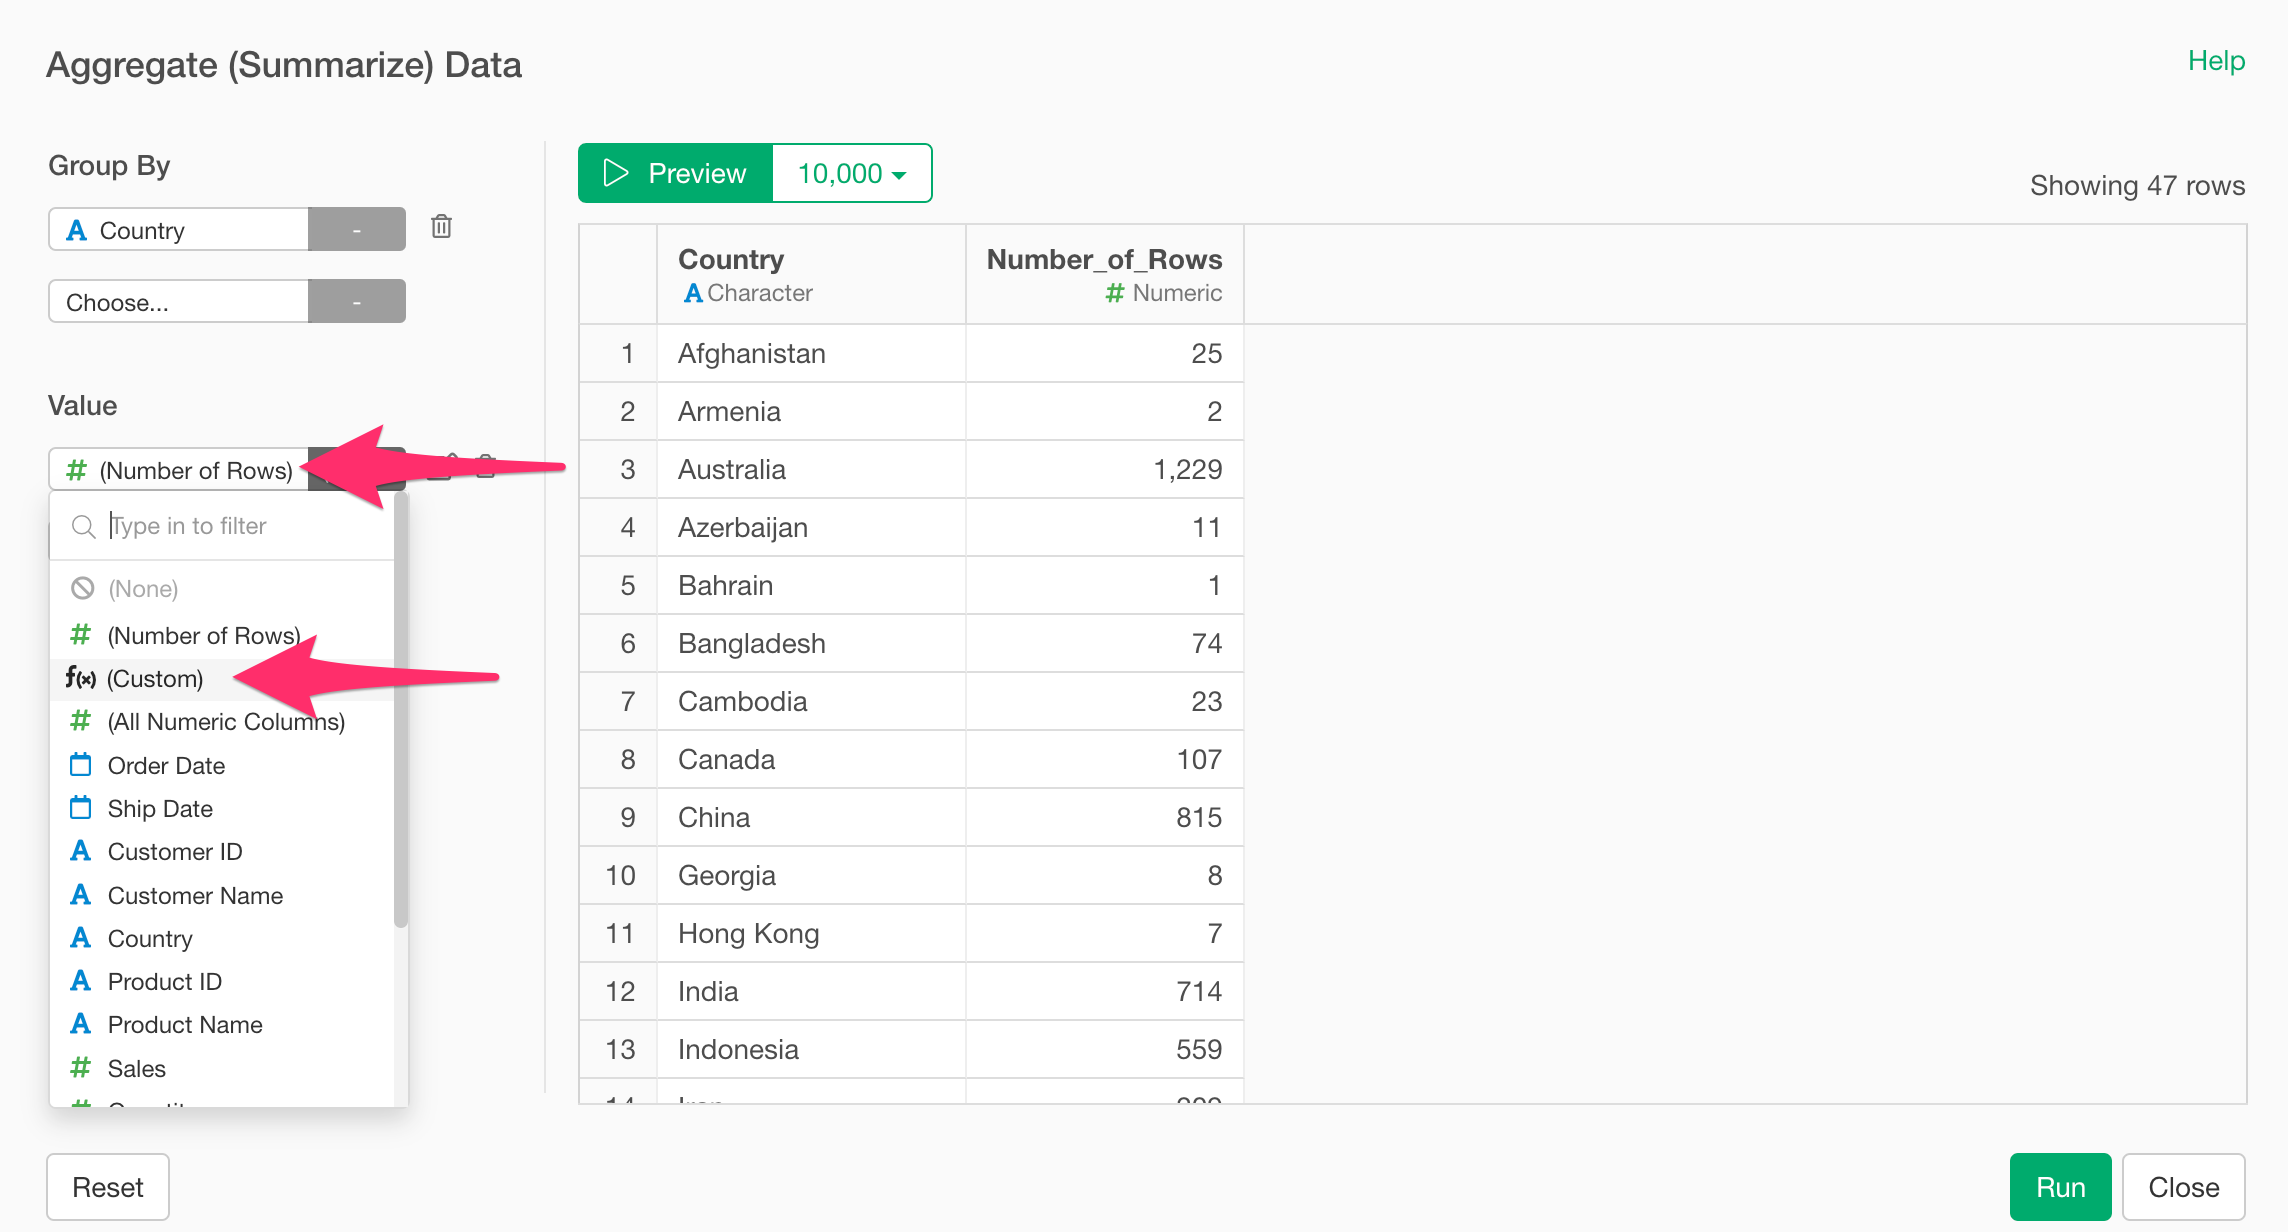
This will display the Custom Calculation dialog, which works the same way as in the chart example above.
We will explain the na.rm argument used in the above
formula later in the “Rules” section.
Rules
There are two important rules for writing formulas:
The formula must return a single value
If the data contains missing values, you must set the
na.rm=TRUEargument, otherwise the result will be missing
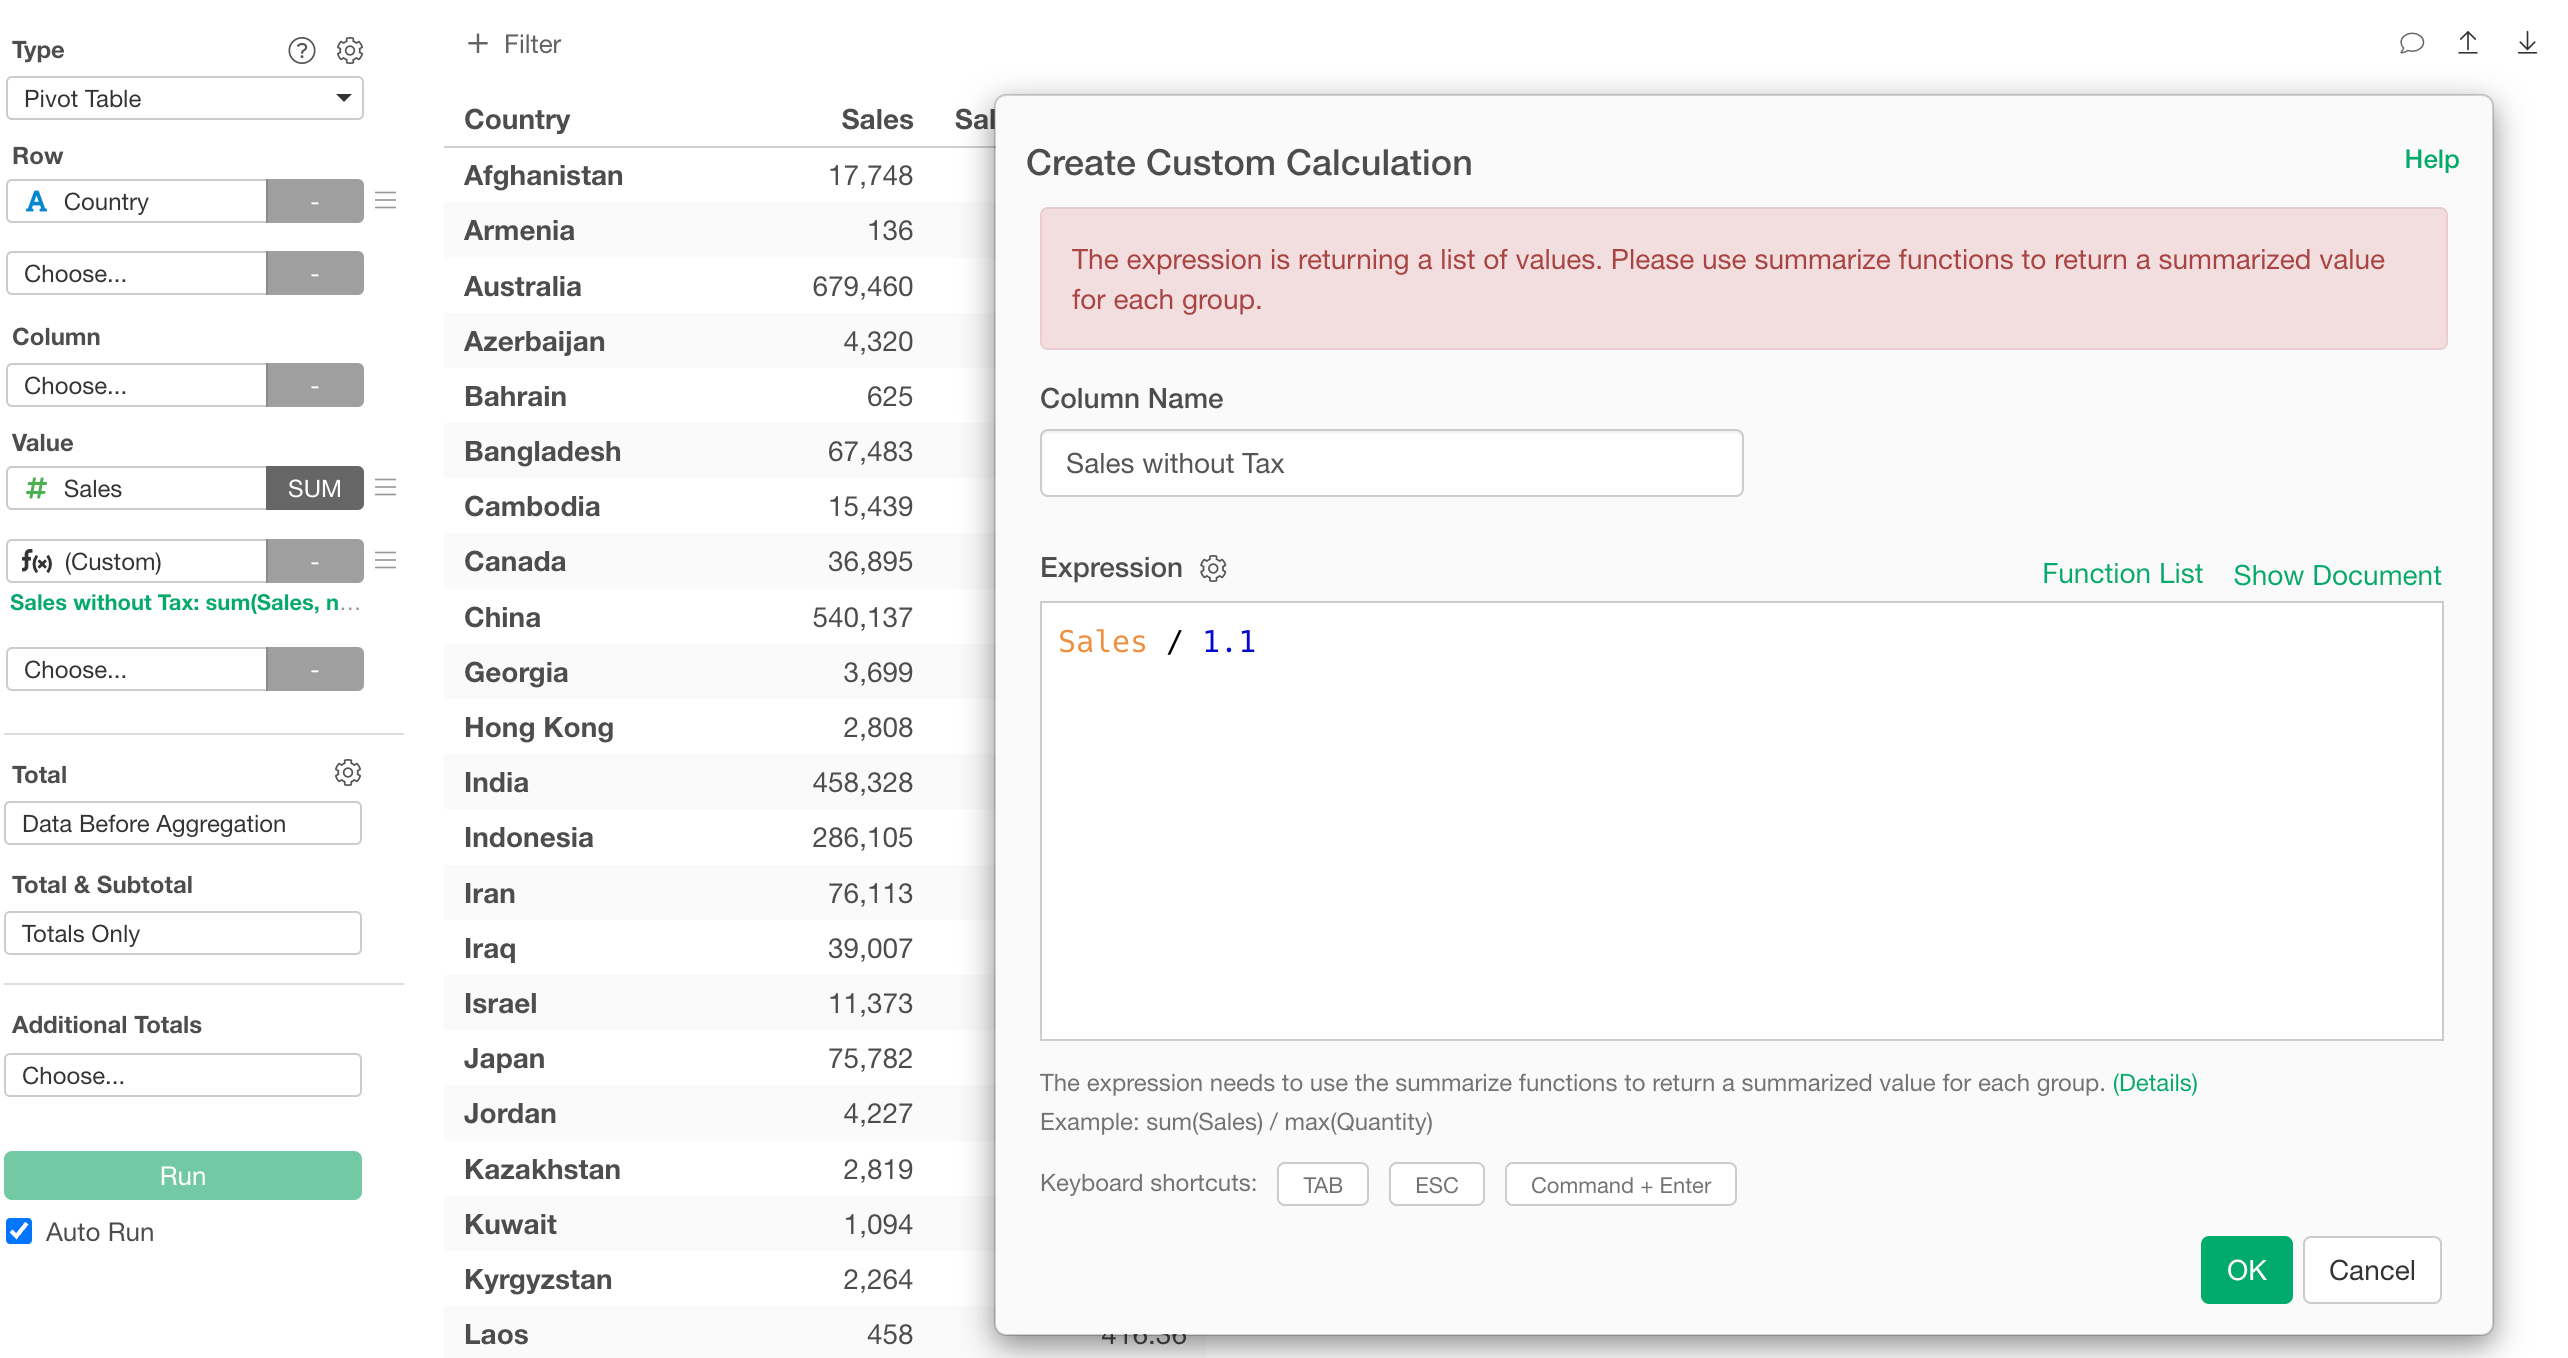
1. The formula must return a single value
For example:
Sales / 1.1The Sales column contains a list of sales values for each order, so this calculation returns a list of sales values before the 10% tax for each order.
However, a custom calculation must return a single value, so you’ll get an error.
2. If the data contains missing values, you must set
na.rm=TRUE or the result will be missing
When using custom calculations in charts or pivot tables, if the data being aggregated contains missing values, simply using an aggregation function may not display results.
This is because, by default, if missing values (N/A) are included, the result of the aggregation function will also be missing.
To handle this, specify na.rm=TRUE in the aggregation
function to exclude missing values from the calculation.
The na stands for “missing value,” and rm
stands for “remove.”
For this reason, we recommend always using
na.rm=TRUE when working with custom calculations unless
there is a specific reason not to.
Commonly Used Functions in Custom Calculations
Below is a list of functions frequently used in custom calculations for summary tables and pivot tables.
In examples like sum(Sales), the part inside the
parentheses is the column name.
| Function Name | Description | Example |
|---|---|---|
| sum | Calculate the sum | sum(Sales) |
| mean | Calculate the mean | mean(Sales) |
| max | Calculate the maximum | max(Sales) |
| median | Calculate the median | median(Sales) |
| min | Calculate the minimum | min(Sales) |
| first | Return the first value | first(Sales) |
| last | Return the last value | last(Sales) |
| mode | Return the mode | mode(Sales) |
| n | Return the number of rows | n() |
| n_distinct | Return the count of unique values | n_distinct(User_Id) |
How to reference the number of rows
To reference the number of rows in a custom calculation, use the
n() function.
For example, if you want to display the result of subtracting the “Marketing_Cost” column from the “Sales” column and dividing by the number of rows, the formula would be:
sum(Sales - Marketing_Cost) / n()