
How to Use Exploratory Part 2 - Data Wrangling
This is the second episode of 'How to Use Exploratory' tutorial series, and focuses on Data Wrangling - clean and transform data. Before taking this tutorial, we'd highly recommend you take a look at the first episode 'How to Use Exploratory Part 1 - Basics' first if you haven't done yet.
With this tutorial, you can quickly learn the following topics by following the step-by-step instructions below.
- Import CSV Data
- Replace Values with New Values
- Aggregate (Summarize) Data
- Join with Another Data Frame
- Create Calculation
- Create Branch Data Frame
- Separate a Column into Multiple Rows
- Clean Up Text Data
It takes about 20 minutes to finish.
Let's start!
1. Import Data
We'll use the following two data frames. You can download them from the links.
Unicorn data has all the latest unicorn companies who are private companies with greater than 1 billion dollars valuation.
Once downloaded, you can select both CSV files and drag and drop them into Exploratory.

Data Import dialog will show up, simply click on the Import button at the bottom.

Another dialog will open. You can keep the default setting, simply click on 'Ok for All' button.

Once imported, you'll see two data frames showing up at the left hand side.

2. Replace Values with New Values
In this section, we'll replace some values with other values in the Unicorn data.
Open the Unicorn data and click on the 'Create Chart' button on the Industry column.

This will create a bar chart under the Chart view that shows you how many unicorn companies are by industry type.
Here's a problem.
There is one bar for 'Artificial Intelligence' and another bar for 'Ai', but they should mean the same thing.

We want to change both of the names to be just 'AI'. And this is when we want to use 'Replace Values with New Values' operation.
Go back to the Table view and select 'Replace Values', then 'With New Values'.

In the 'Replace Original...' dialog, you can type in 'AI' for the two entries of 'Ai' and 'Artificial Intelligence'.

Once you click on the Run button, you'll see the values are updated for the Industry column.

When you go back to the Chart view you might not see the Industry column values are not updated. That's because your chart is still pinned to the very first step at the right hand side.
You can simply drag-and-drop the Pin button to the second step where you replace those values.

Now your chart should reflect the changes and you should see only one bar for 'AI'.

3. Summarize (Aggregate) Data
In Exploratory, you can summarize (or aggregate) data quickly with charts and pivot tables under the Chart view. But sometimes you want to summarize the data as a data wrangling step so that you can do something with the summarized data such as create additional calculations, join with other data, and so on.
Here, we want to know how many unicorn companies for each country, and also want to know how many unicorn companies per capita (based on population) by country and compare the stats among the countries.
In order to do such, first we need to summarize the data by country.
Select 'Summarize (Aggregate)' from the column header menu of the Country column.

In the Summarize dialog, make sure that 'Country' column is selected for the Group By and '(Number of Rows)' is selected for the Value. This will calculate the number of the unicorns for each country given that each row represents each unicorn company.

You can simply click on the Run button and see the result under the Table view.

4. Join with Another Data Frame
Now, let's bring in the country level population data into this Unicorn data so that we can calculate the number of unicorns per capita for each country later.
Select 'Join (Add Columns)' from the column header menu of the Country column.

In the 'Join (Add Columns)' dialog, you can select the Population data frame under the Target Data Frame.

Make sure that the Country columns are selected at the both end of the Key Column. This will join the two data sets by matching the Country column values of the Unicorn data with the Country column values of the Population data.

Click on the Preview button to see how they are joined together.

Let's say you don't really want all the columns from the Population data frame to come into the Unicorn data frame. In such cases, you can select which columns to bring in.
Click on 'Select Columns to Join (All)' text.

Then you can select 'Population' and 'GDP_Estimate_by_IMF' columns, for example.

Once you click the Ok button, you'll see the Population and GDP data are now in the Unicorn data frame for all the countries.

5. Create Calculation
Now that we have the number of unicorns value and the population value for each country, we can create the number of unicorns per capita information.
Select 'Create Calculation', then 'Standard' from the column header menu of the 'Number of Rows' column.

In the Calculation editor, type in '/' and select the 'Population' from the suggestion list.

Lastly, let's multiple by 1 million (1,000,000) so that we can calculate the 'per population' as 'per 1 million people'.

Add a column name, something like 'Unicorns per Capita' and click the Run button.
Go to the Chart view and create a new chart.
Select 'Bar' as the chart type, assign 'Country' to the X-Axis and 'Unicorn per Capita' to the Y-Axis.

You can see that Malta is the tope country, and the next is Luxembourg.
However, there is one problem.
These countries have just one unicorn company and their population is pretty small so they came up to the top ranks. Nothing wrong with having just one unicorn company, there are many countries that don't even have one.
But at the same time just having one unicorn might be a random event. So, we can remove the countries with just one unicorn and then compare among the countries with at least two unicorn companies.
Click on the Add Filter button, select 'Number_of_Rows' column, 'Greater Than' operator, then type in 1 as the Value. Then, hit the 'Run' button.

Now, you can see Israel is the top, then United States, Singapore, Hong Kong follows the lead.
5. Create Branch Data Frame
So far, we have transformed the Unicorn data quite a bit.
But now, what if I tell you to summarize at the investor level?
You have already summarized the data at the country level and create a chart for it. You don't want to go back and change the summarizing level and break the subsequent calculations and the chart. Of course, you want to keep the country level summarized data.
For something like this, you can simply branch off of the original data frame and perform such different type of data wrangling operations in the branched data frame. This is called 'Branch Data Frame' in Exploratory.
Let's try!
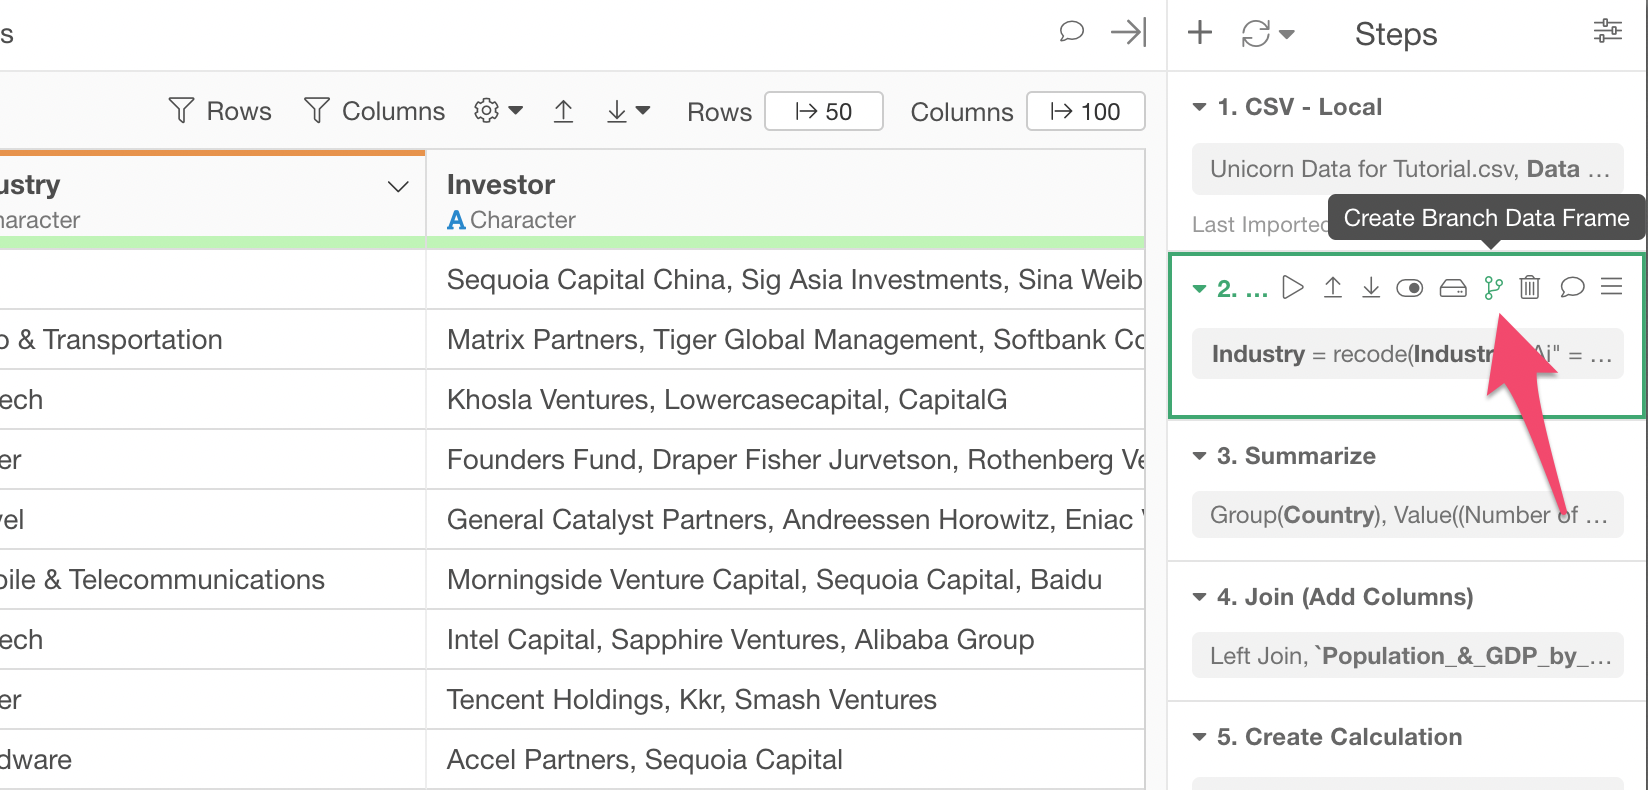
Select the 2nd step at the right hand side, this is the step right before the 'Summarize' step.

Click on the 'Create Branch Data Frame' button.
Enter a new name for this branch data frame.
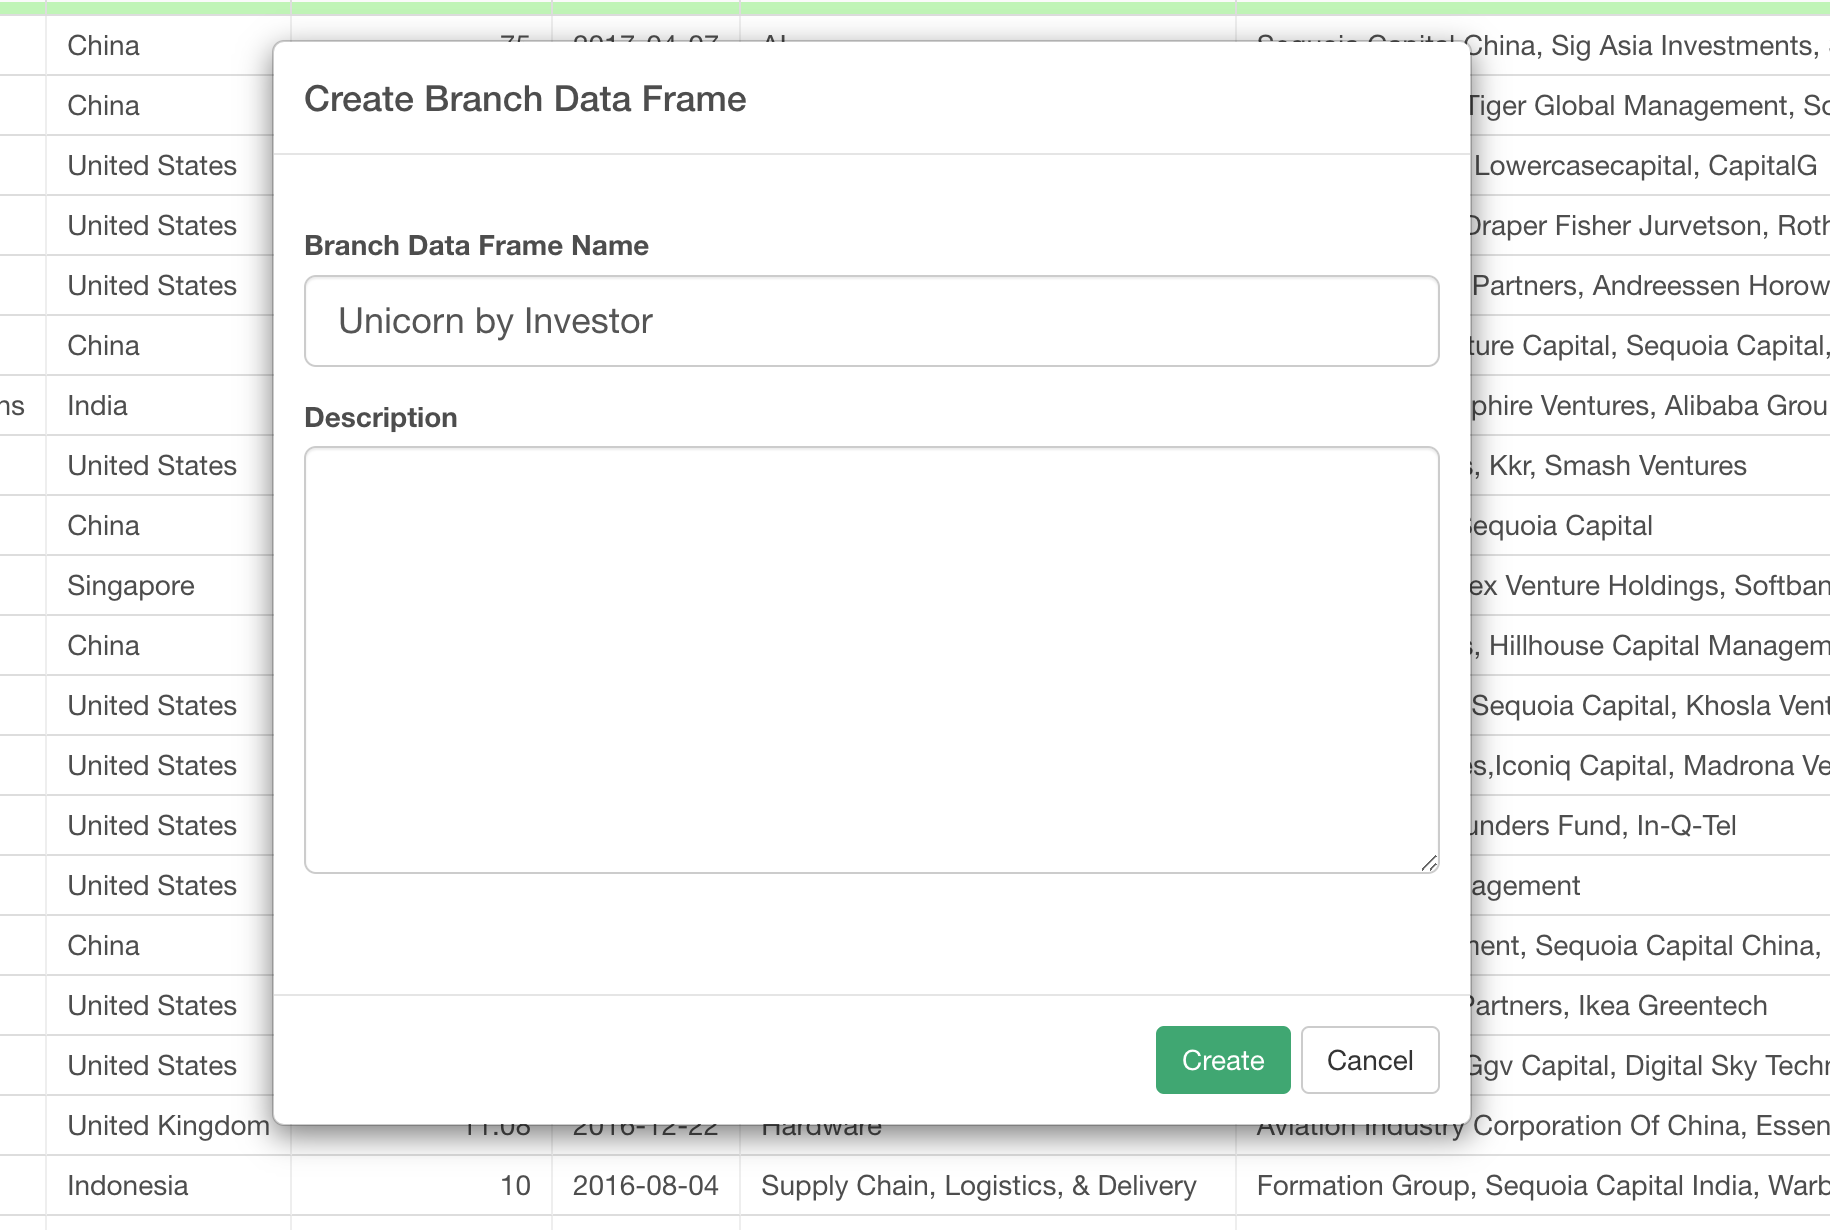
Once you click on the Create button, you'll see a new branch data frame name showing up right underneath the original Unicorn data frame.

When you look at the right hand side, the Steps area, you can see 'Branch Root' is highlighted and the previous two steps are grayed out. These grayed out steps can be accessed and updated only in the main data frame (the original Unicorn data frame).
Now we can work on this branch data frame to see which investors have the most unicorn companies.
6. Separate a Column into Multiple Rows
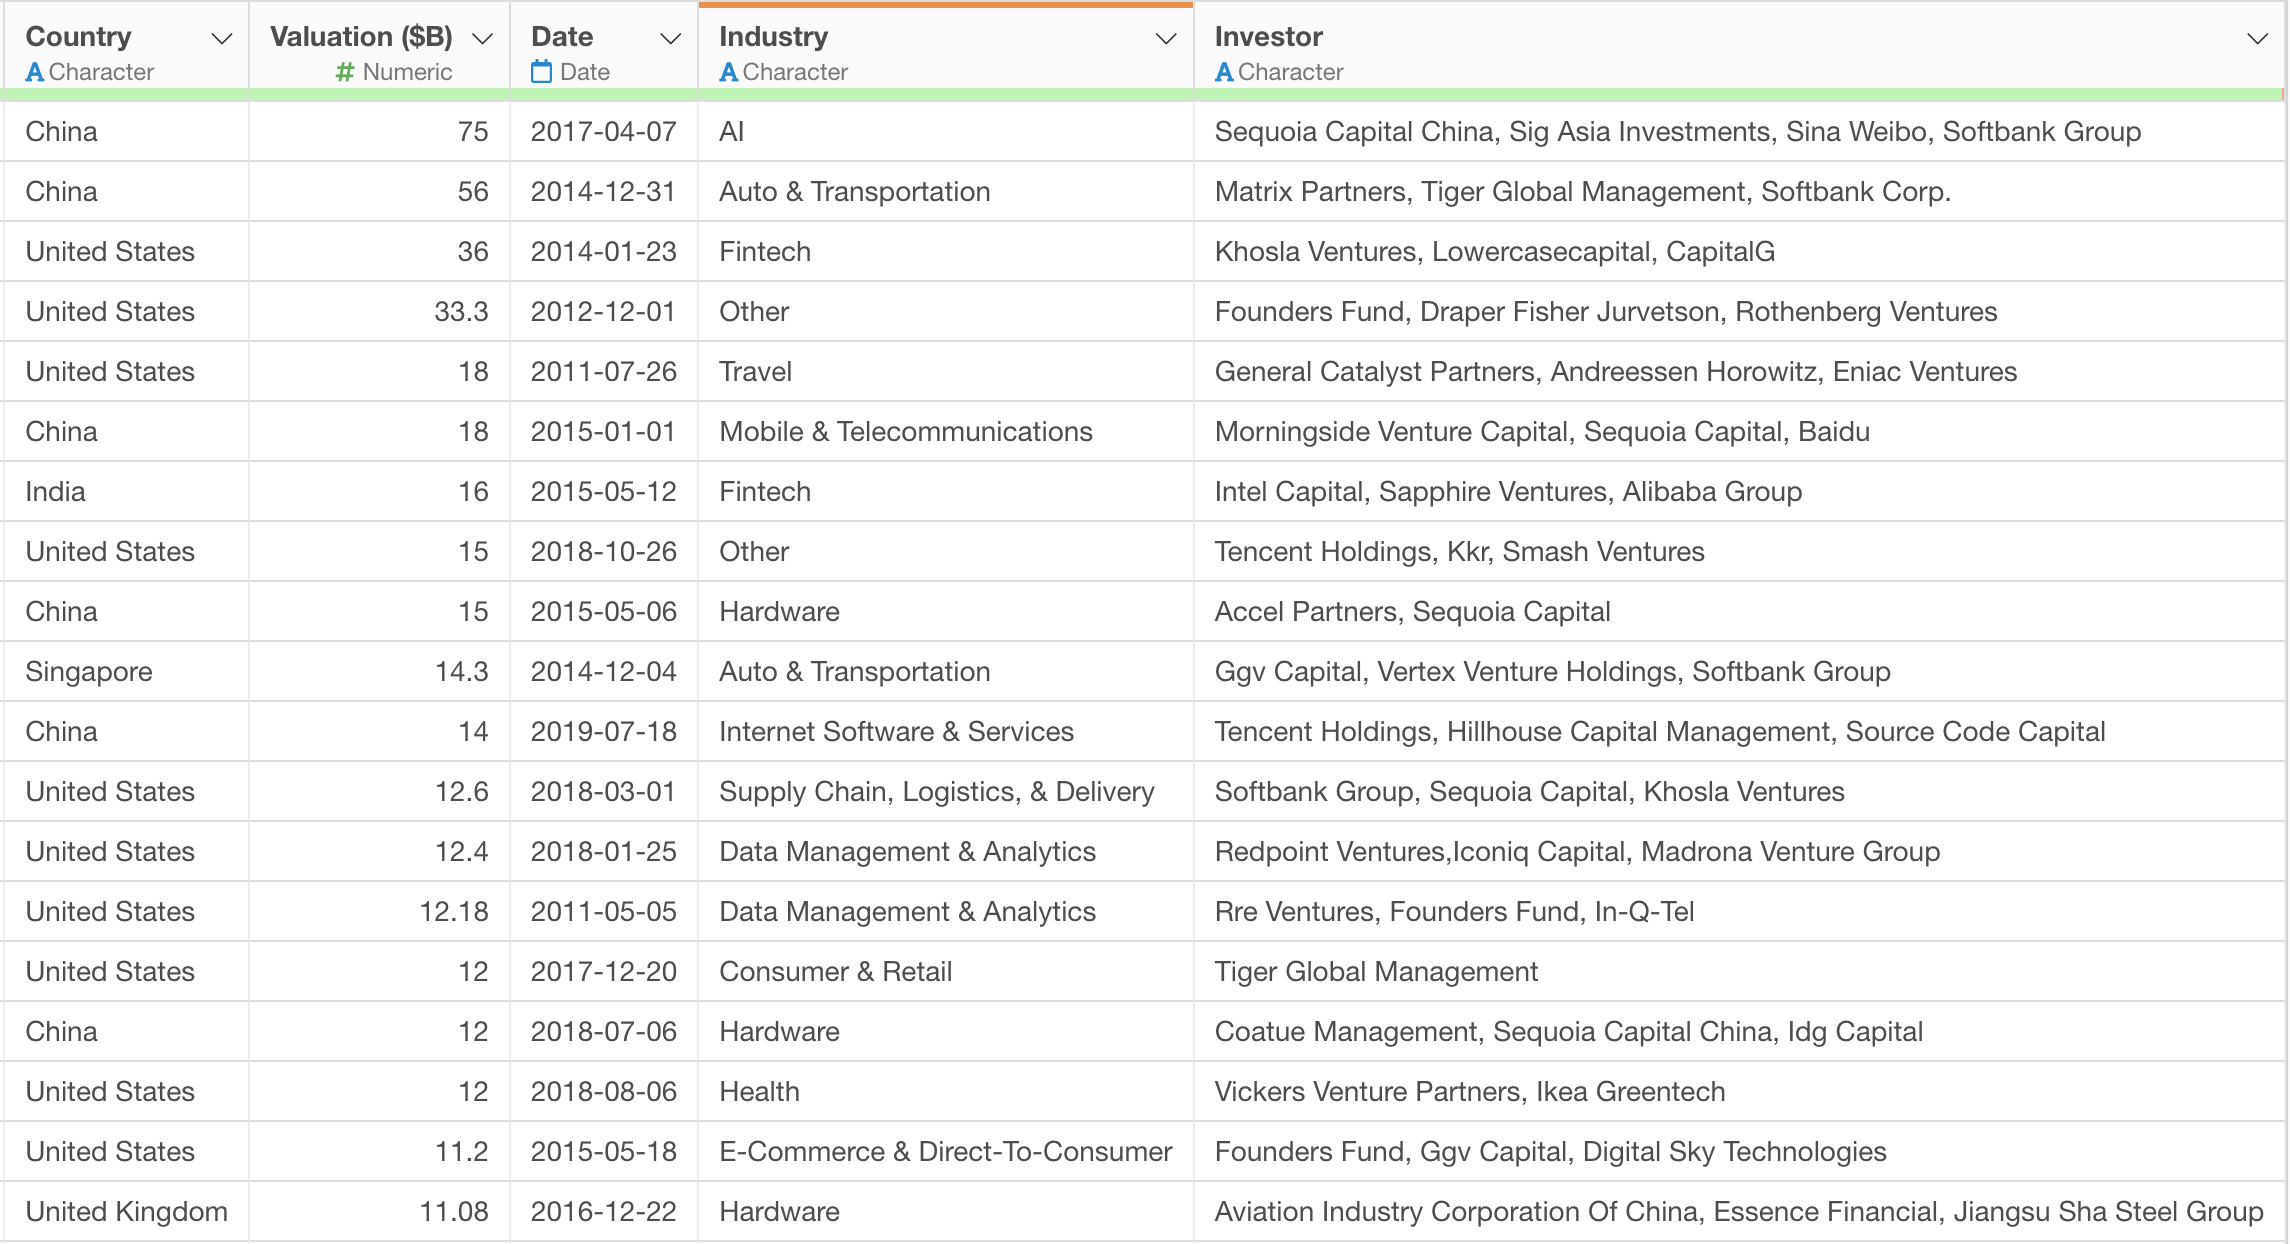
We want to show how many unicorns each investor has, but the Investor column has multiple investor names for each of the unicorn companies. In order to calculate such, we need to separate each investor name into separate rows so that each investor per the same unicorn company will have its own row.
You can select 'Separate', then 'Separate to Rows By ...' from the column header menu of the Investor column.
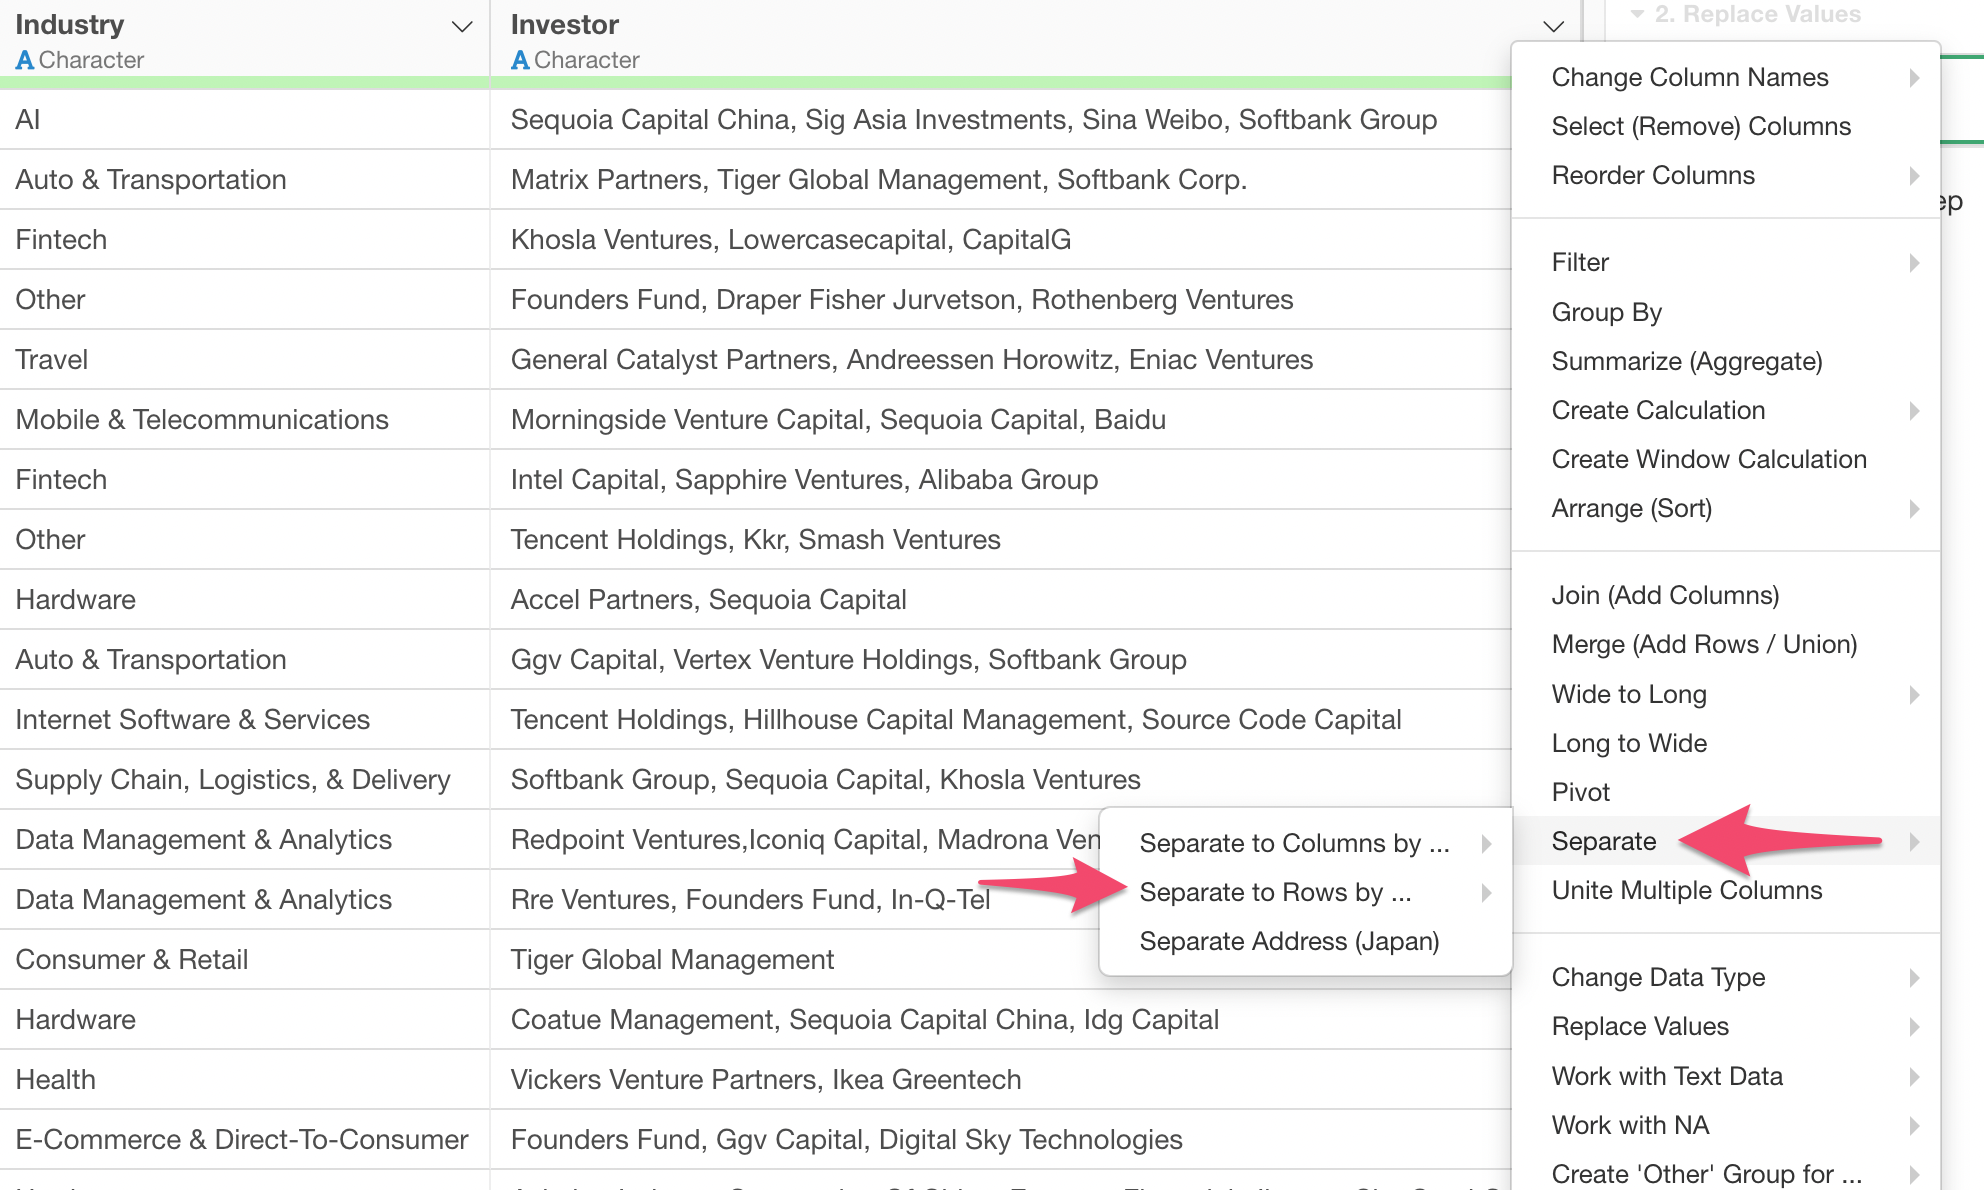
Then, select 'Comma (,)' from the sub-menu since the investor names are separated by comma.
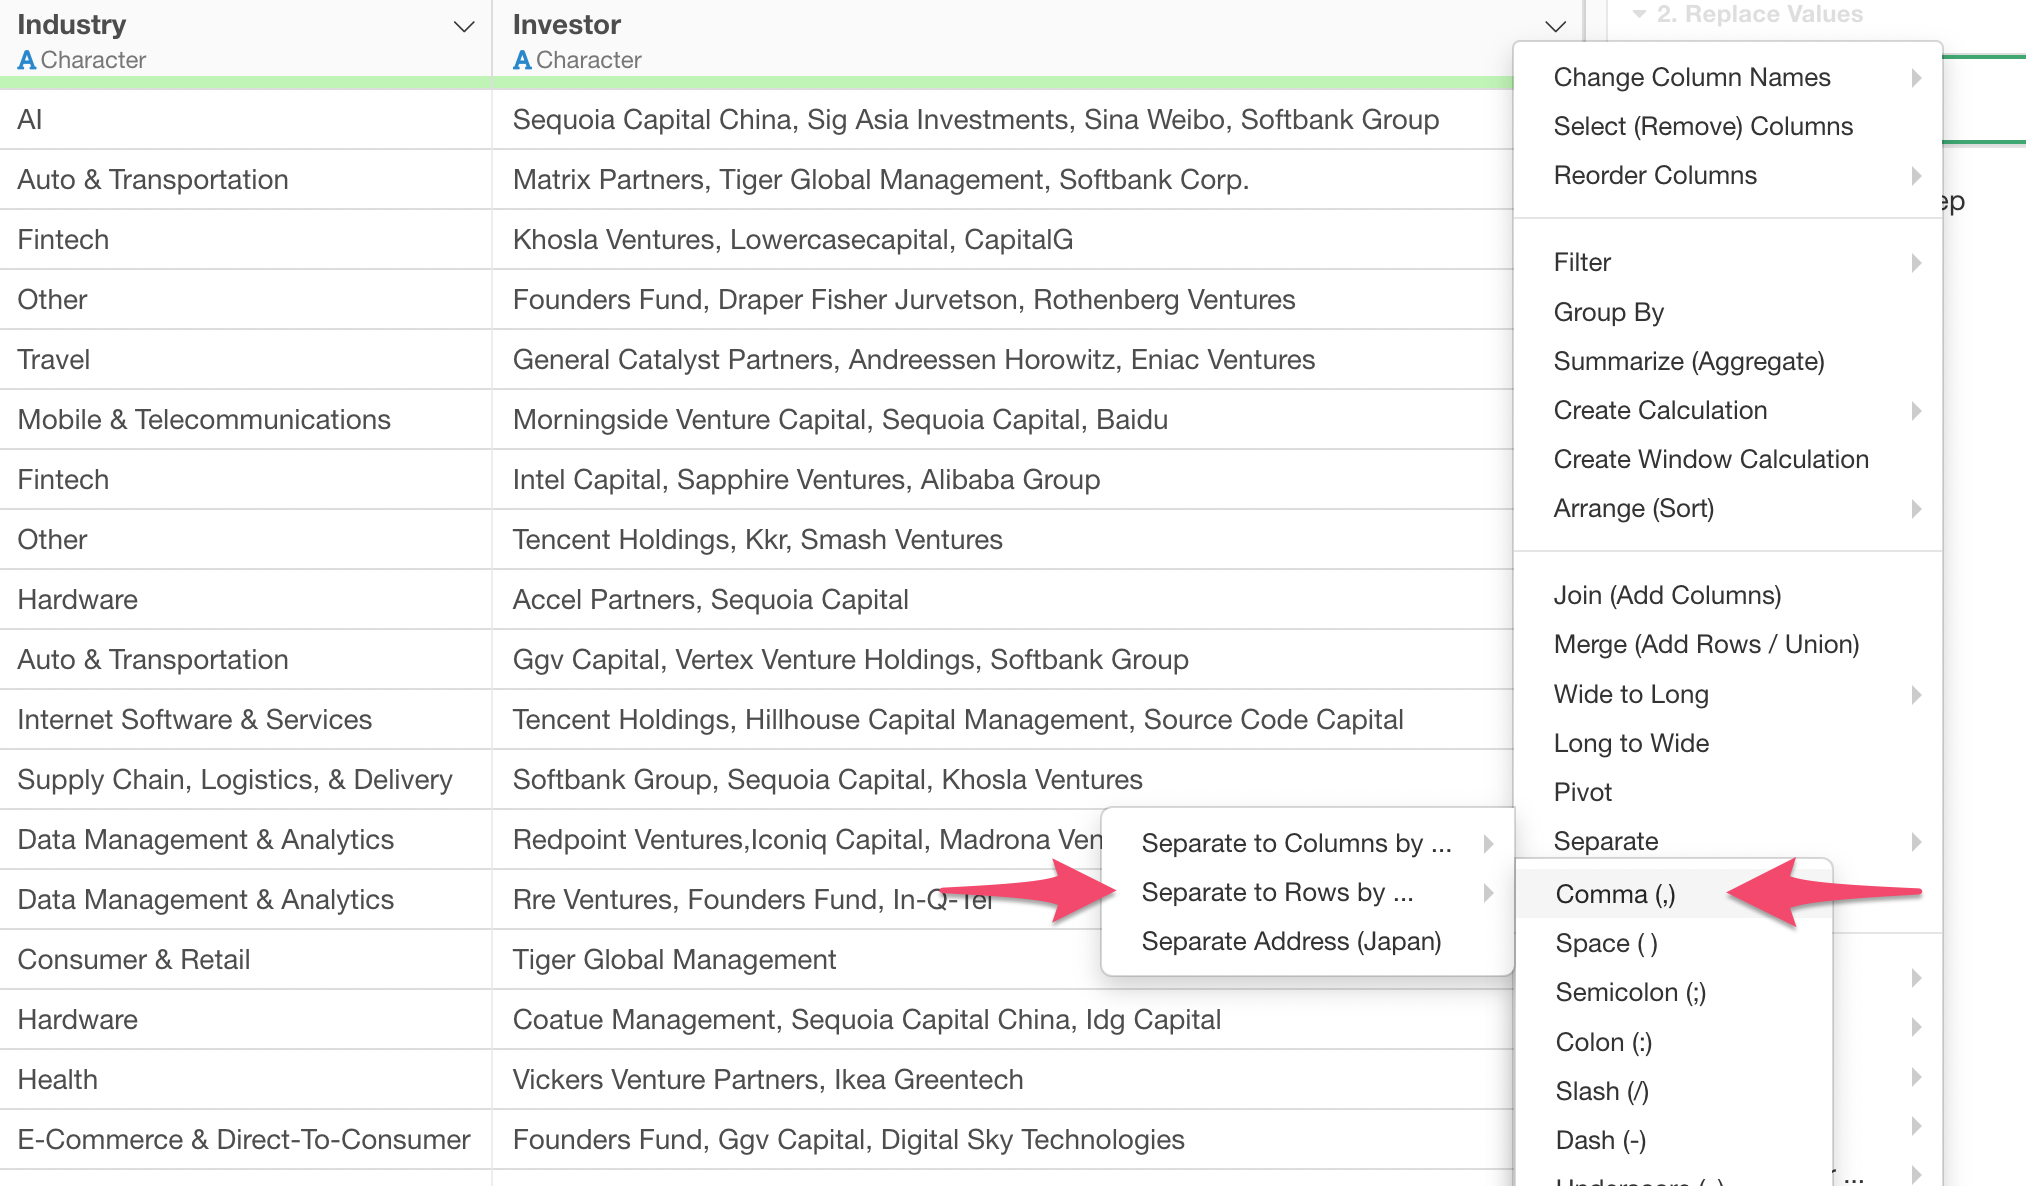
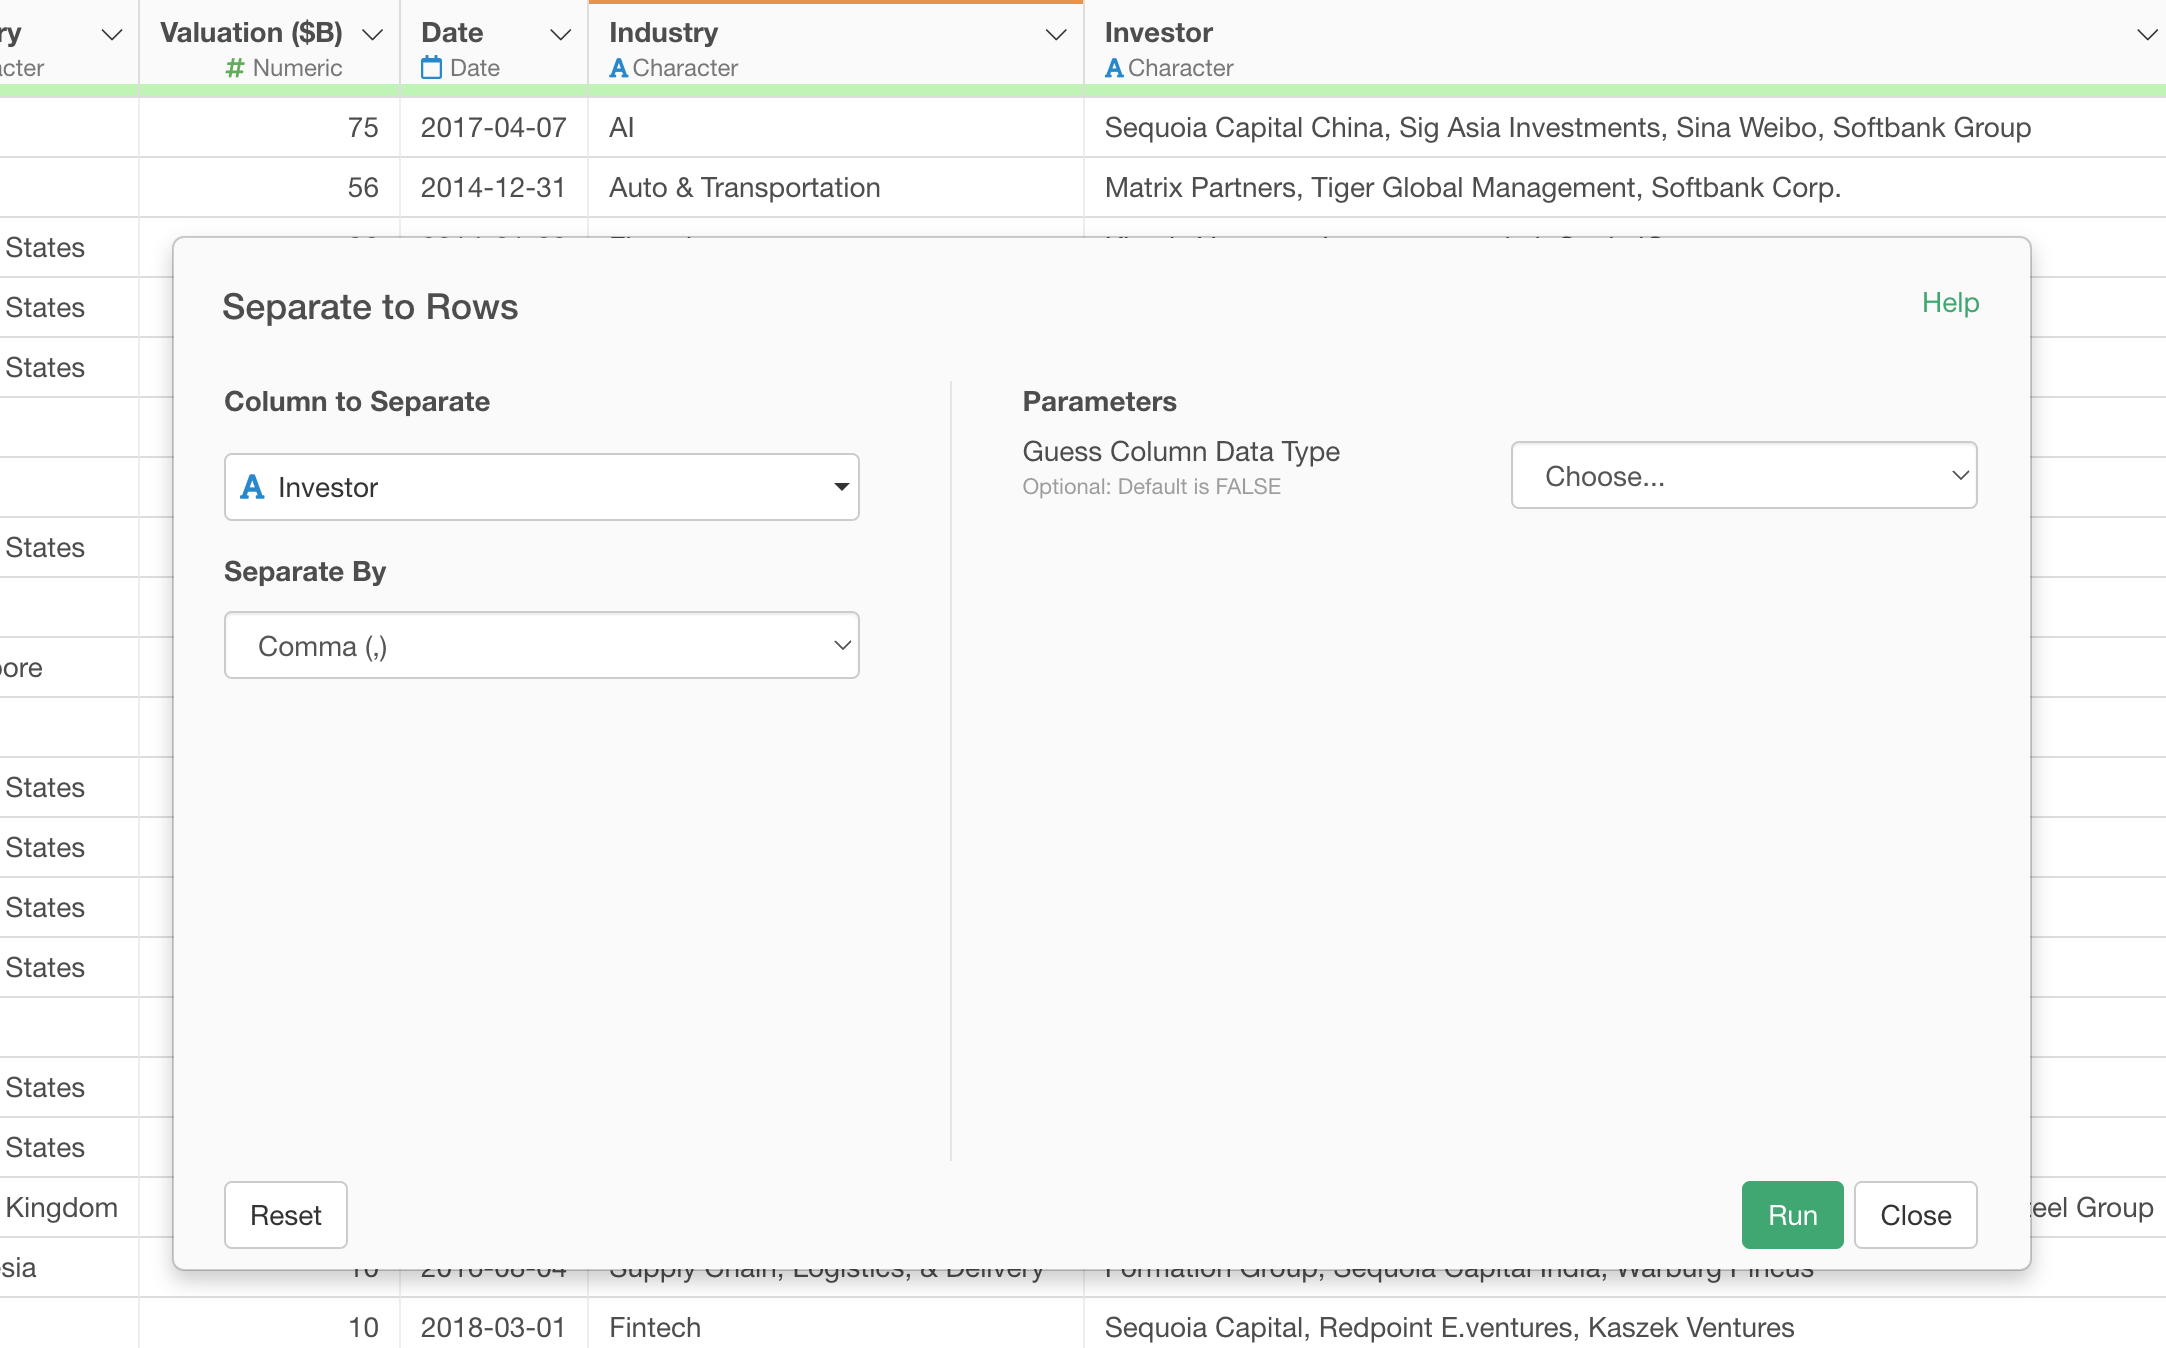
You can keep the parameters in the 'Separate to Rows' dialog, and click the Run button.
Now you can see each investor is presented into each row.
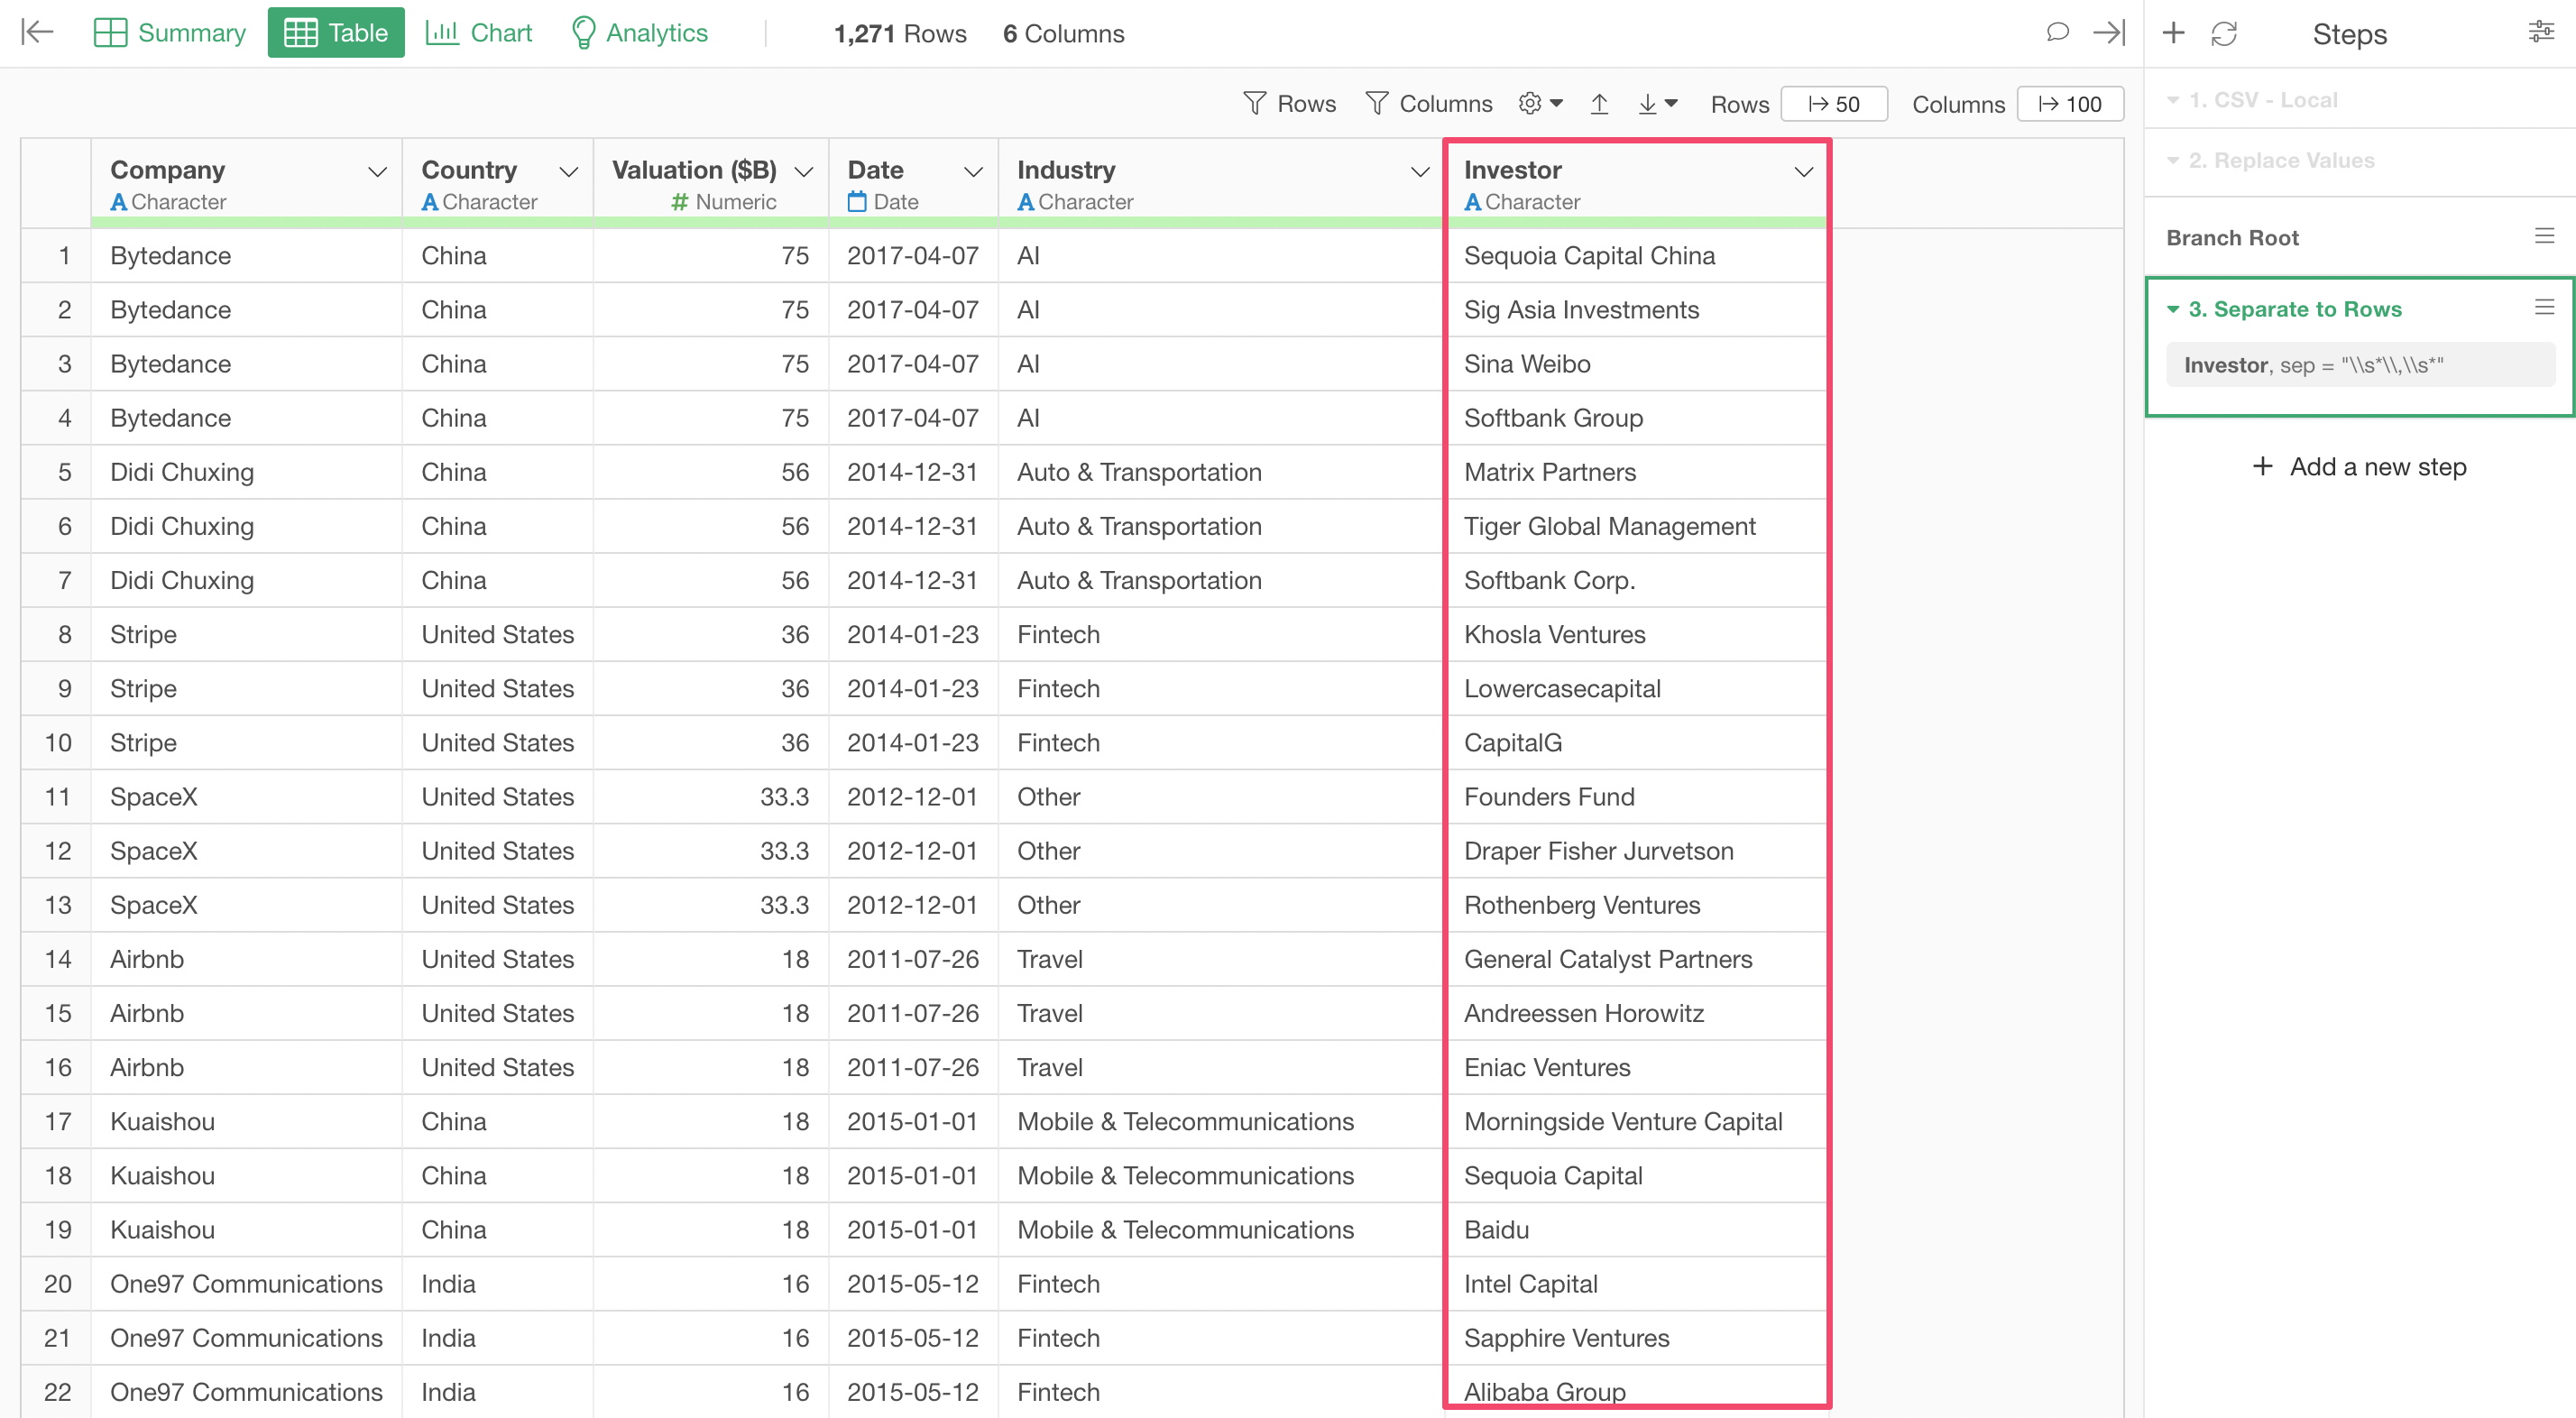
For example, 'Bytedance' company now has 4 rows with 4 different investor names.
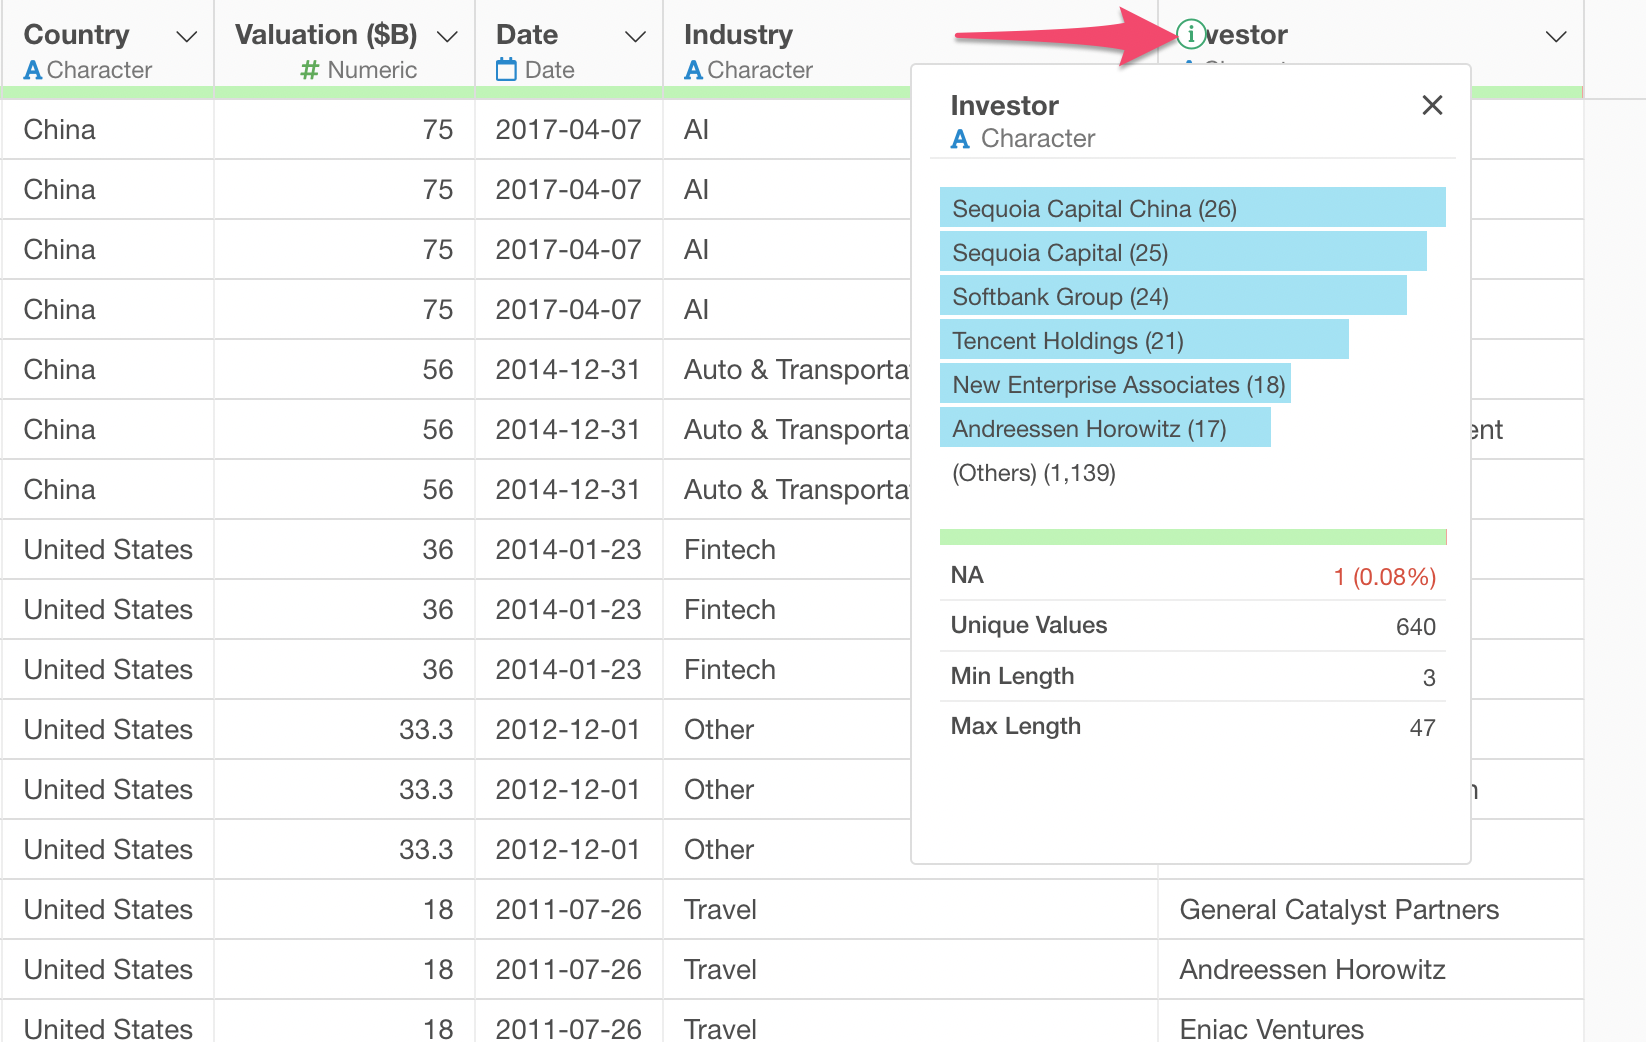
You can click on the Information icon at the Investor column header to see which investors have the most unicorns.
7. Clean Up Text Data
More often than not, text data has all sorts of clean up problems.
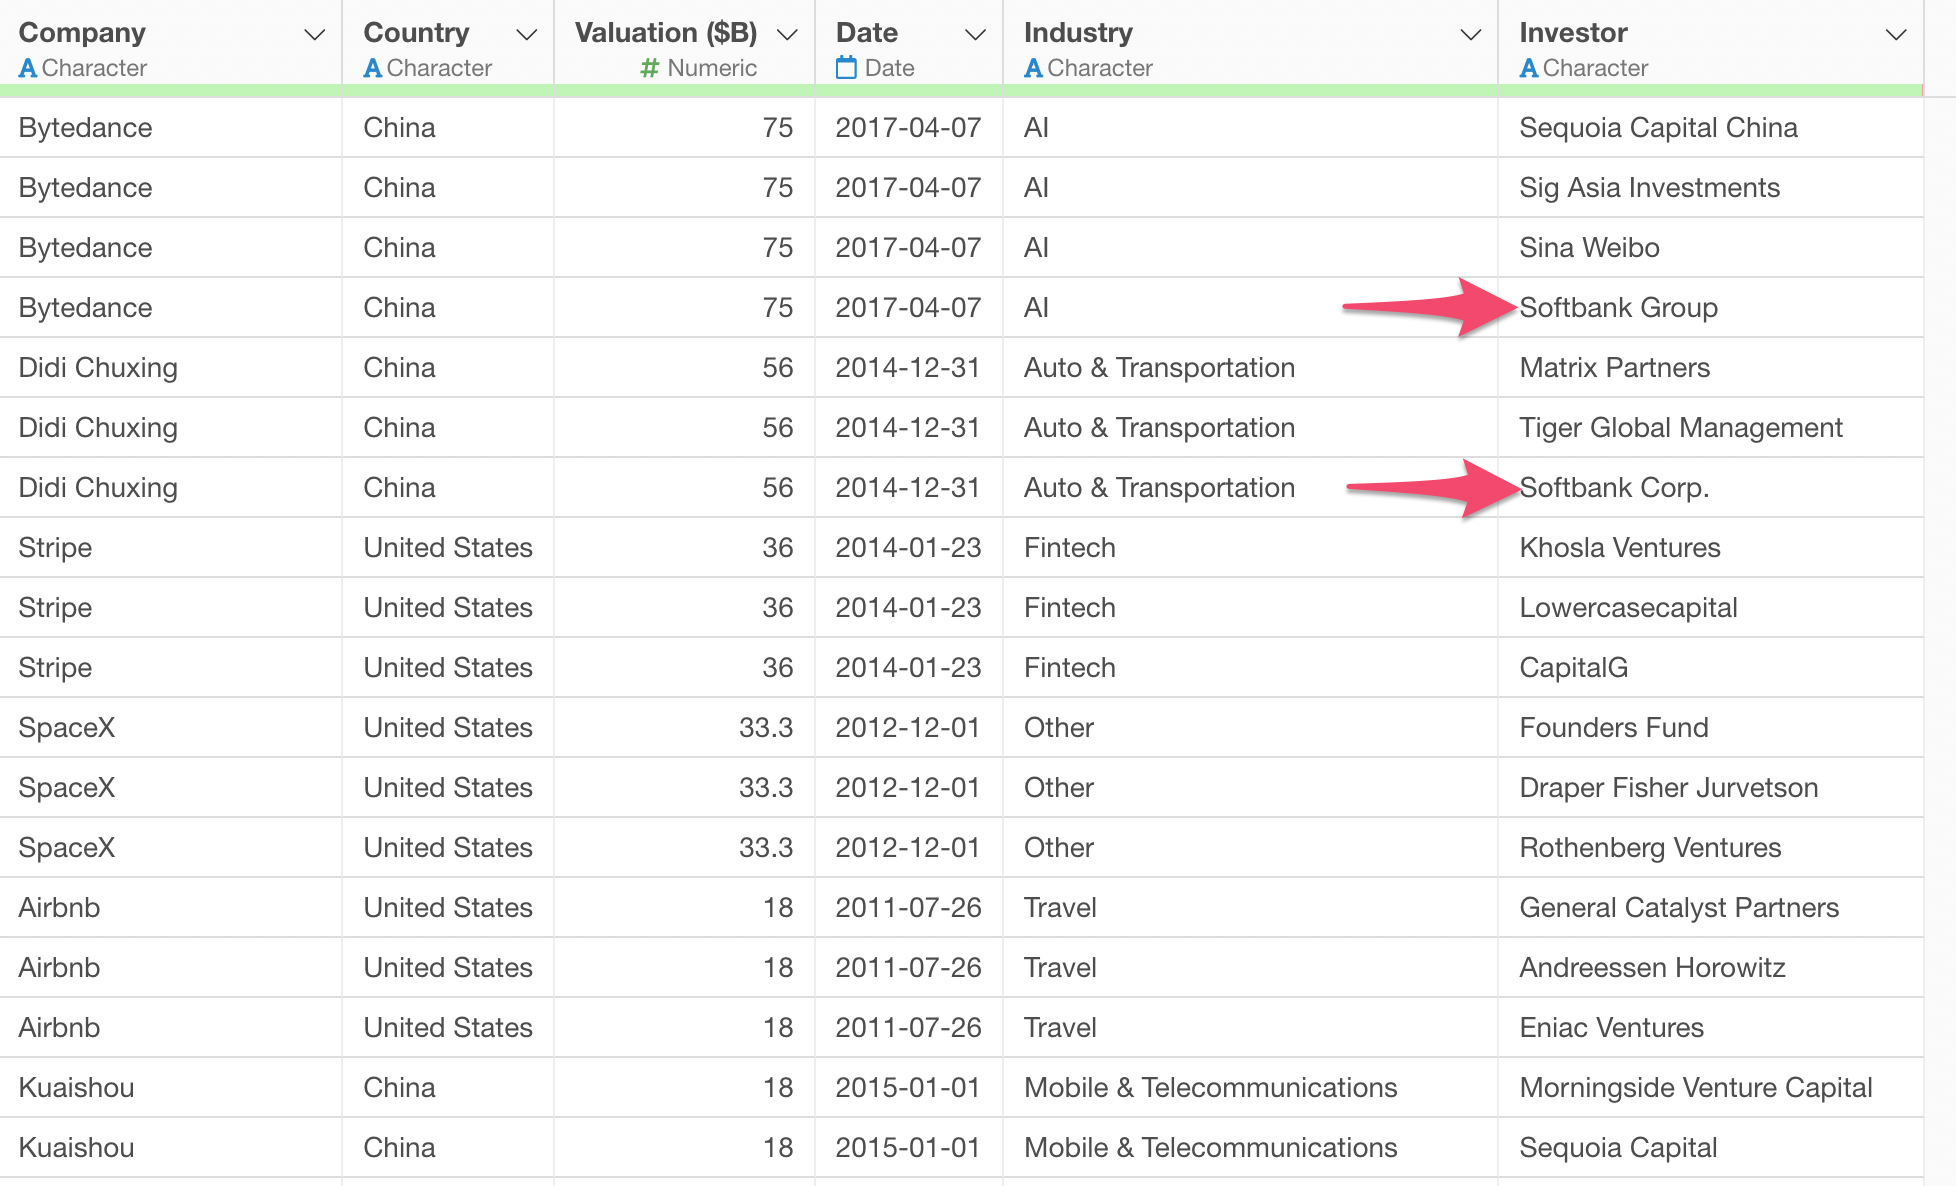
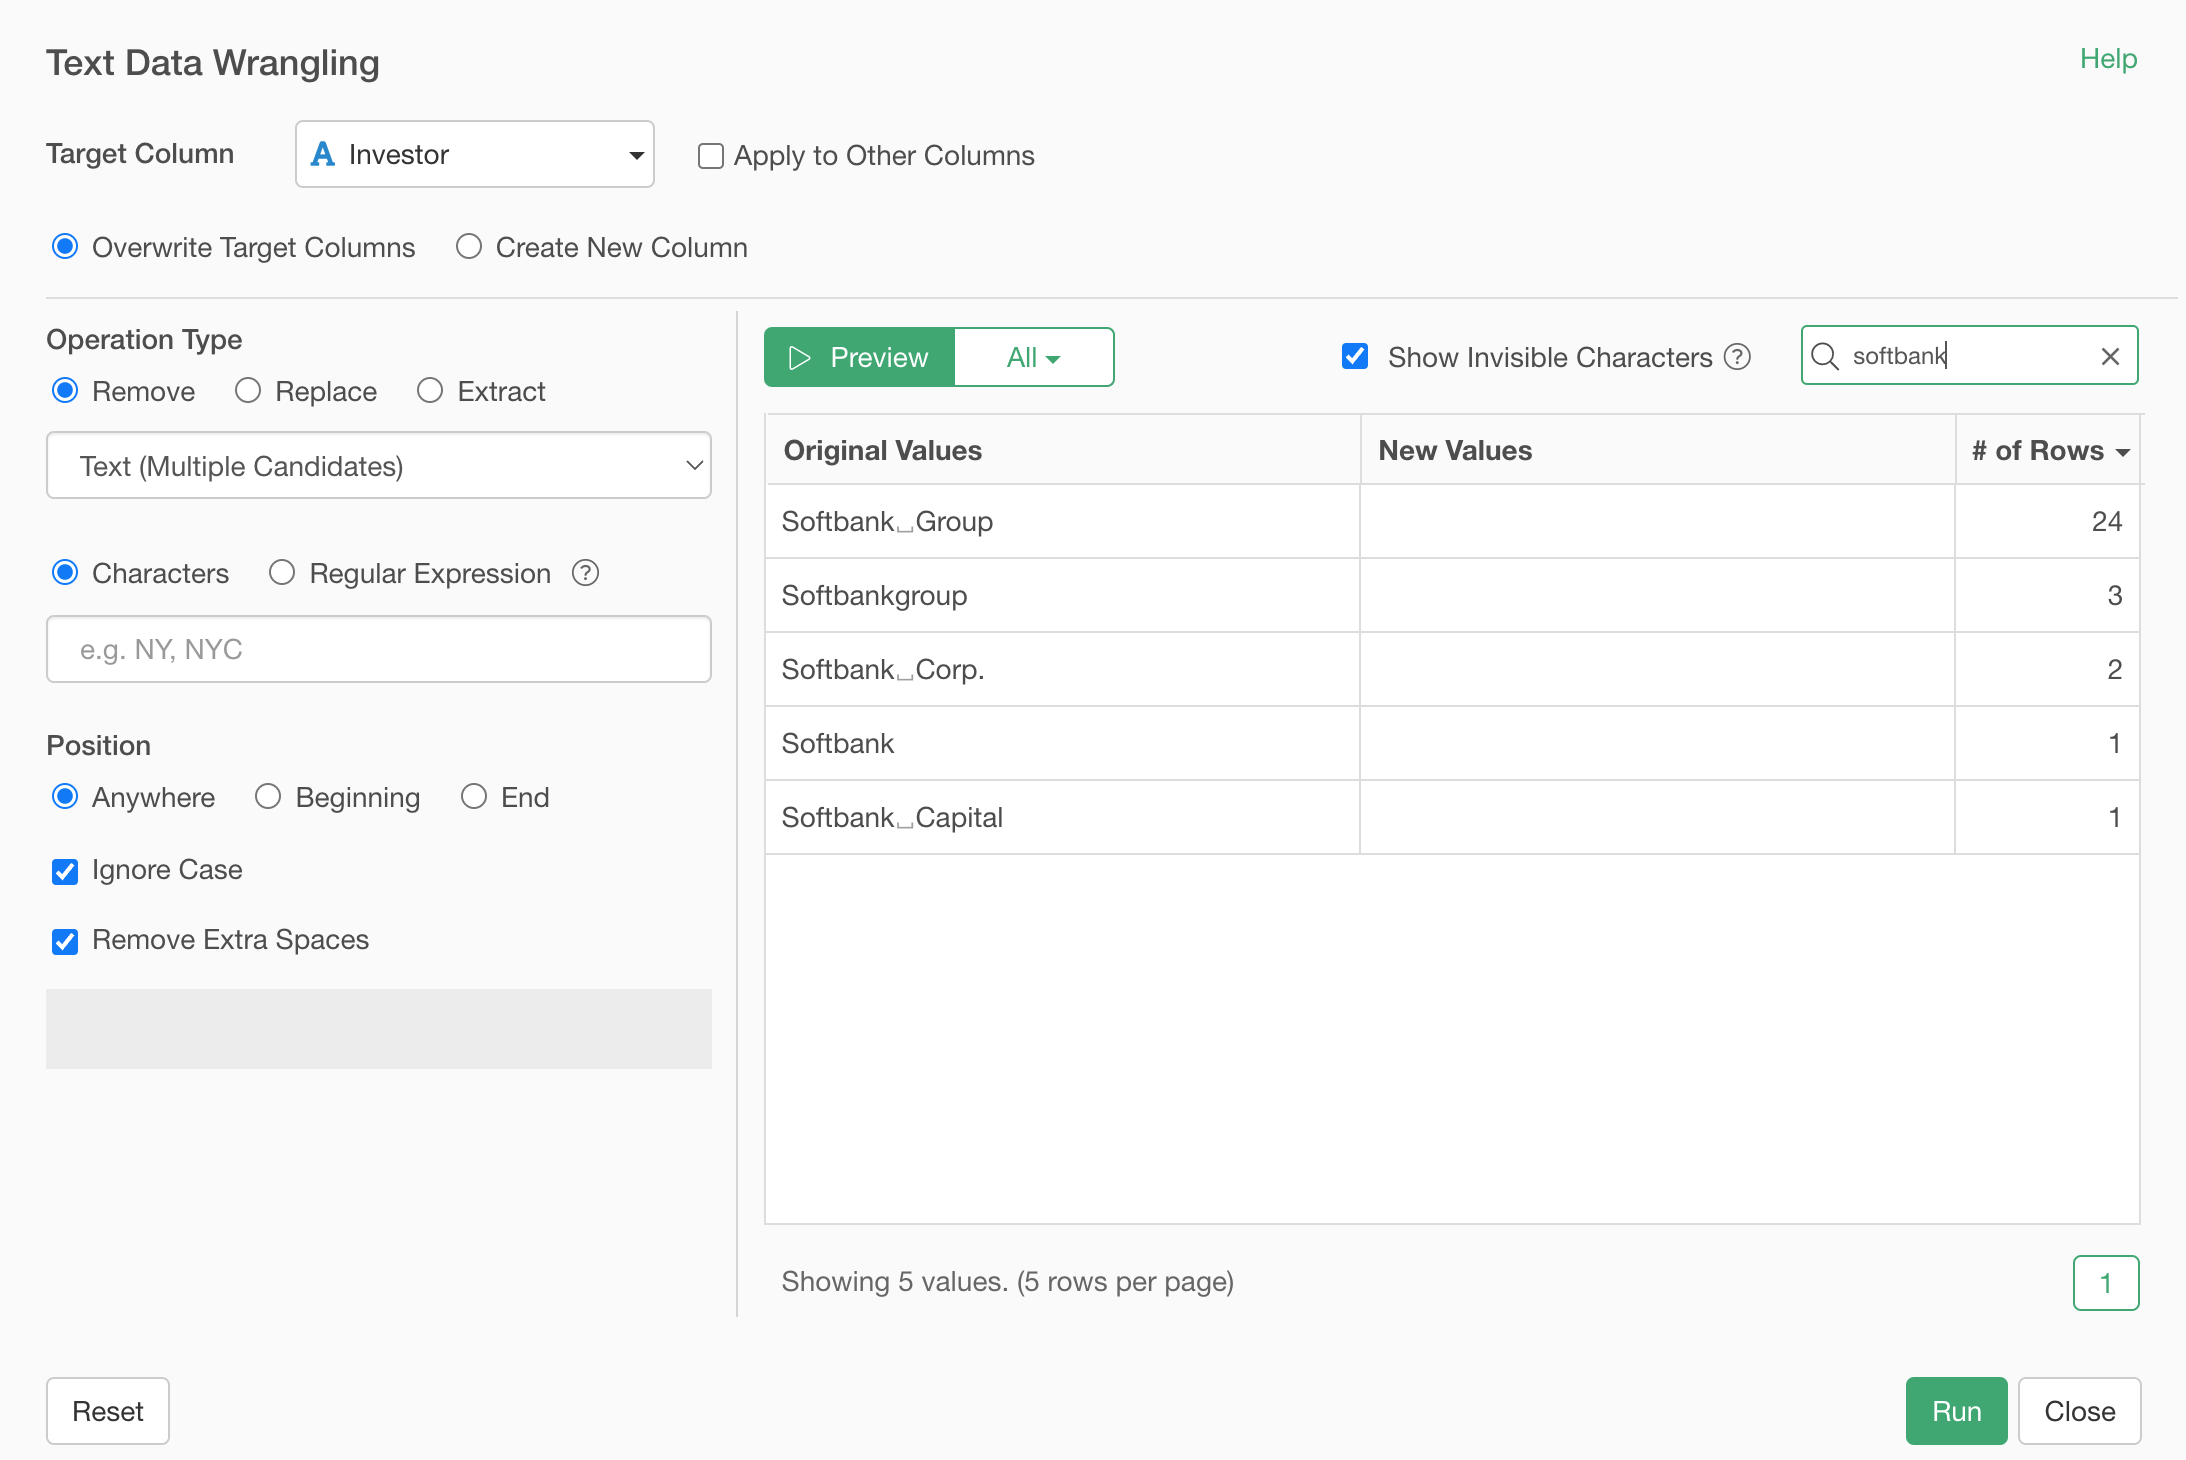
For example, take a look at the two 'Softbank' related values. One is 'Softbank Group' and another is 'Softbank Corp.'
It turned out that there are even more variations around 'Softbank' when you look at it with Summarize Table under the Chart view and filter the data with a condition of containing 'Softbank'.
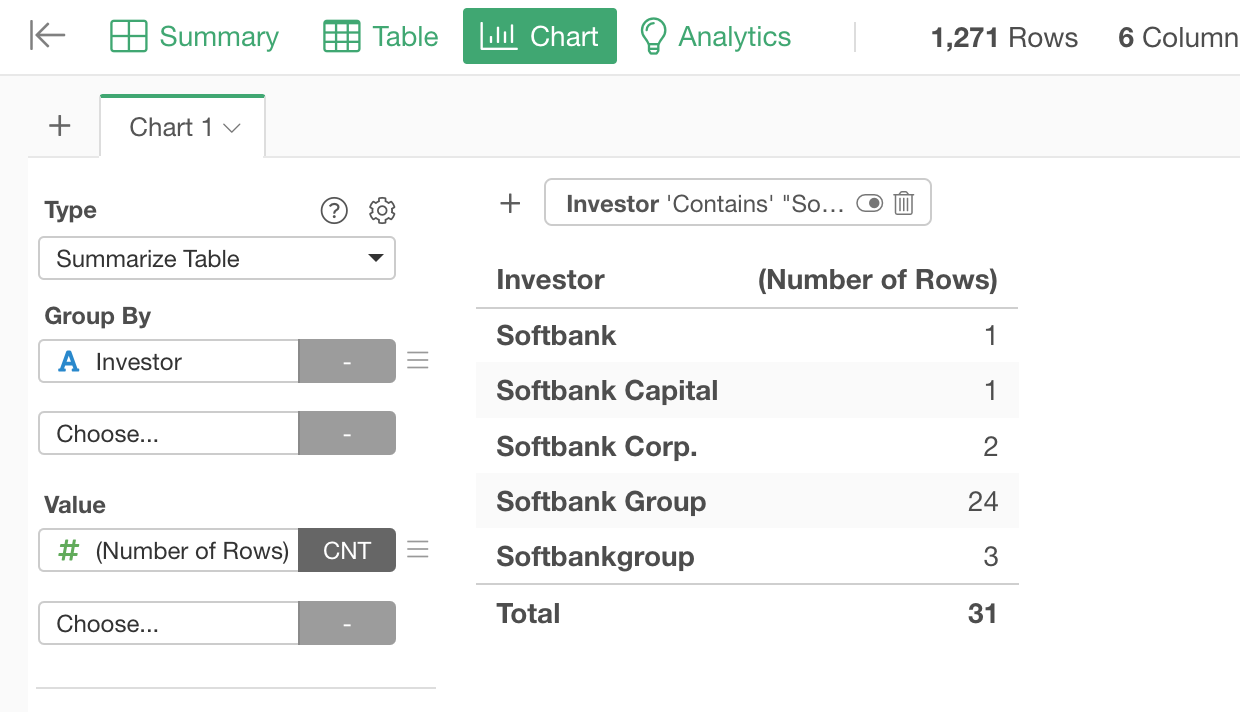
Most likely they are 'Softbank' related entities and we want to count them together as a same investor, so let's clean them up!
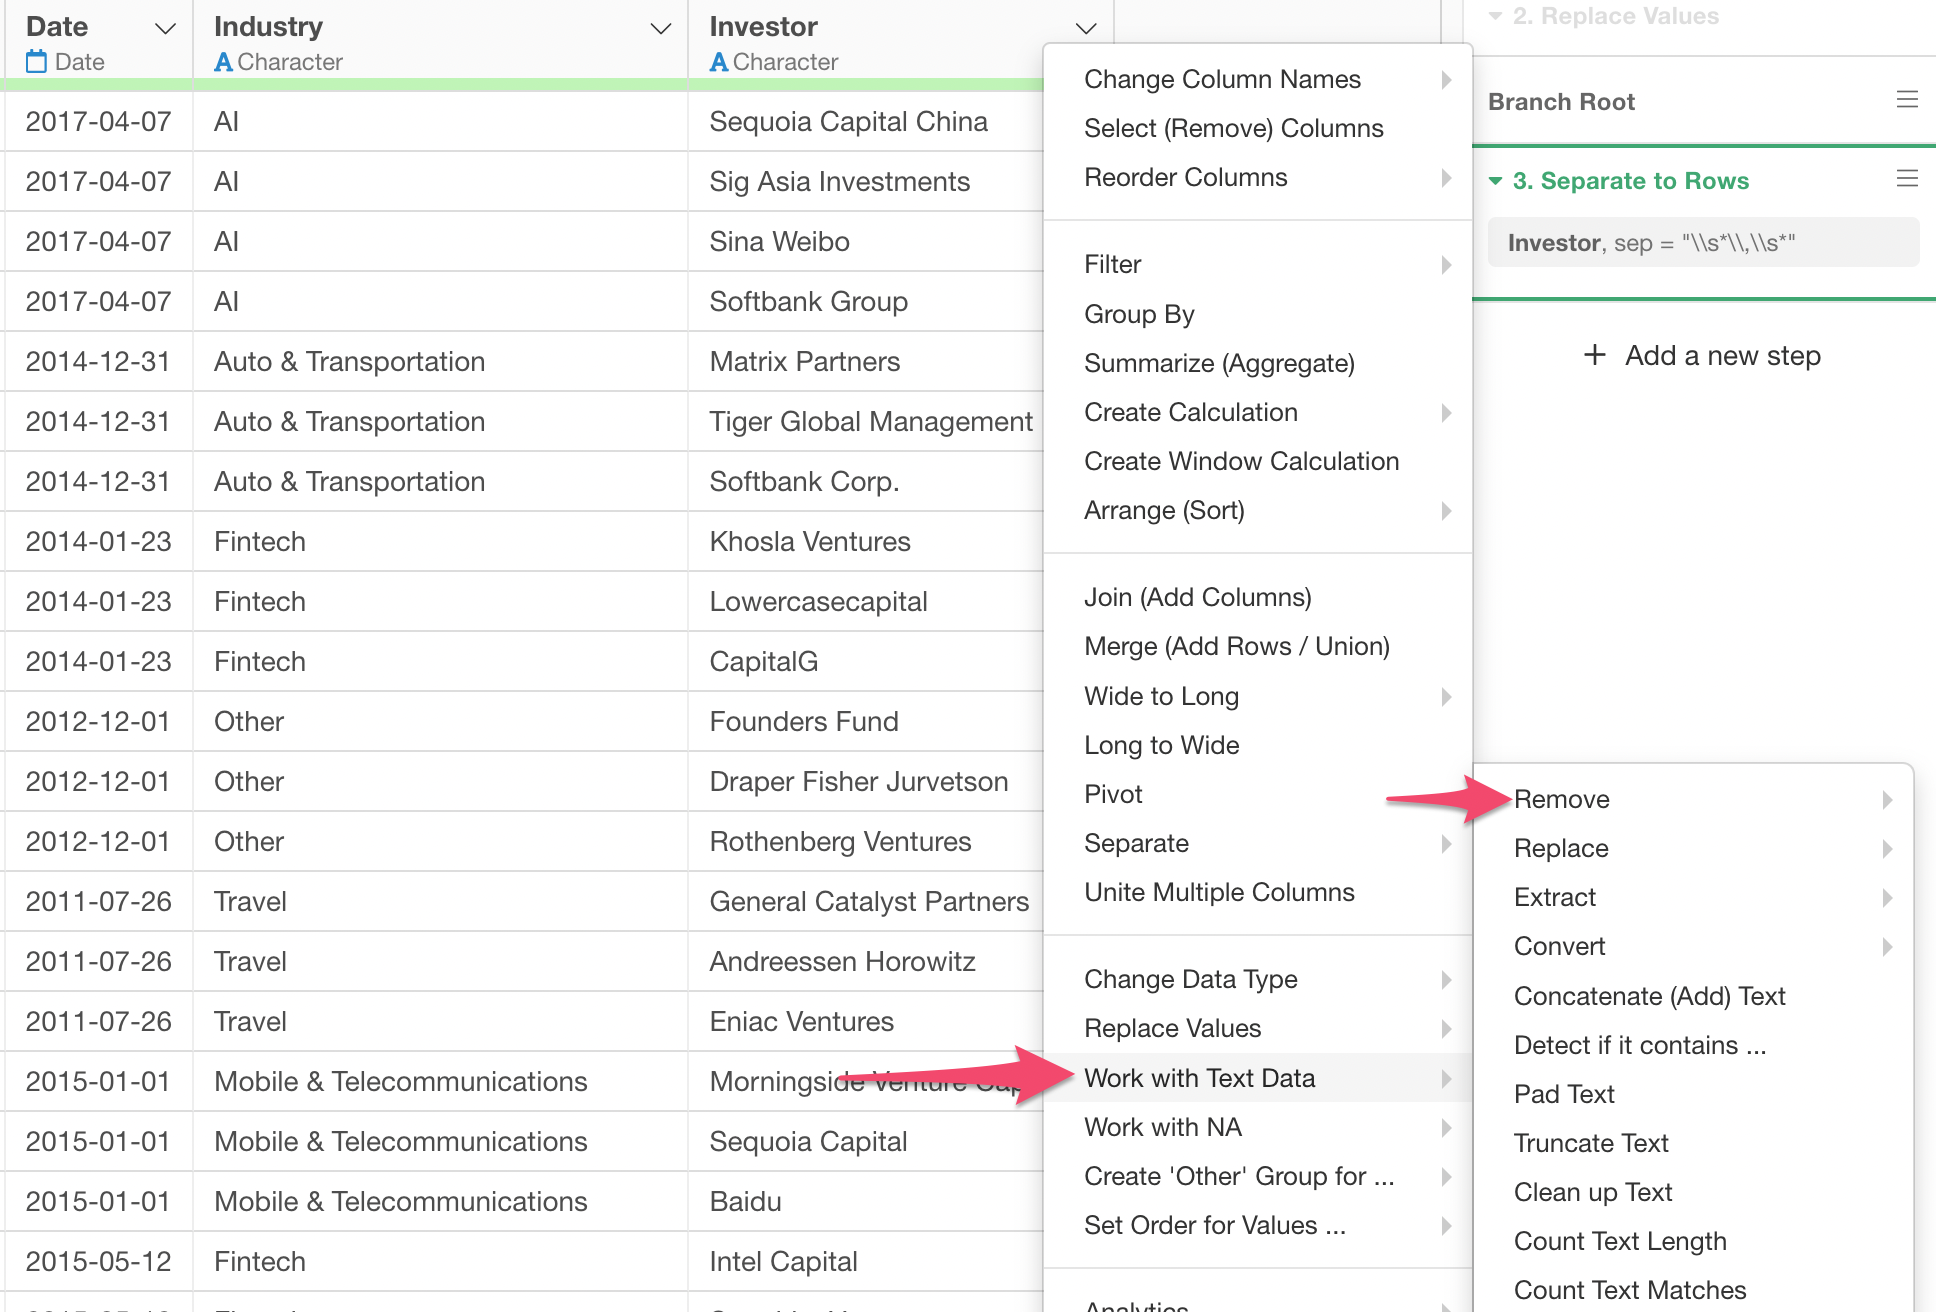
Select 'Work with Text Data', then 'Remove' from the column header menu of the Investor column.
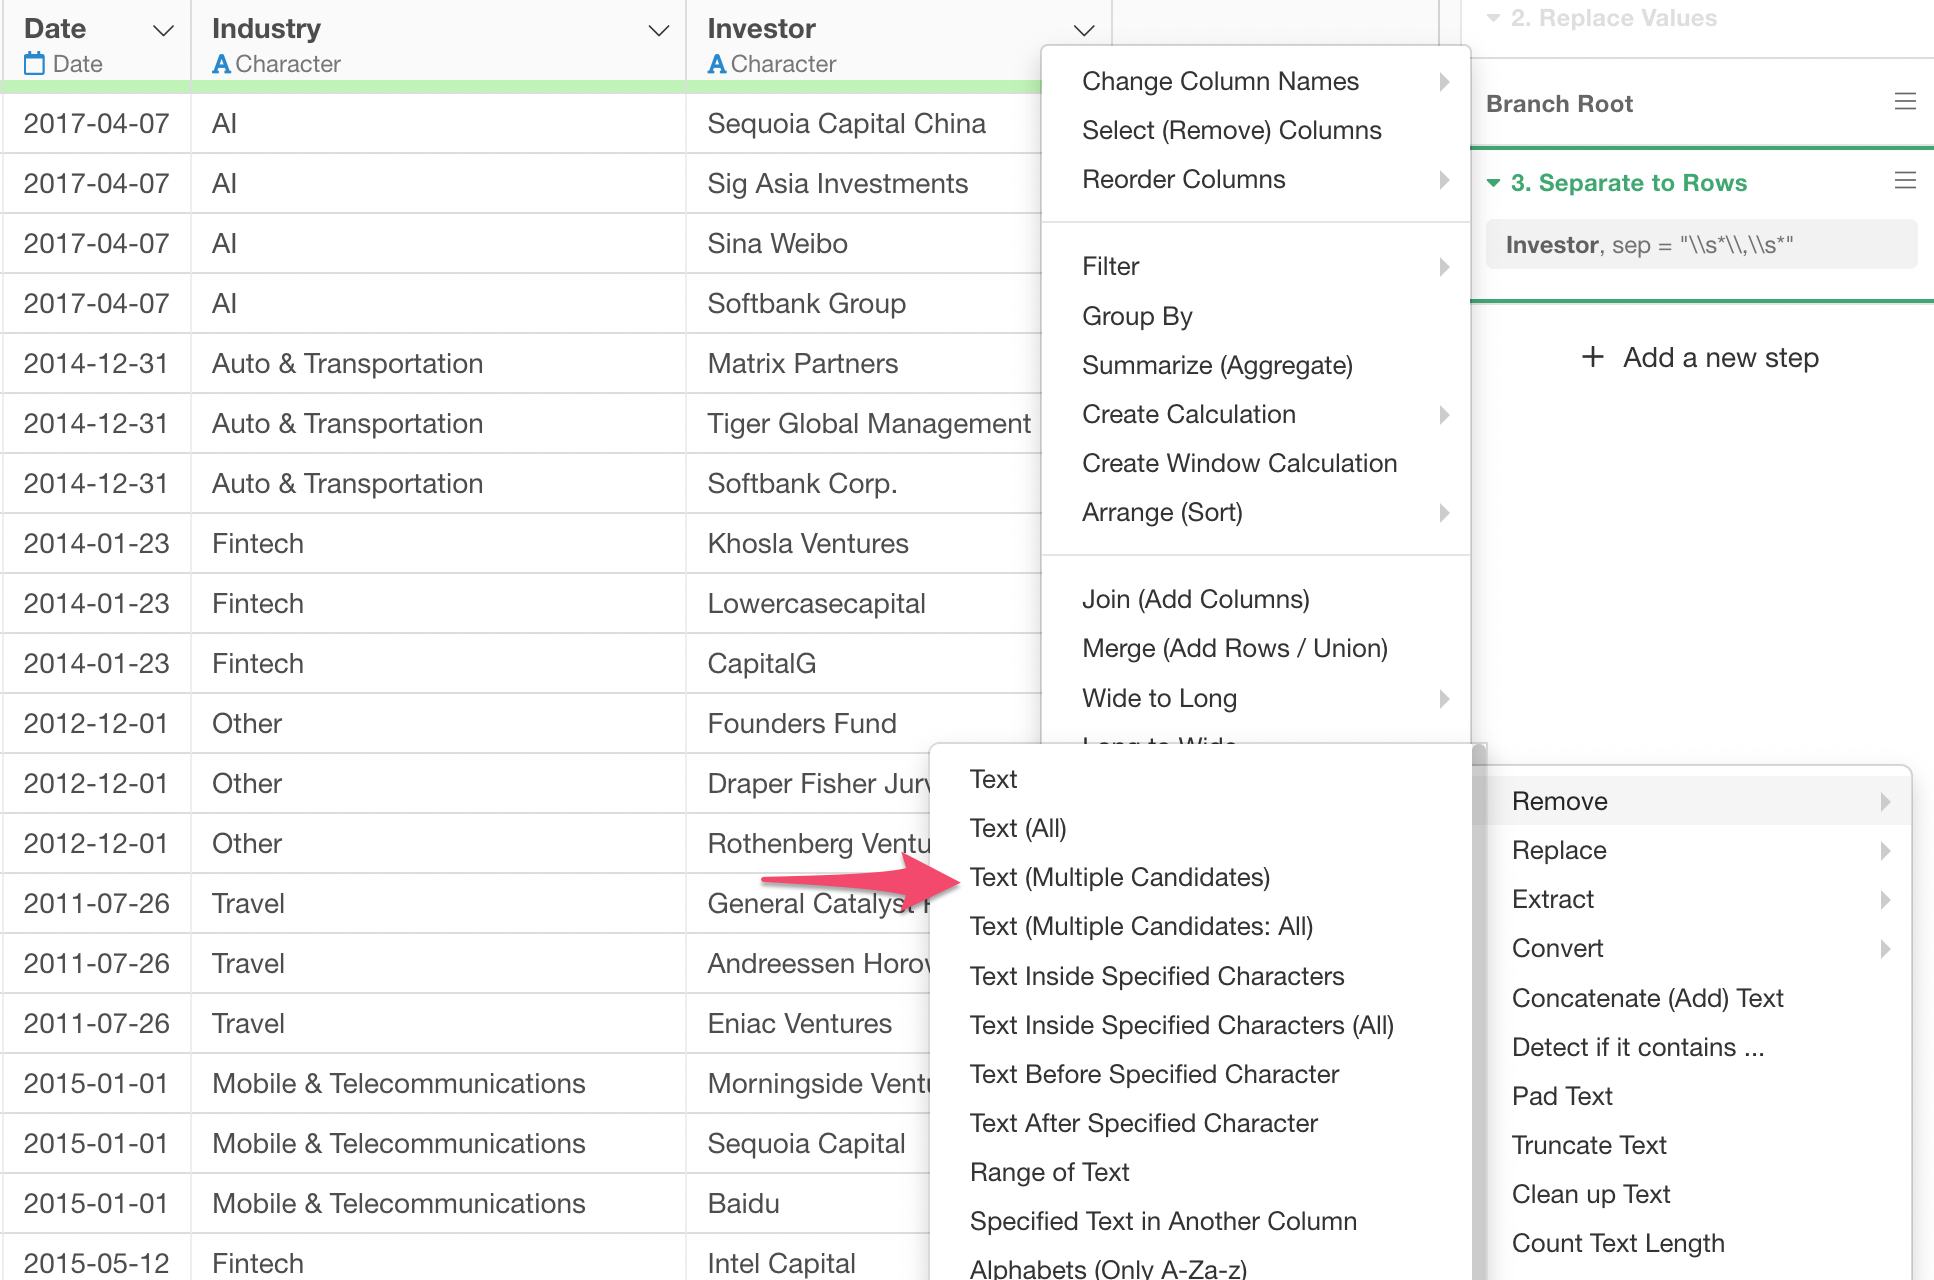
Then, select 'Text (Multiple Candidates)'. You can fix this selection later, so no worry about picking the 'right' menu.
In the Text Data Wrangling dialog, type in 'softbank' at the search text box at the right hand side above the preview table, in order to see all the Softbank related entries.
And type the following 3 entries separated by comma.
Group, Corp., Capital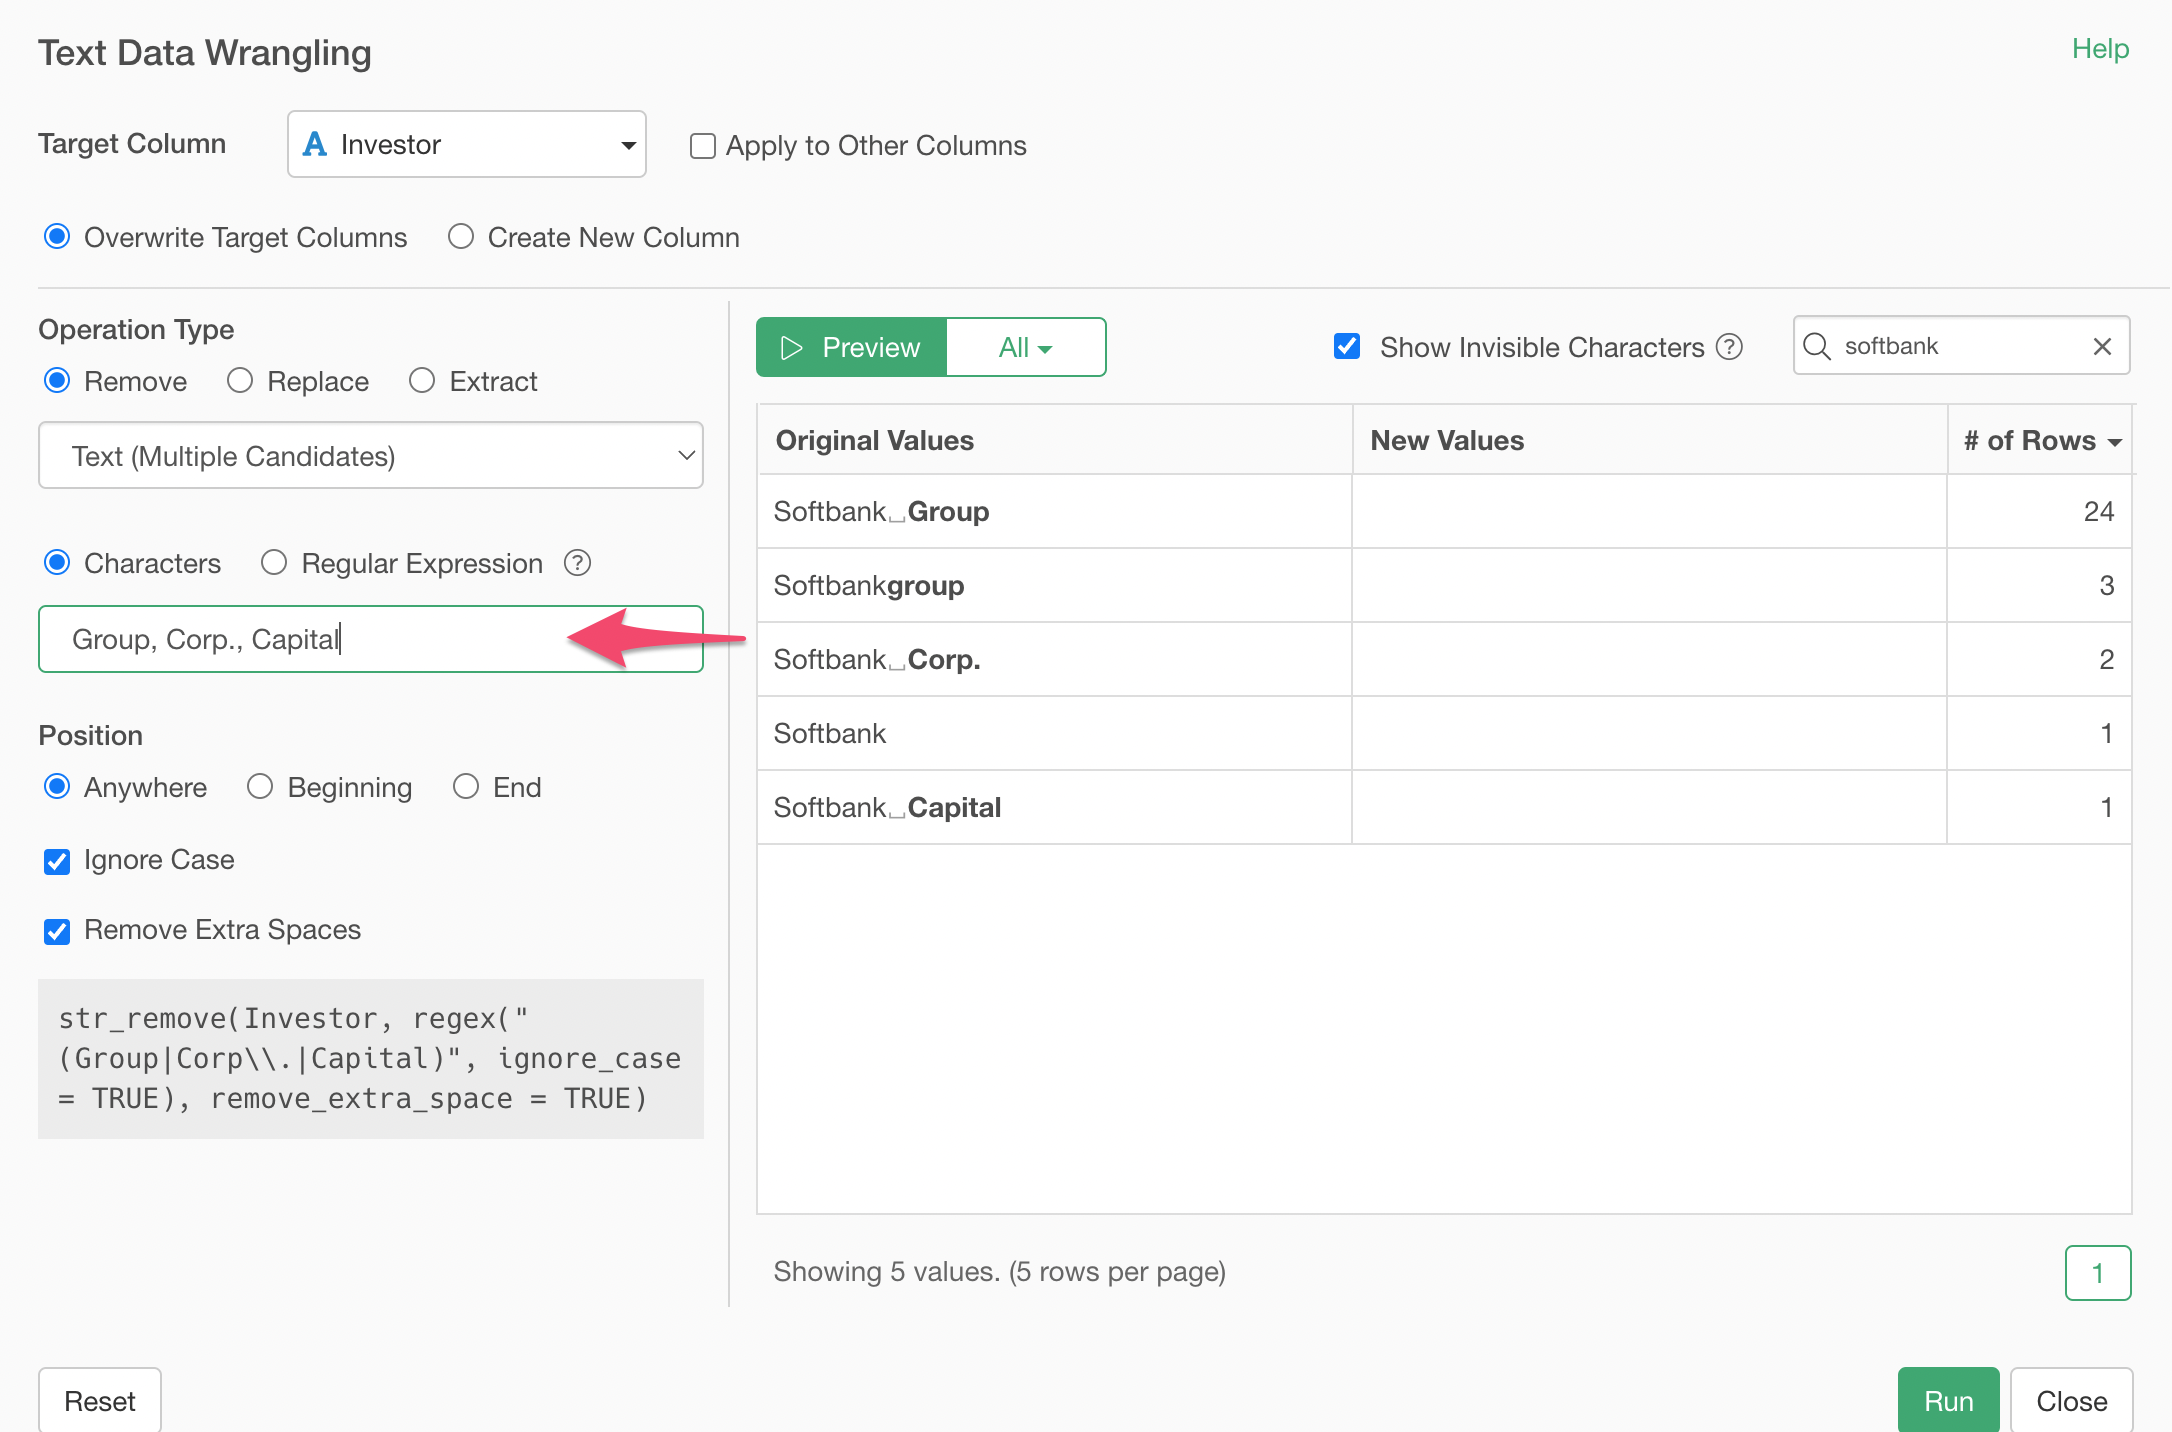
And click on the Preview button.
You will see that all the Softbank entries got cleaned up!

Two things to note.
First, because the 'Ignore Case' option is checked by default it matches those candidate text in a case insensitive way.
Second, because 'Remove Extra Spaces' is checked by default it removes any extra spaces at the beginning or at the ending of the remained text. This is why you don't see any extra space after 'Softbank' after removing word like 'Group'.
Now, remove the 'Softbank' search text at the right hand side top of the preview table and see how other values are also updated.
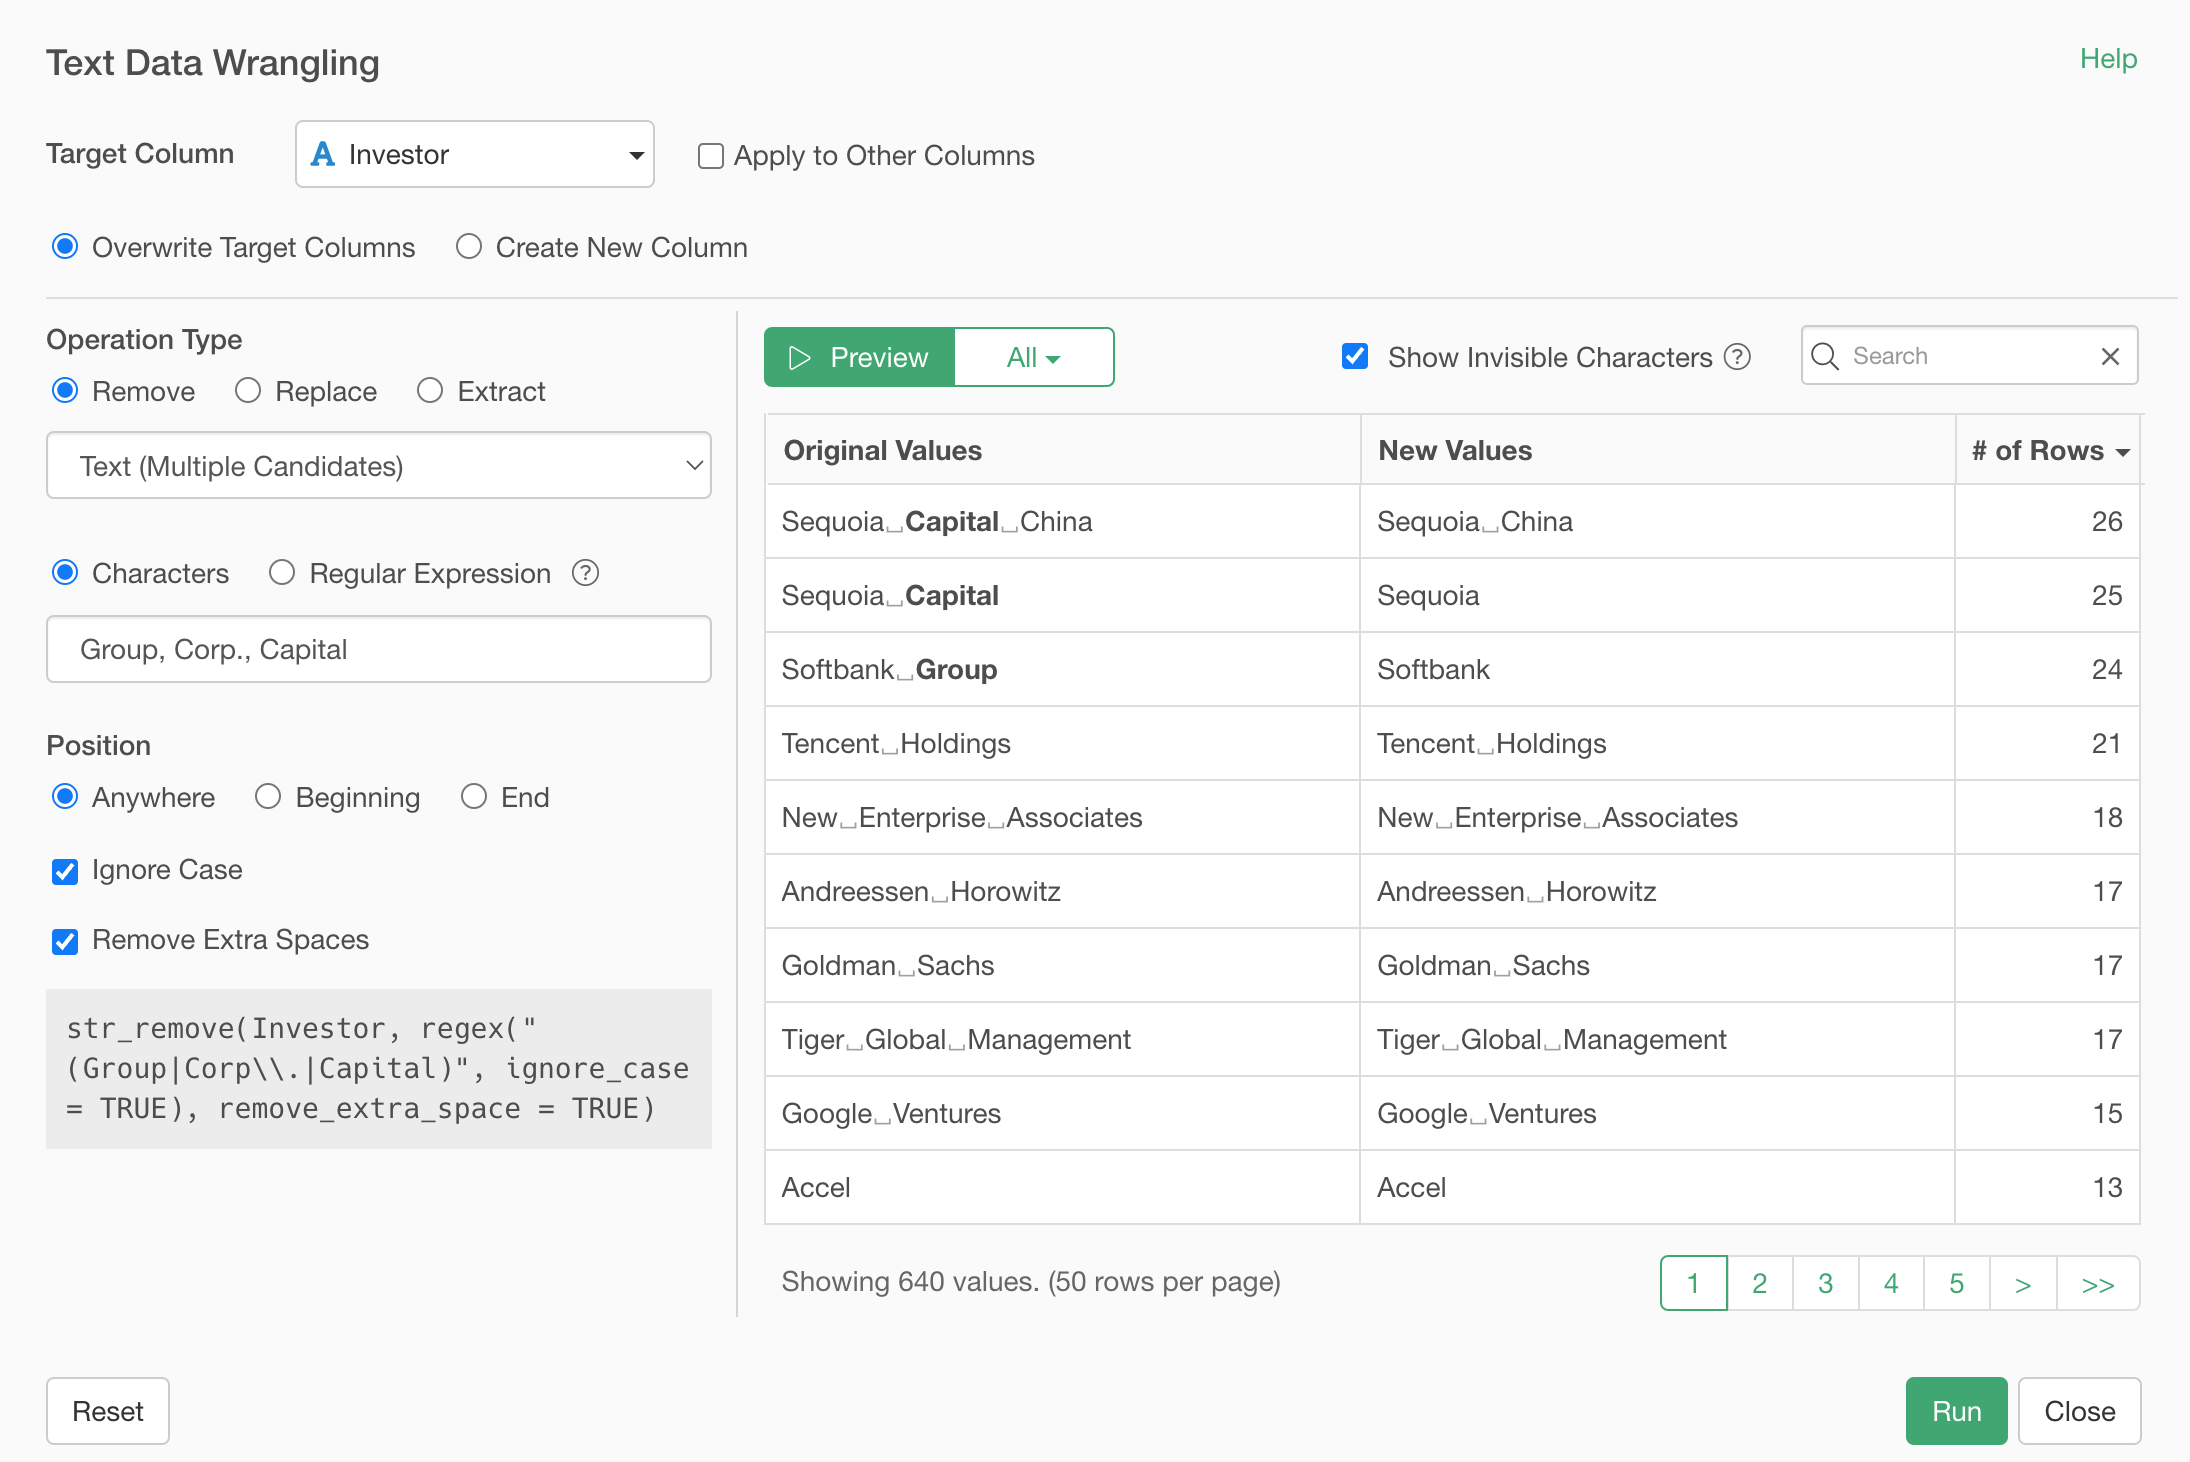
When you scroll down you'll notice that there is one entry looking strange. 'CapitalG' has been updated as 'G', which doesn't make any sense.
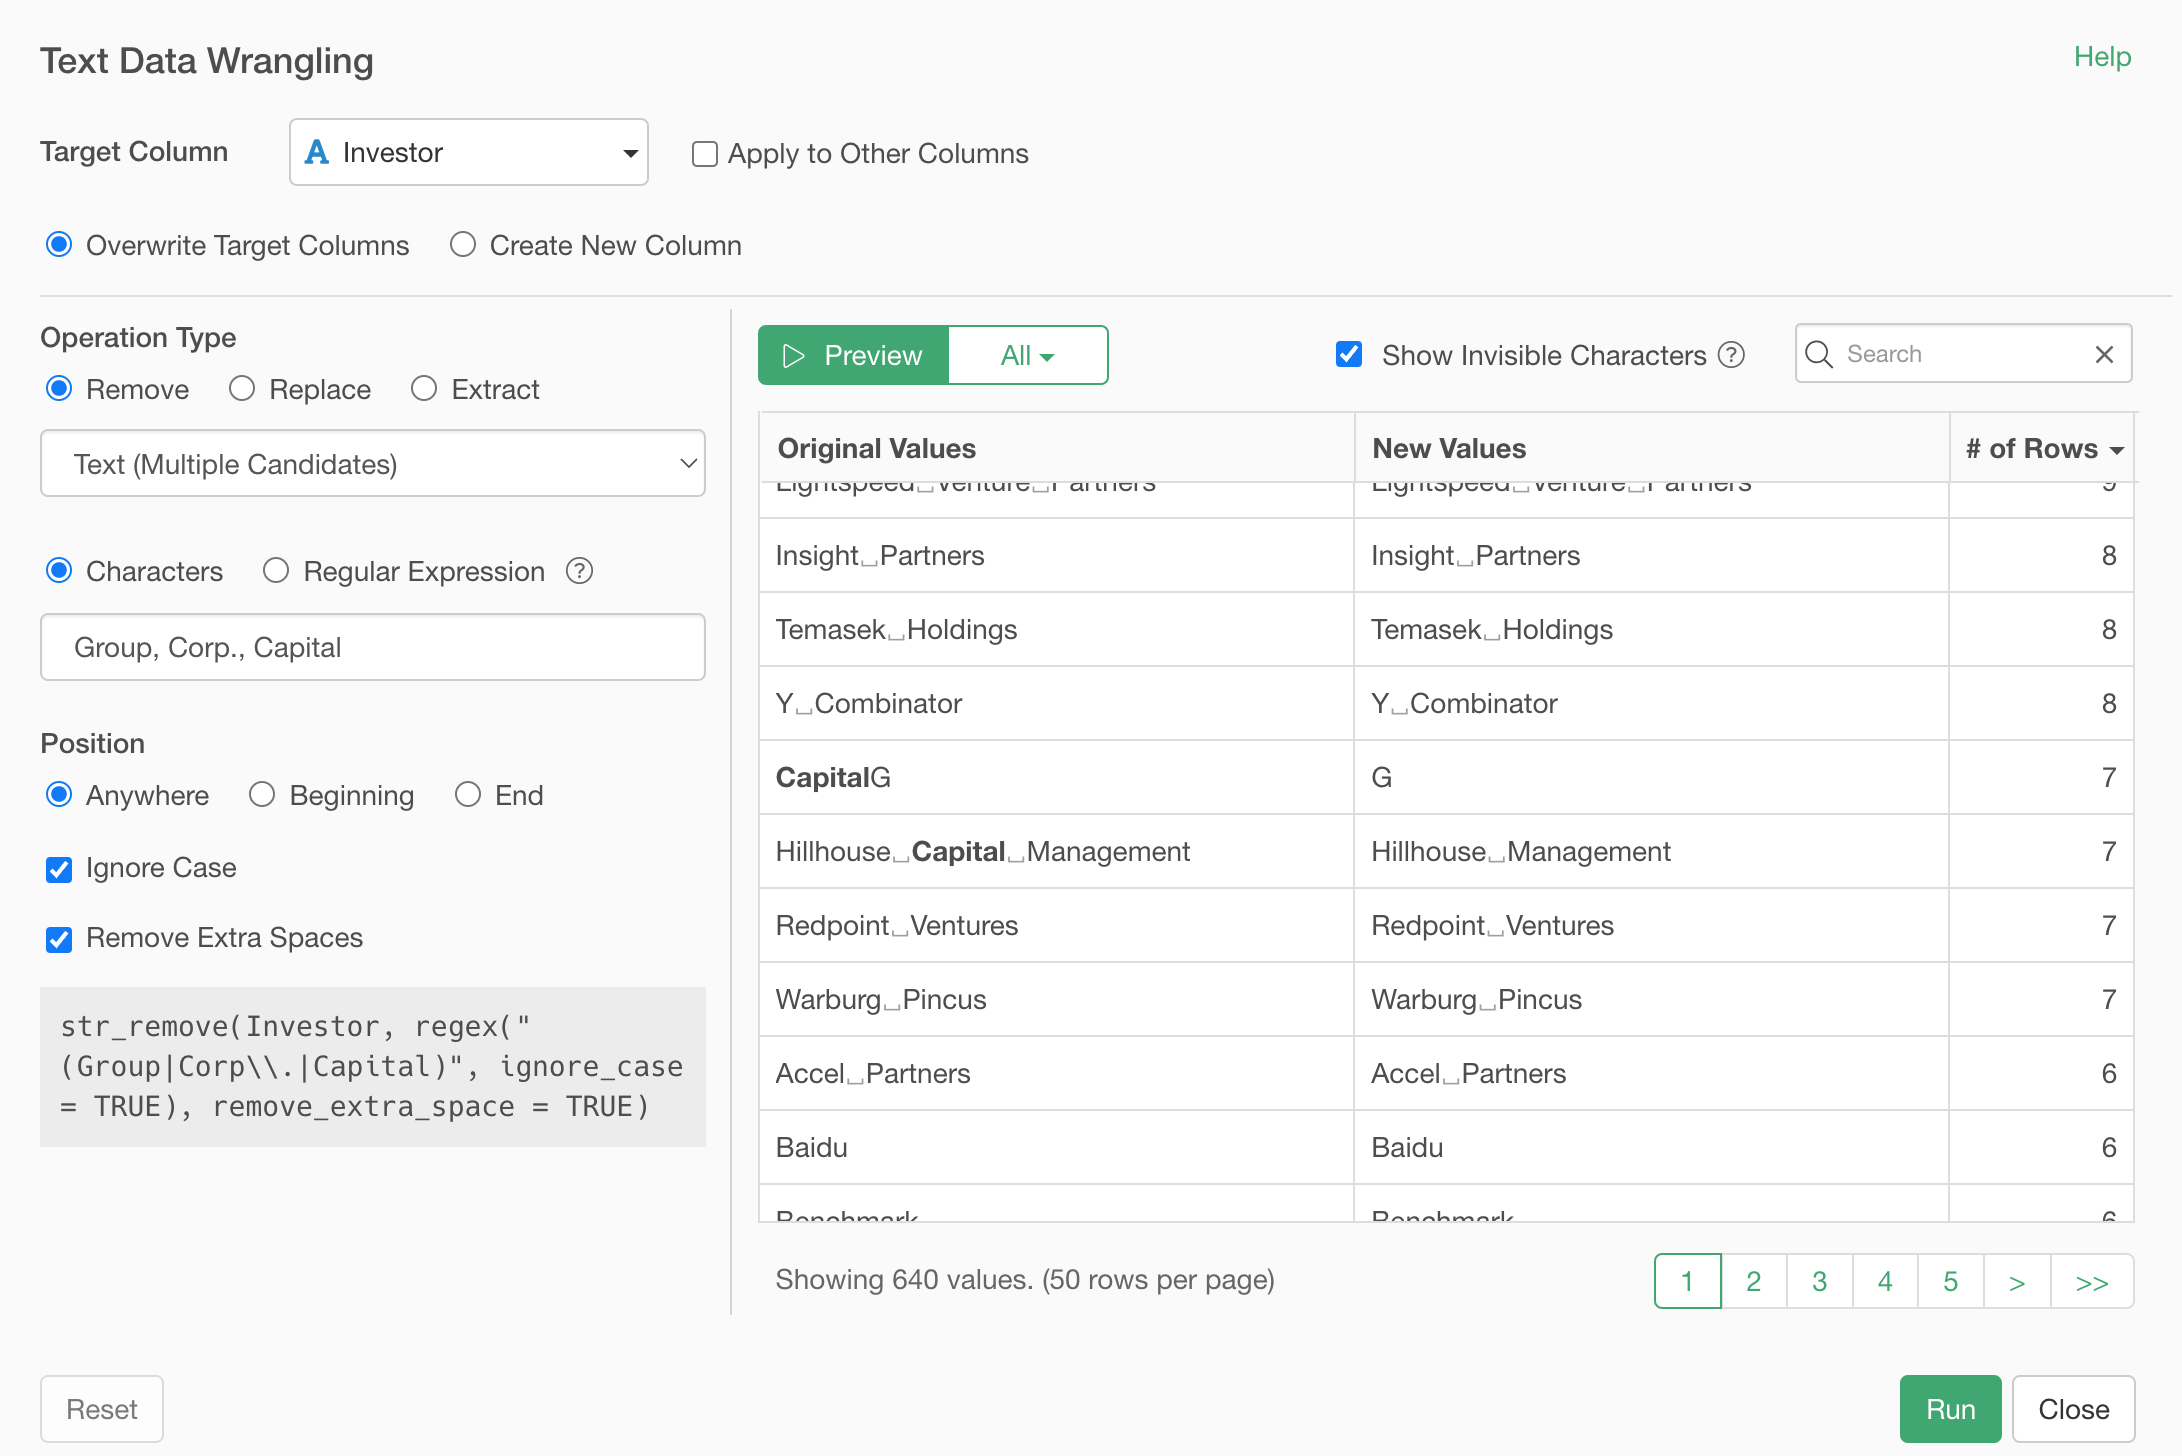
The problem is that one of the removing candidate words is 'Capital' and it removes it out of 'CapitalG'. We can avoid this by specifying where to find the 'Capital' in the text value.
In this case, we want to remove those removing candidate words only when they are presented at the end of the word.
Click 'End' as the Position, and click on the Preview button.
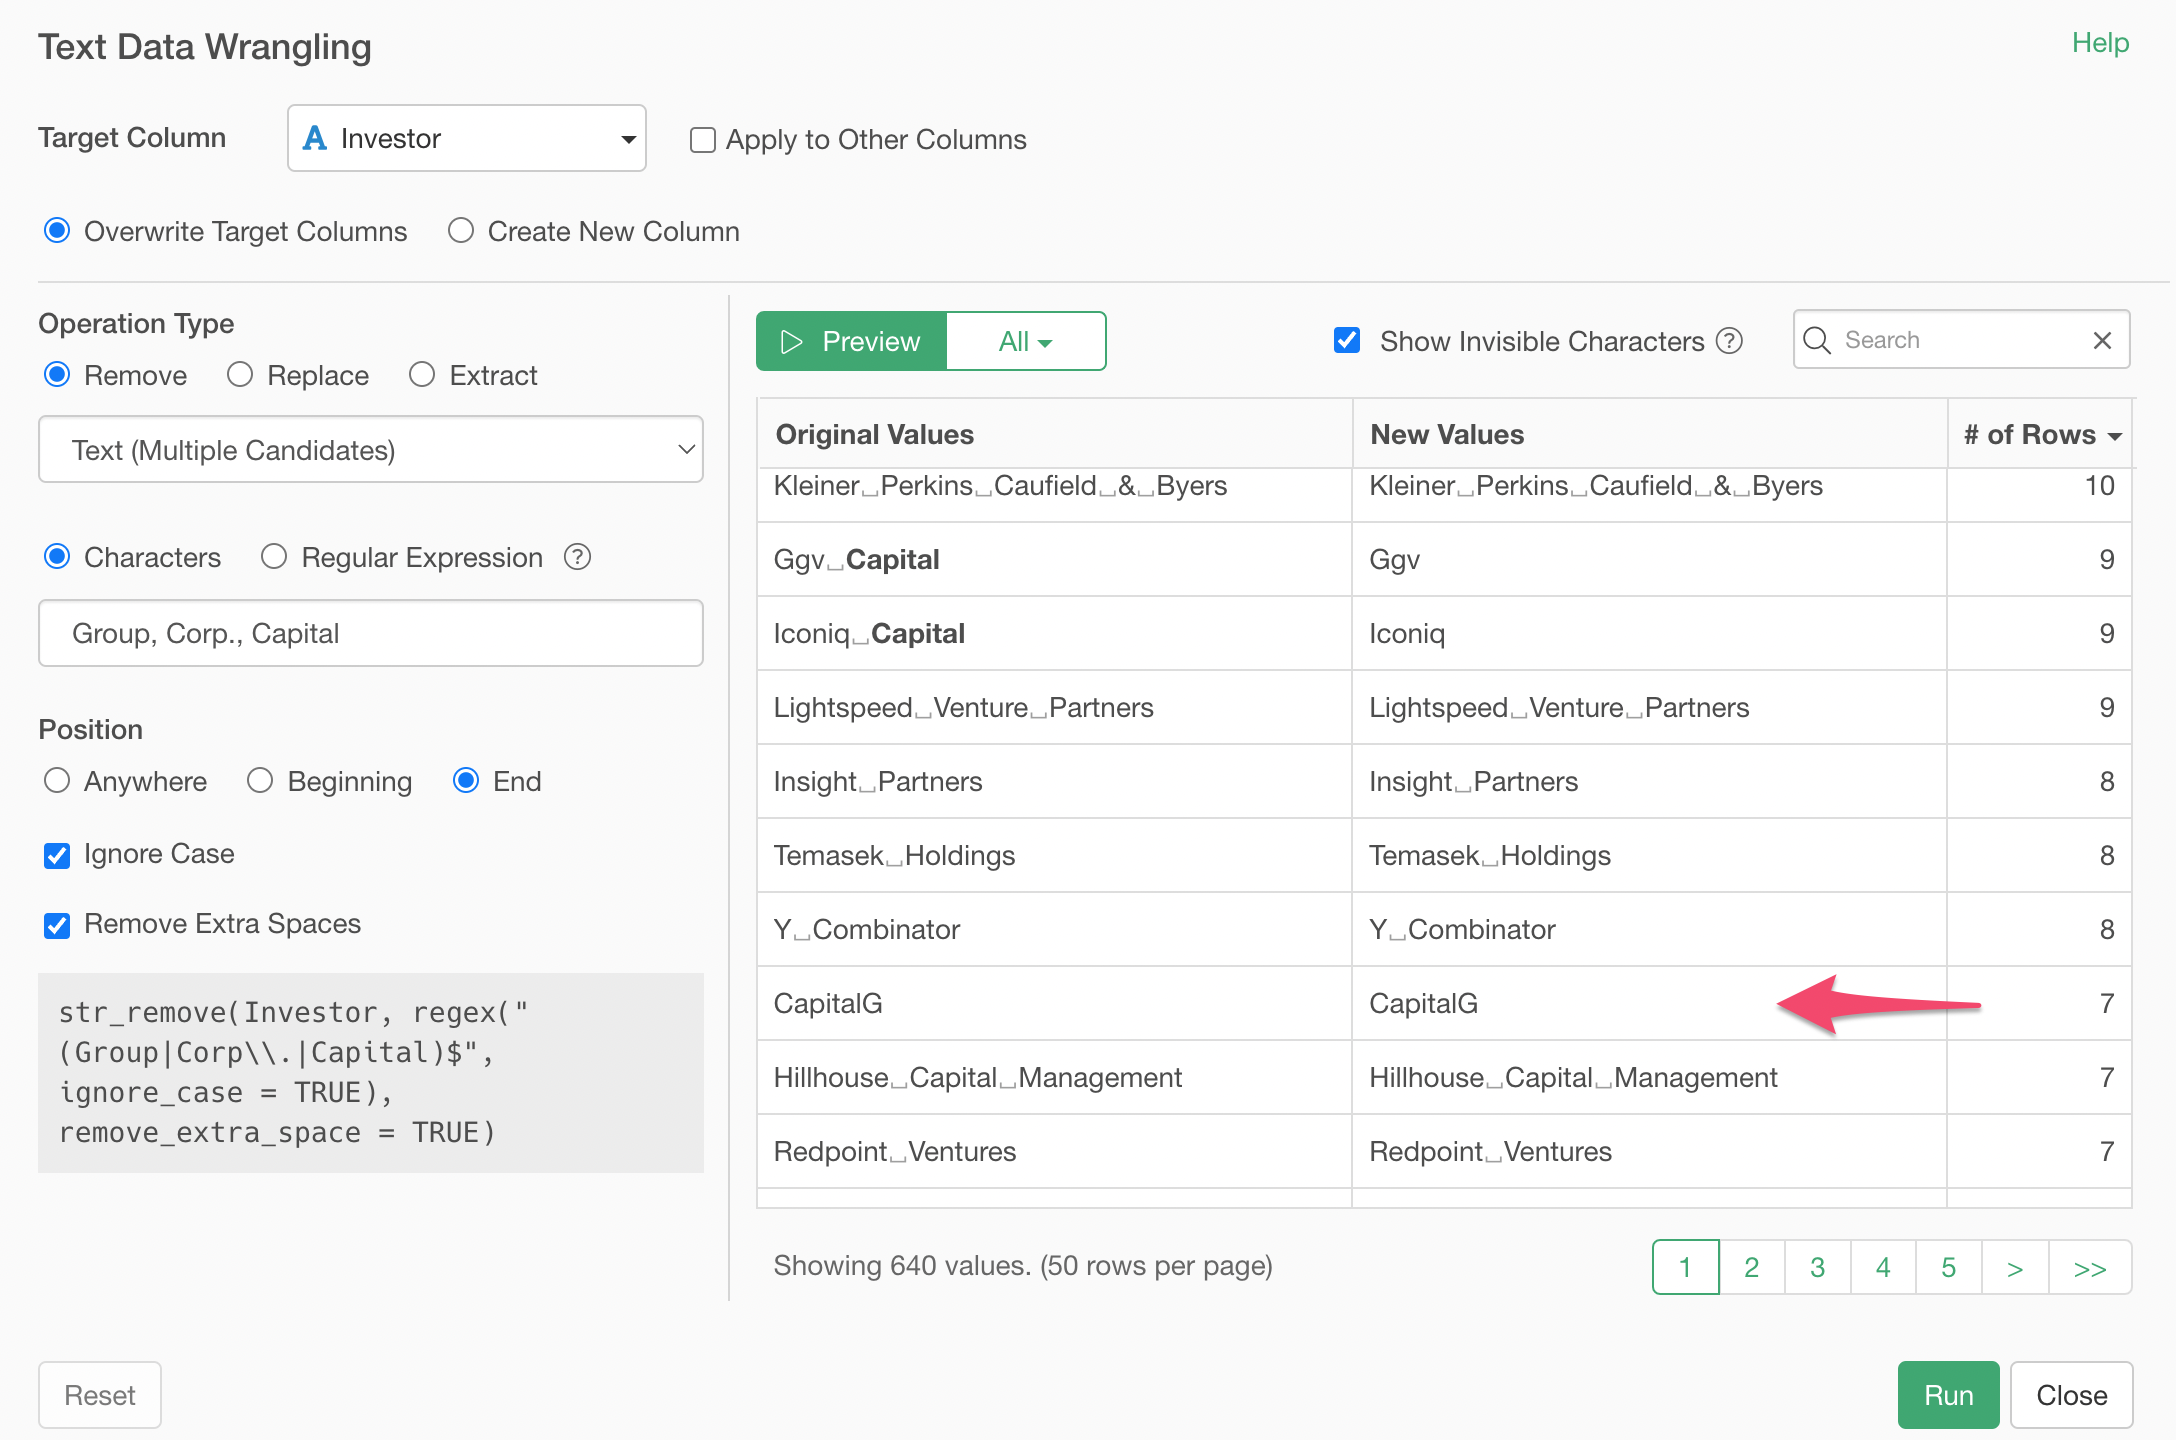
Now, only when the 'Capital' is at the end of each text value then it's removed, otherwise it's kept.
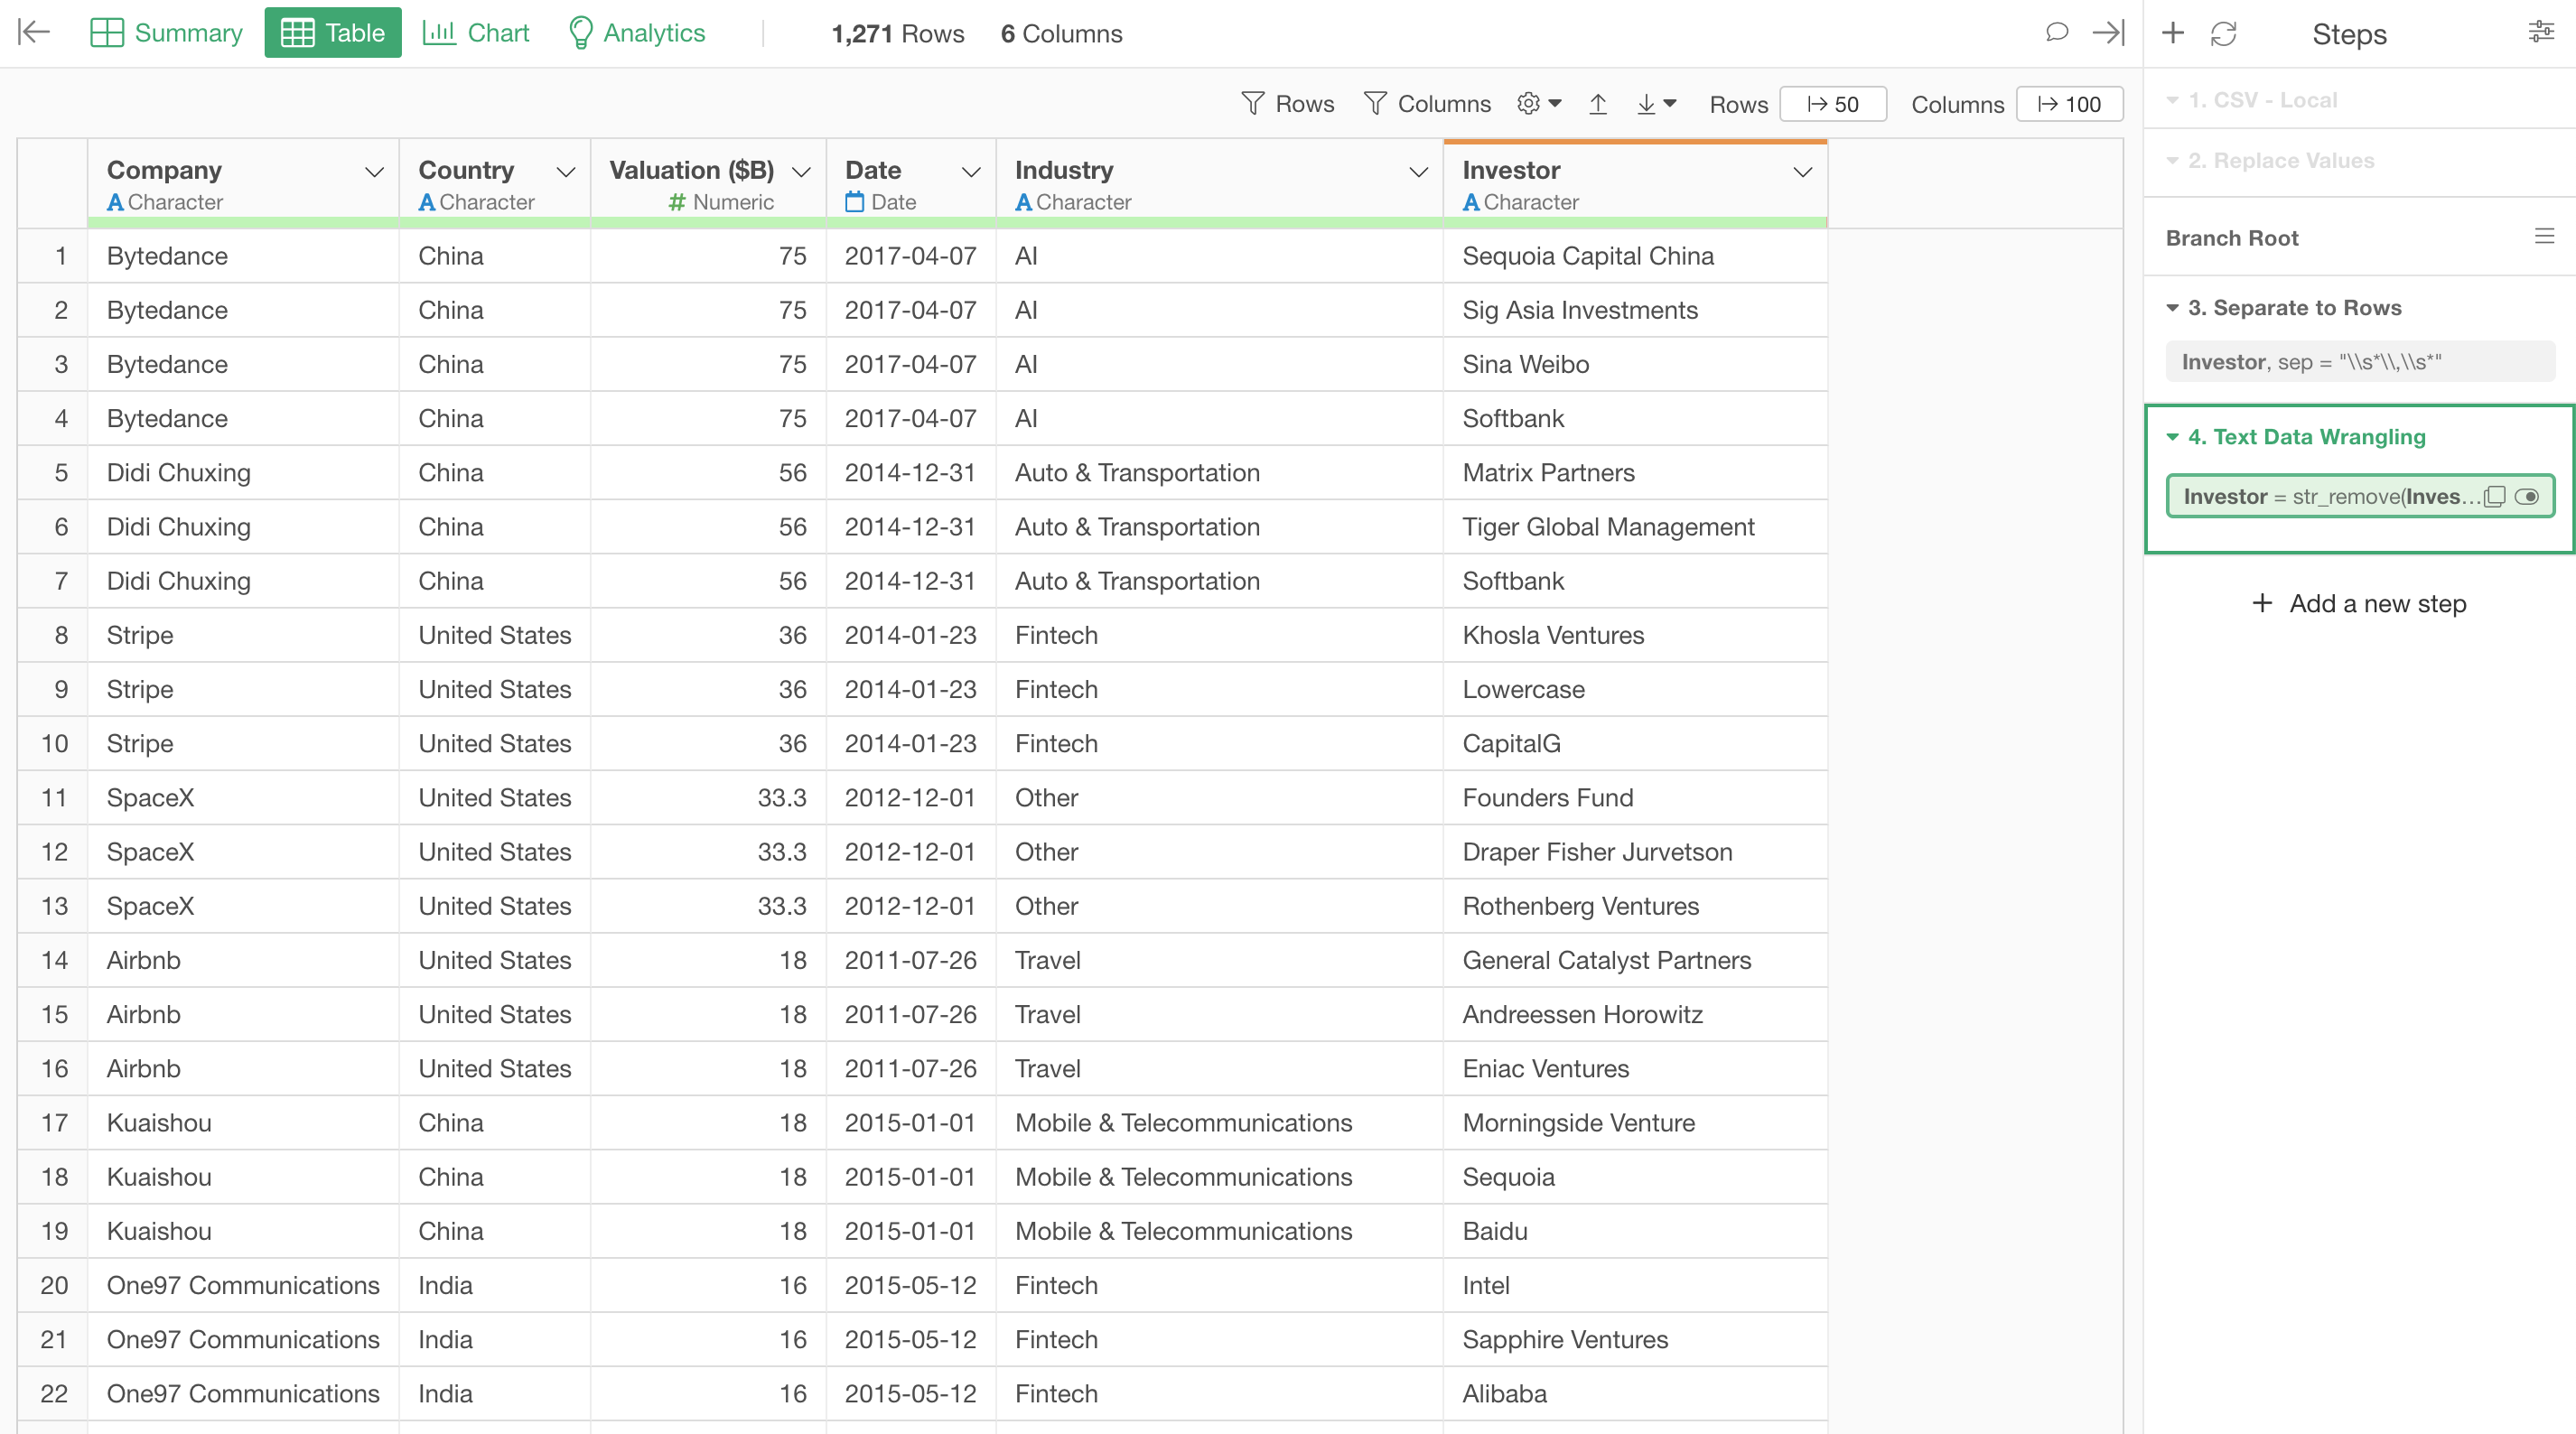
Click on the Run button and see the result in the Table view.
You can click on the Information icon at the Investor column header to see who has more unicorn companies.
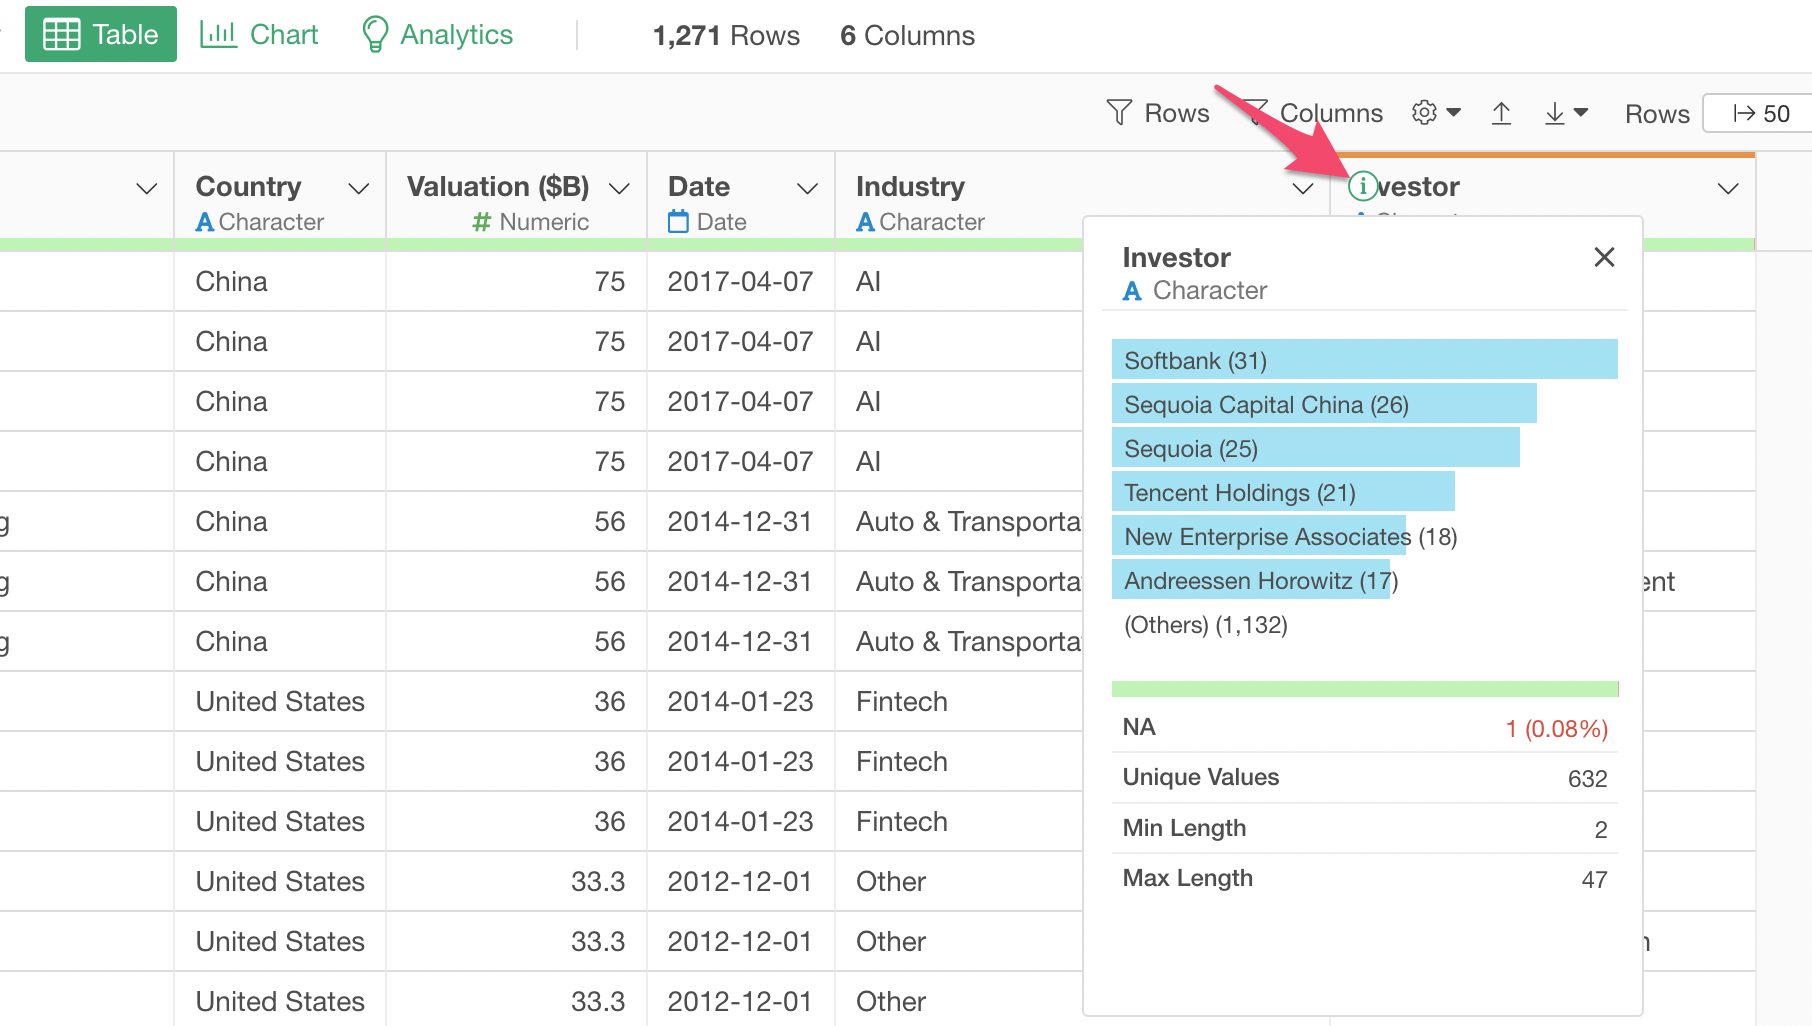
It turned out, after cleaning up and consolidate all the Softbank related entries, that Softbank has the most unicorn companies (31).