How to Use Exploratory Part 3 - Data Wrangling - AI Version
This note is the third topic of “How to Use Exploratory” series, designed to help you get started efficiently with Exploratory, focusing on “Data Wrangling”.
Specifically, this version utilizes “AI Prompt” to process data using natural language. If you are using the “Public Plan” or “Academic Plan” and cannot use AI Prompt, please refer to the “UI Version” hereor switch your trial to private.
This note is designed to help you learn how to write prompts and tips for cleaning, processing, and shaping data using AI Prompt, by working hands-on with sample data.
The estimated time to complete this note is about 20 minutes.
1. Import Data
We’ll use the following two data frames. You can download them from the links.
Unicorn data has all the latest unicorn companies who are private companies with greater than 1 billion dollars valuation.
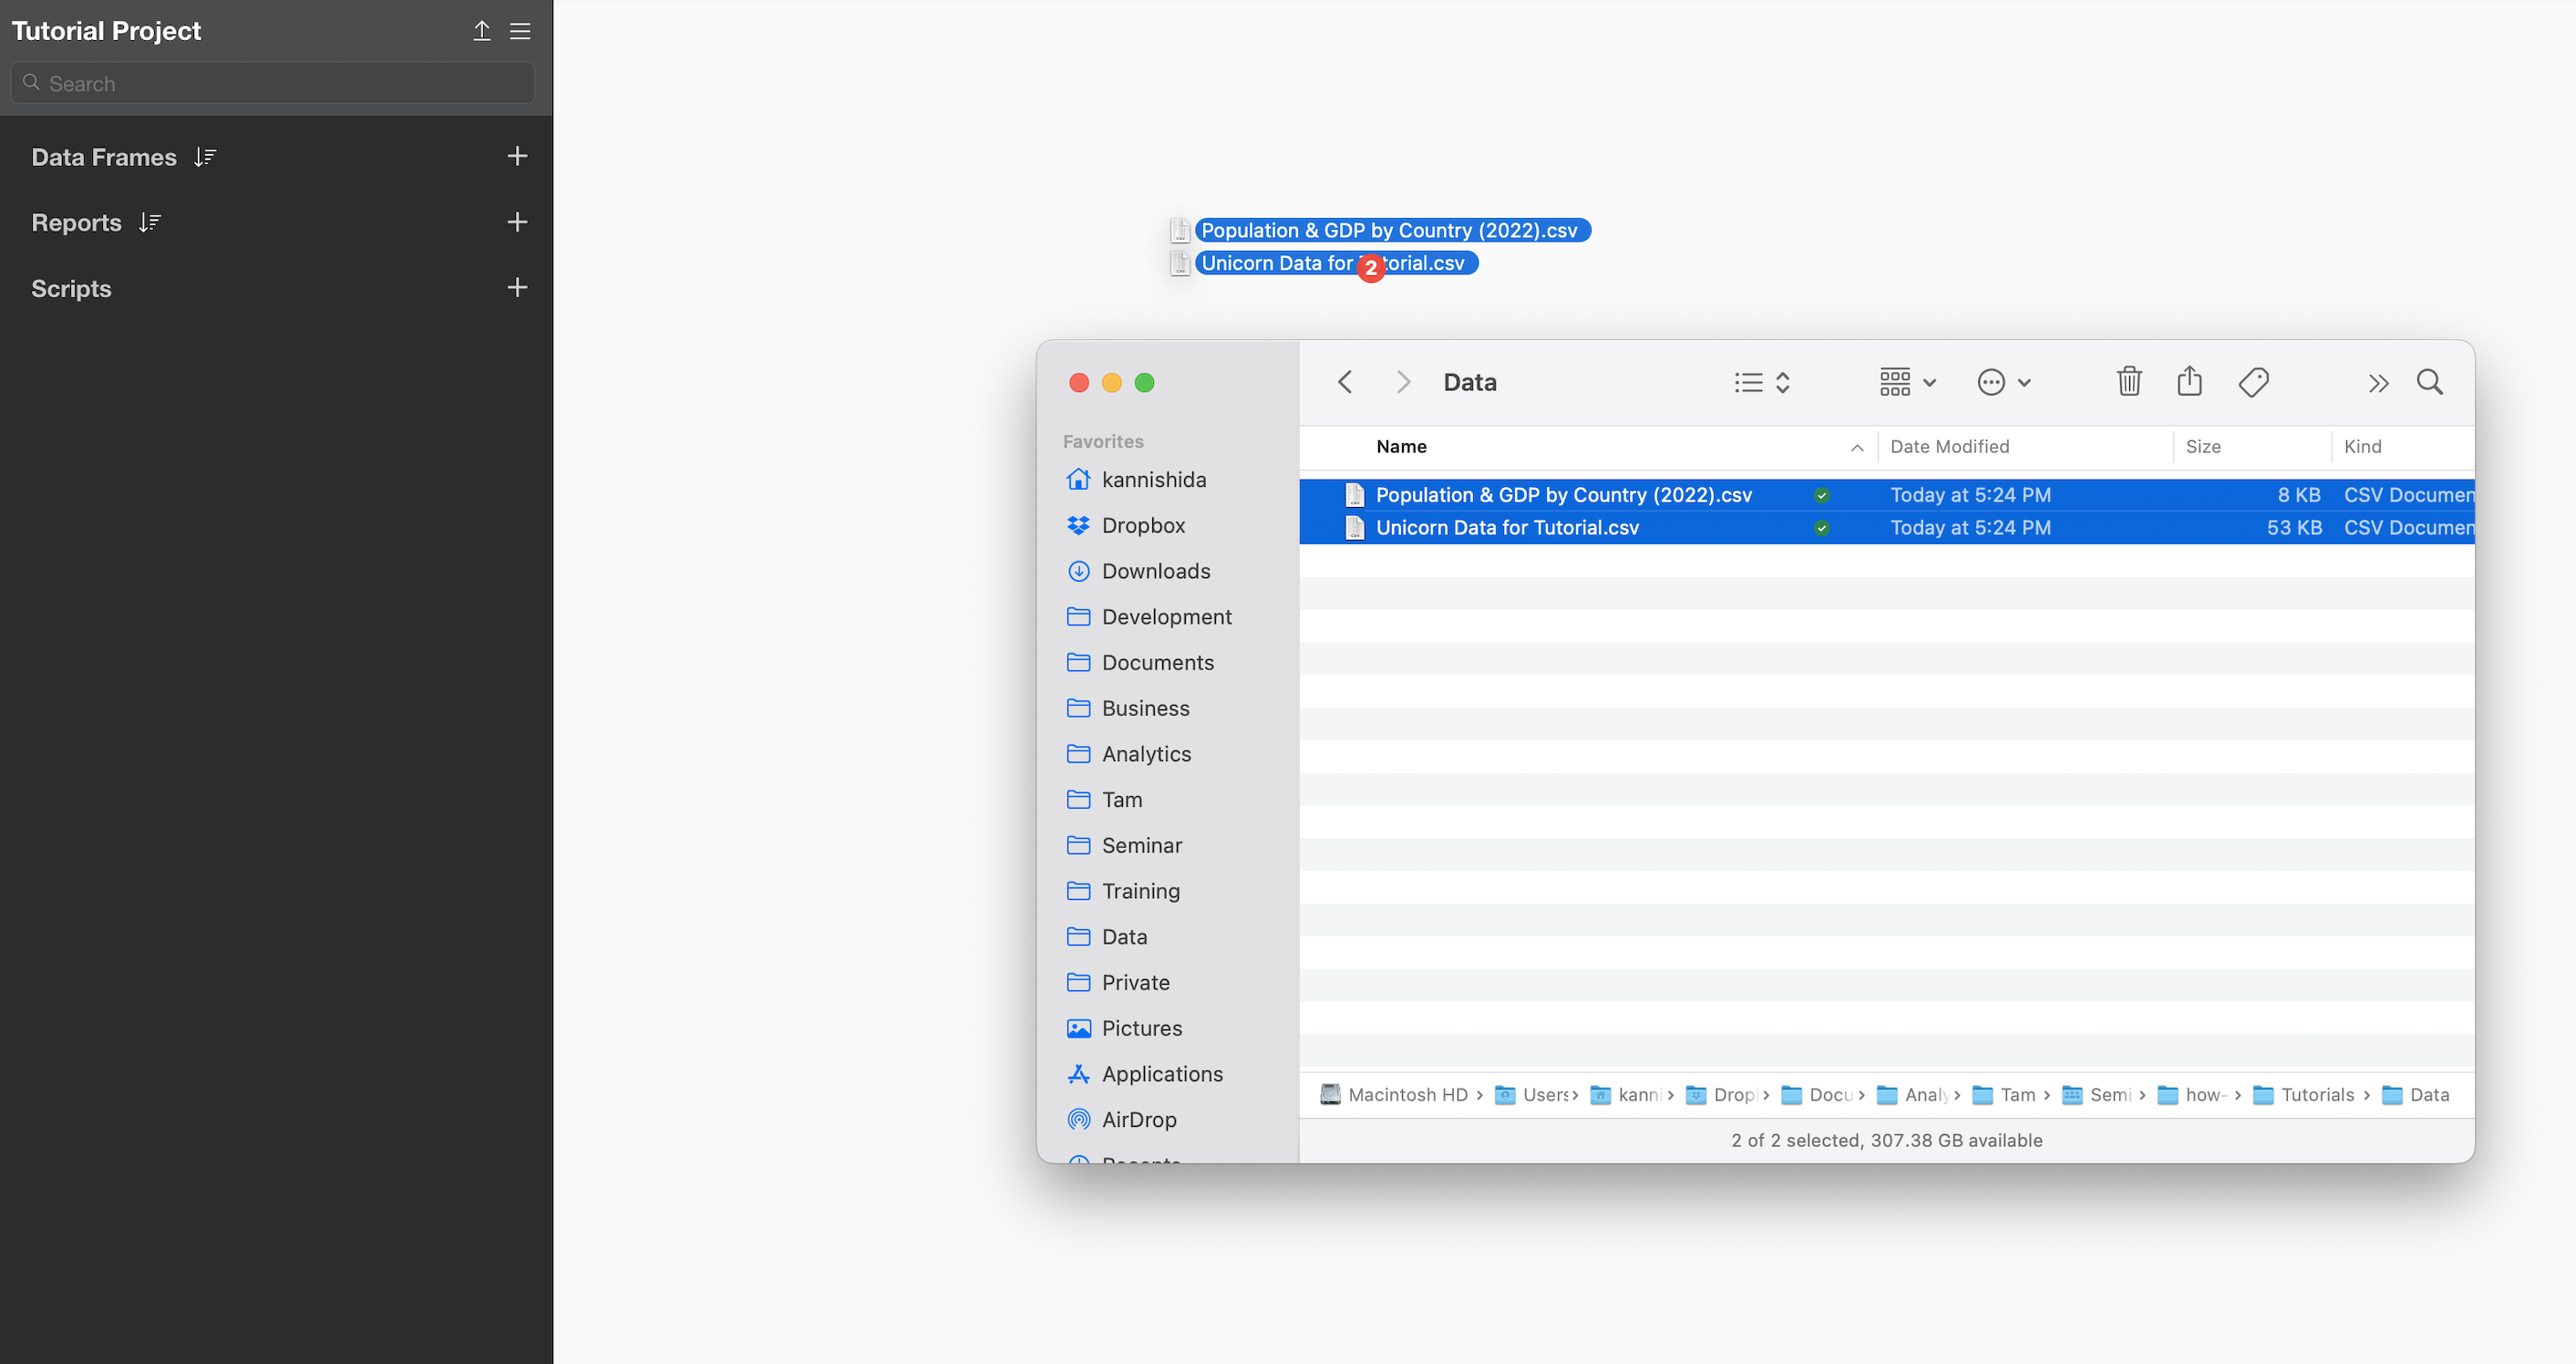
Once downloaded, you can select both CSV files and drag and drop them into Exploratory.
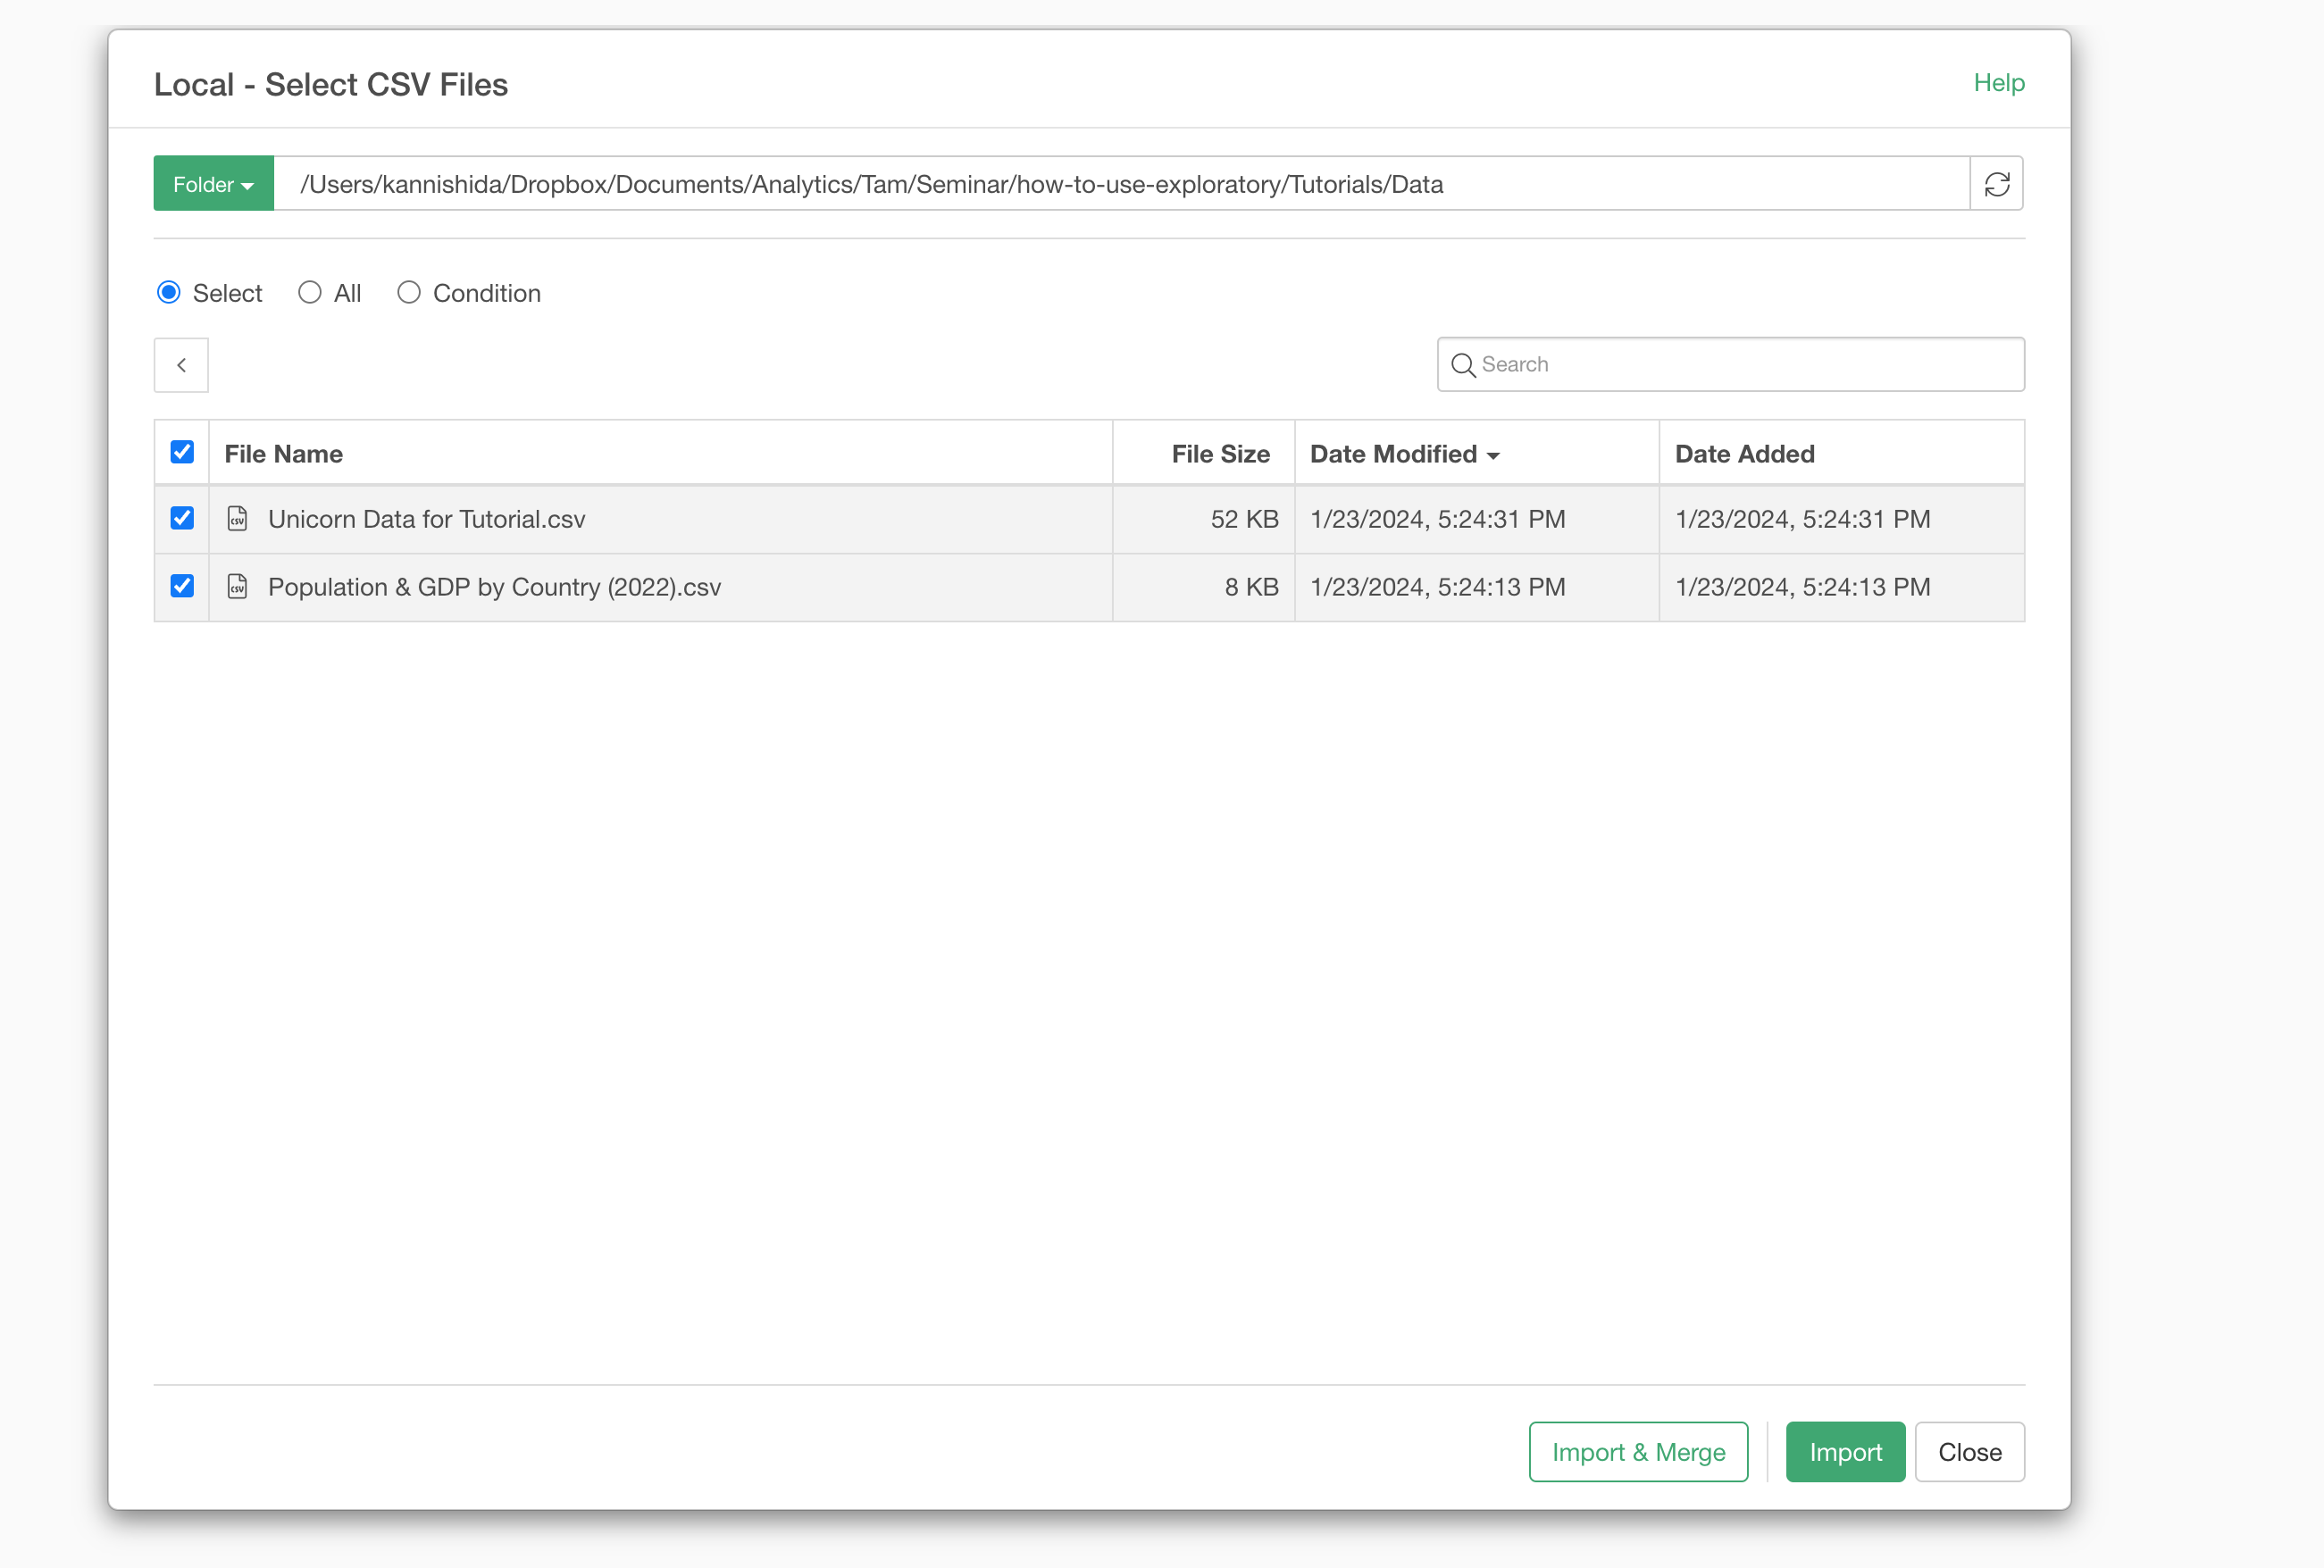
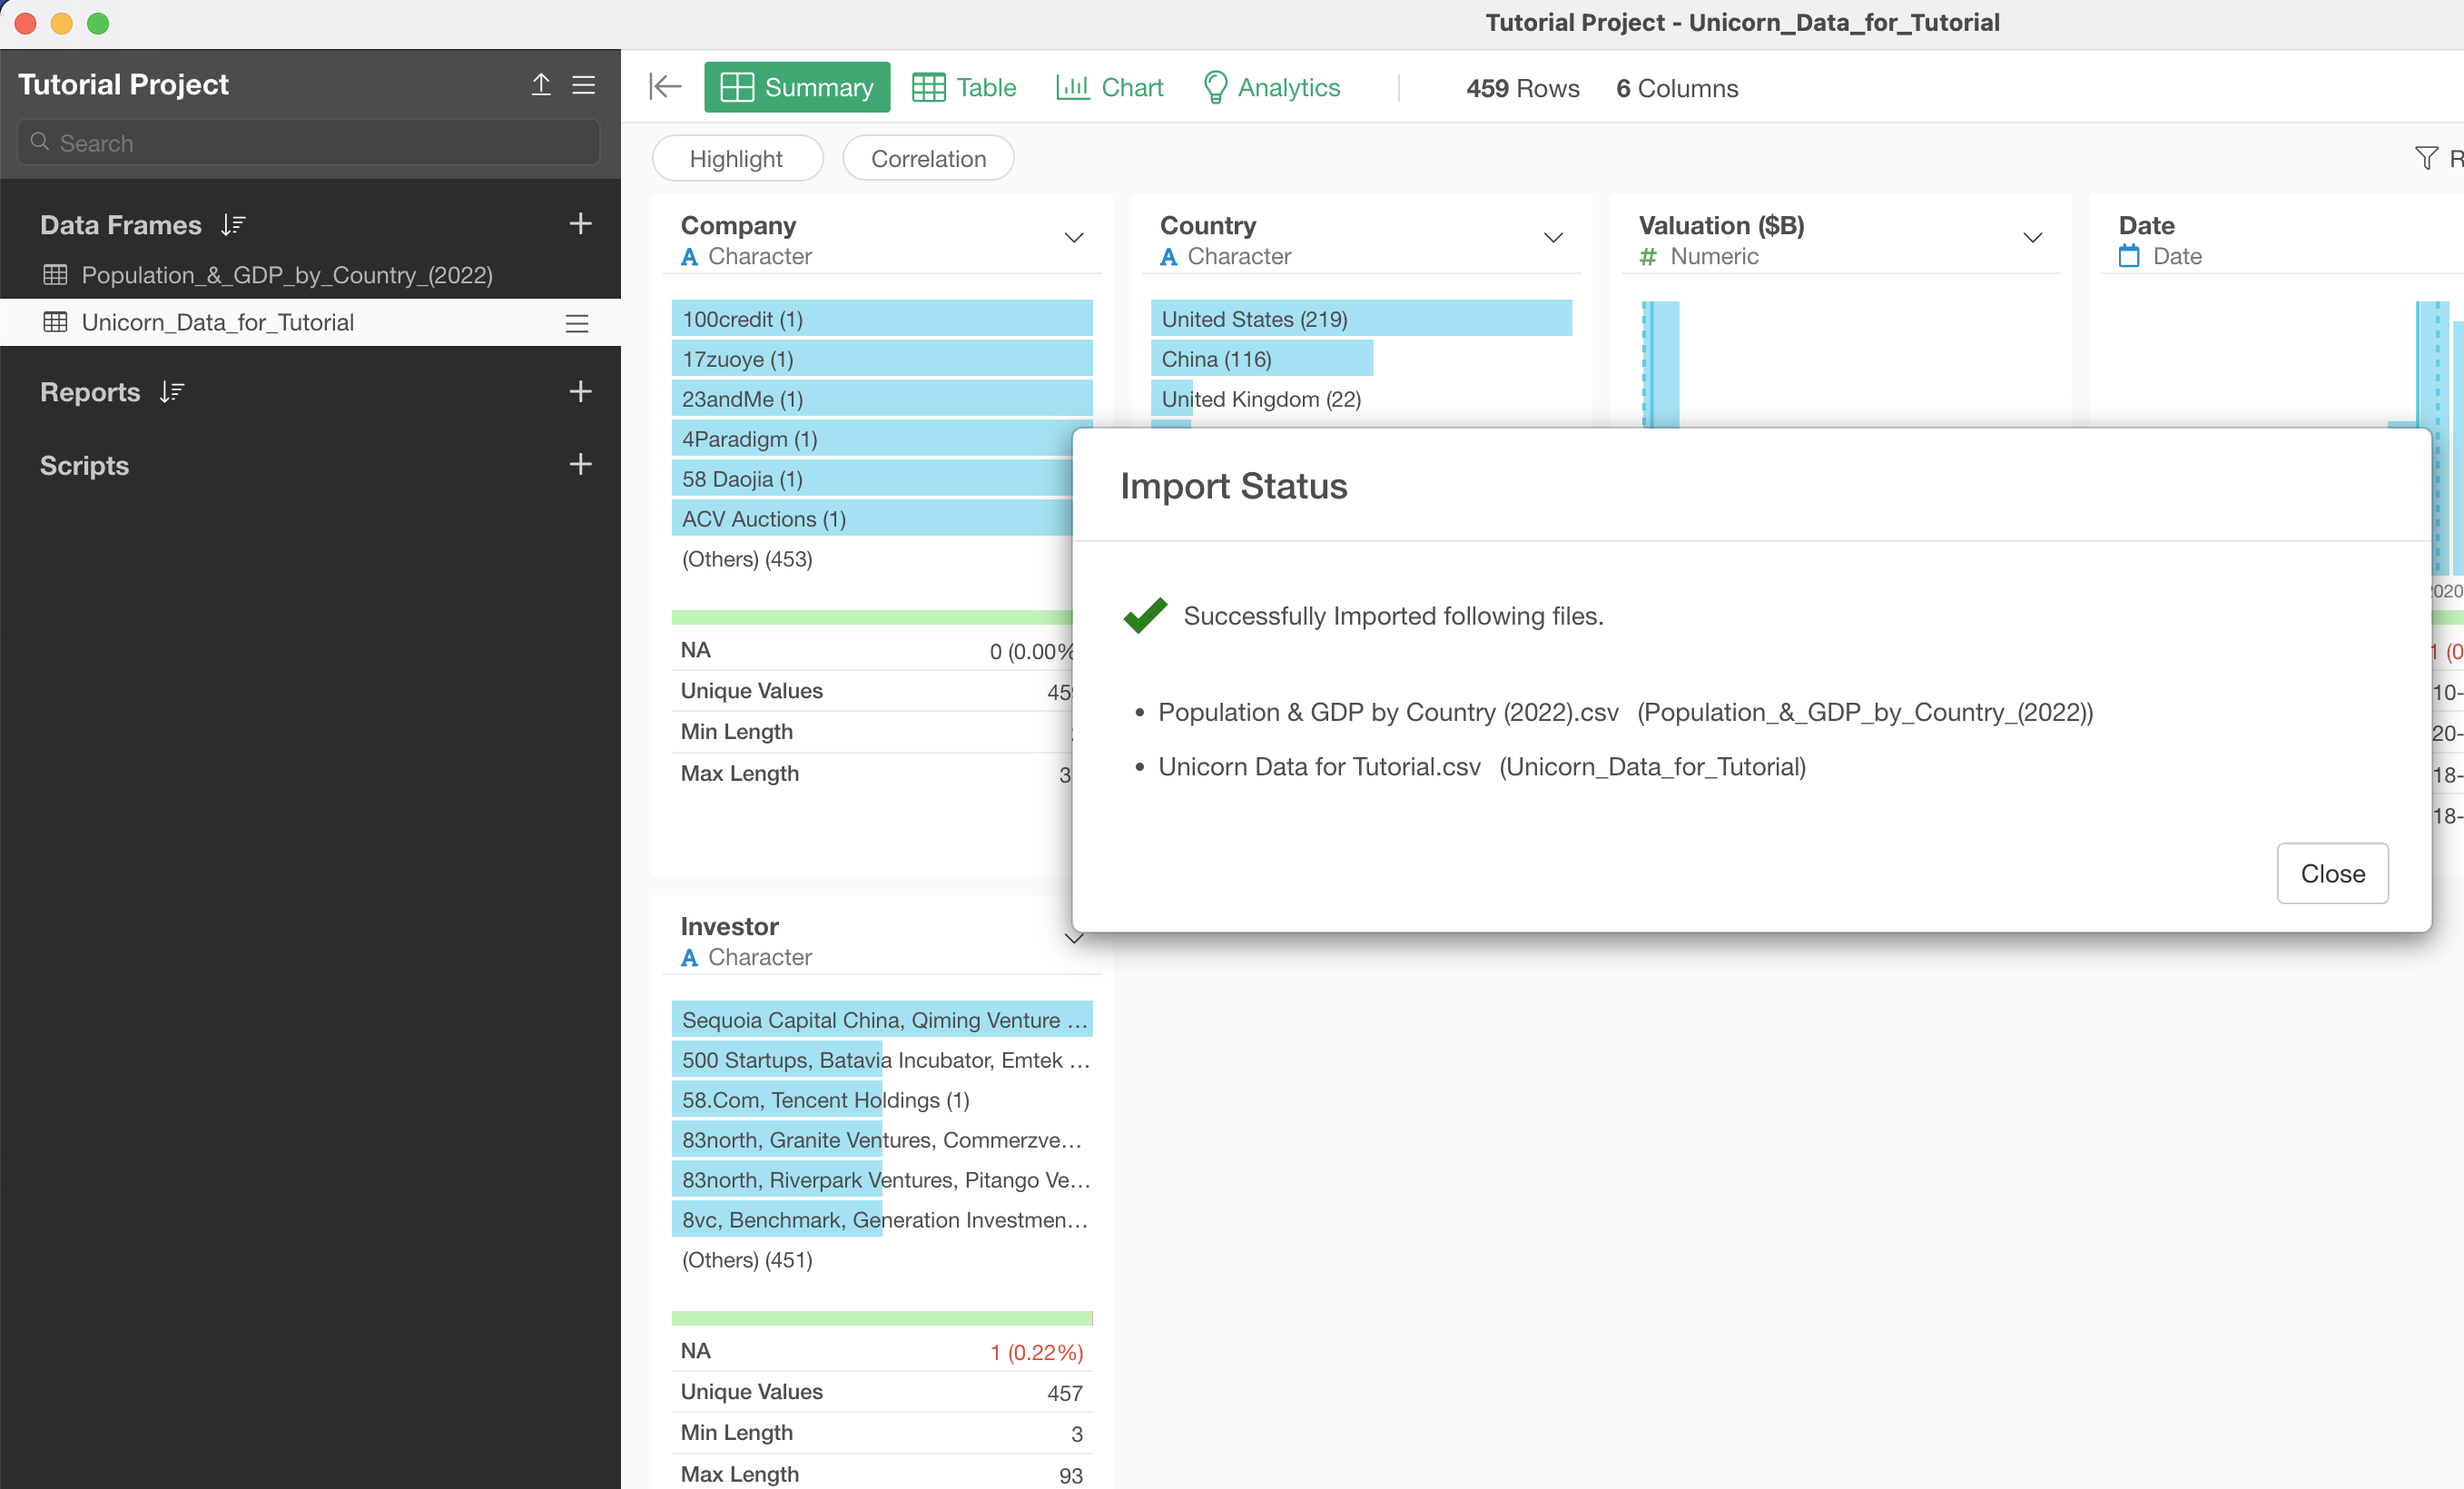
Data Import dialog will show up, simply click on the Import button at the bottom.
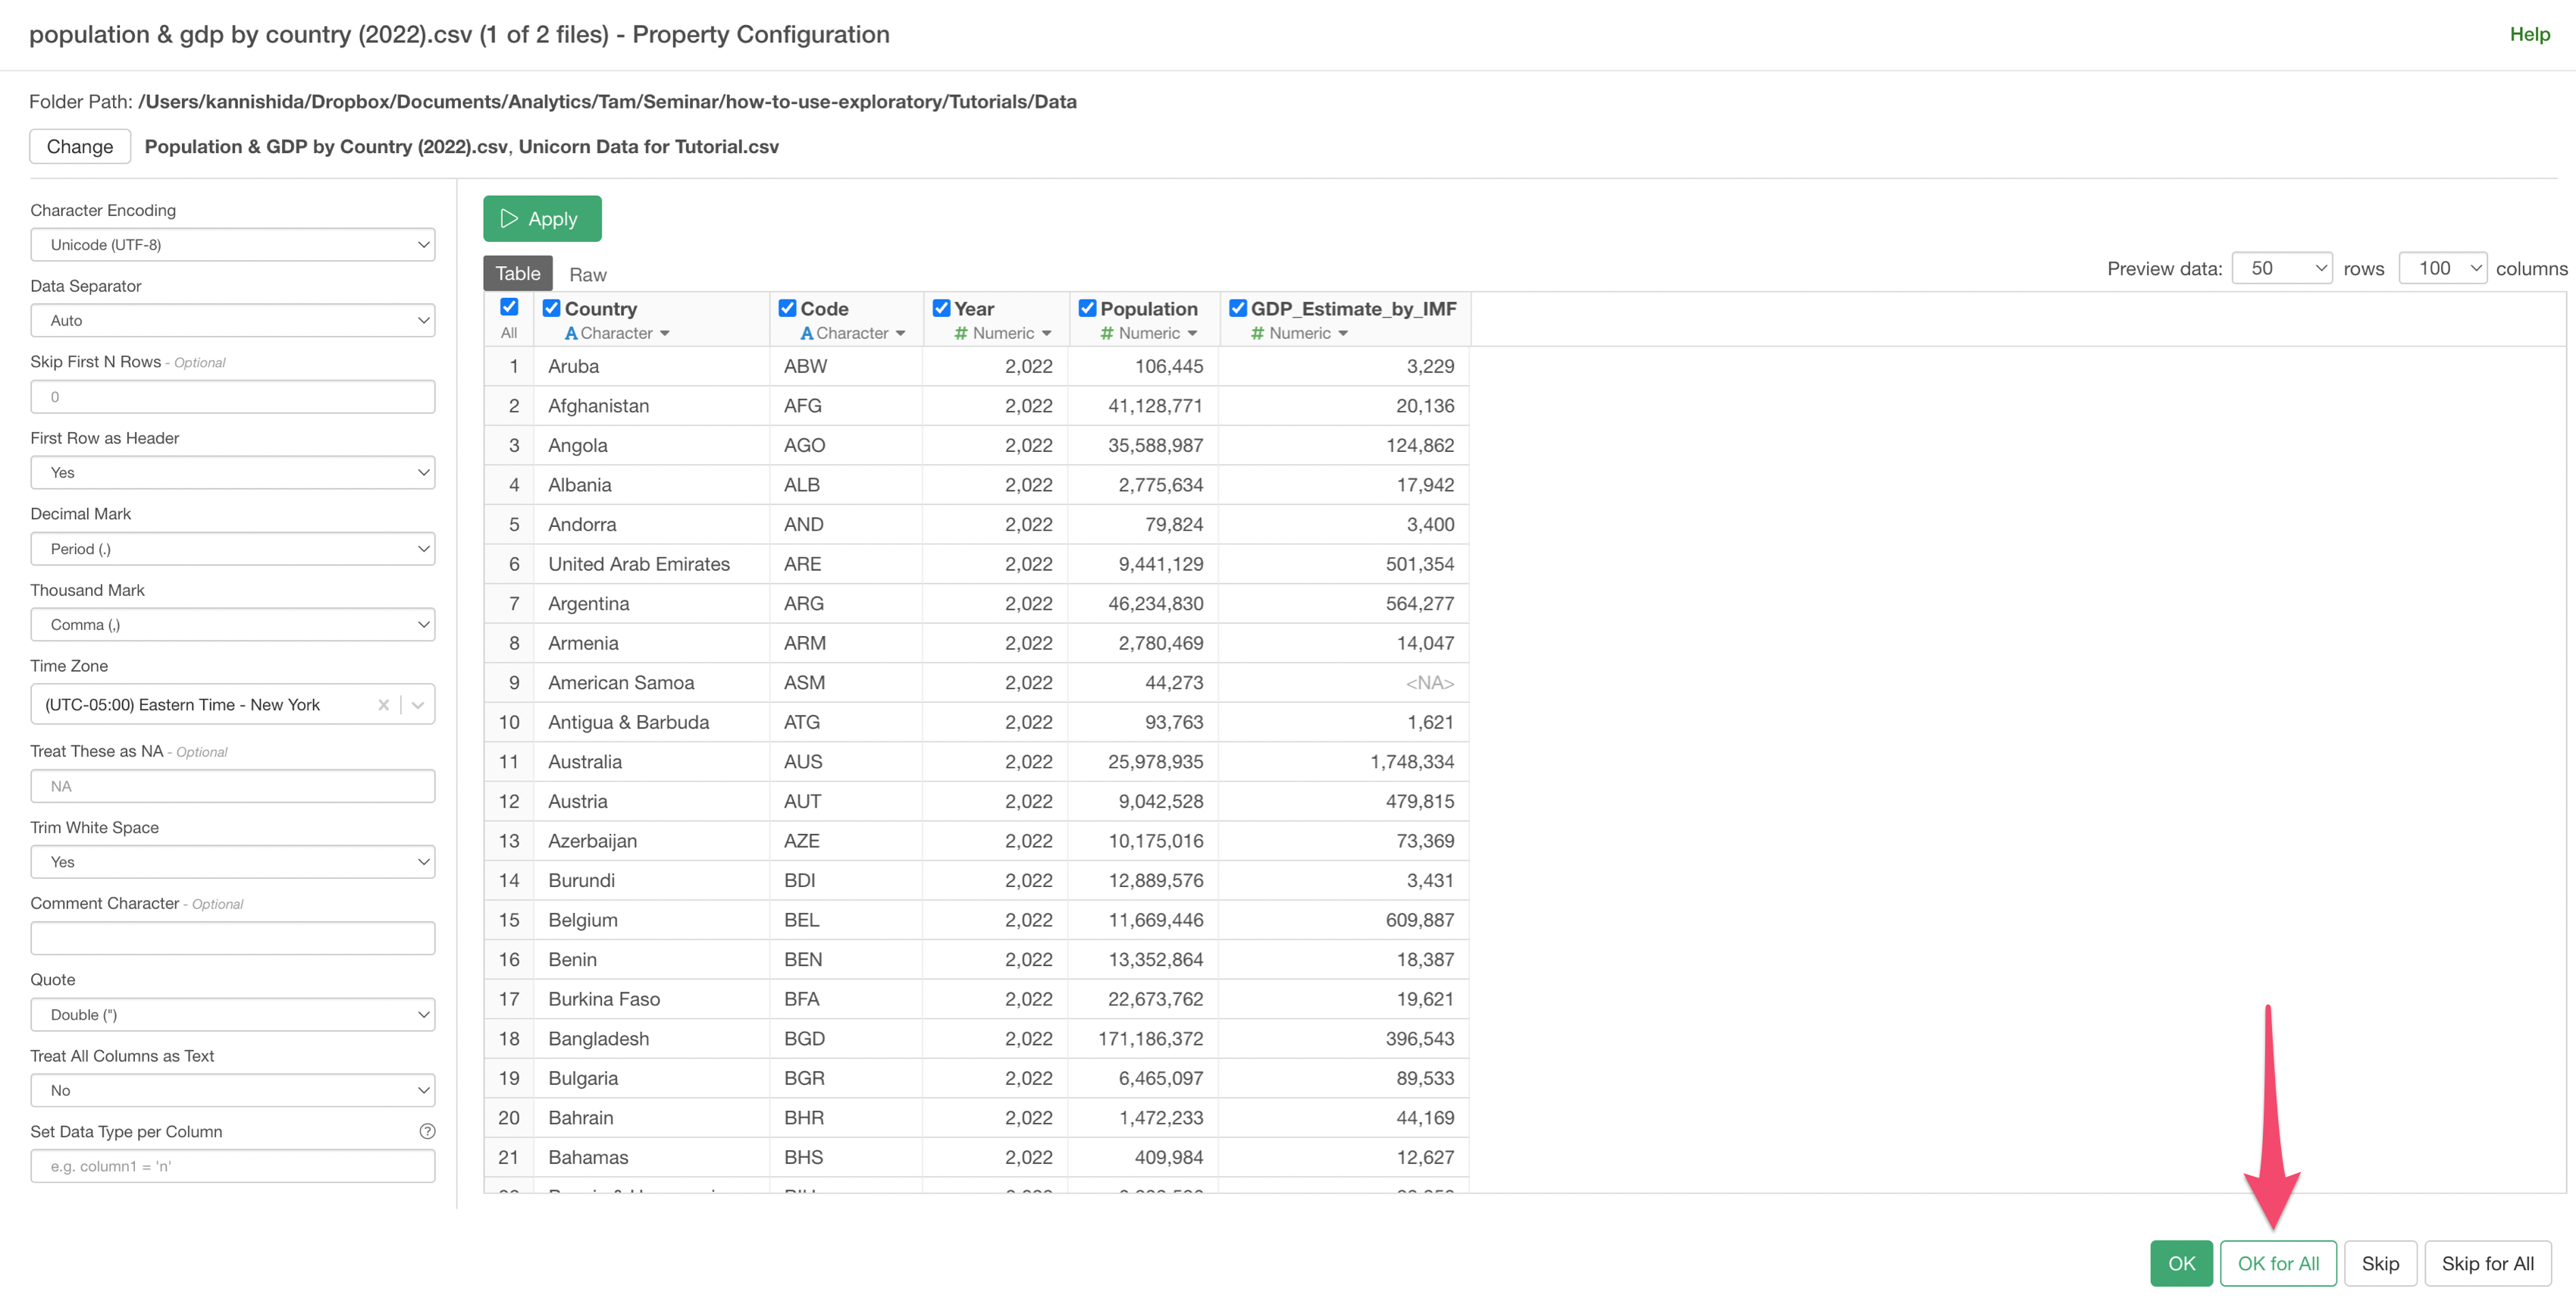
Another dialog will open. You can keep the default setting, simply click on ‘Ok for All’ button.
Once imported, you’ll see two data frames showing up at the left hand side.
2. Replace with New Values
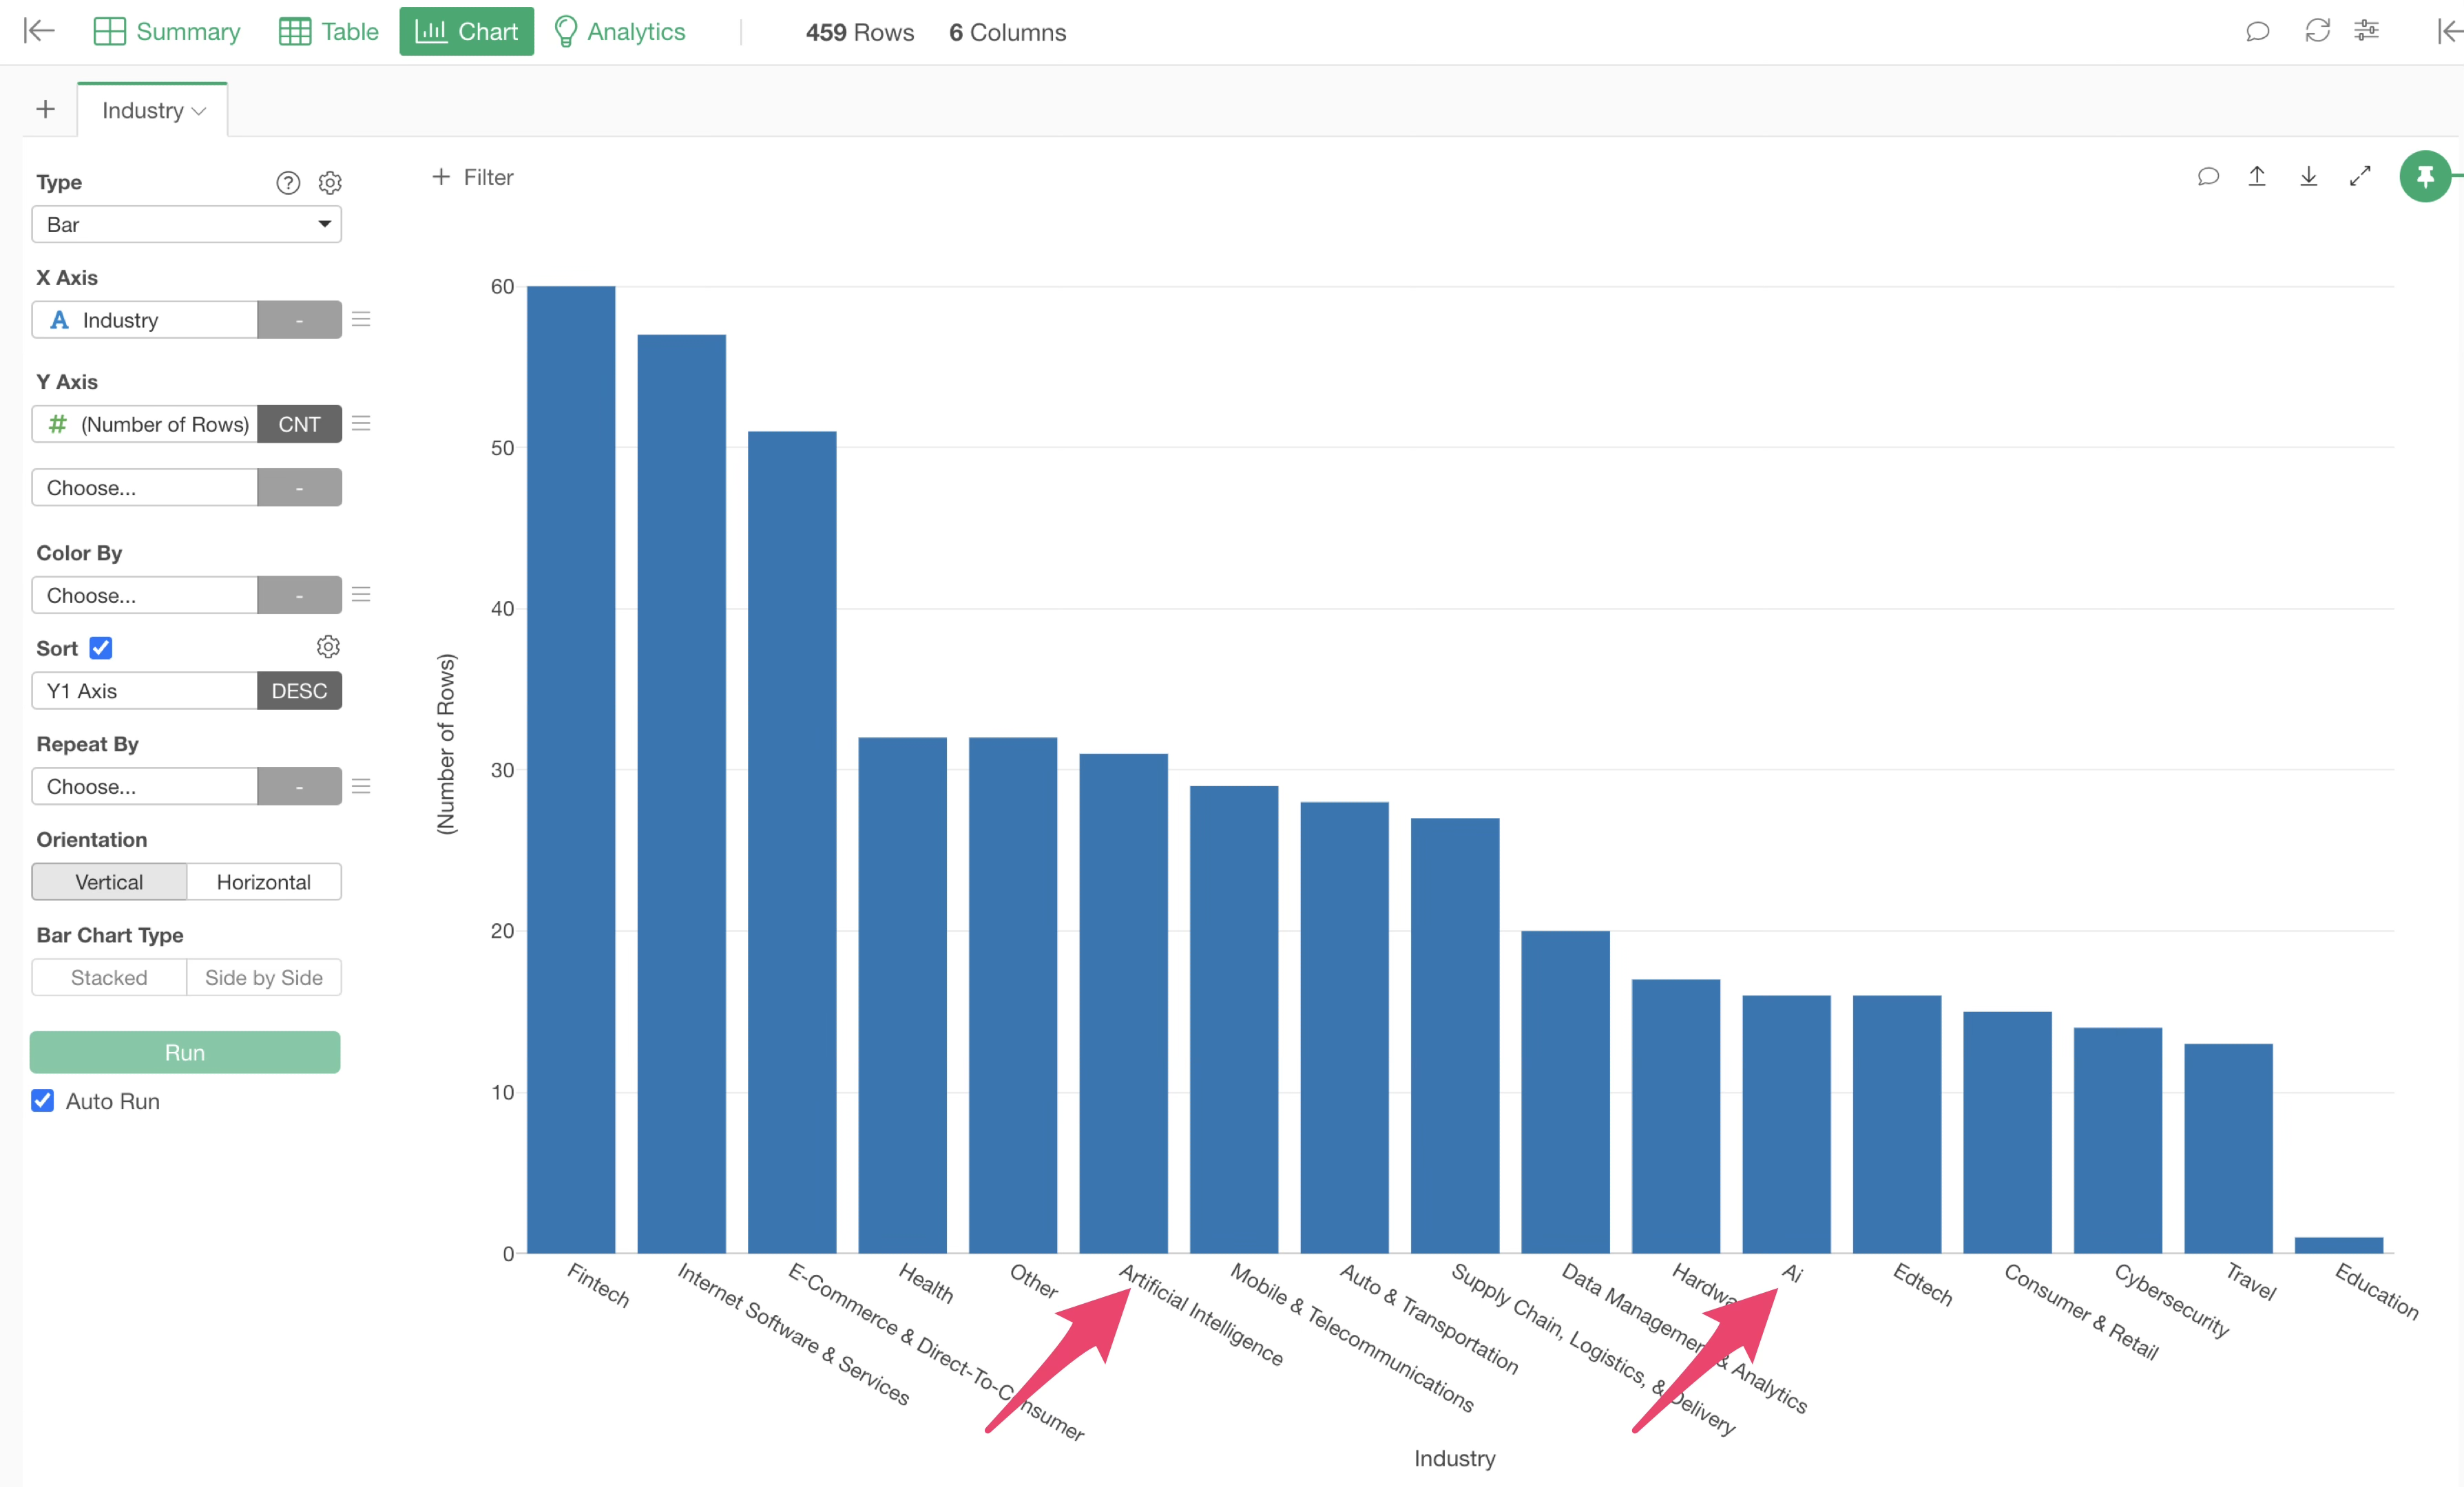
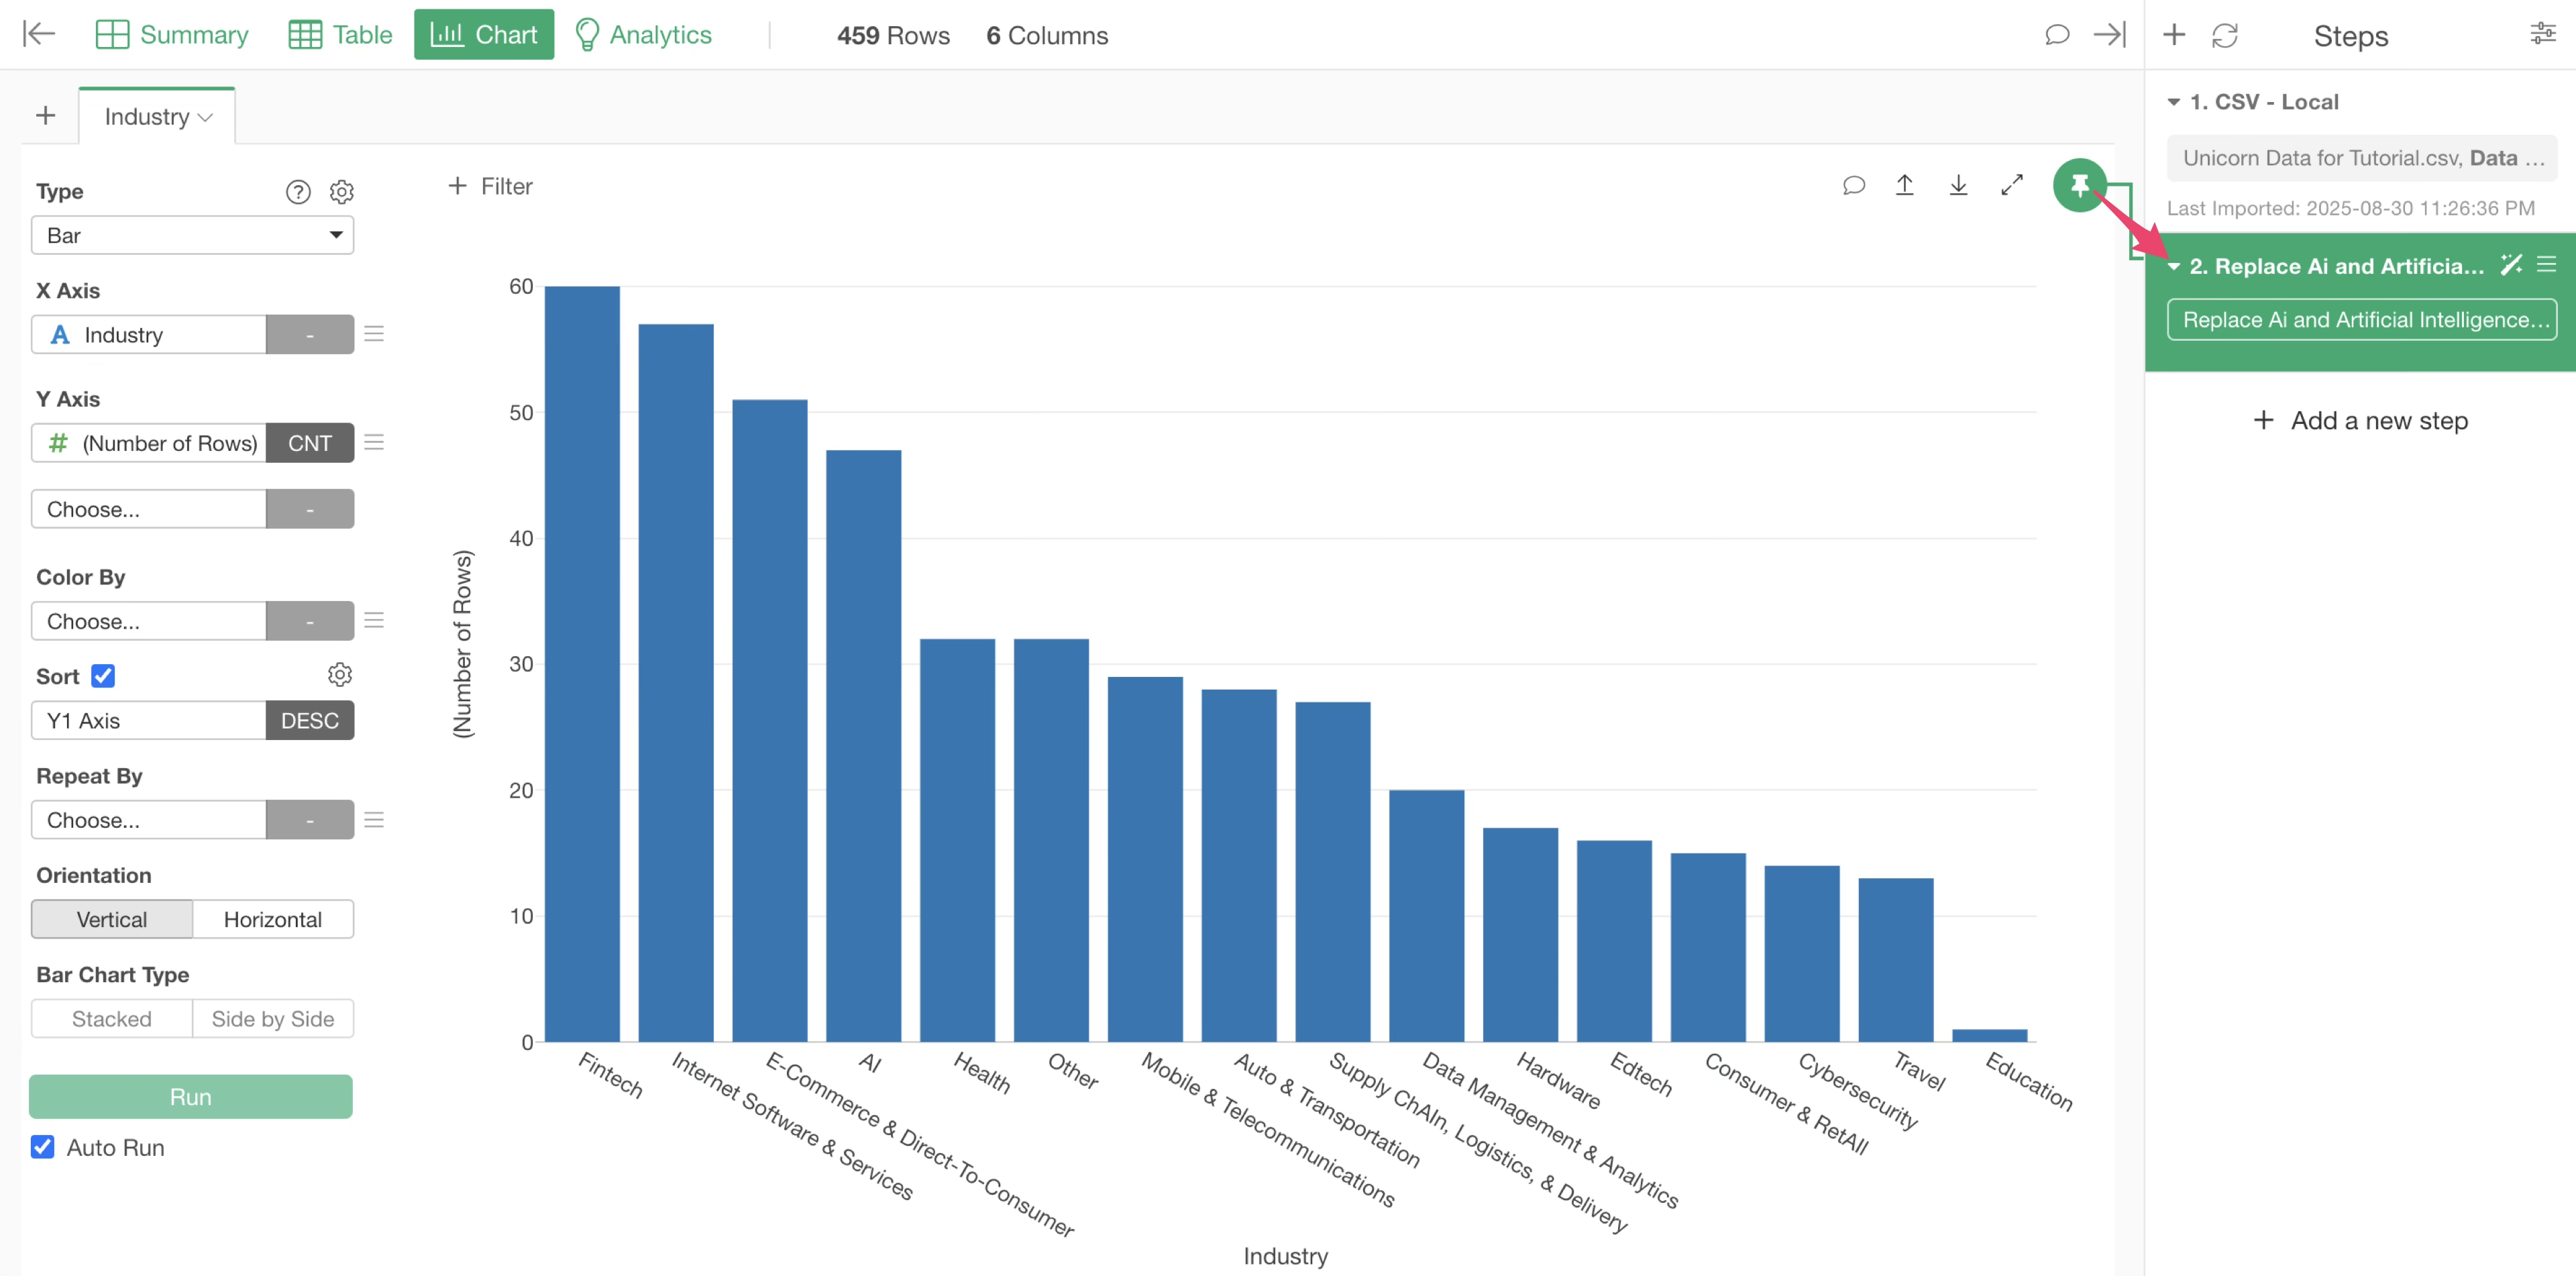
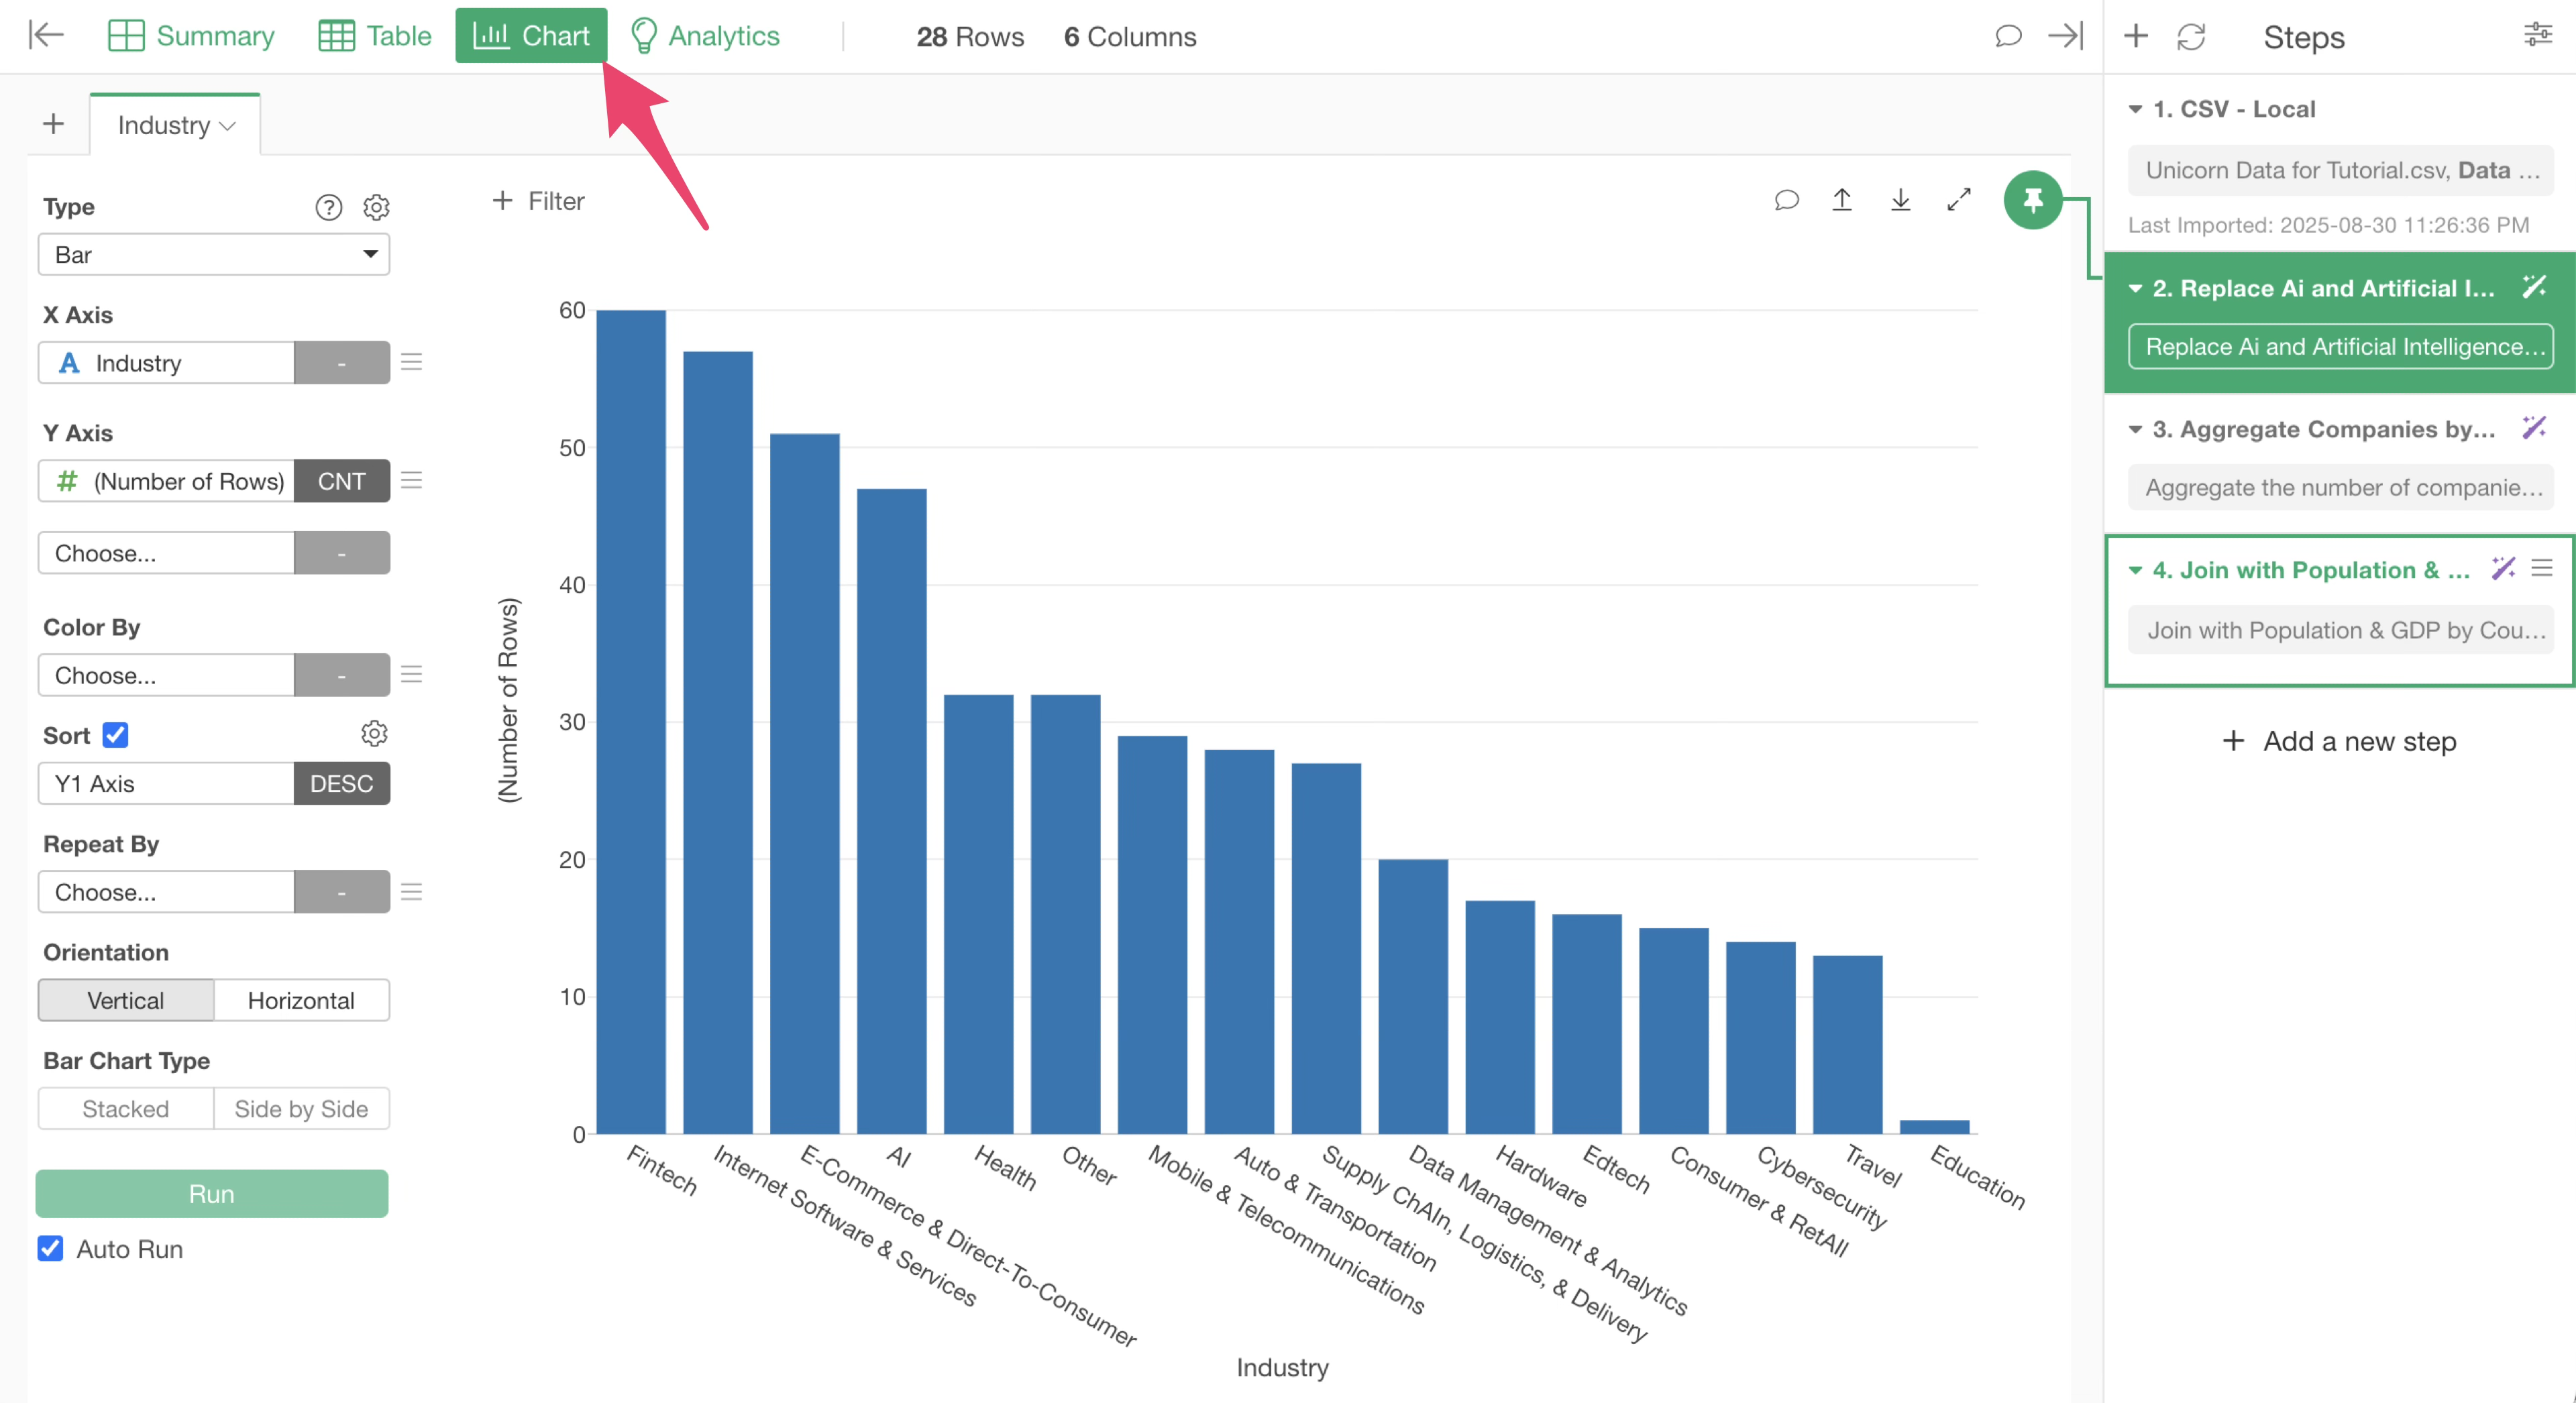
Let’s open the unicorn companies data and visualize the number of companies by industry.
From the “Industry” column in the Summary View, click the “Create Chart” button.
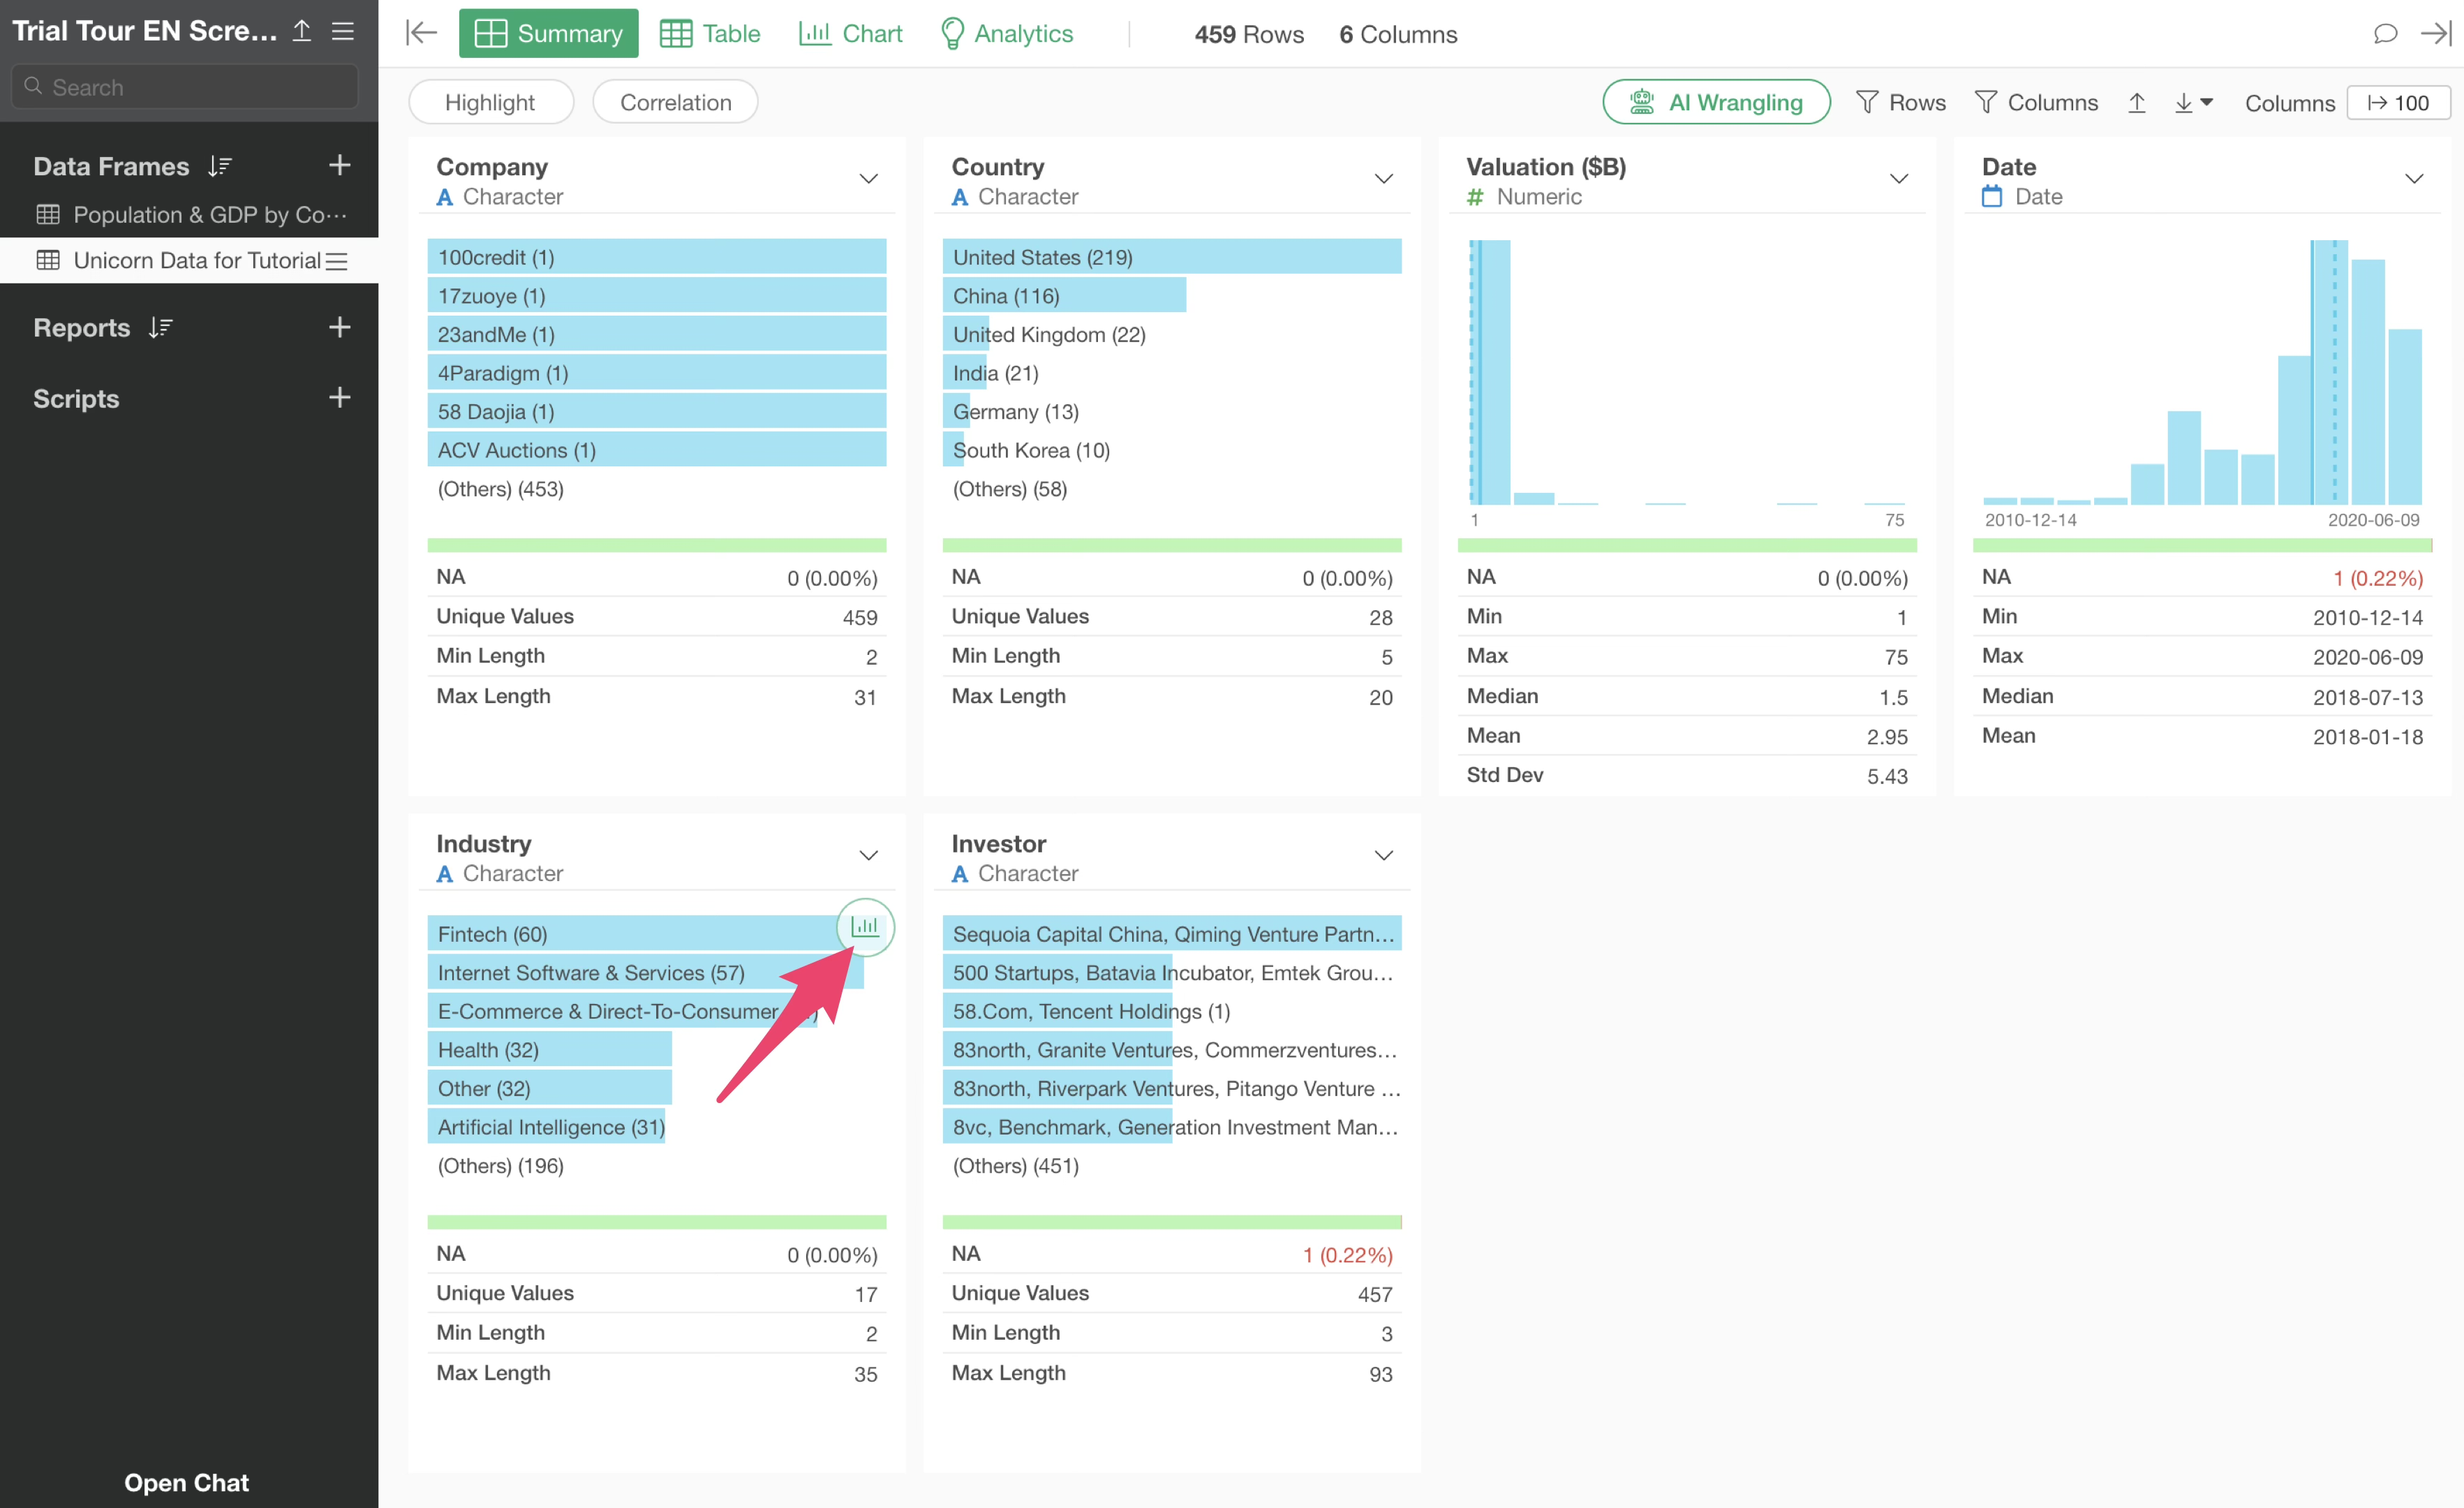
You will move to the Chart View and the number of rows (number of companies) by industry.
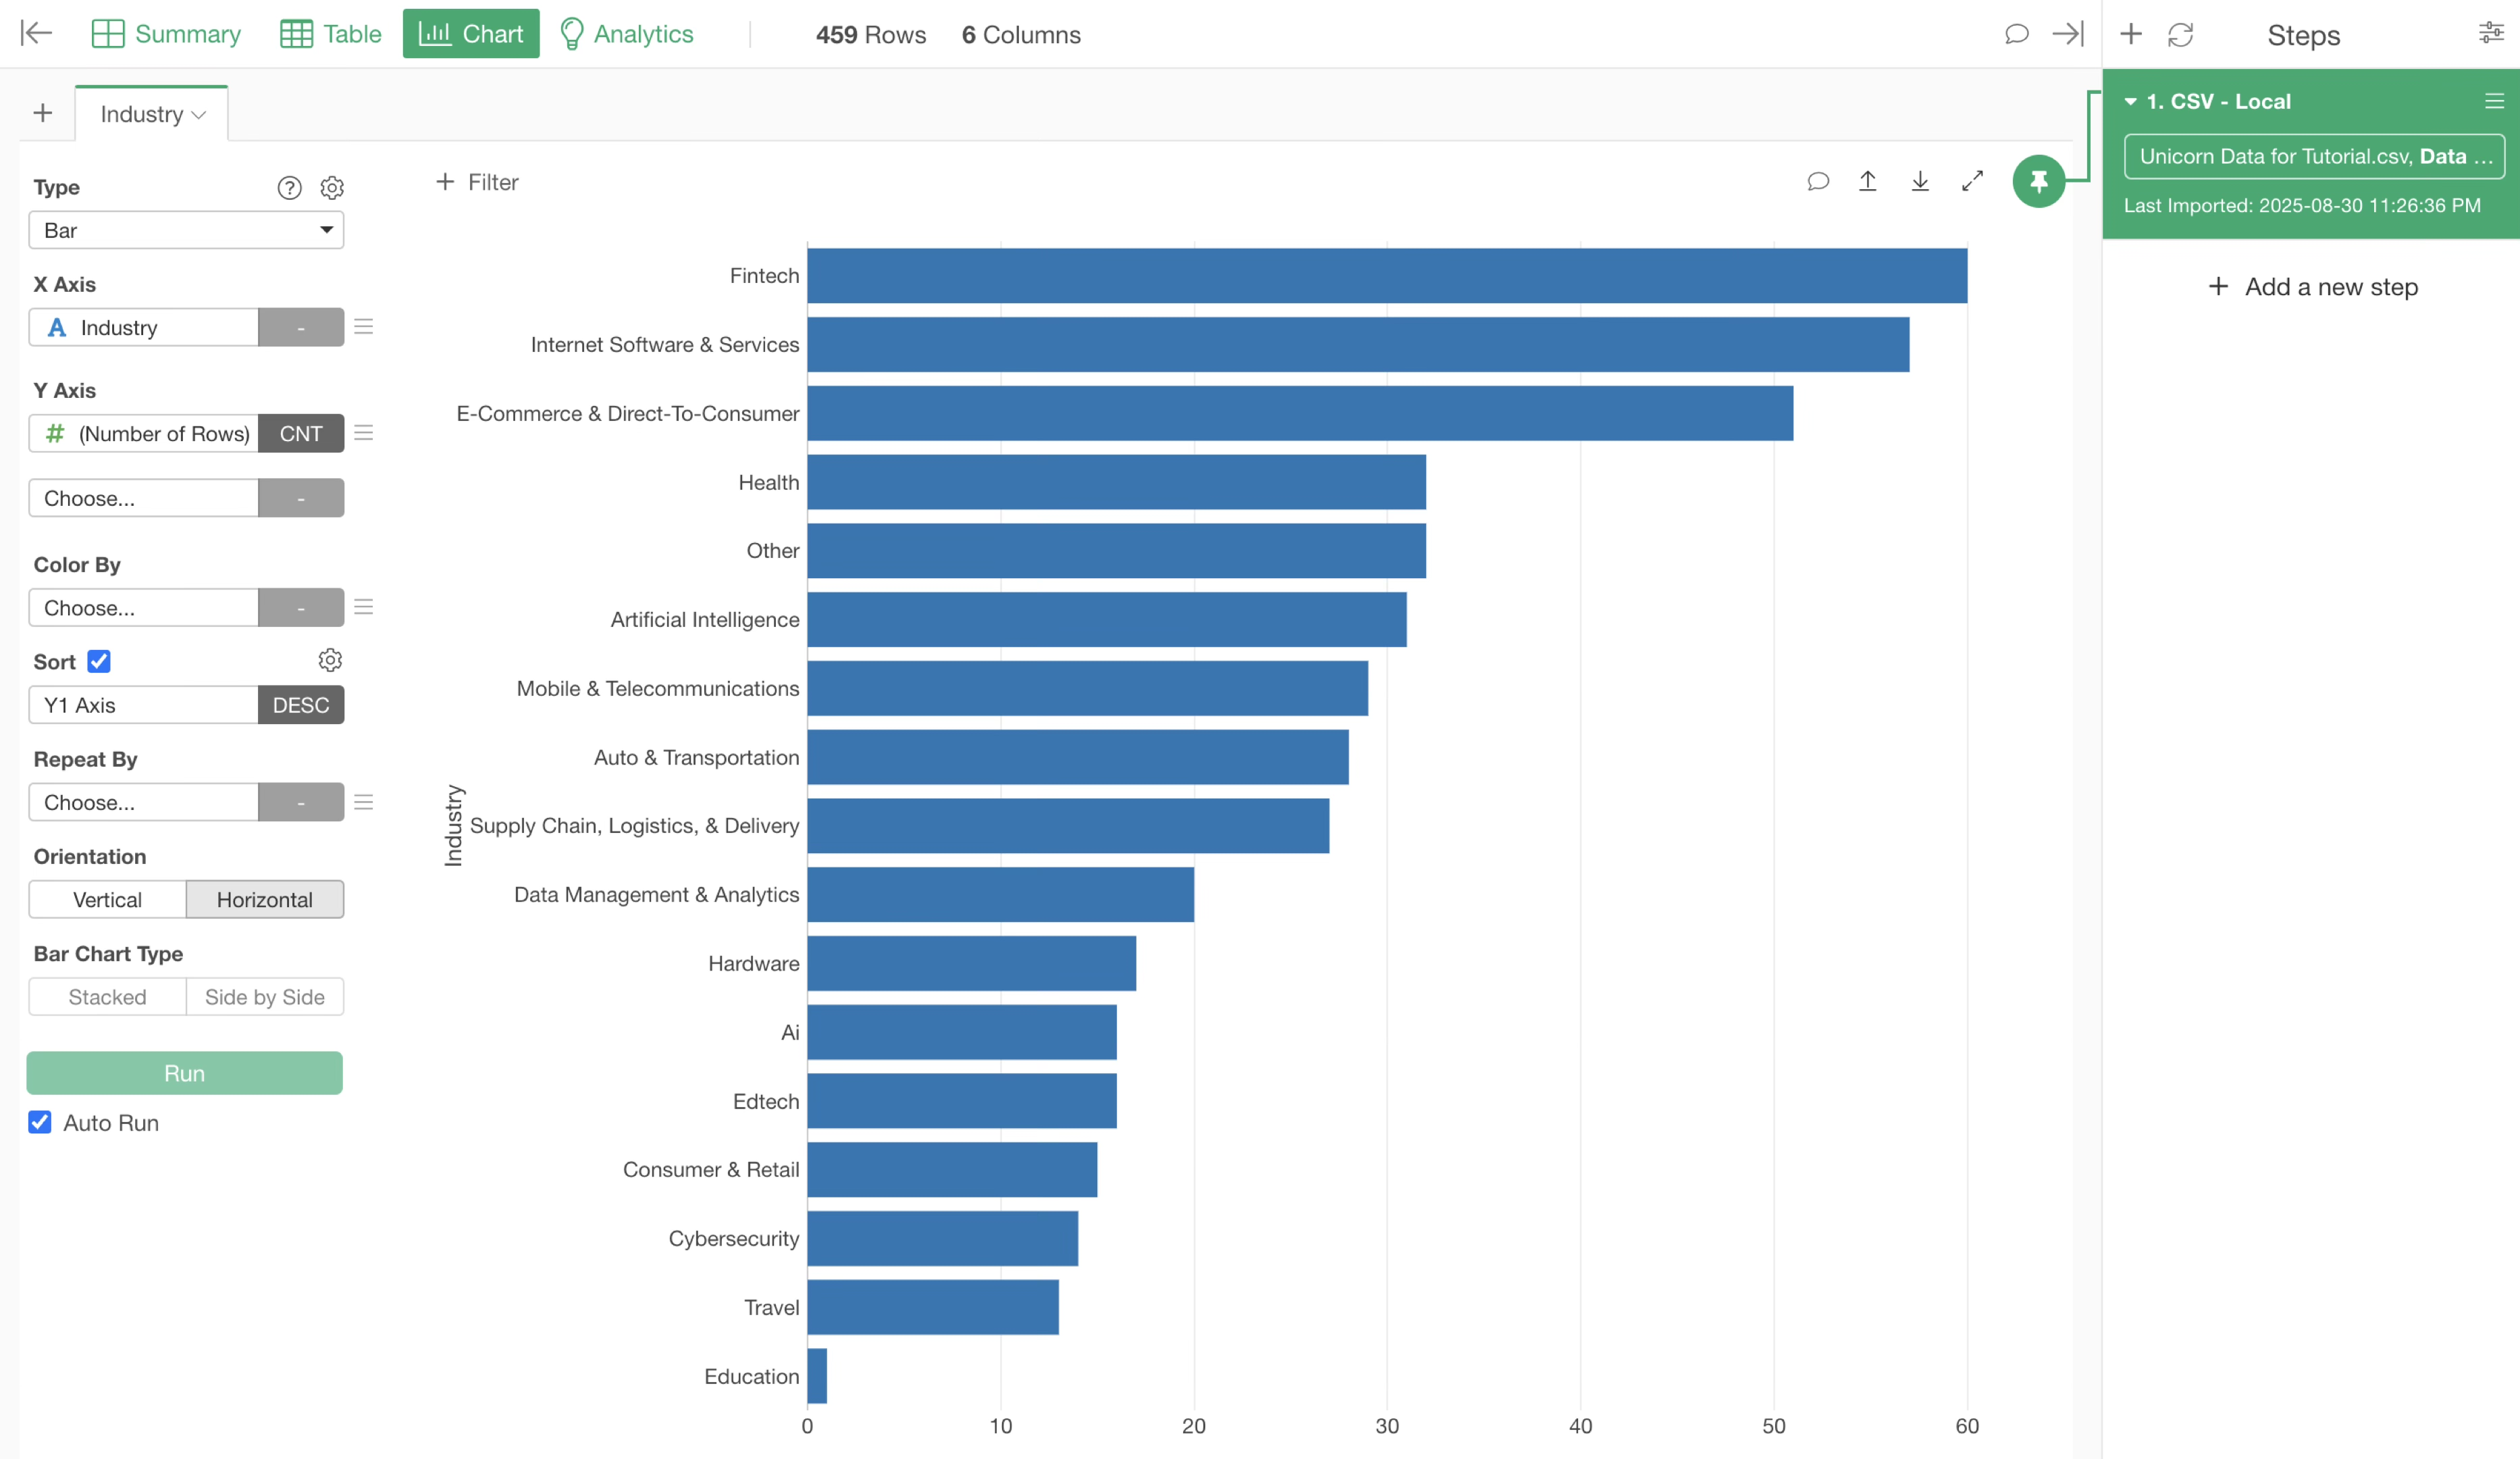
If you want to change the orientation of the bar chart to vertical, select “Vertical” for orientation.
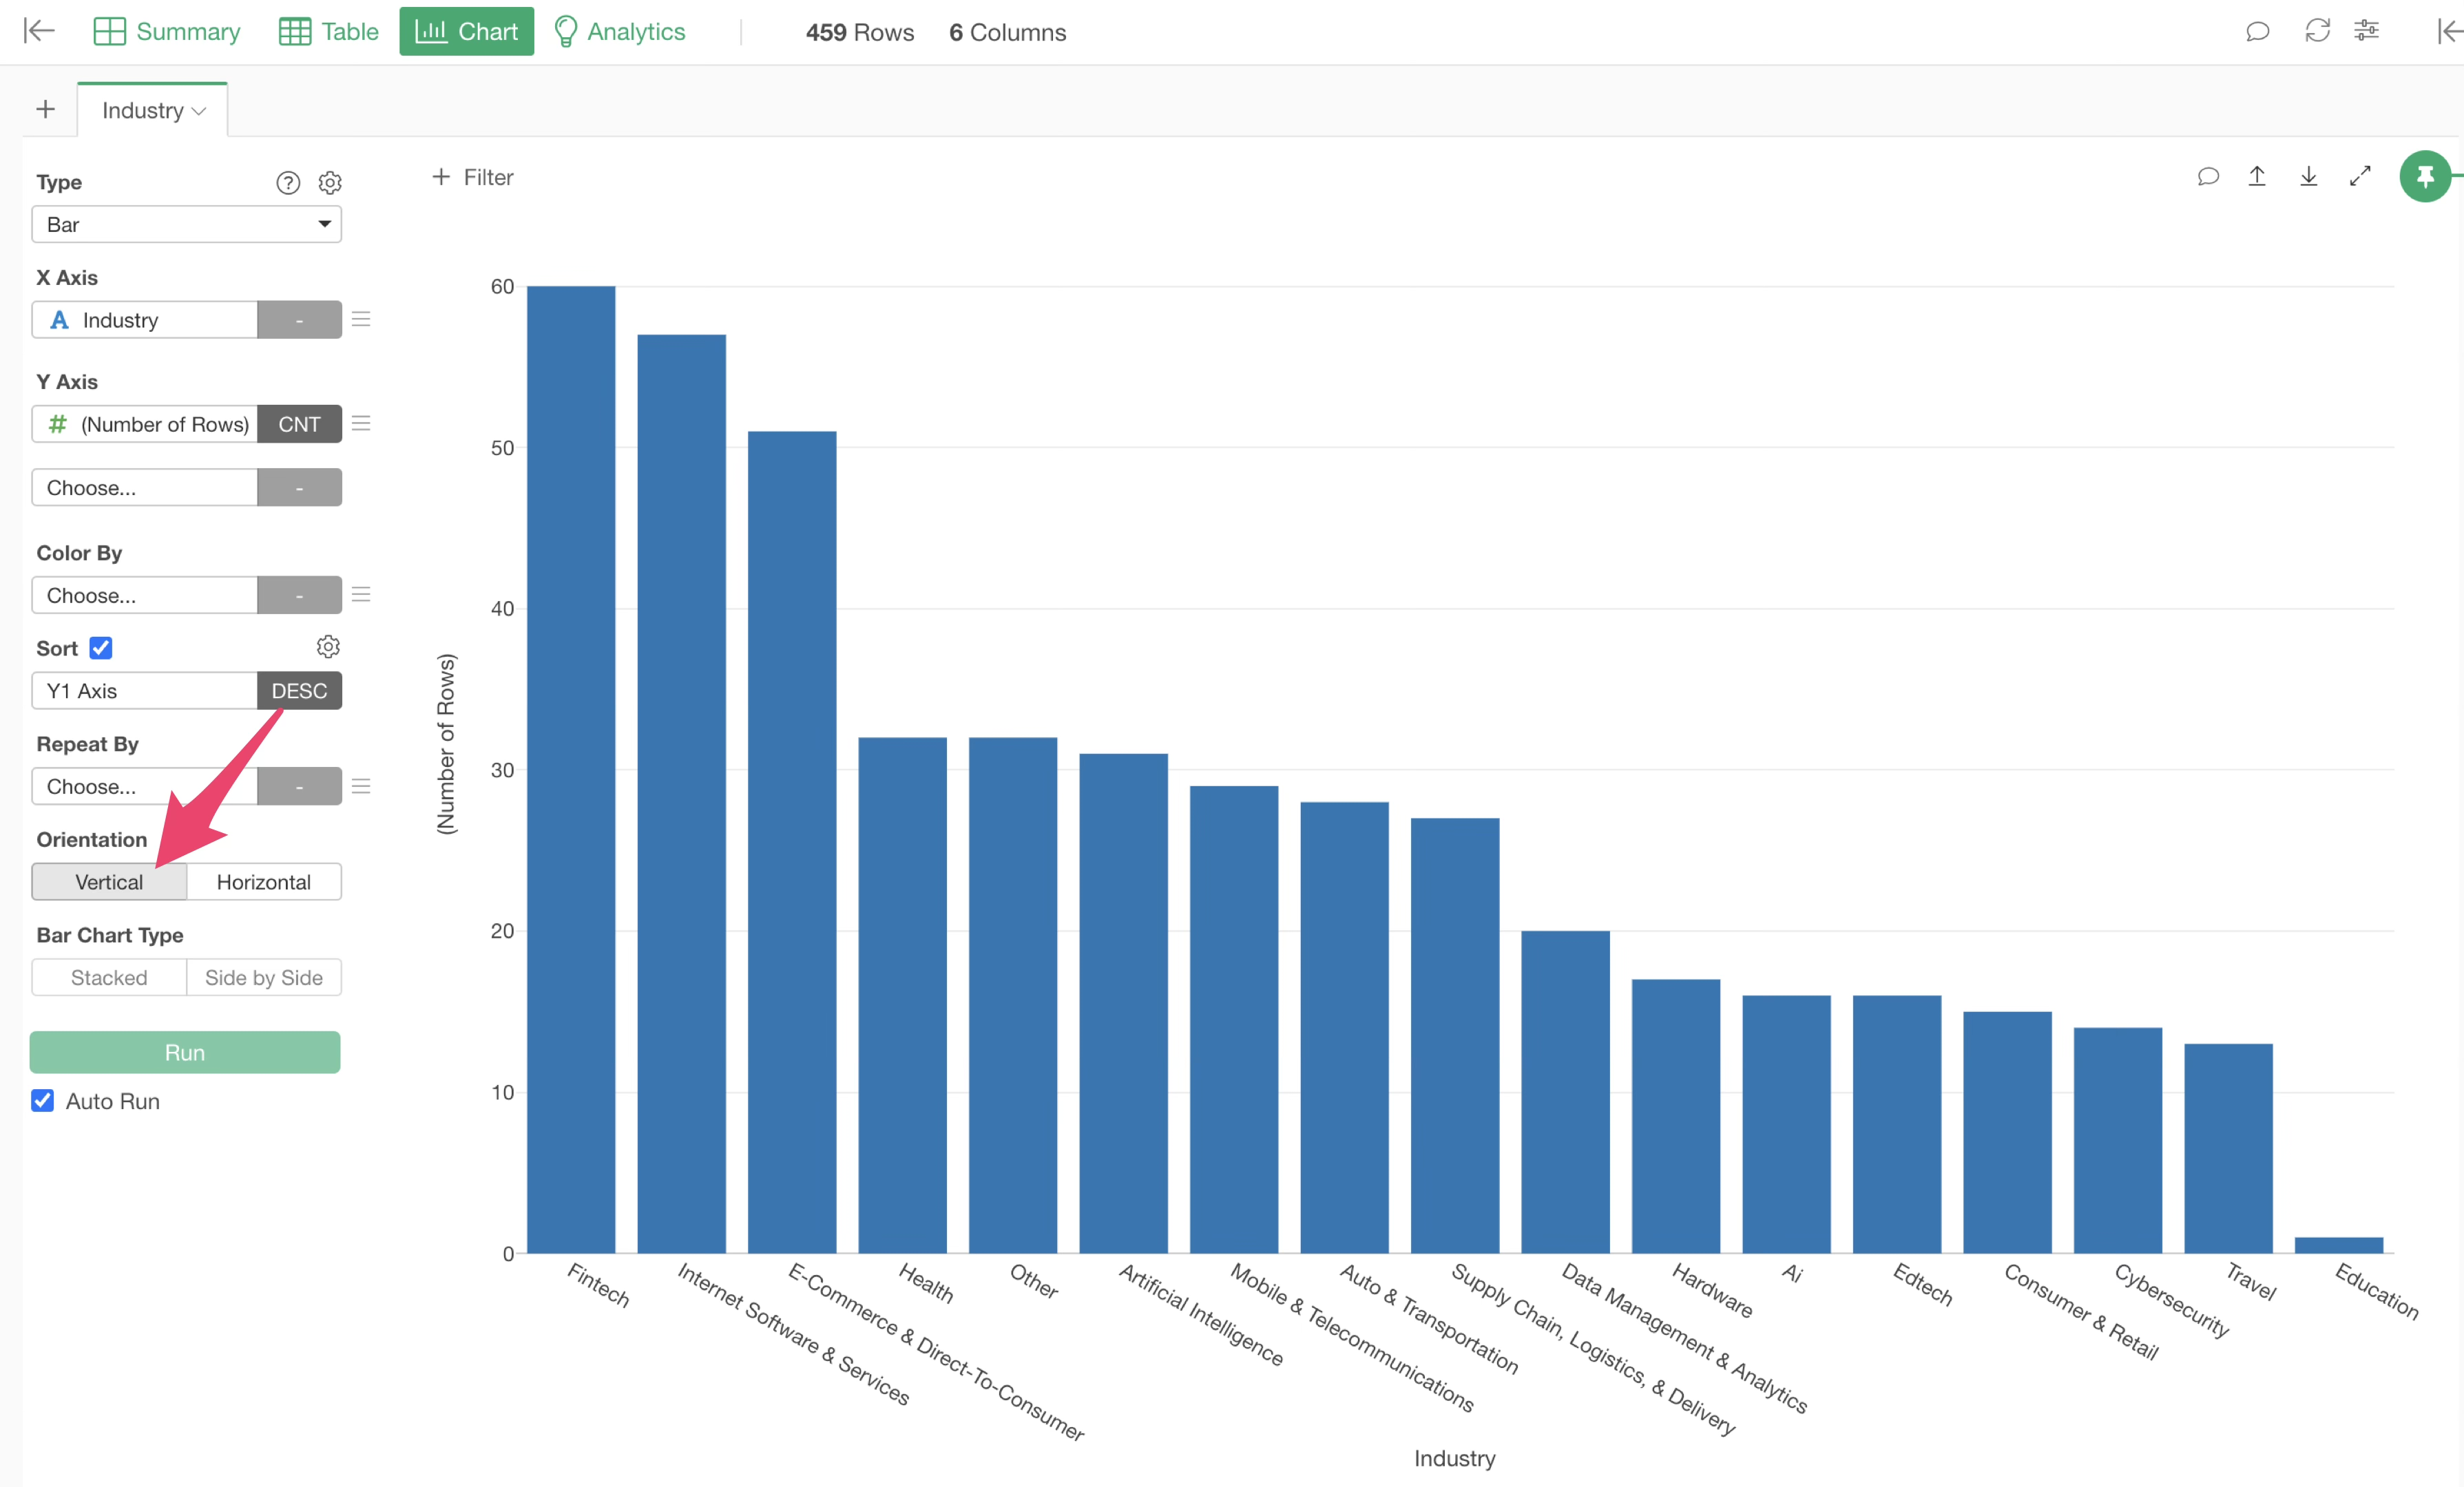
It appears that the “Industry” column contains “Artificial Intelligence” and “Ai,” which represent the same “AI” value. To count these as the same category, we want to replace both with “AI” to standardize the notation.
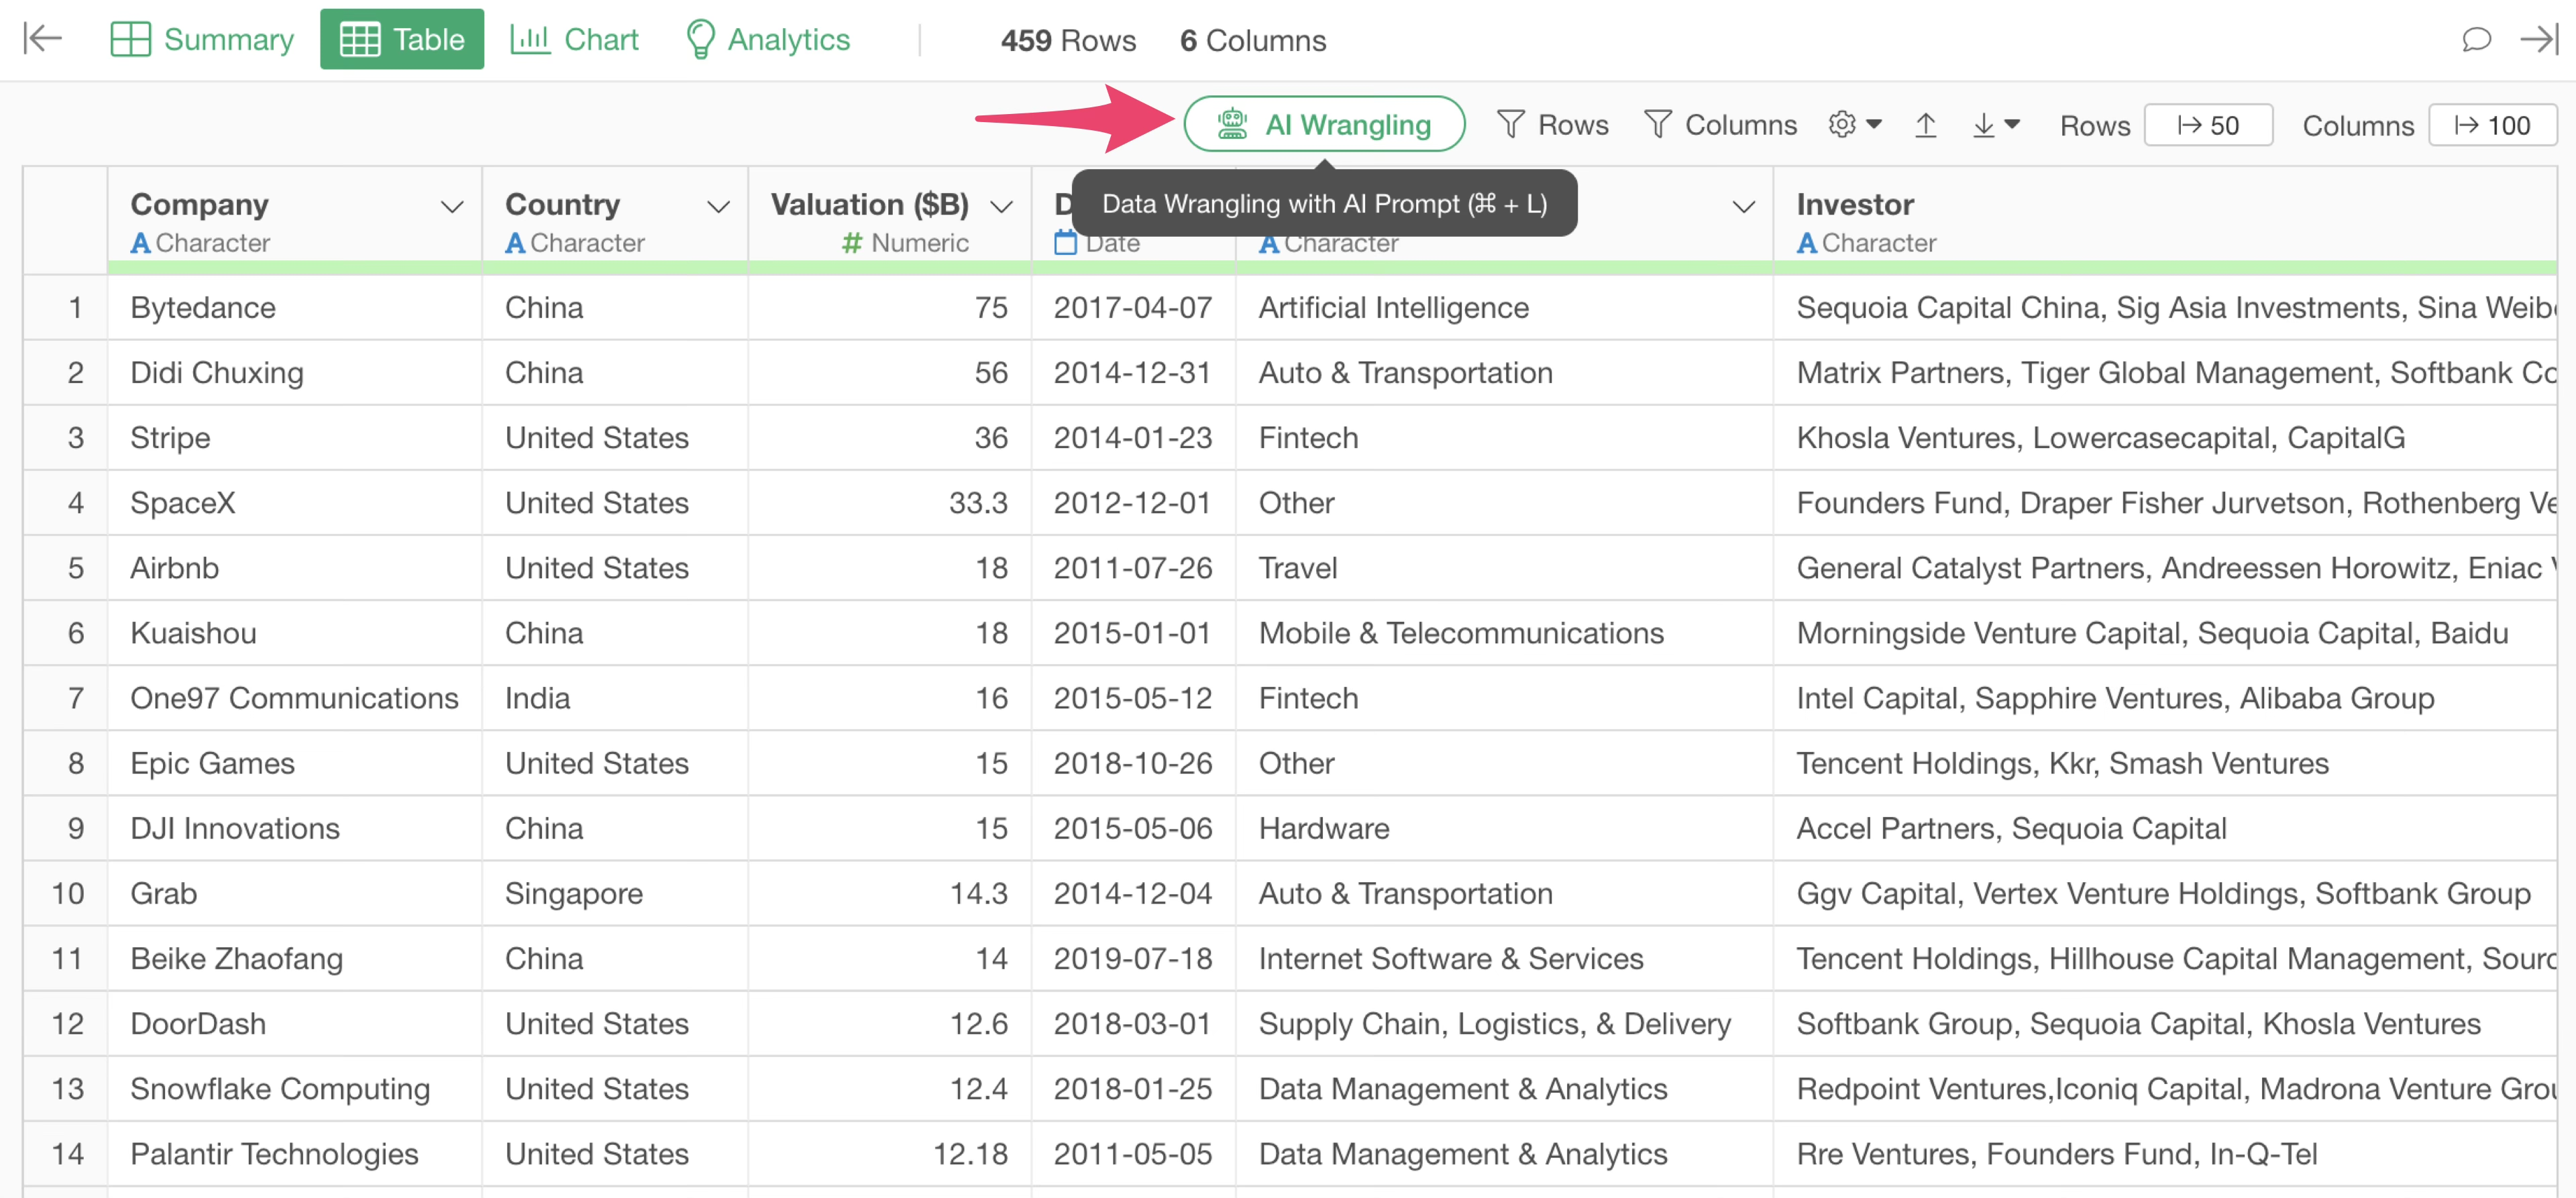
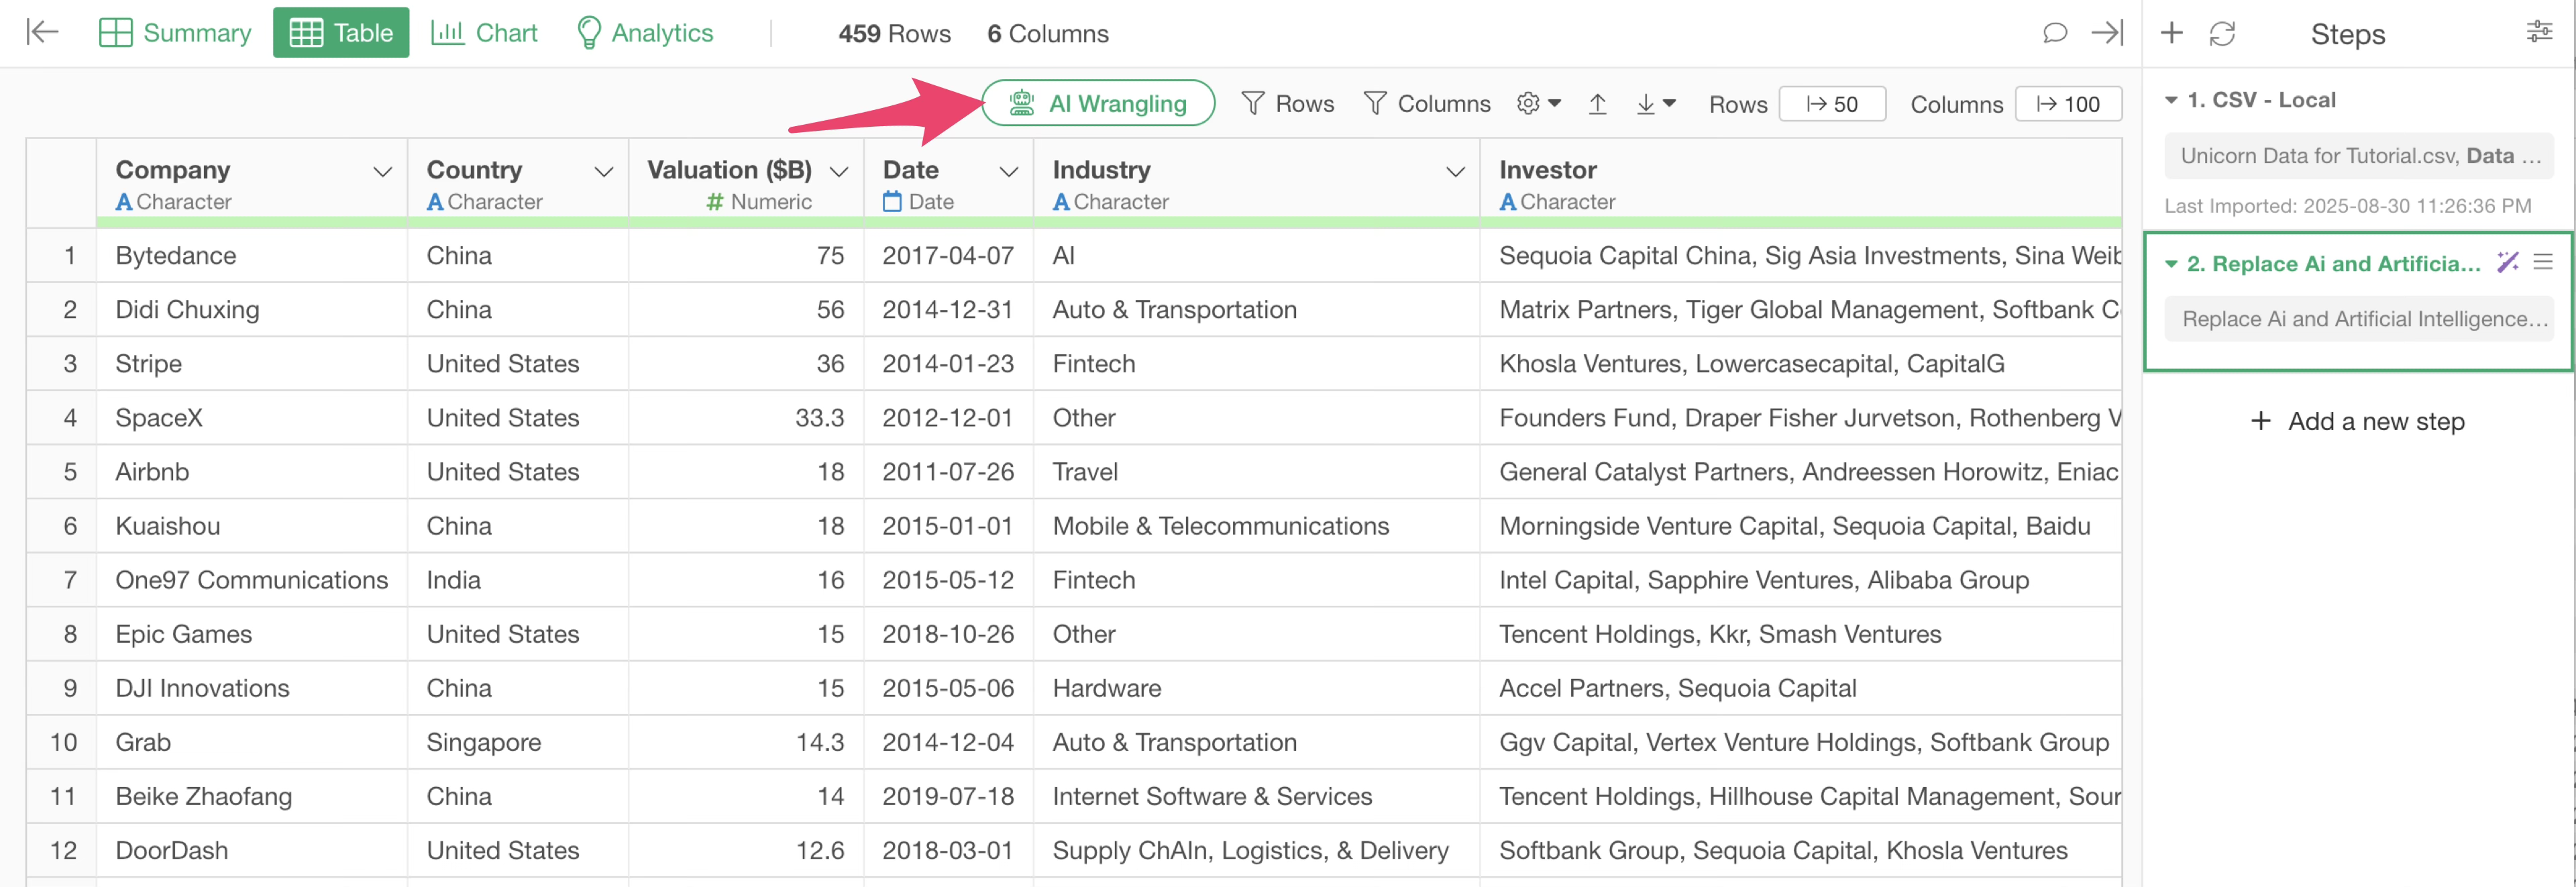
Click the “AI Wrangling” button.
The AI Prompt dialog will appear. Enter the following prompt:
Replace Ai and Artificial Intelligence in Industry with AI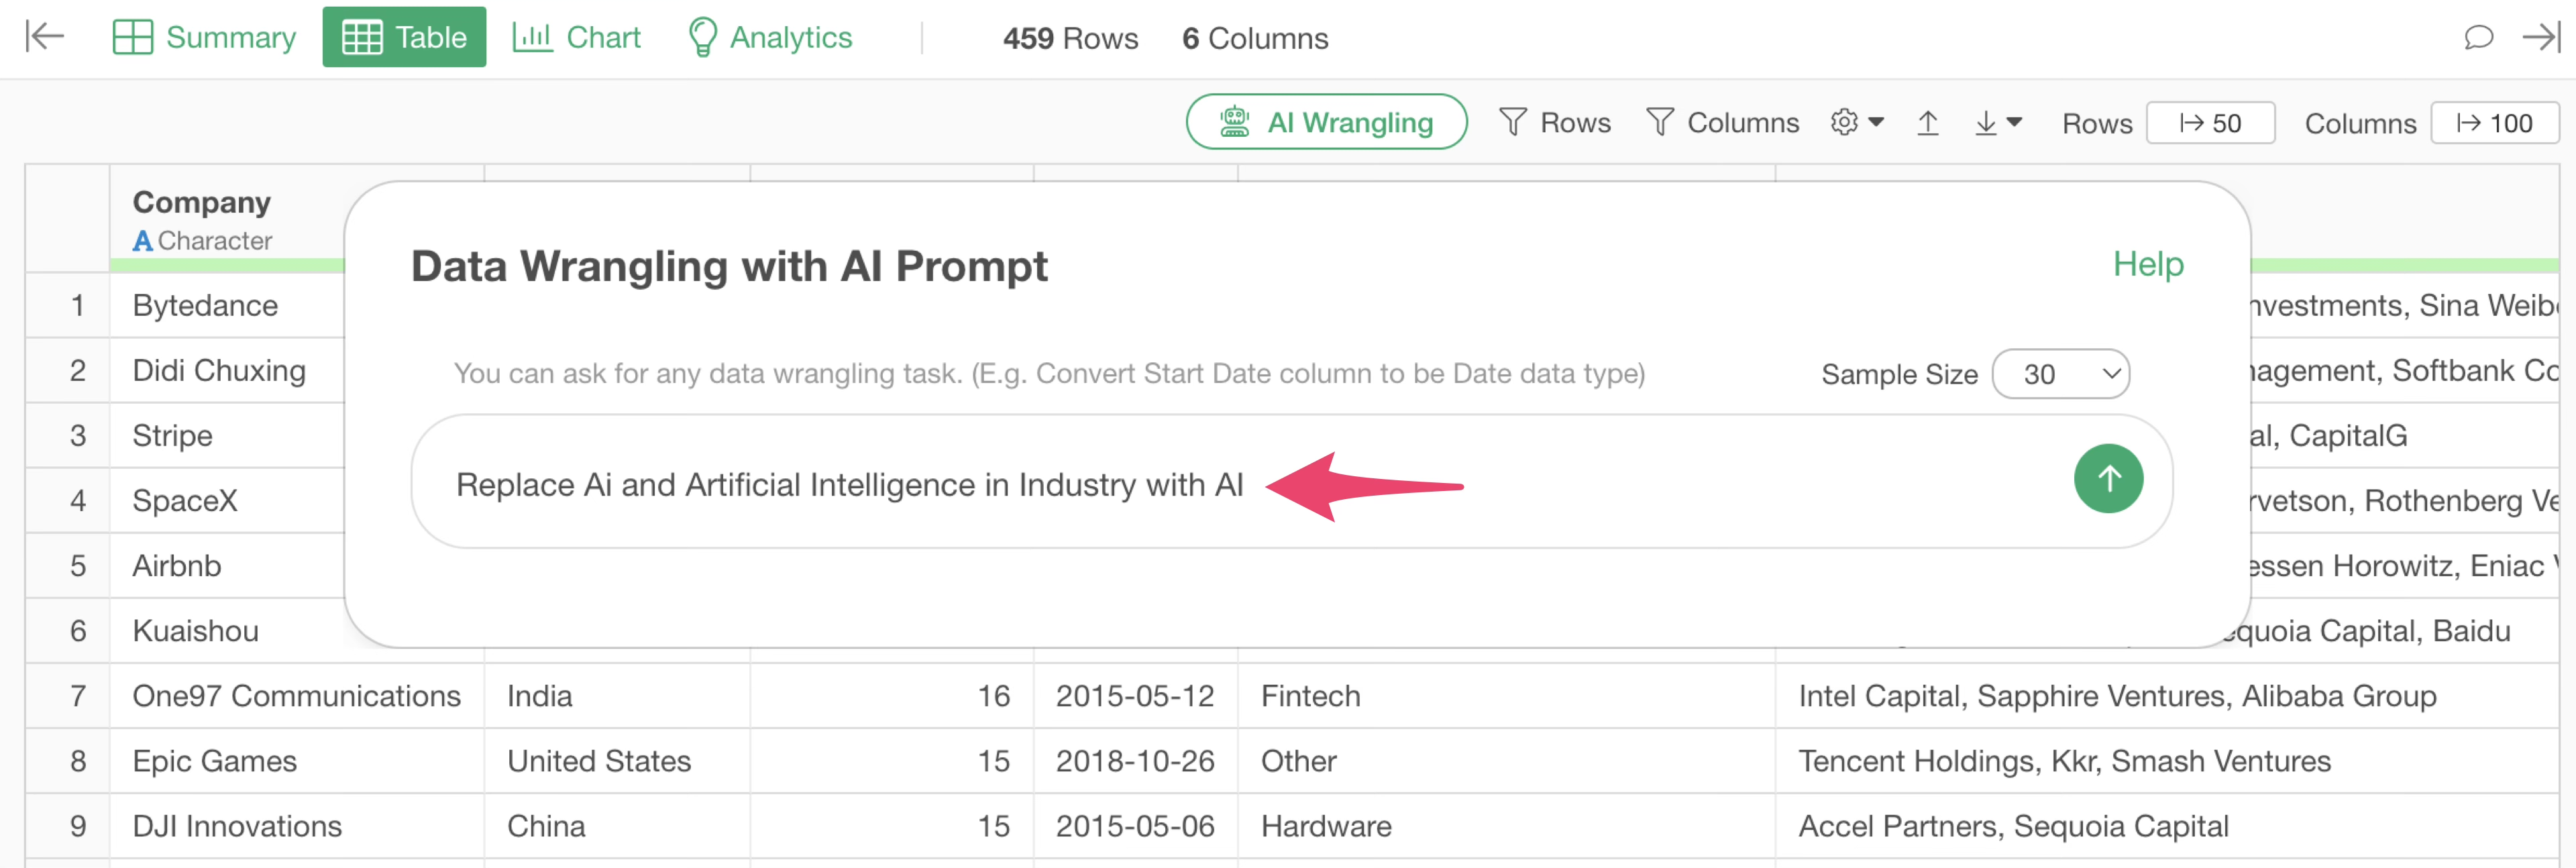
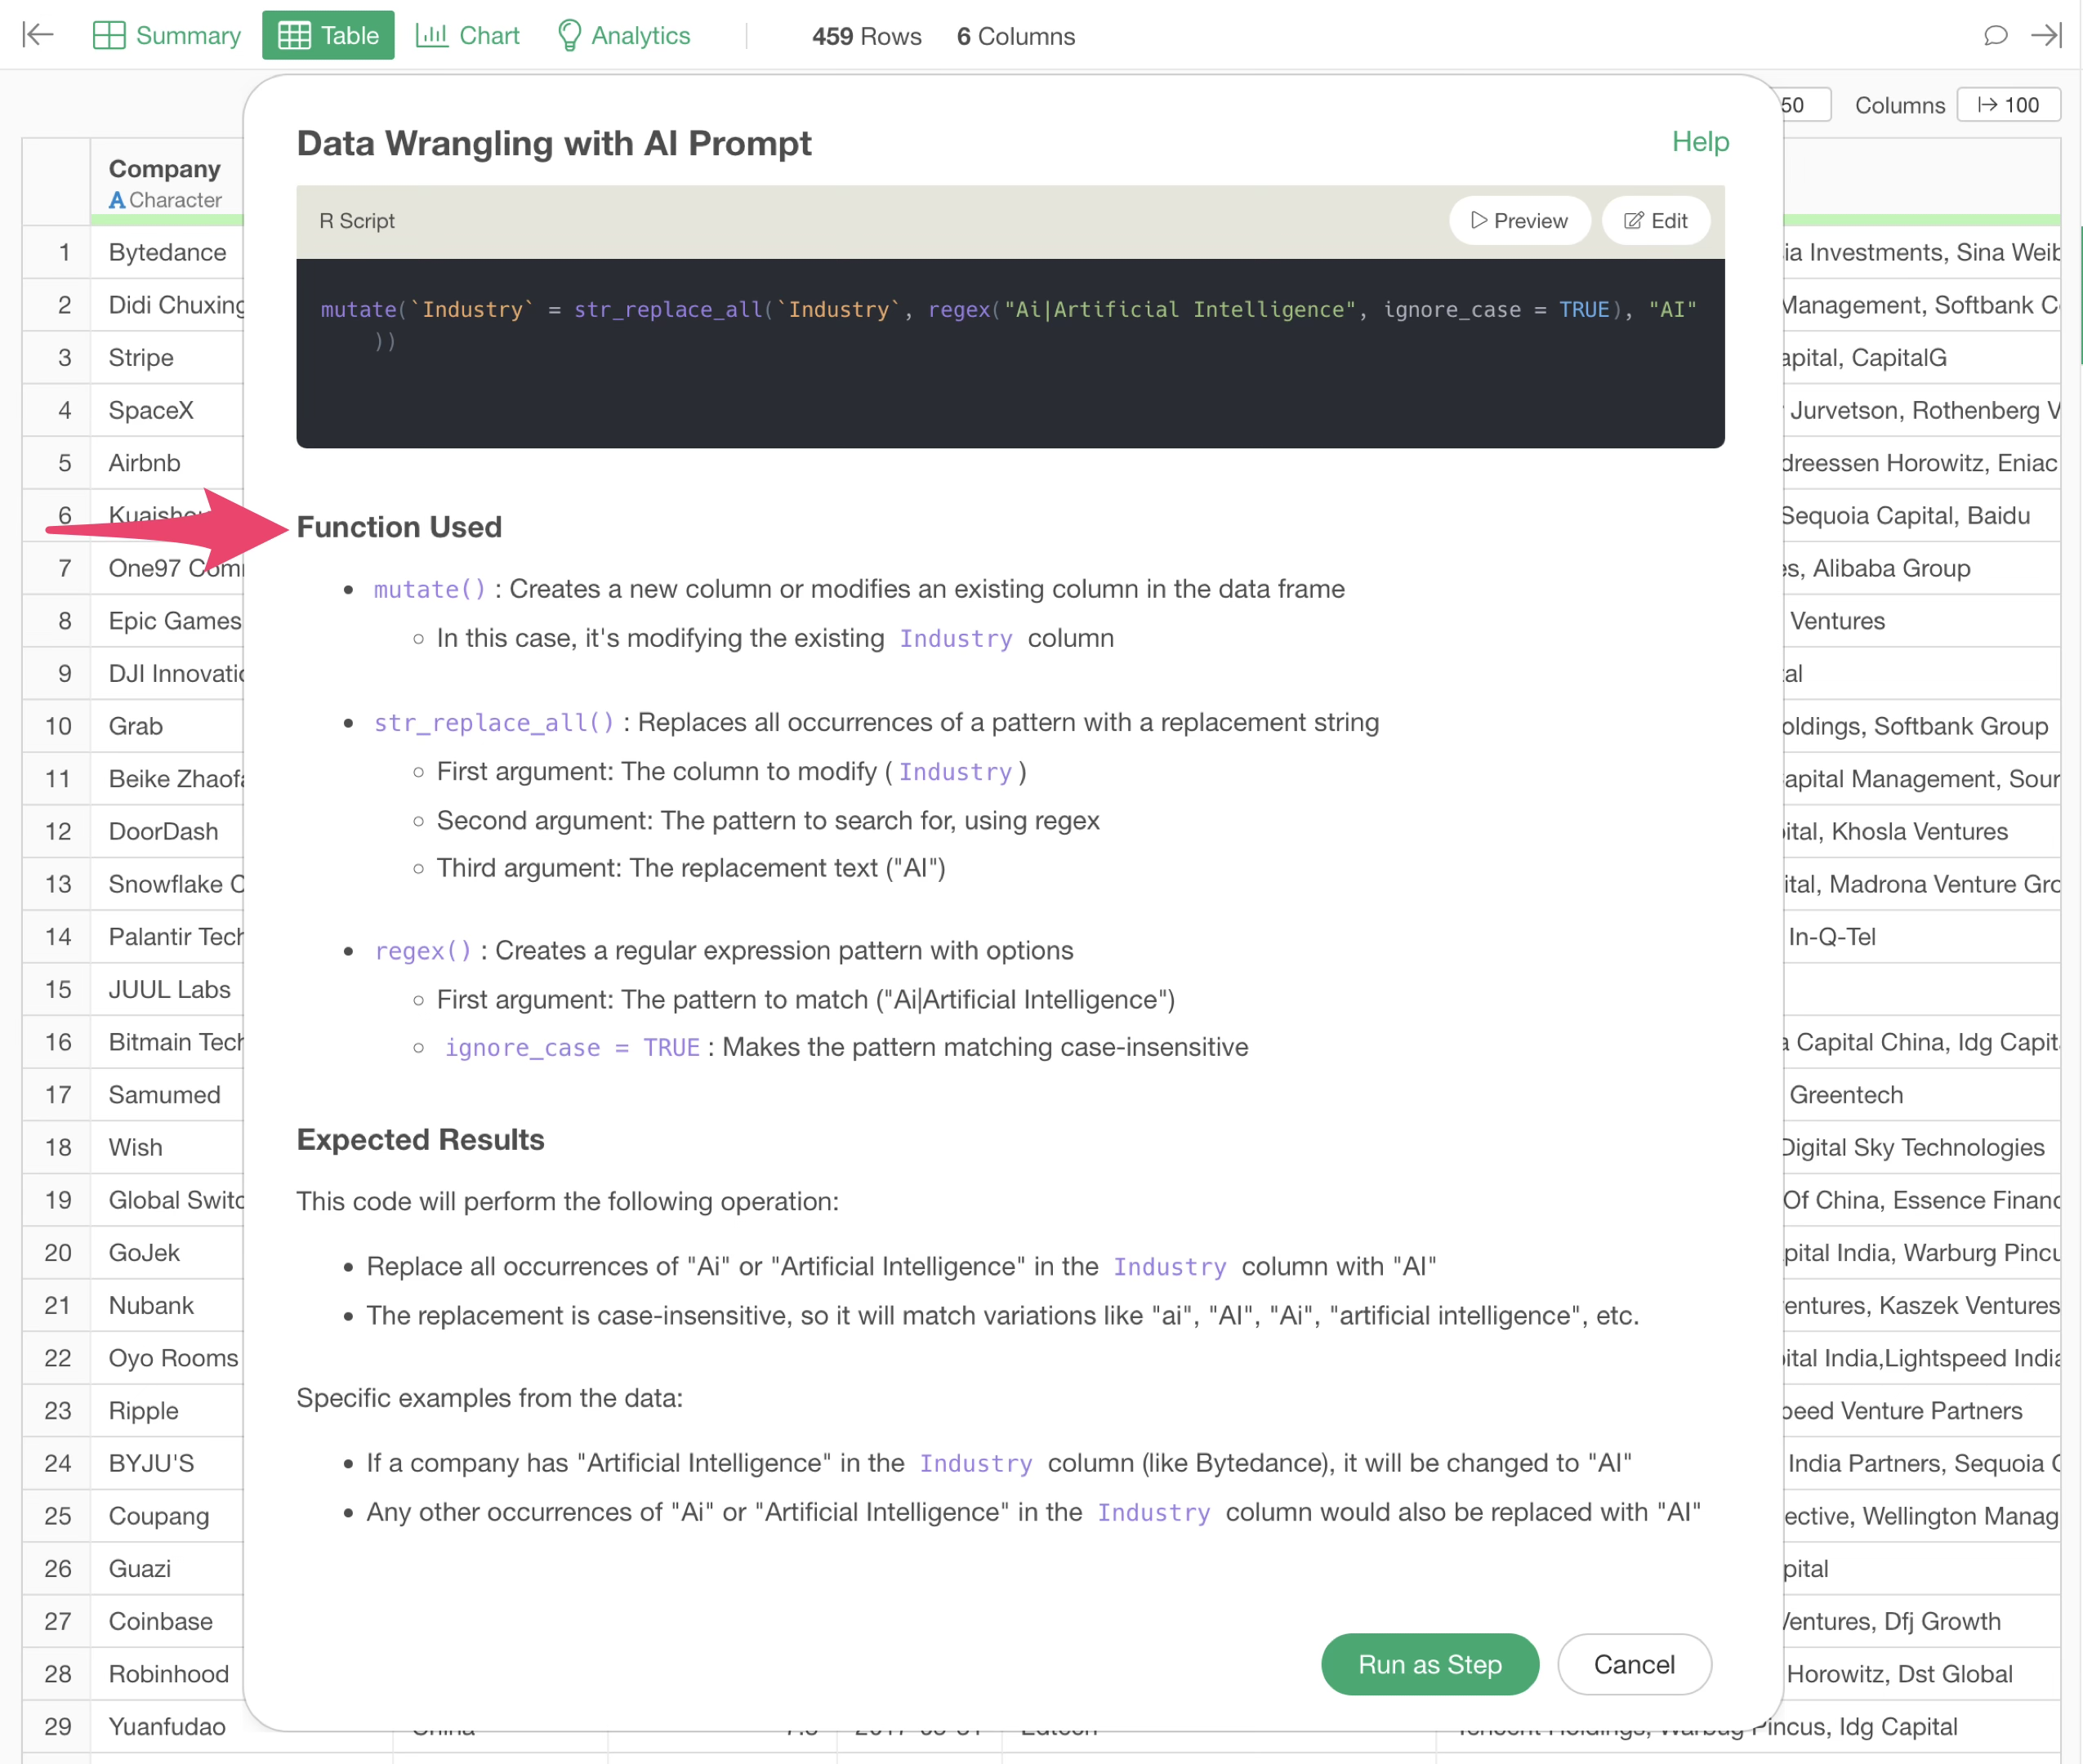
The AI will return an R script to replace “Ai” and “Artificial Intelligence” in the “Industry” column with “AI.”
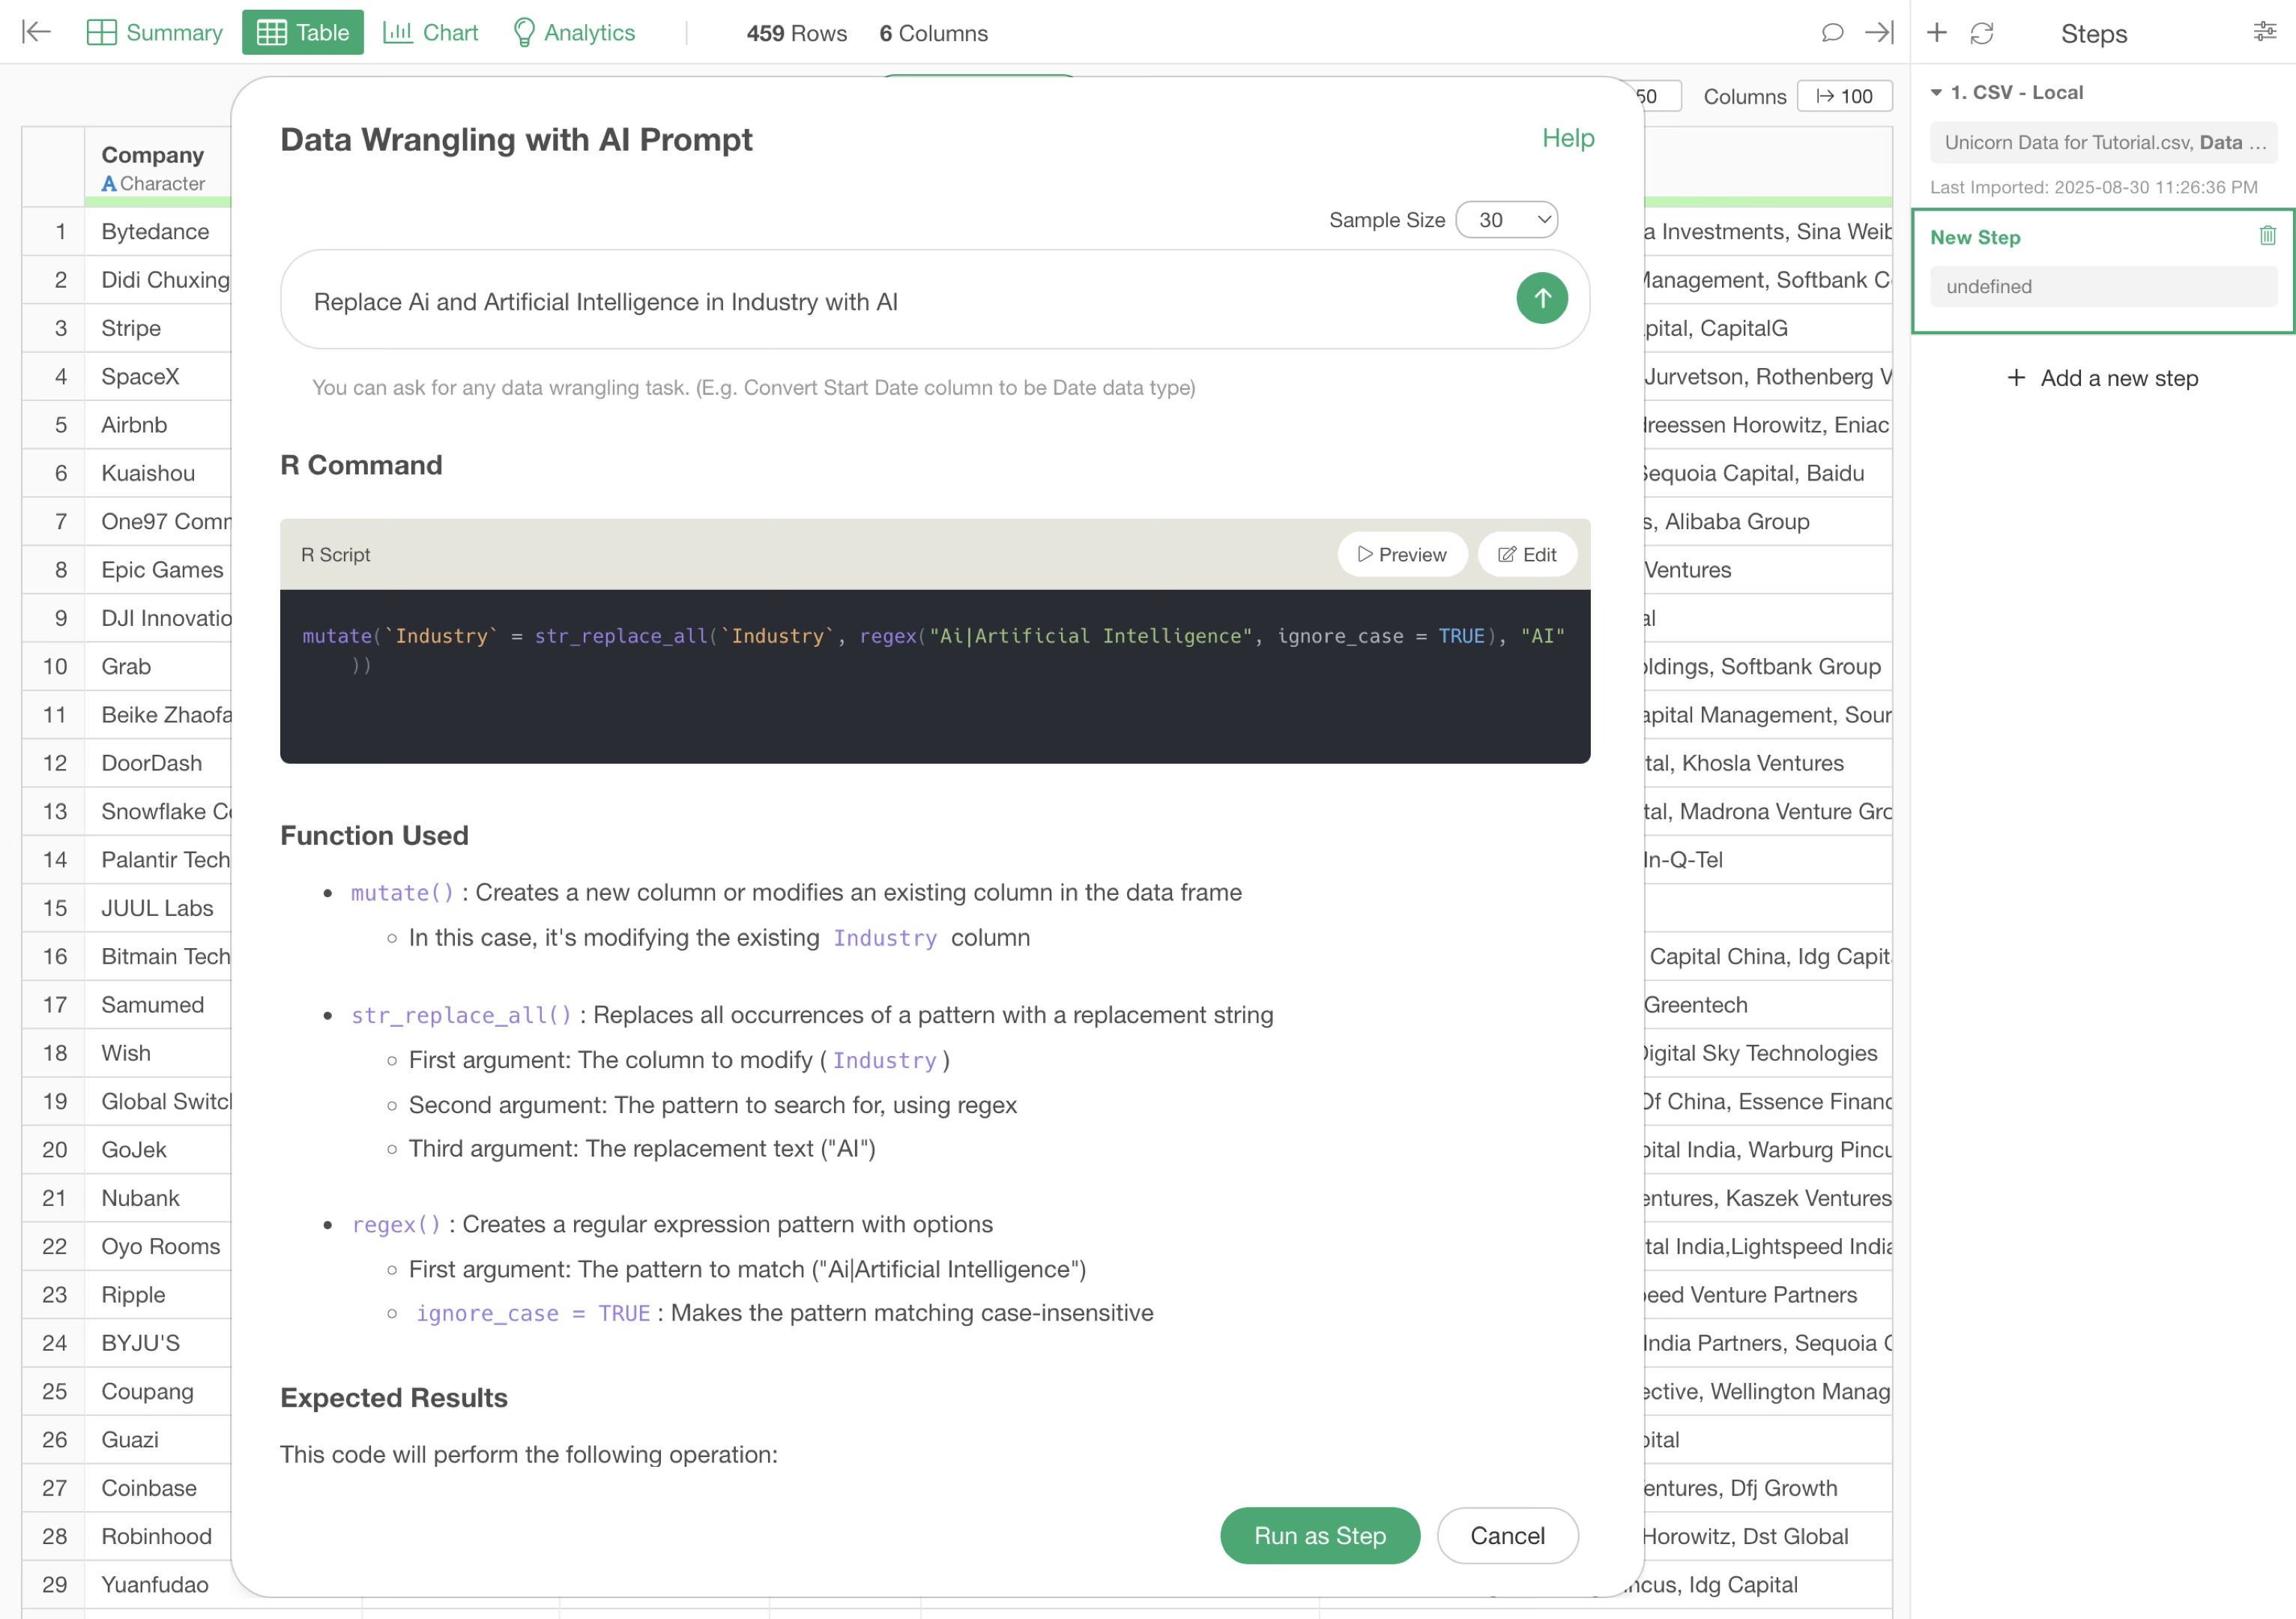
The functions used in the R command are explained in the “Functions Used” section, detailing what functions and arguments are employed.
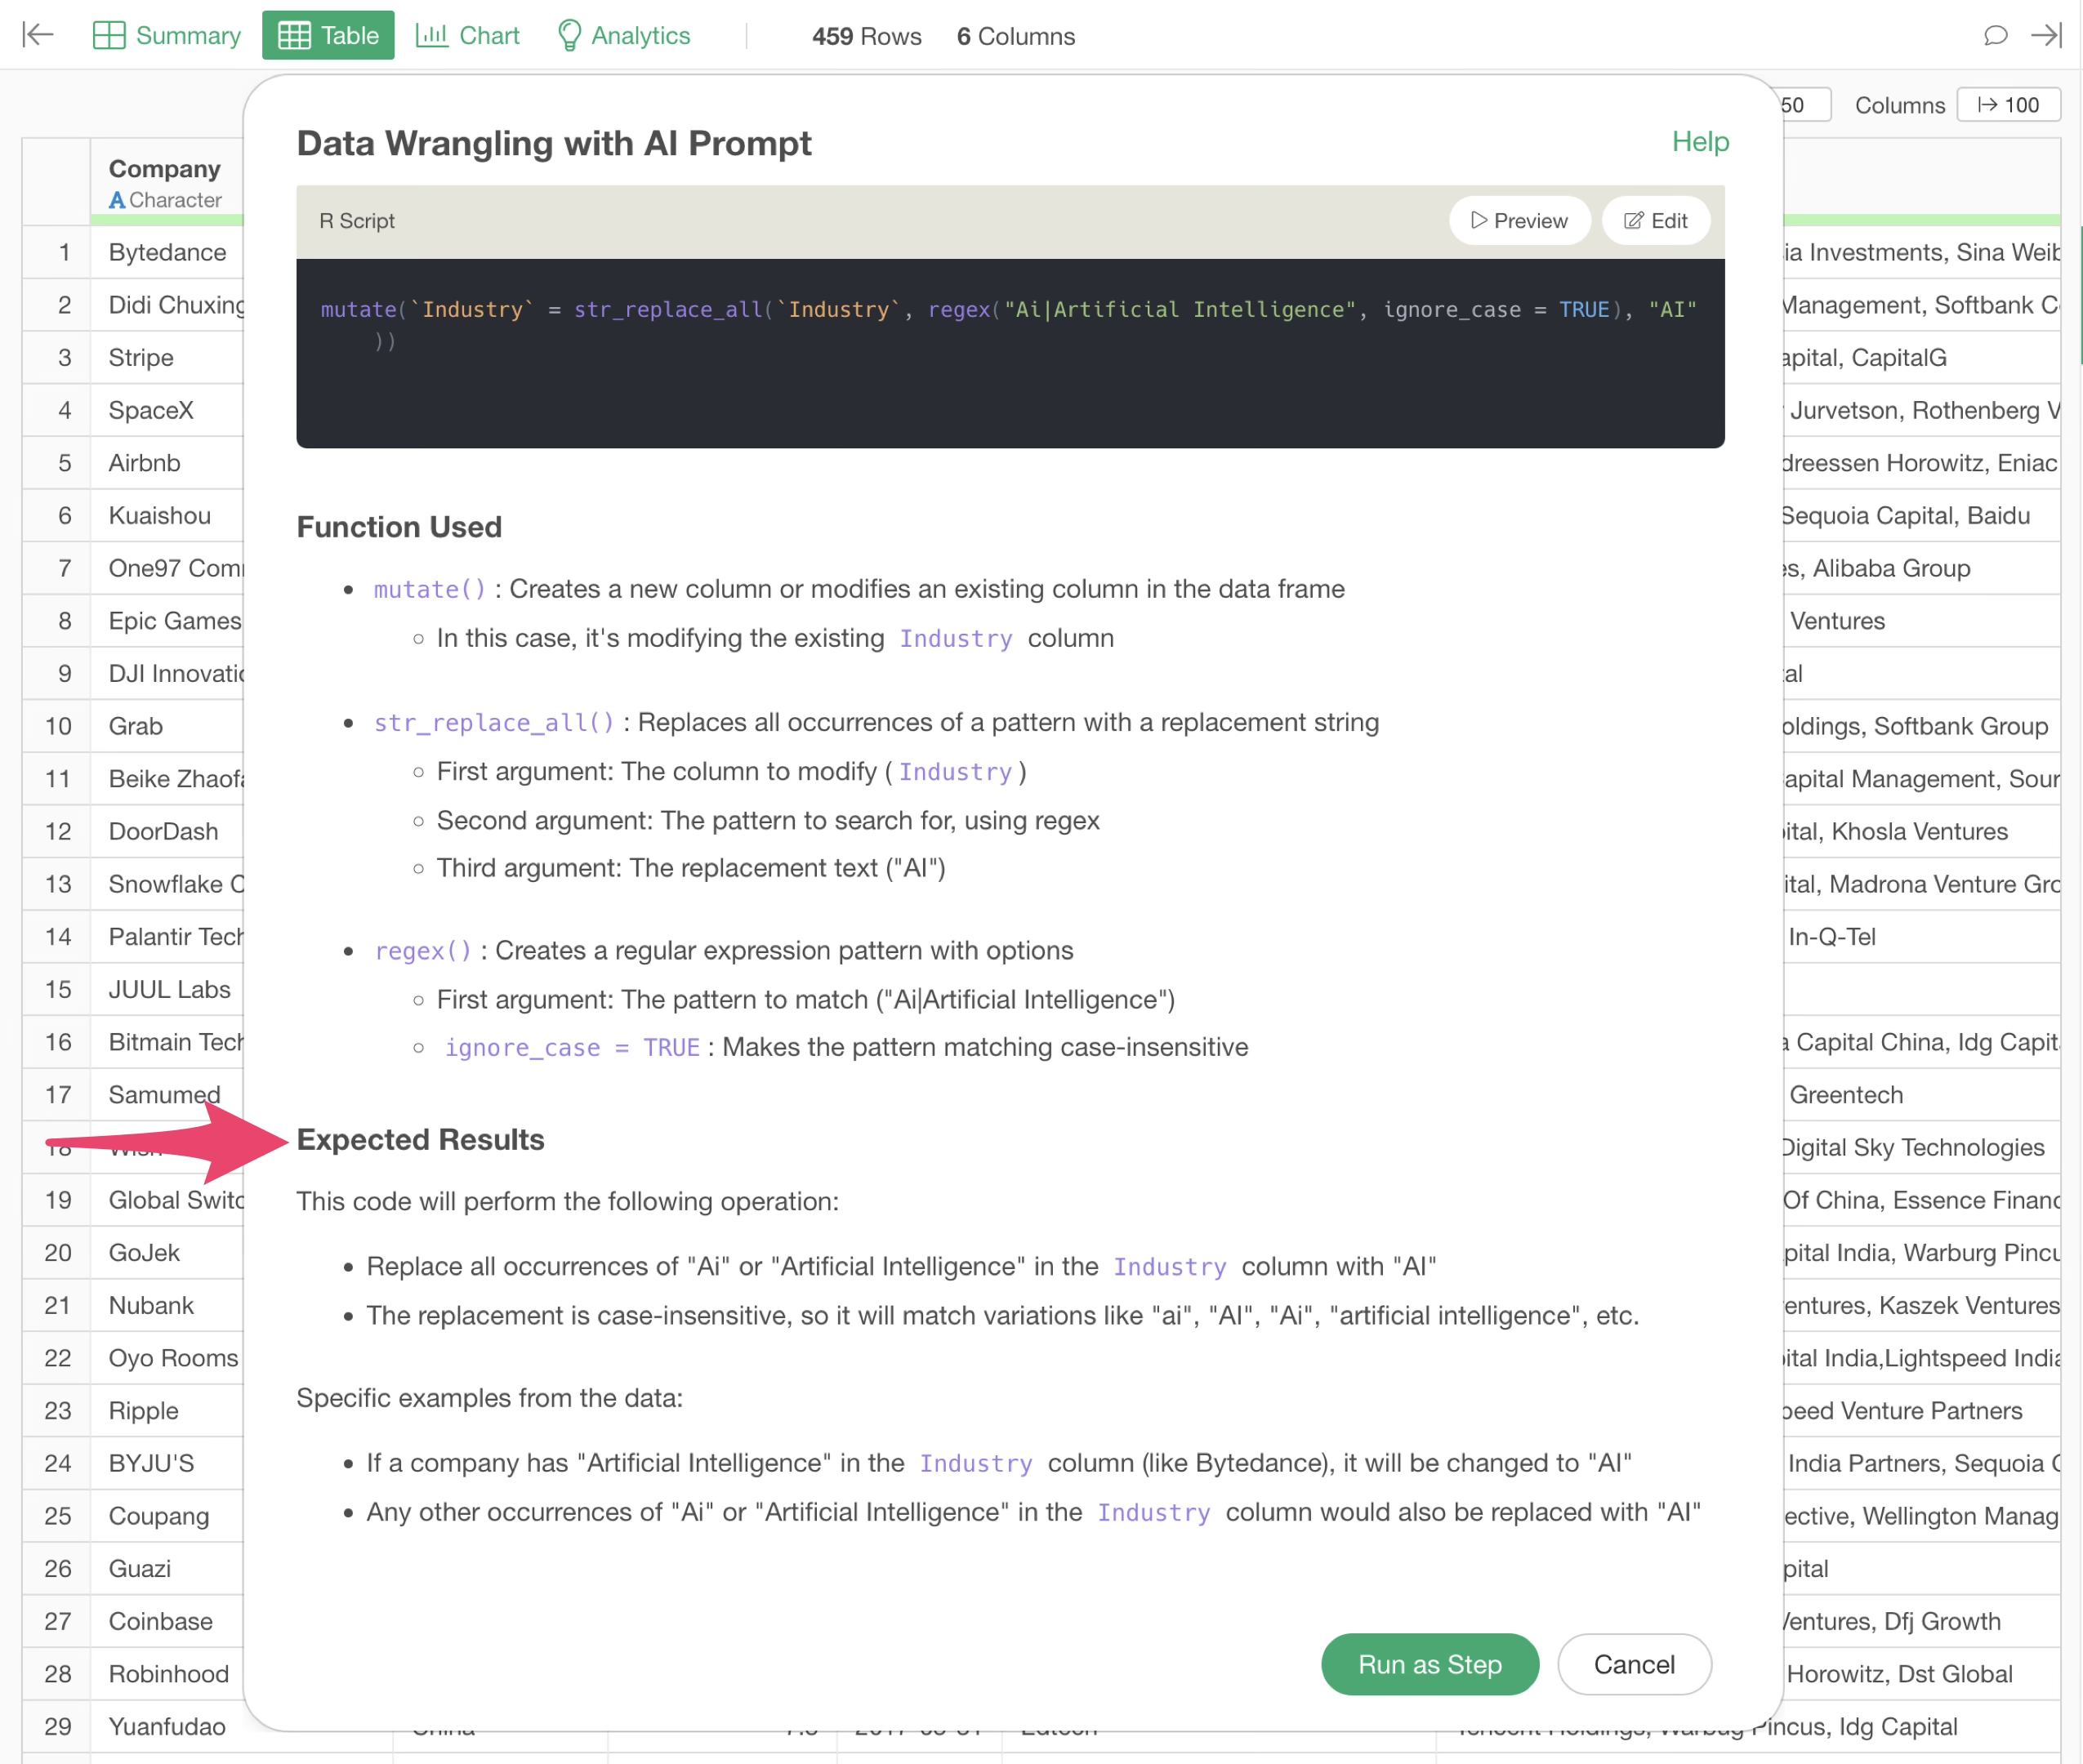
Additionally, the “Expected Results” section describes what outcomes can be anticipated from executing this code.
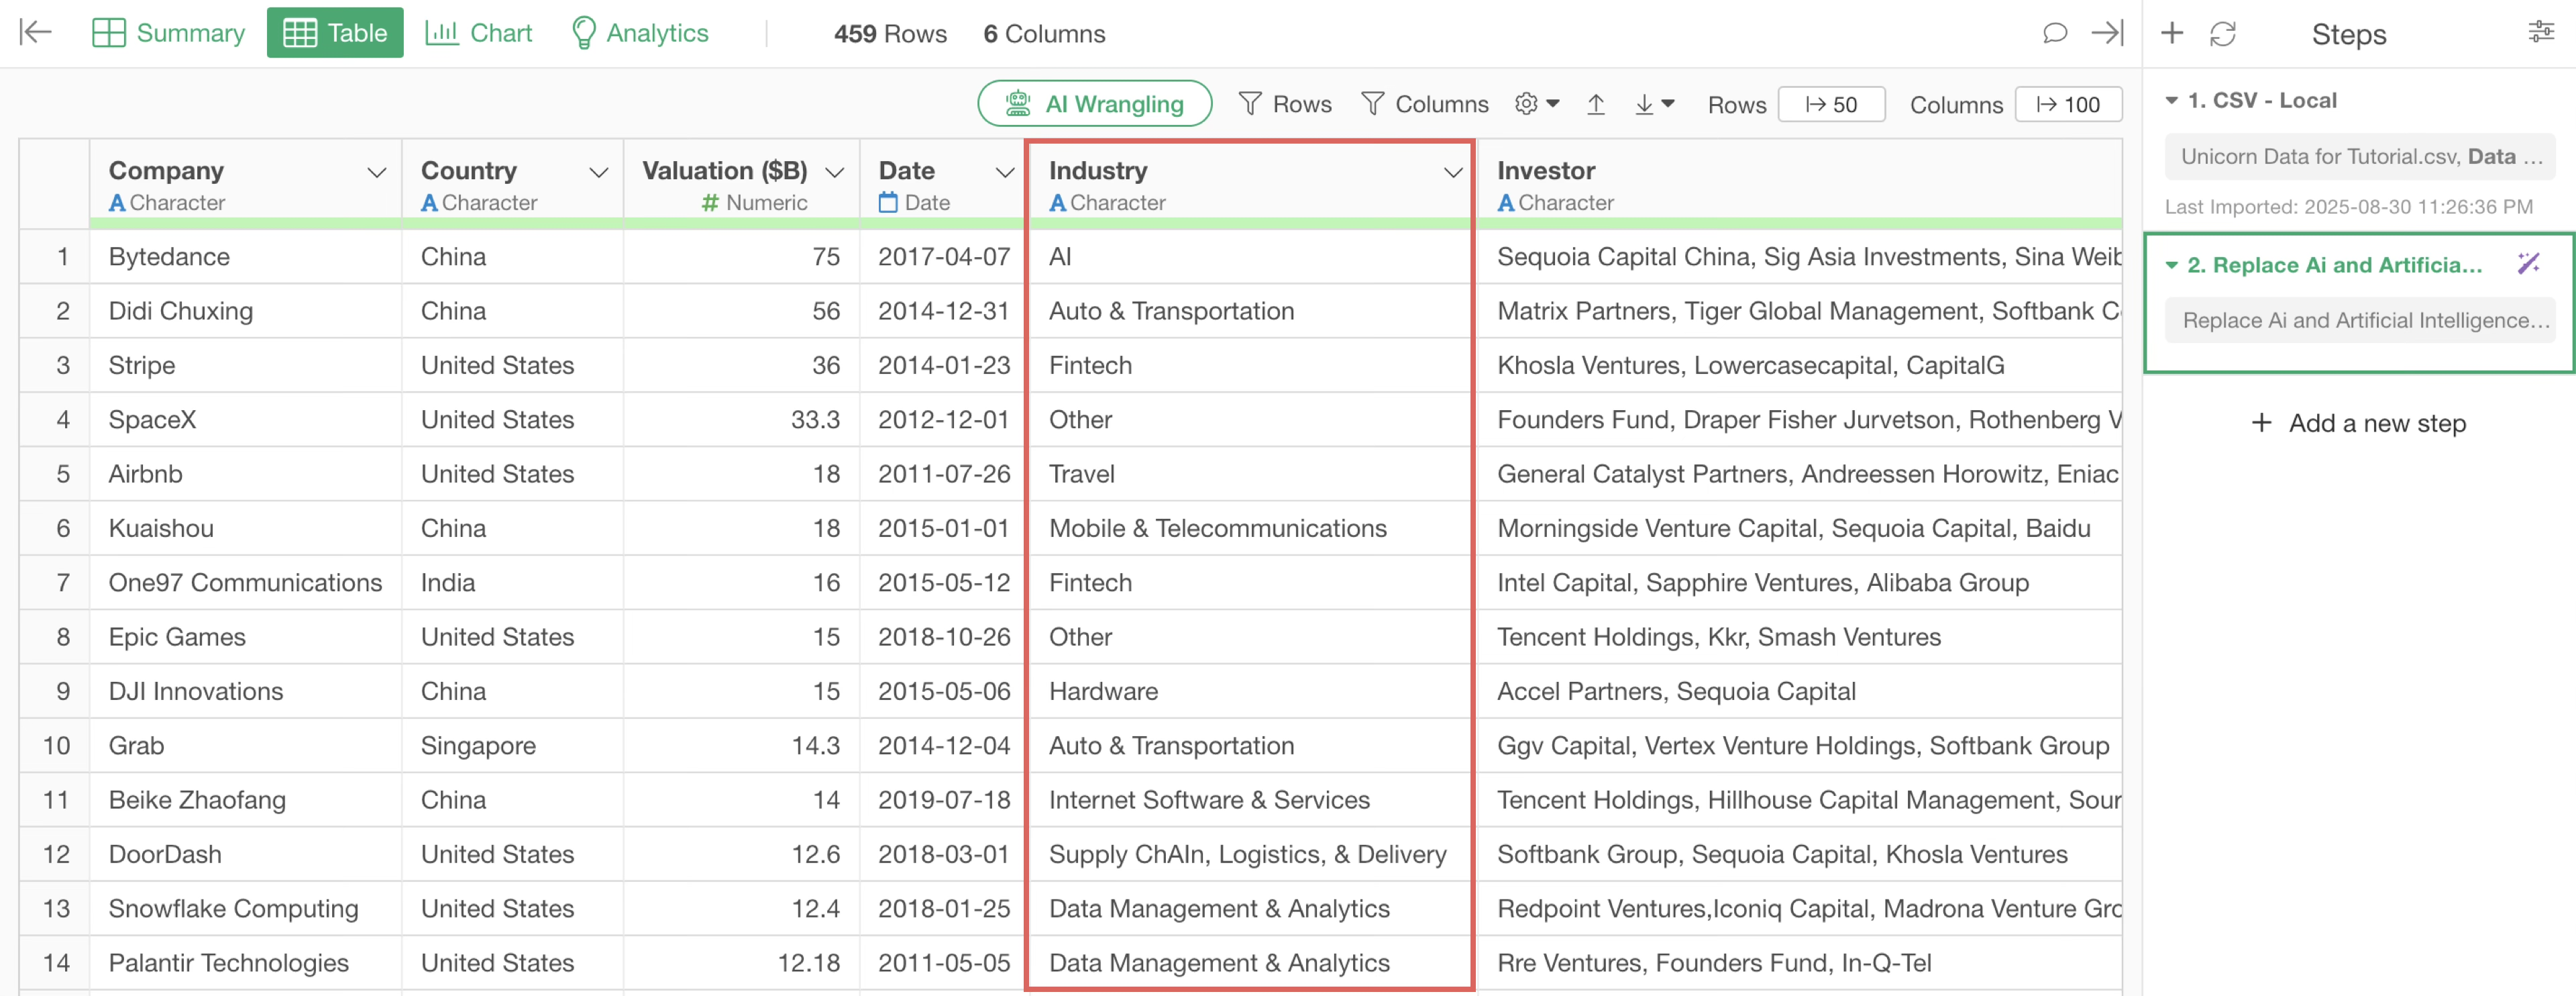
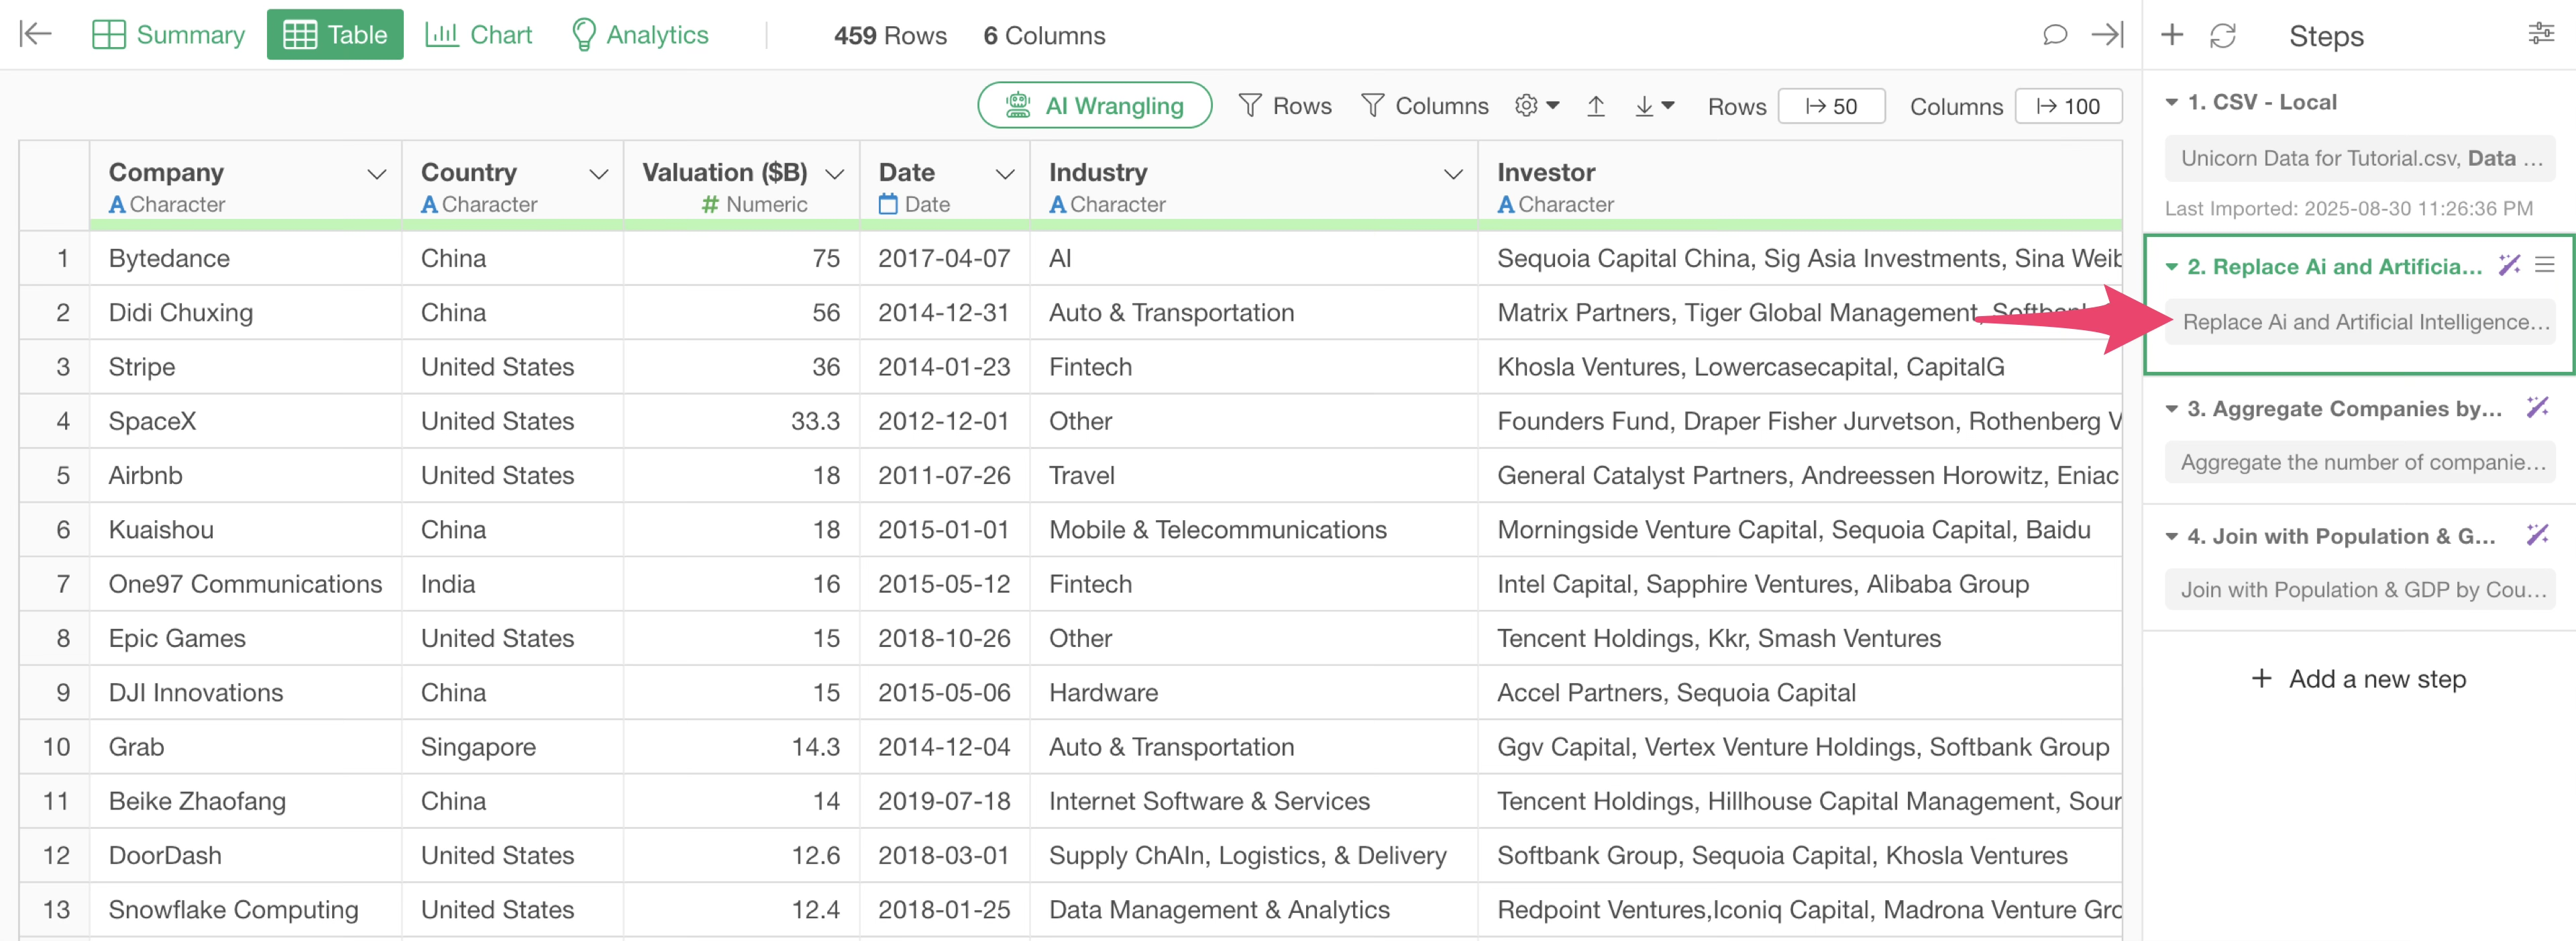
By executing this, we were able to replace “Artificial Intelligence” and “Ai” in the “Industry” column with “AI.”
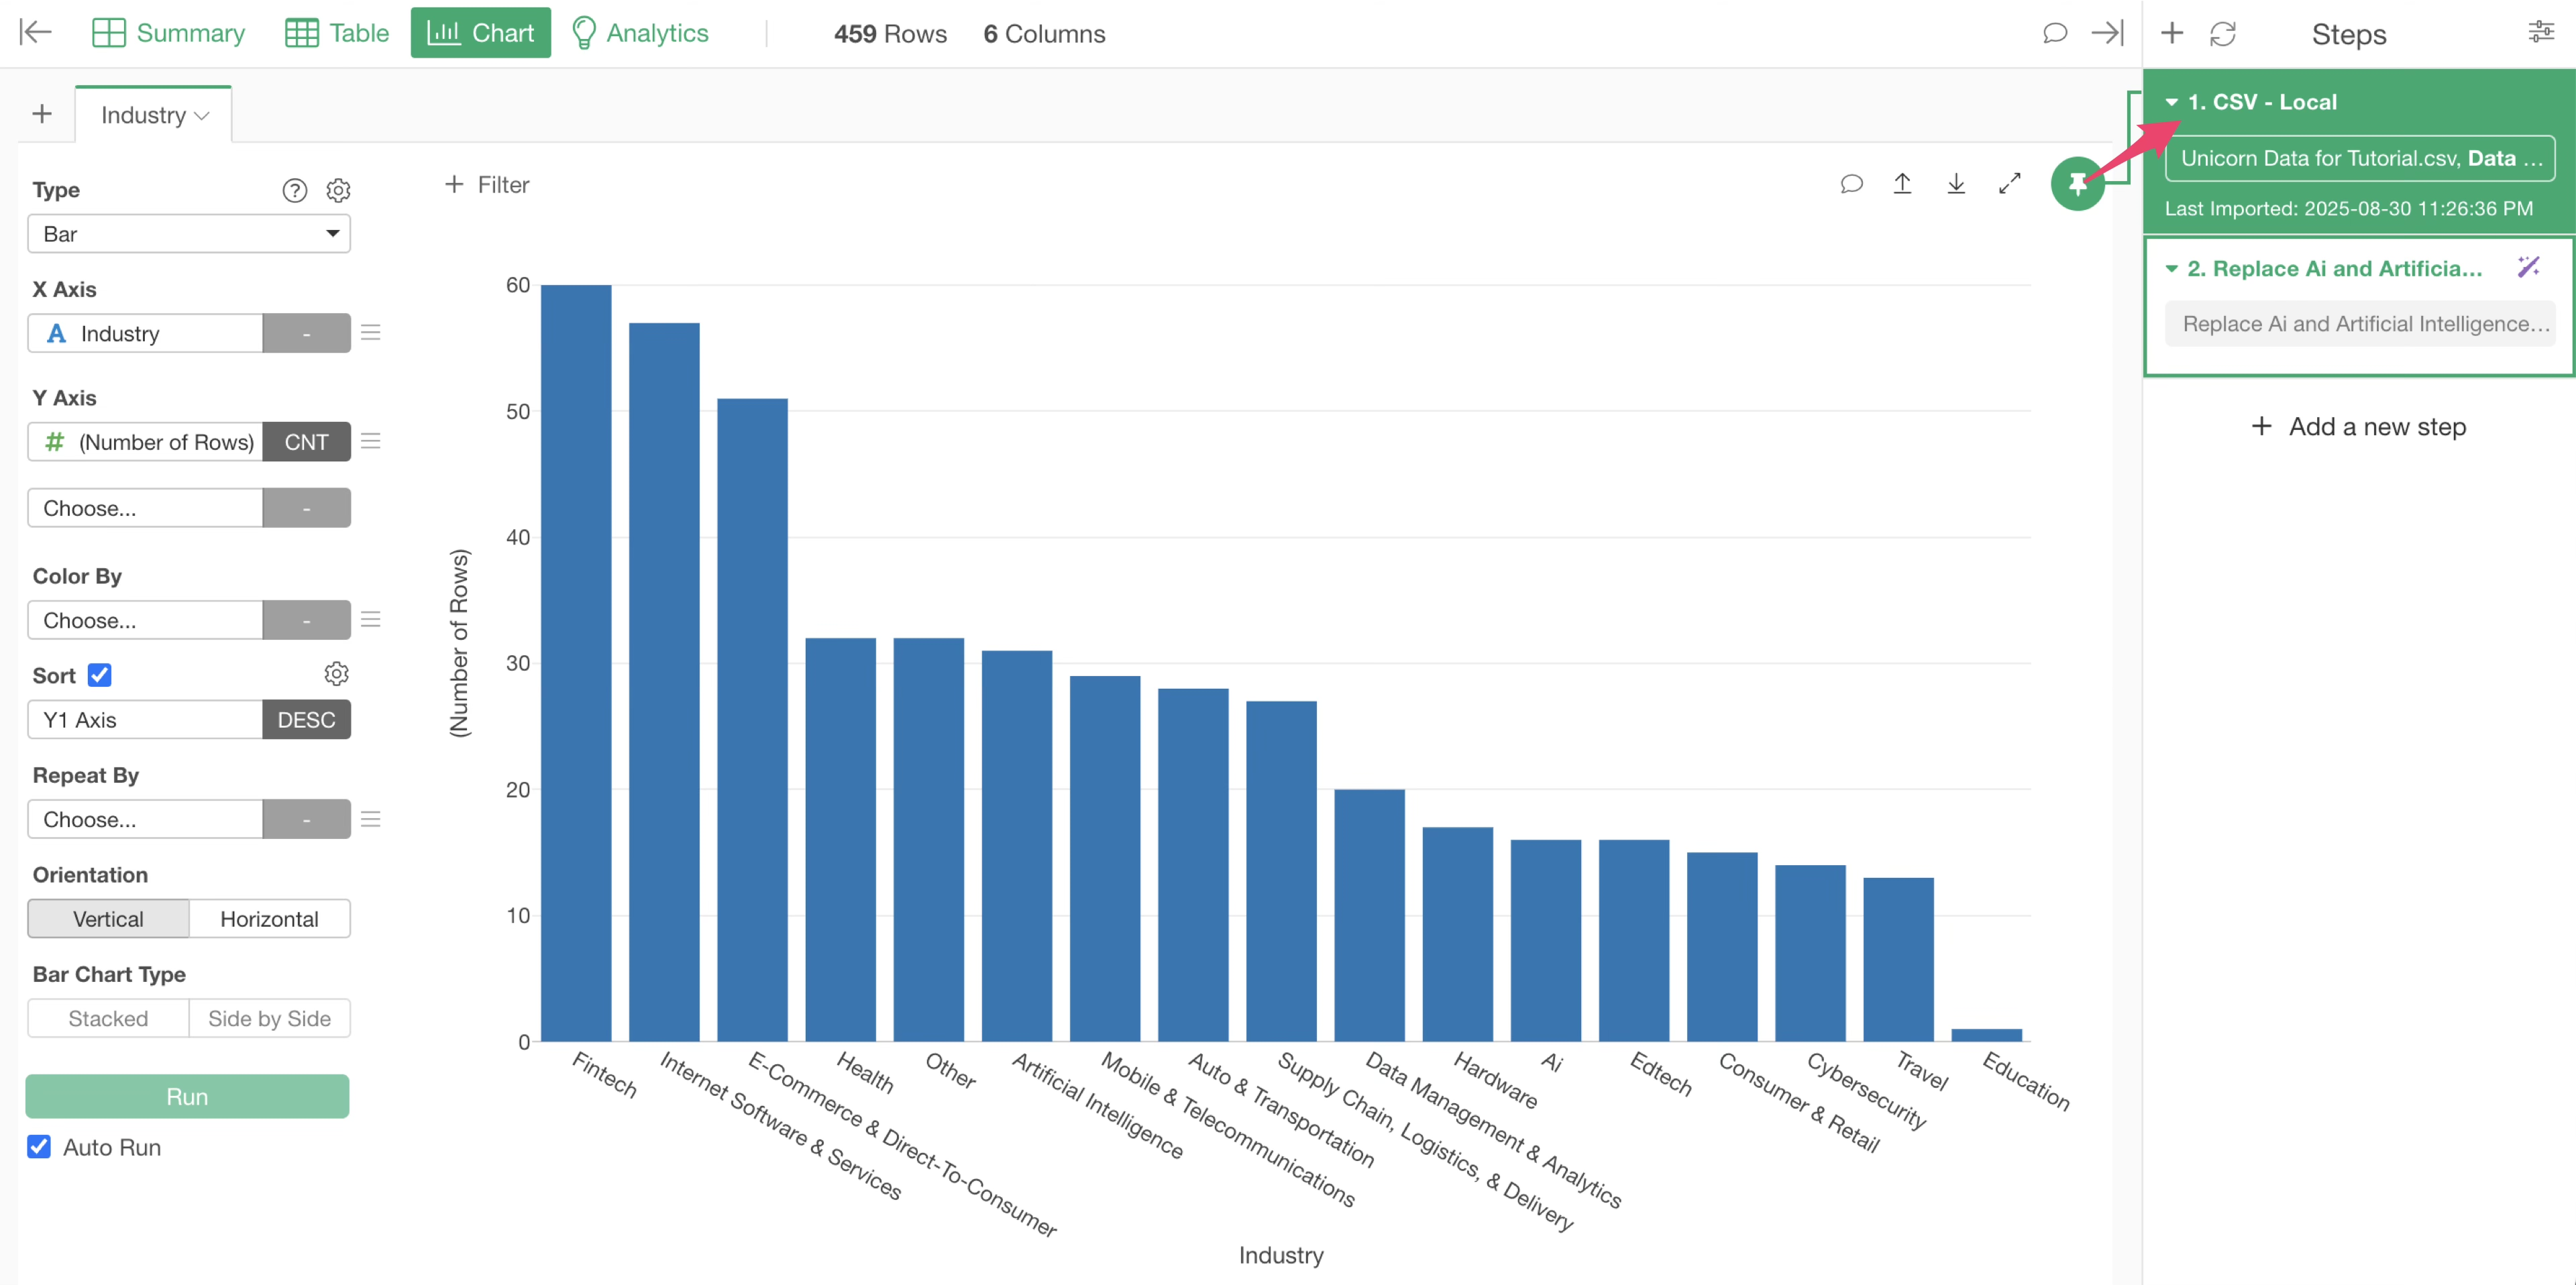
To confirm the results in the bar chart, open the “Chart View.”

However, “Artificial Intelligence” and “Ai” in the “Industry” column are still displayed as separate values.

This is because the chart is still “pinned” to the first step. This means that at this point, the process of replacing “Artificial Intelligence” and “Ai” in the “Industry” column with “AI” has not yet been applied.
Therefore, you need to move the chart pin to the second step, where the industry values were “replaced with new values.” Drag and drop the chart pin to the second step.
This confirms that “Artificial Intelligence” and “Ai” have been combined into a single “AI” bar for visualization.

3. Aggregate Data
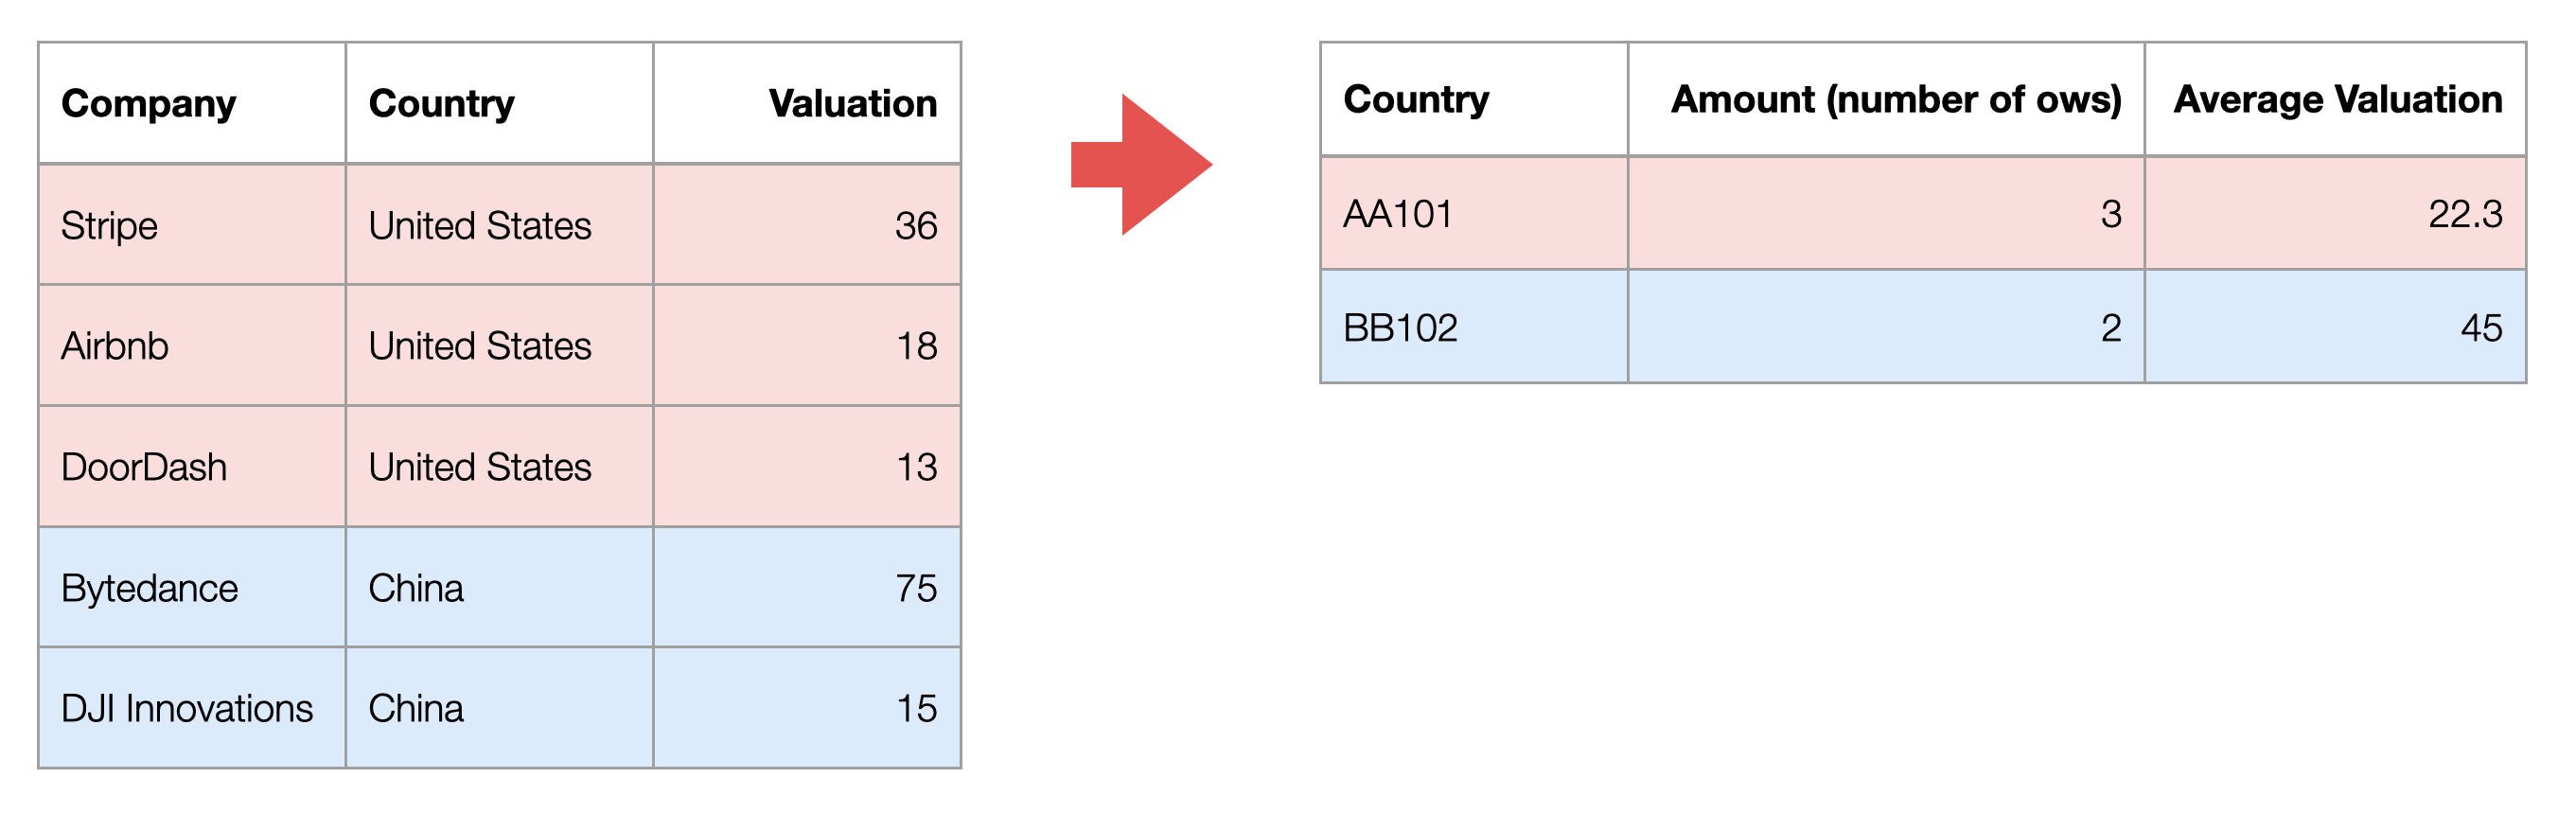
Aggregation refers to grouping rows by “group” and performing calculations at the group level.
For example, with data like the unicorn companies data, it means calculating the number of companies (number of rows) or the average market valuation for each “country” as shown below.
In Exploratory, aggregation could be performed within the chart, so it is generally not necessary to aggregate data specifically for visualization. However, if you want to perform further calculations based on aggregated results, you may need to aggregate the data beforehand.
Currently, the data has one row per unicorn company. Let’s aggregate the data to have one row per country and create a dataset with the number of companies per country.
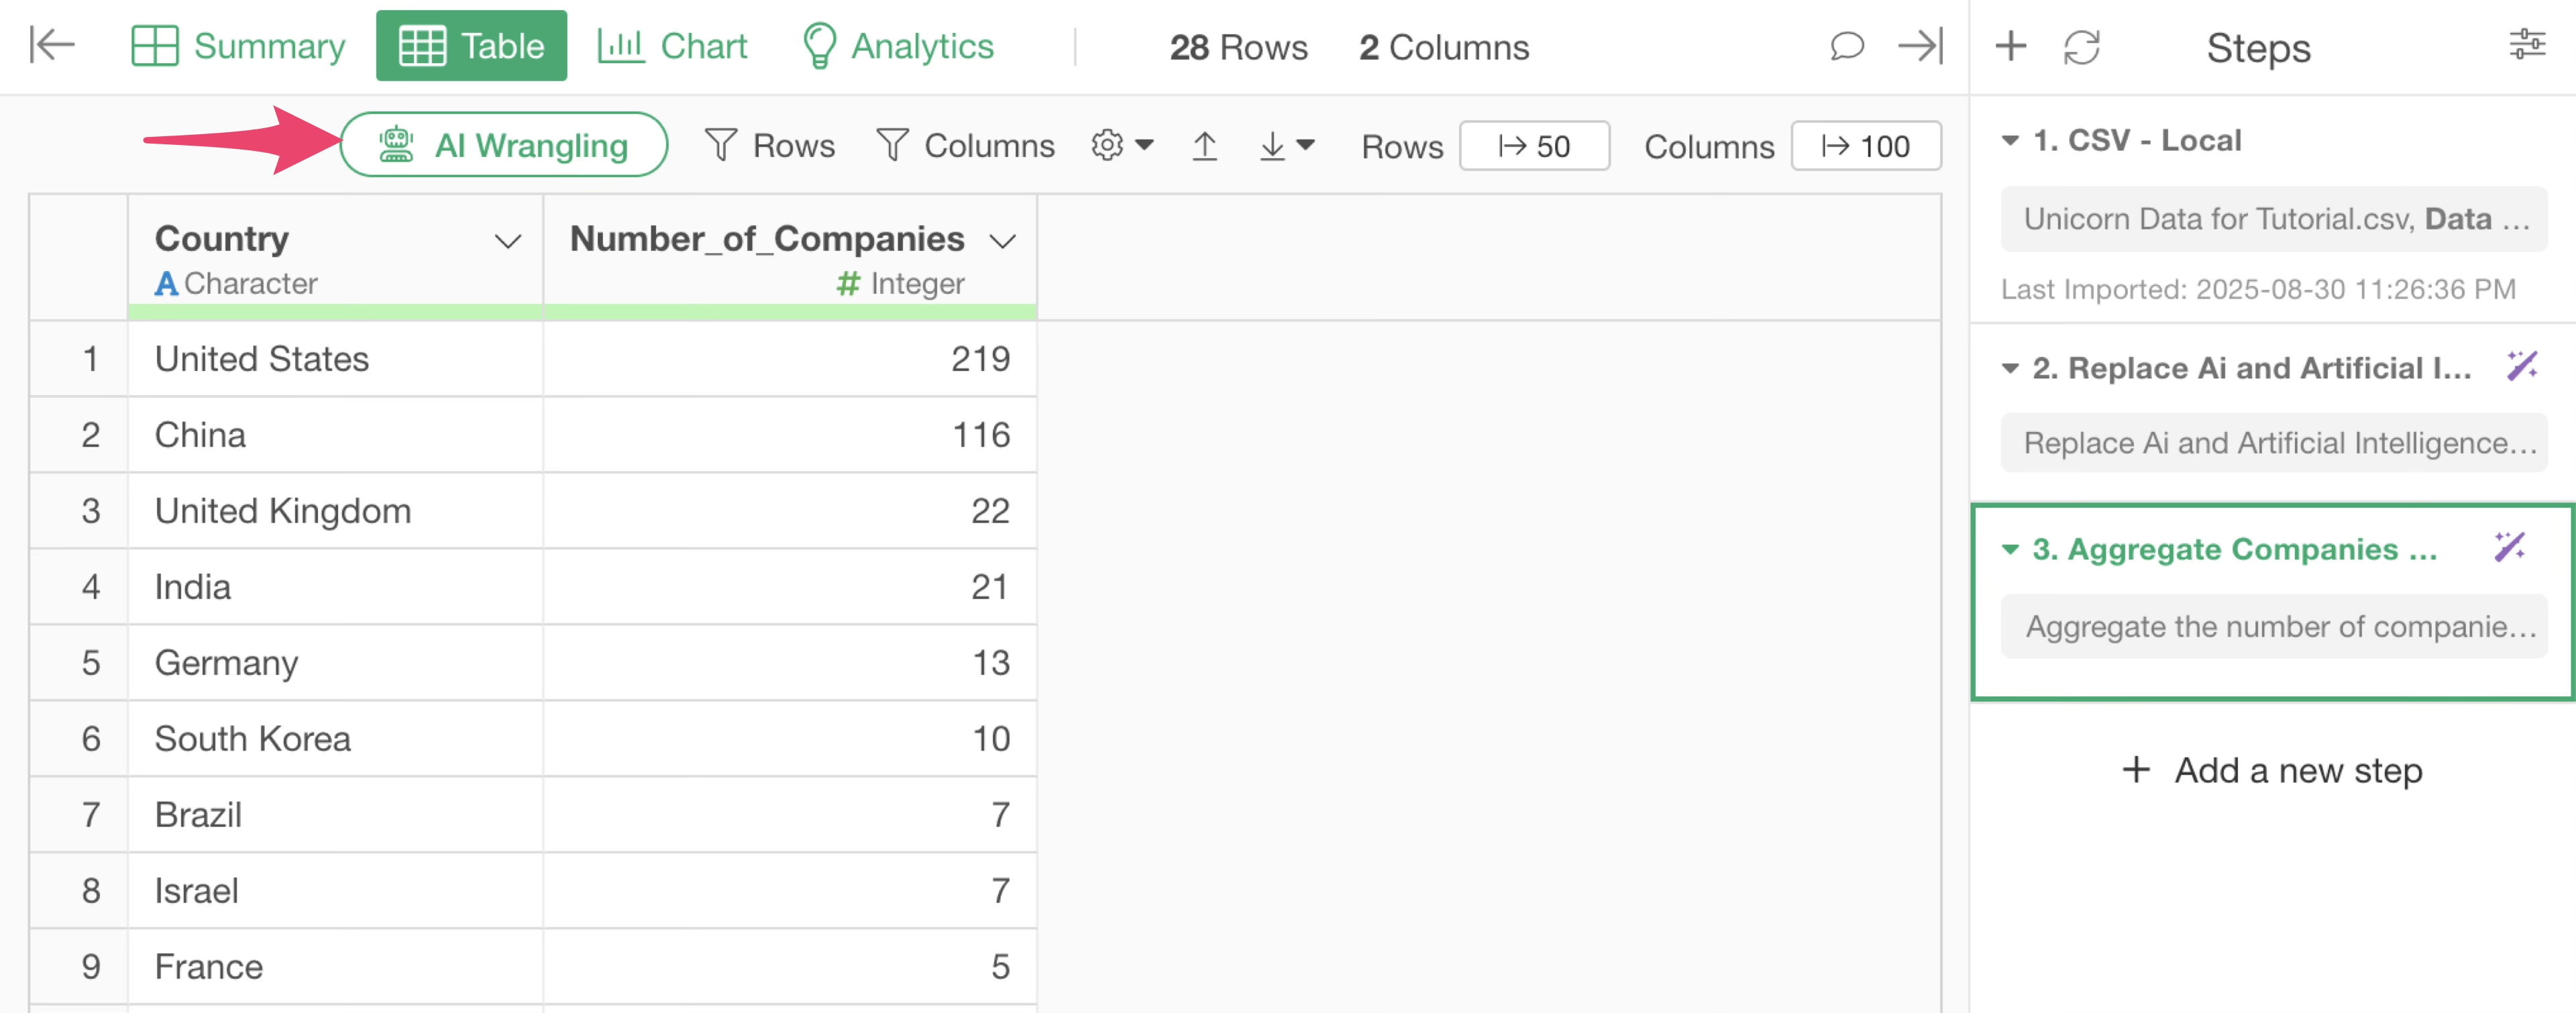
Click the “AI Wrangling” button.
The AI Prompt dialog will appear. Enter the following prompt:
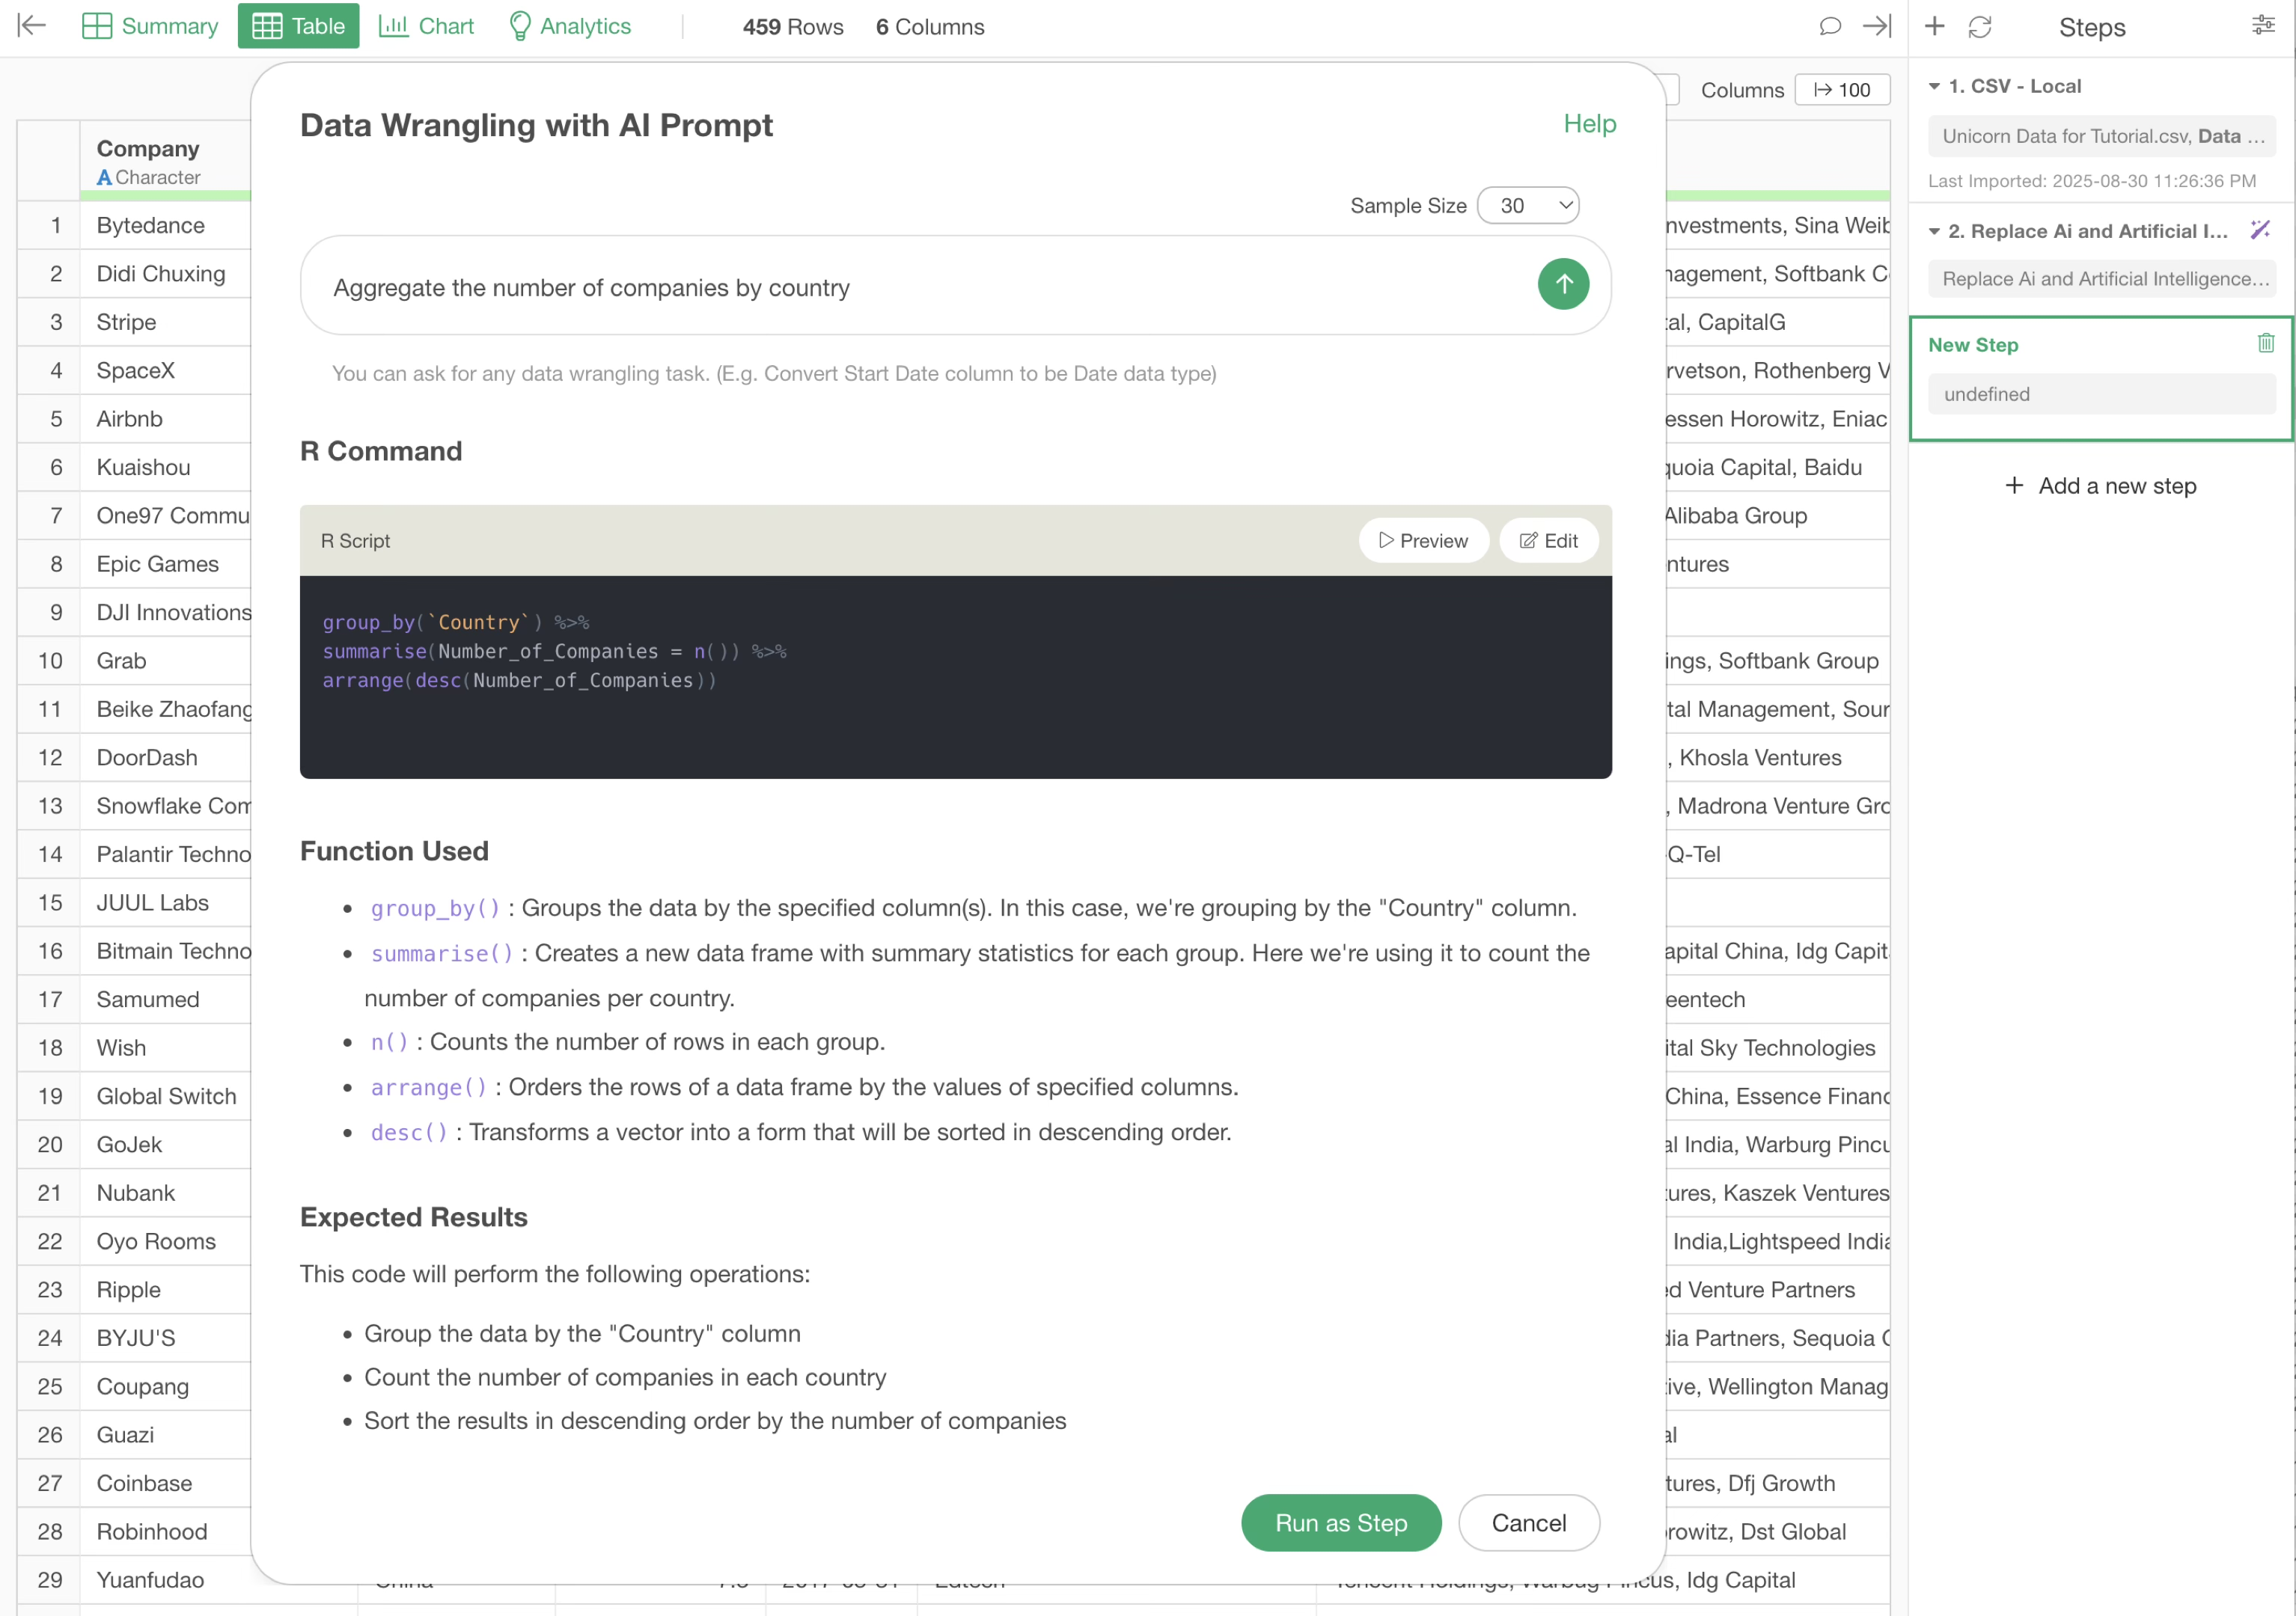
Aggregate the number of companies by country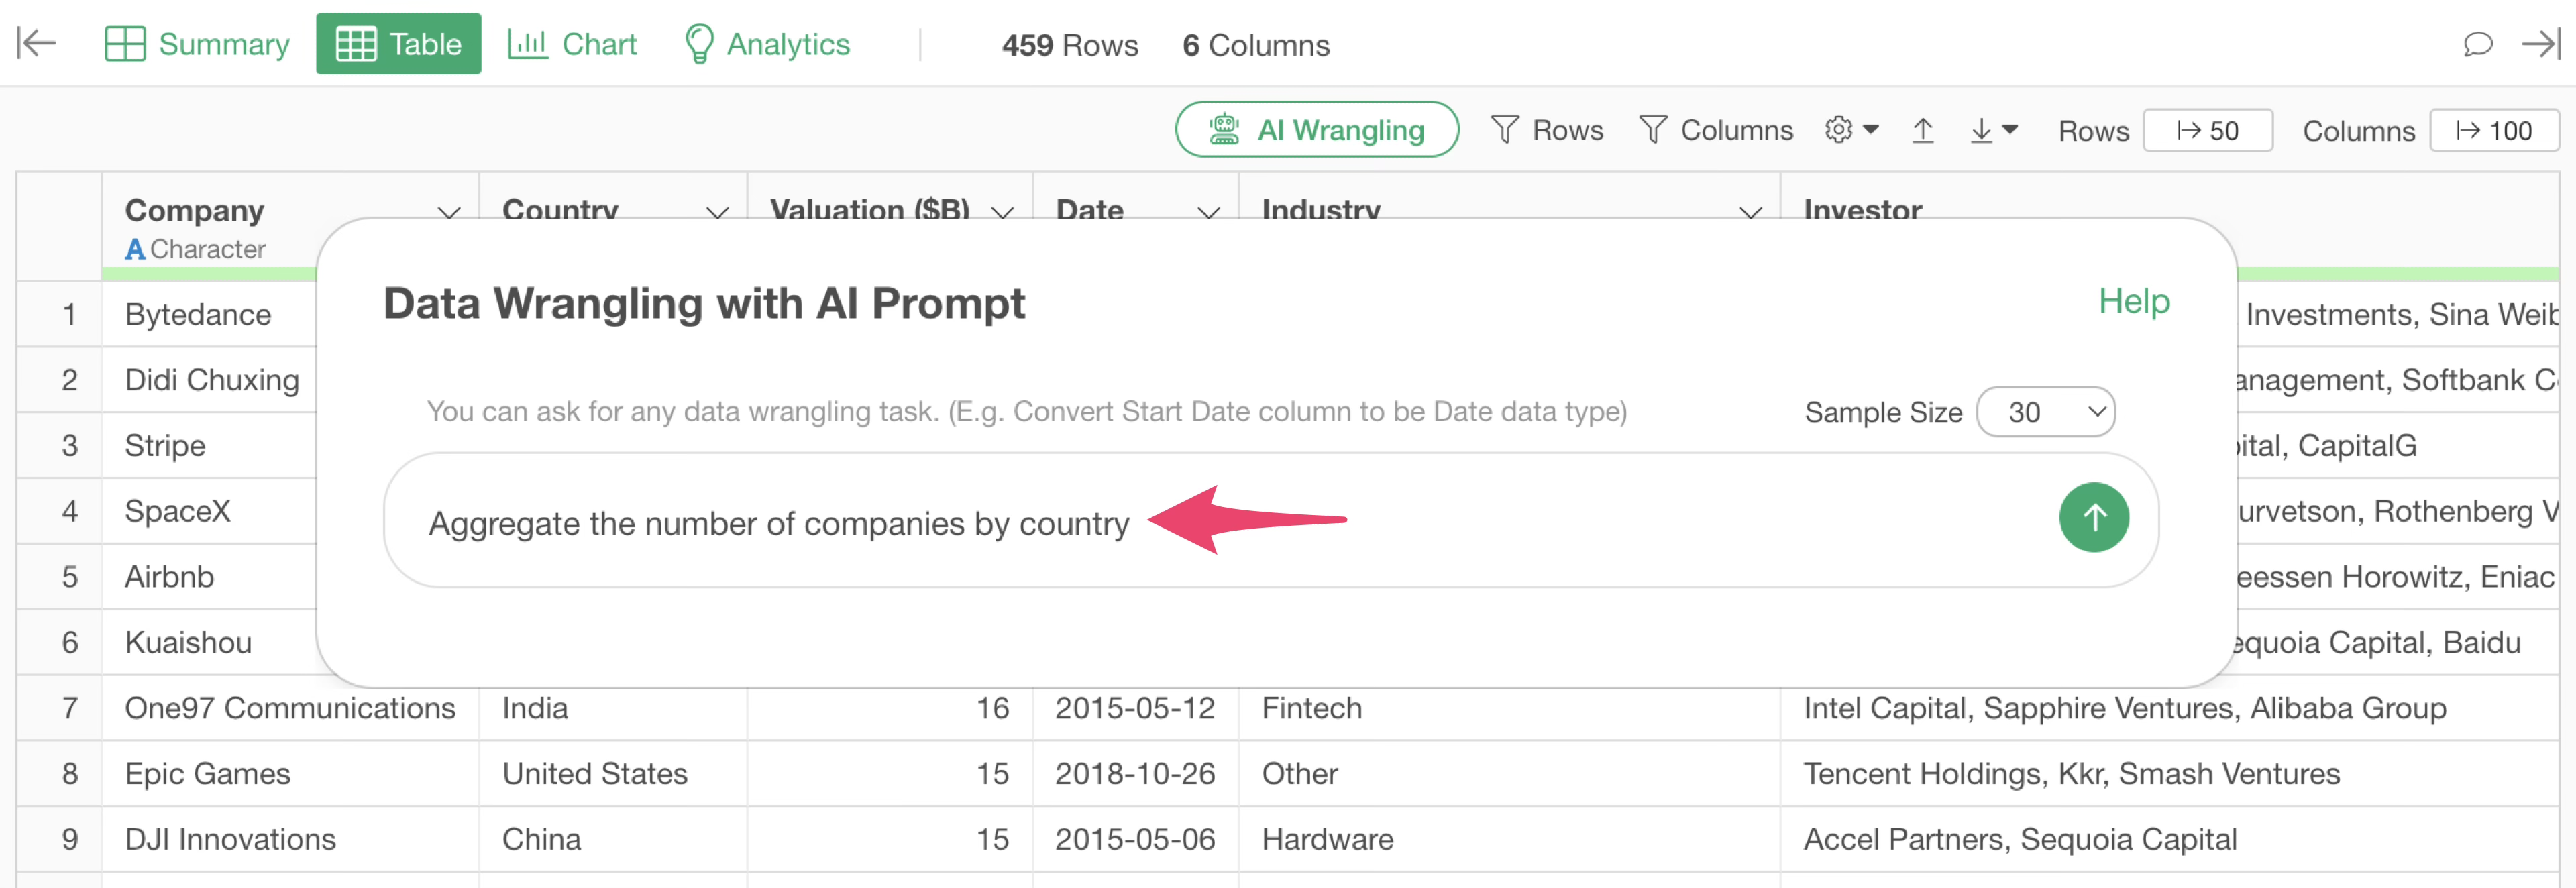
The R script for aggregating the number of companies by country will be returned.
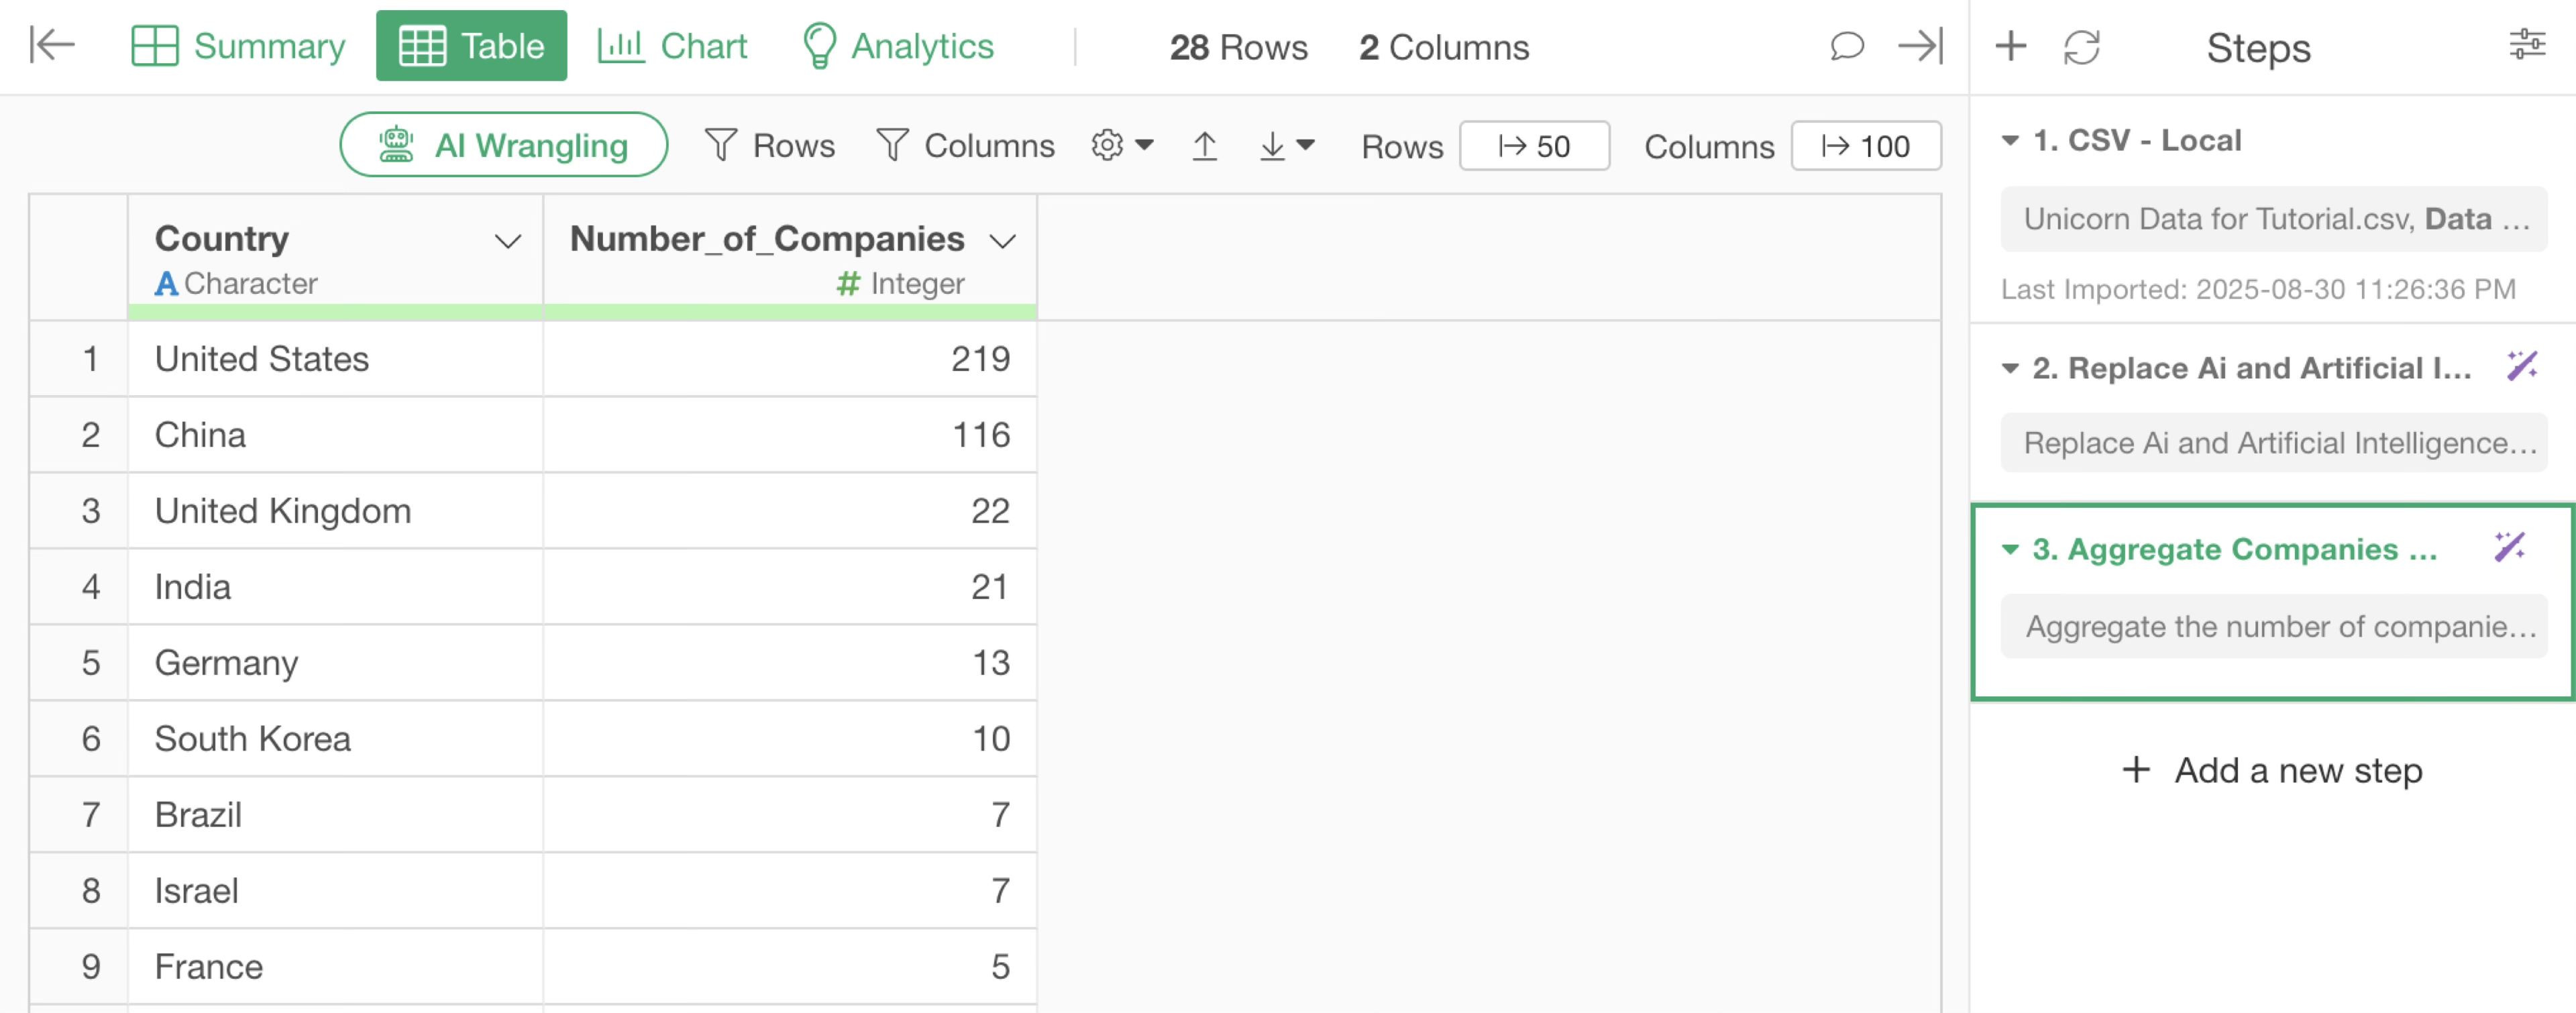
We were able to aggregate the number of unicorn companies (number of rows) by country, transforming the data from one row per company to one row per country.
4. Join (Add Columns)
For example, suppose you want to investigate the relationship between the number of unicorn companies and GDP per country.
However, the unicorn companies data does not have GDP information as a column.

Therefore, let’s join the “GDP” and “Population” data from the other dataset we imported earlier, “Population & GDP by Country (2022)”, with the company count data, using the country name as the key.
Click the “AI Wrangling” button.
The AI Prompt dialog will appear. You can refer to other data frames by typing “@” or “$” sign.
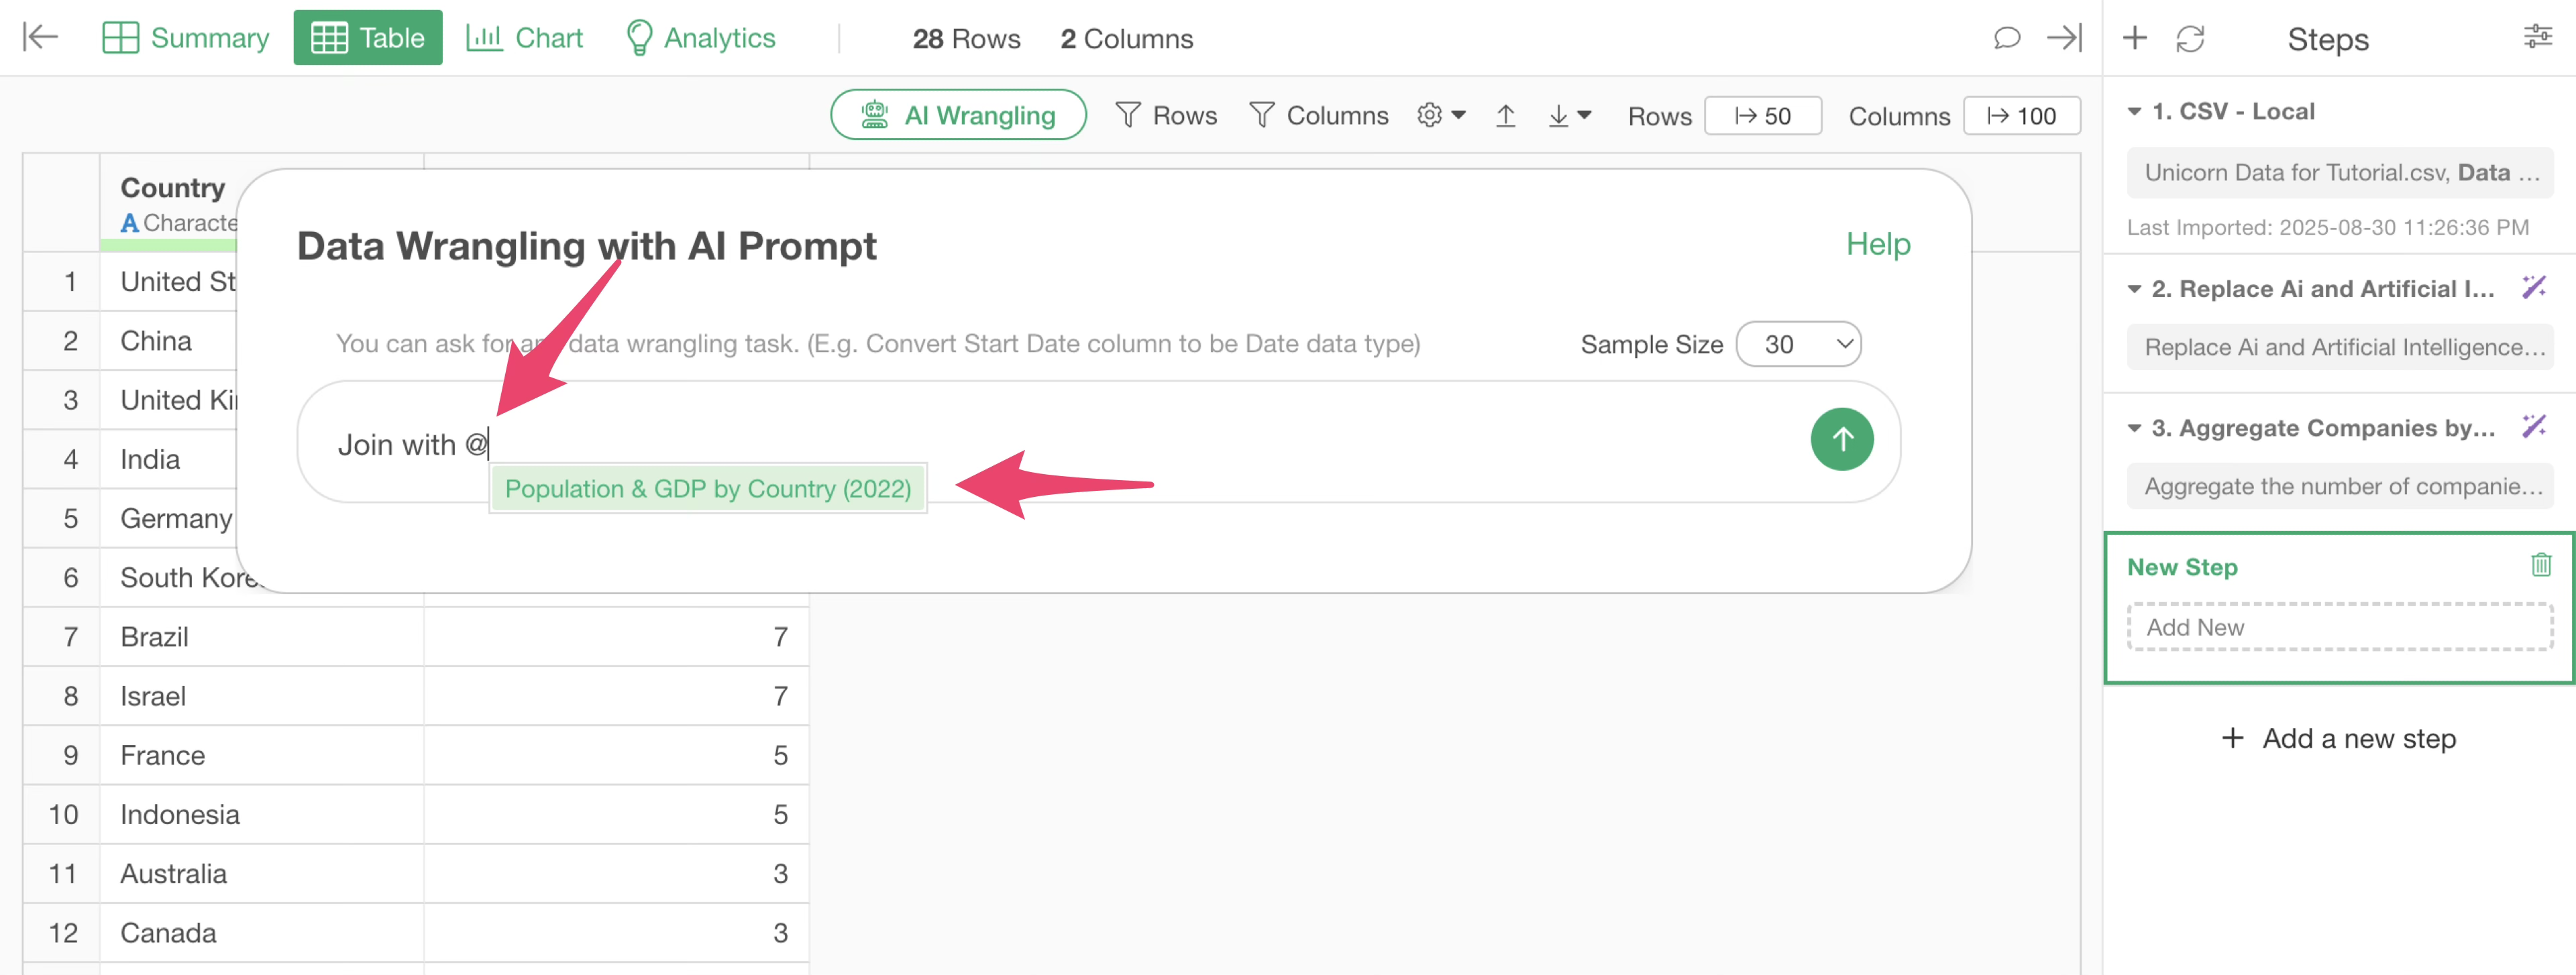
Next, specify the prompt as follows:
Join with $Population & GDP by Country (2022)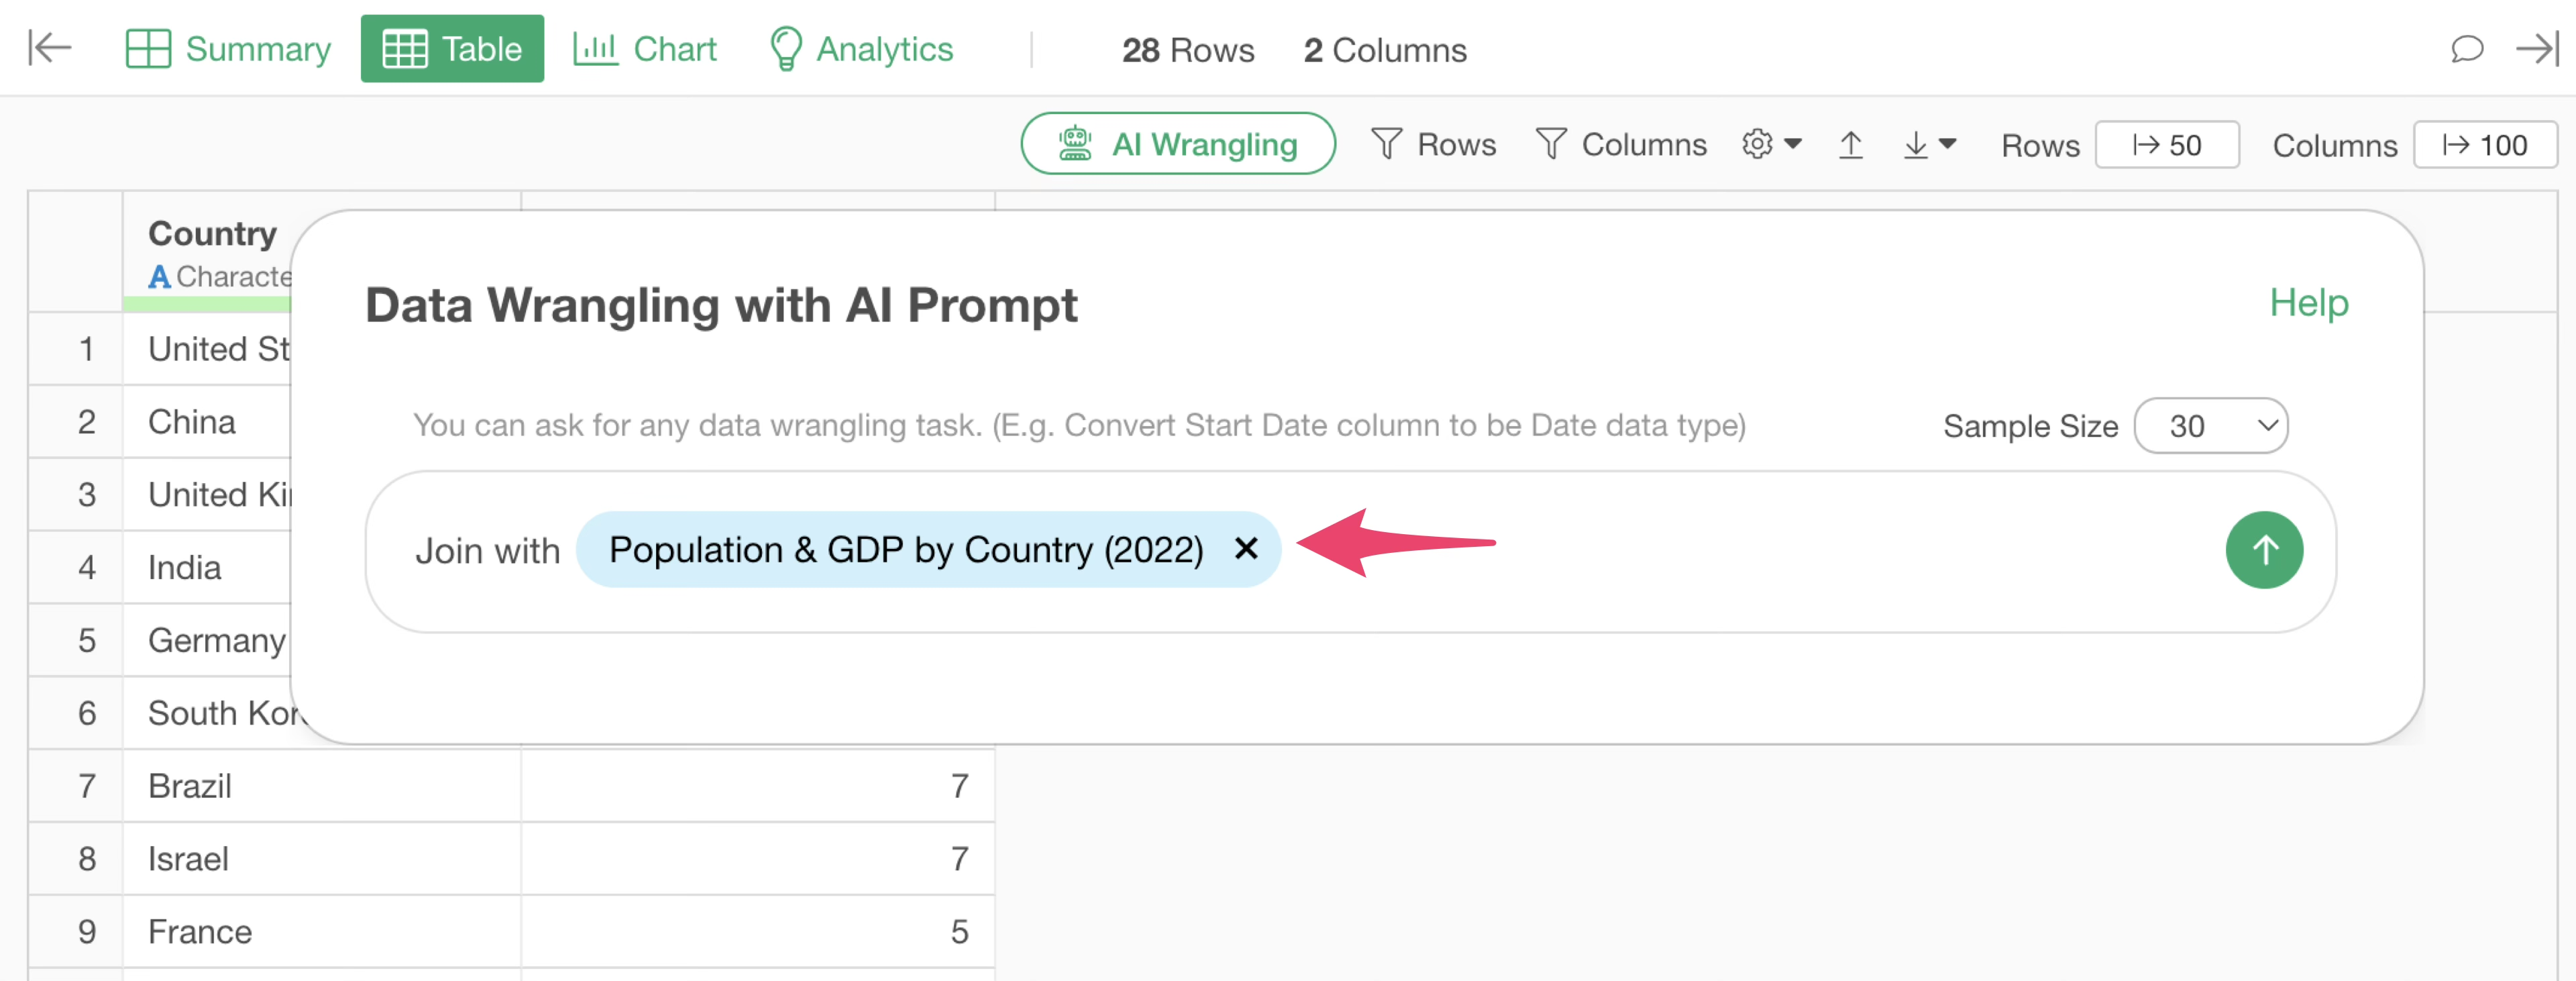
The R script for joining the GDP and population data by country will be returned.
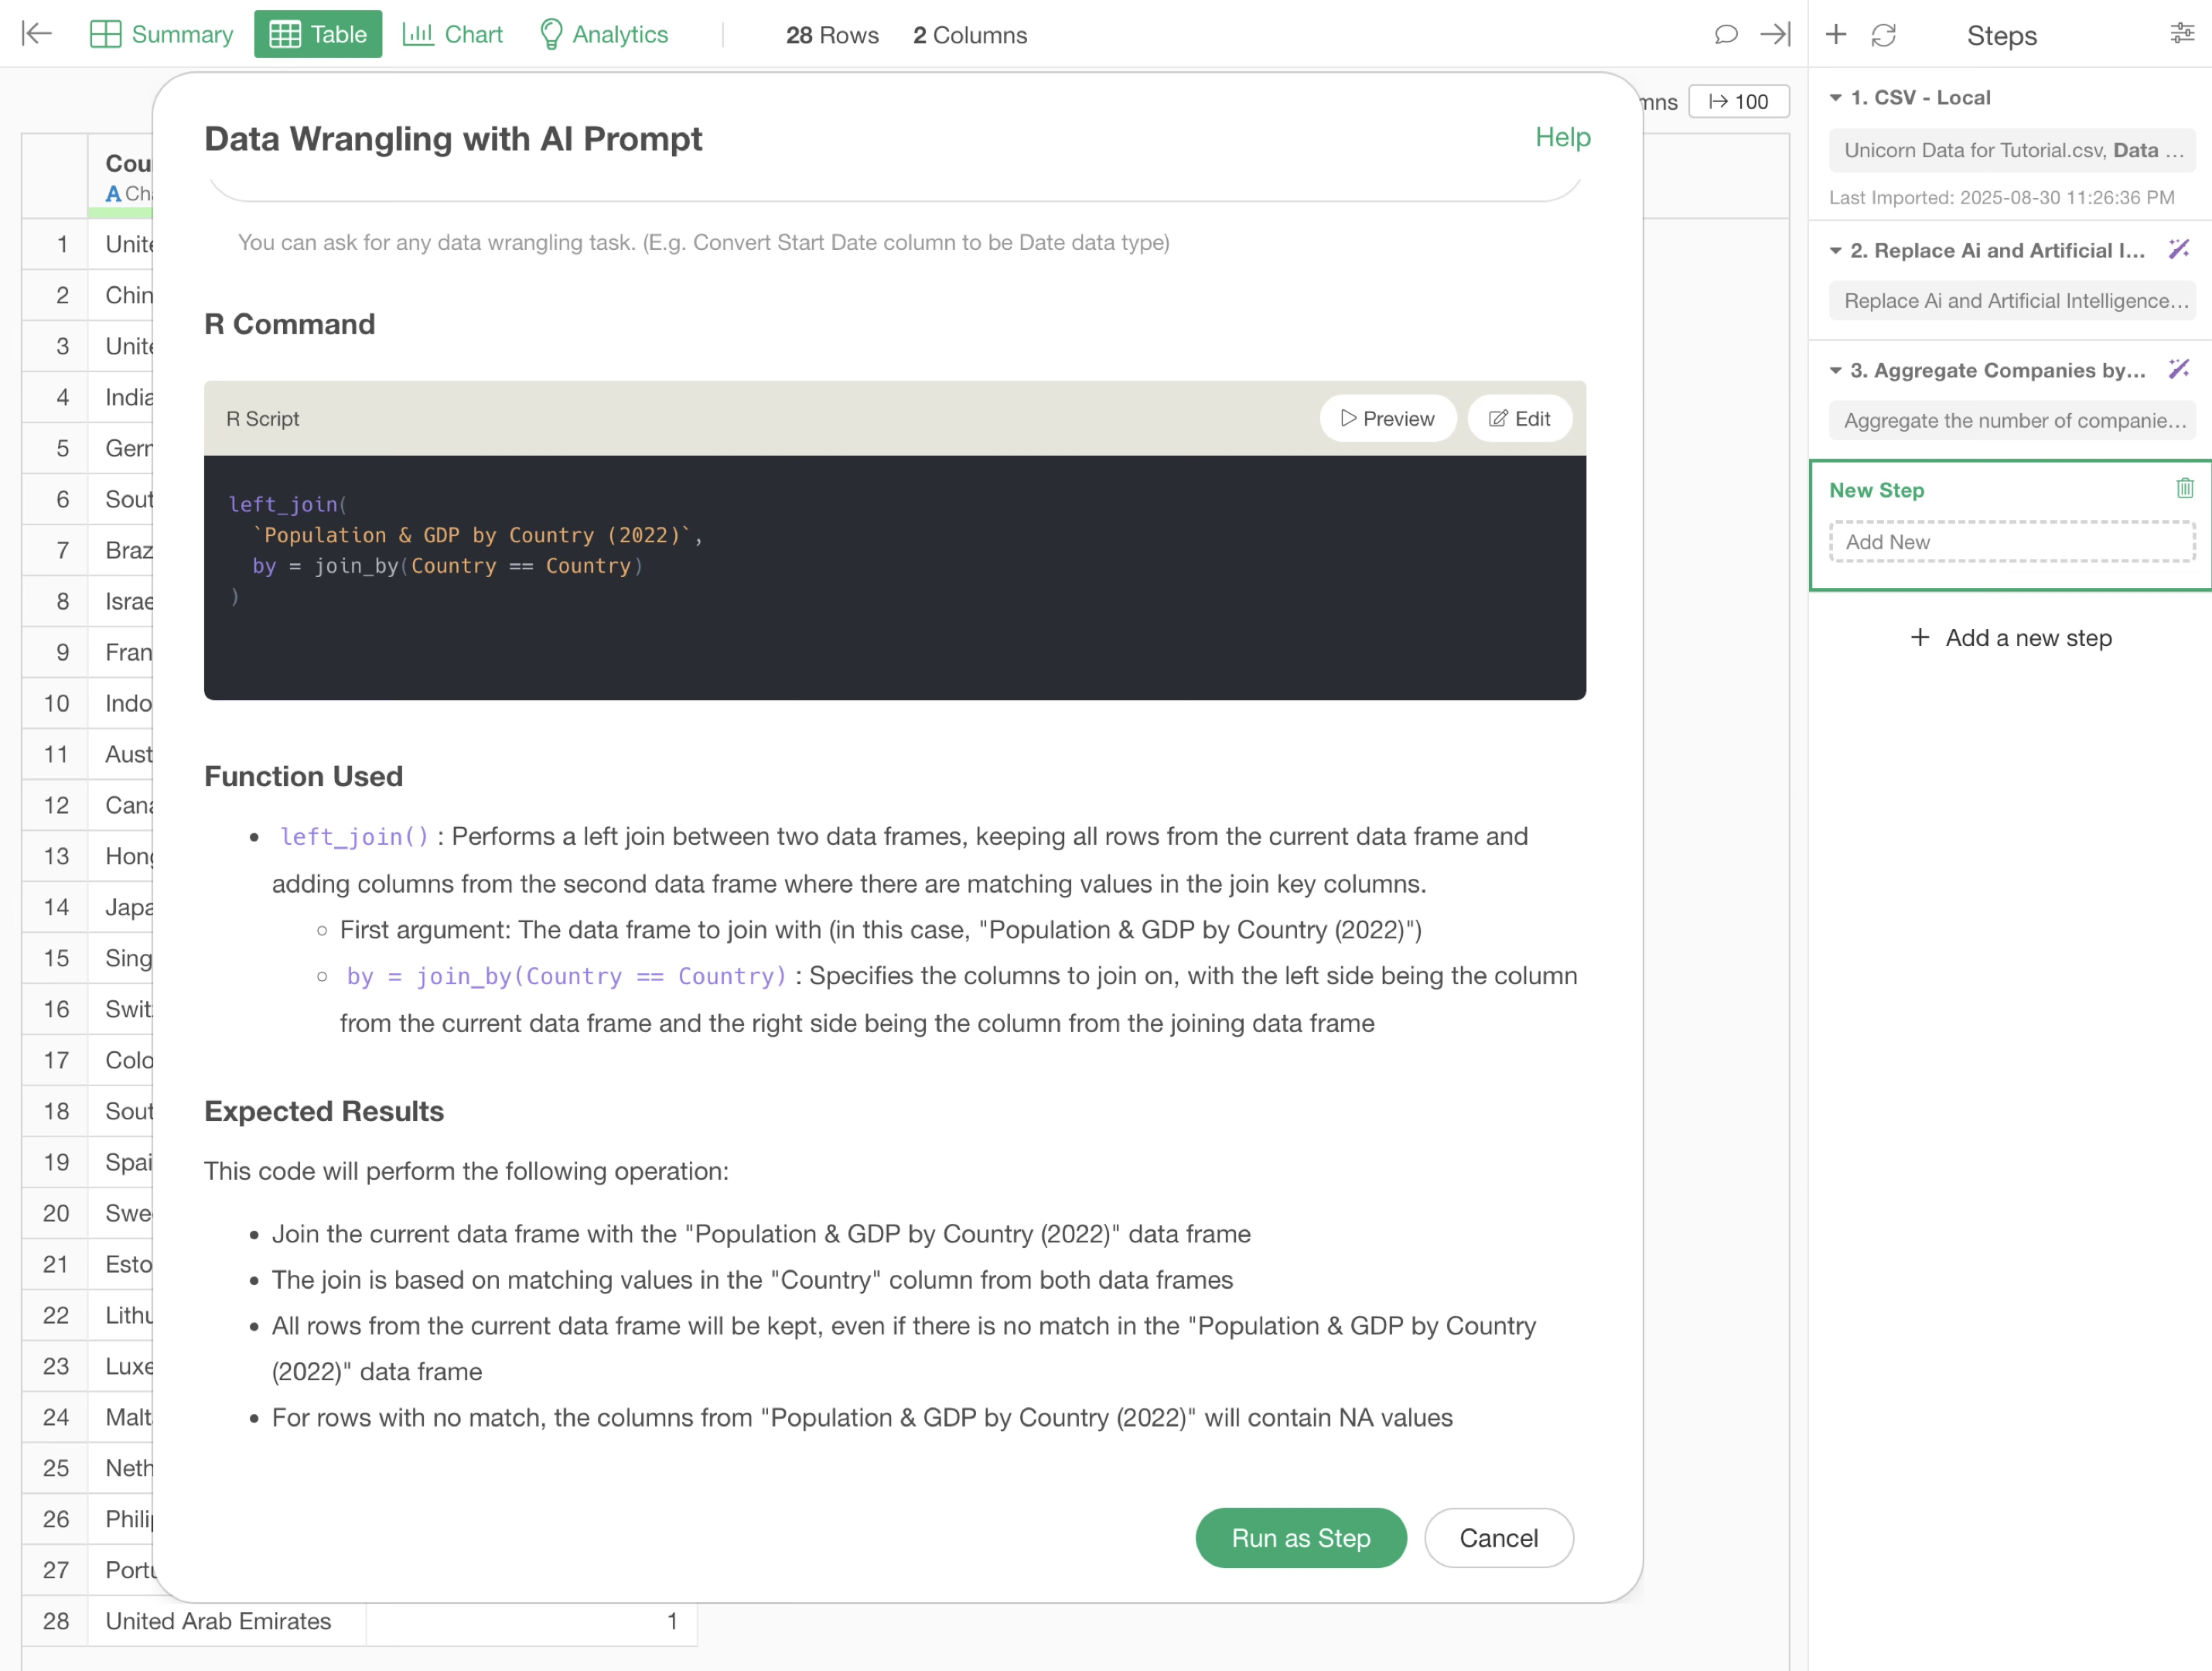
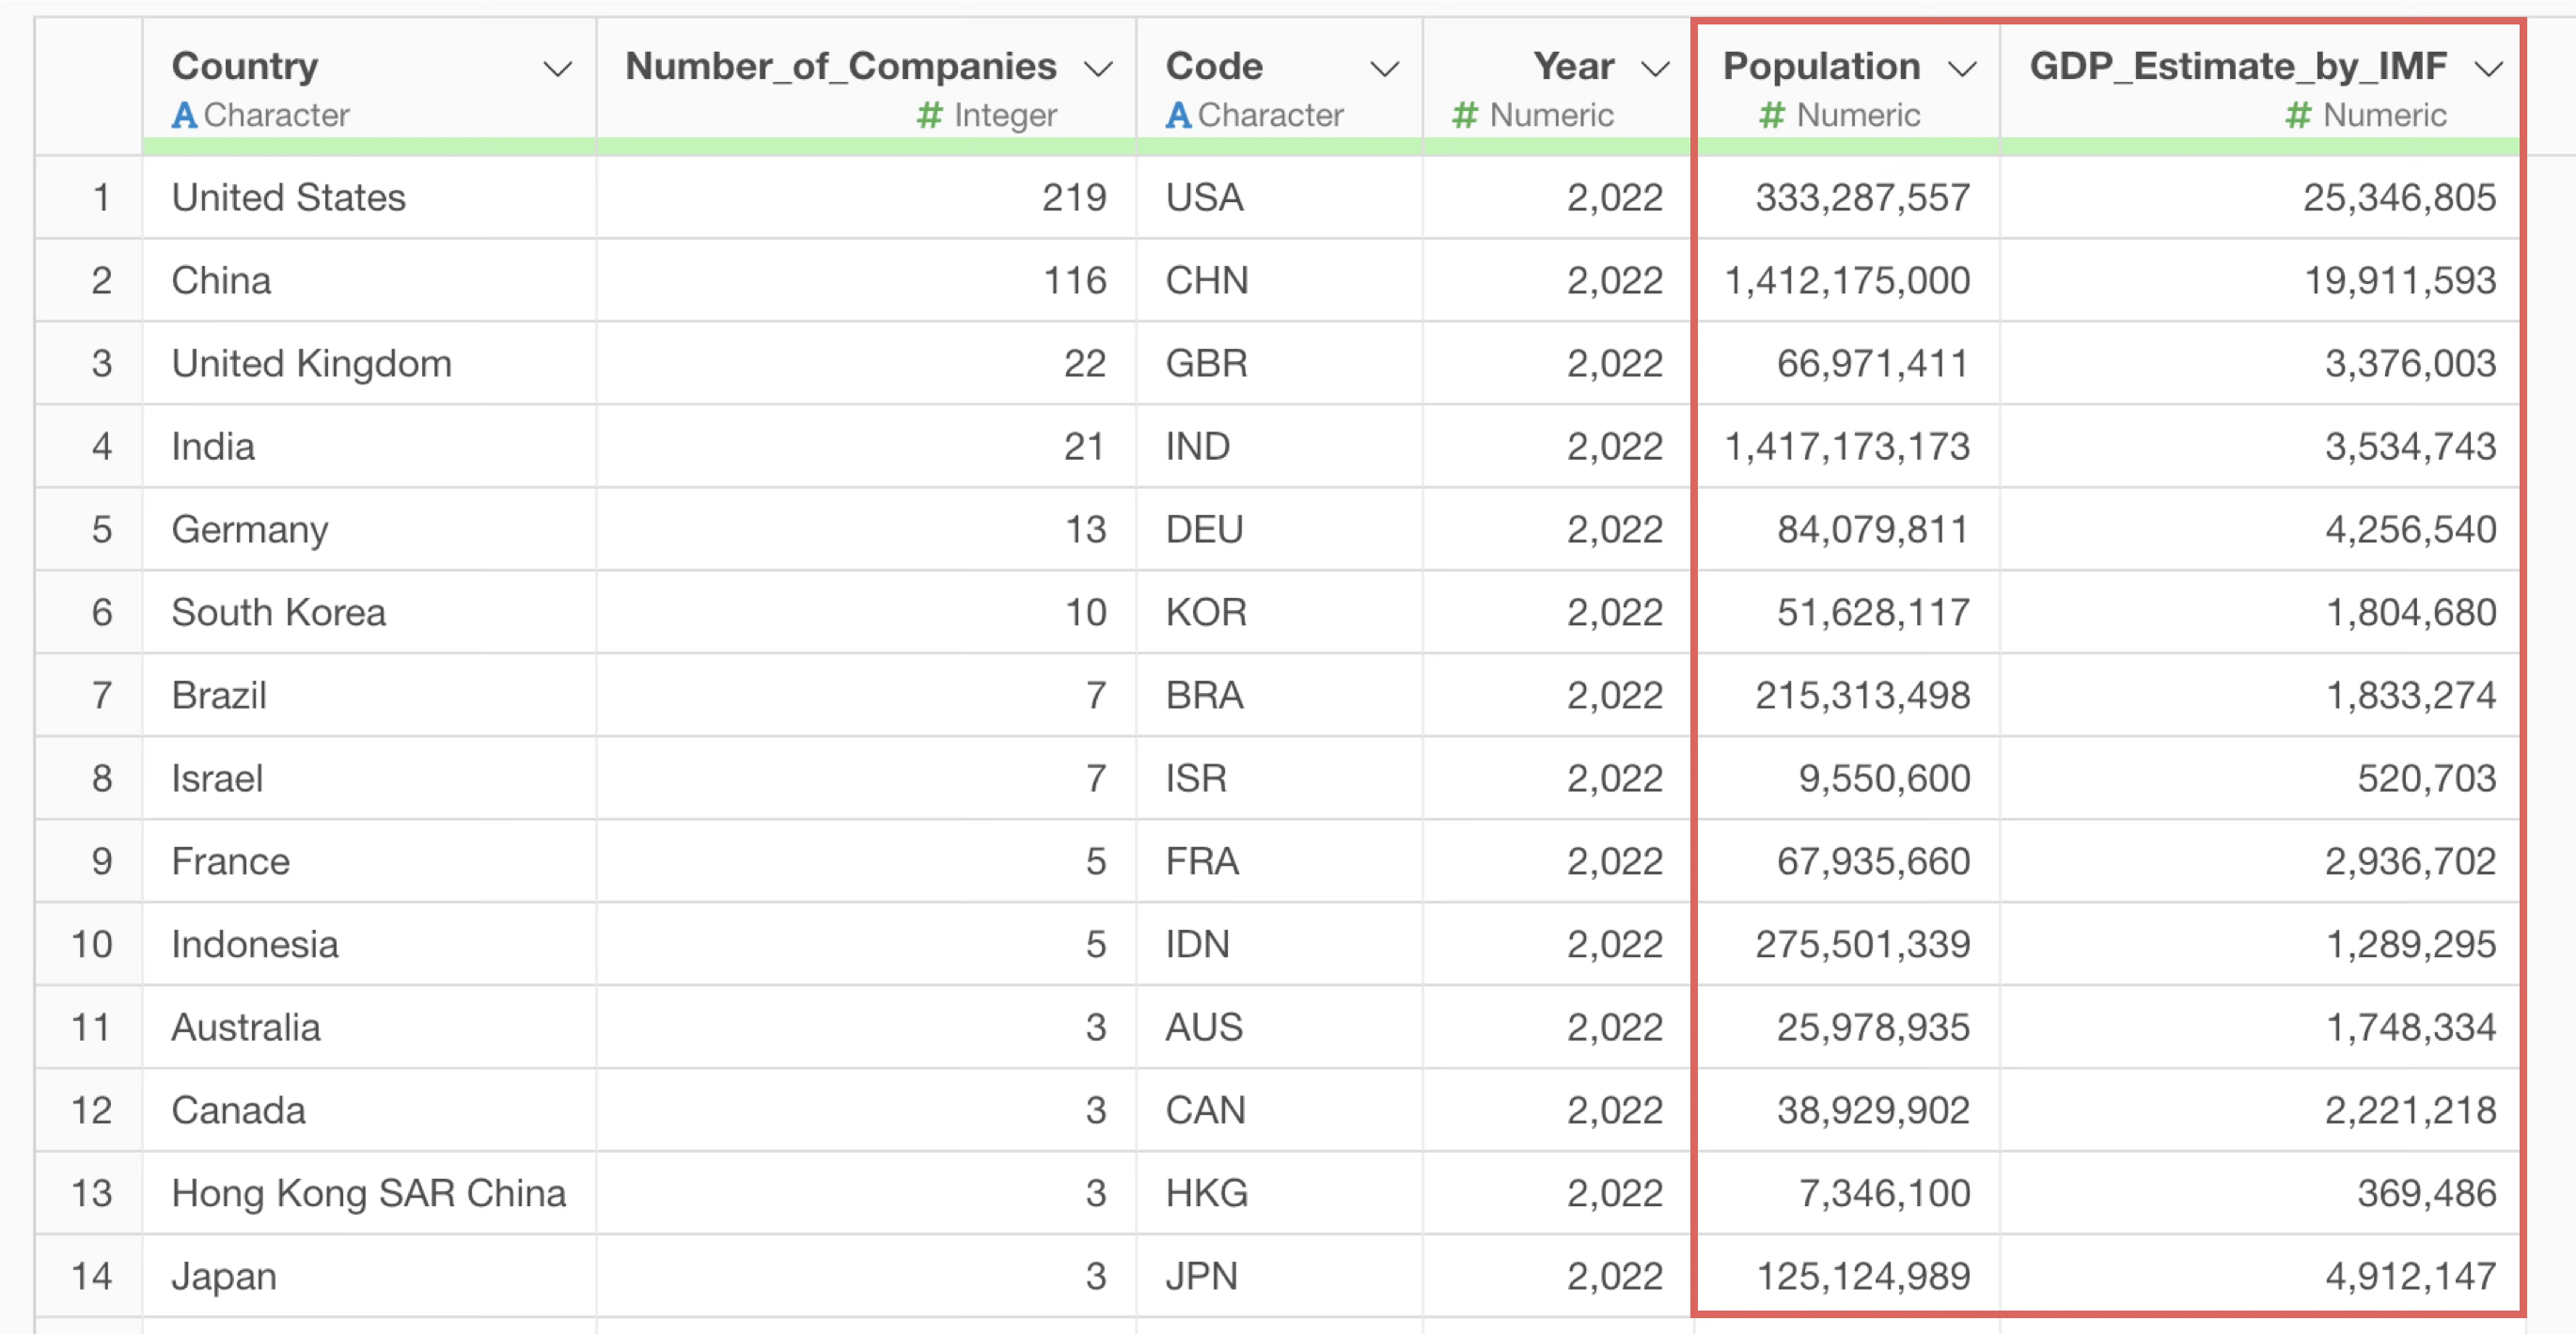
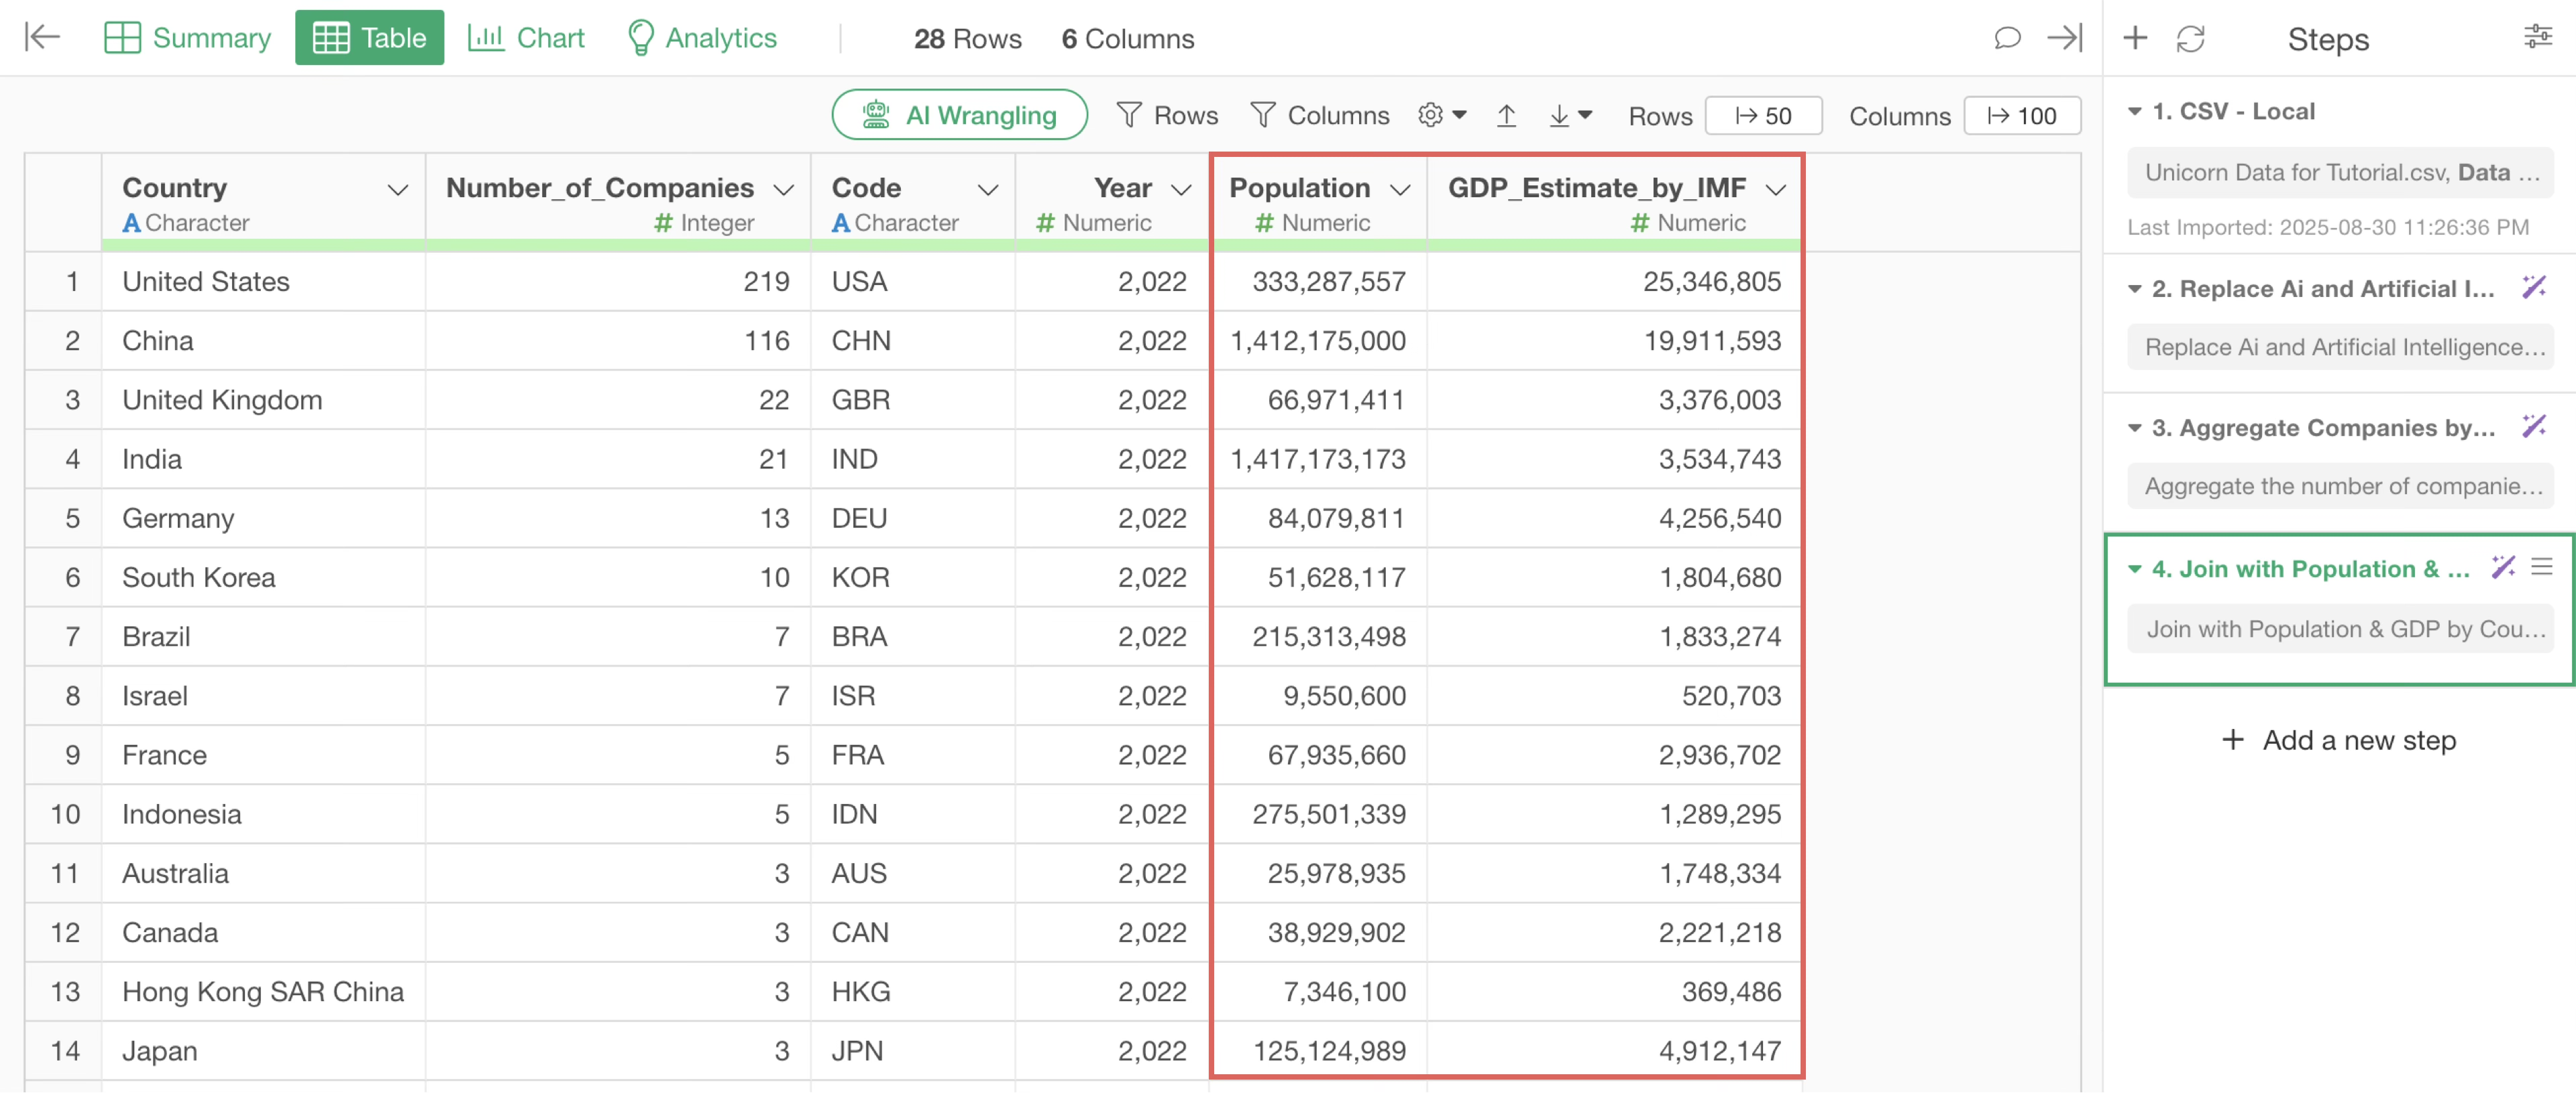
By executing this, we were able to join columns such as “Population” and “GDP_Estimate_by_IMF” to the unicorn companies data, using “Country” as the key.
Now, we want to visualize the number of unicorn companies and GDP per country using a bar chart.
To create the chart, open the Chart View.
To create a new chart, click the “plus” button.
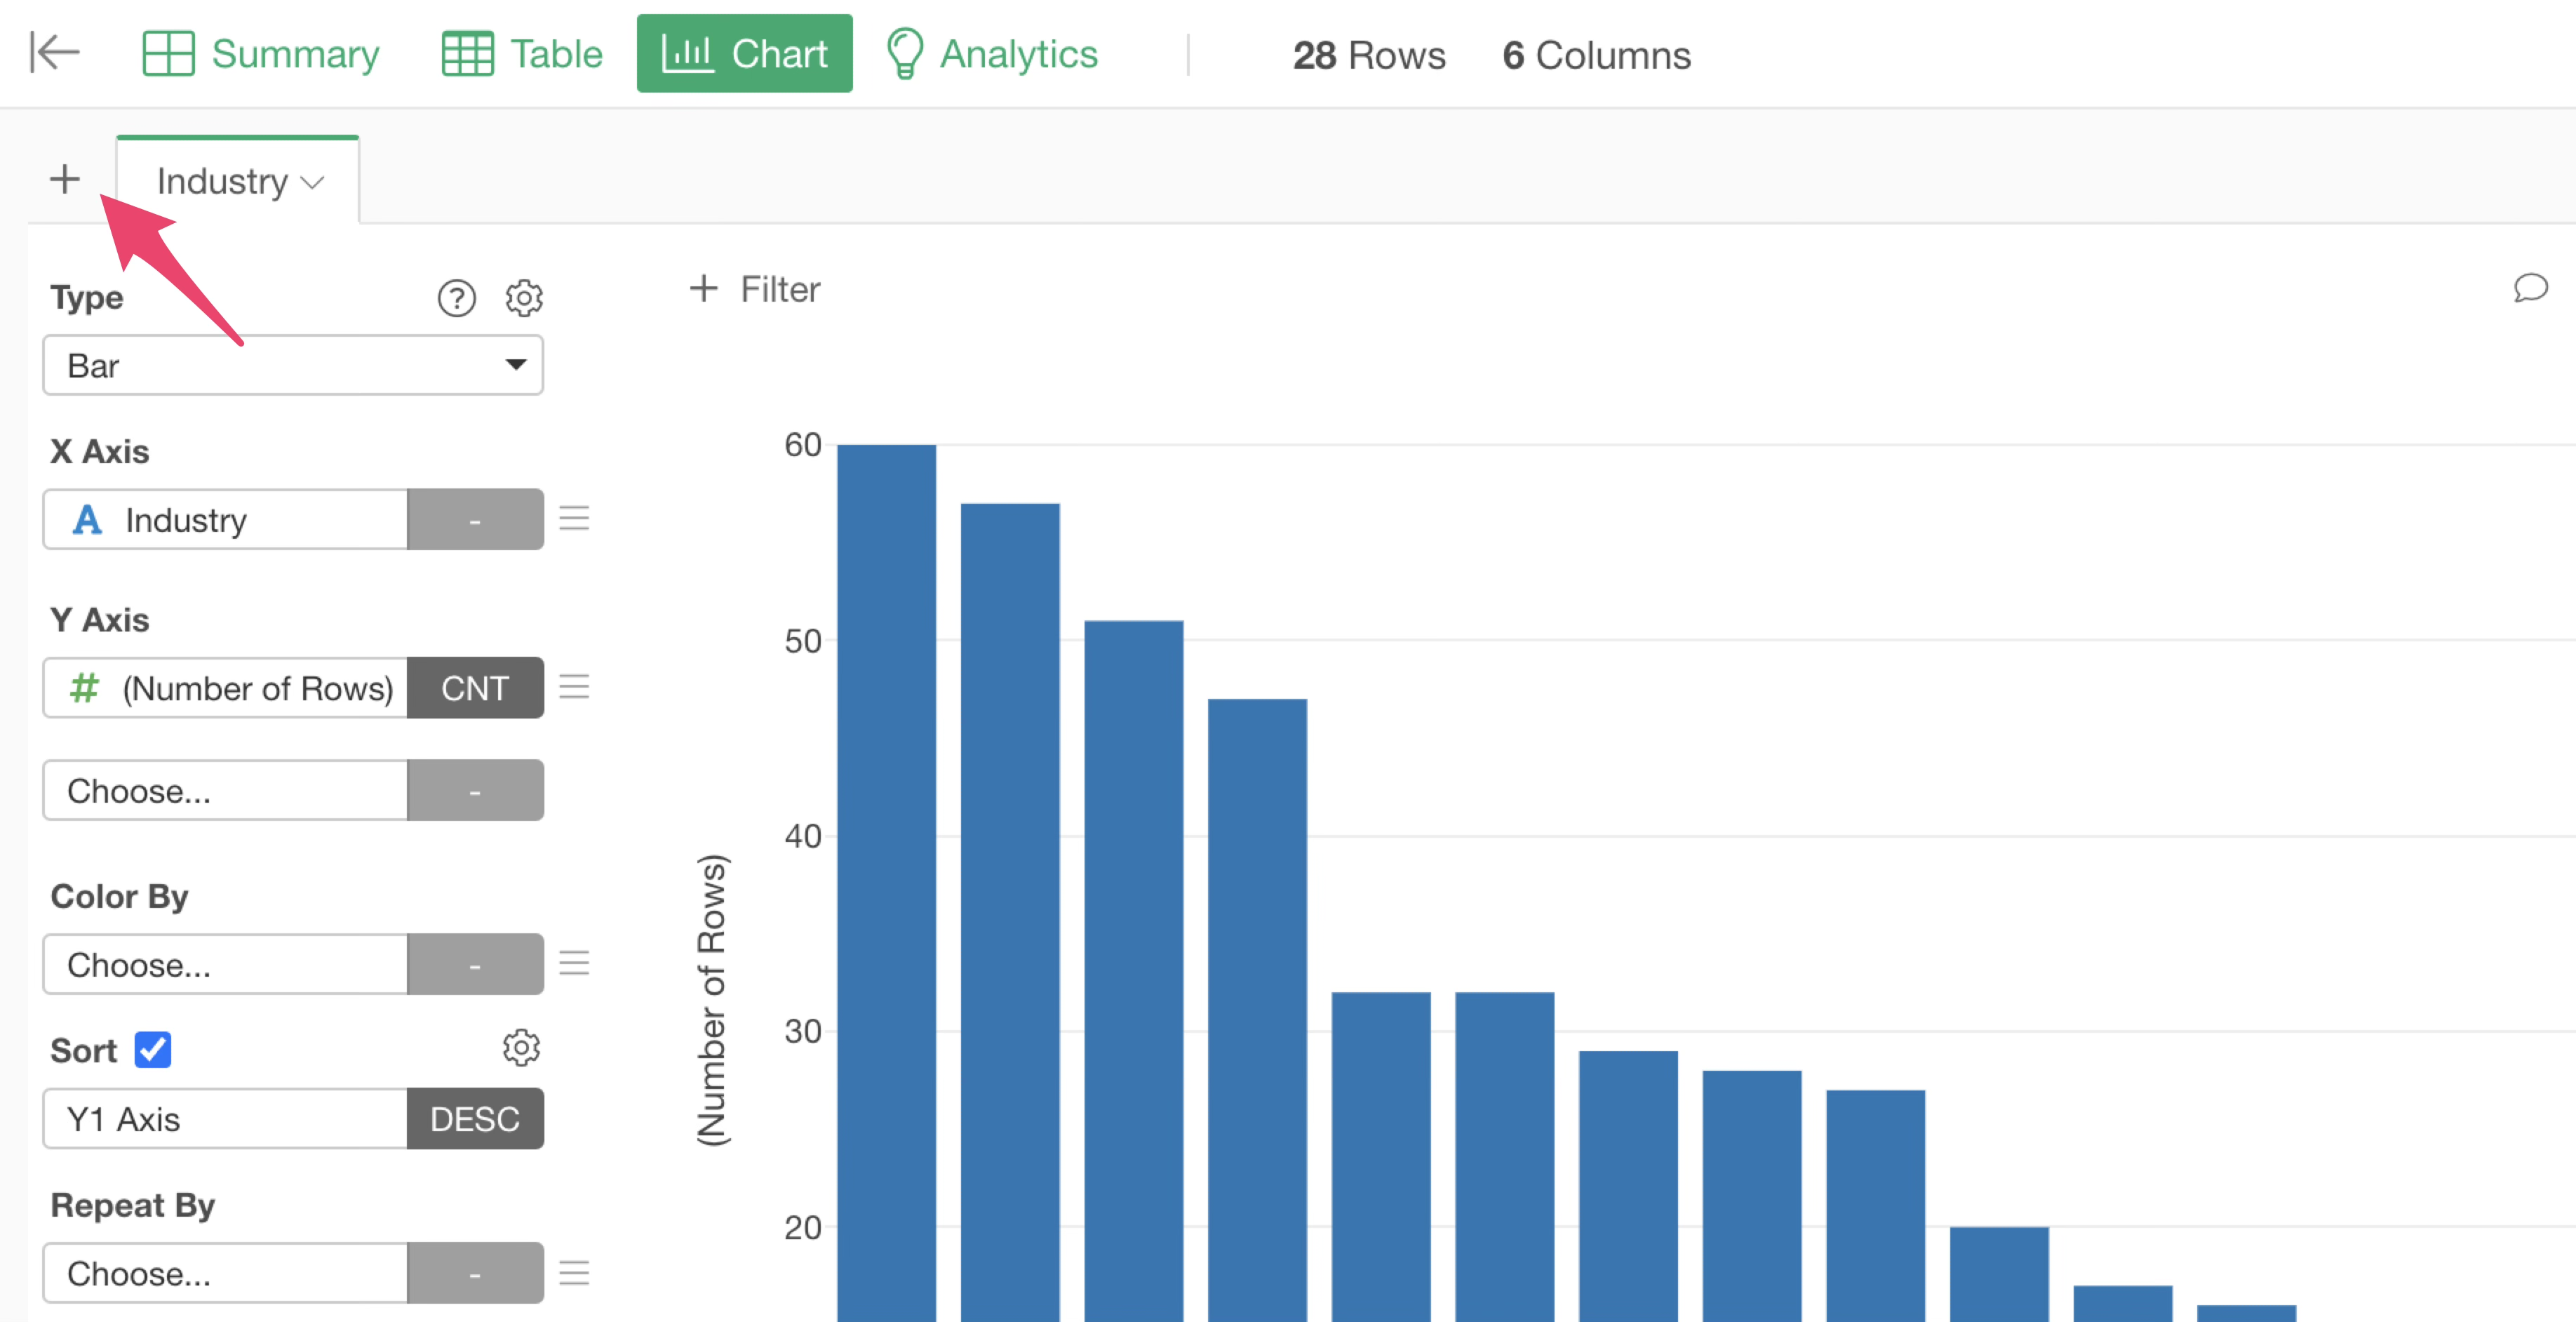
A new chart has been created. Also, when a new chart is created, the “Chart Pin” is linked to the currently selected 4th step.
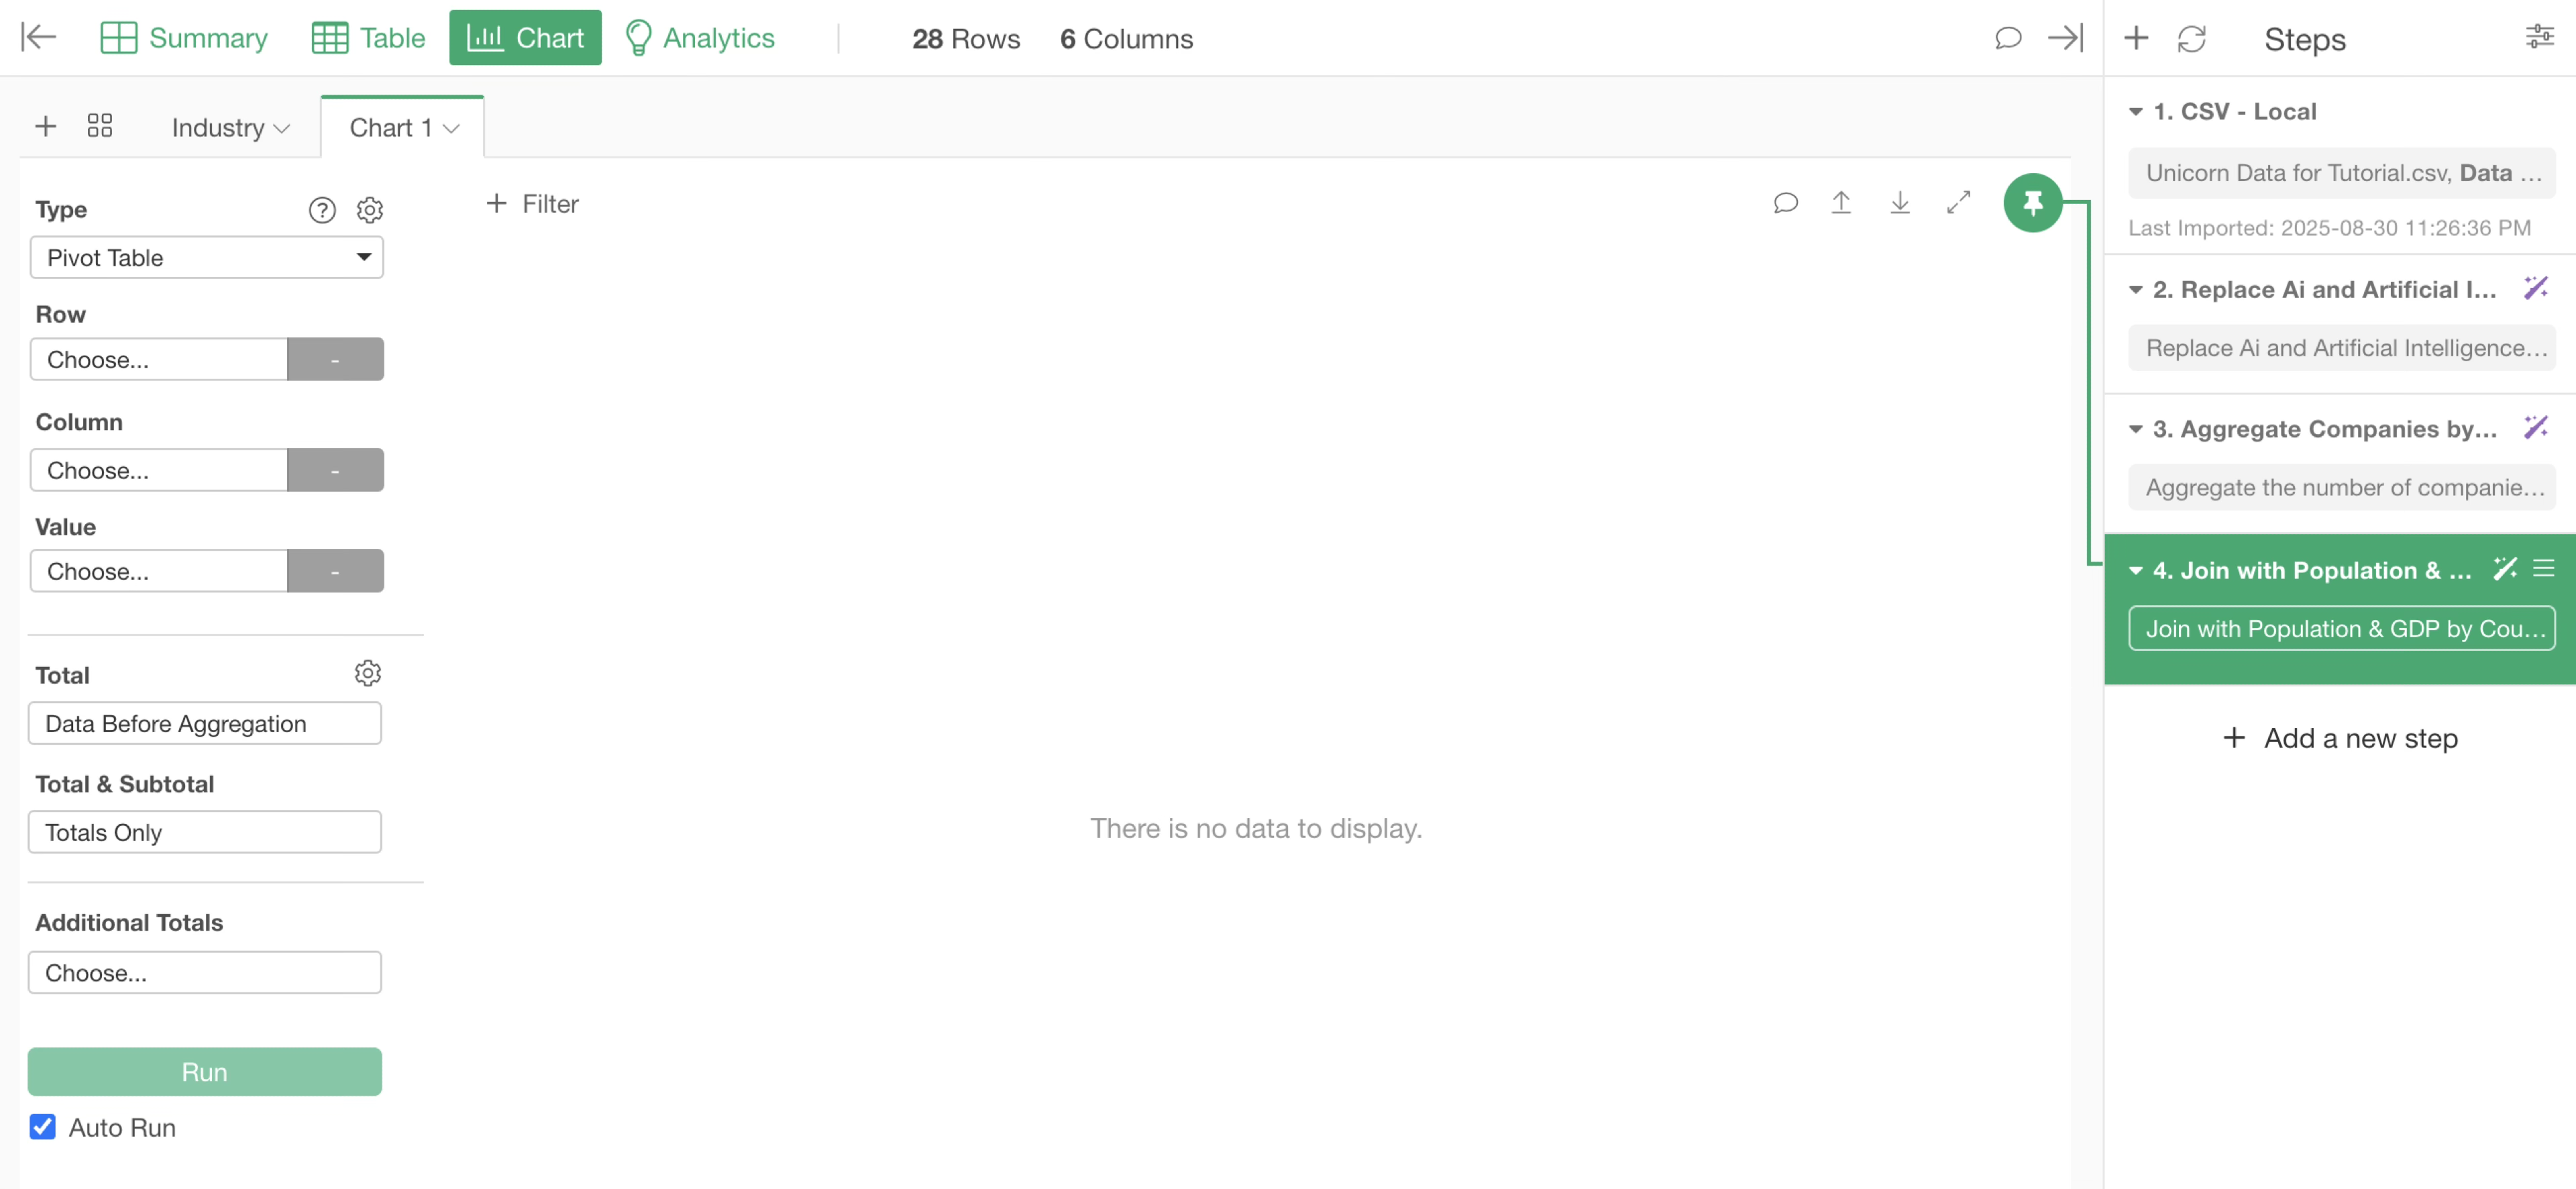
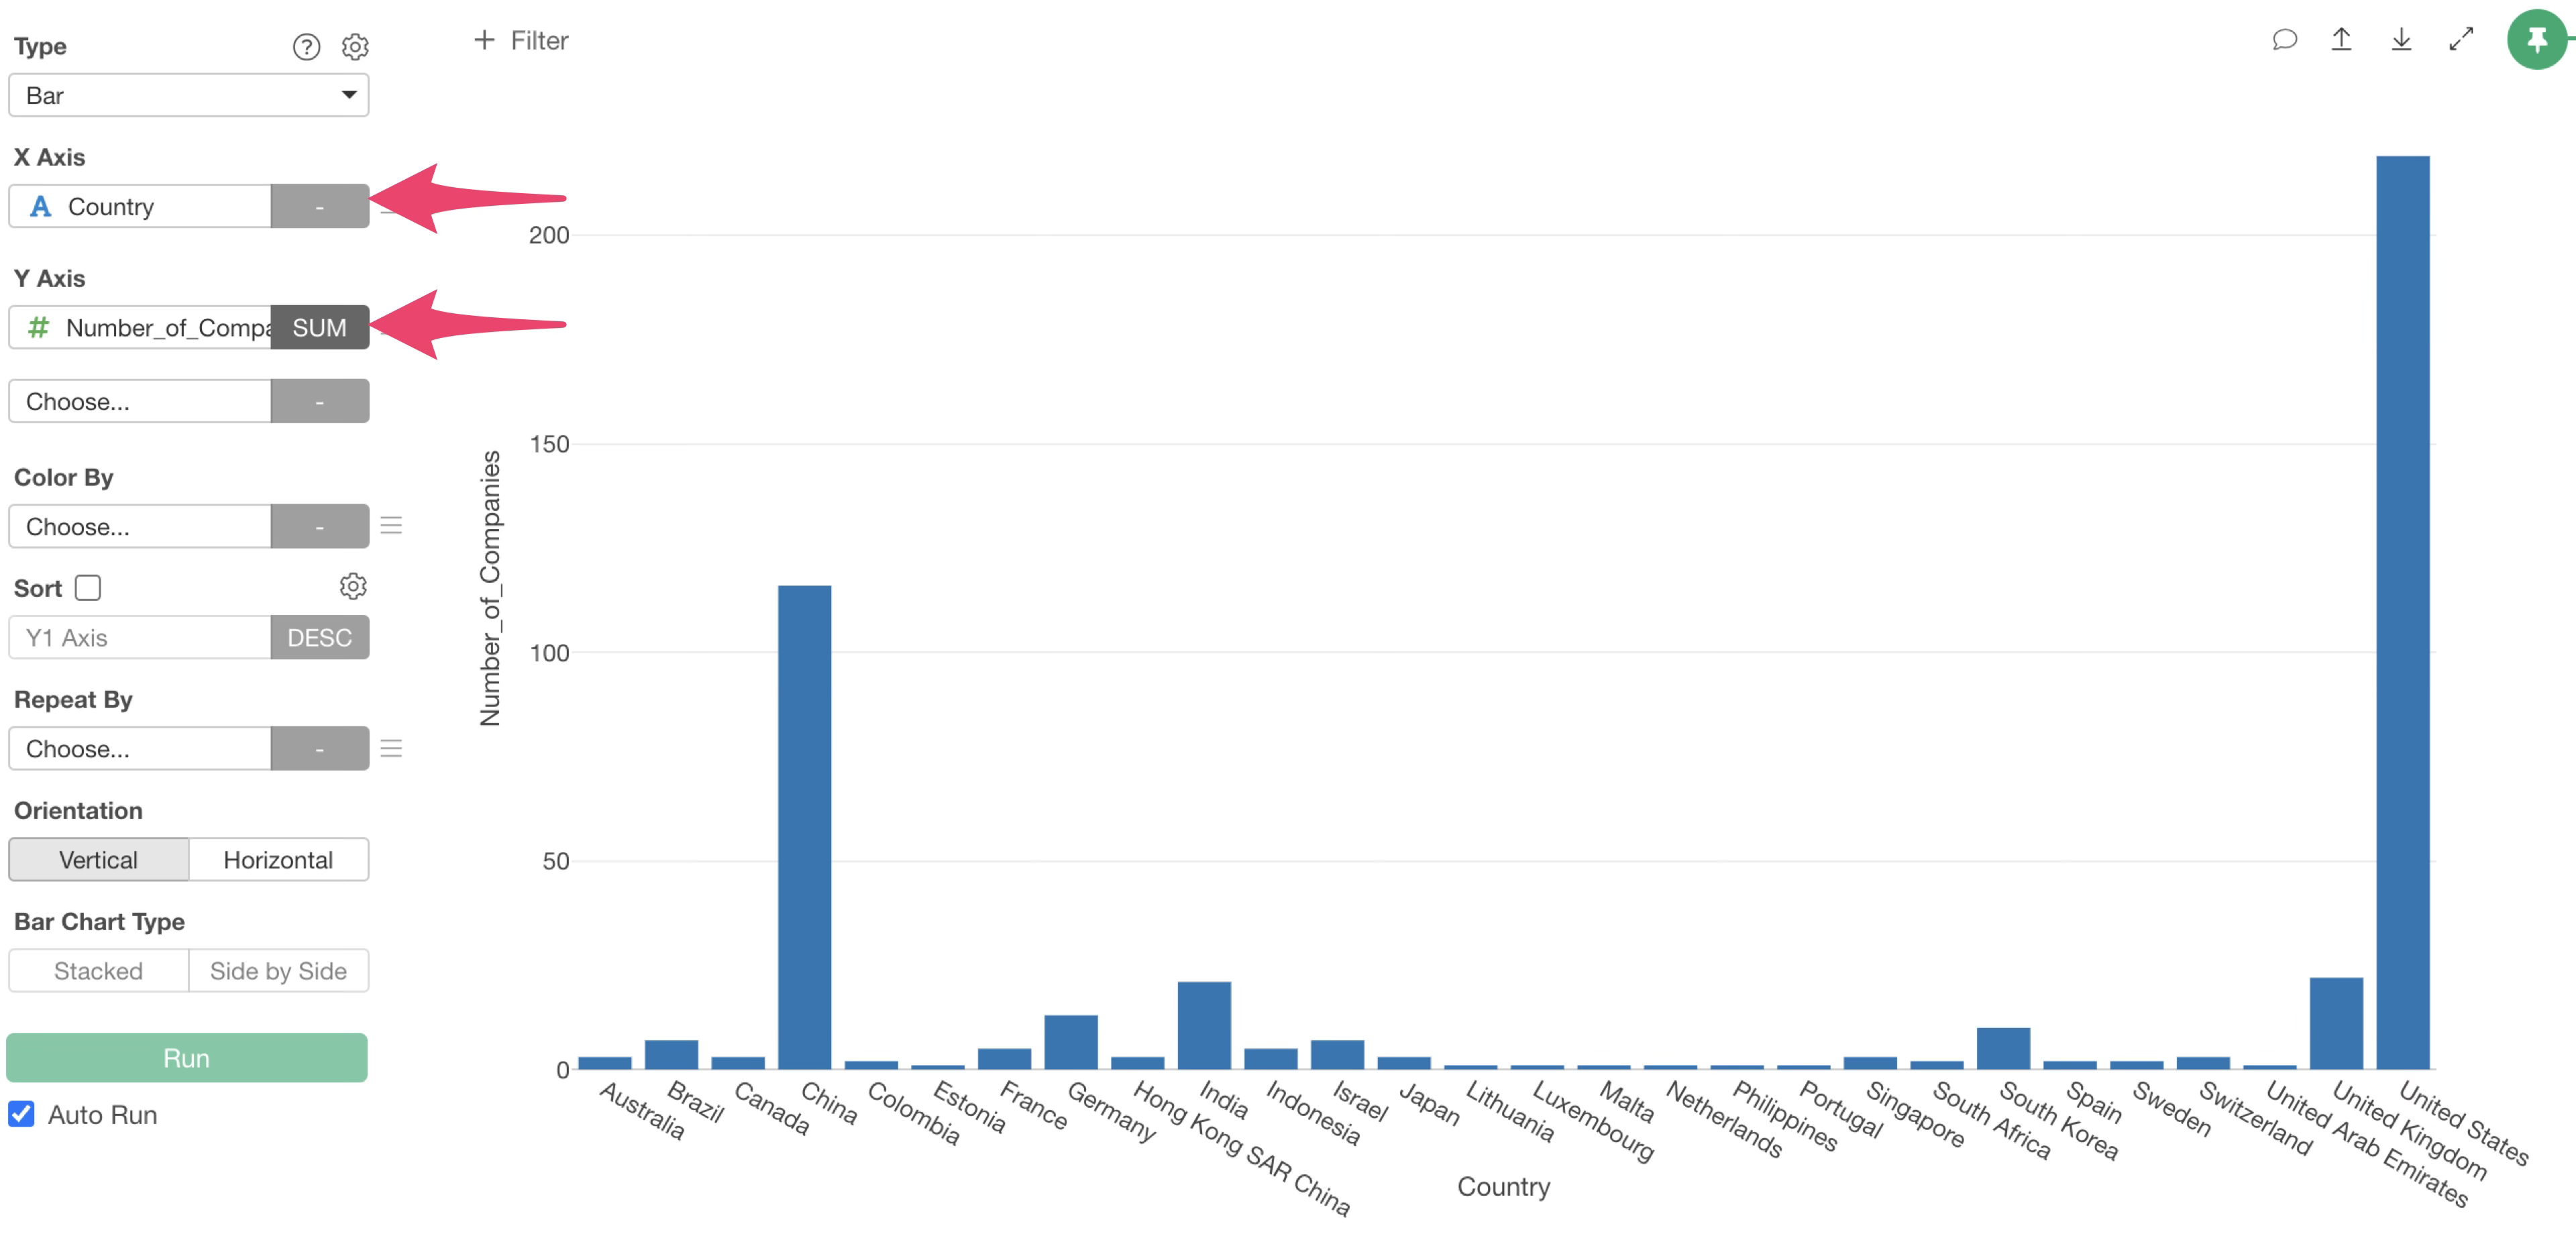
Select “Bar” as the chart type.
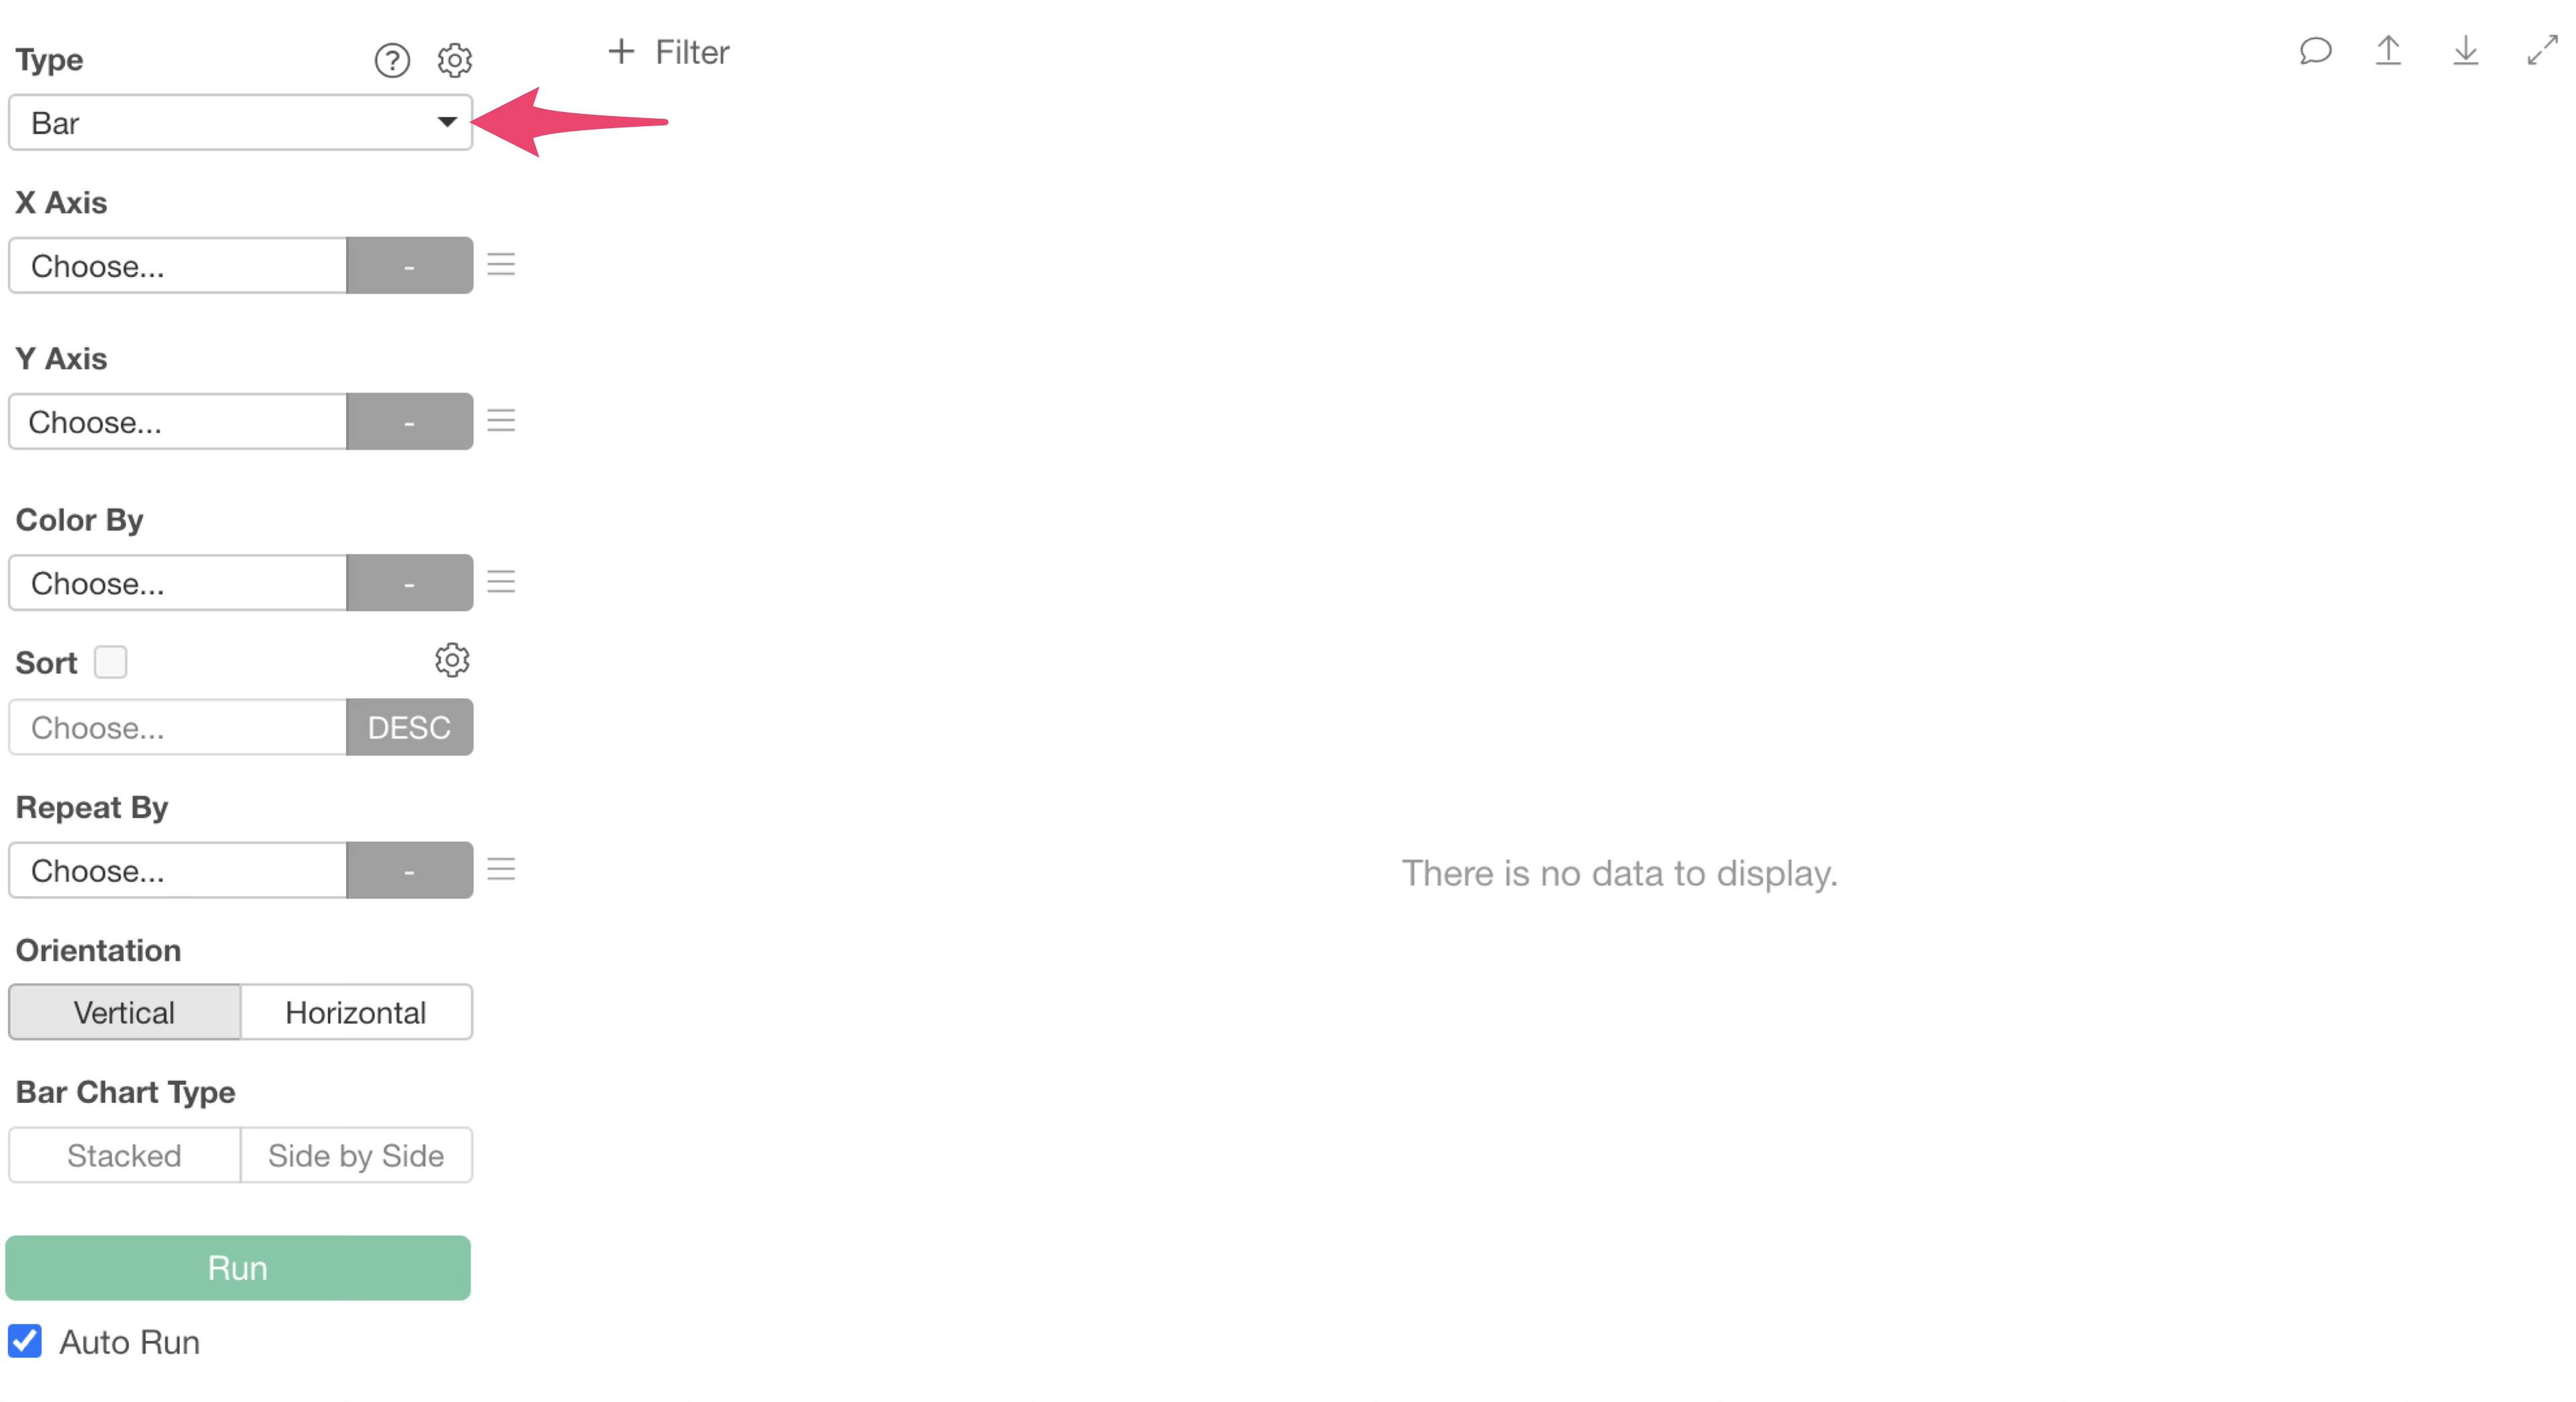
Select “Country” for the X-axis and “SUM” for the aggregation function of “Number_of_Companies” on the Y-axis.
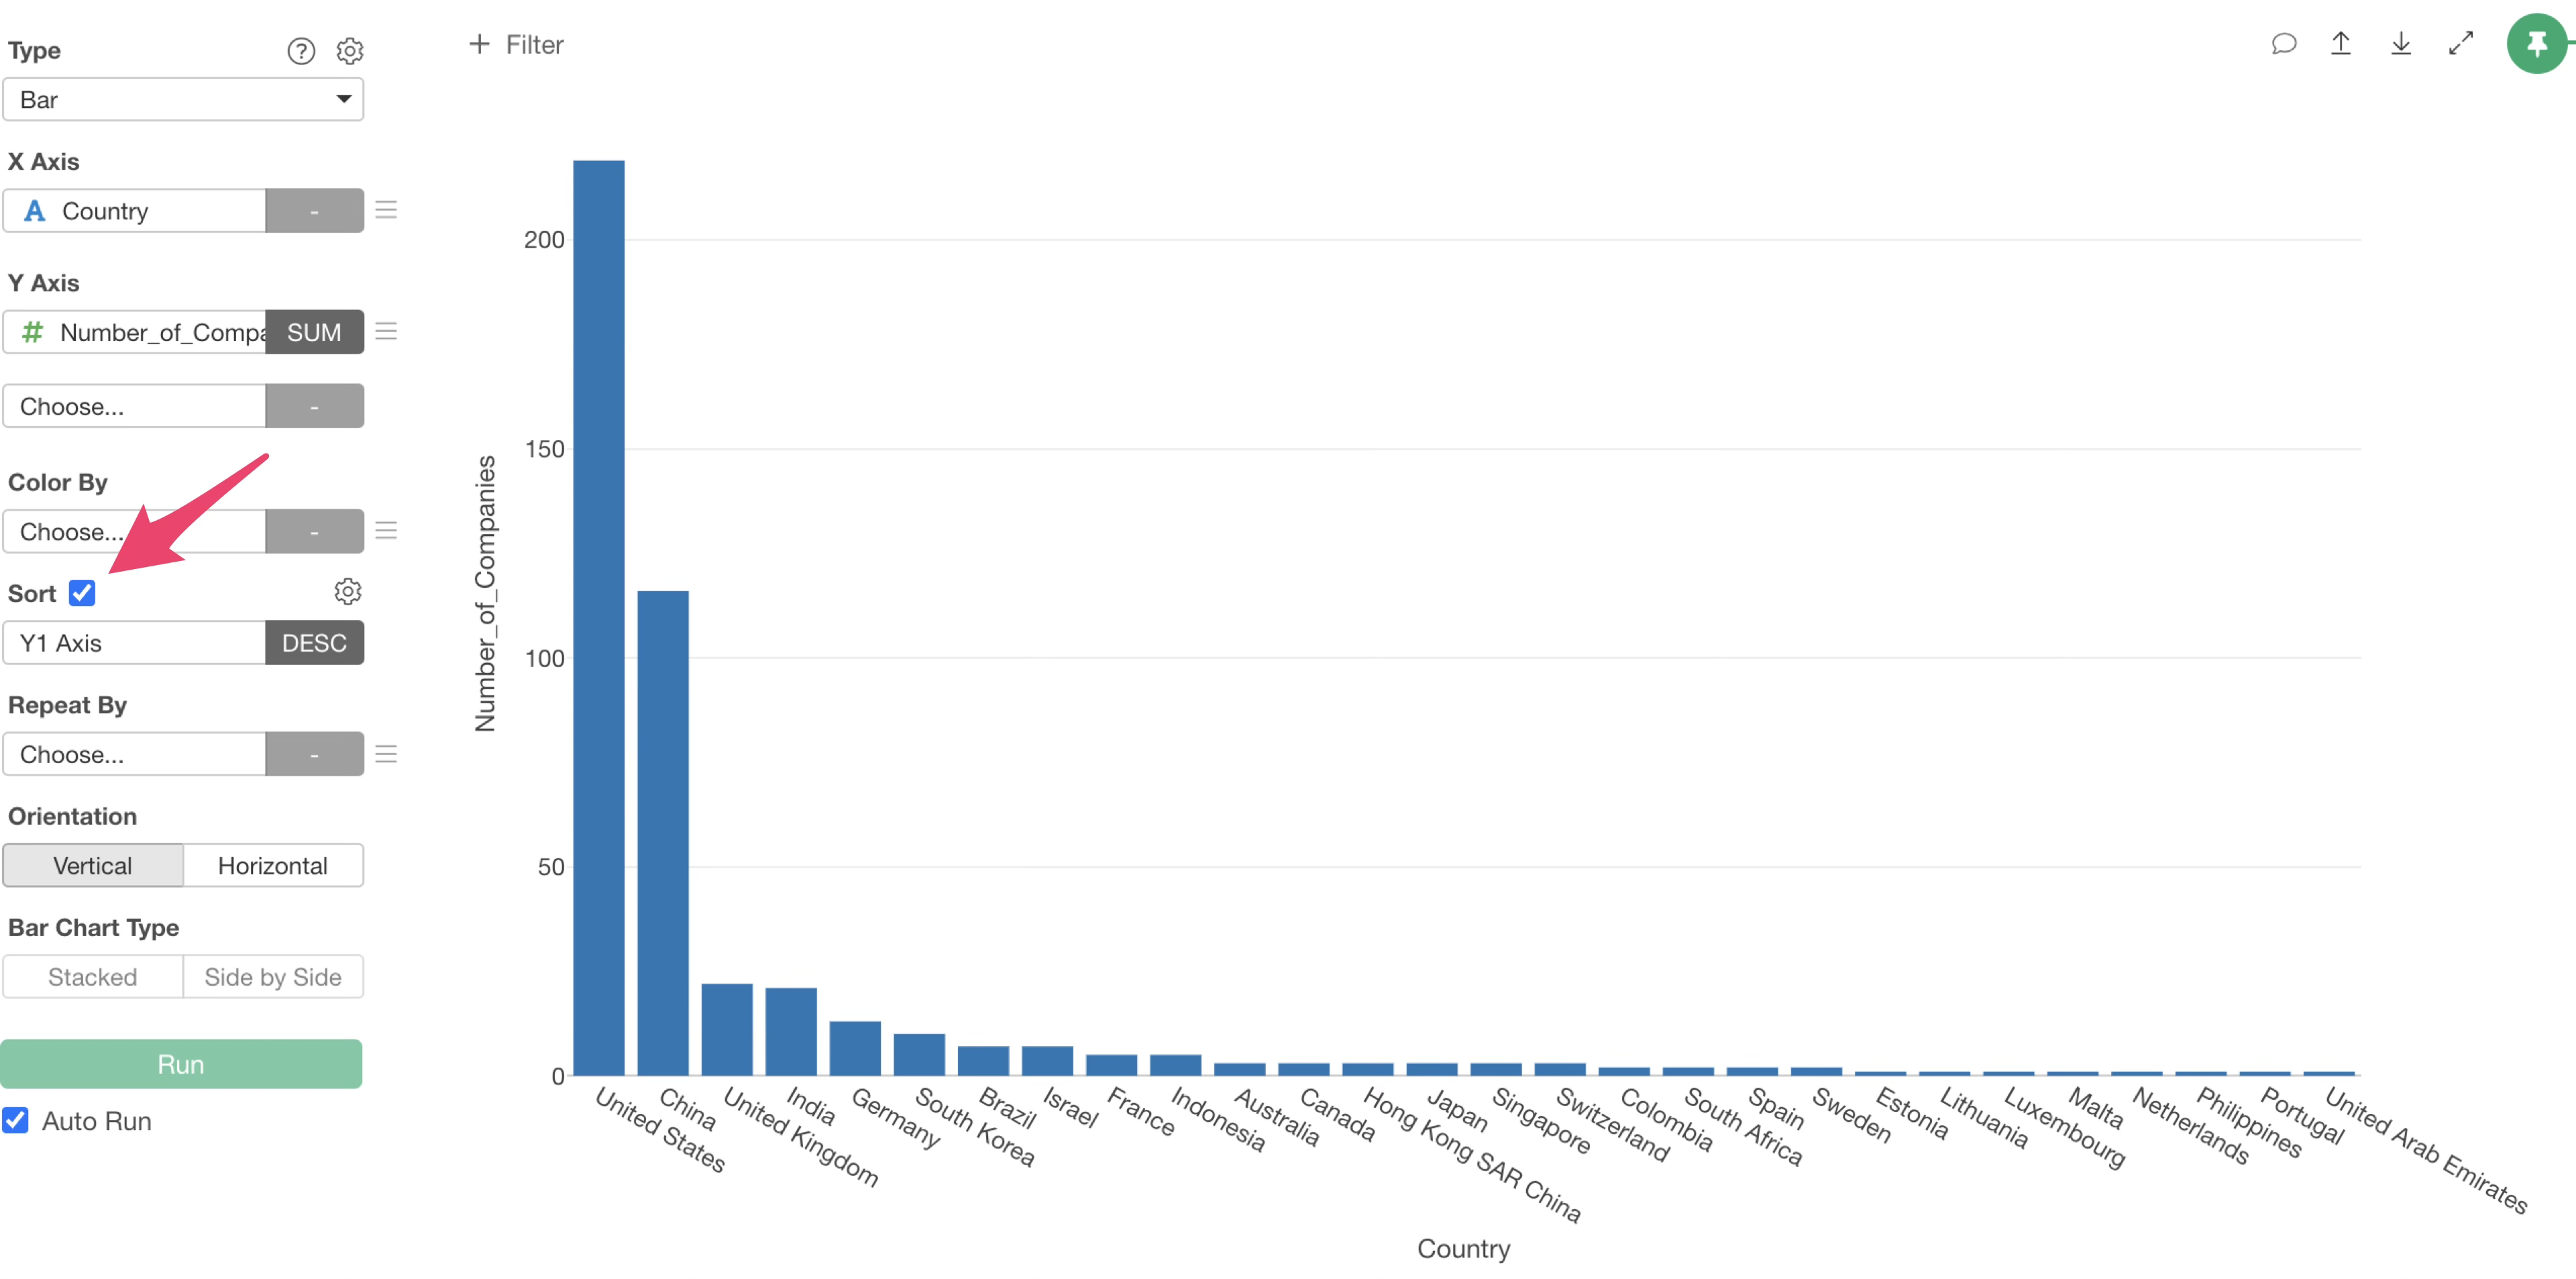
By checking “Sort” checkbox, you can sort countries in descending order of the number of companies.
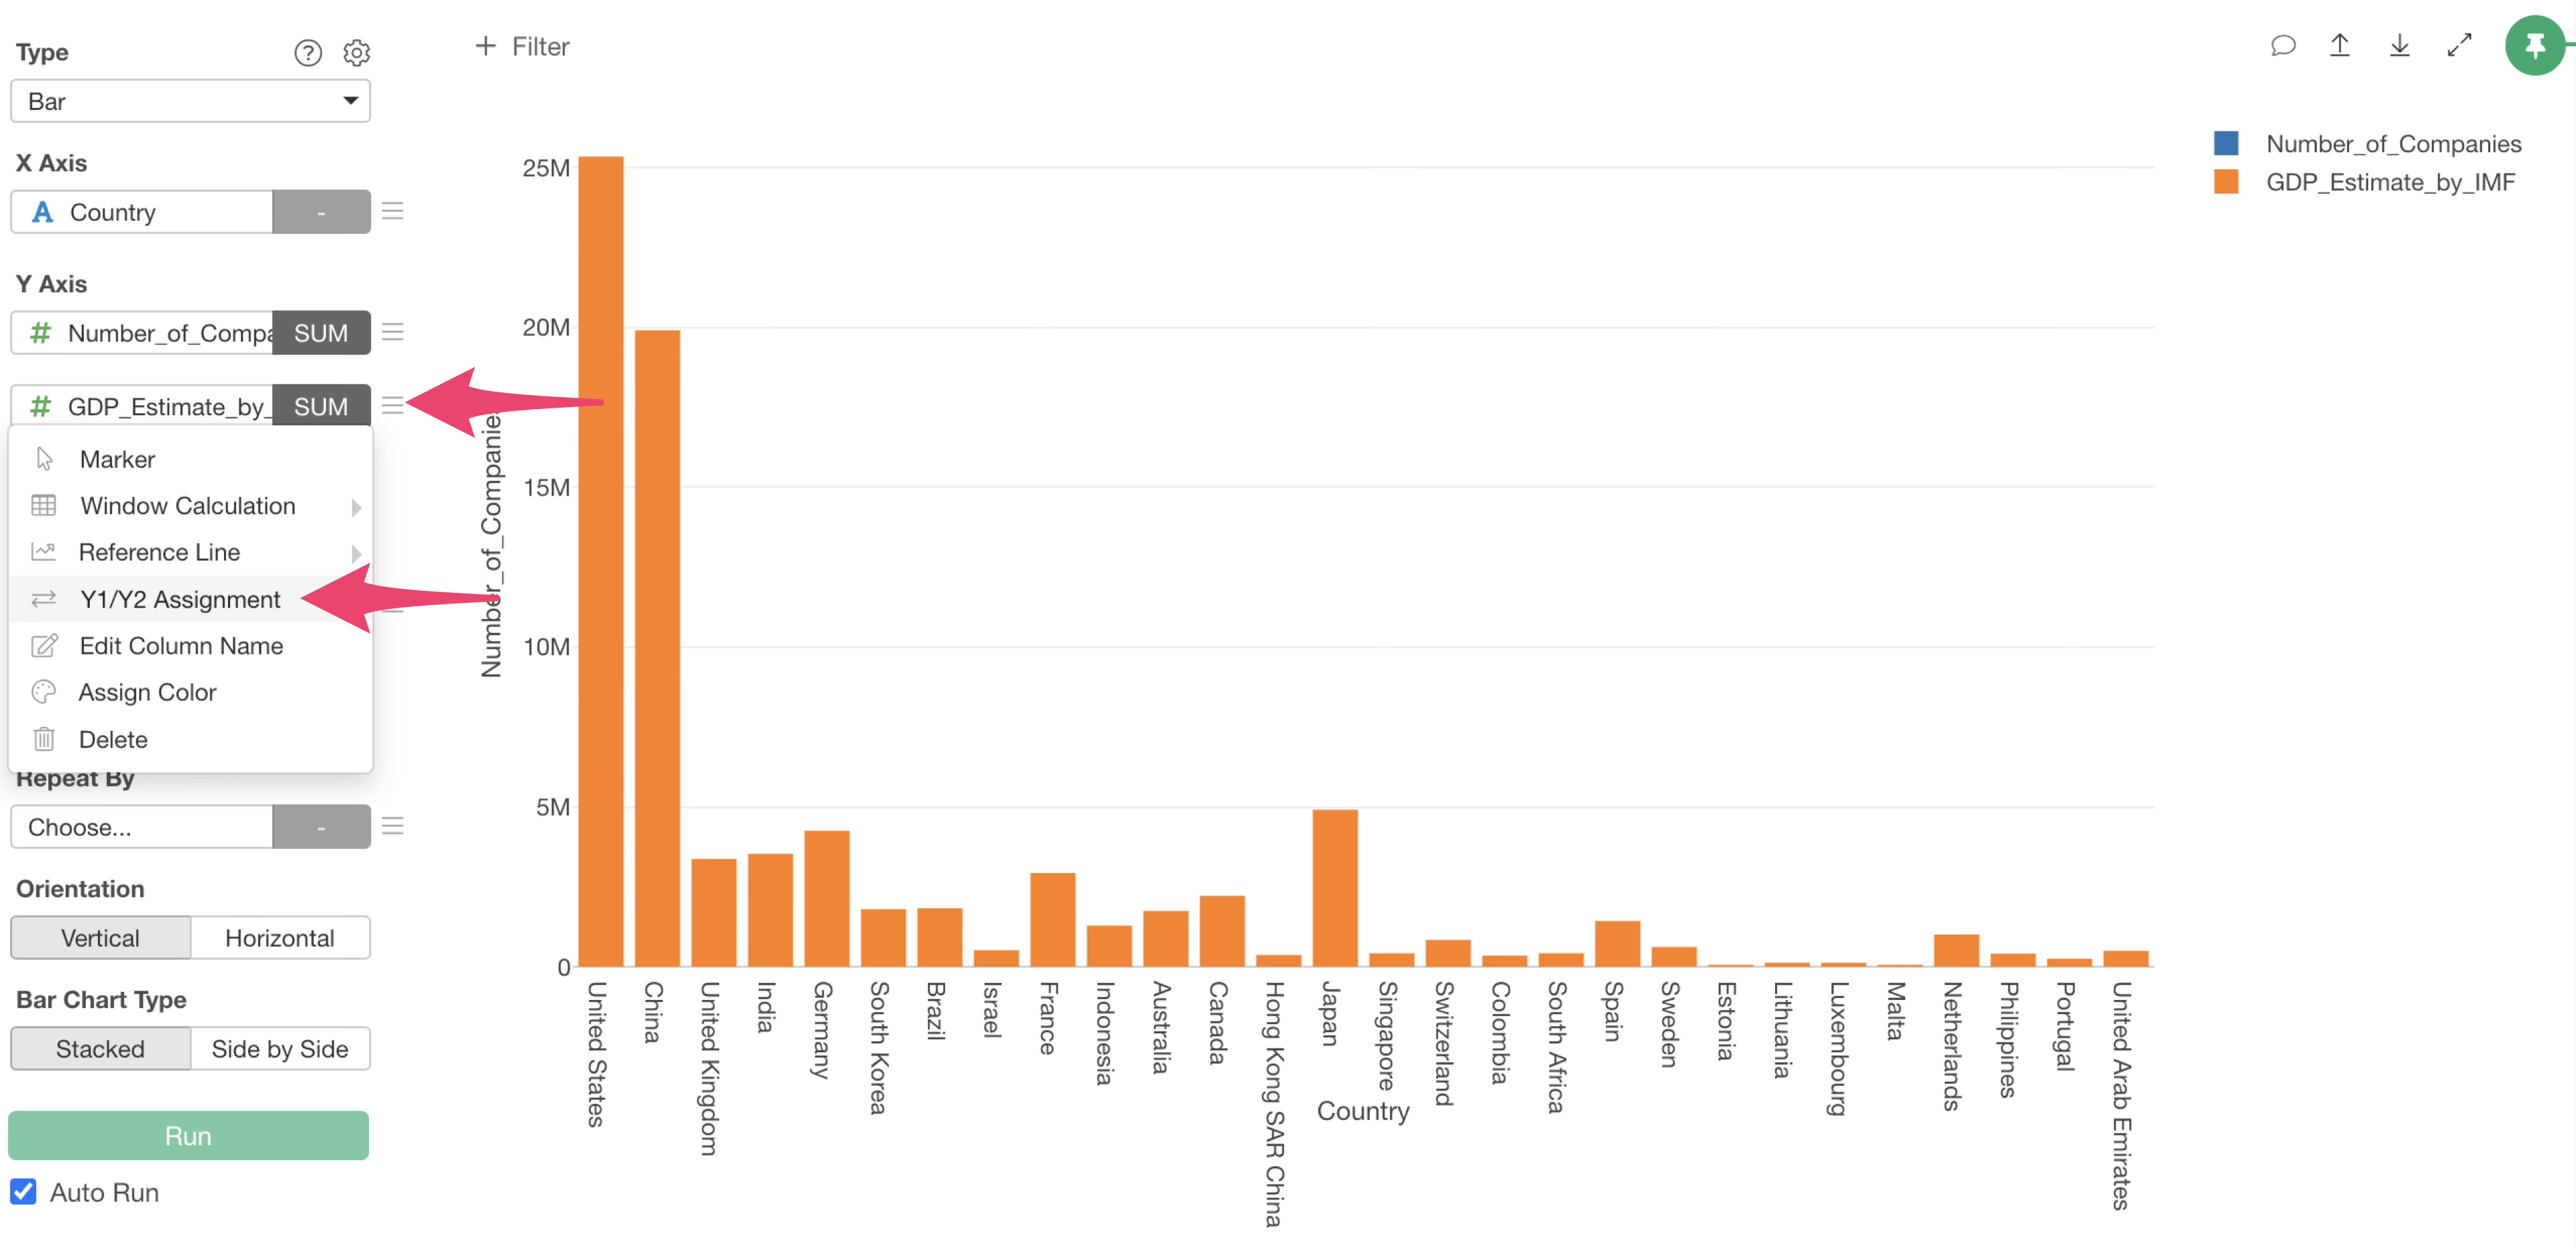
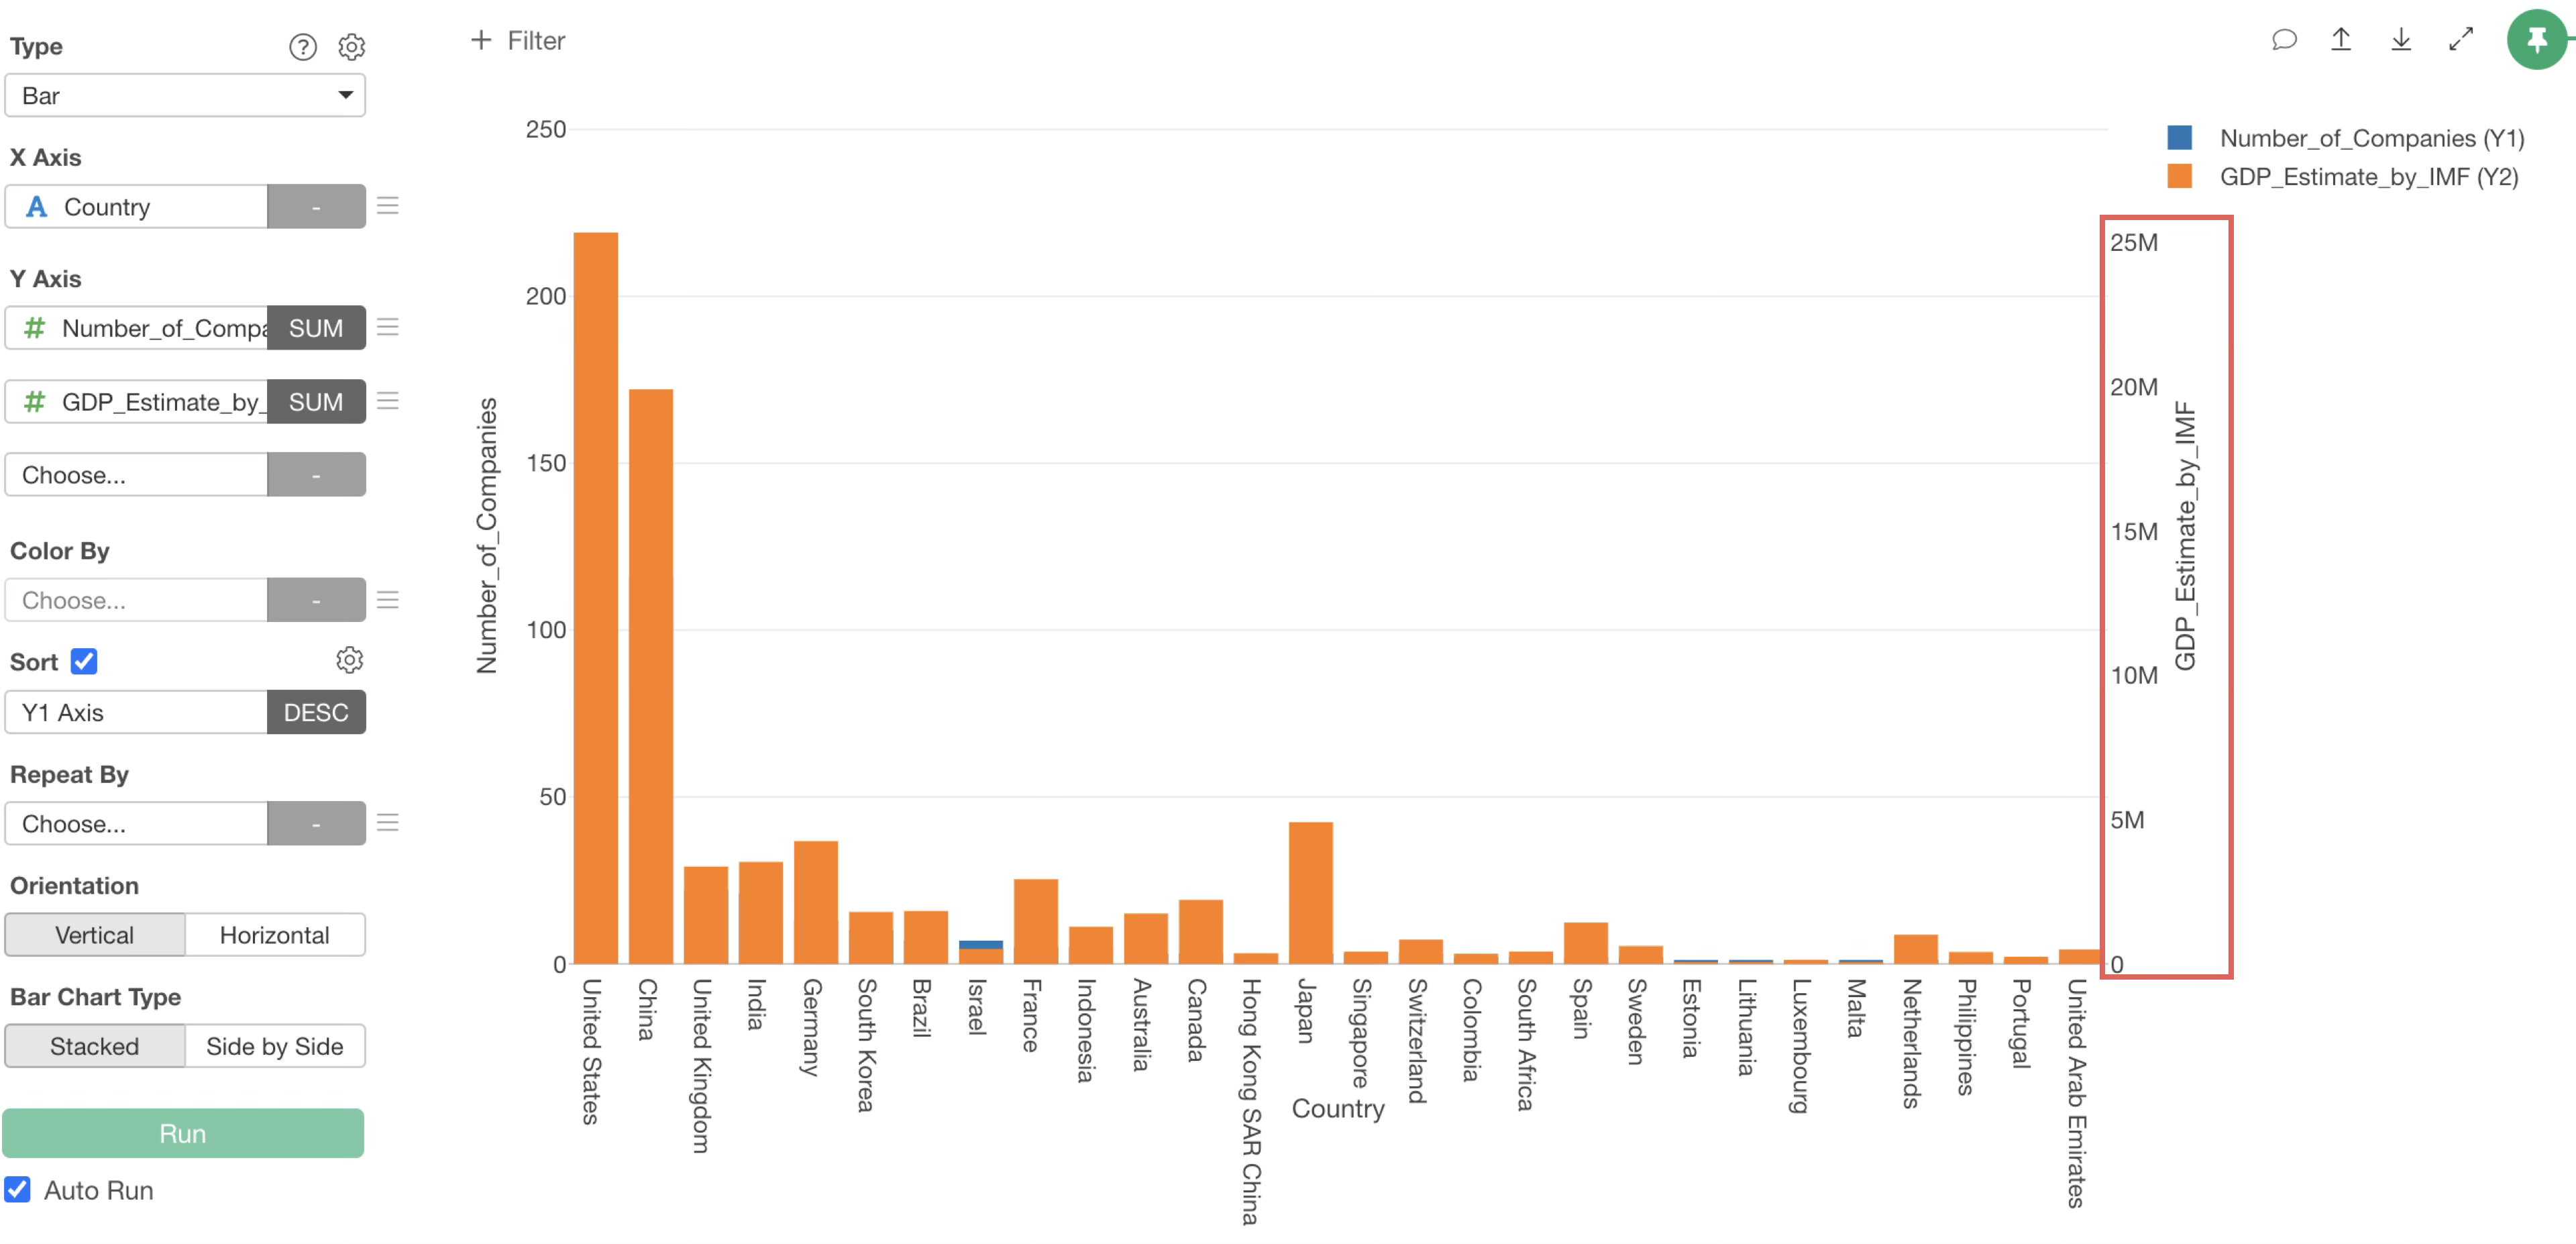
Select “GDP_Estimate_by_IMF” for the second column on the Y-axis and “SUM” for the aggregation function.

However, since “Number_of_Companies” and “GDP_Estimate_by_IMF” are using the same Y1 axis, we want to set GDP to the “Y2 axis.”
From the menu of “GDP” set as the second Y-axis, select “Y1/Y2 Axis.”
The column settings dialog will appear. Check “Y2 Axis” for GDP and click “Apply.”
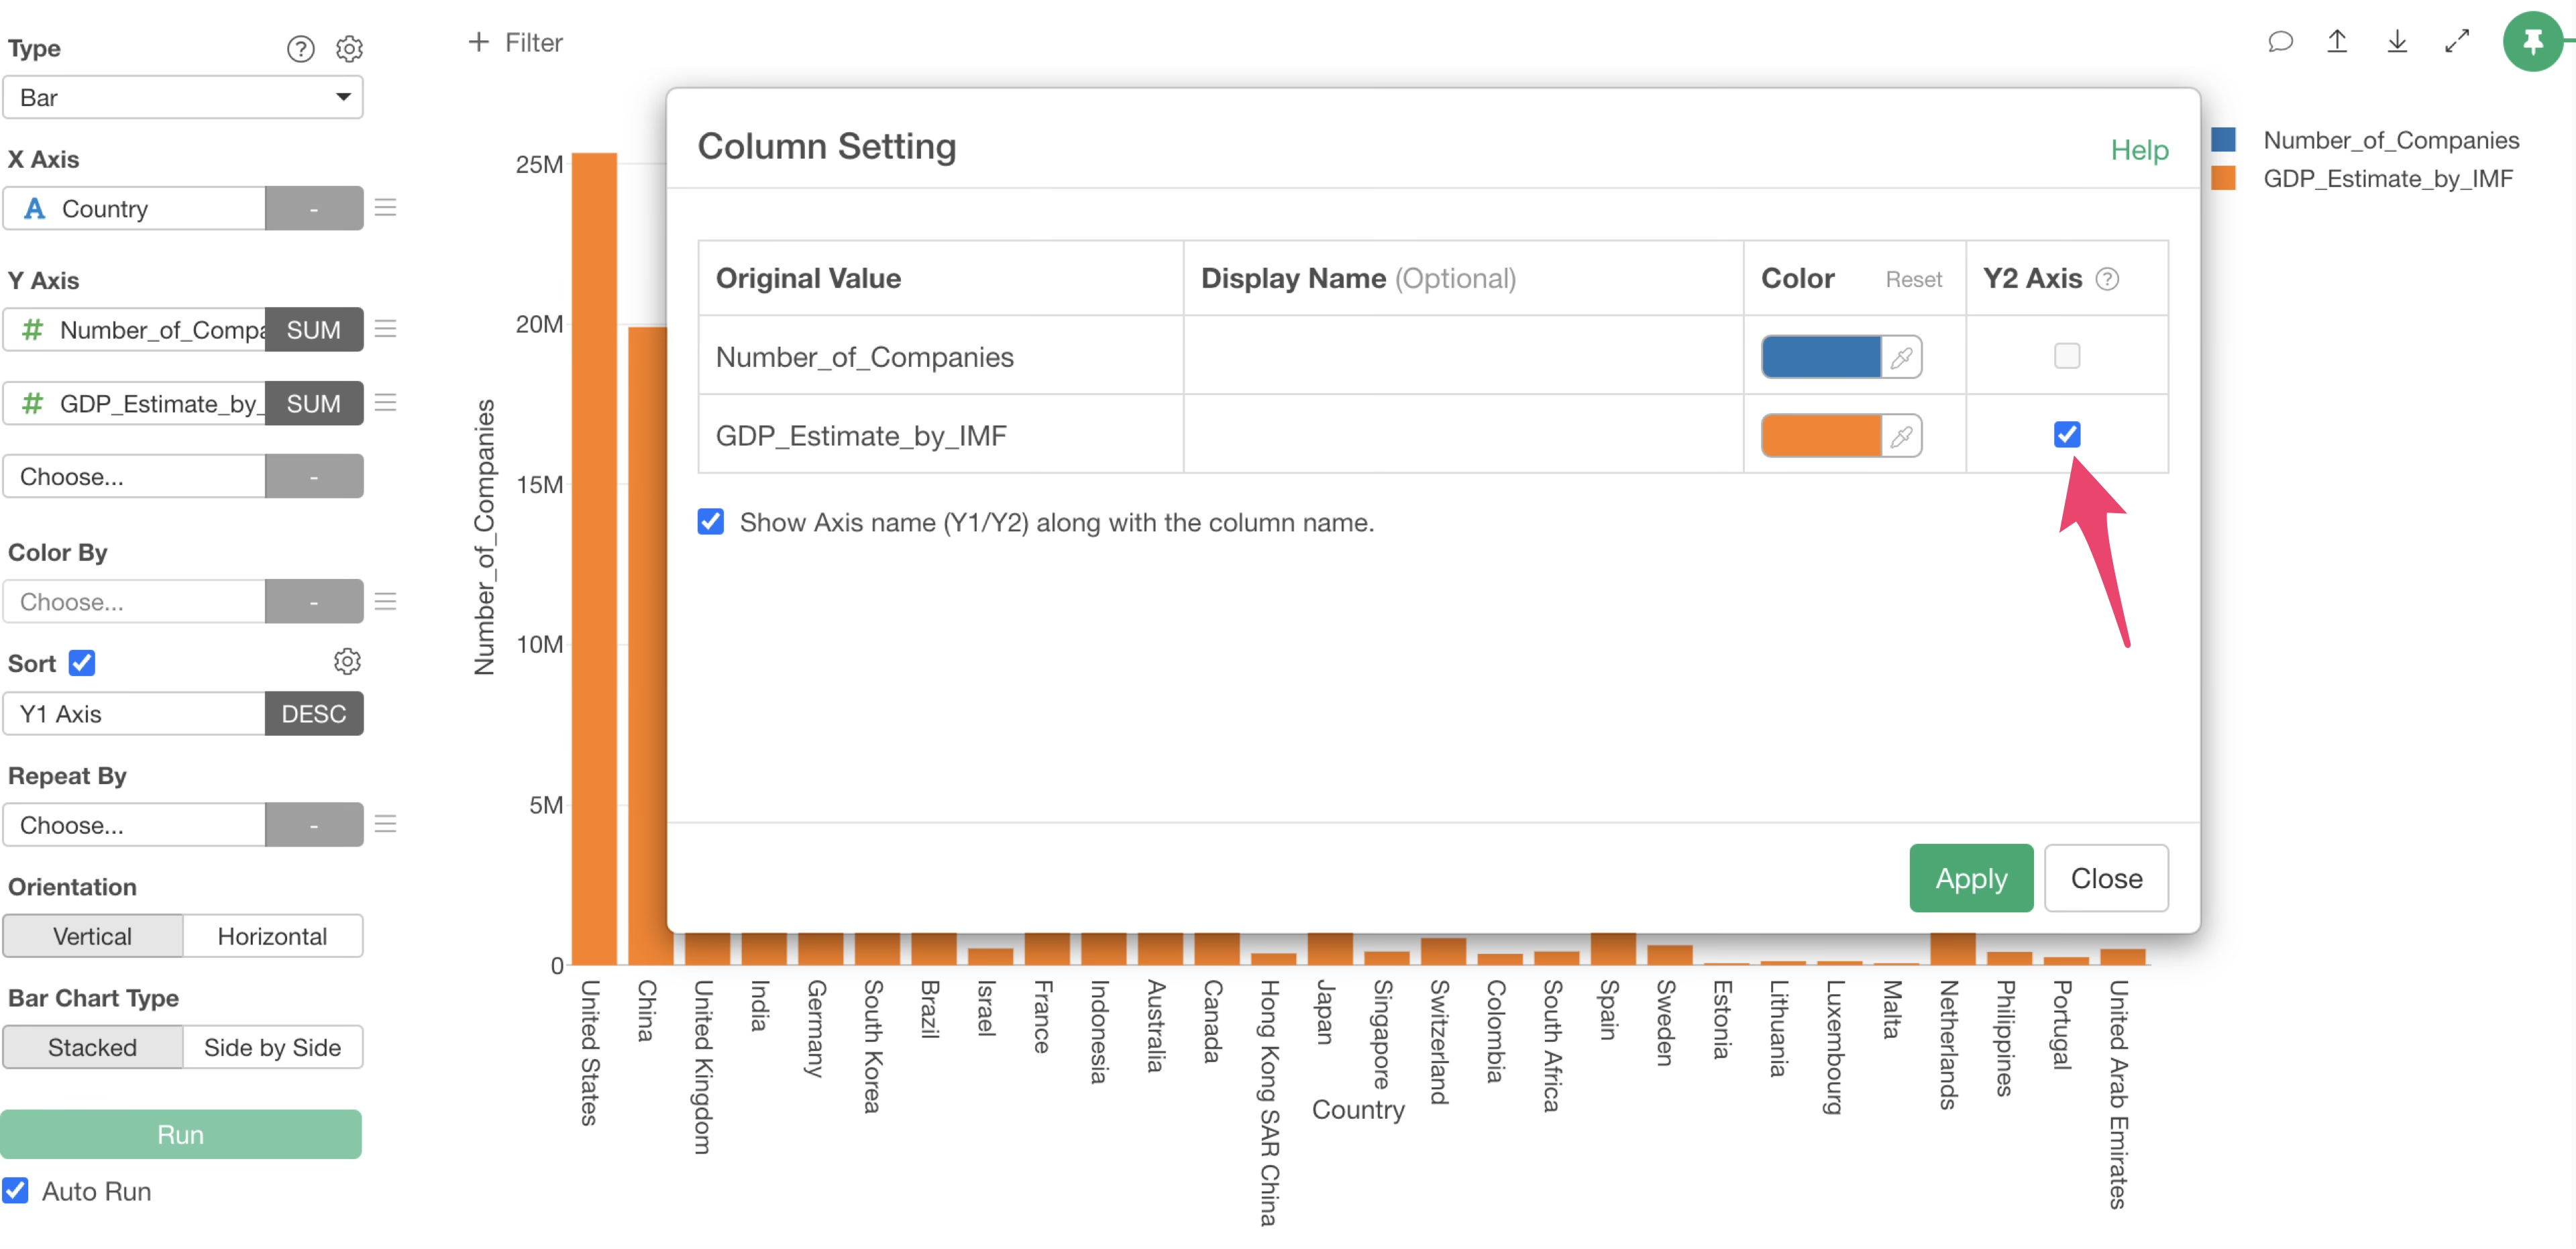
The GDP column values have been set to the “Y2 axis.”
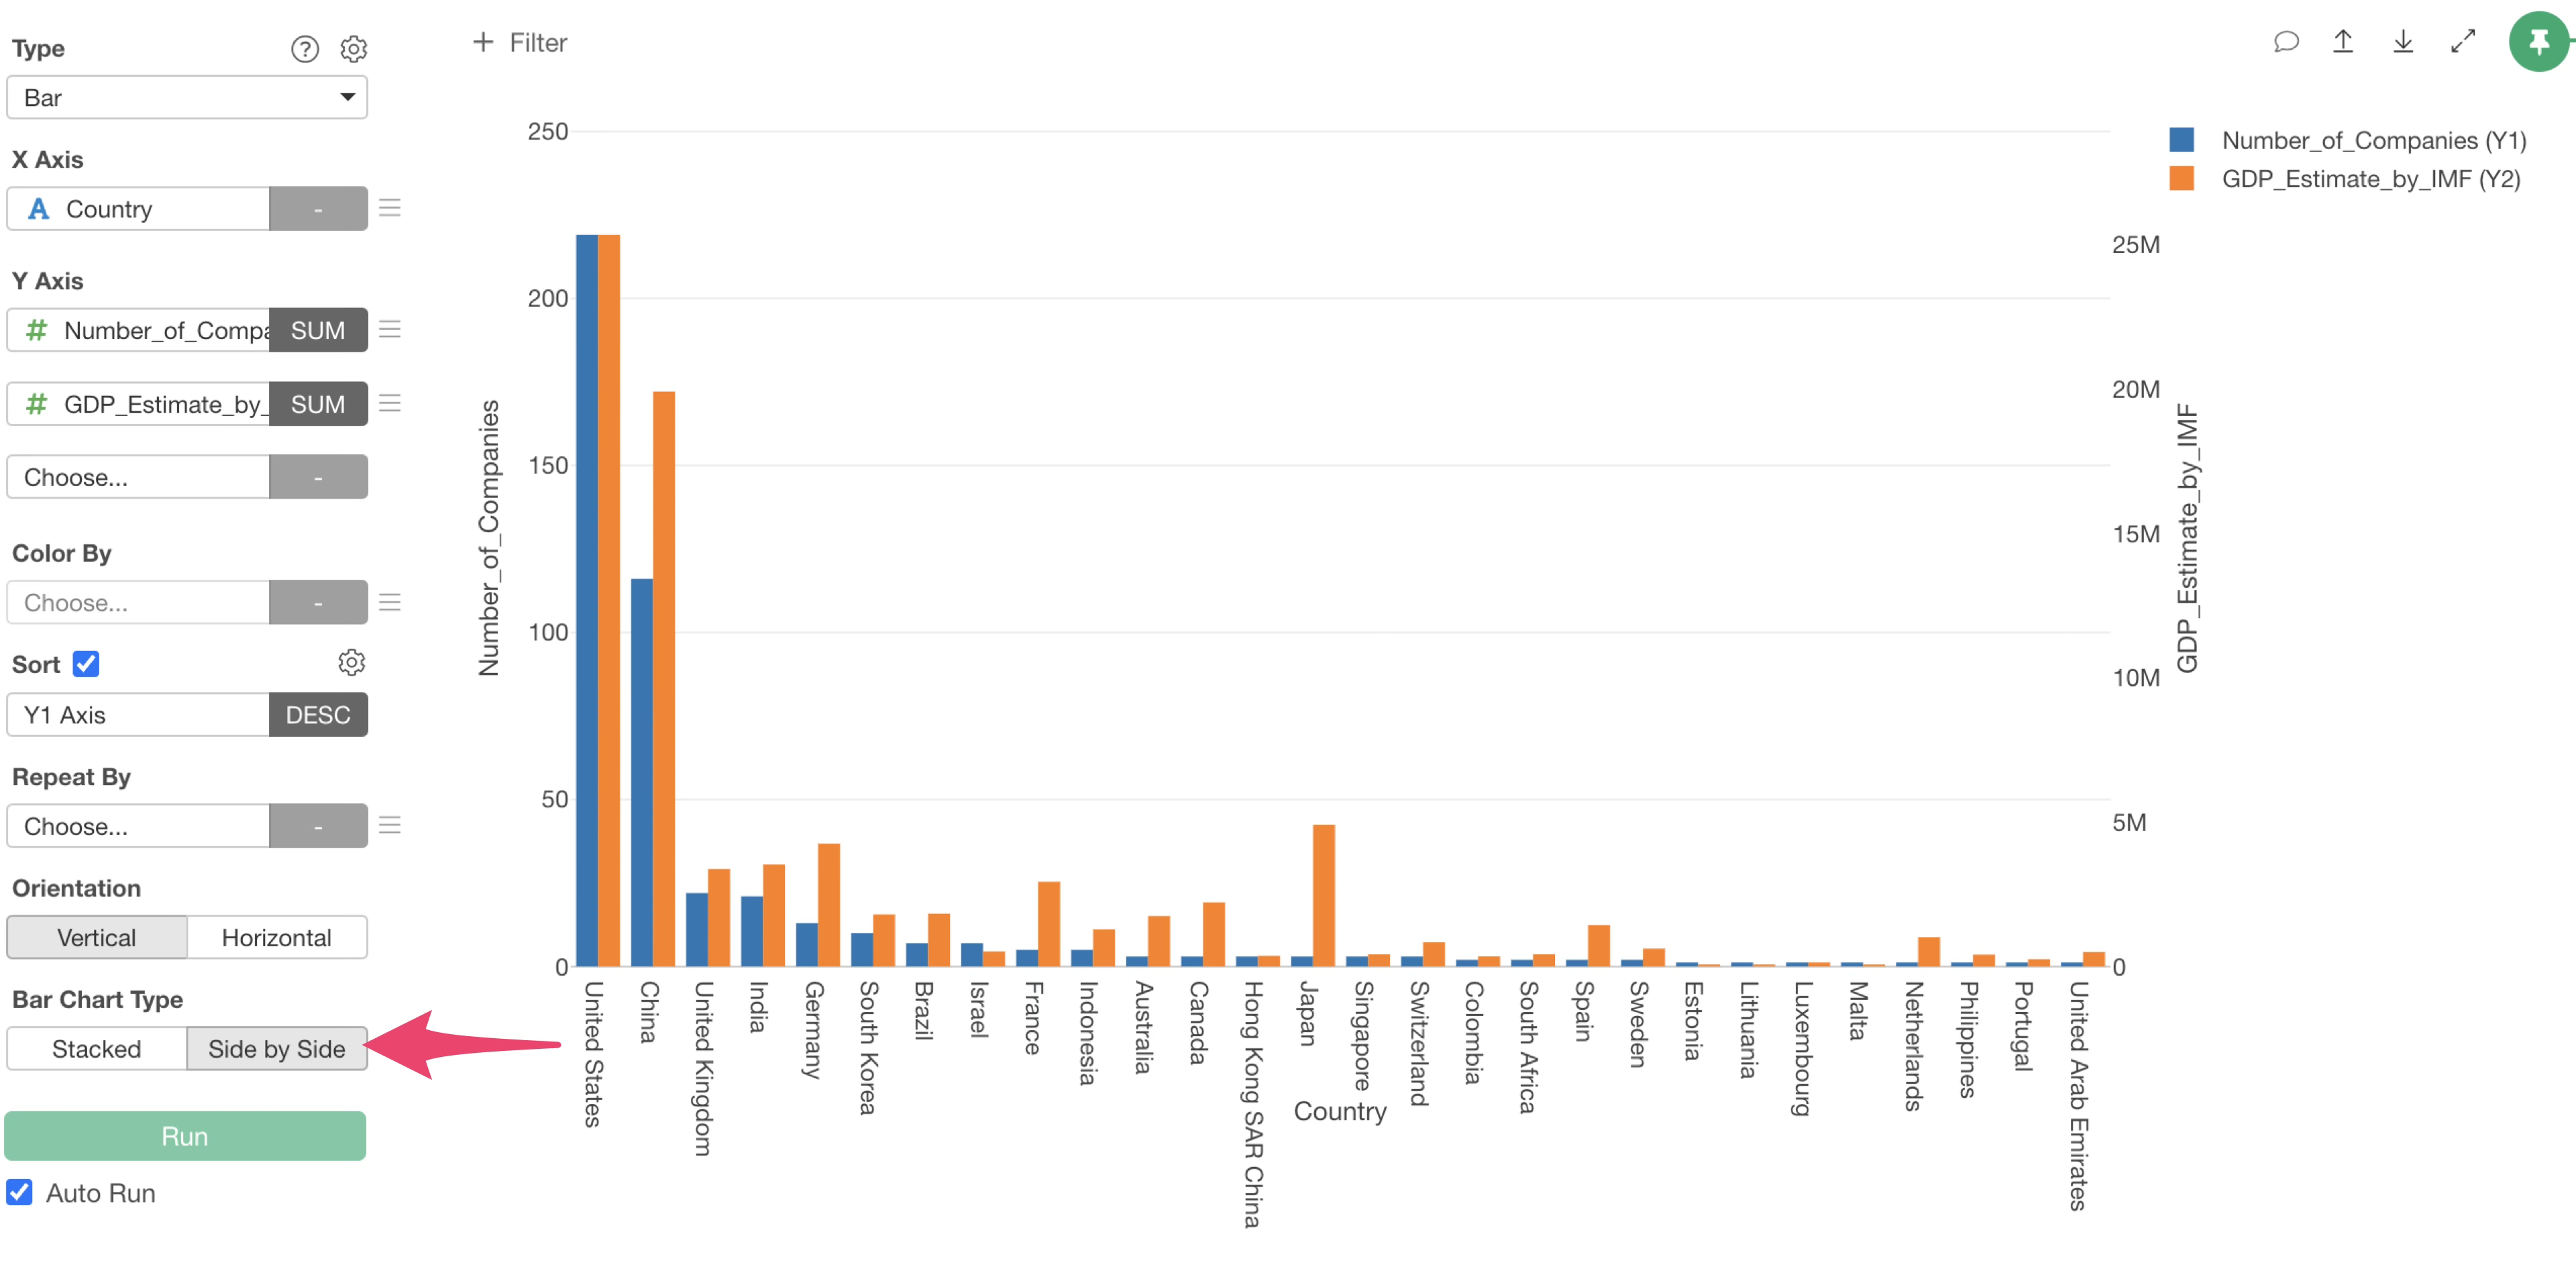
To display the “Number_of_Companies” and “GDP_Estimate_by_IMF” bars side-by-side, specify “Side by Side” for the bar chart type.
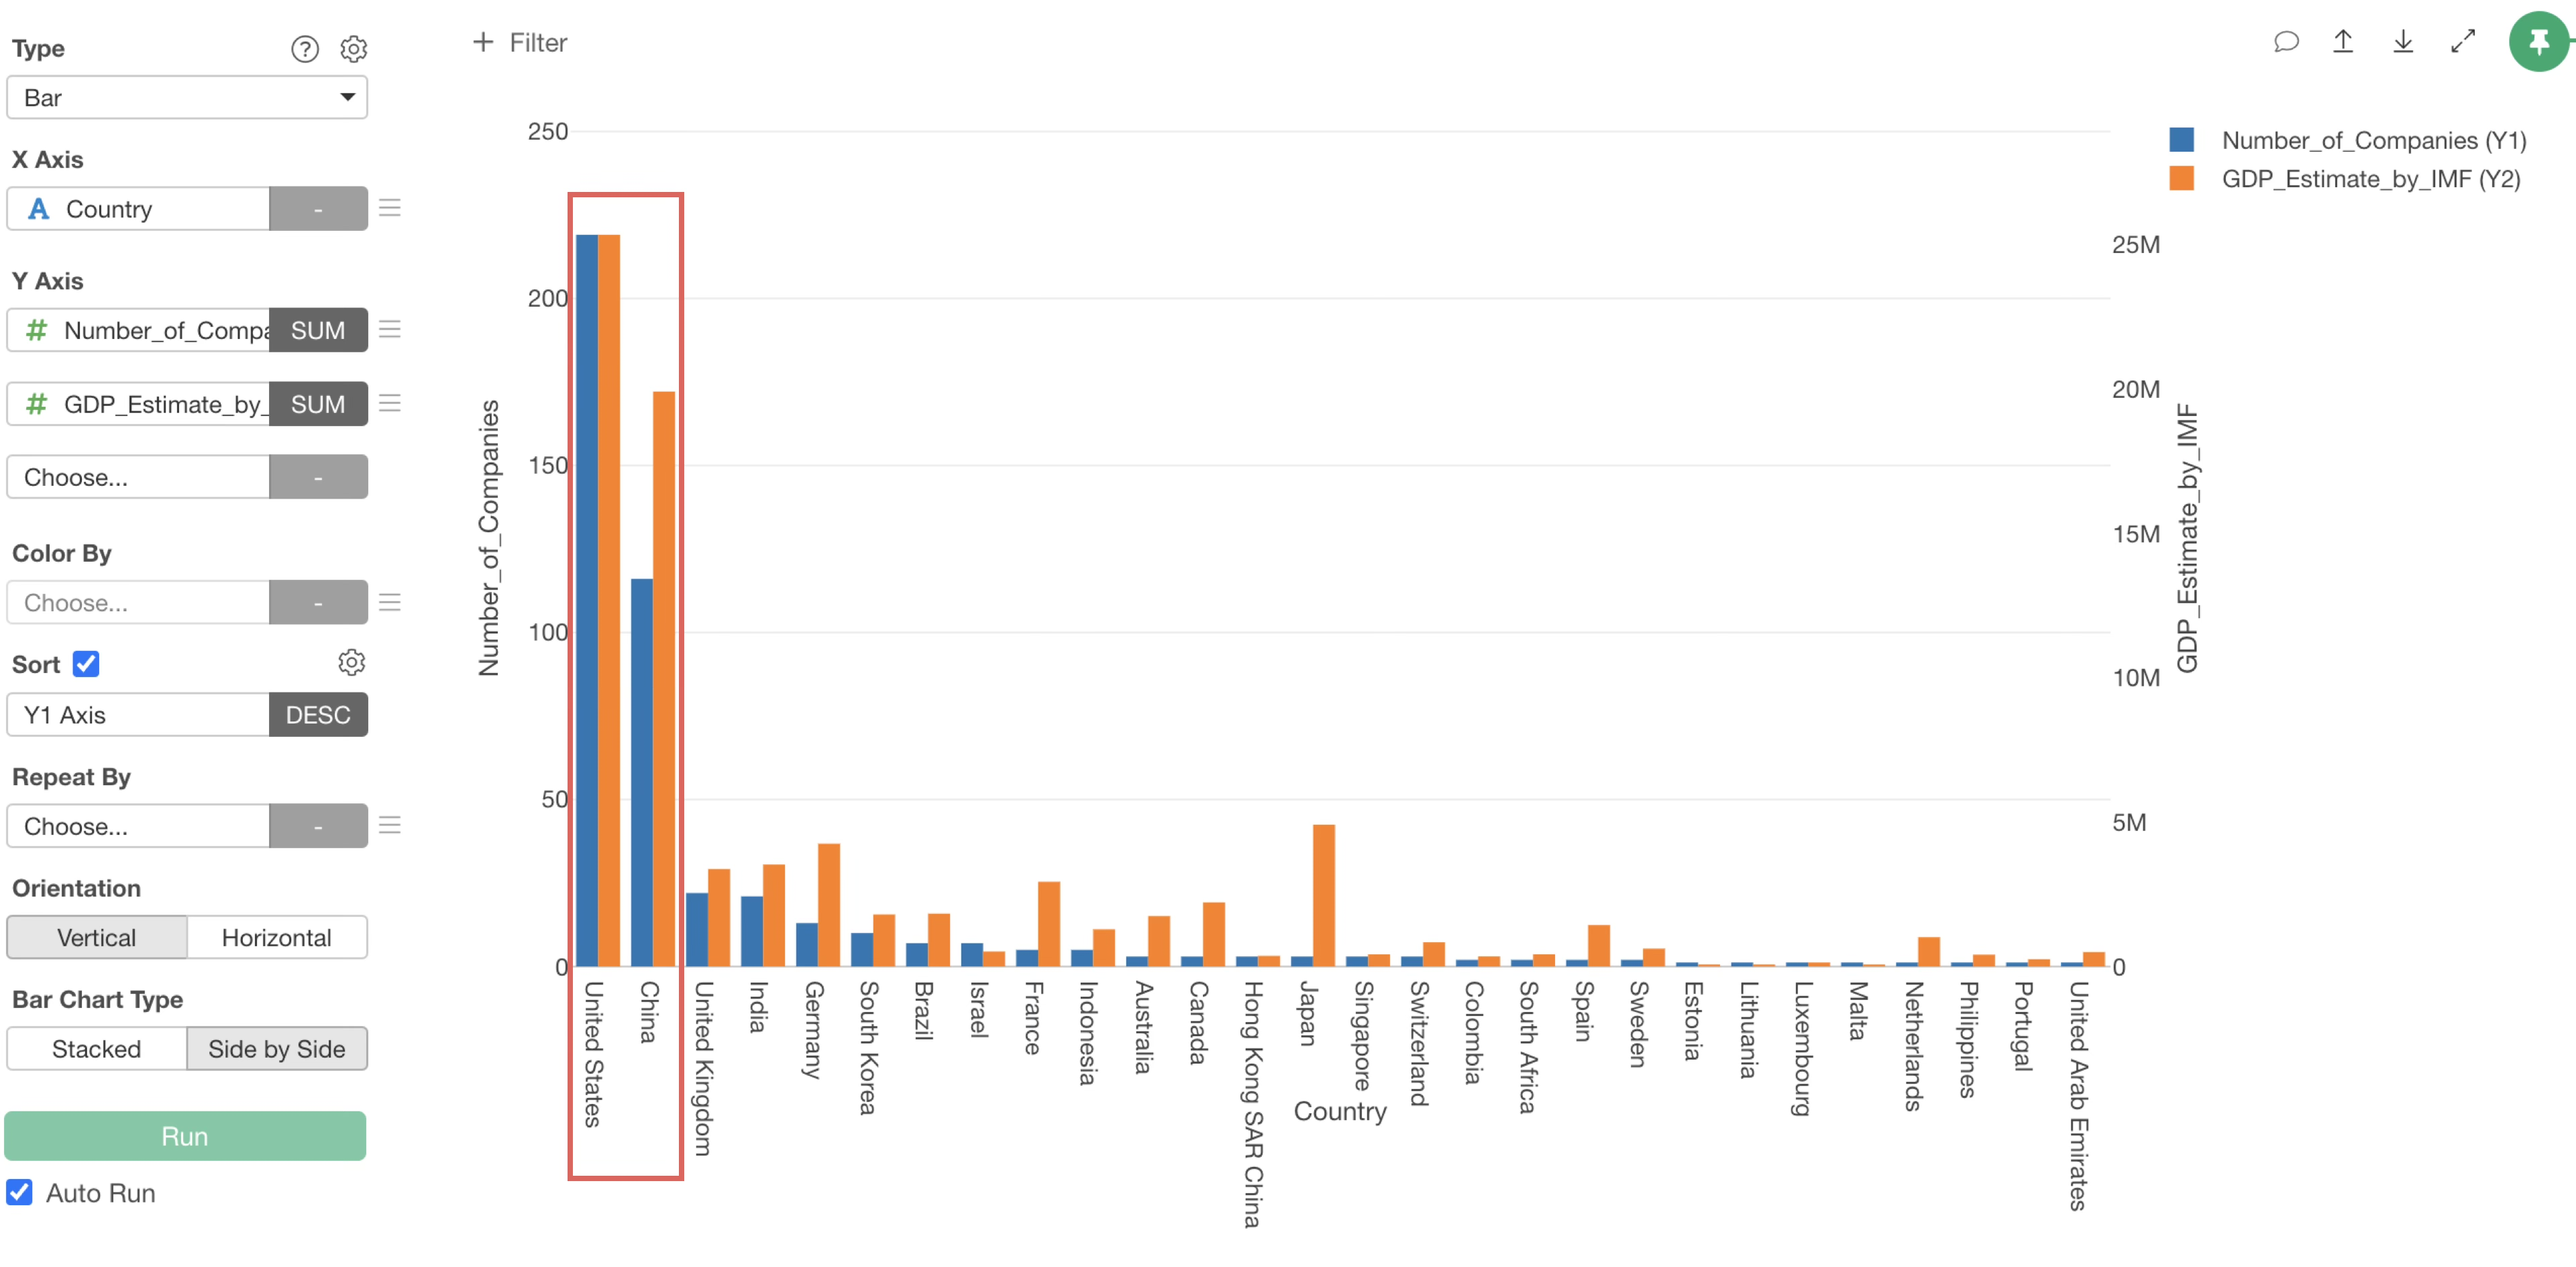
It can be observed that countries with high GDP, such as “United States” and “China”, have a large number of unicorn companies.
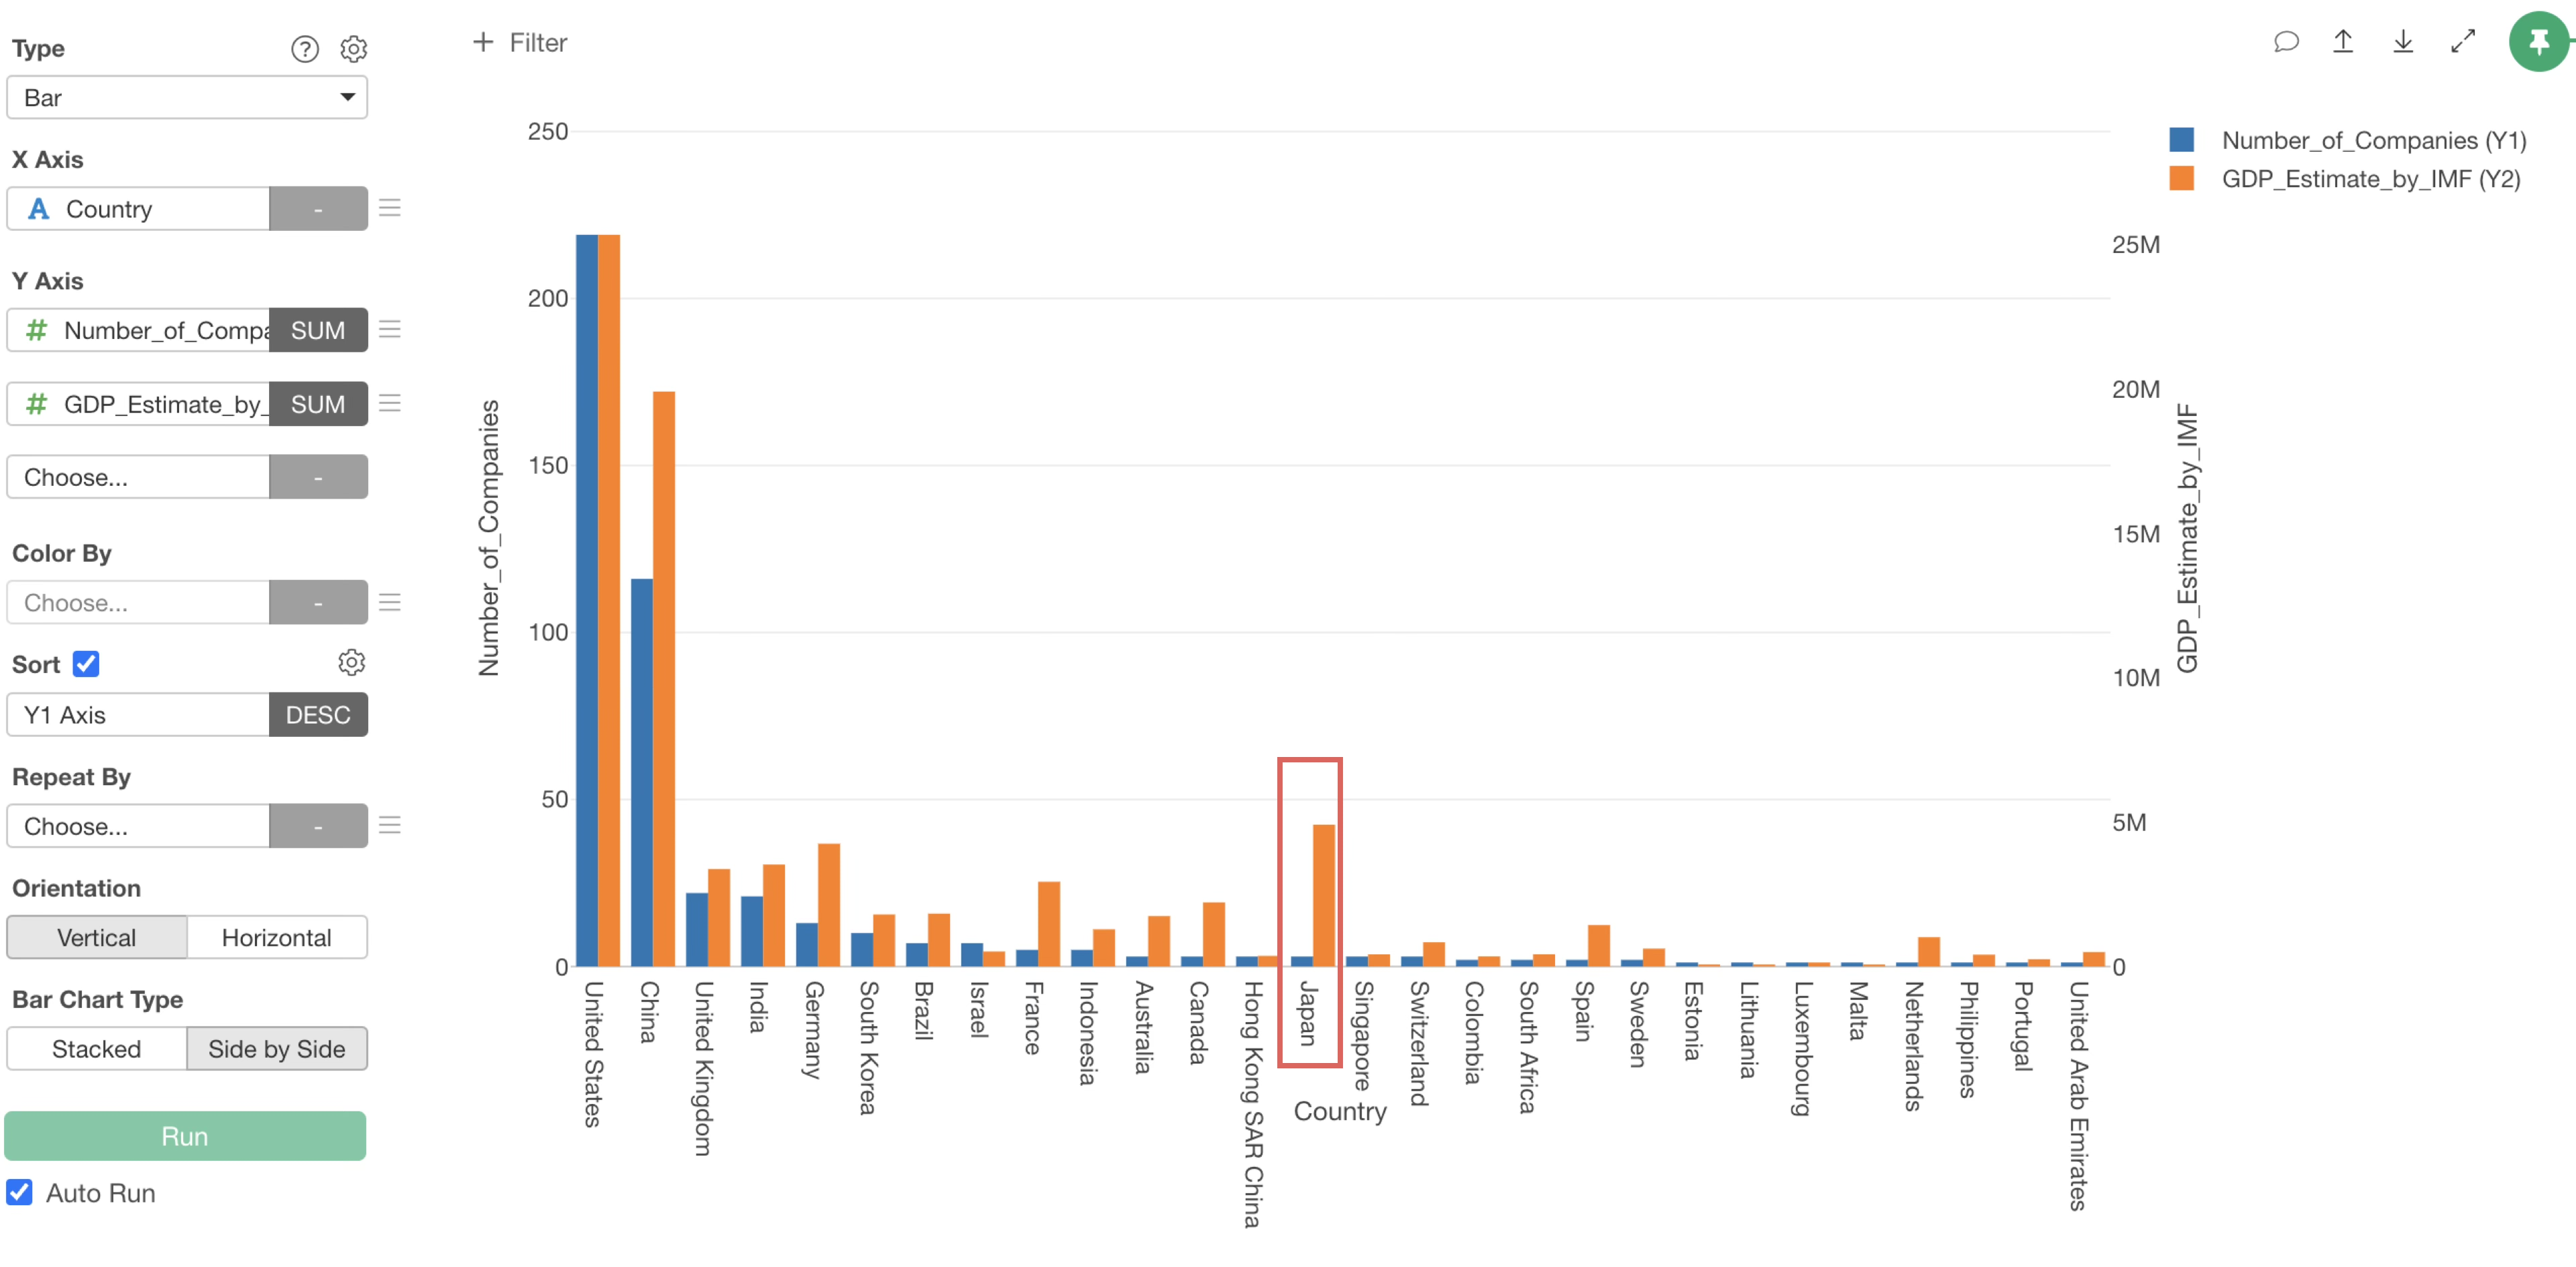
On the other hand, while Japan has a high GDP compared to other countries, it has only 3 unicorn companies. (Note that we are using 2020’s data)
5. Create a Branch
By aggregating the data, we have transformed it from one row per company to one row per country. However, there are times when we want to perform other data wrangling tasks using the one-row-per-company data.
This is where the “Branch” feature comes in handy, allowing you to create a derived data frame from the main data frame.
Furthermore, multiple branches can be created from any step.
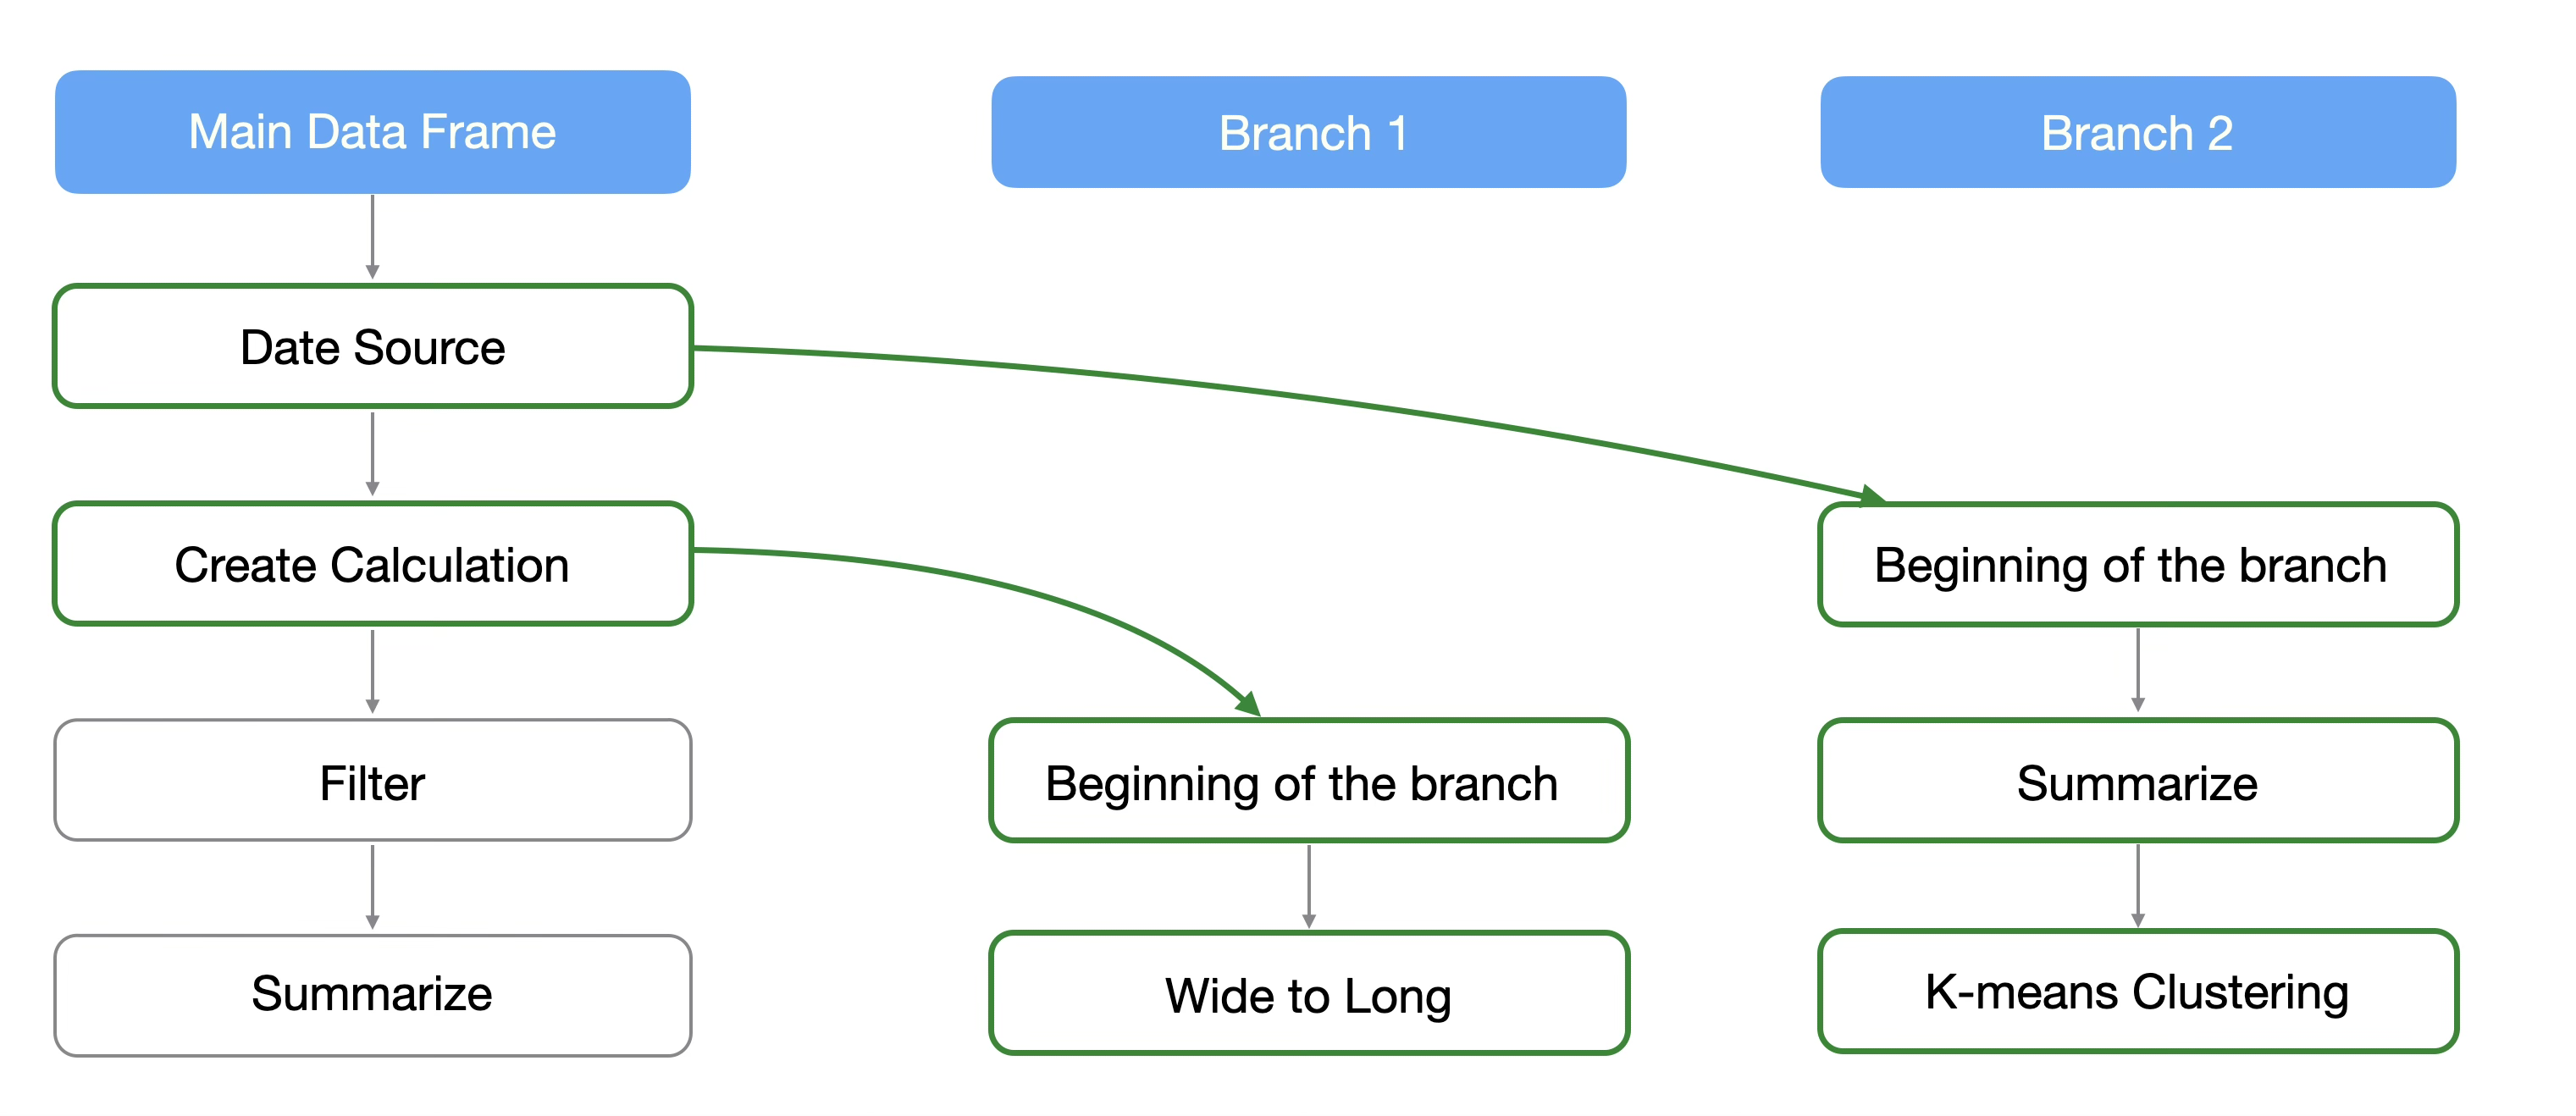
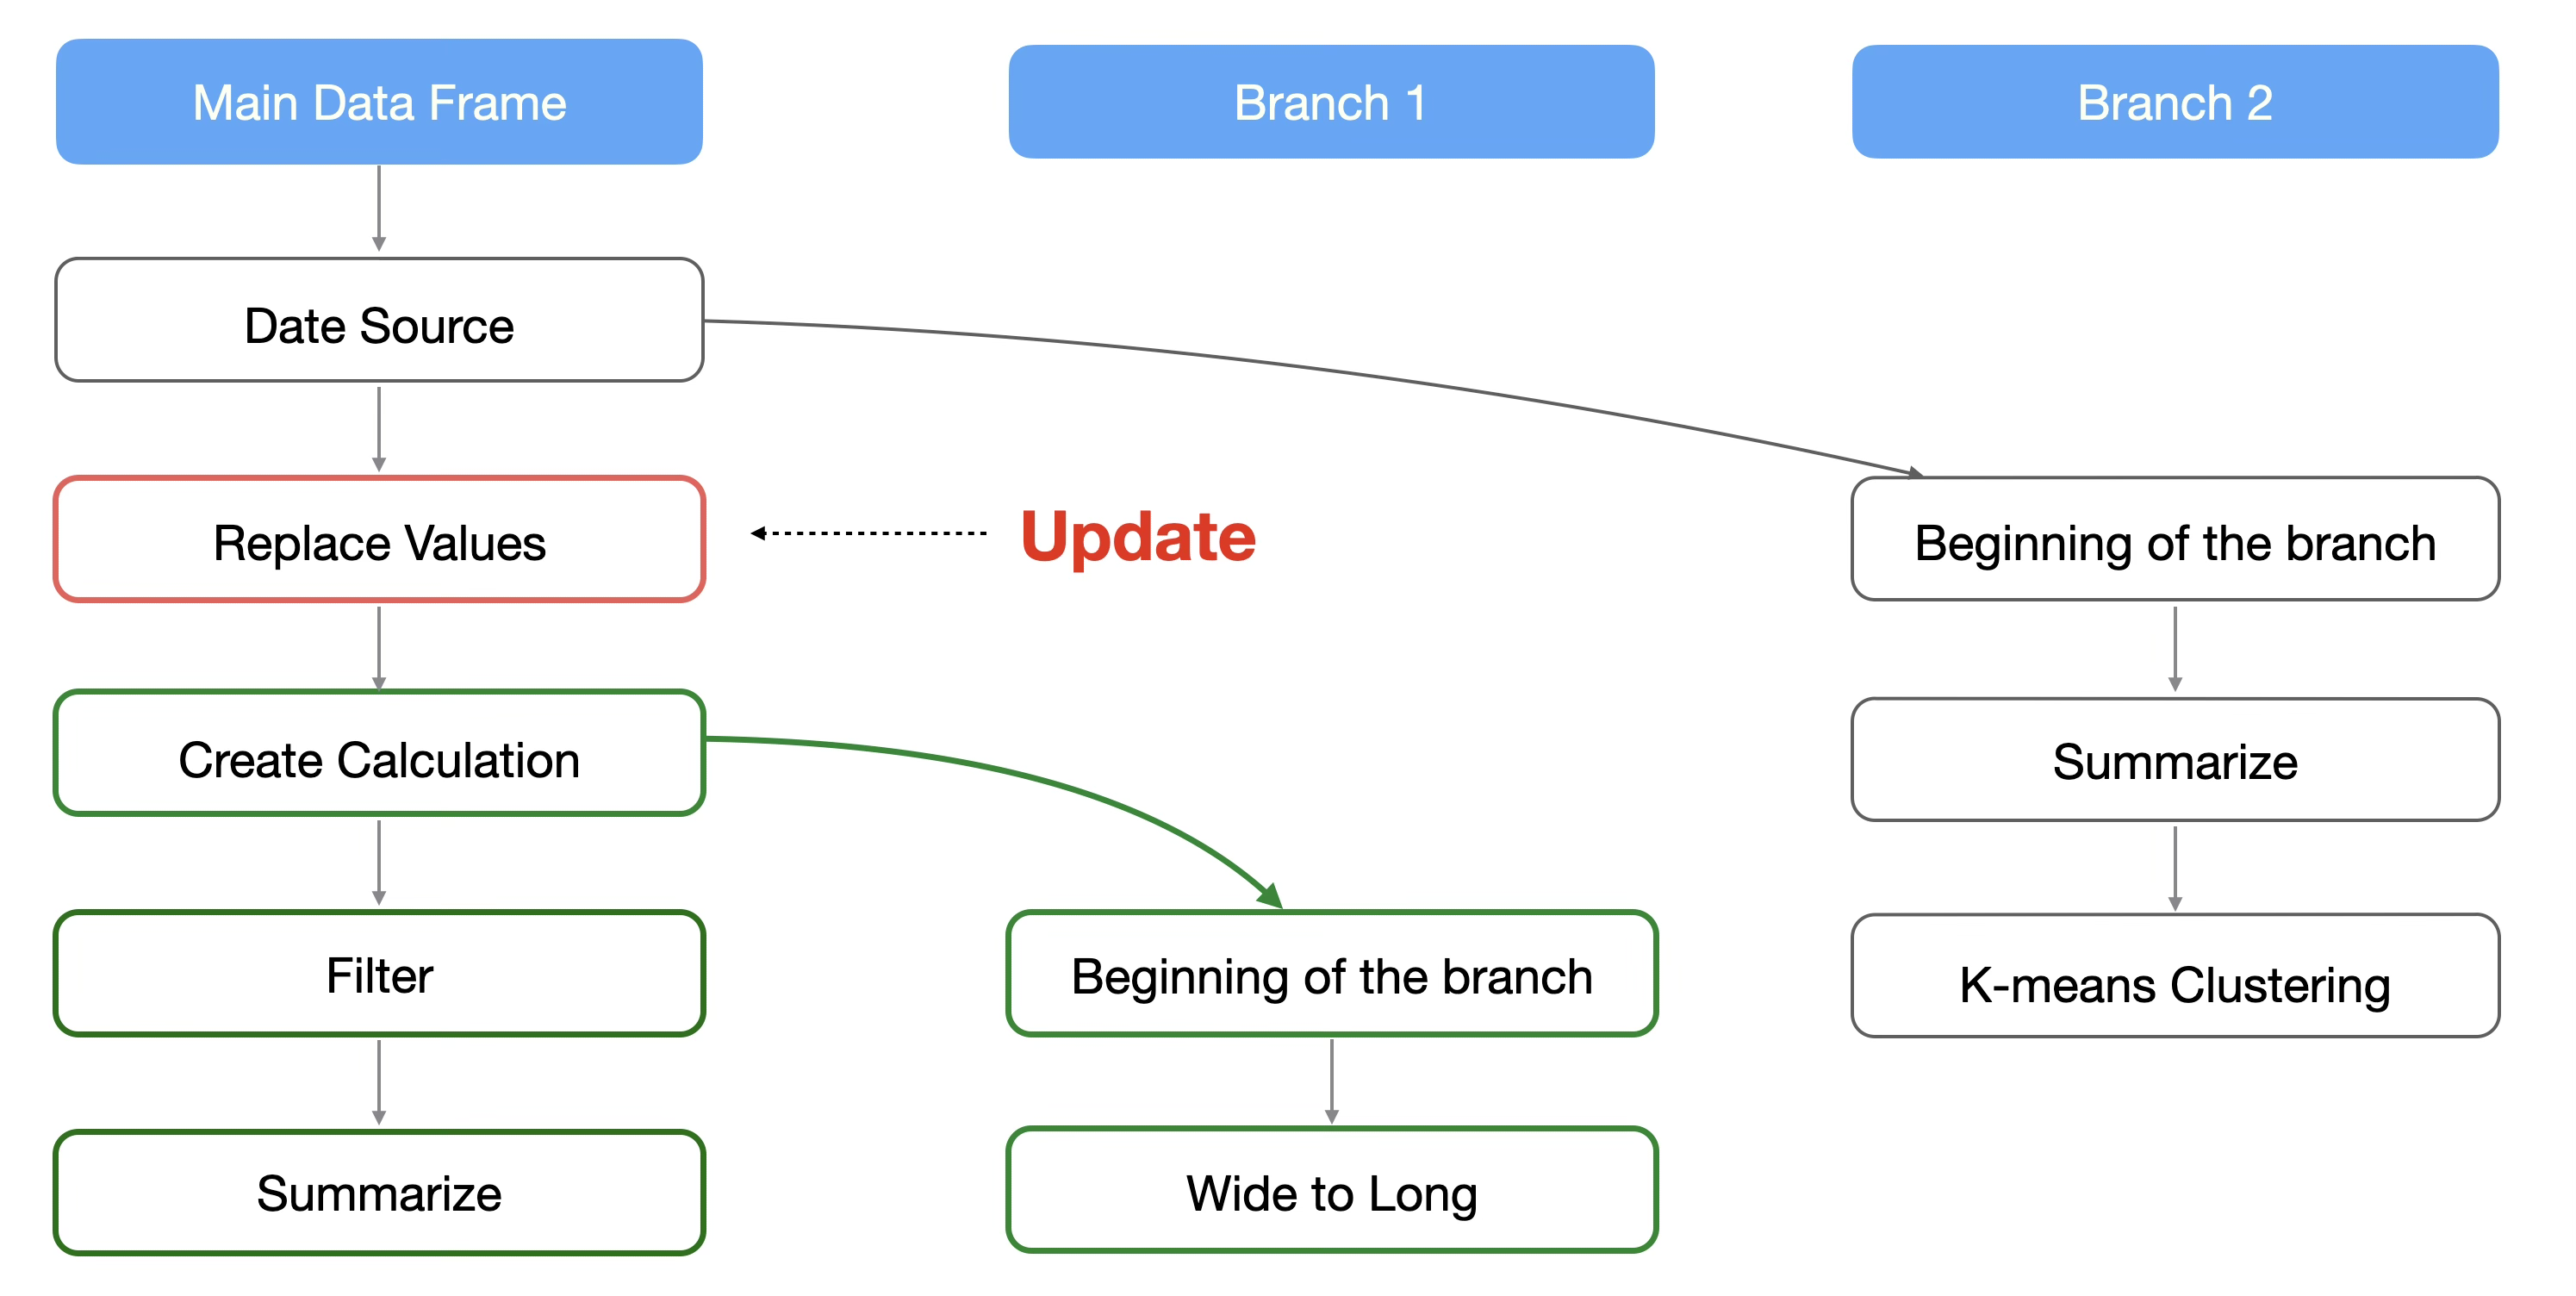
If you update or change a step prior to where a branch was created, only the downstream steps will be updated.
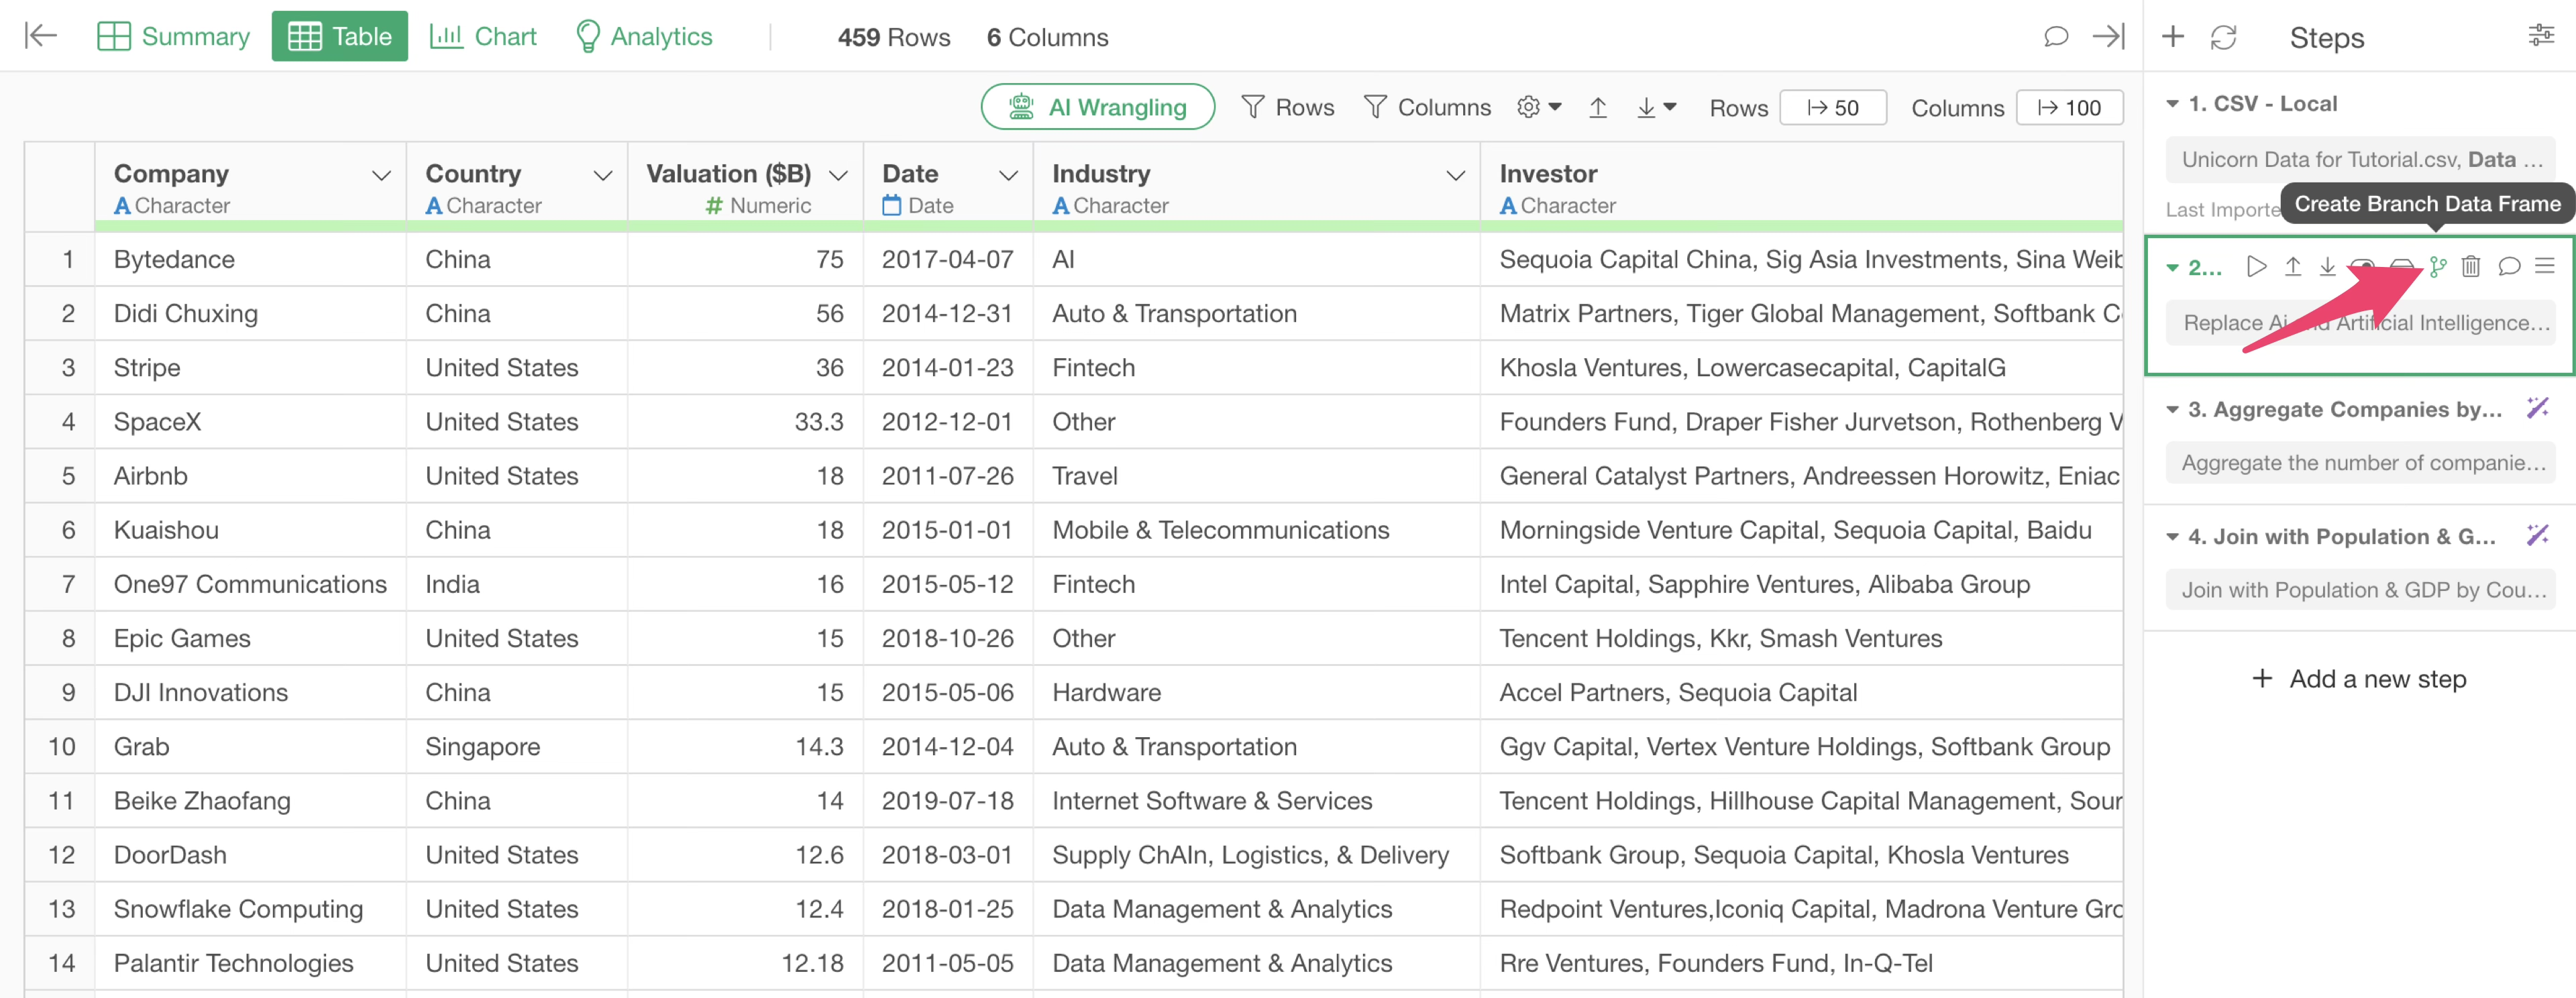
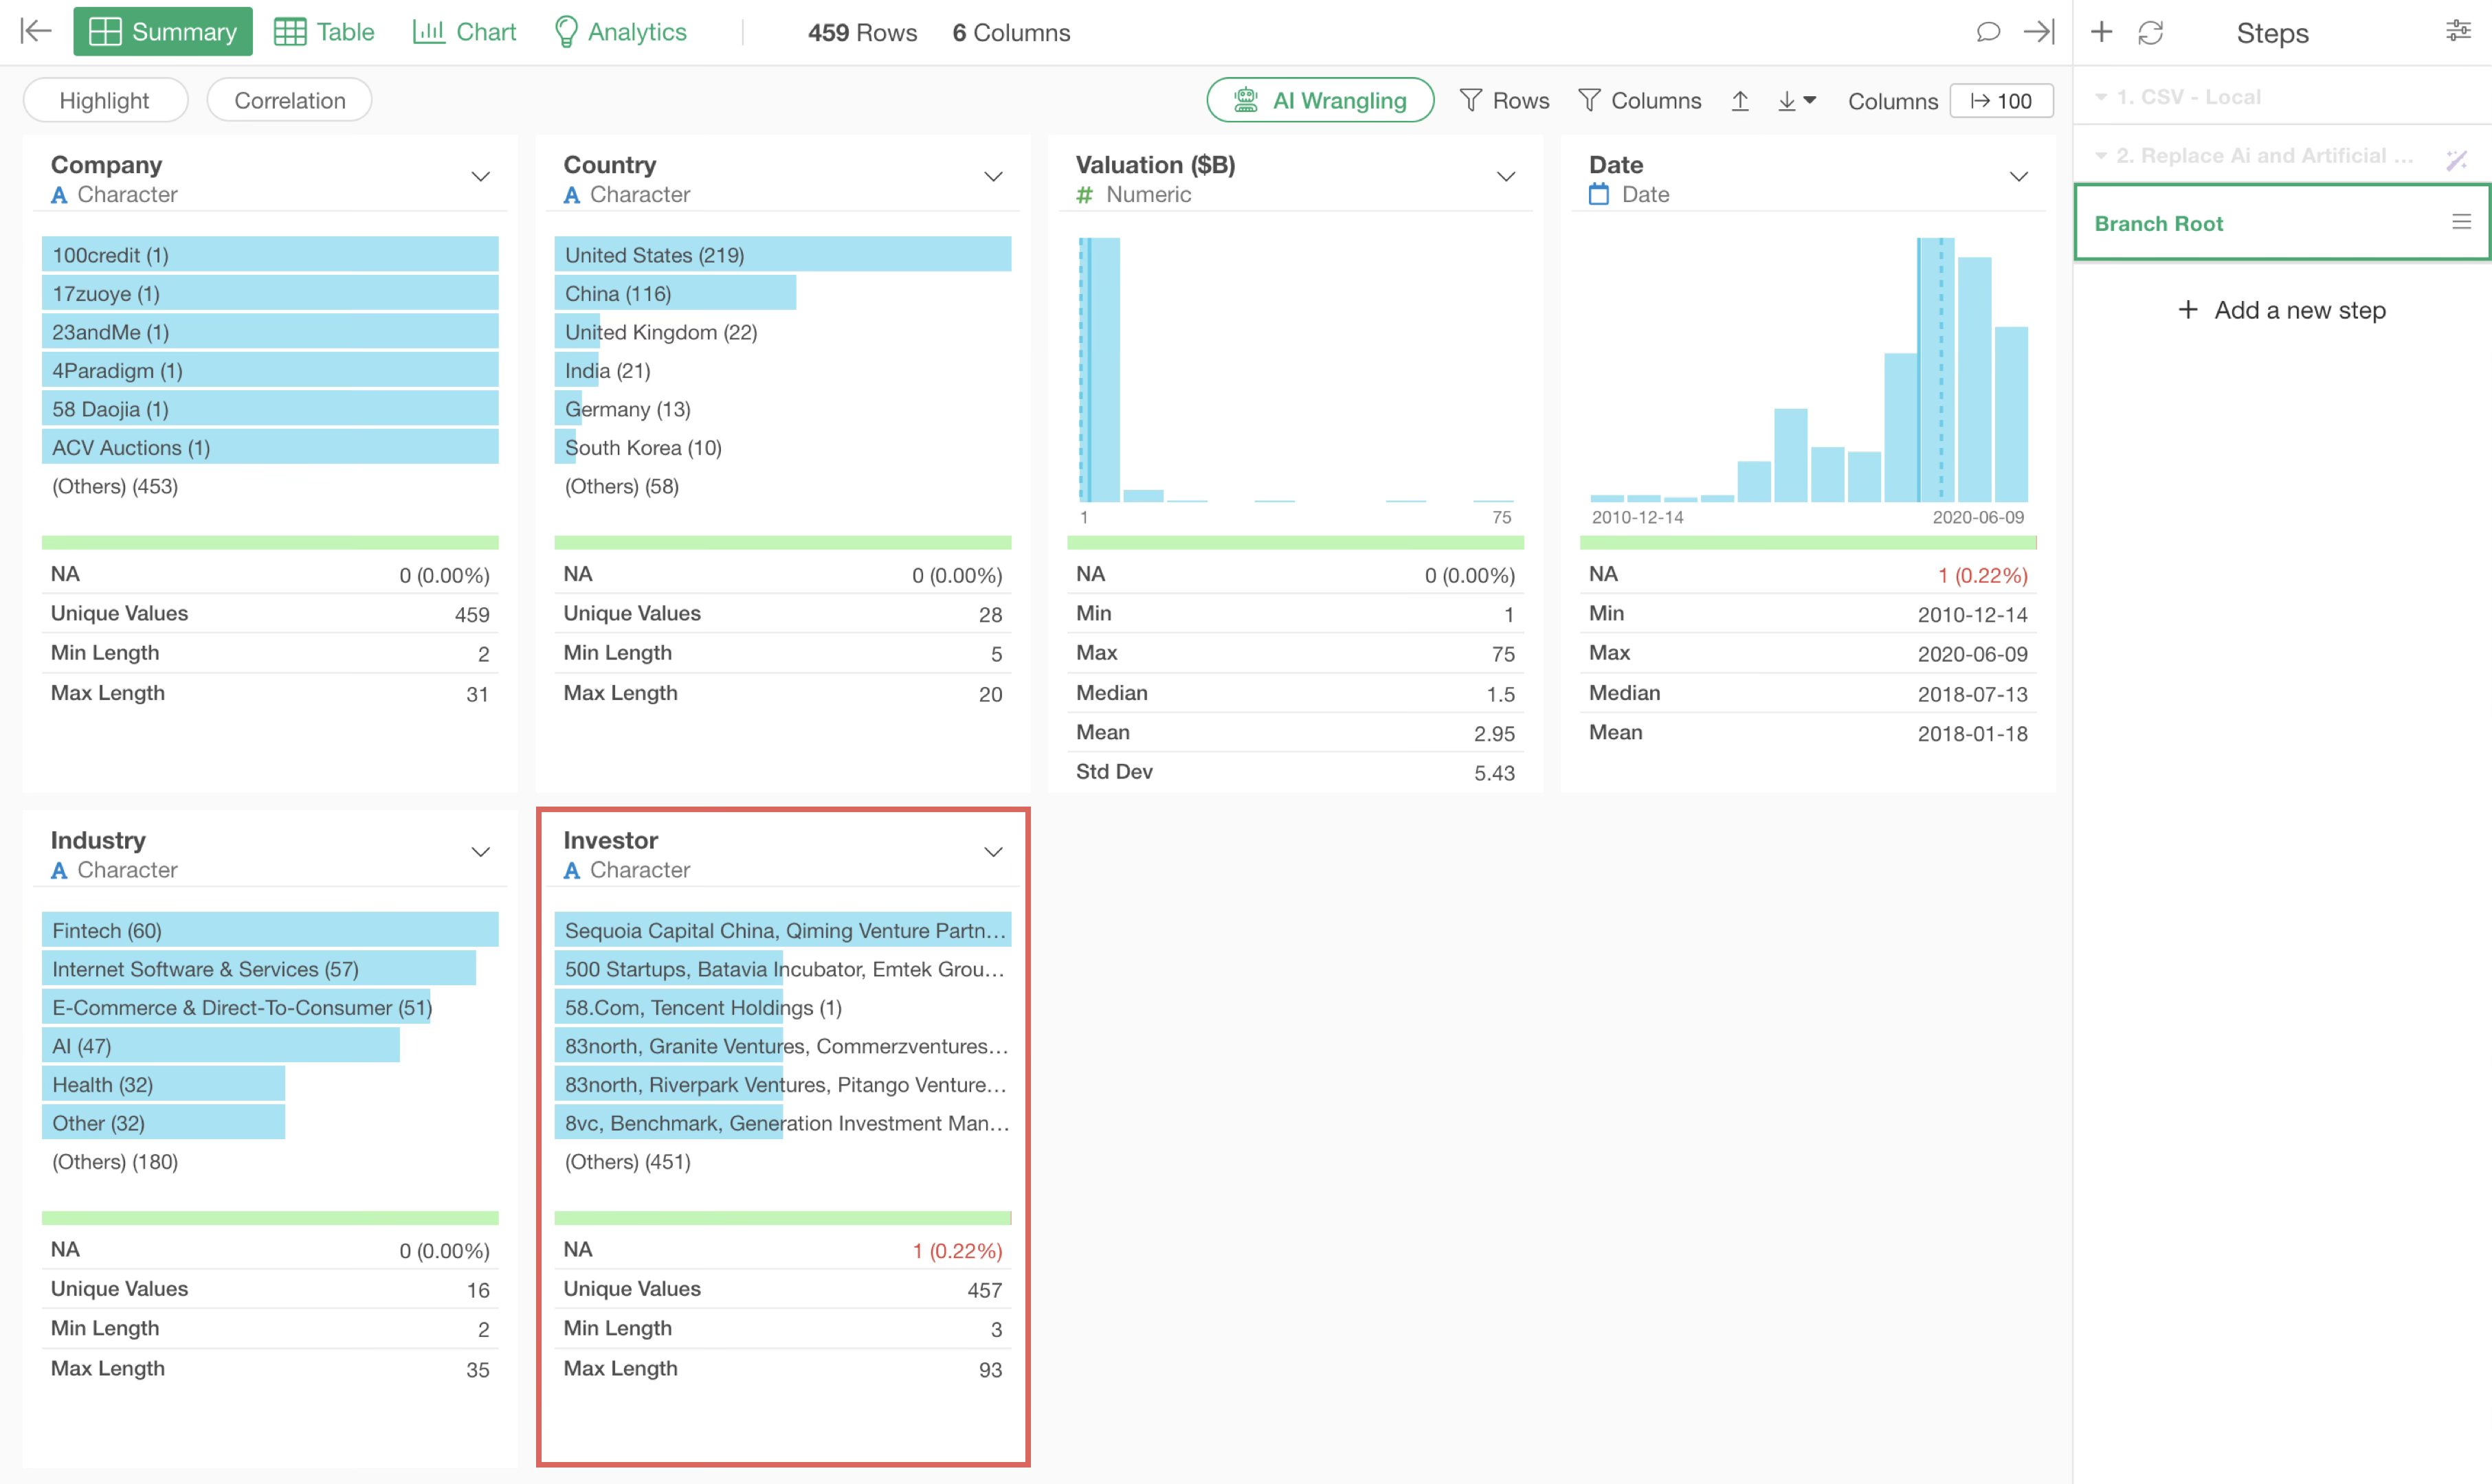
To create a branch from the one-row-per-company data, select the second step, which is before the aggregation.
From the second step, click the “Create Branch” button.
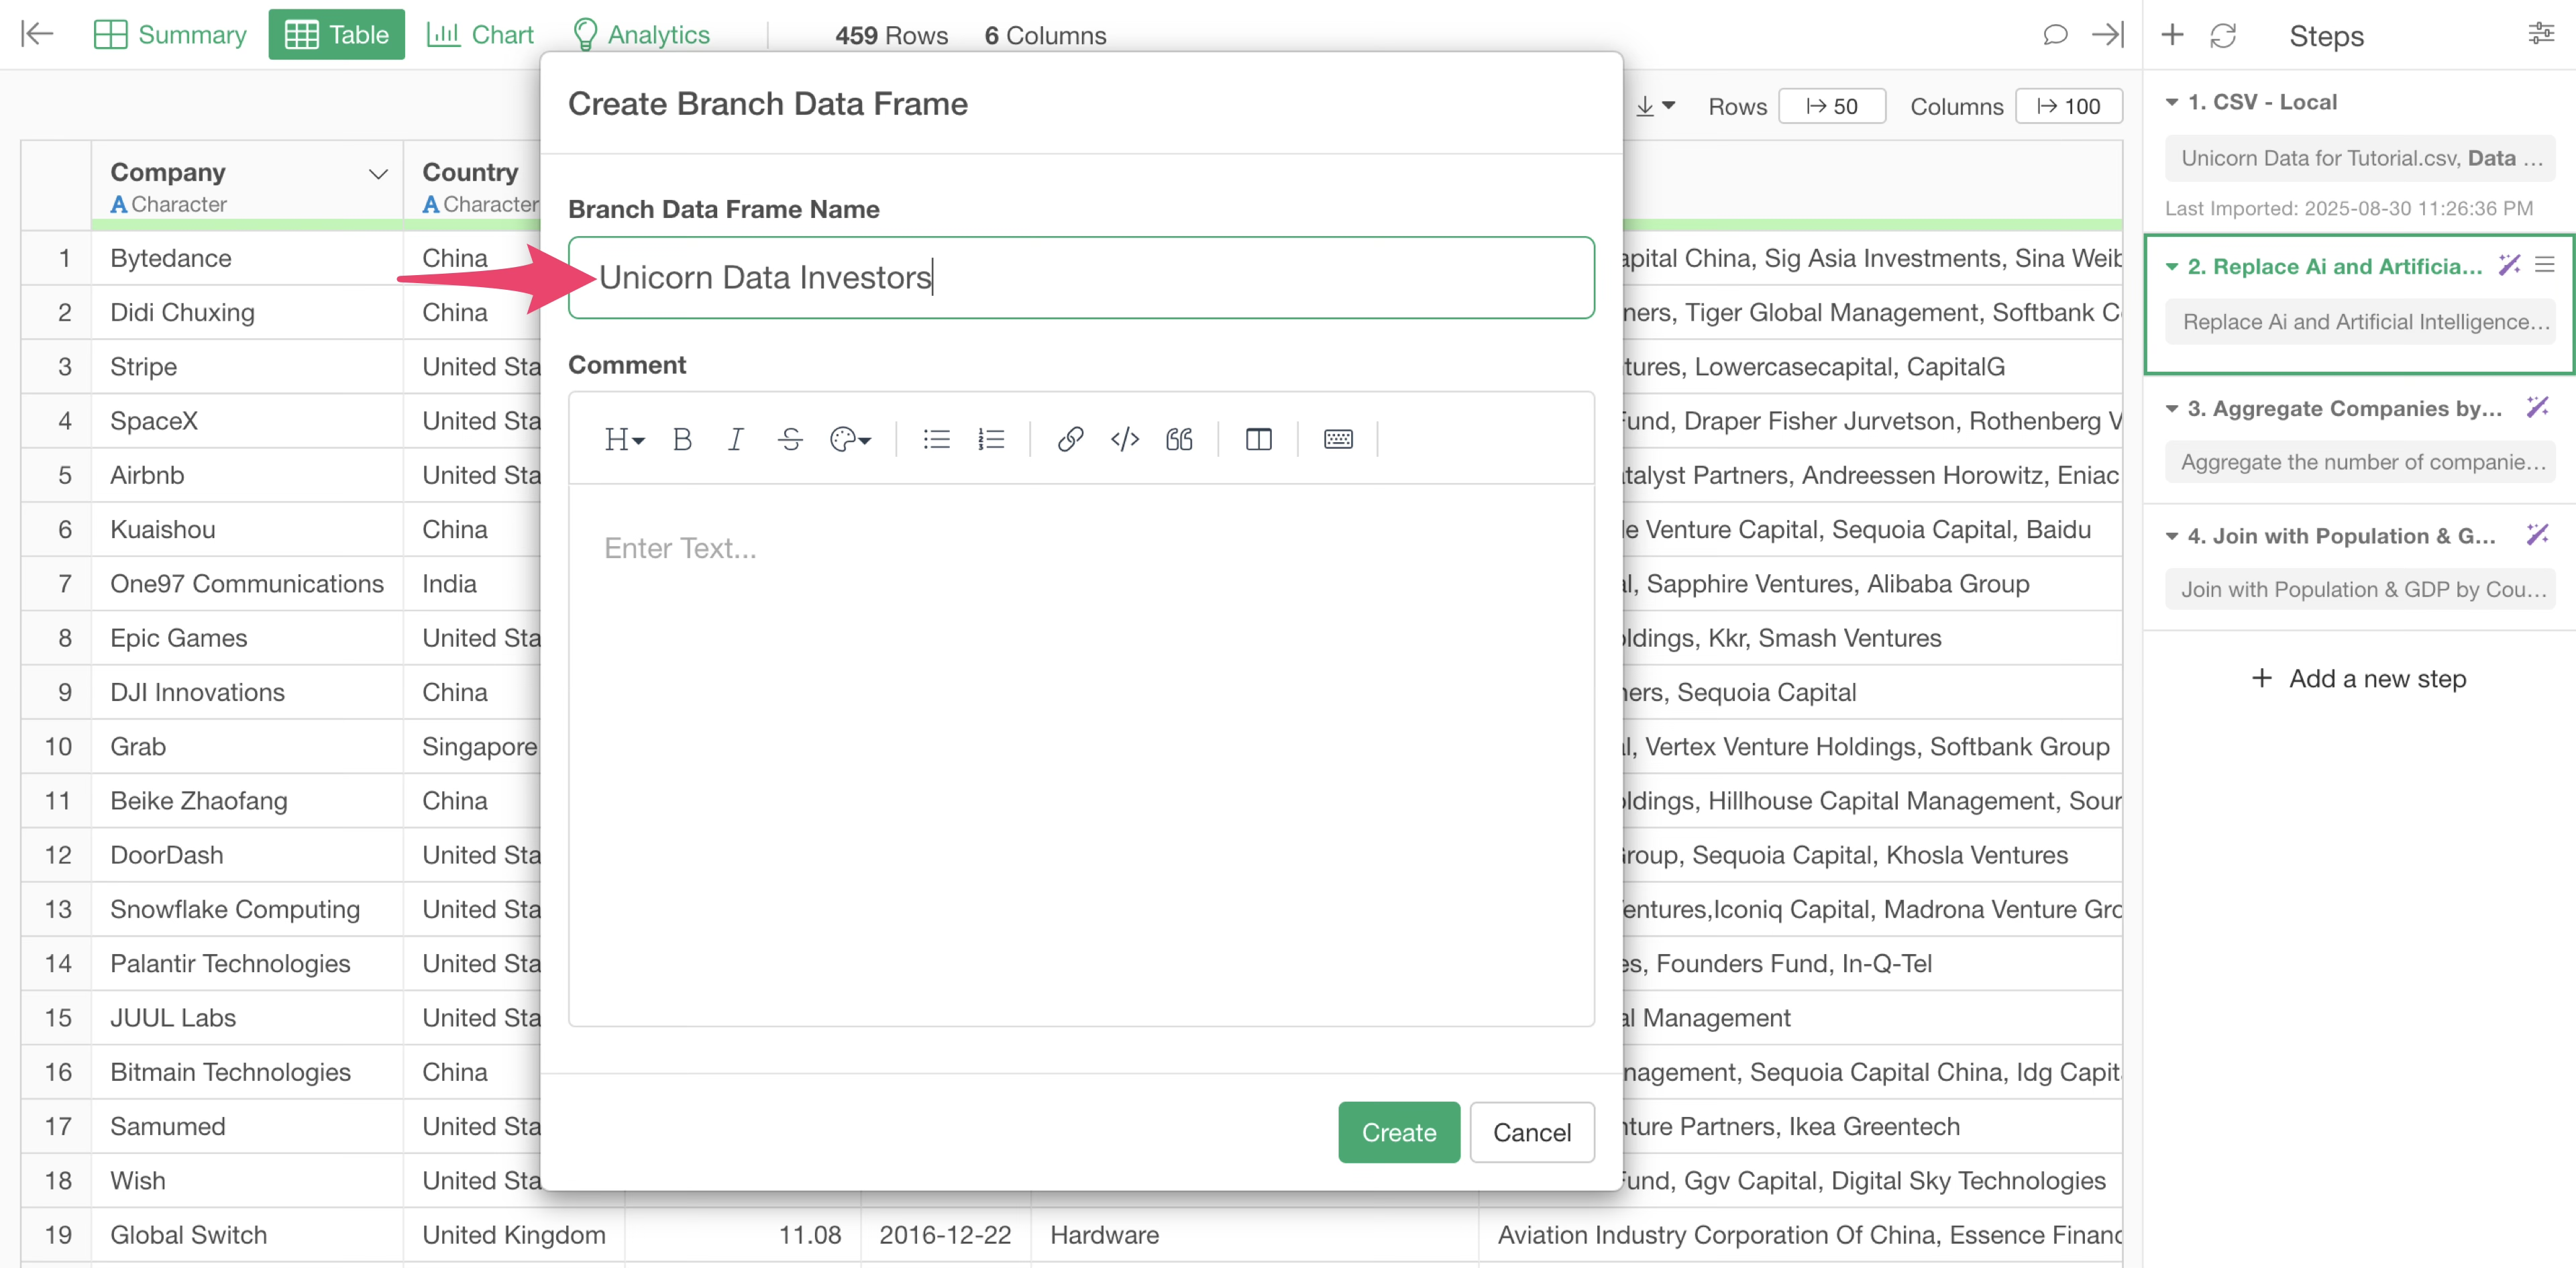
Set the branch name and click the “Create” button.
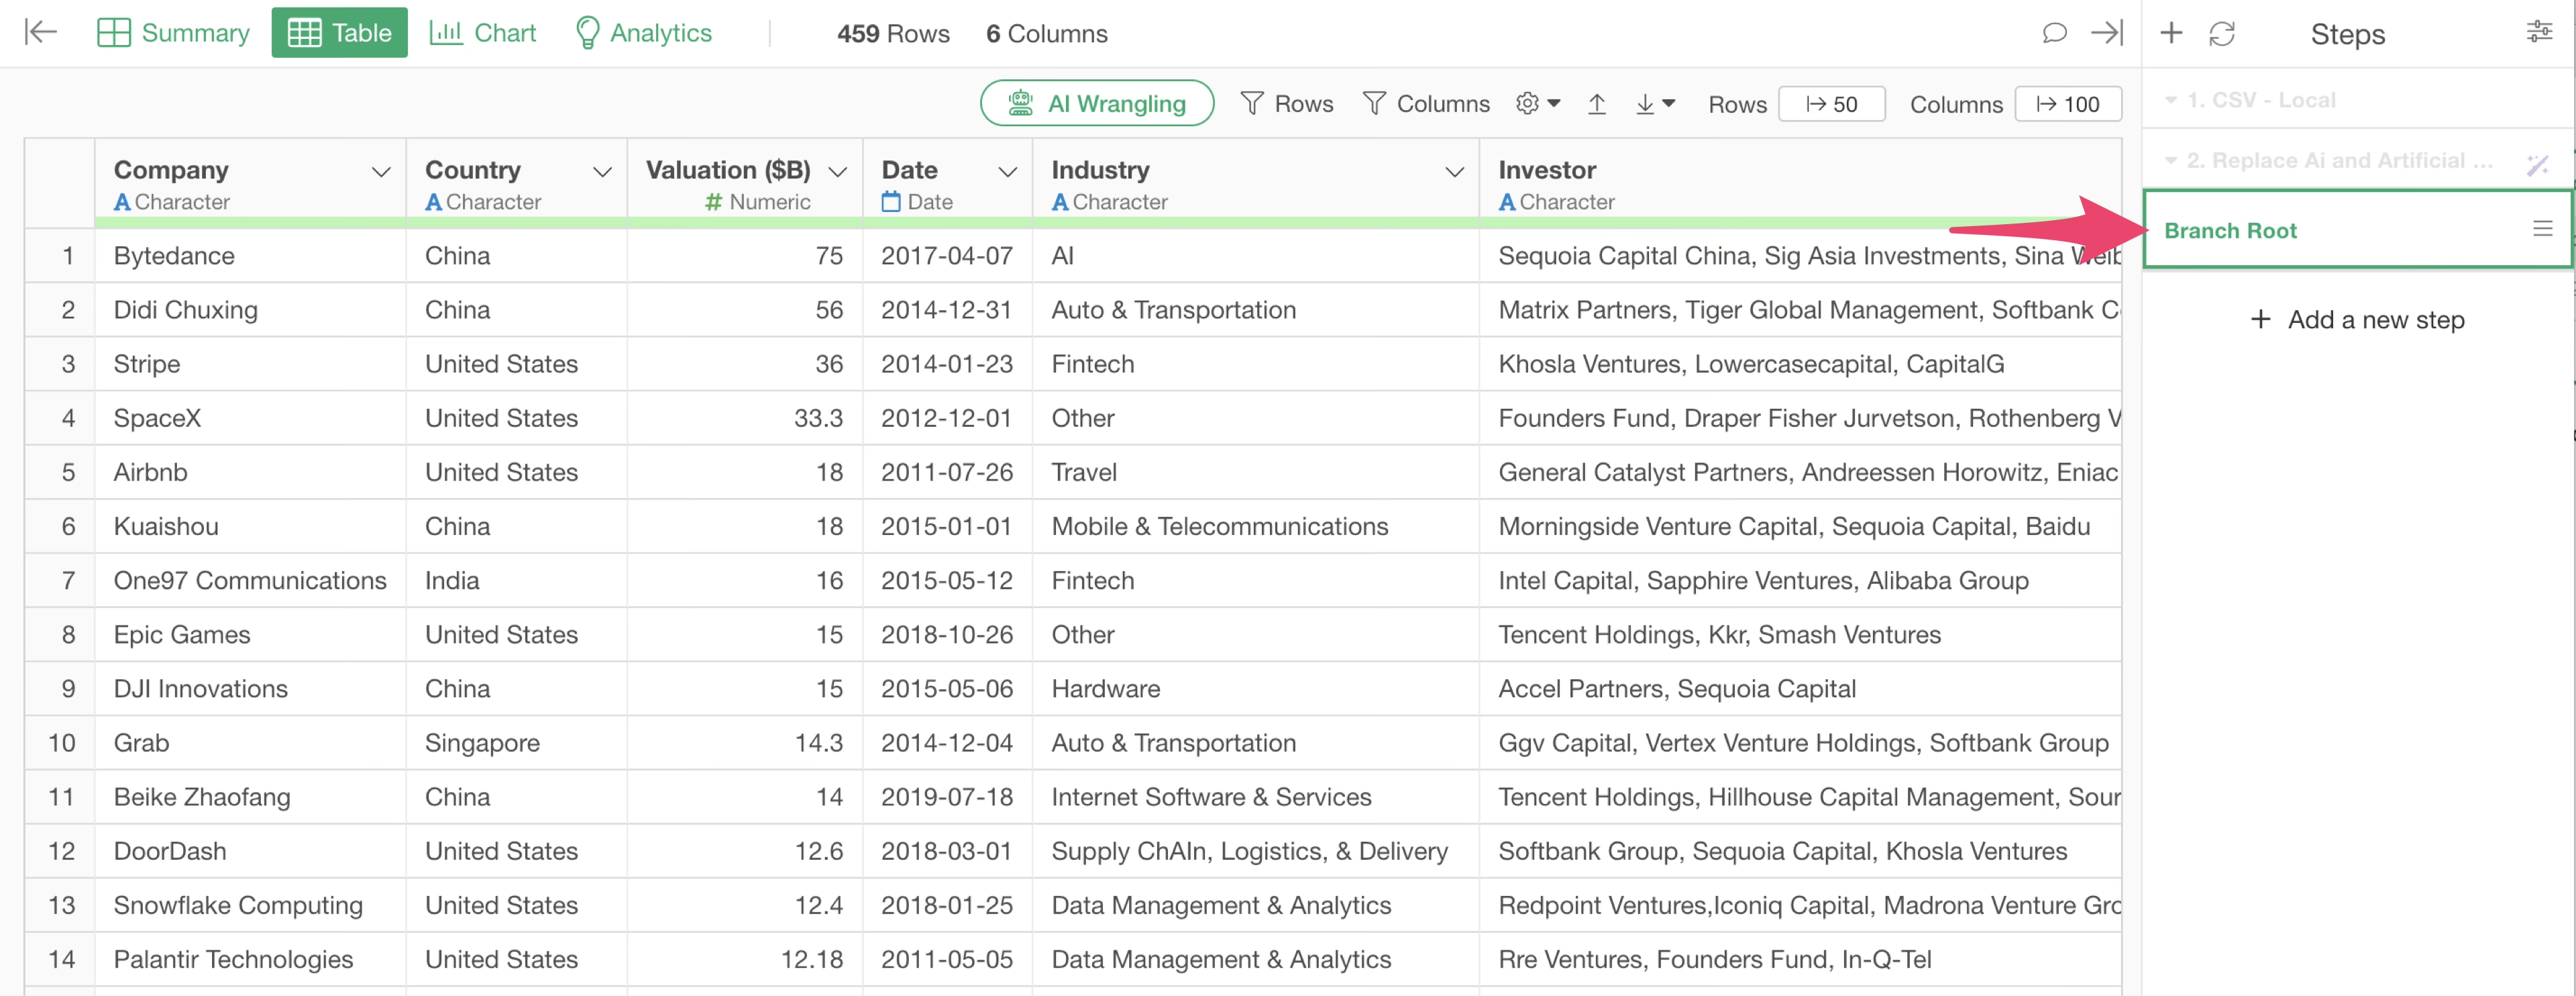
We have successfully created a “branch” data frame derived from the main data frame.
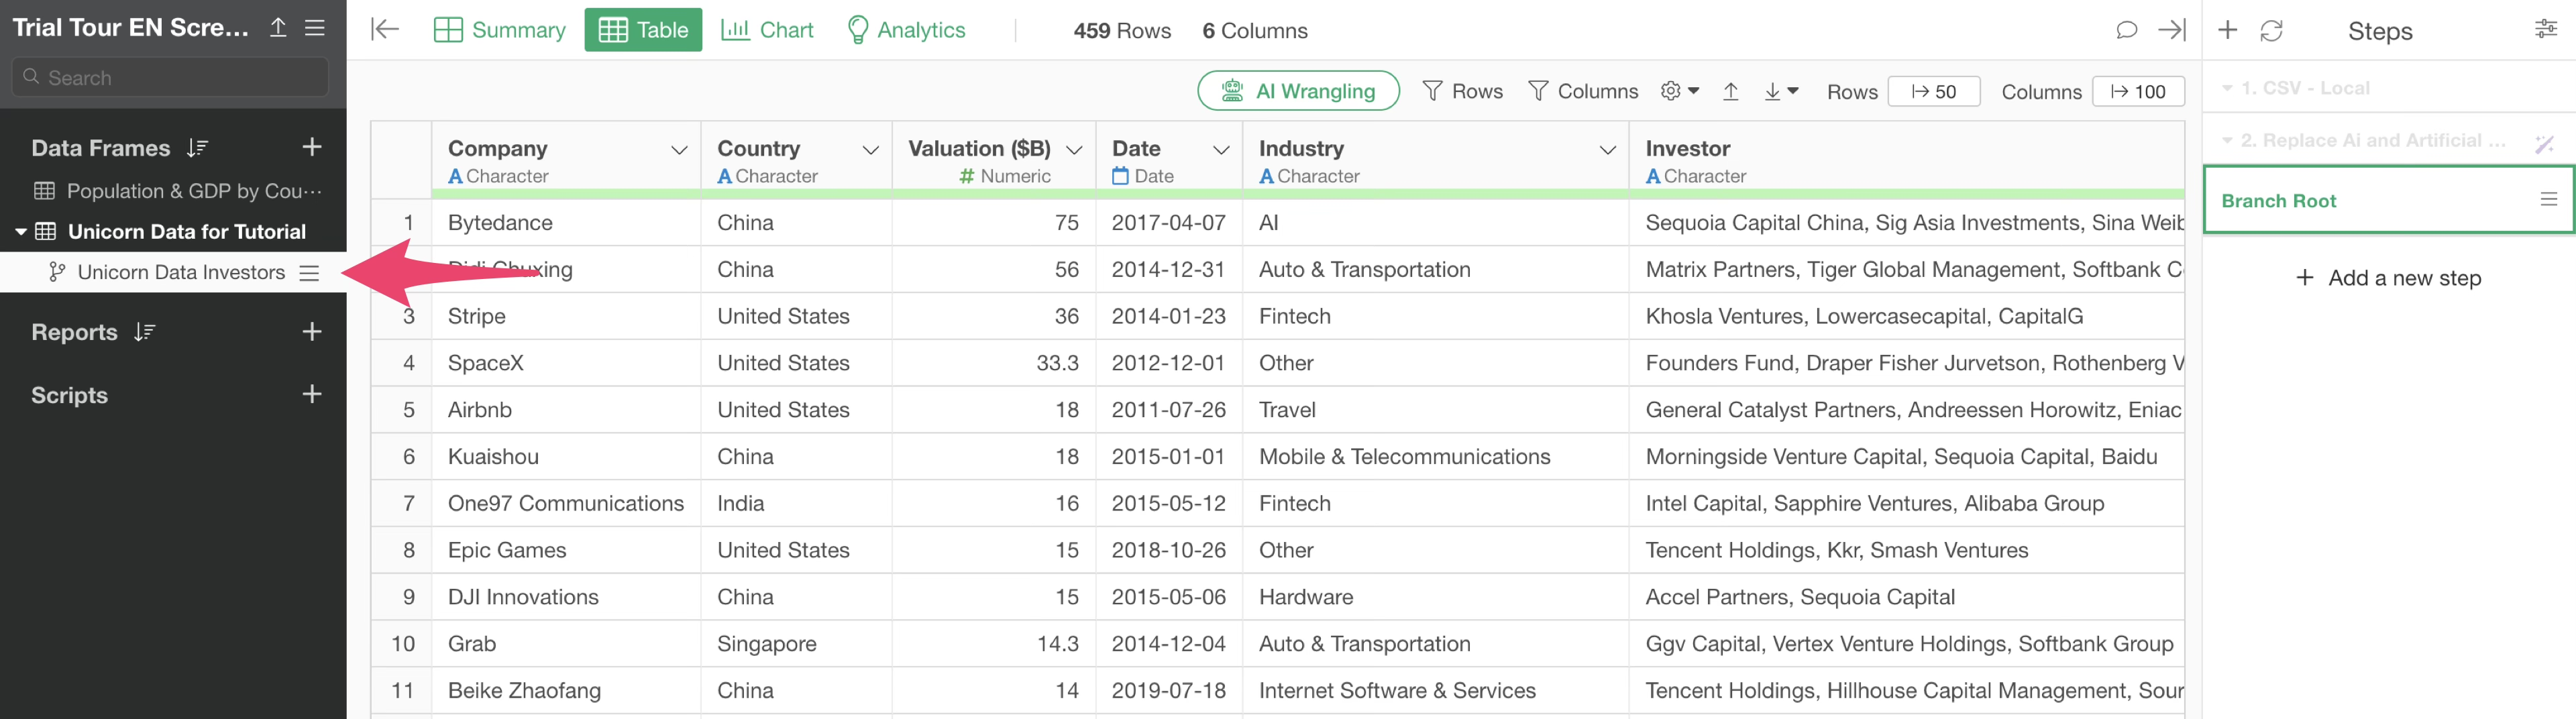
Since the branch was created from the second step, it reflects the processing up to the second step.
6. Split Values into Multiple Rows
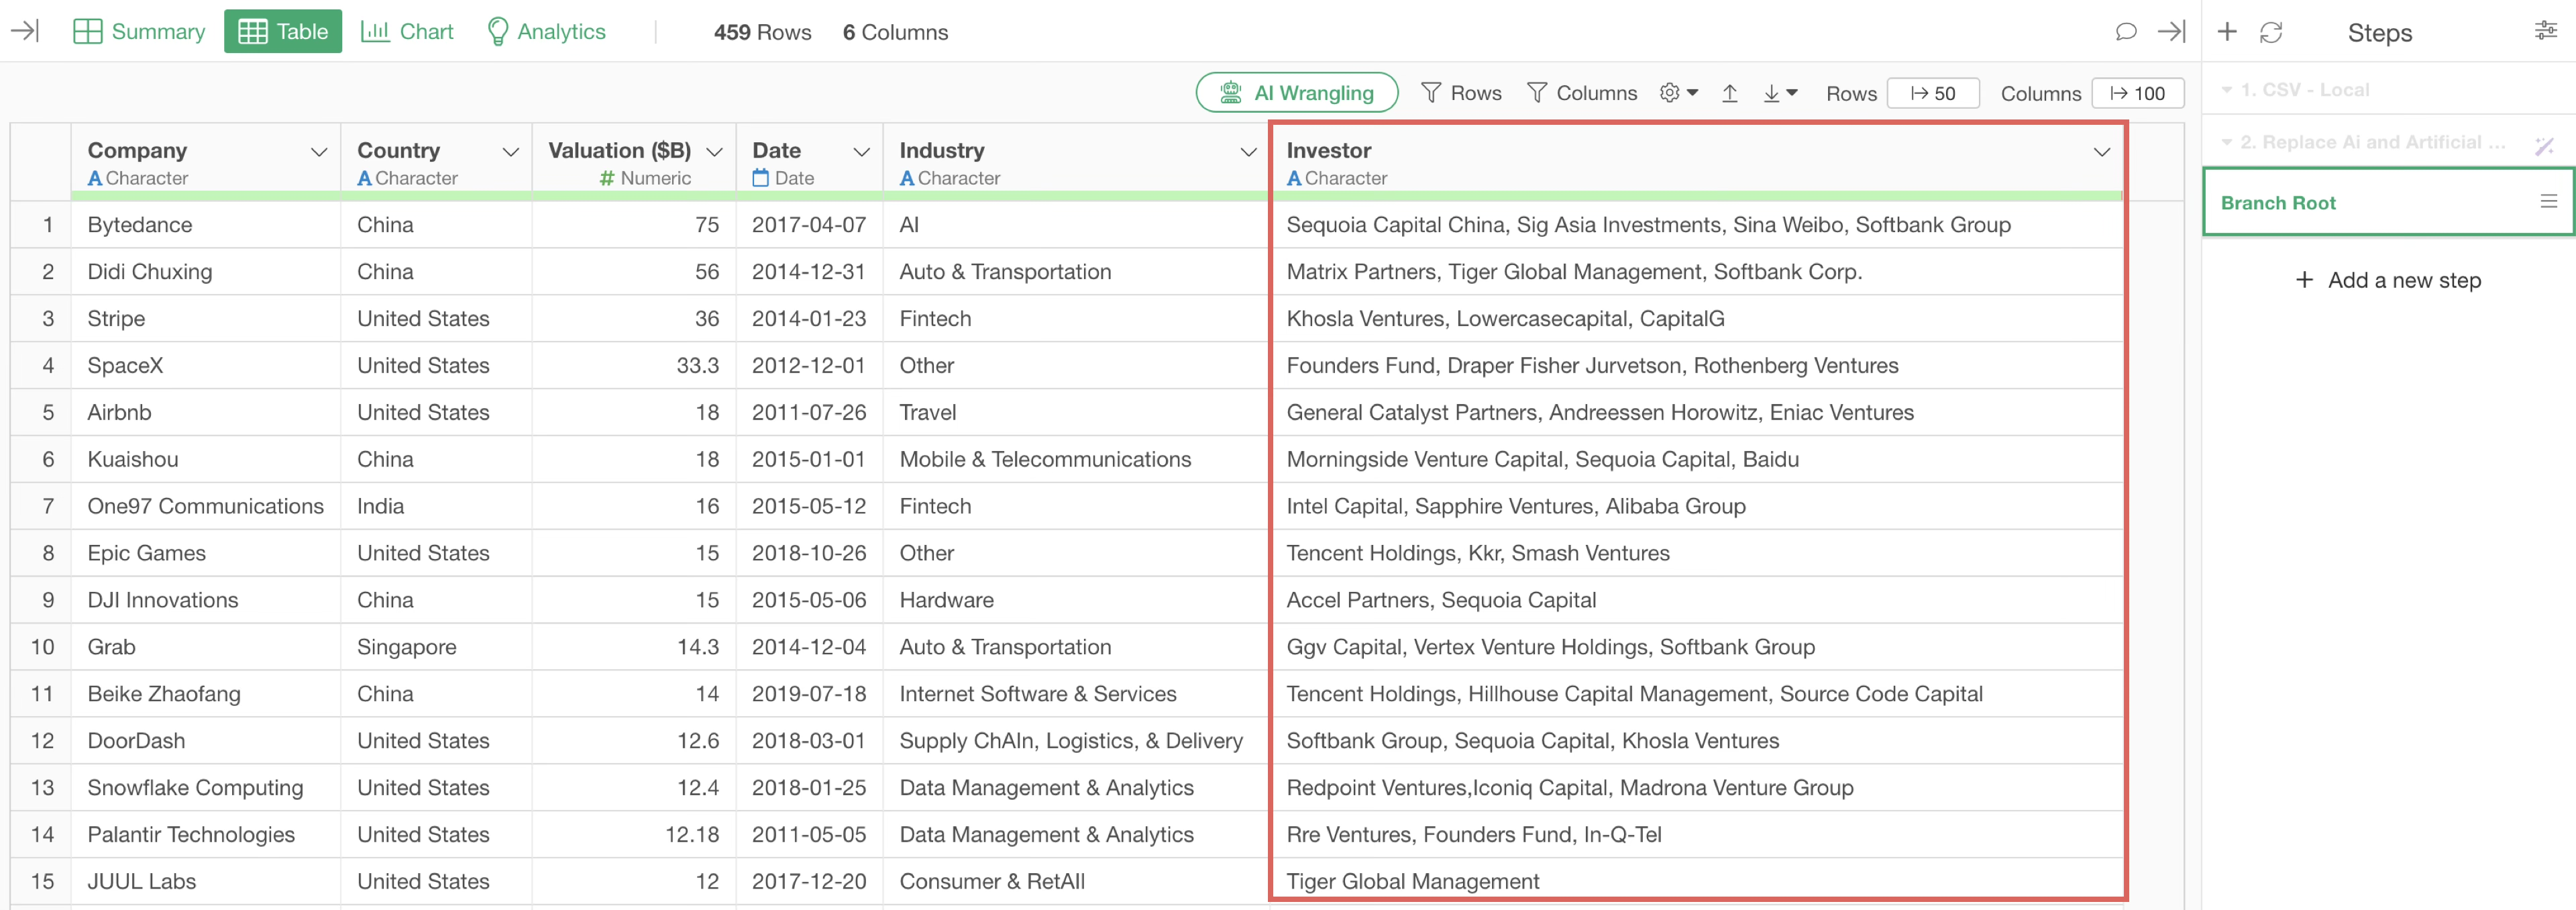
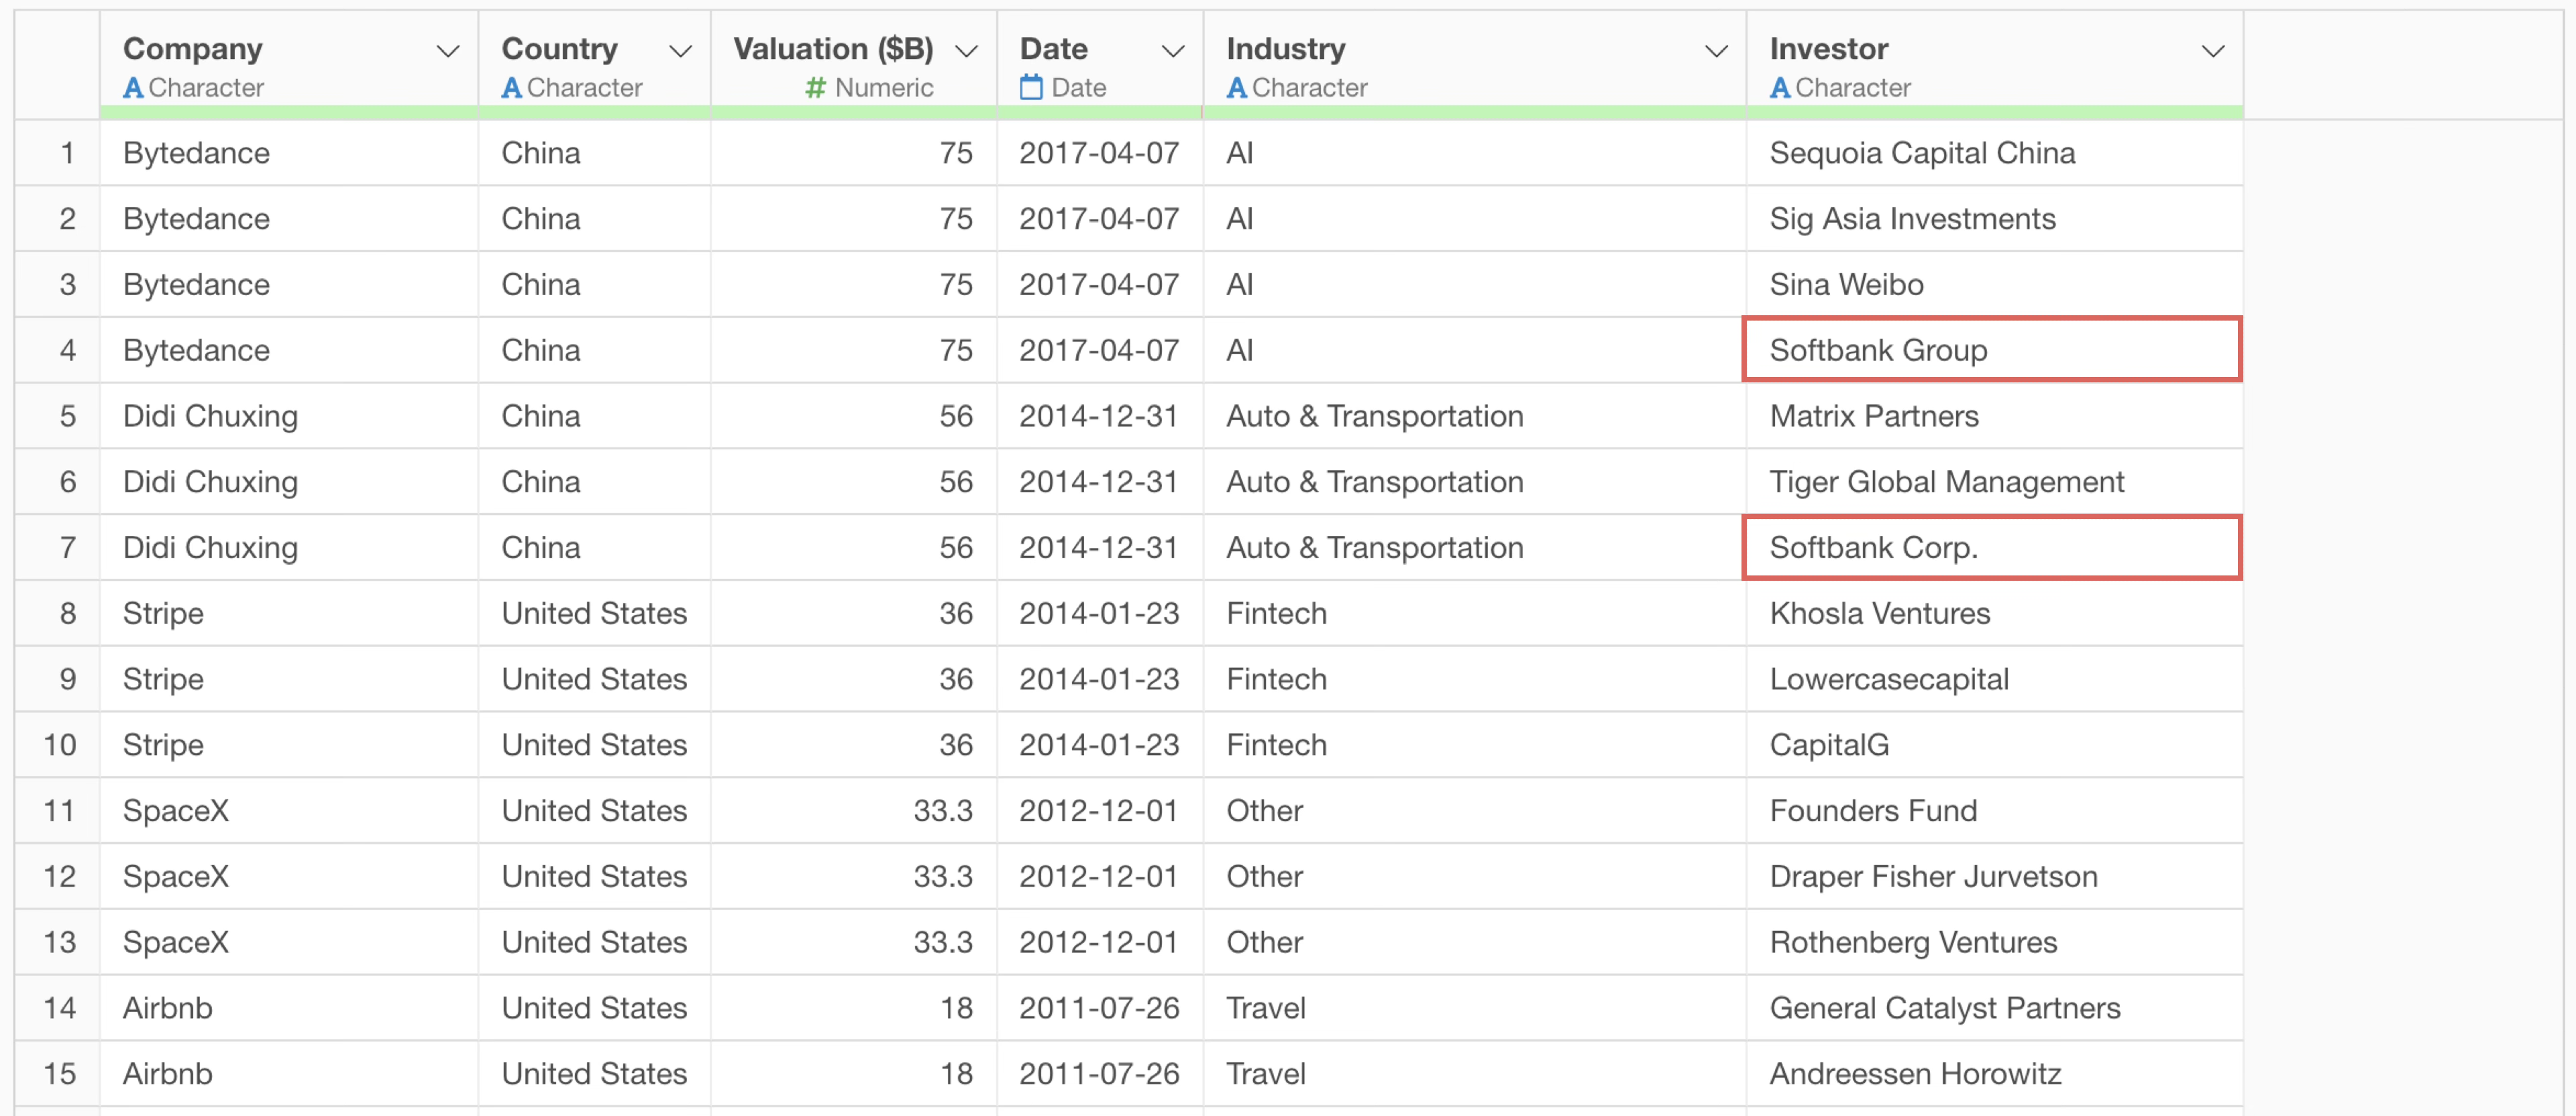
If multiple investors have invested in a company, the “Investors” column will display the names of multiple investors separated by commas.
If you want to aggregate or visualize data at the company level, as it is currently with one row per company, there is no problem.
However, if you try to aggregate or visualize by “investor,” it will not work well. This is because each row does not represent a single investor, making it impossible to count the number of specific investors.
Therefore, let’s split the investor values into multiple rows so that each row represents one investor.
Click the “AI Wrangling” button.
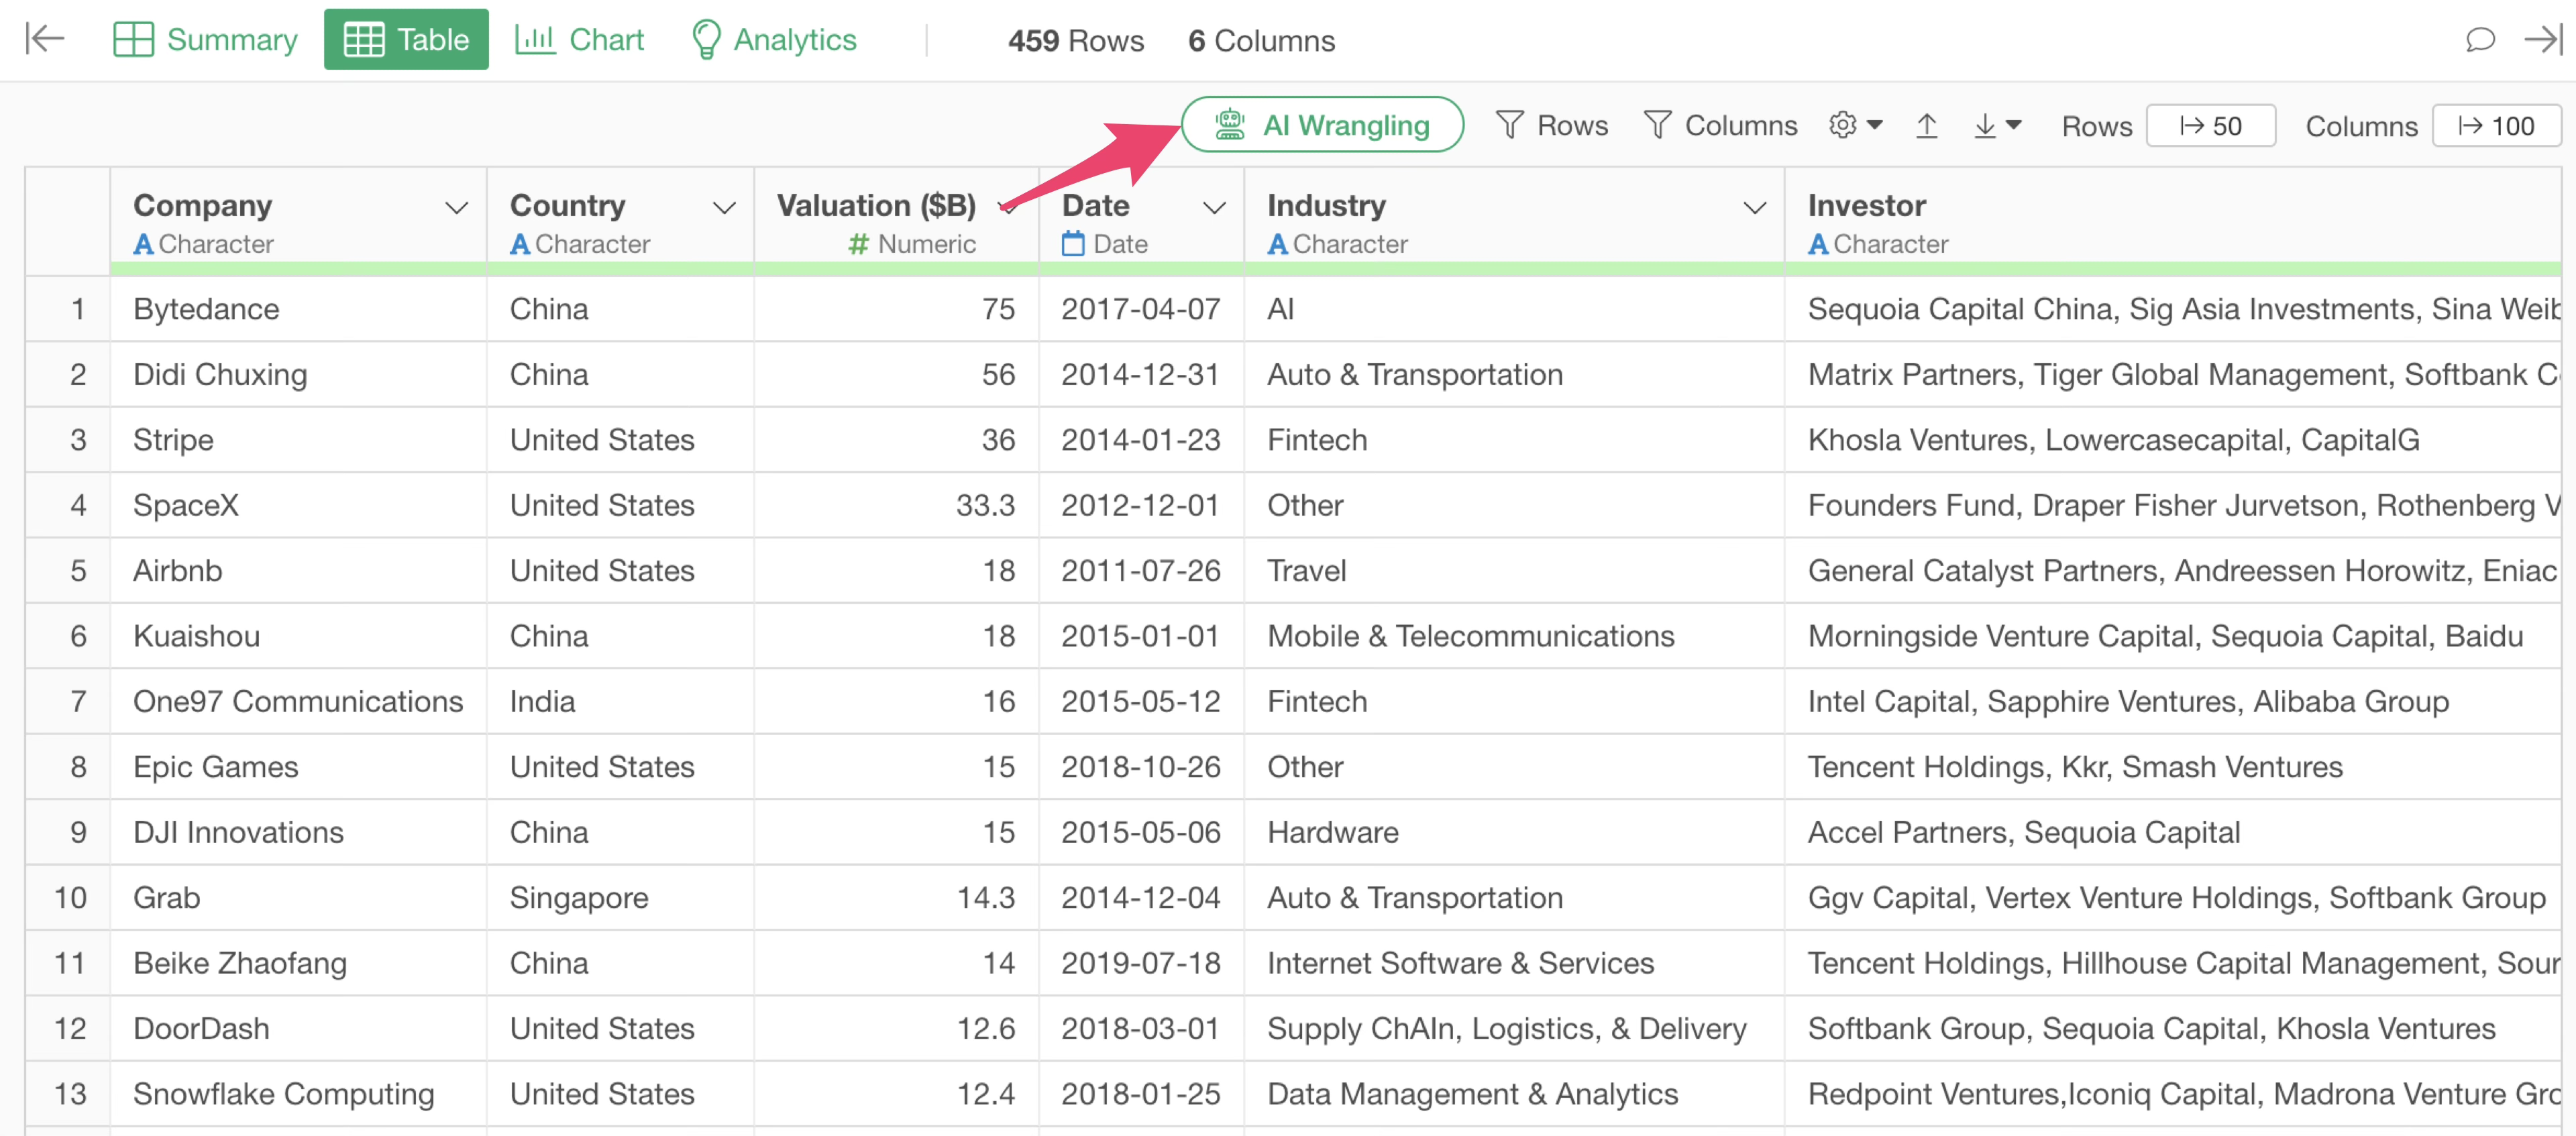
The AI Prompt dialog will appear. Enter the following prompt:
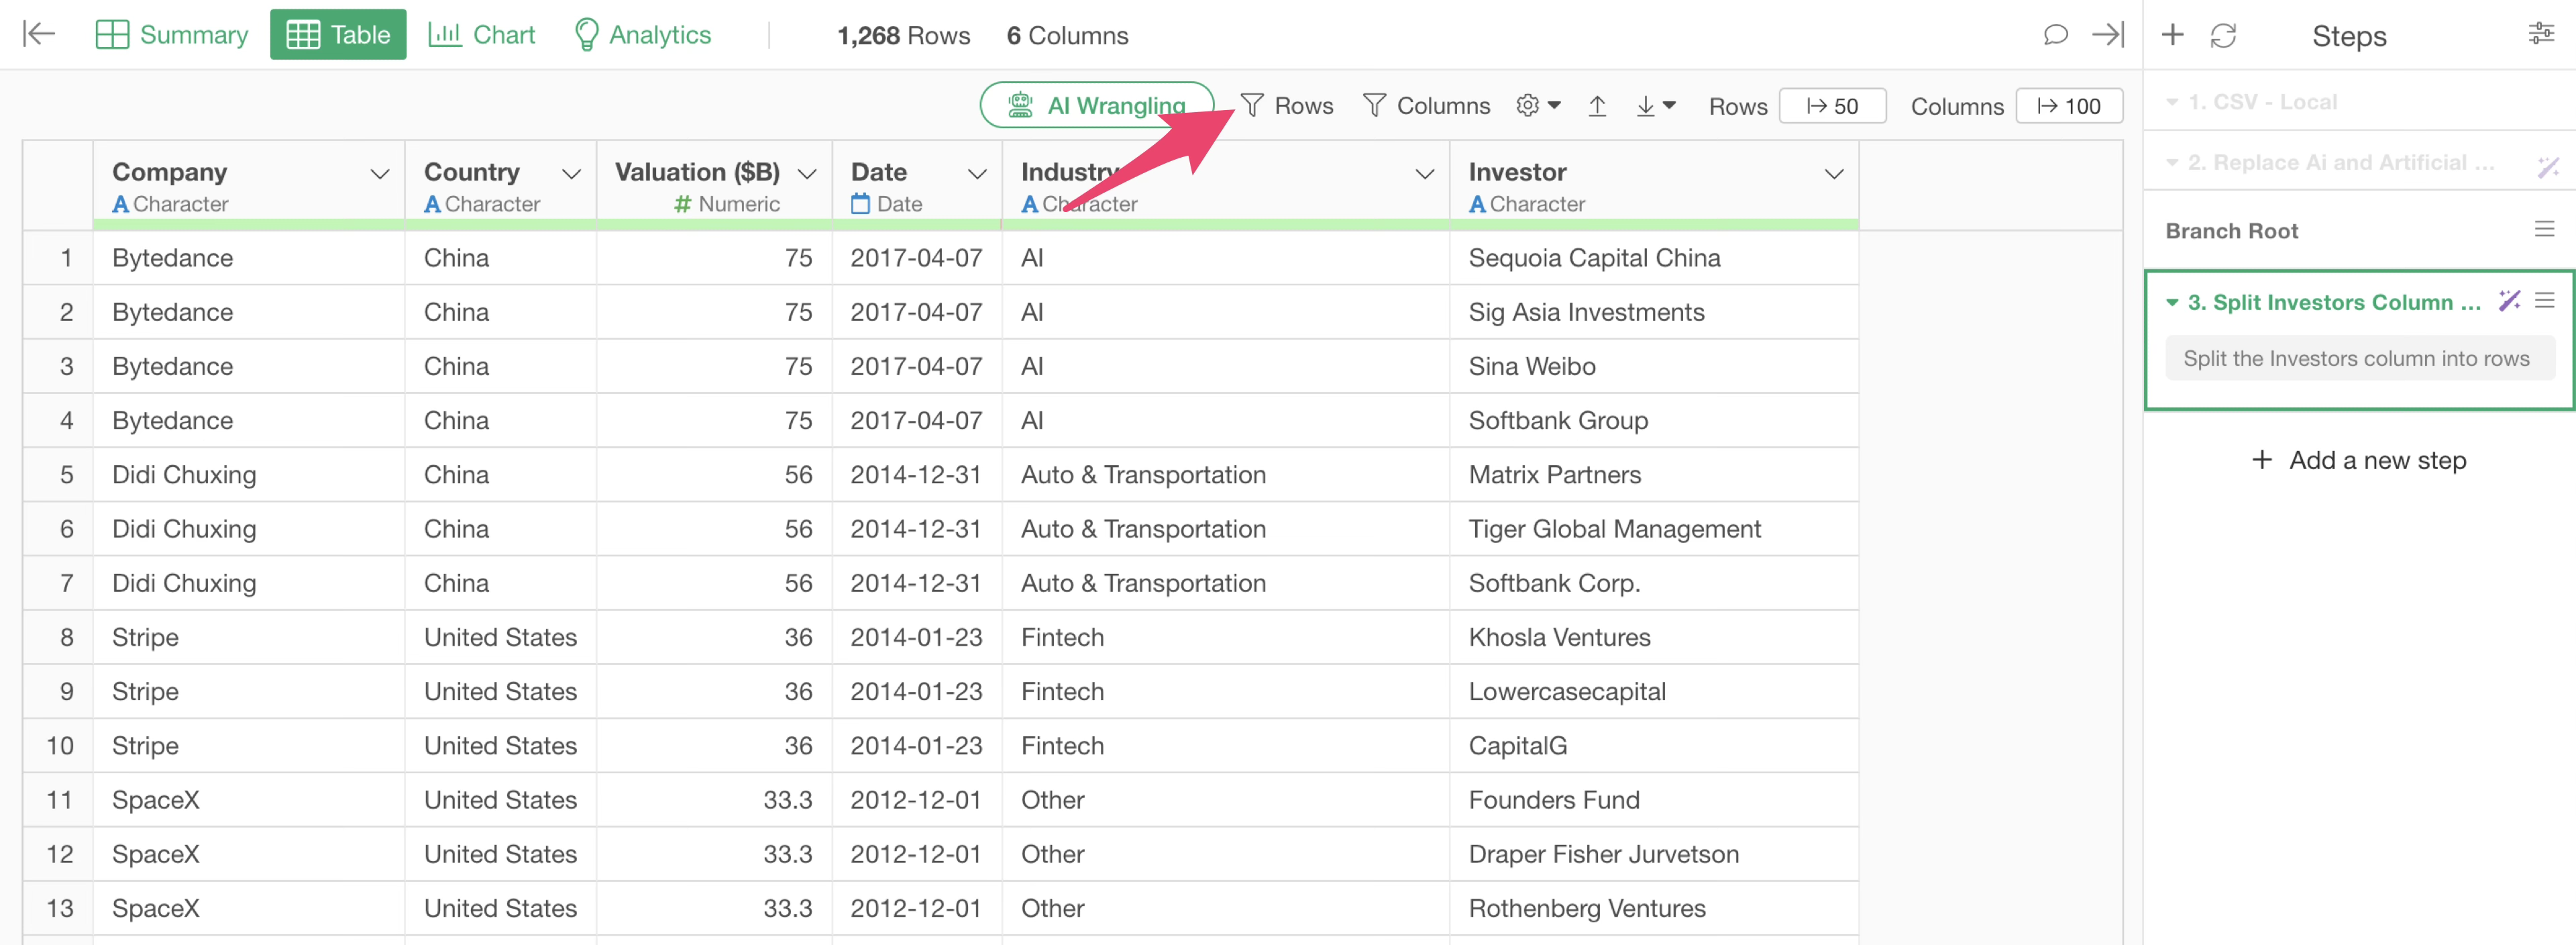
Split the Investors column into rows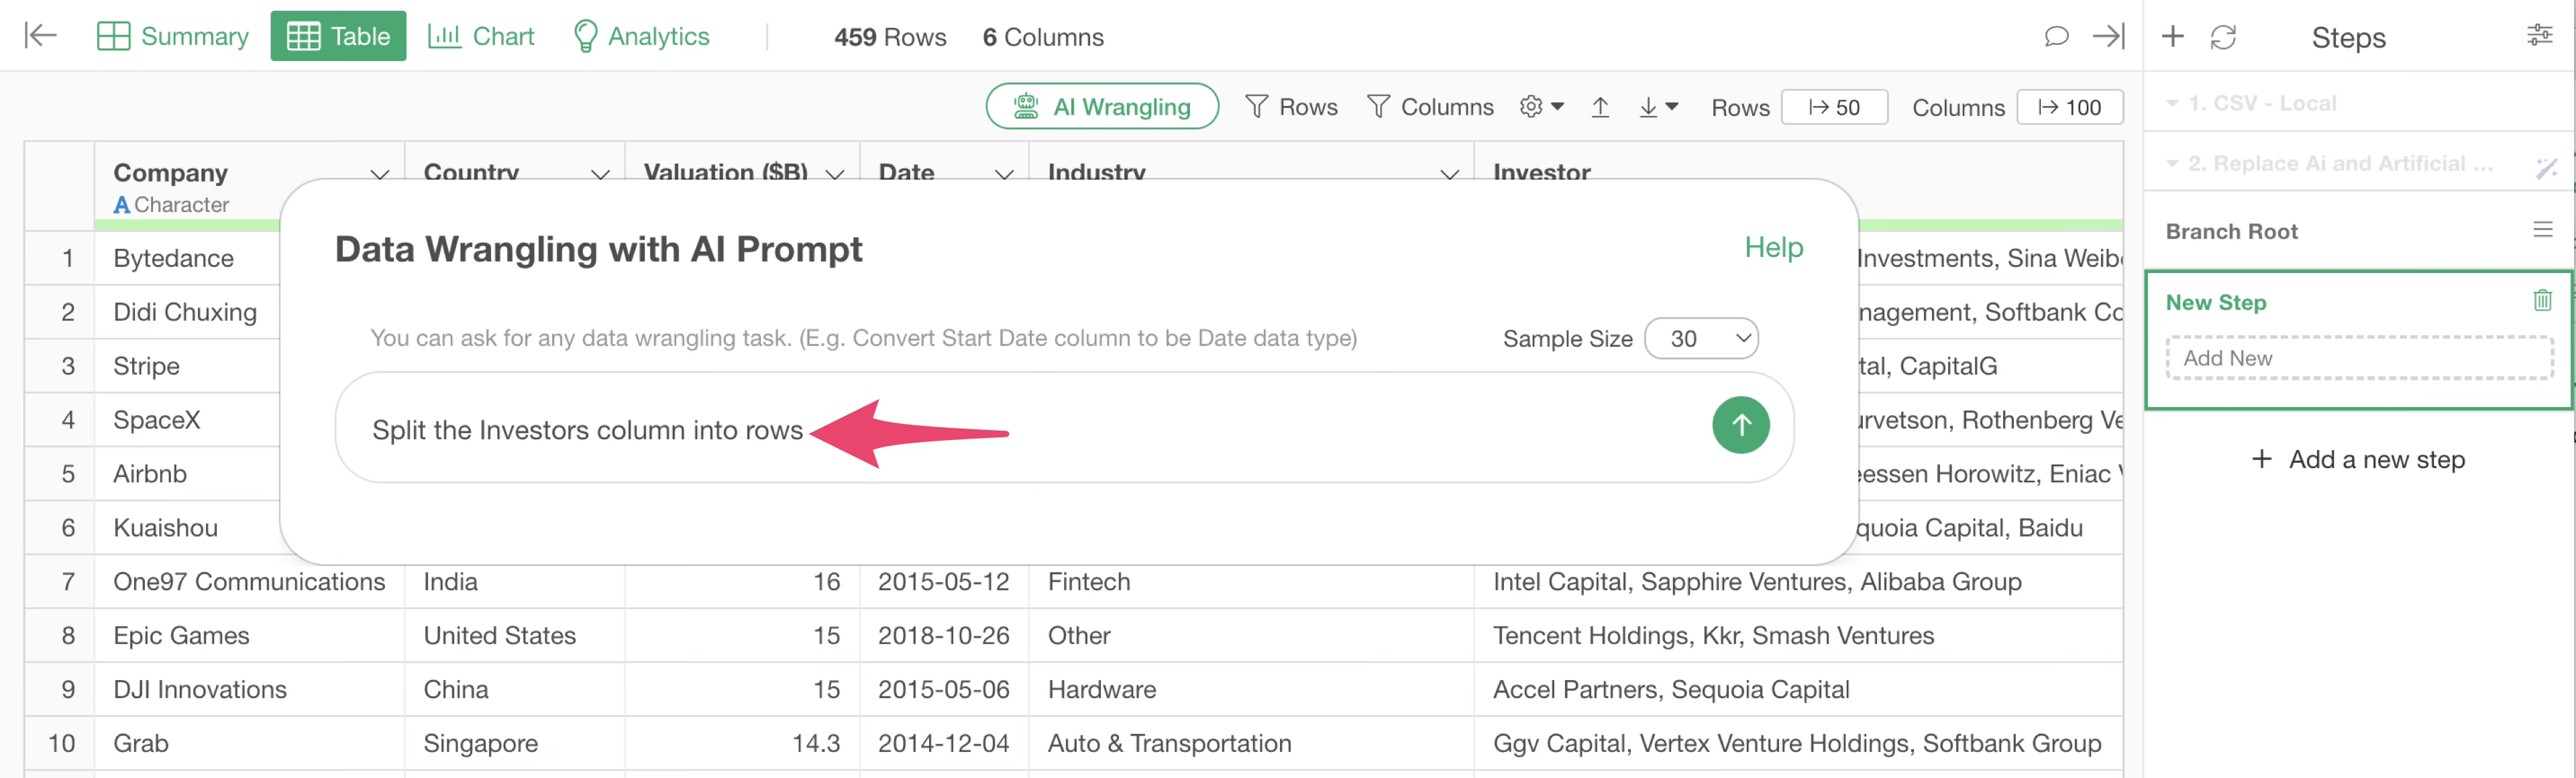
The R script to split the investor values into rows by comma will be returned.
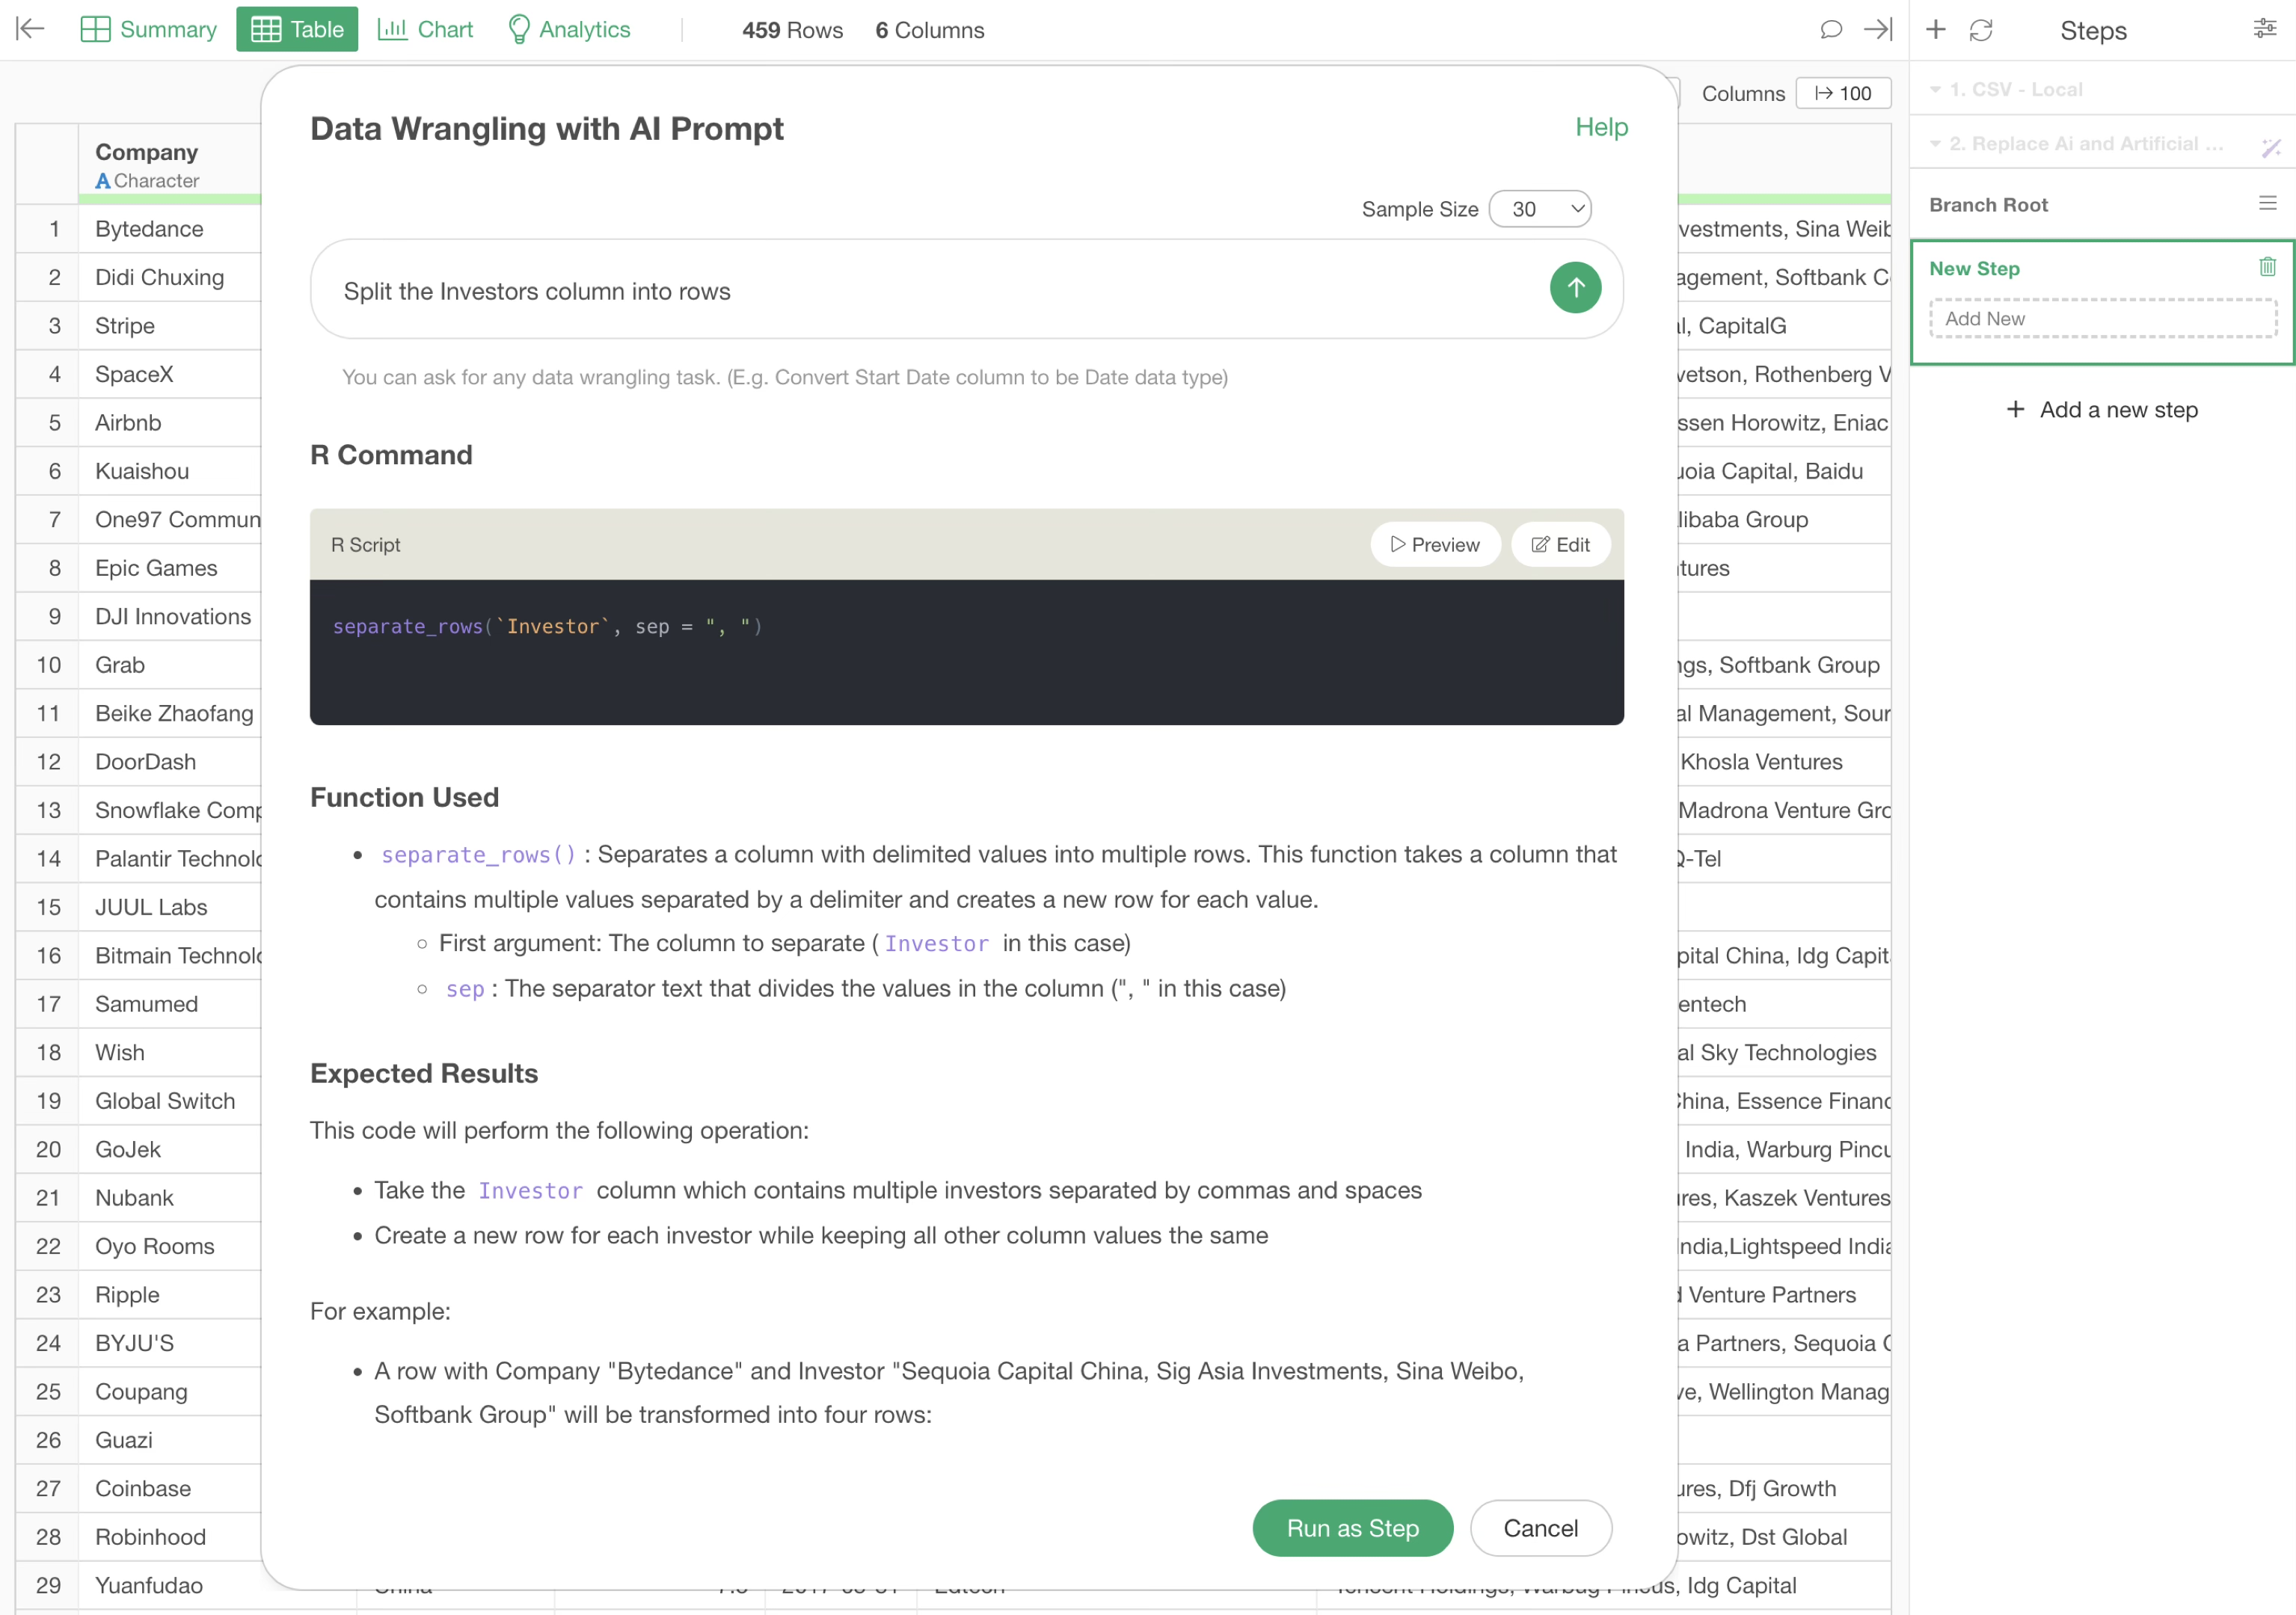
By executing this, we were able to split the data into rows by investor.
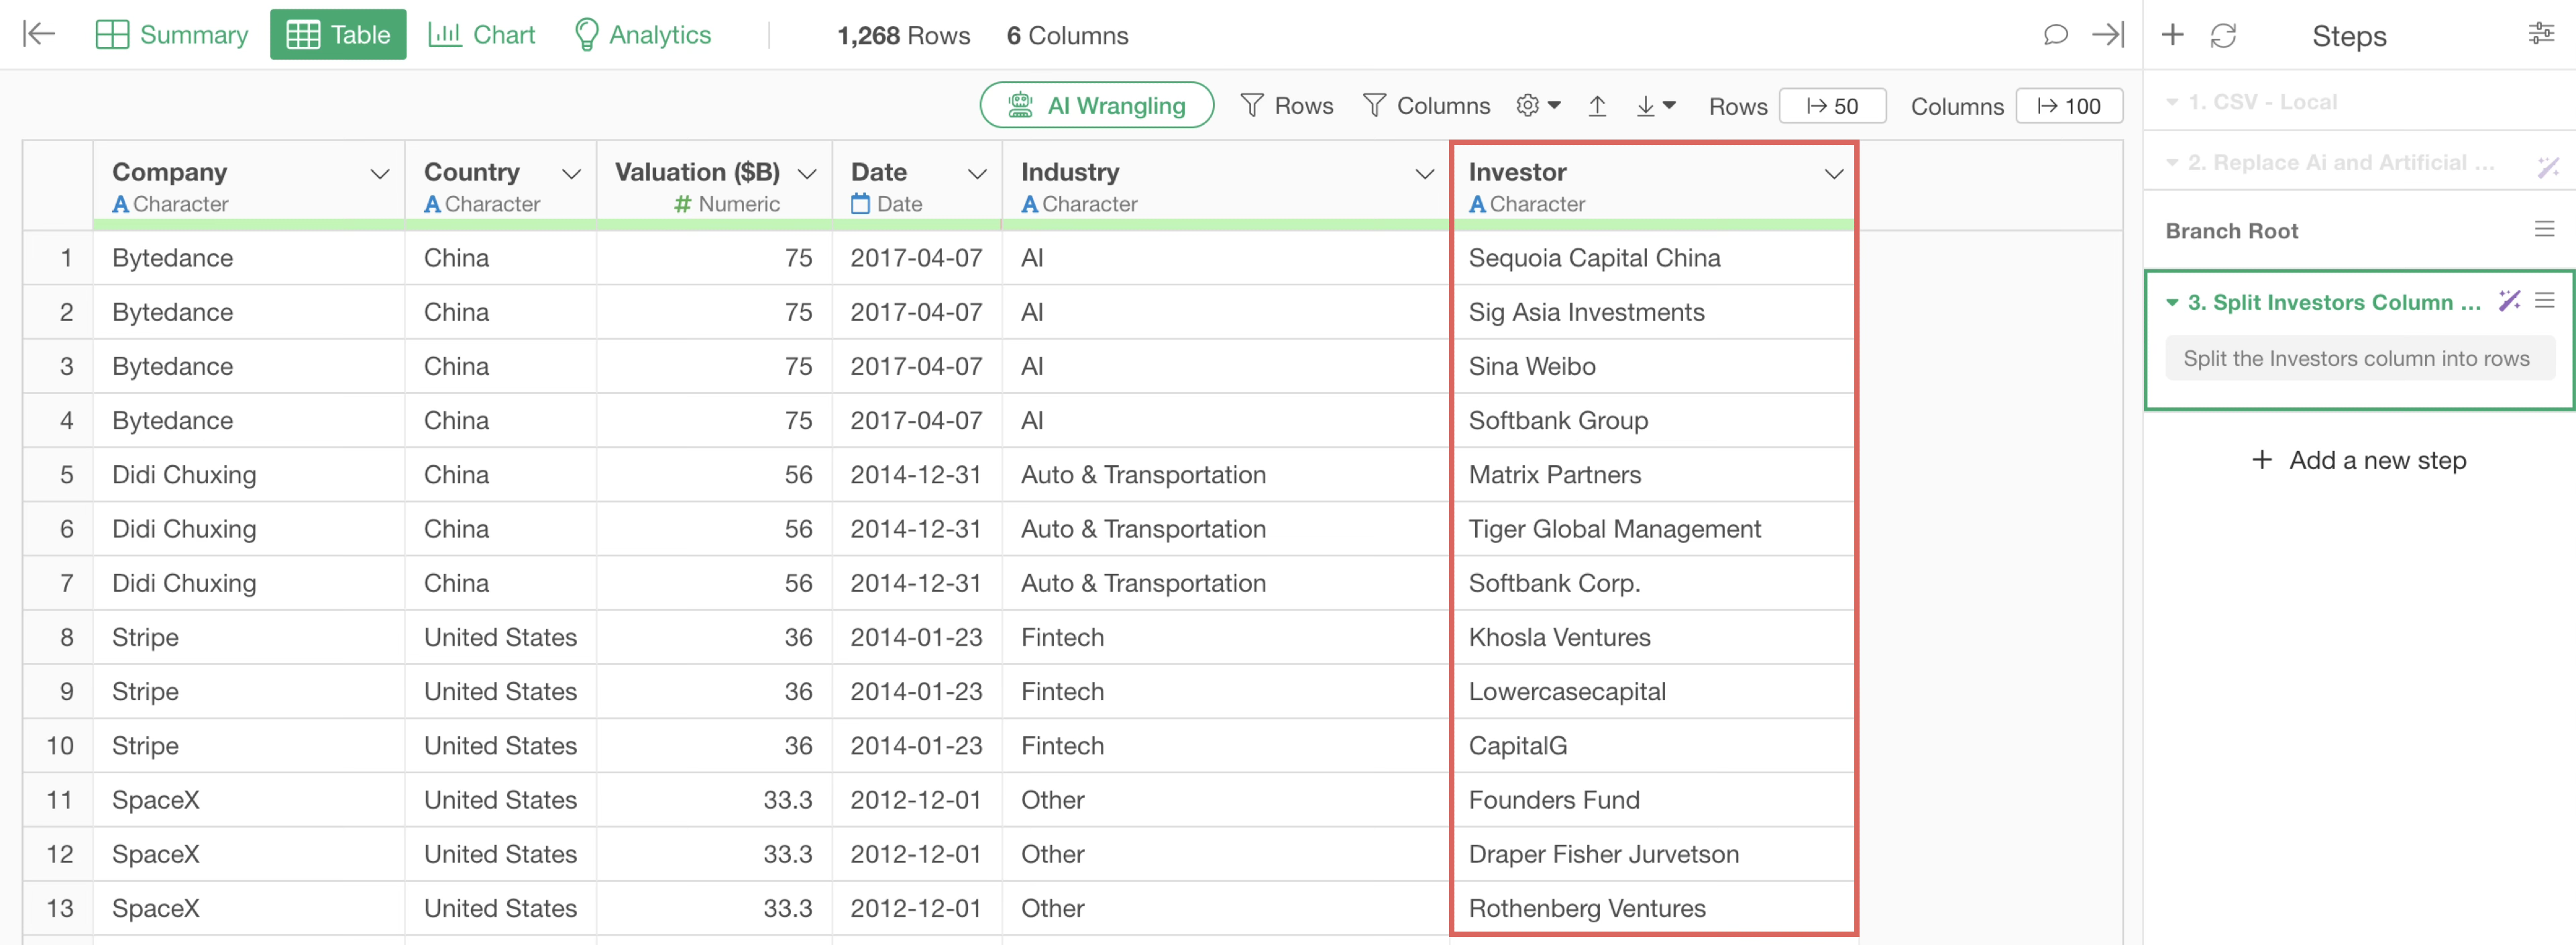
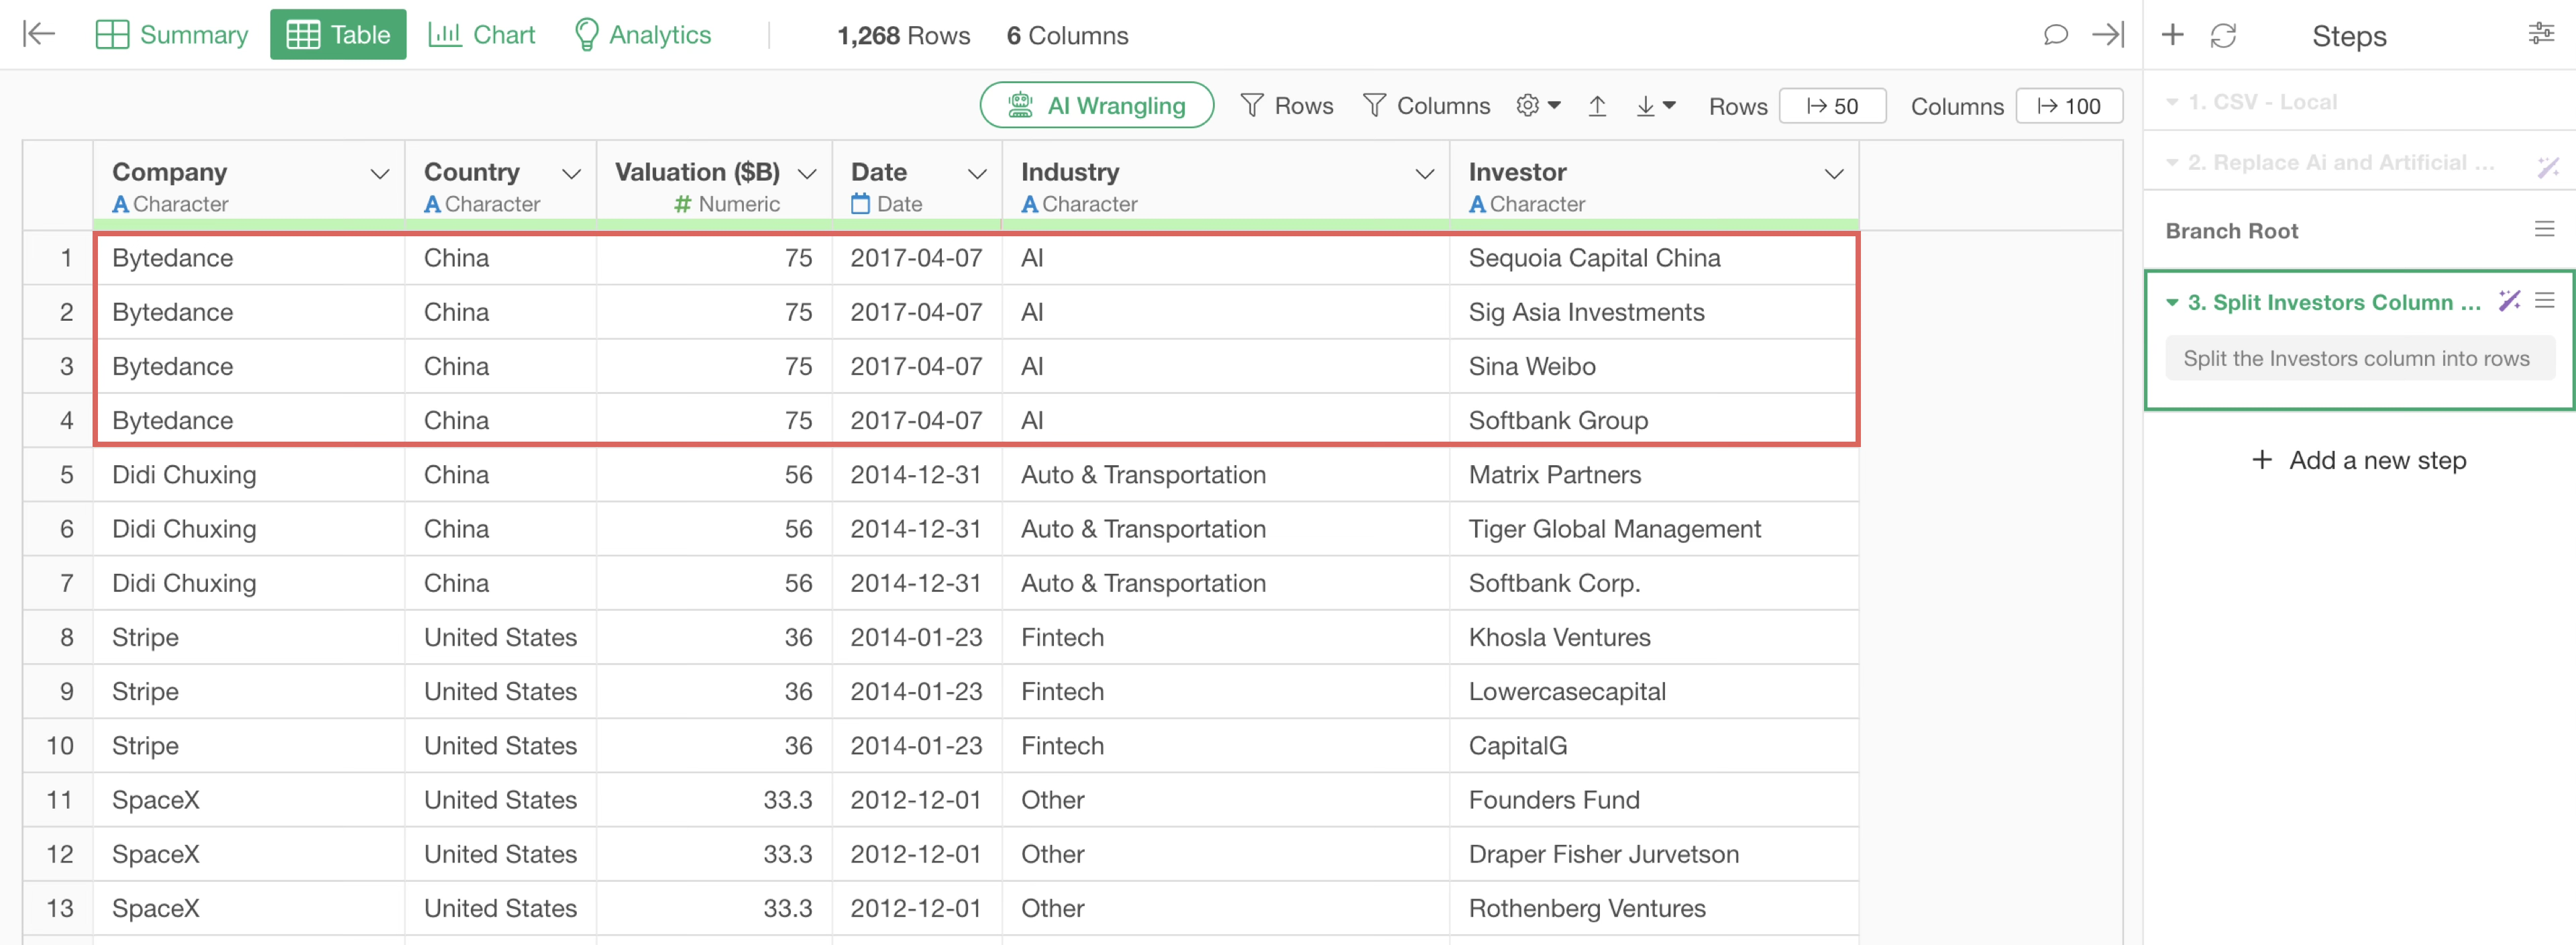
By creating a row for each investor, companies that have received investments from multiple investors will have an increased number of rows. For example, “Bytedance”, a Chinese company famous for TikTok, has received investments from four investors, so it now has four rows.
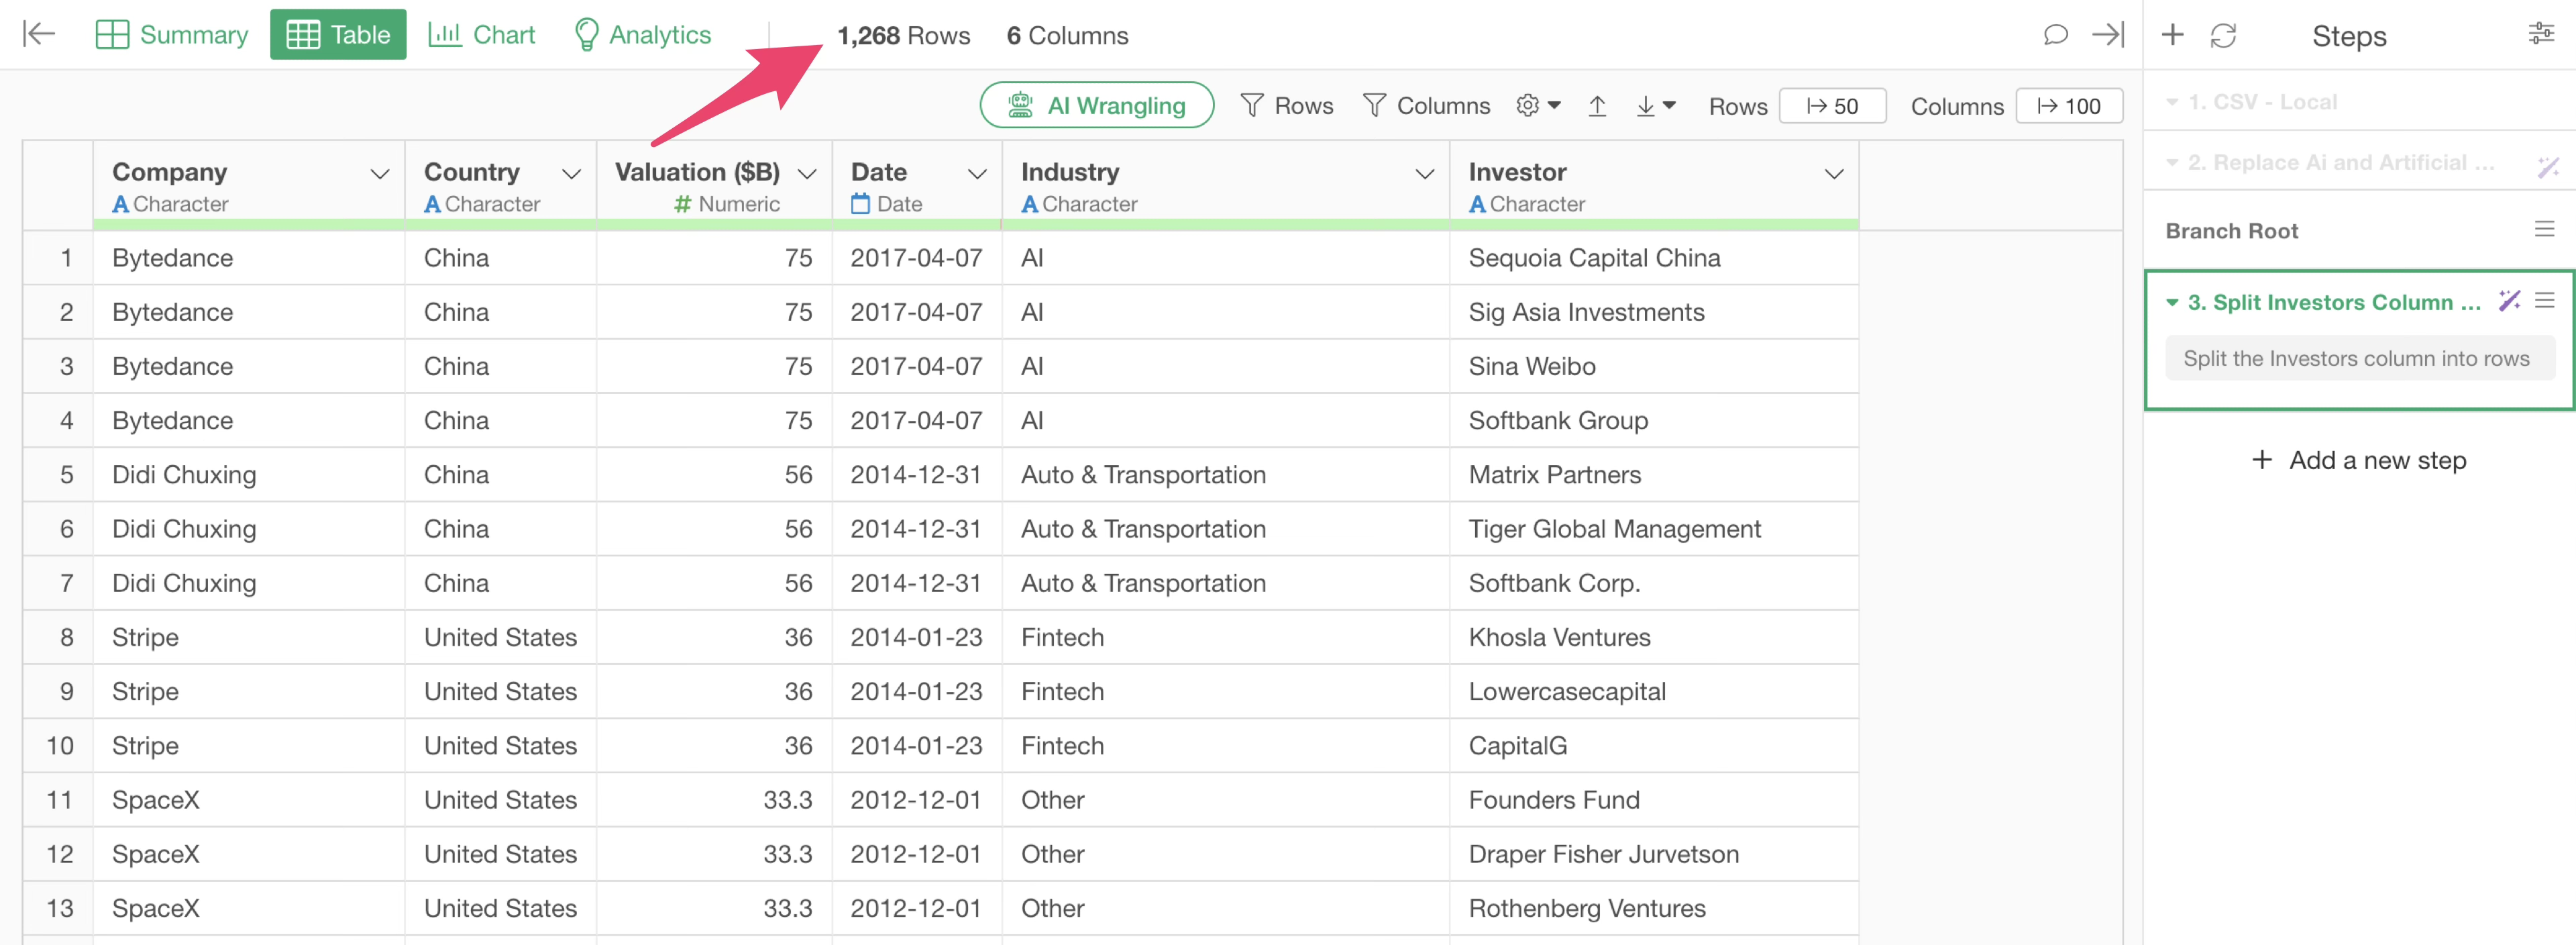
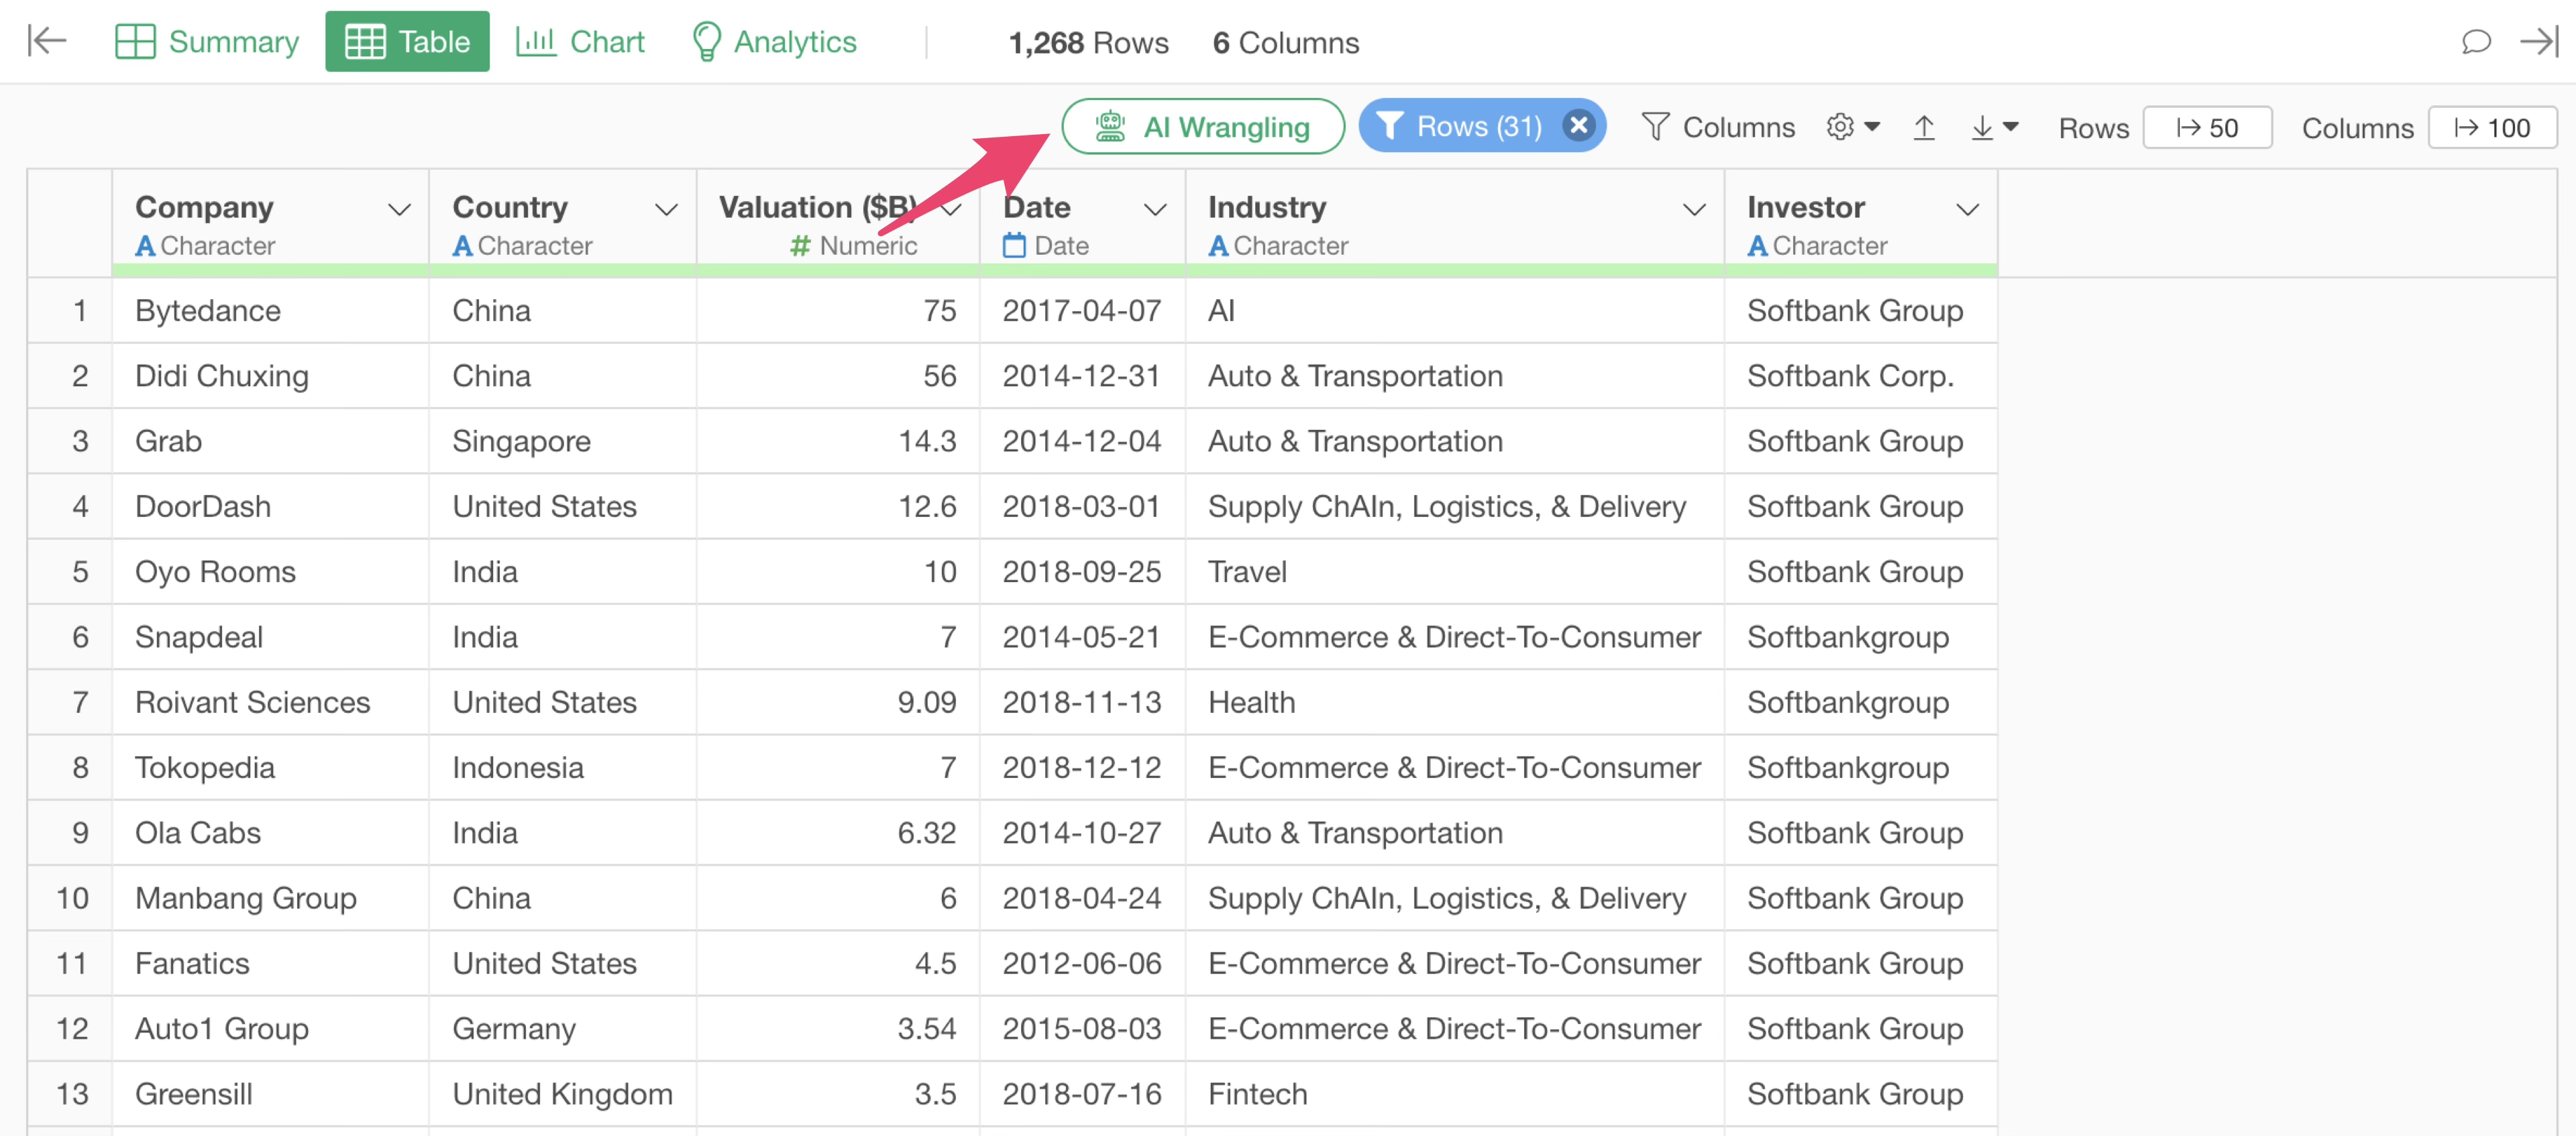
It can be confirmed that the number of rows has increased to “1,268 Rows” due to splitting by investor.
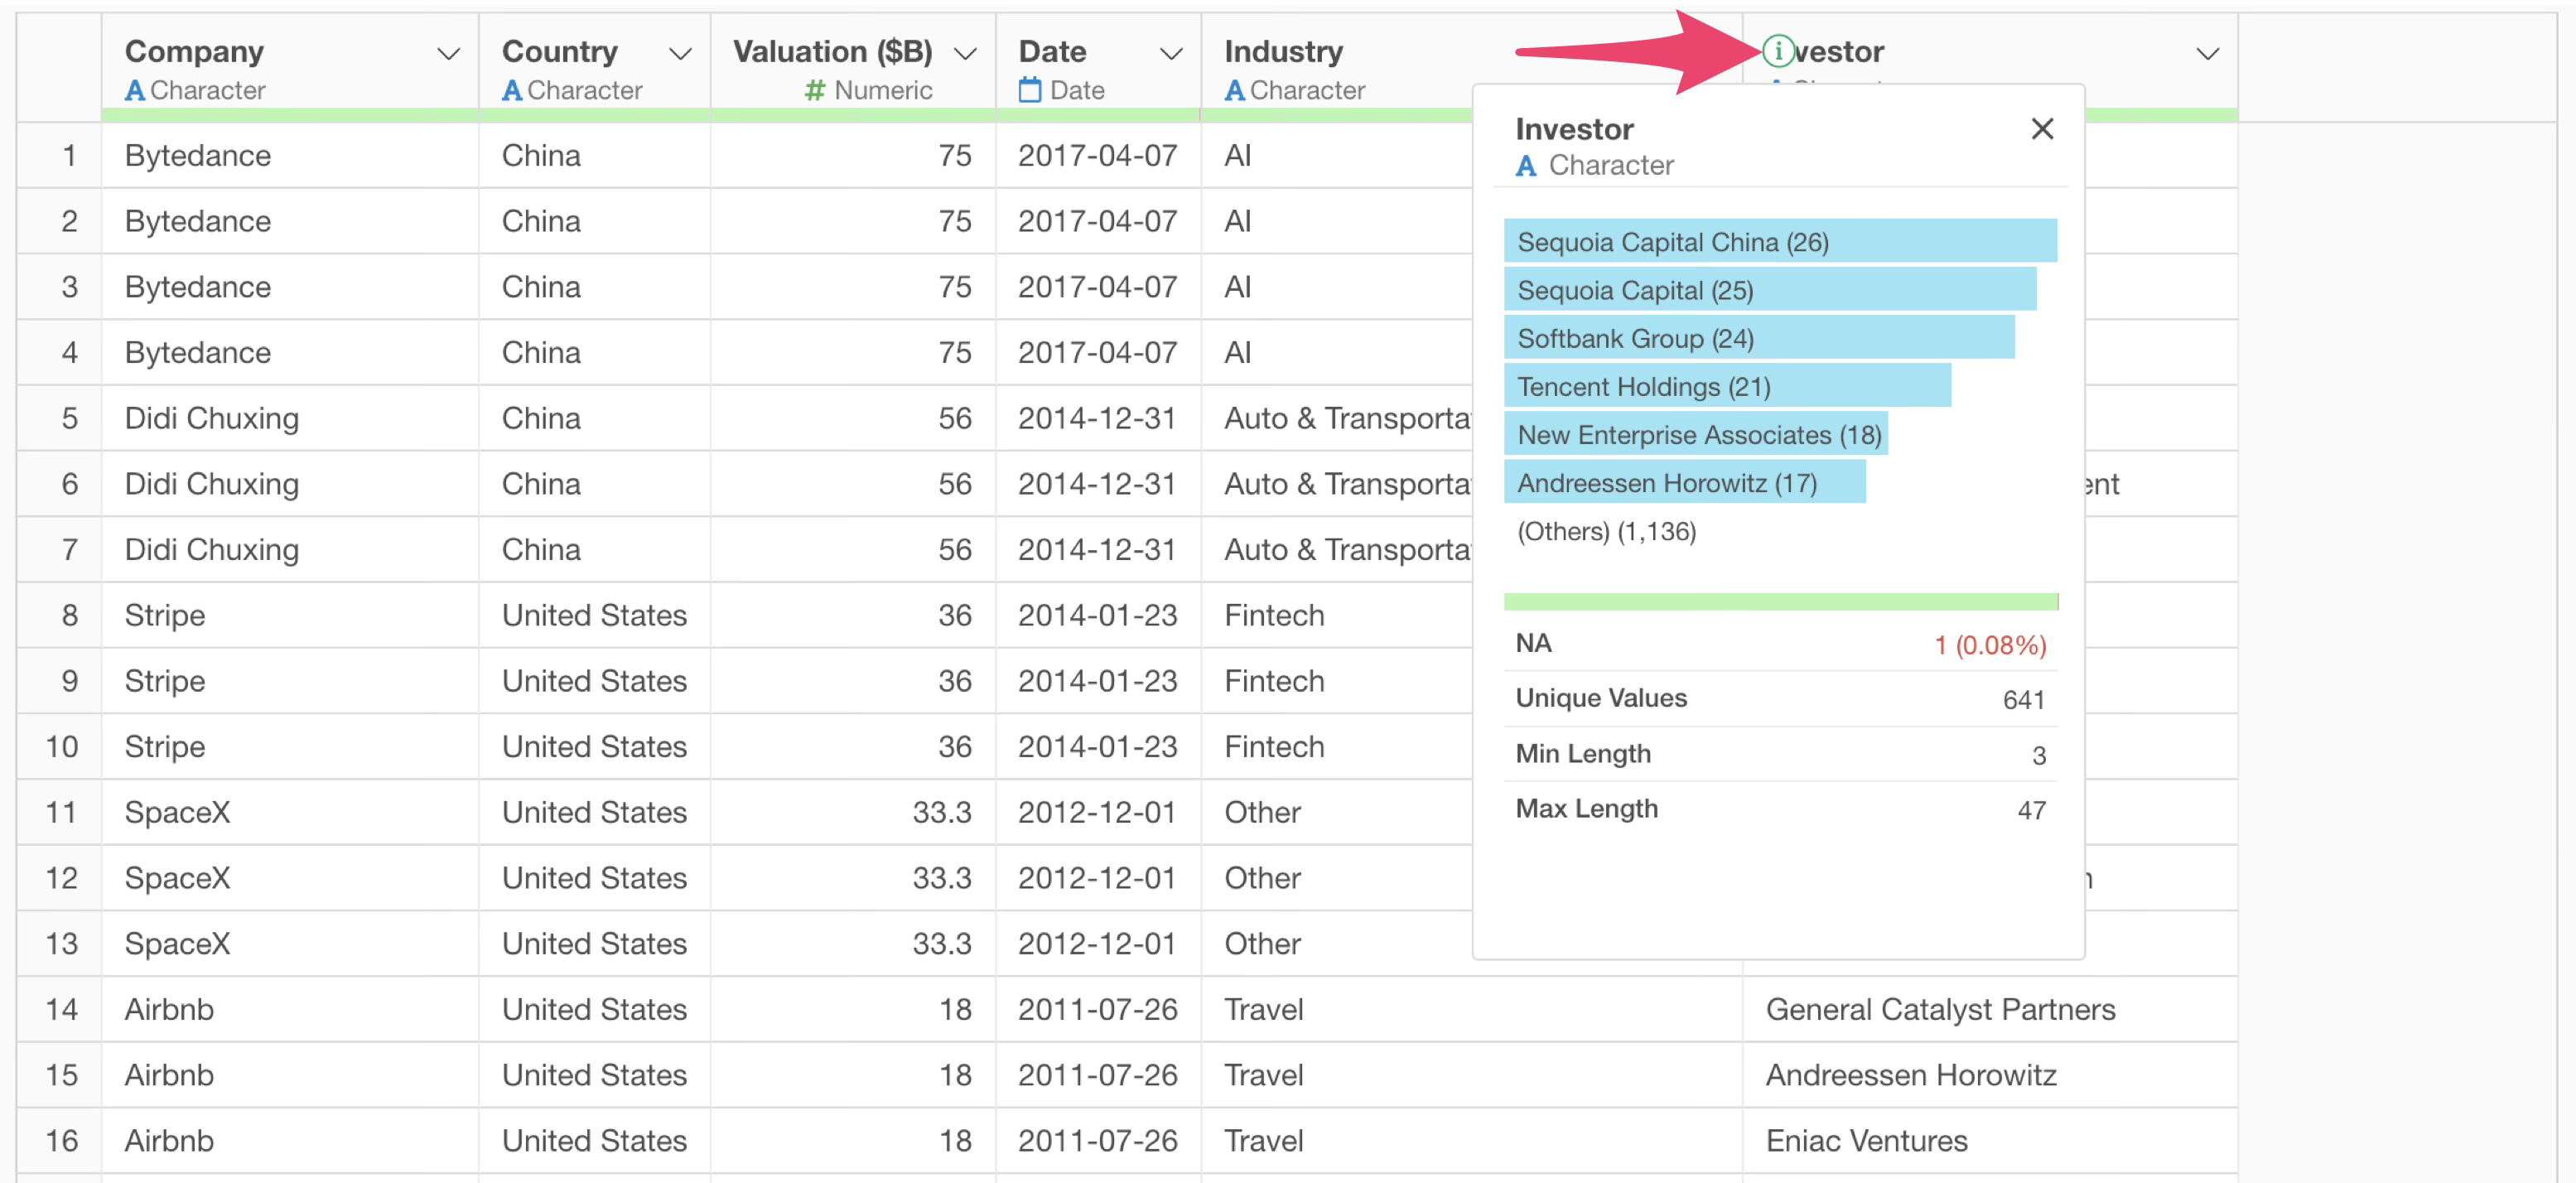
Furthermore, by clicking the “i(infomation)” button in the “Investors” column from the Table View, you can view “Summary Information”, which makes it easy to check which investors have invested in more companies.
7. Standardize Text Data Variations
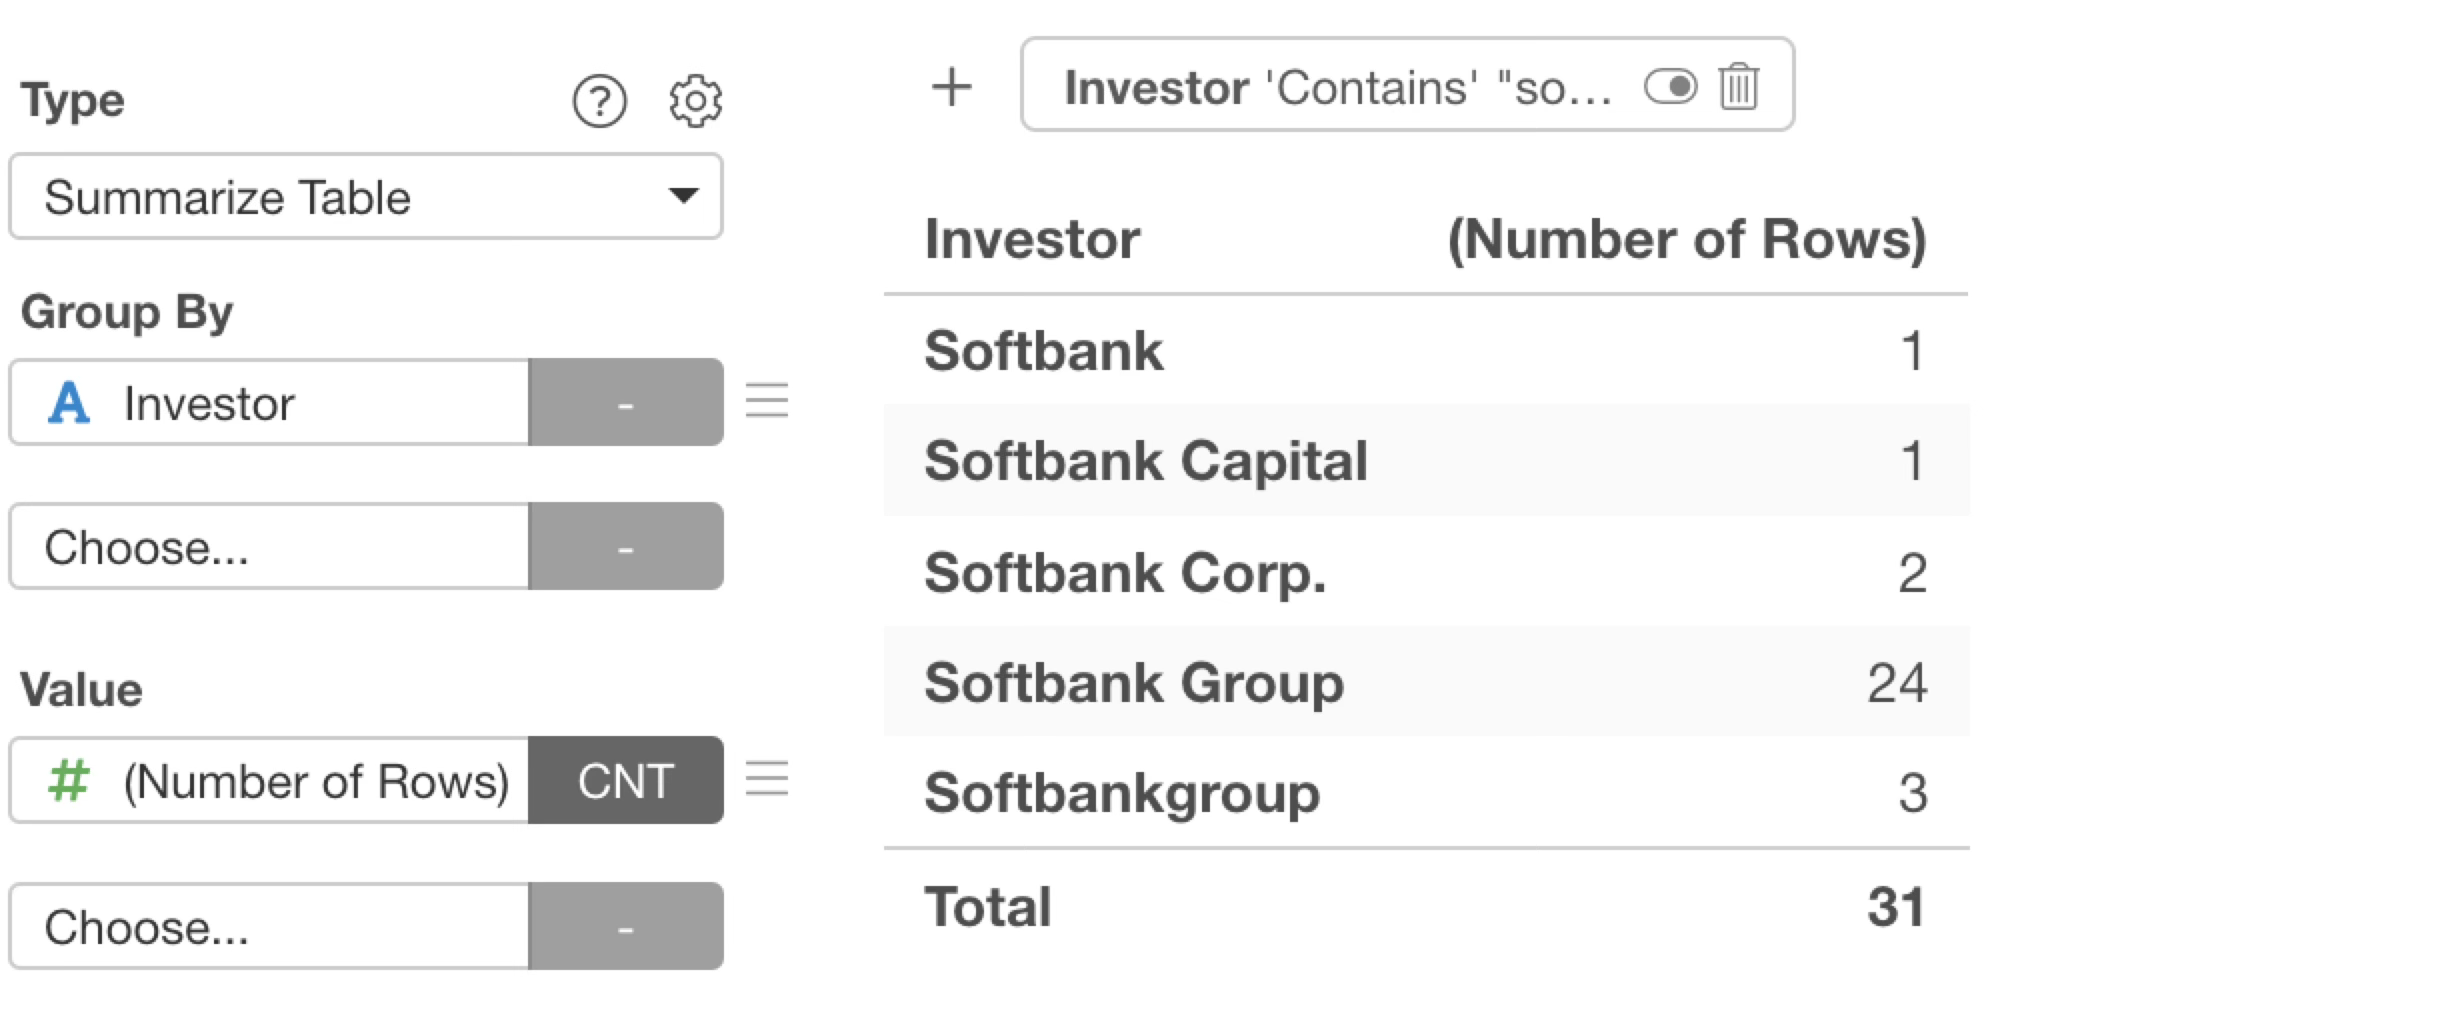
This time, we want to focus on “Softbank,” a Japanese company among the investors.
However, “Softbank” appears under multiple names such as “Softbank Group” and “Softbank Corp.”
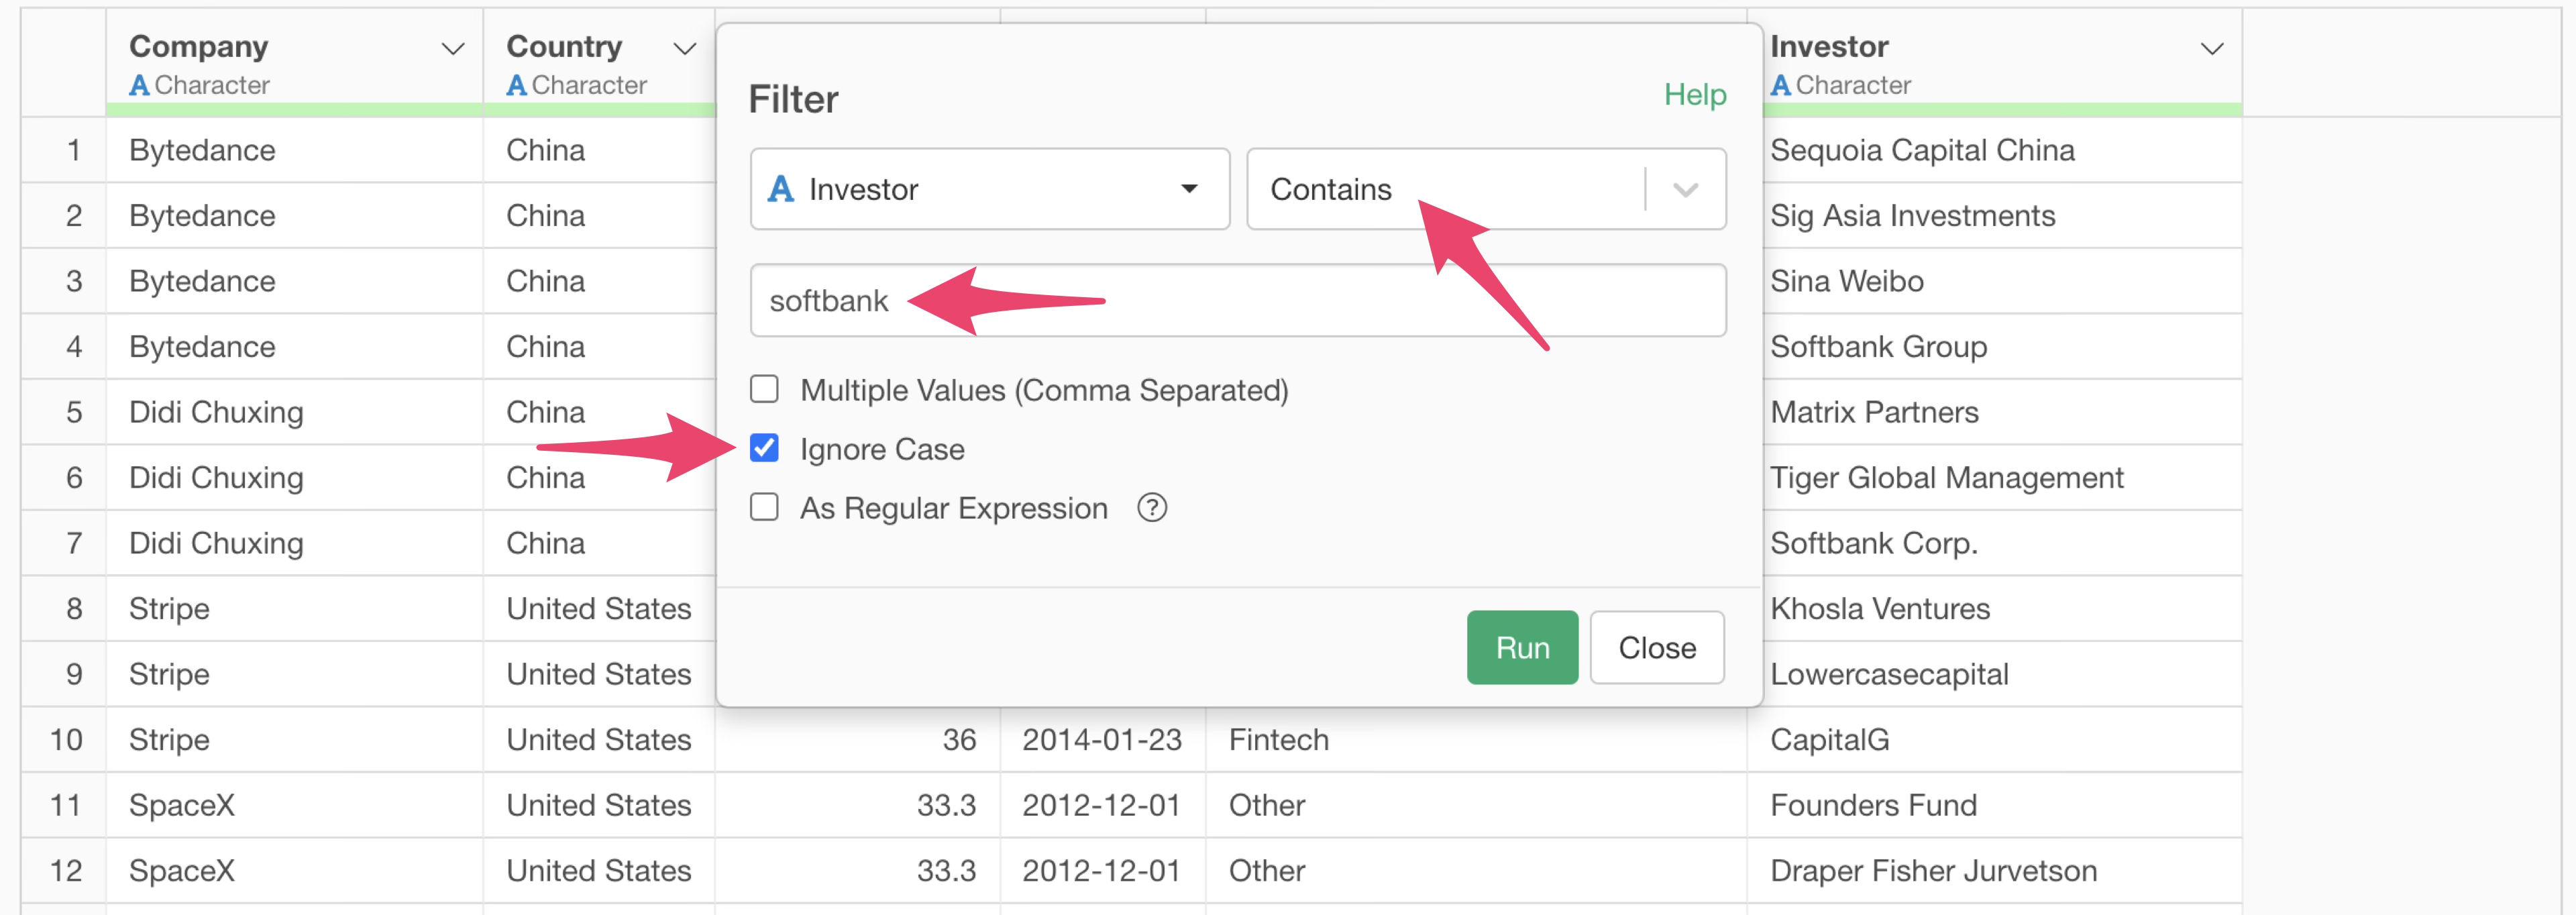
To find out what other names include “Softbank”, we will use the “Rows Filter” in the Table View to narrow down the data to rows that “contain Softbank.”
The row filter dialog will appear. Specify as follows:
Select “Select Investors” for the column
Select “Contains” for the operator
Enter “softbank”
Check “Ignore Case”
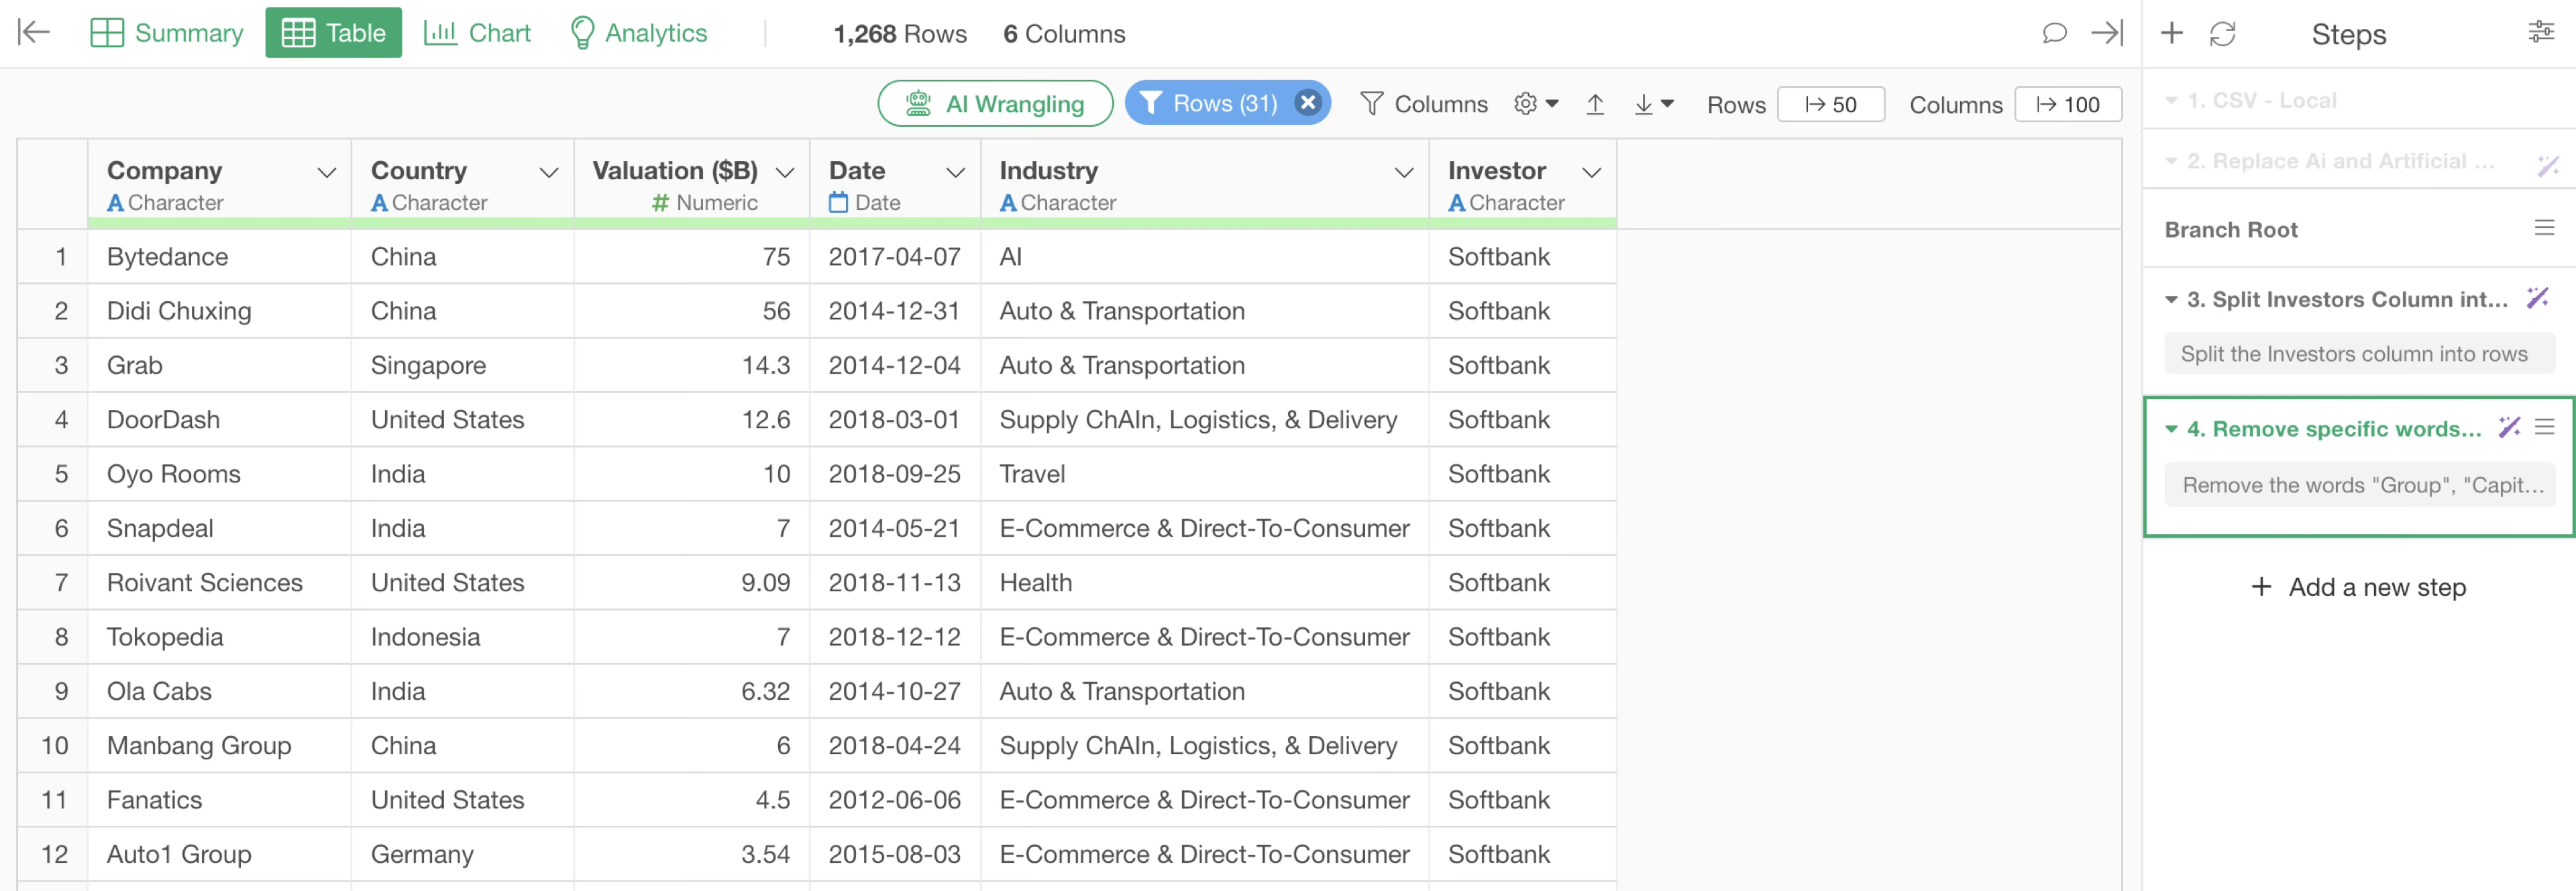
With this operation, we can find there are 31 rows that “contain Softbank”, and it can be seen that the notation after Softbank varies.
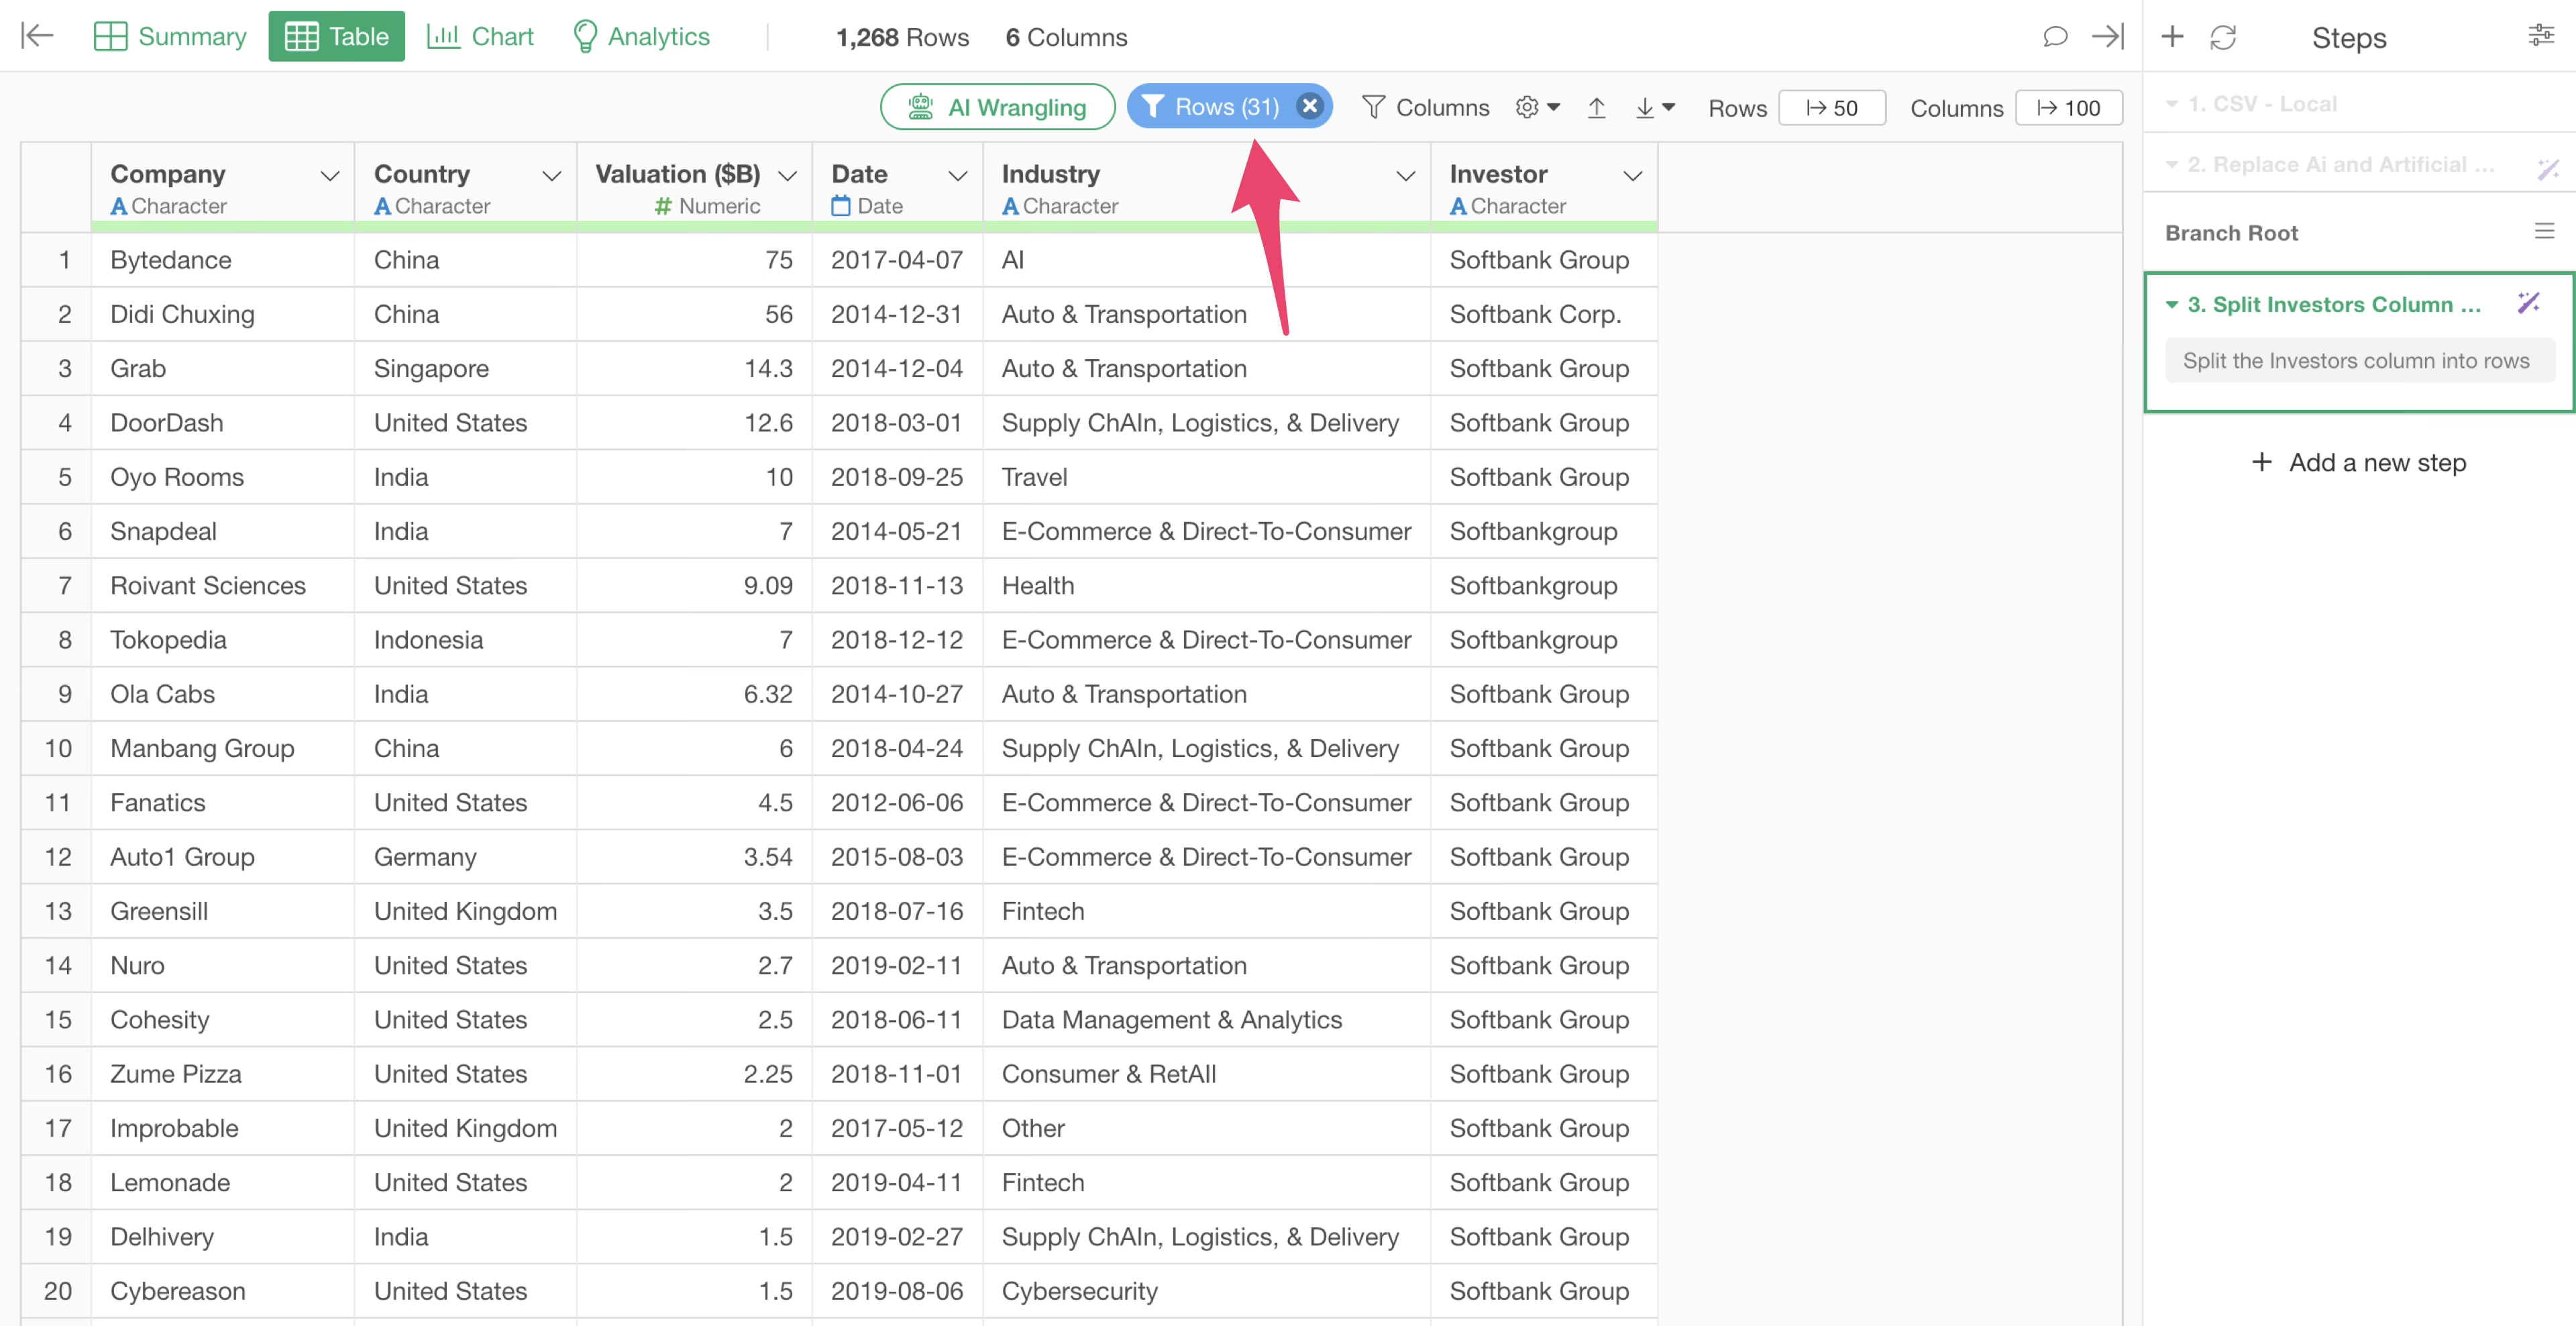
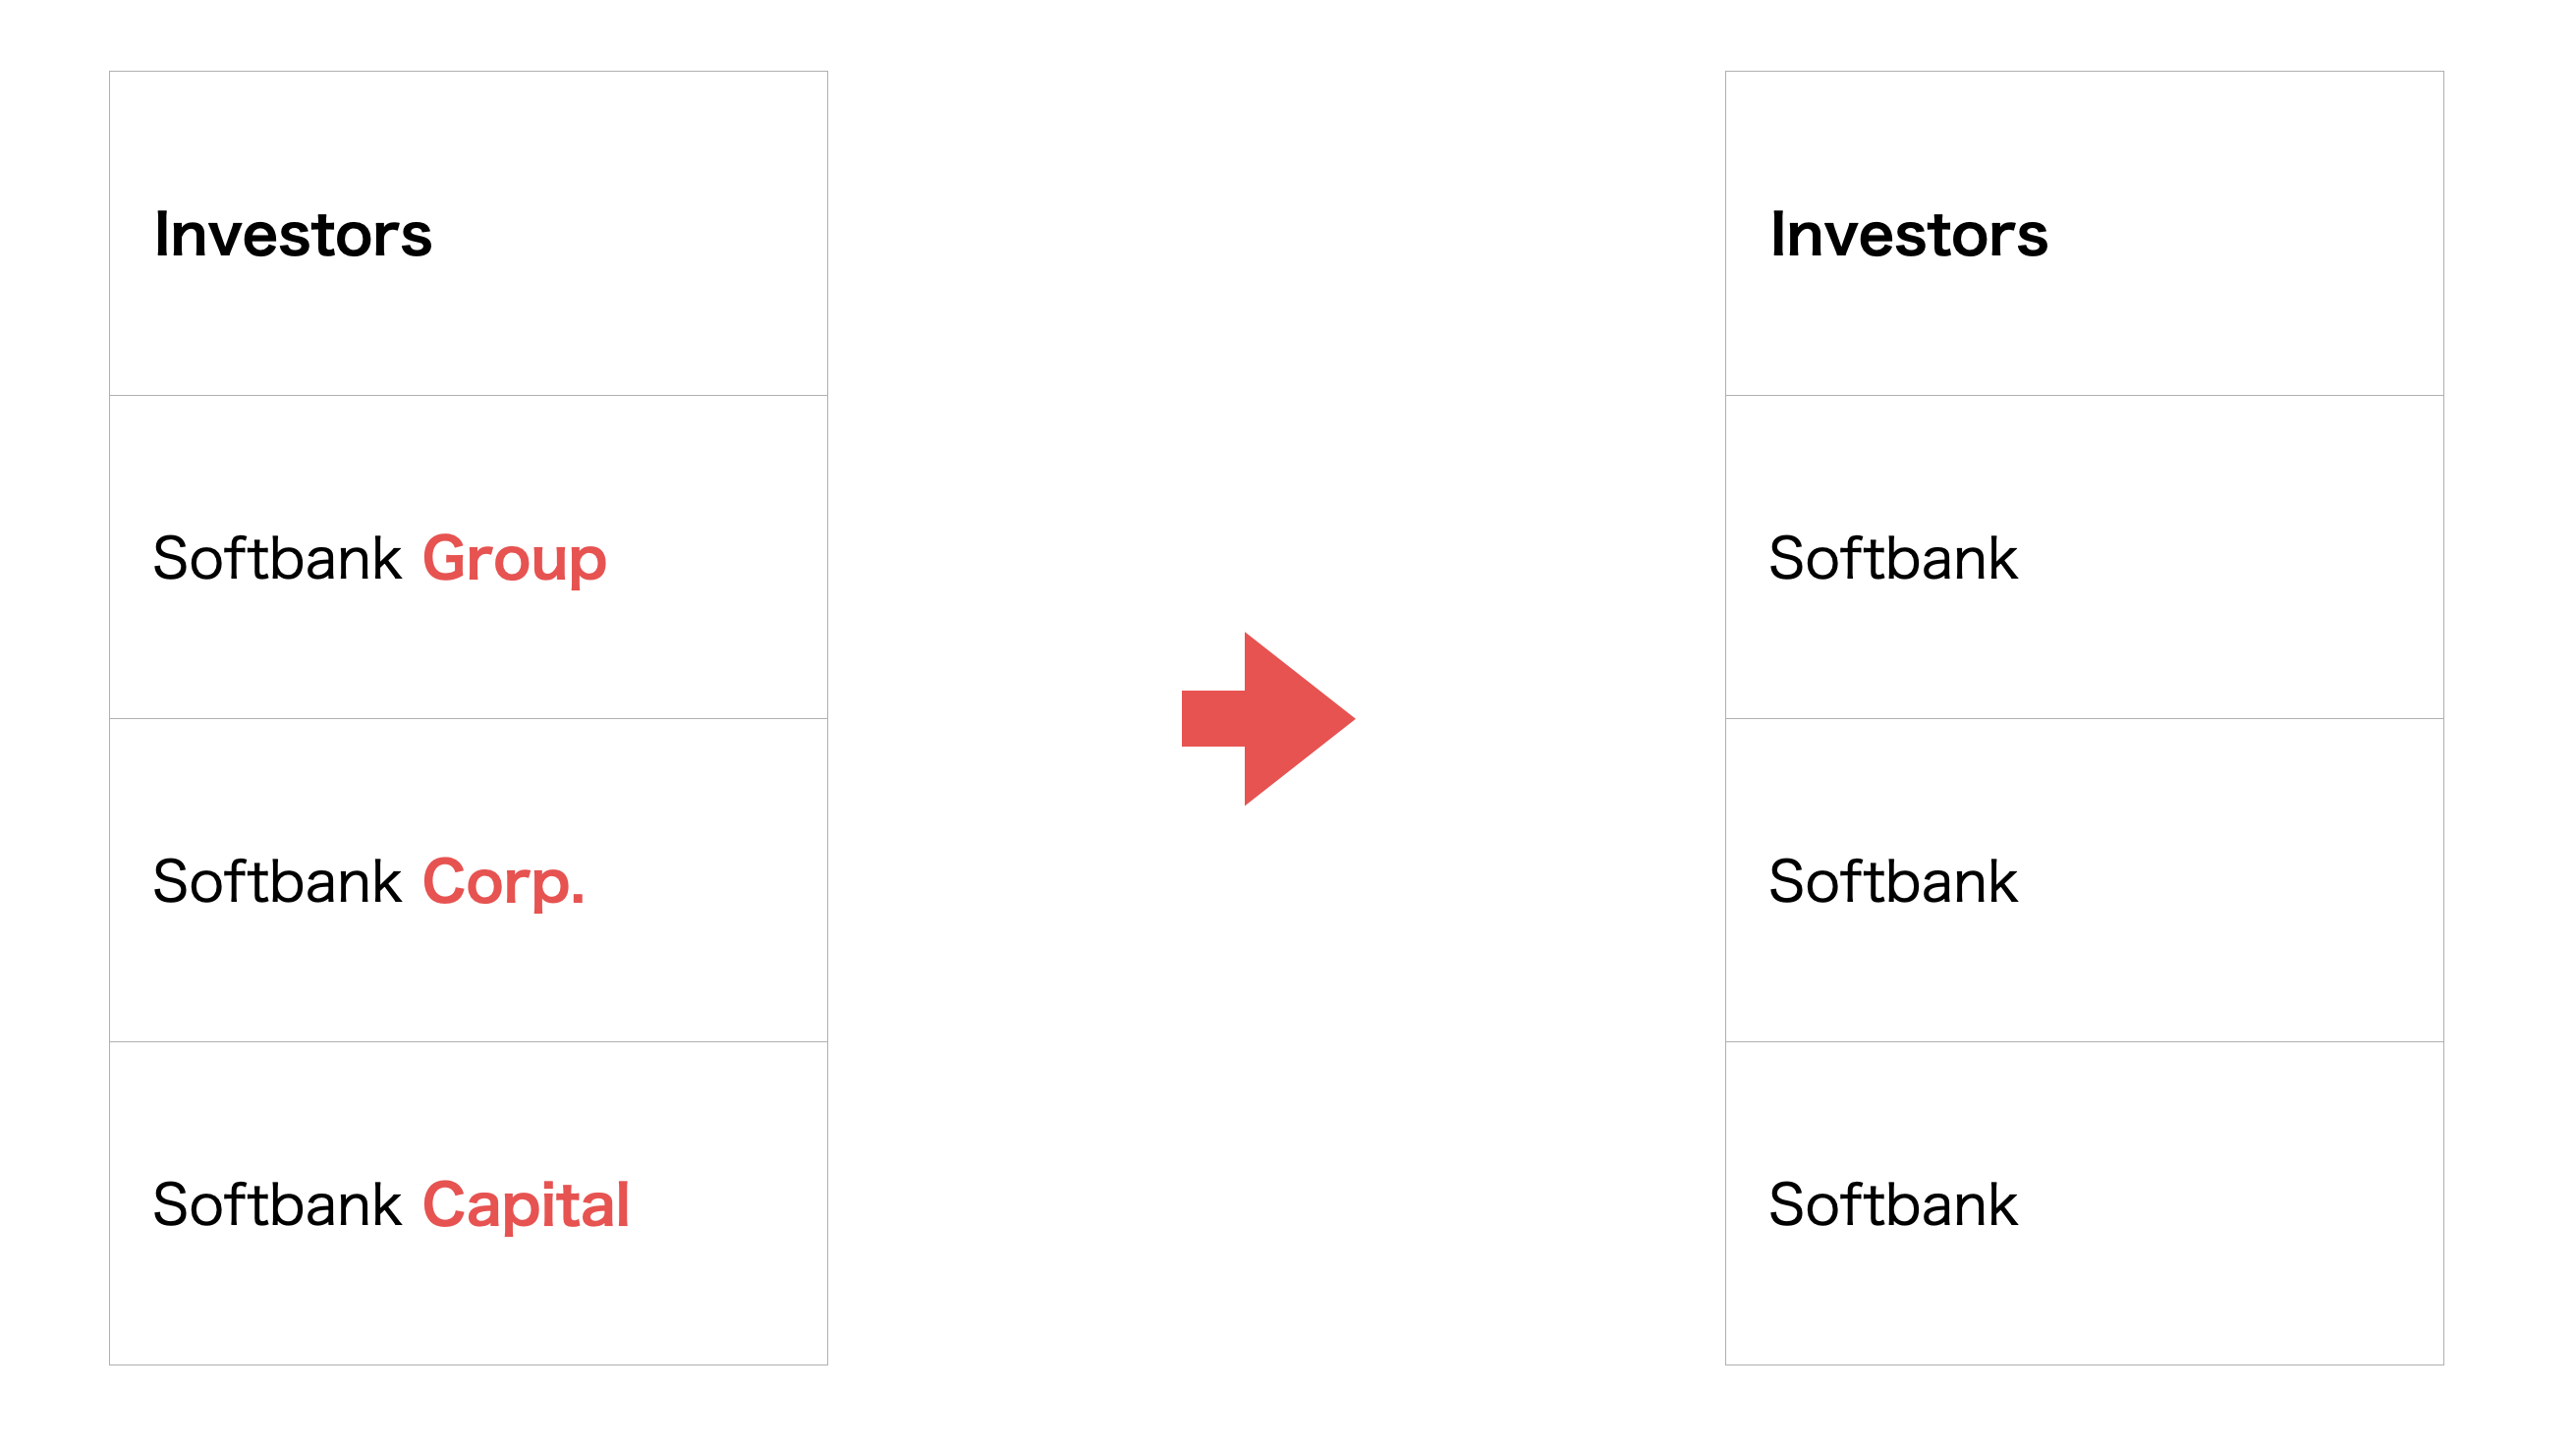
With this type of data, values that represent the same meaning are treated as separate entries during aggregation or visualization, which leads to incorrect counts.
Therefore, values that represent the same meaning must be standardized to the same text. This is done through “text data processing”.
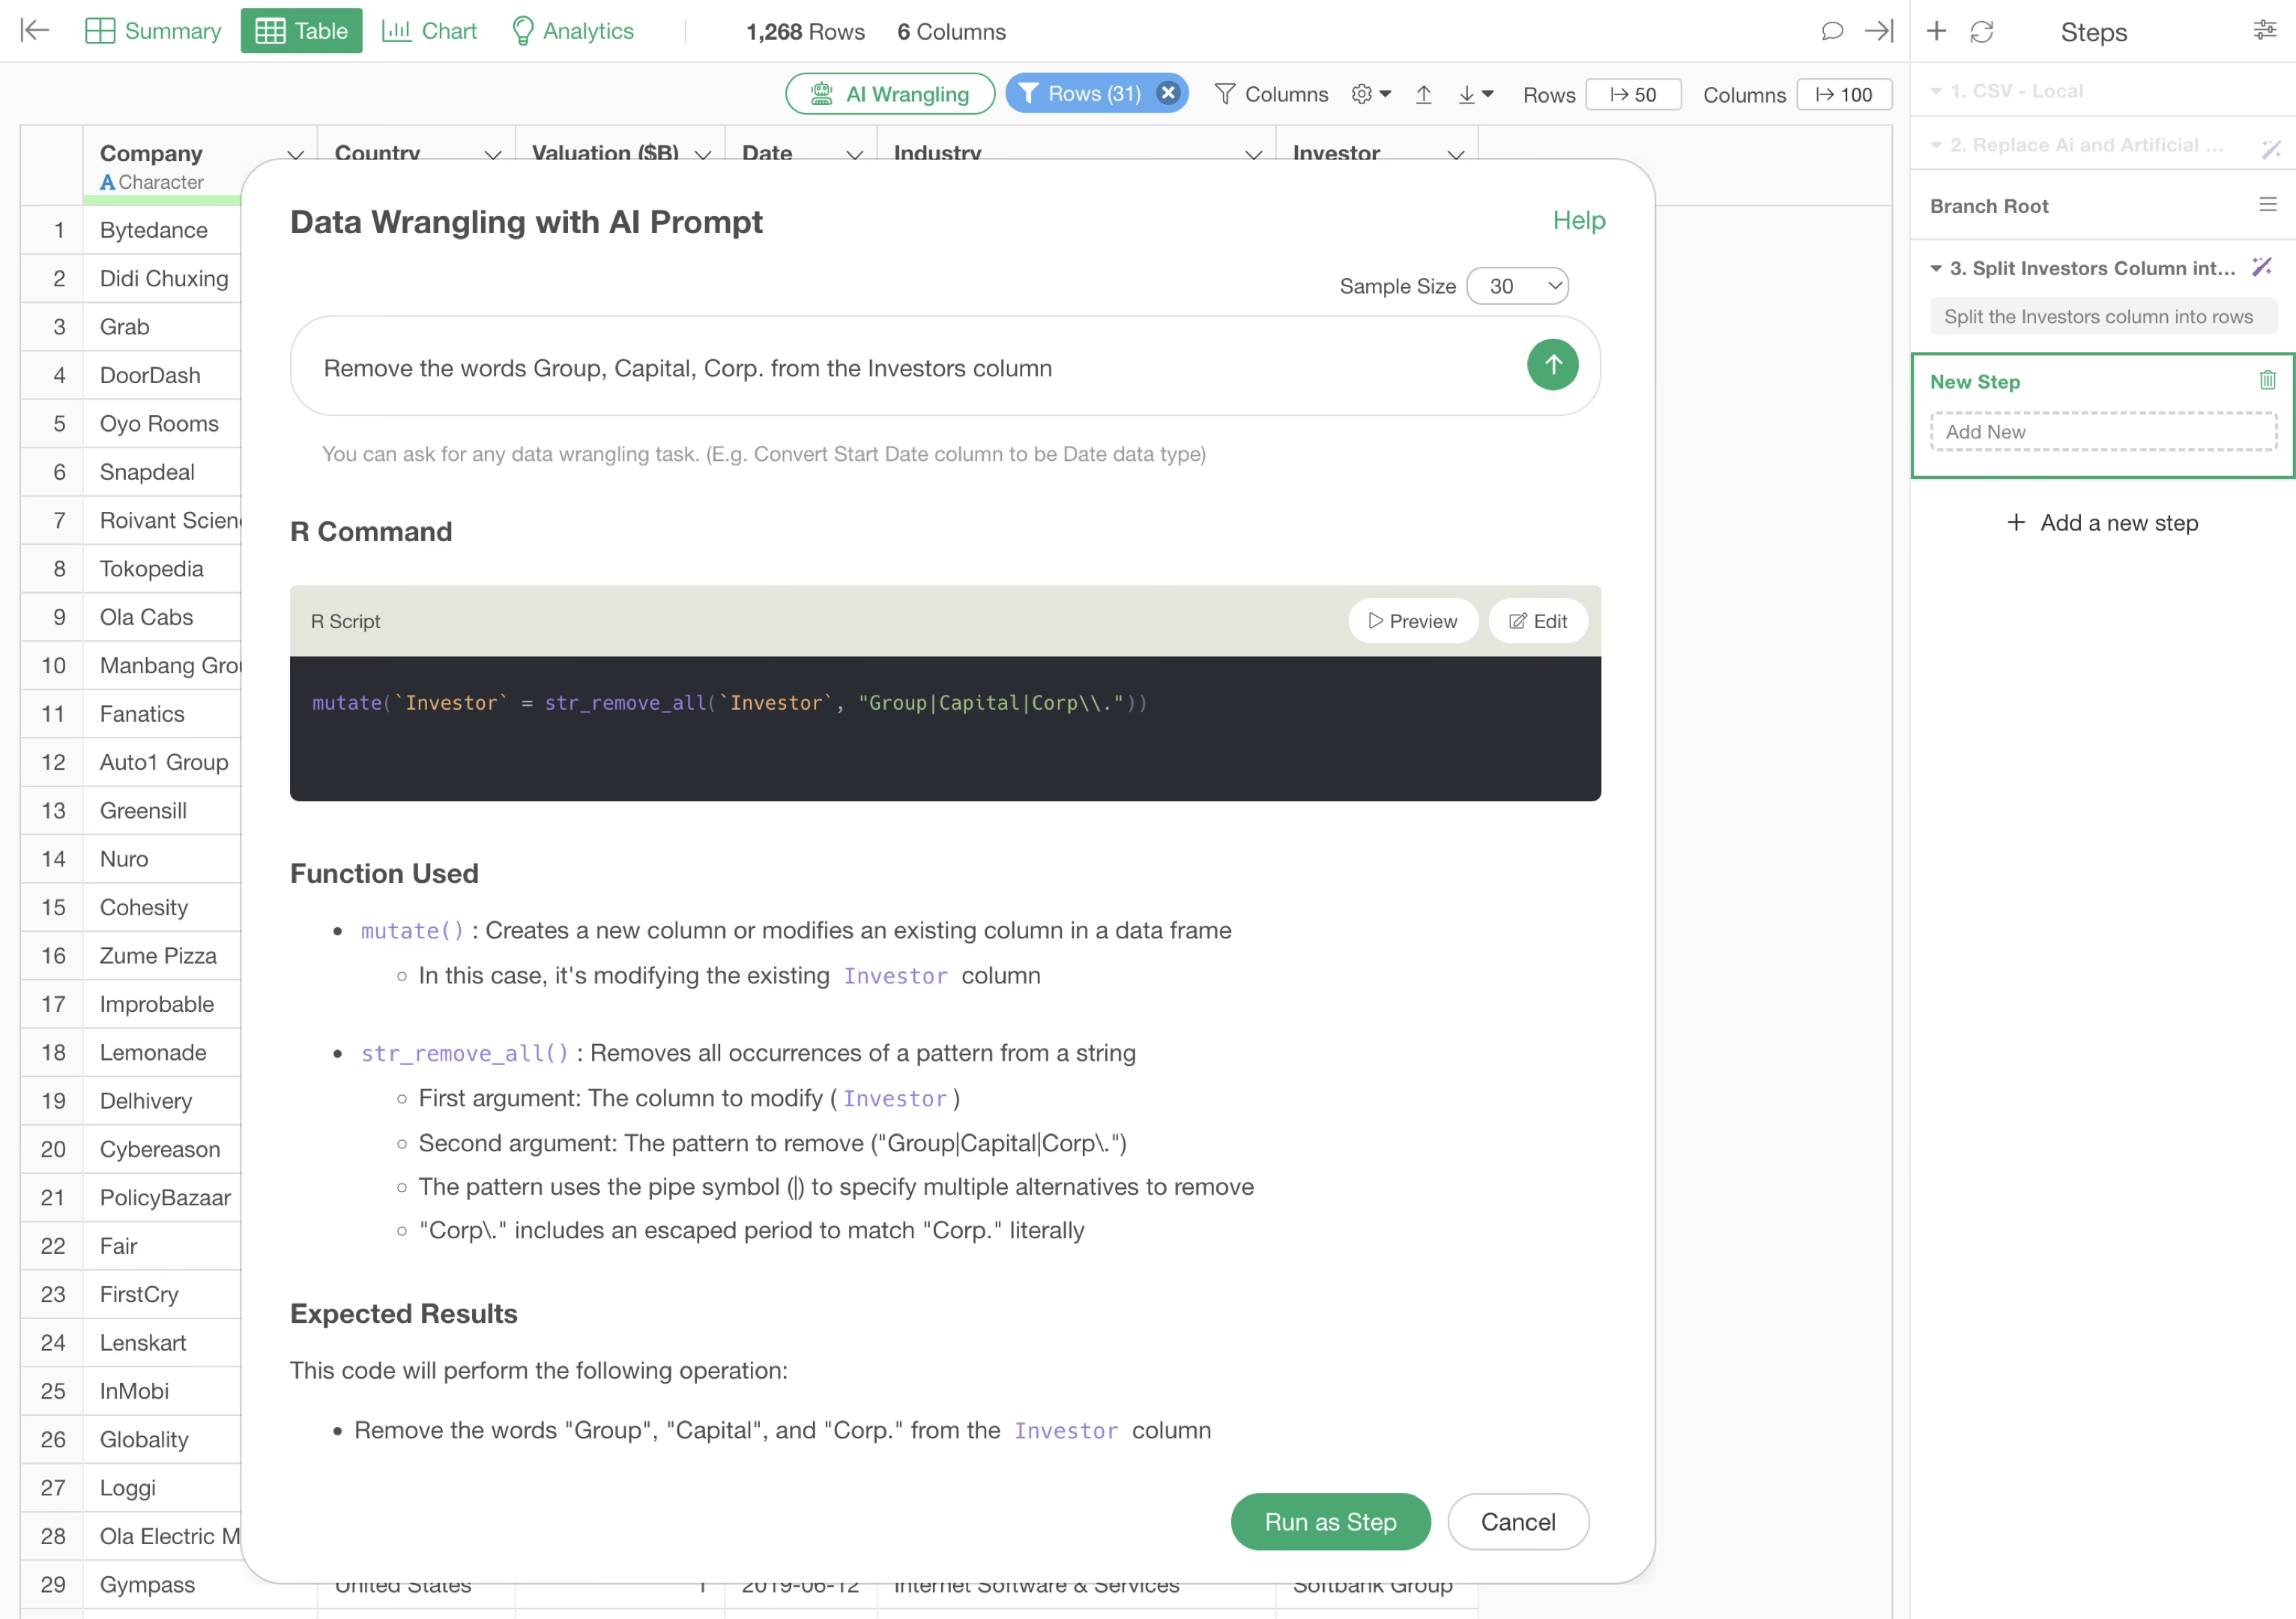
Click the “AI Wrangling” button.
The AI Prompt dialog will appear. Enter the following prompt:
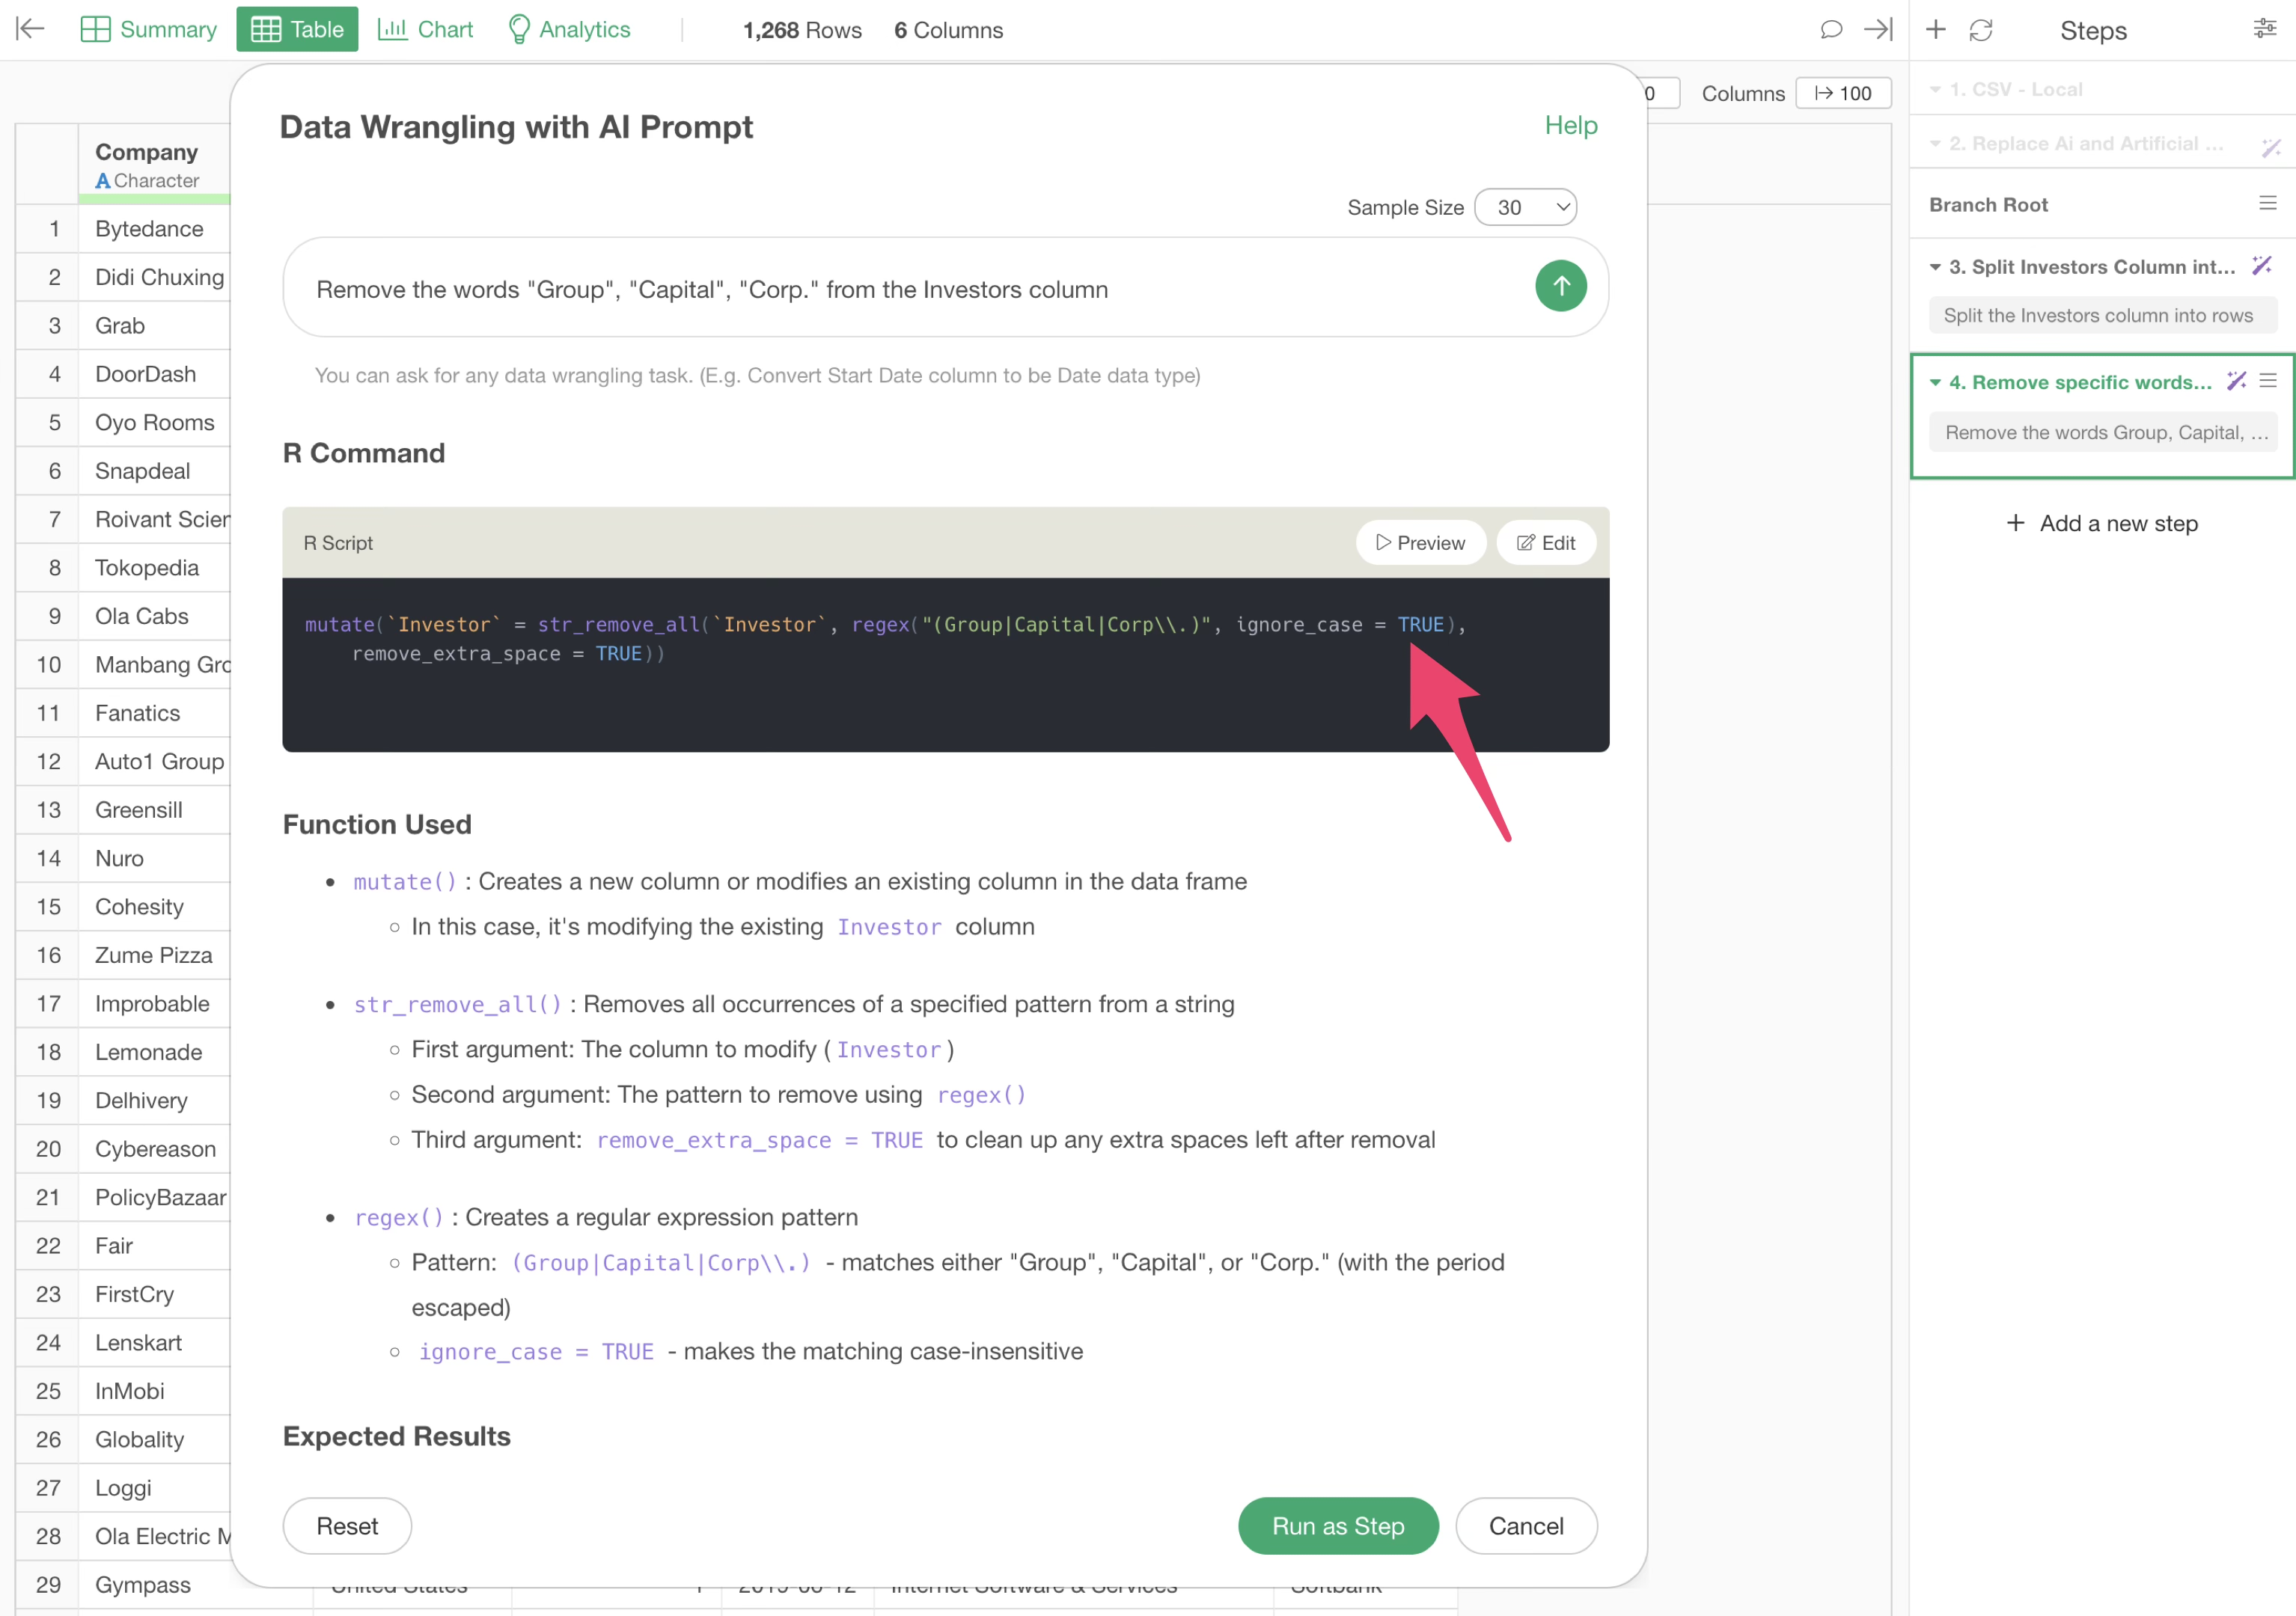
Remove the words Group, Capital, Corp. from the Investors column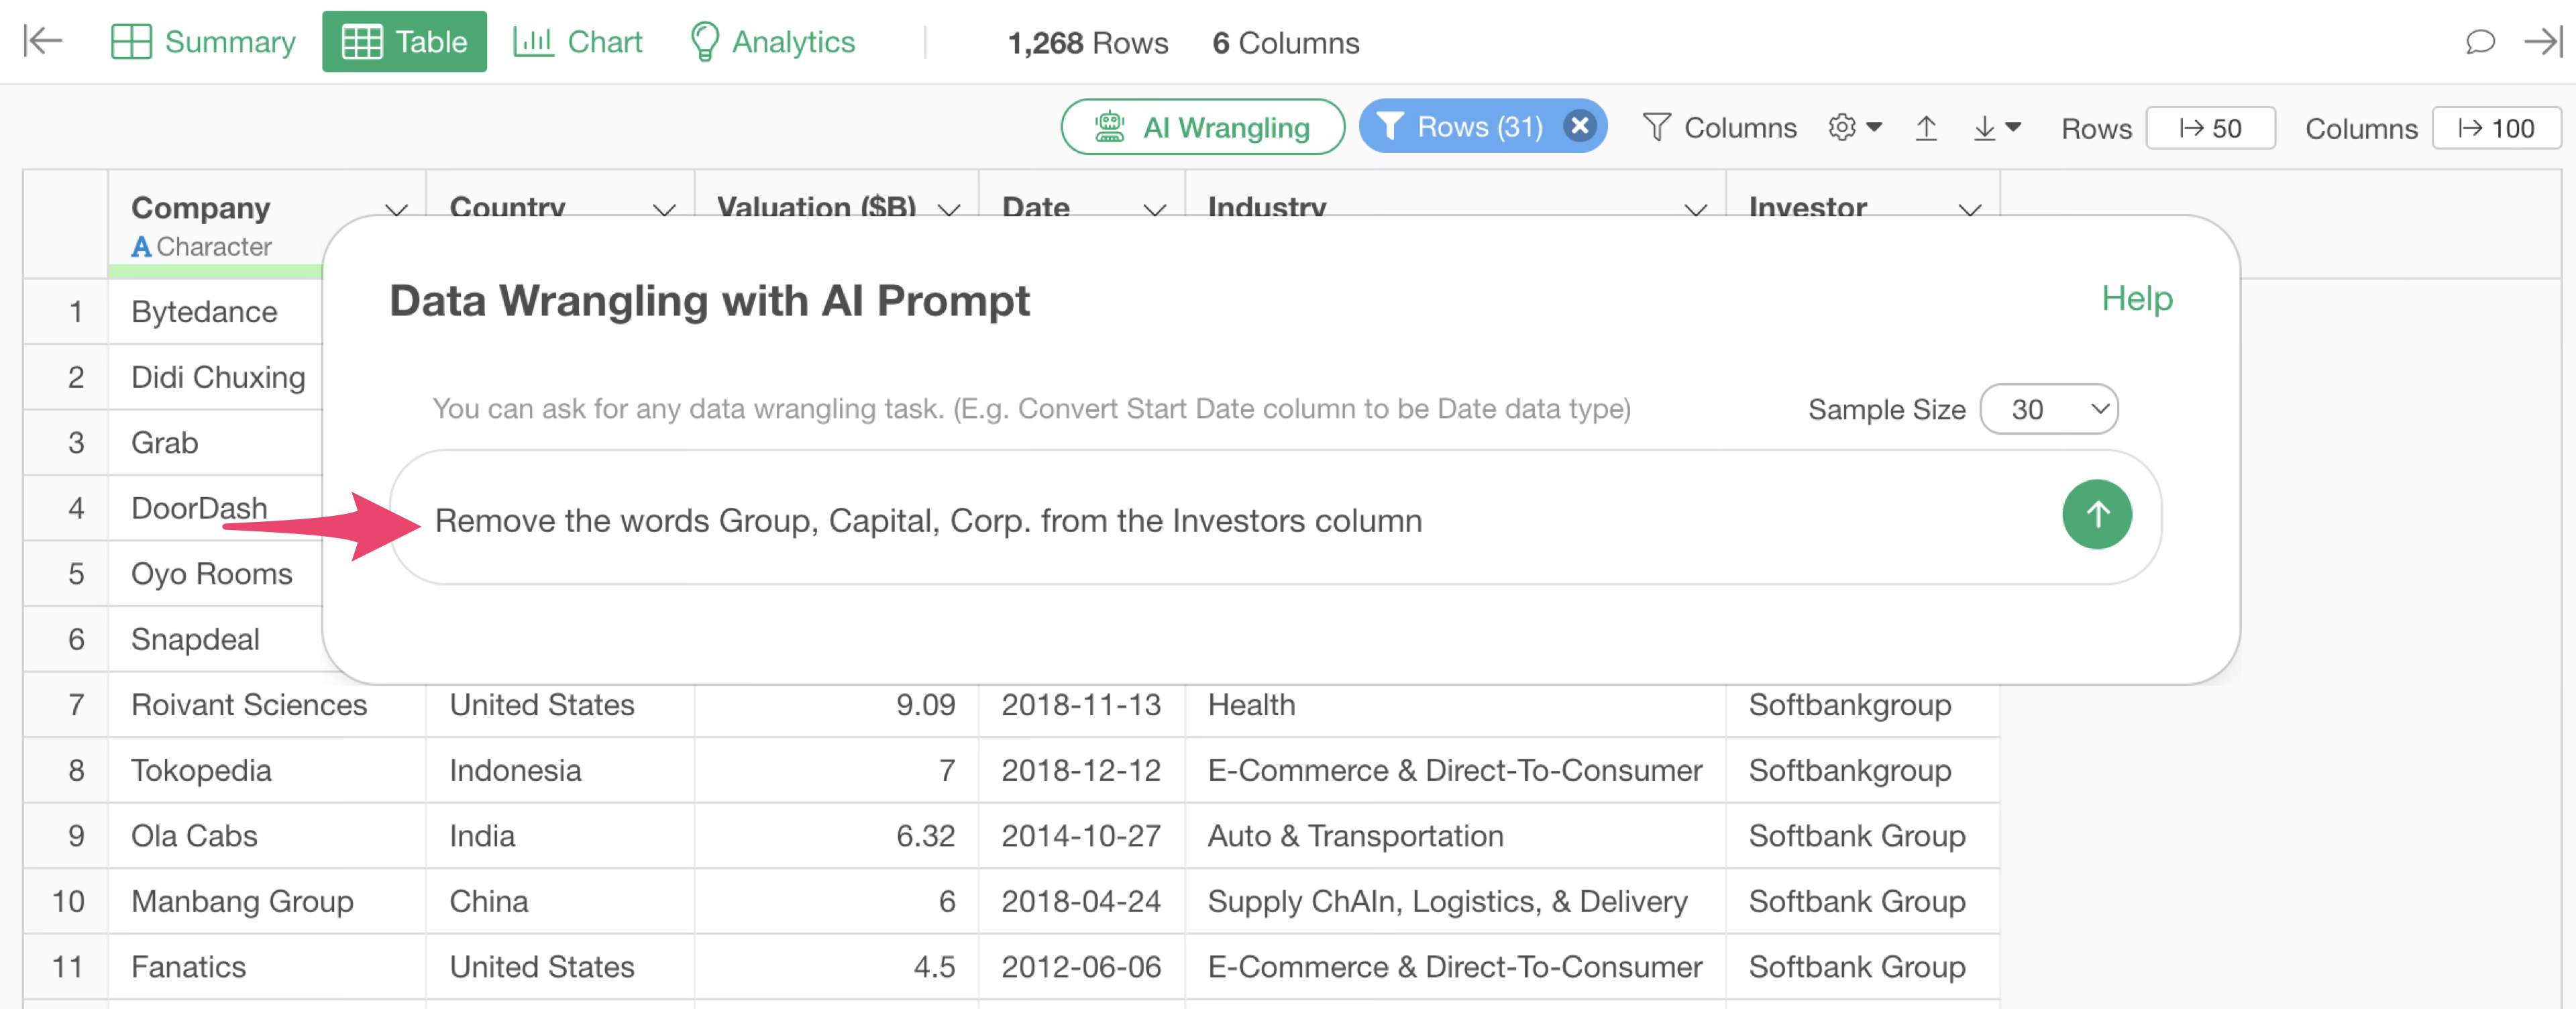
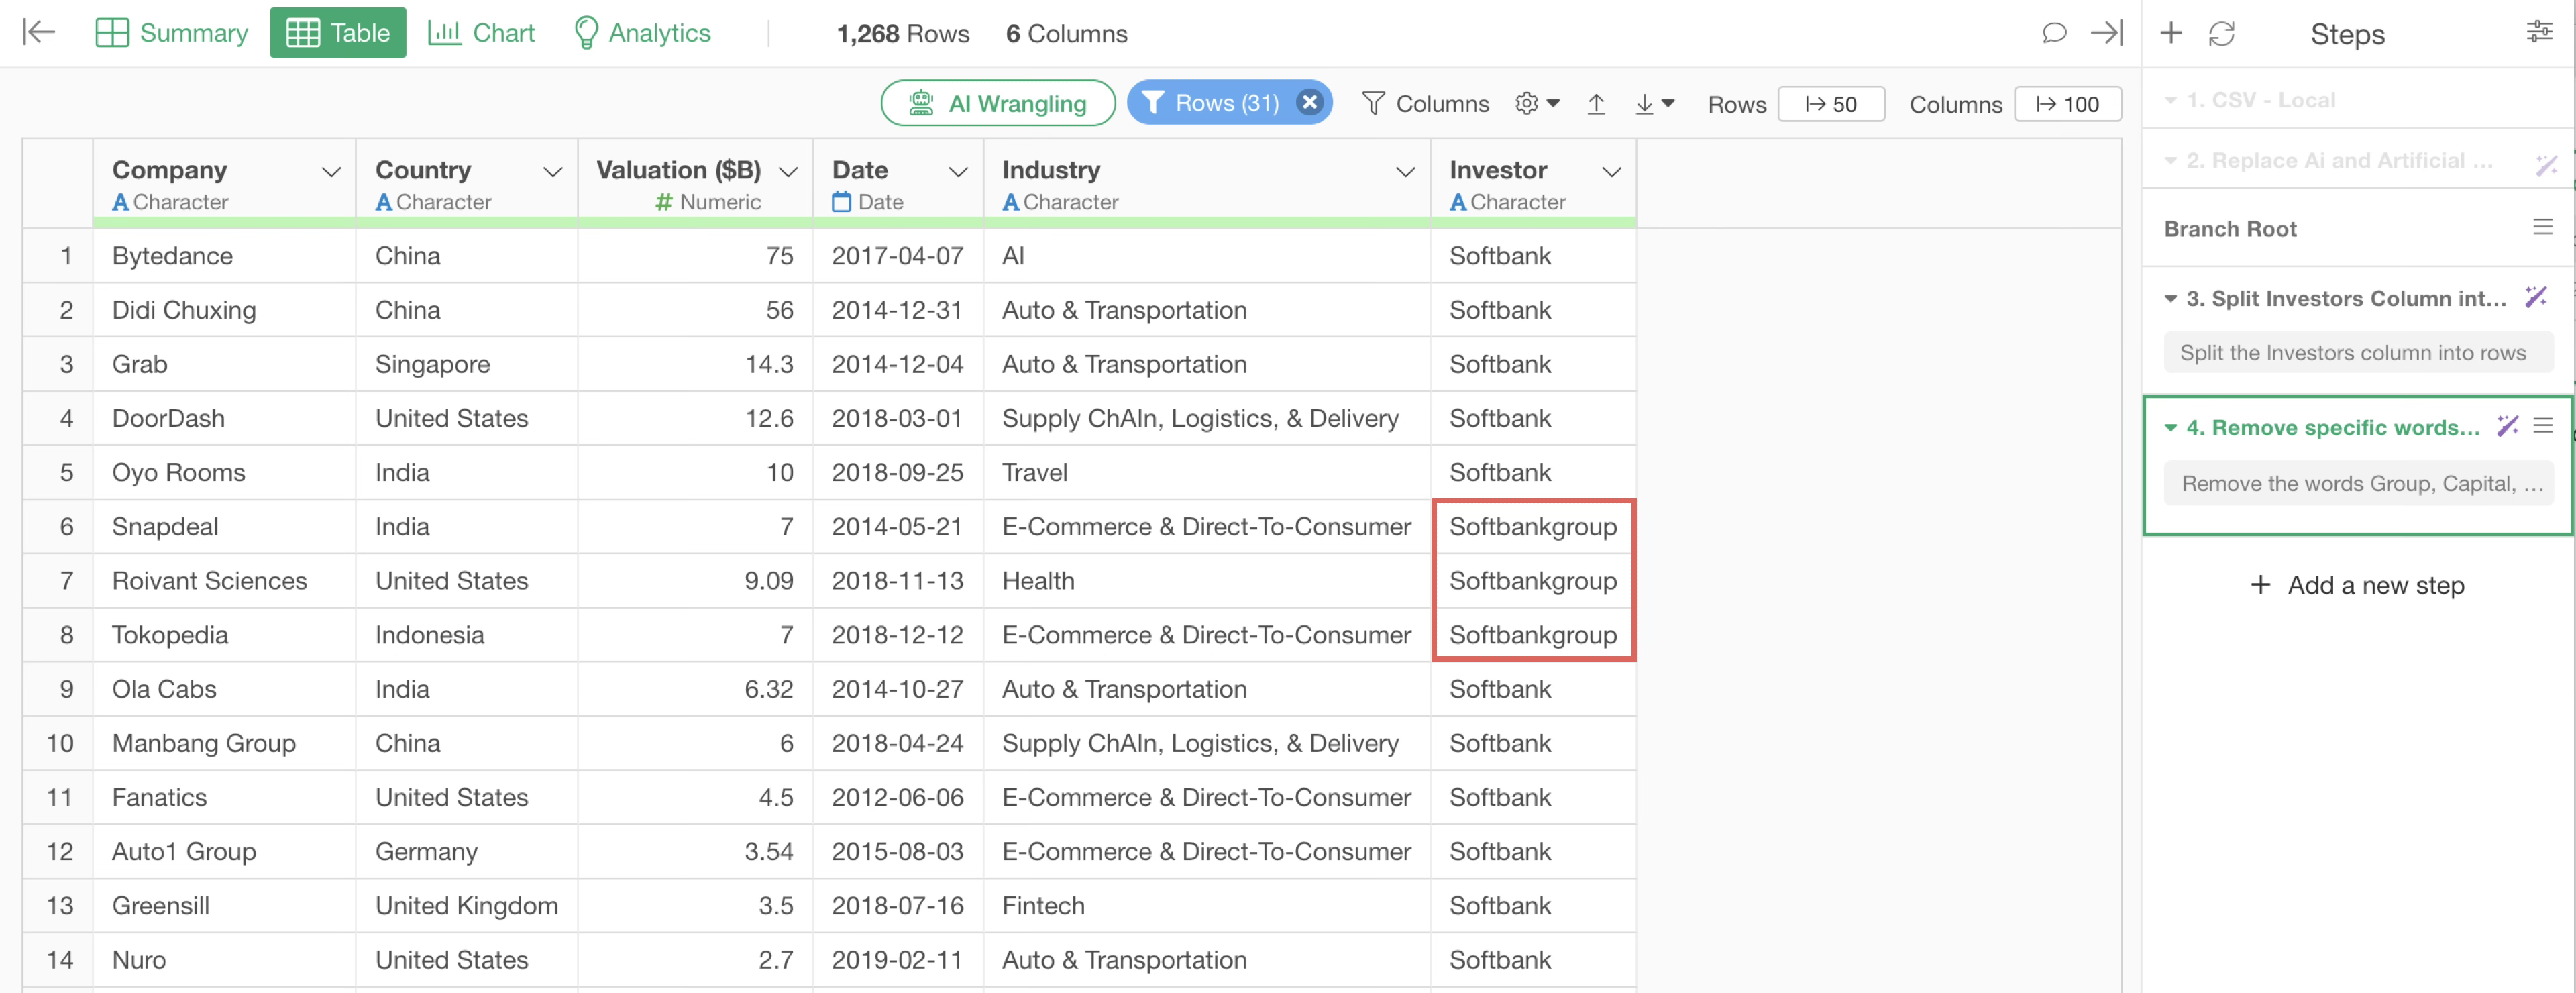
The R script to remove the words “Group”, “Capital”, and “Corp.” from the Investors column will be returned.
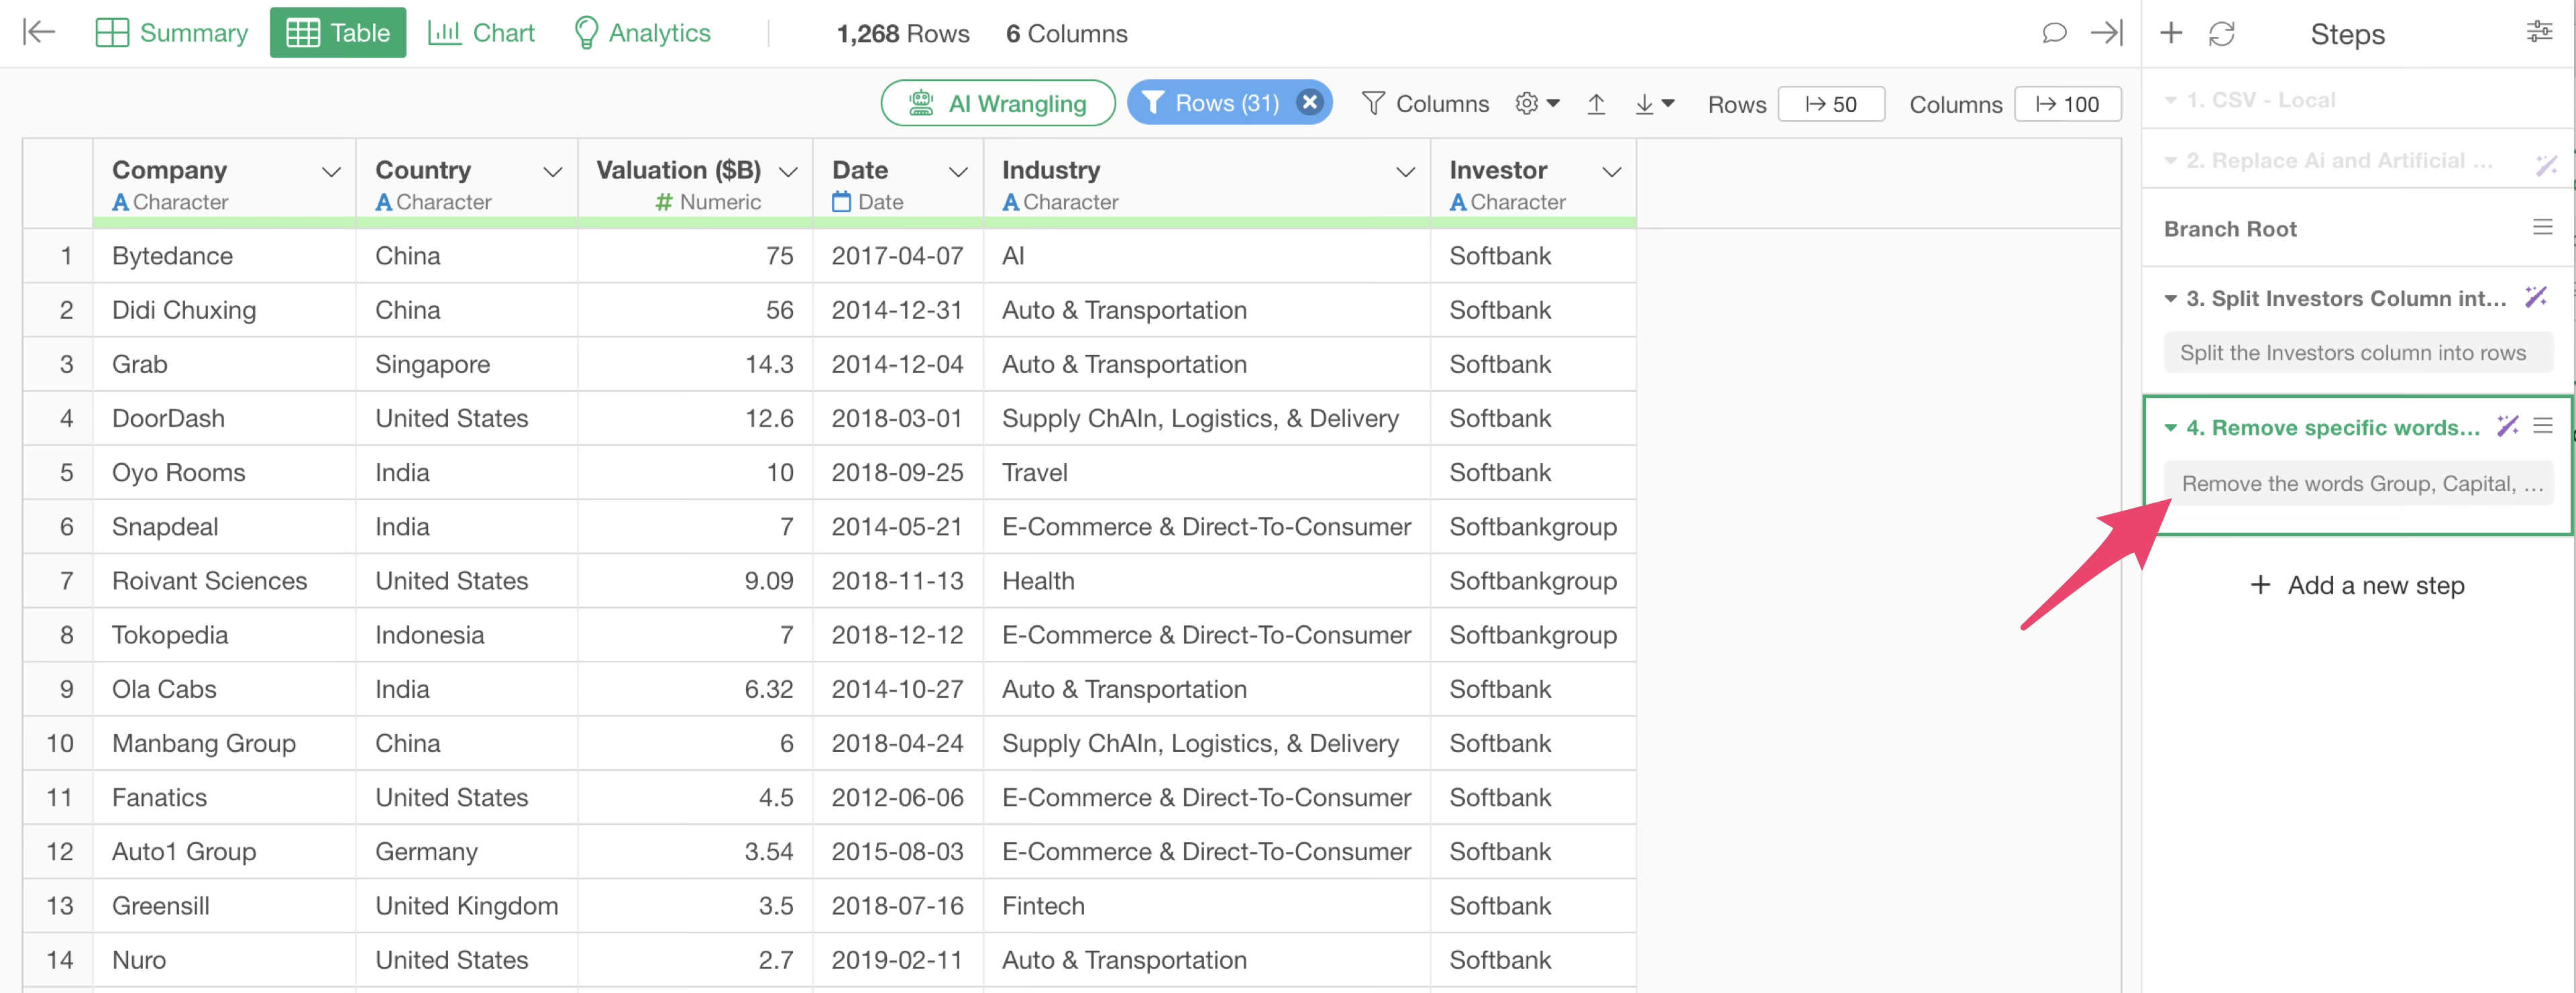
Upon execution, “Group,” “Capital,” and “Corp.” were removed, but “group” in “Softbankgroup” was not.
Click the “Step 4” token where the investor string was removed.
The AI Prompt dialog will appear. Change the prompt as follows, enclosing the values in double quotes:
Remove the words "Group","Capital","Corp." from the Investors column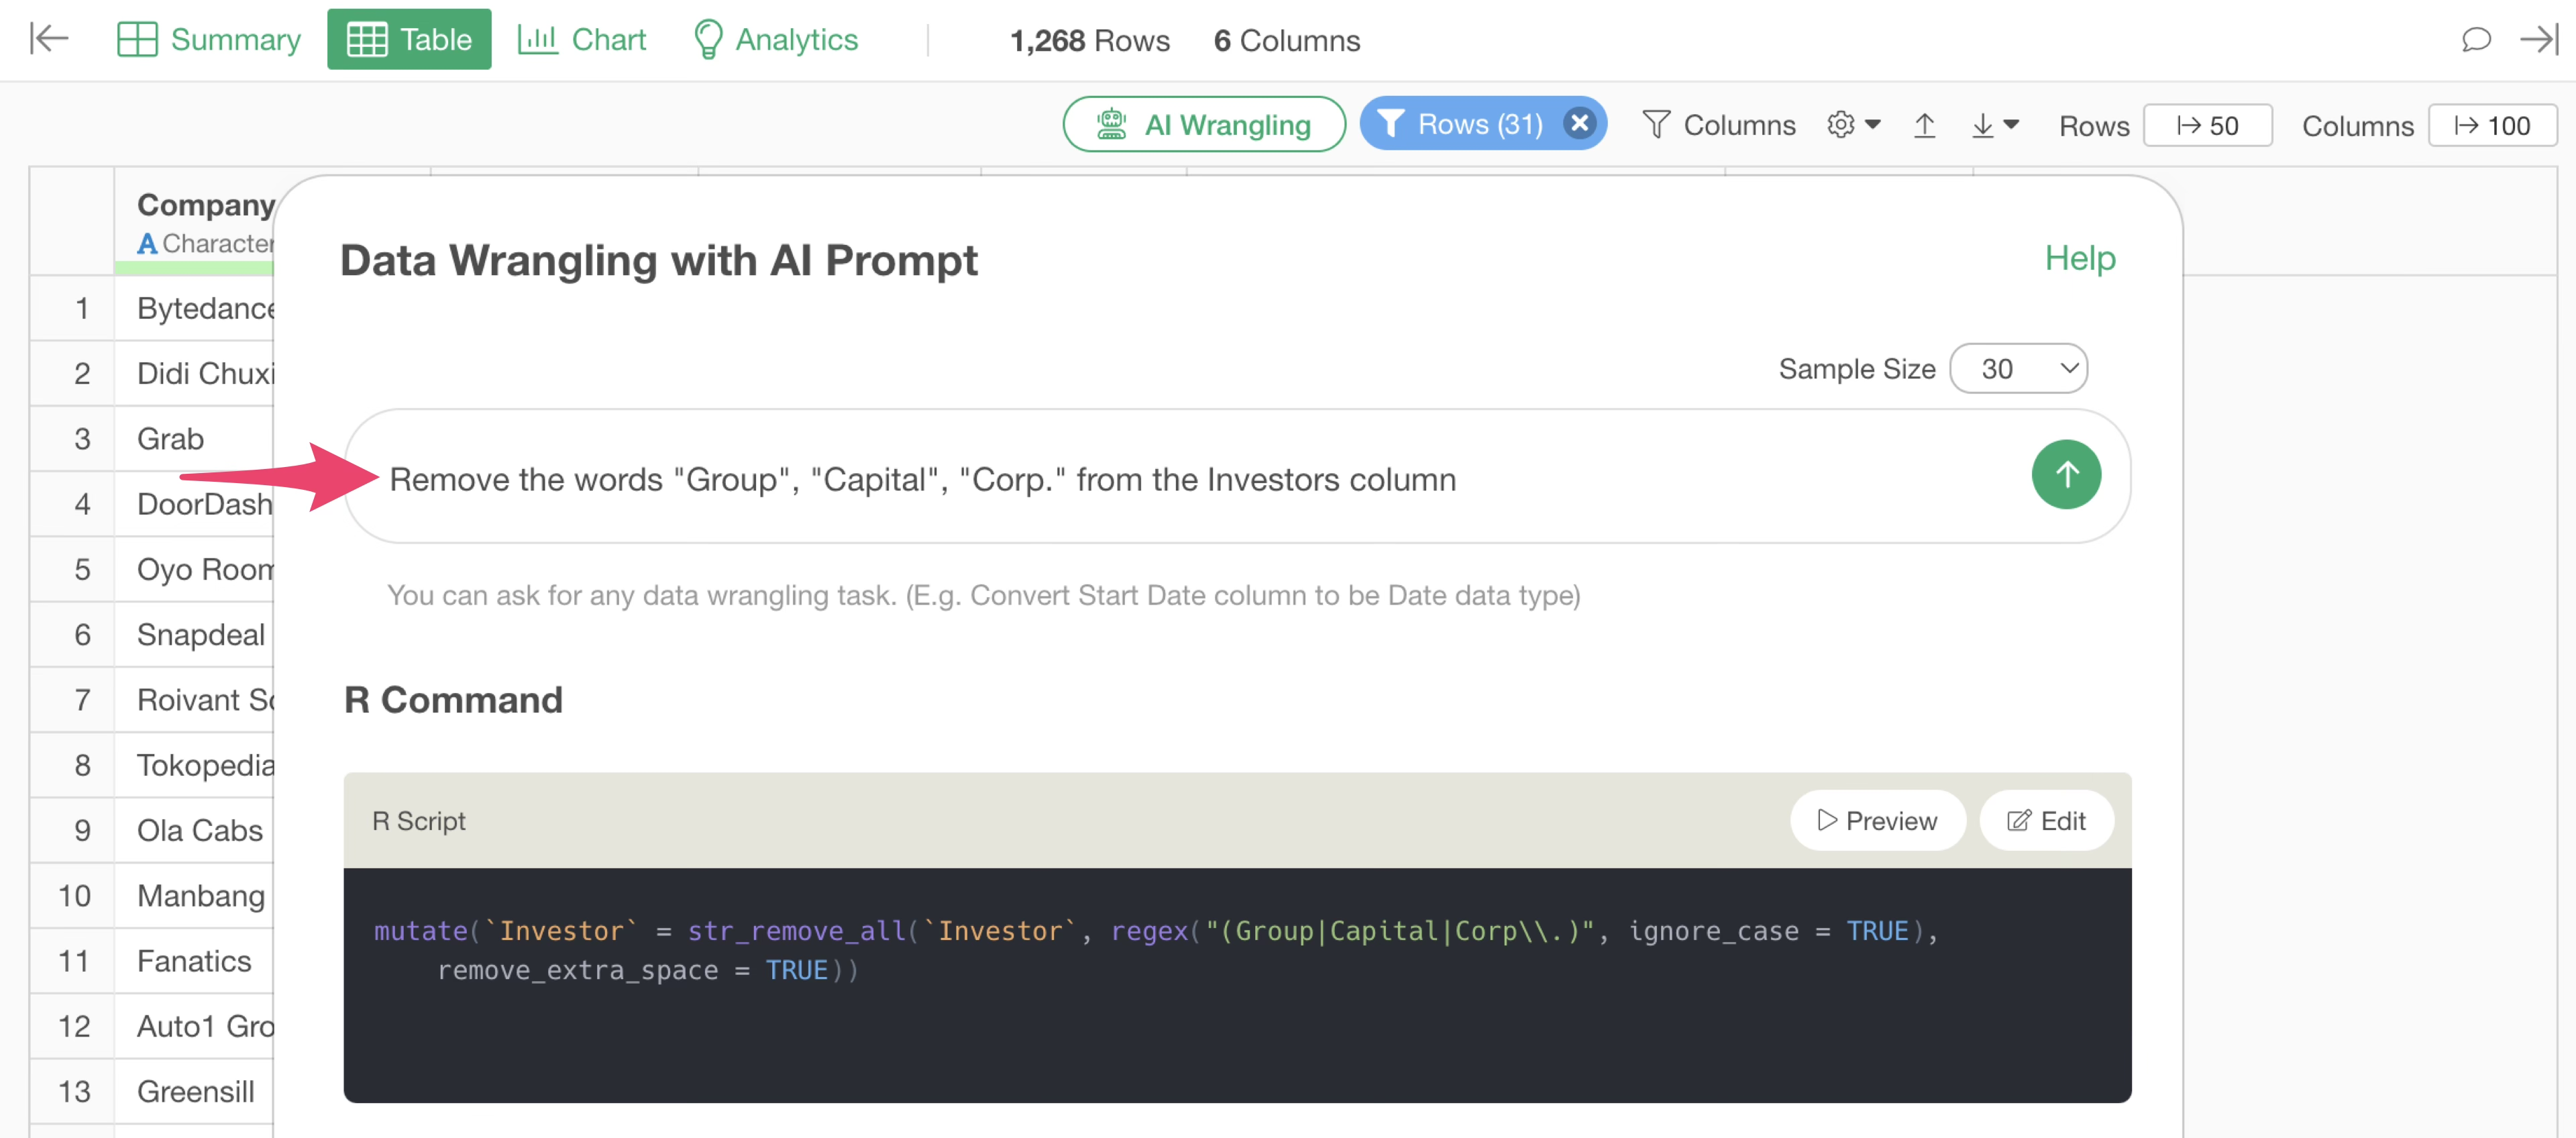
This adds several arguments. For example,
ignore_case = TRUE allows processing to ignore case.
By executing this, the lowercase “group” can also be removed.
Debugging with Preview
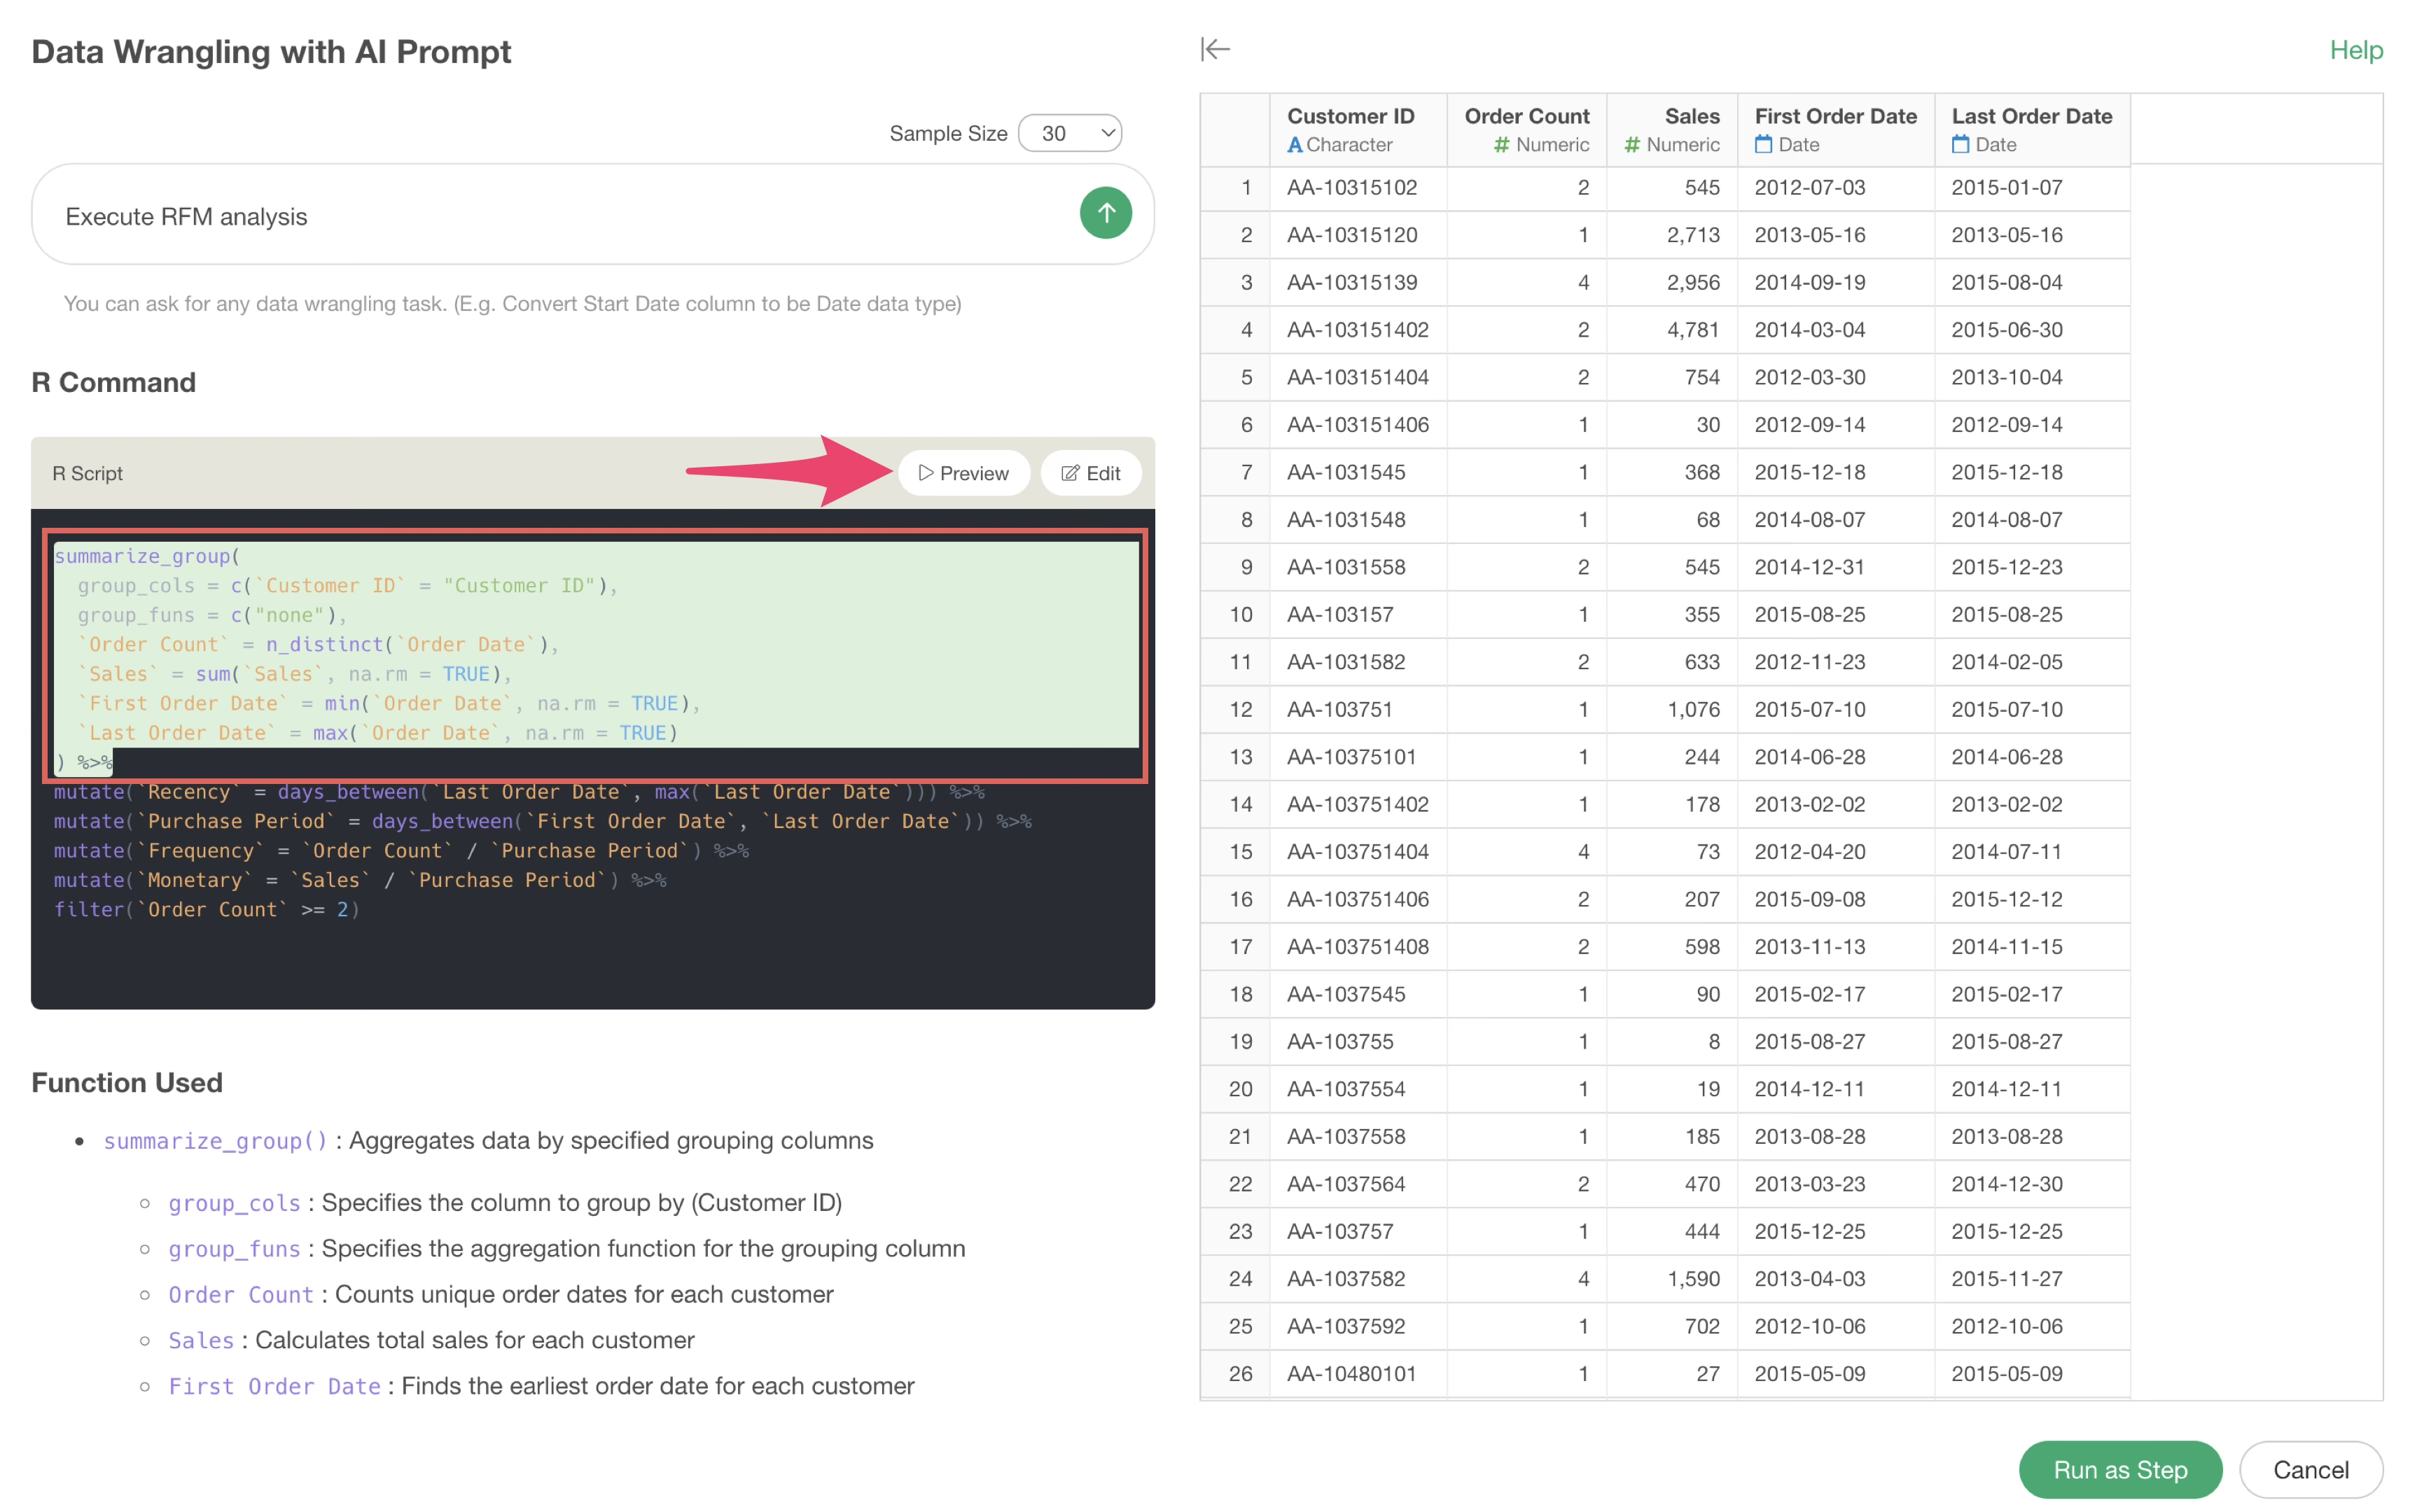
By previewing the R script output by AI Prompt, you can check the processing results when executed.
AI Prompt may sometimes output R scripts that chain multiple functions with pipes (%>%), but it is possible to debug by checking the execution results of each function.
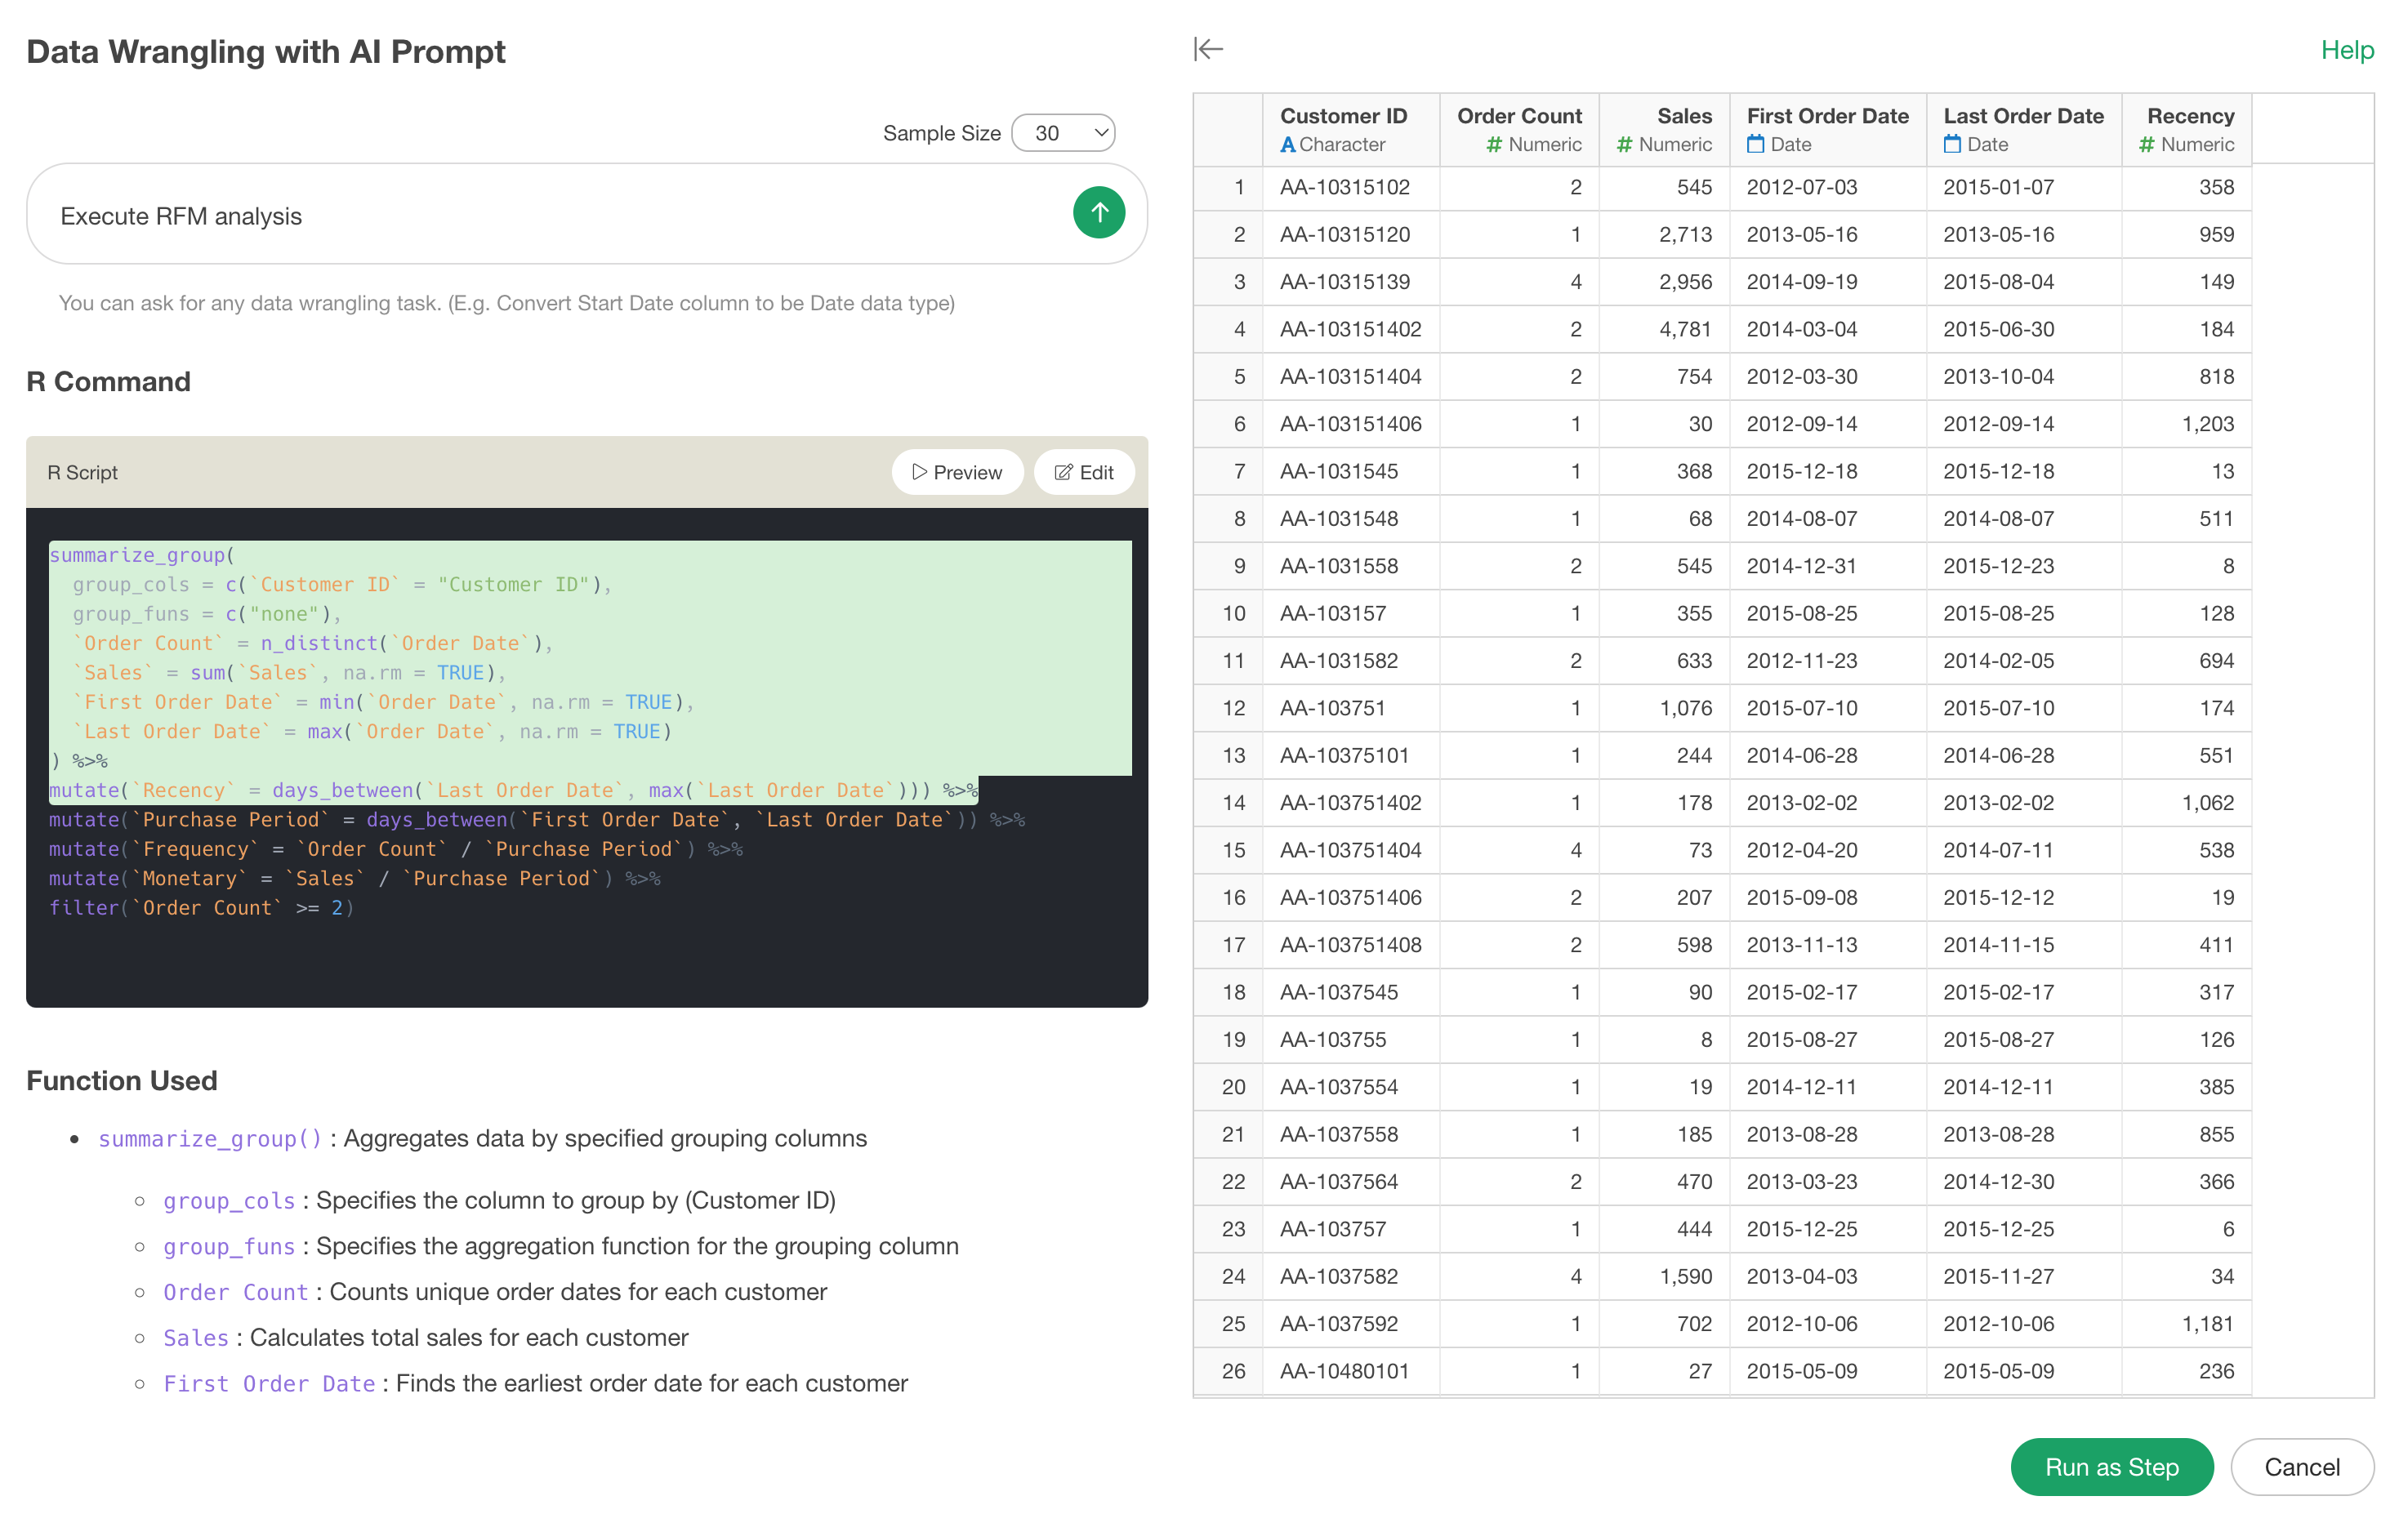
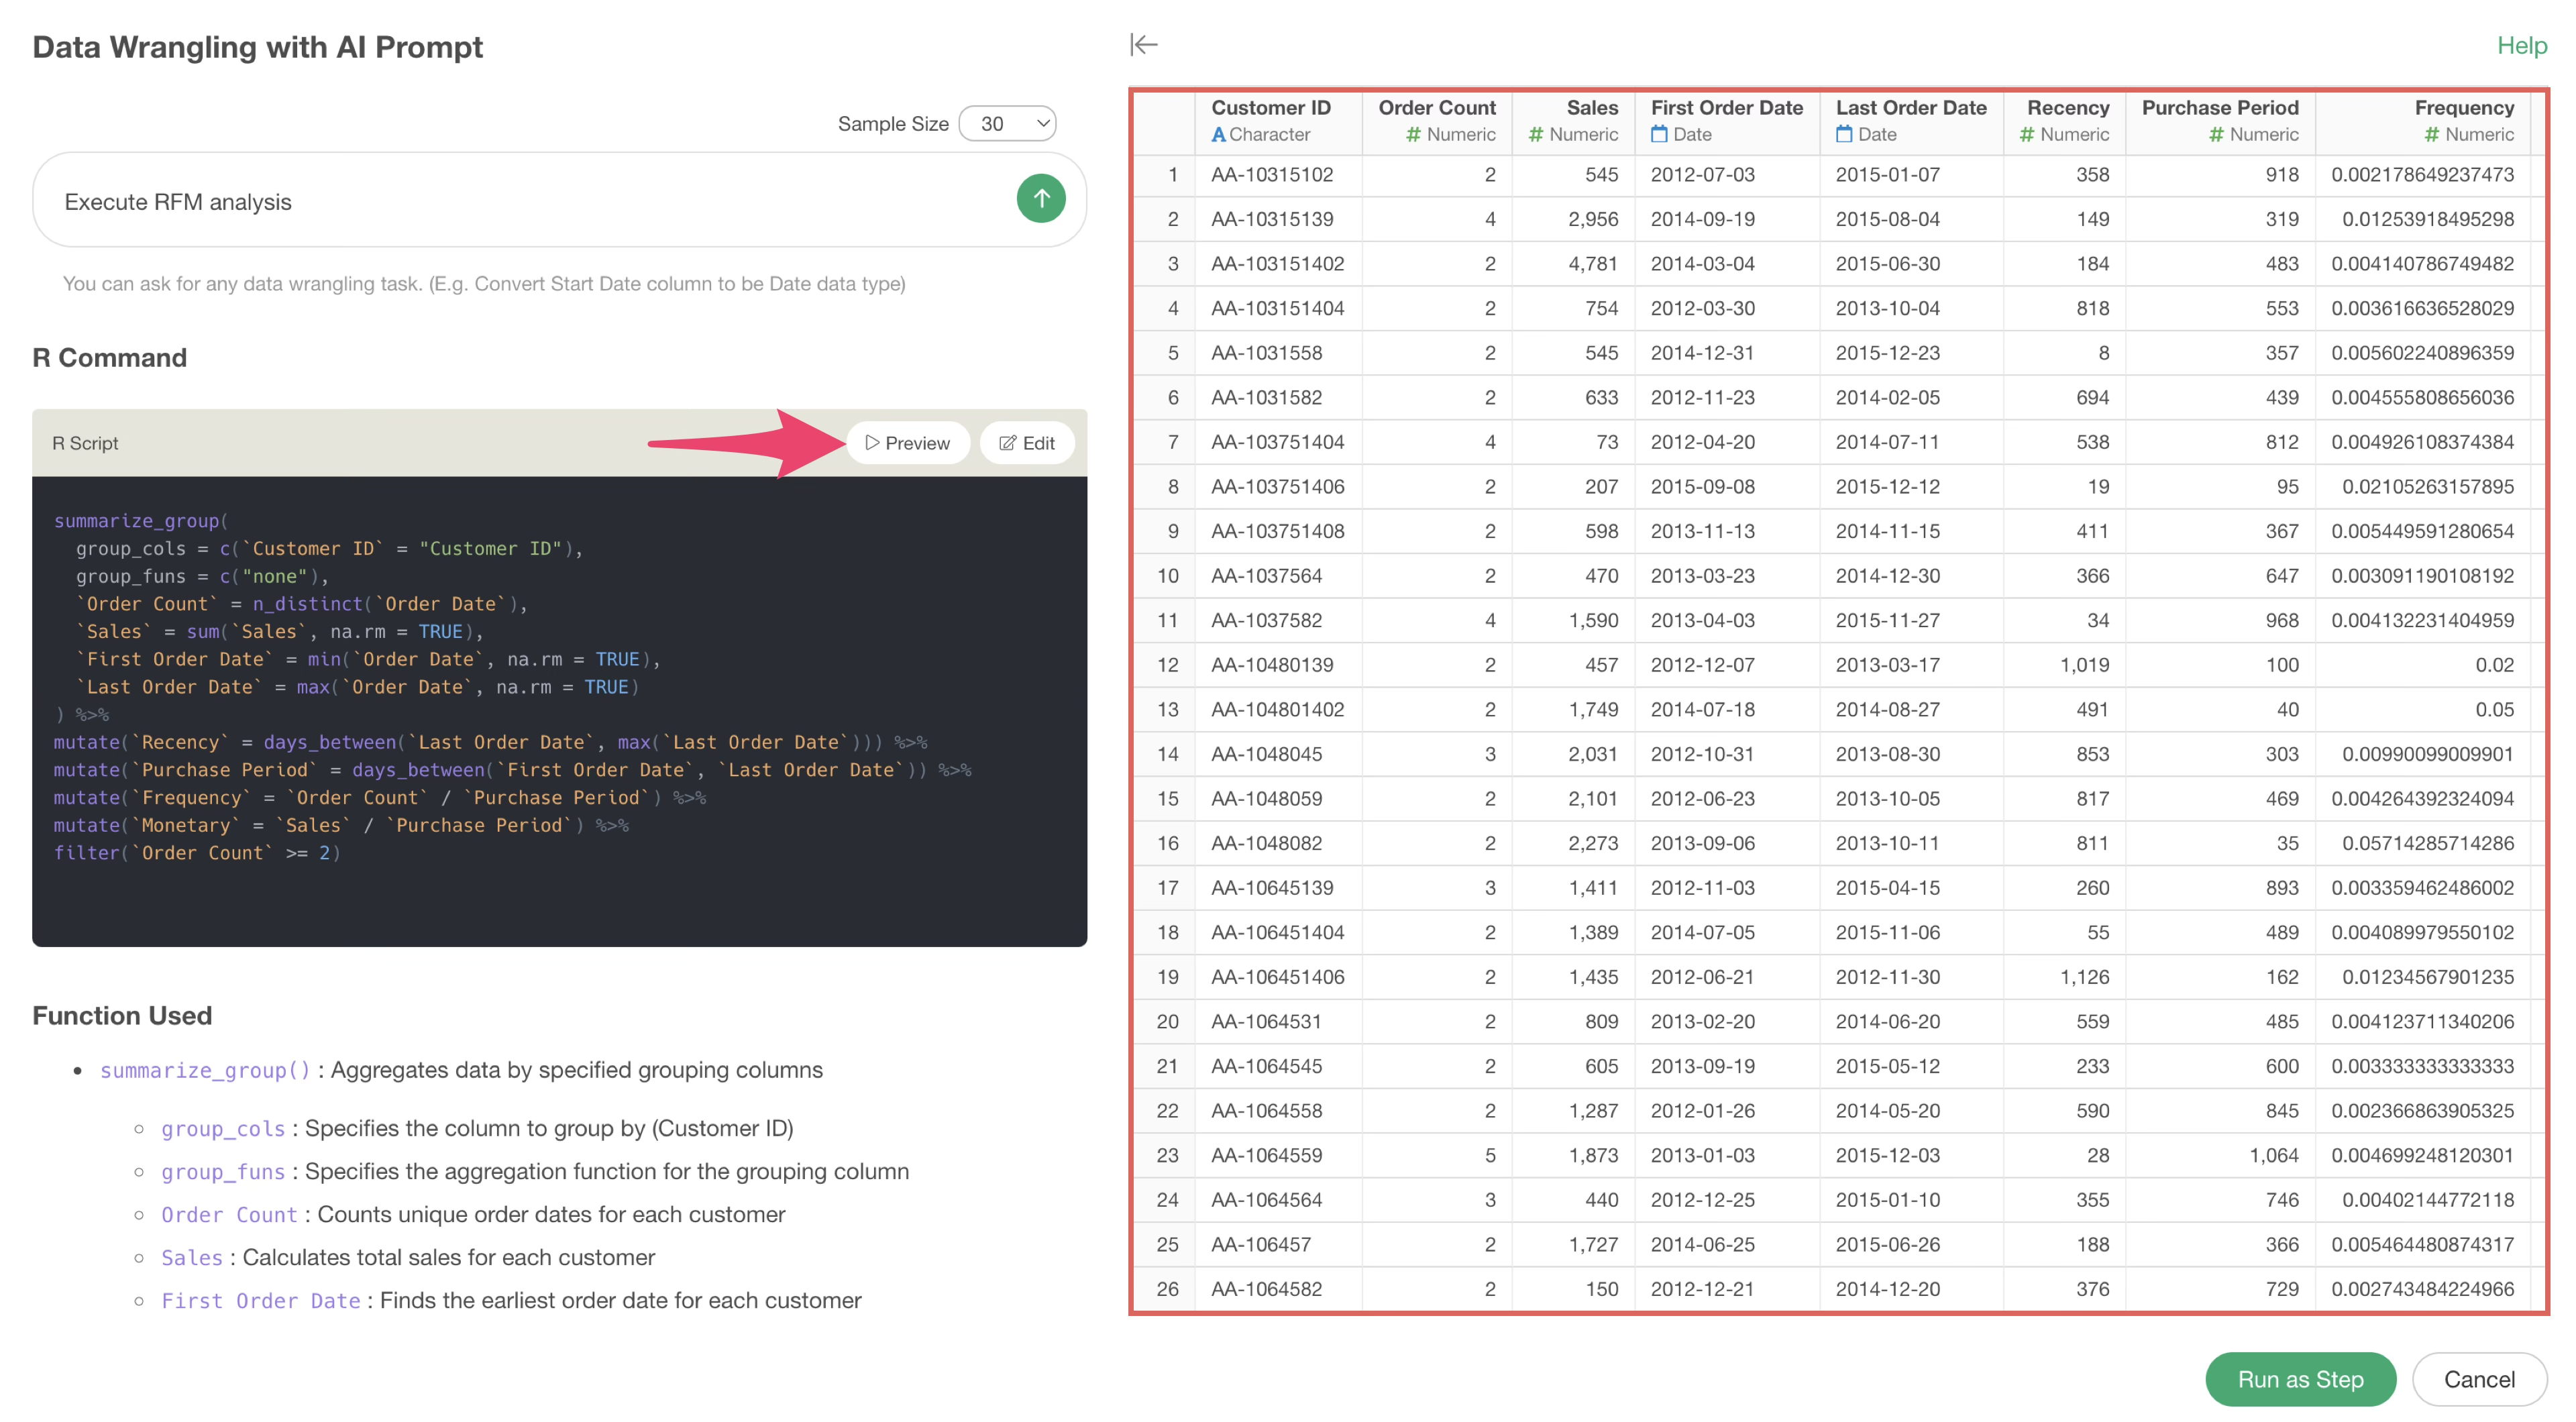
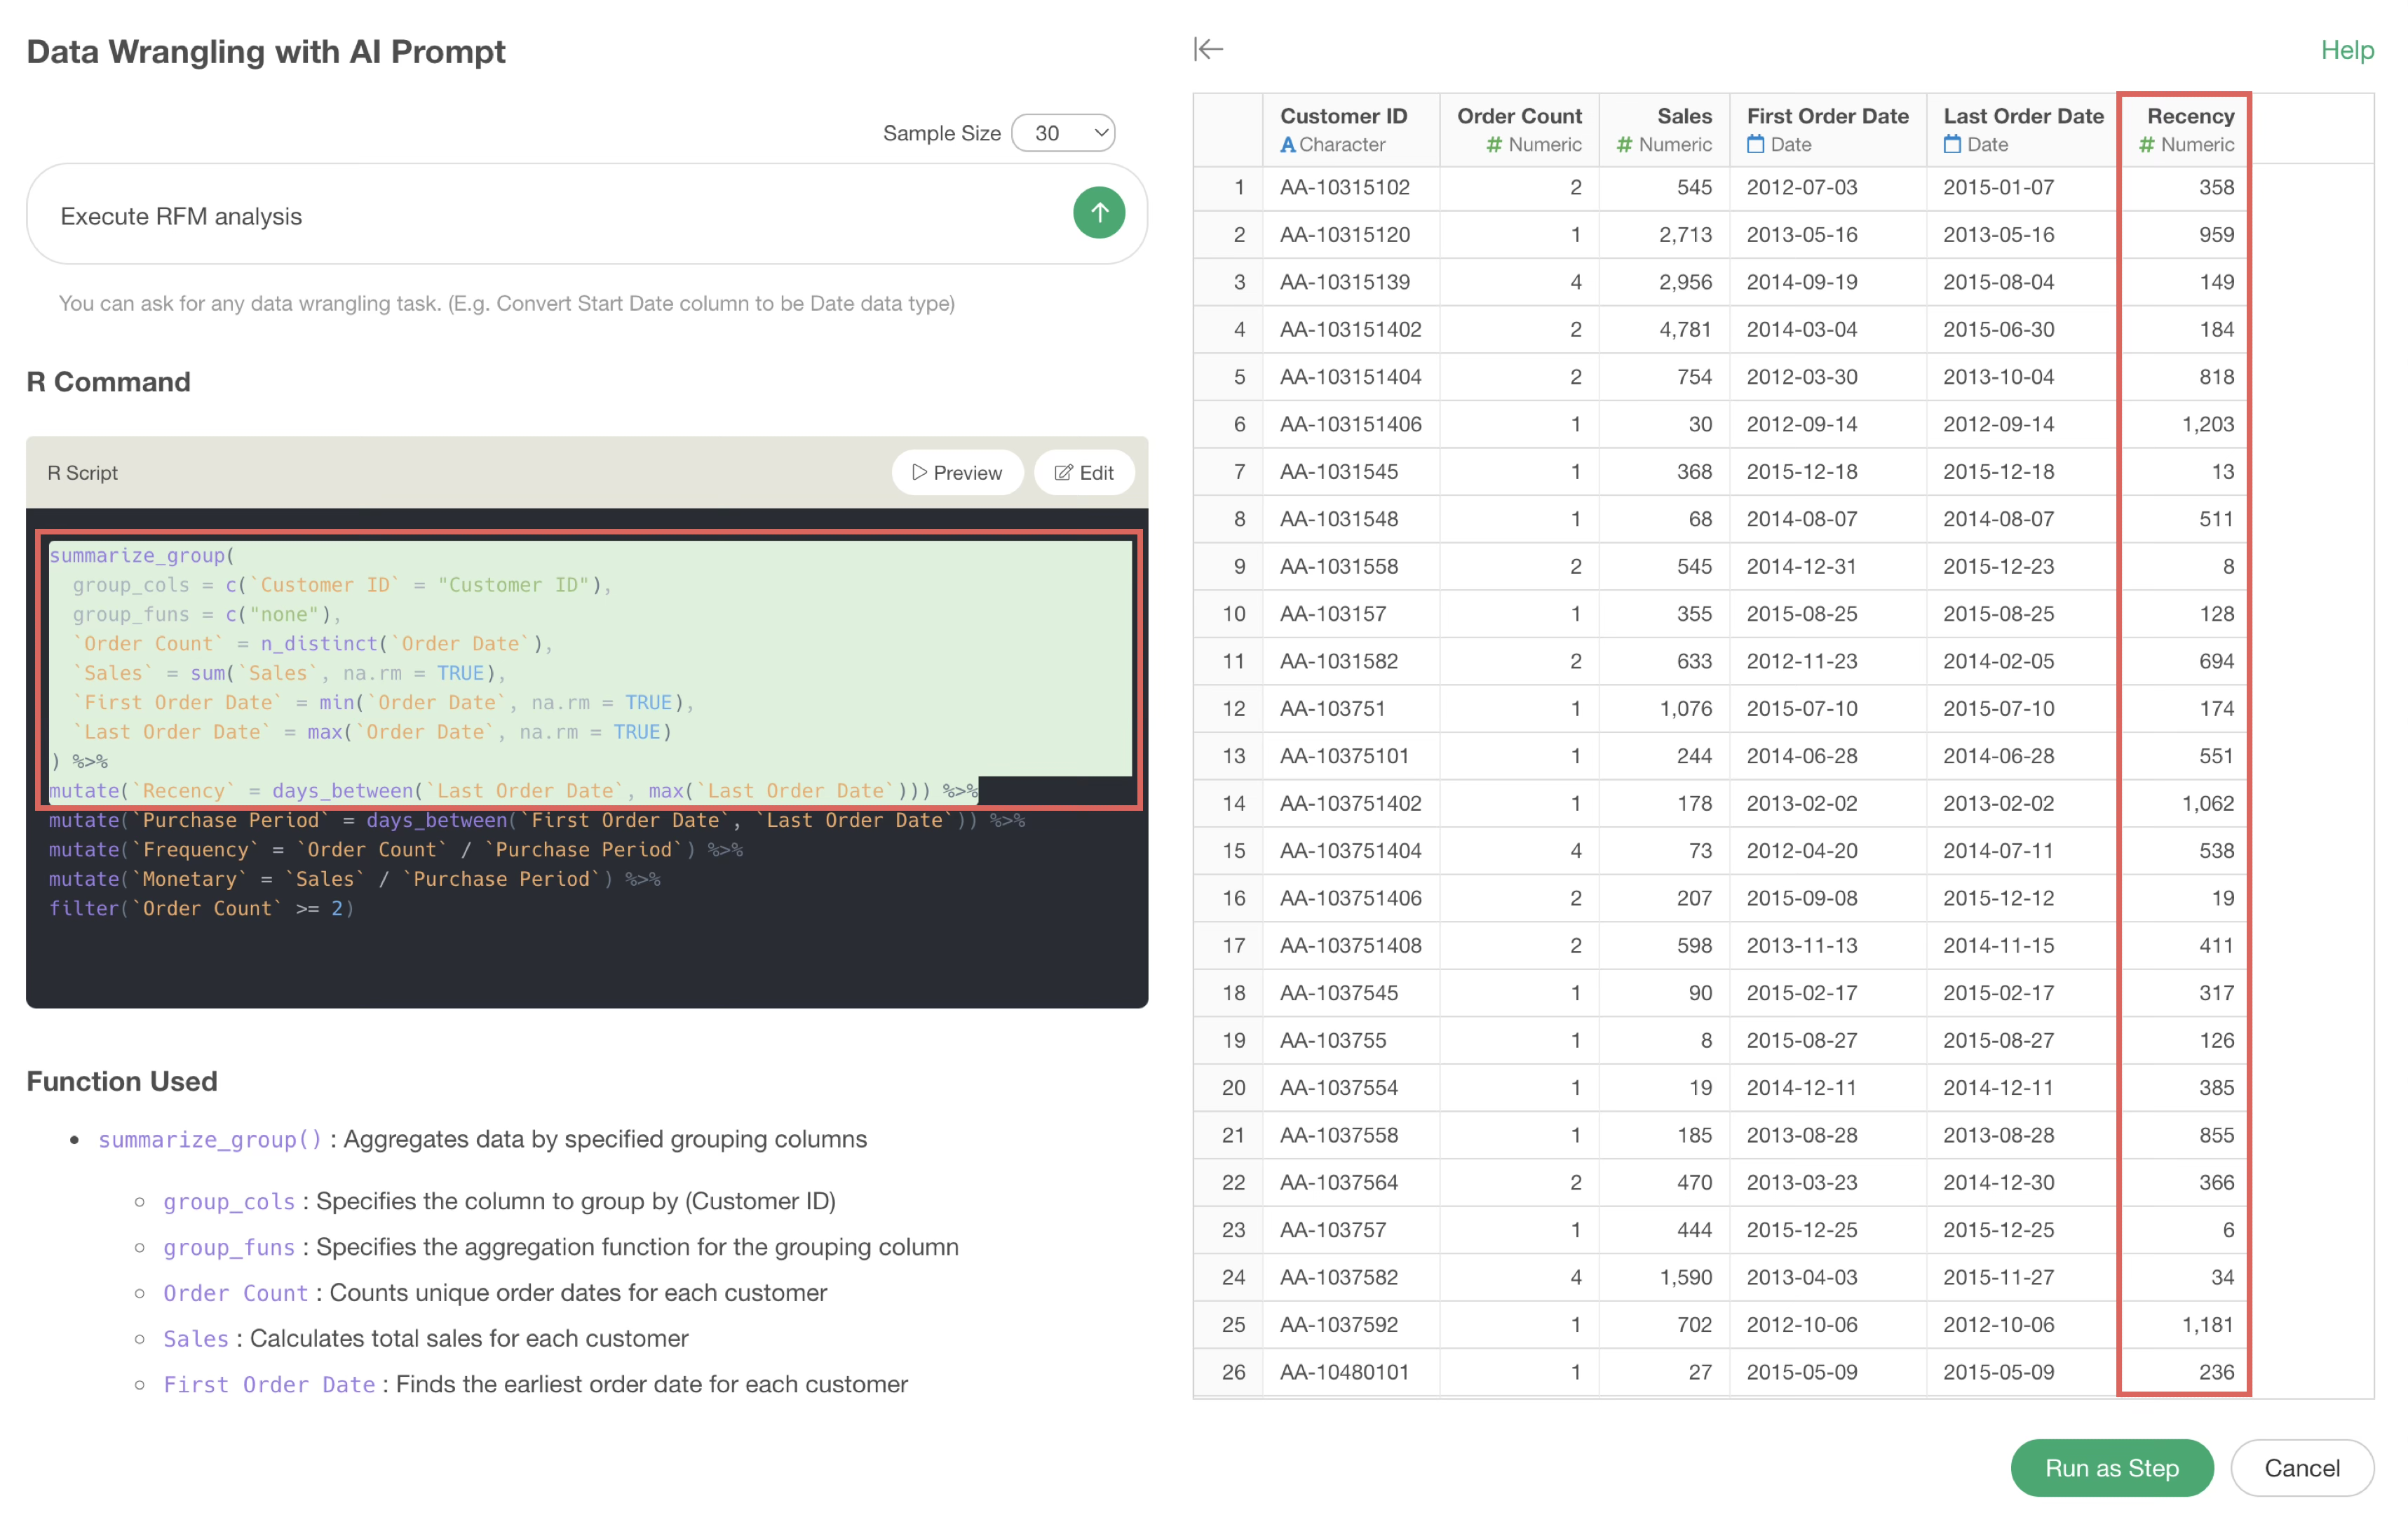
For example, the following uses functions to executeRFM analysis. By clicking on the desired function and then previewing, you can check the execution results up to that point.
In the following case, it can be seen that the Recency column has been added by the second calculation (mutate function).
Auto Fix for Errors
Occasionally, errors may occur when using AI Prompt.
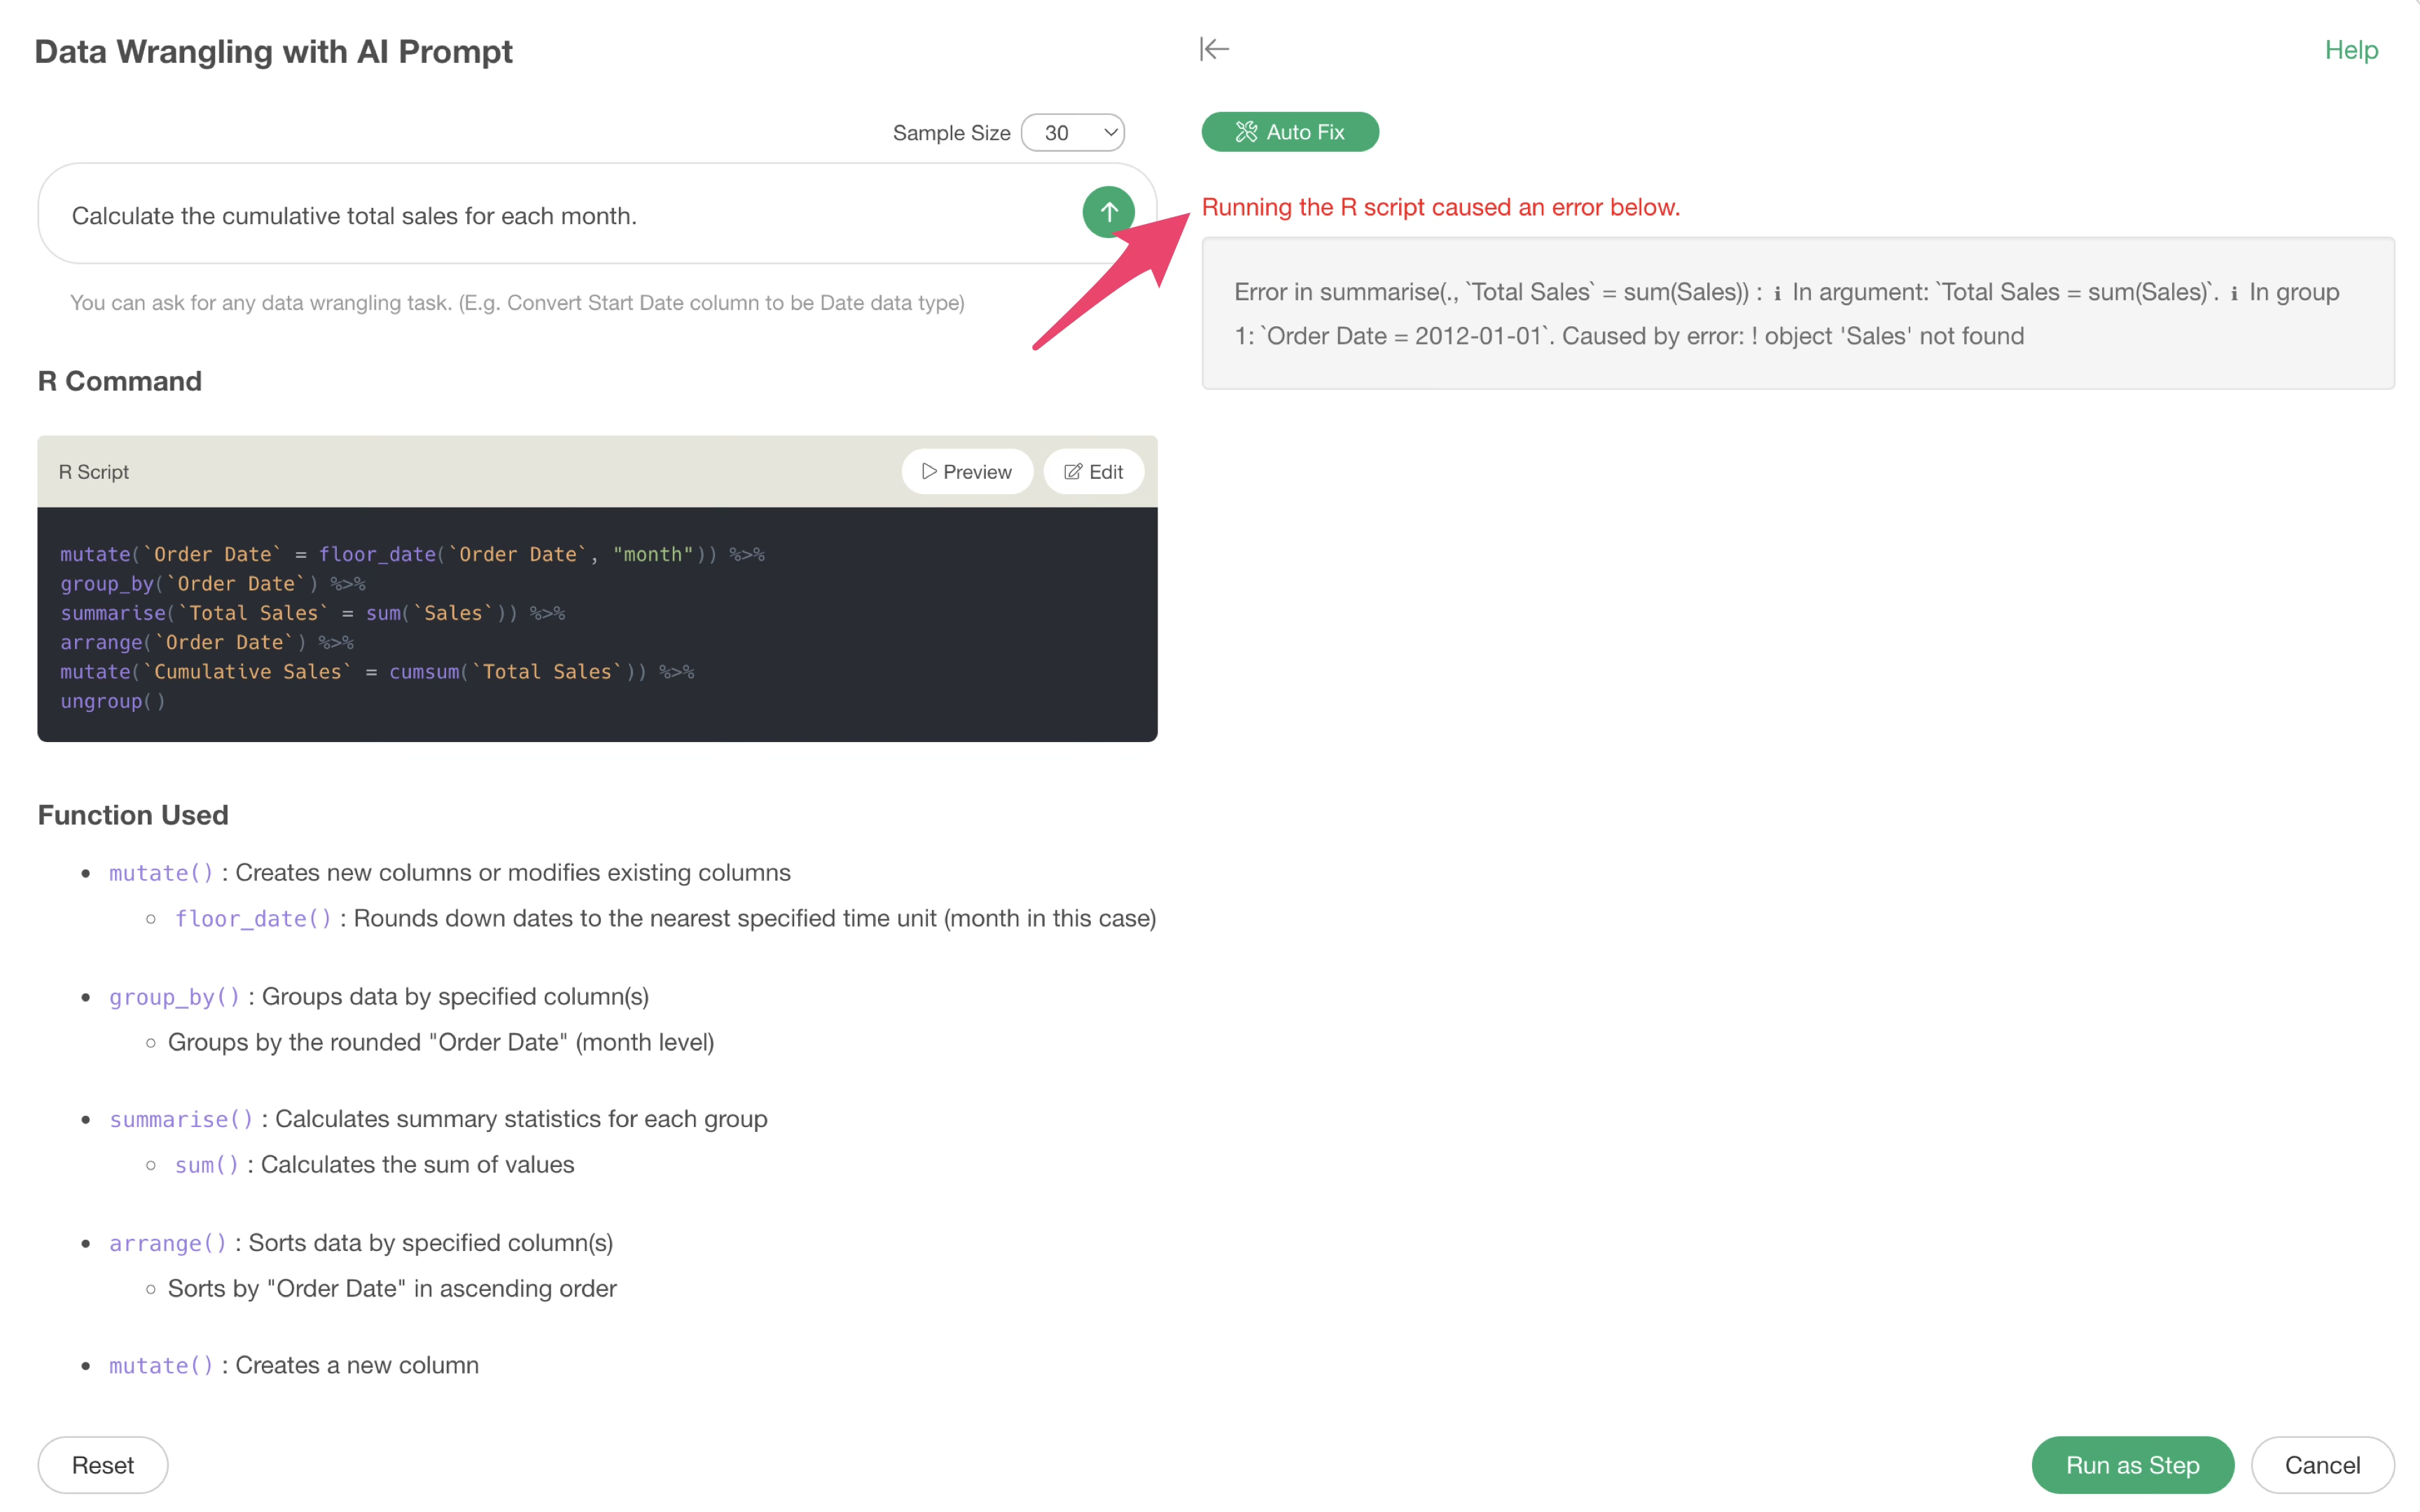
You can check what kind of error has occurred by previewing, but to automatically resolve this error with AI, click the “Auto Fix” button.
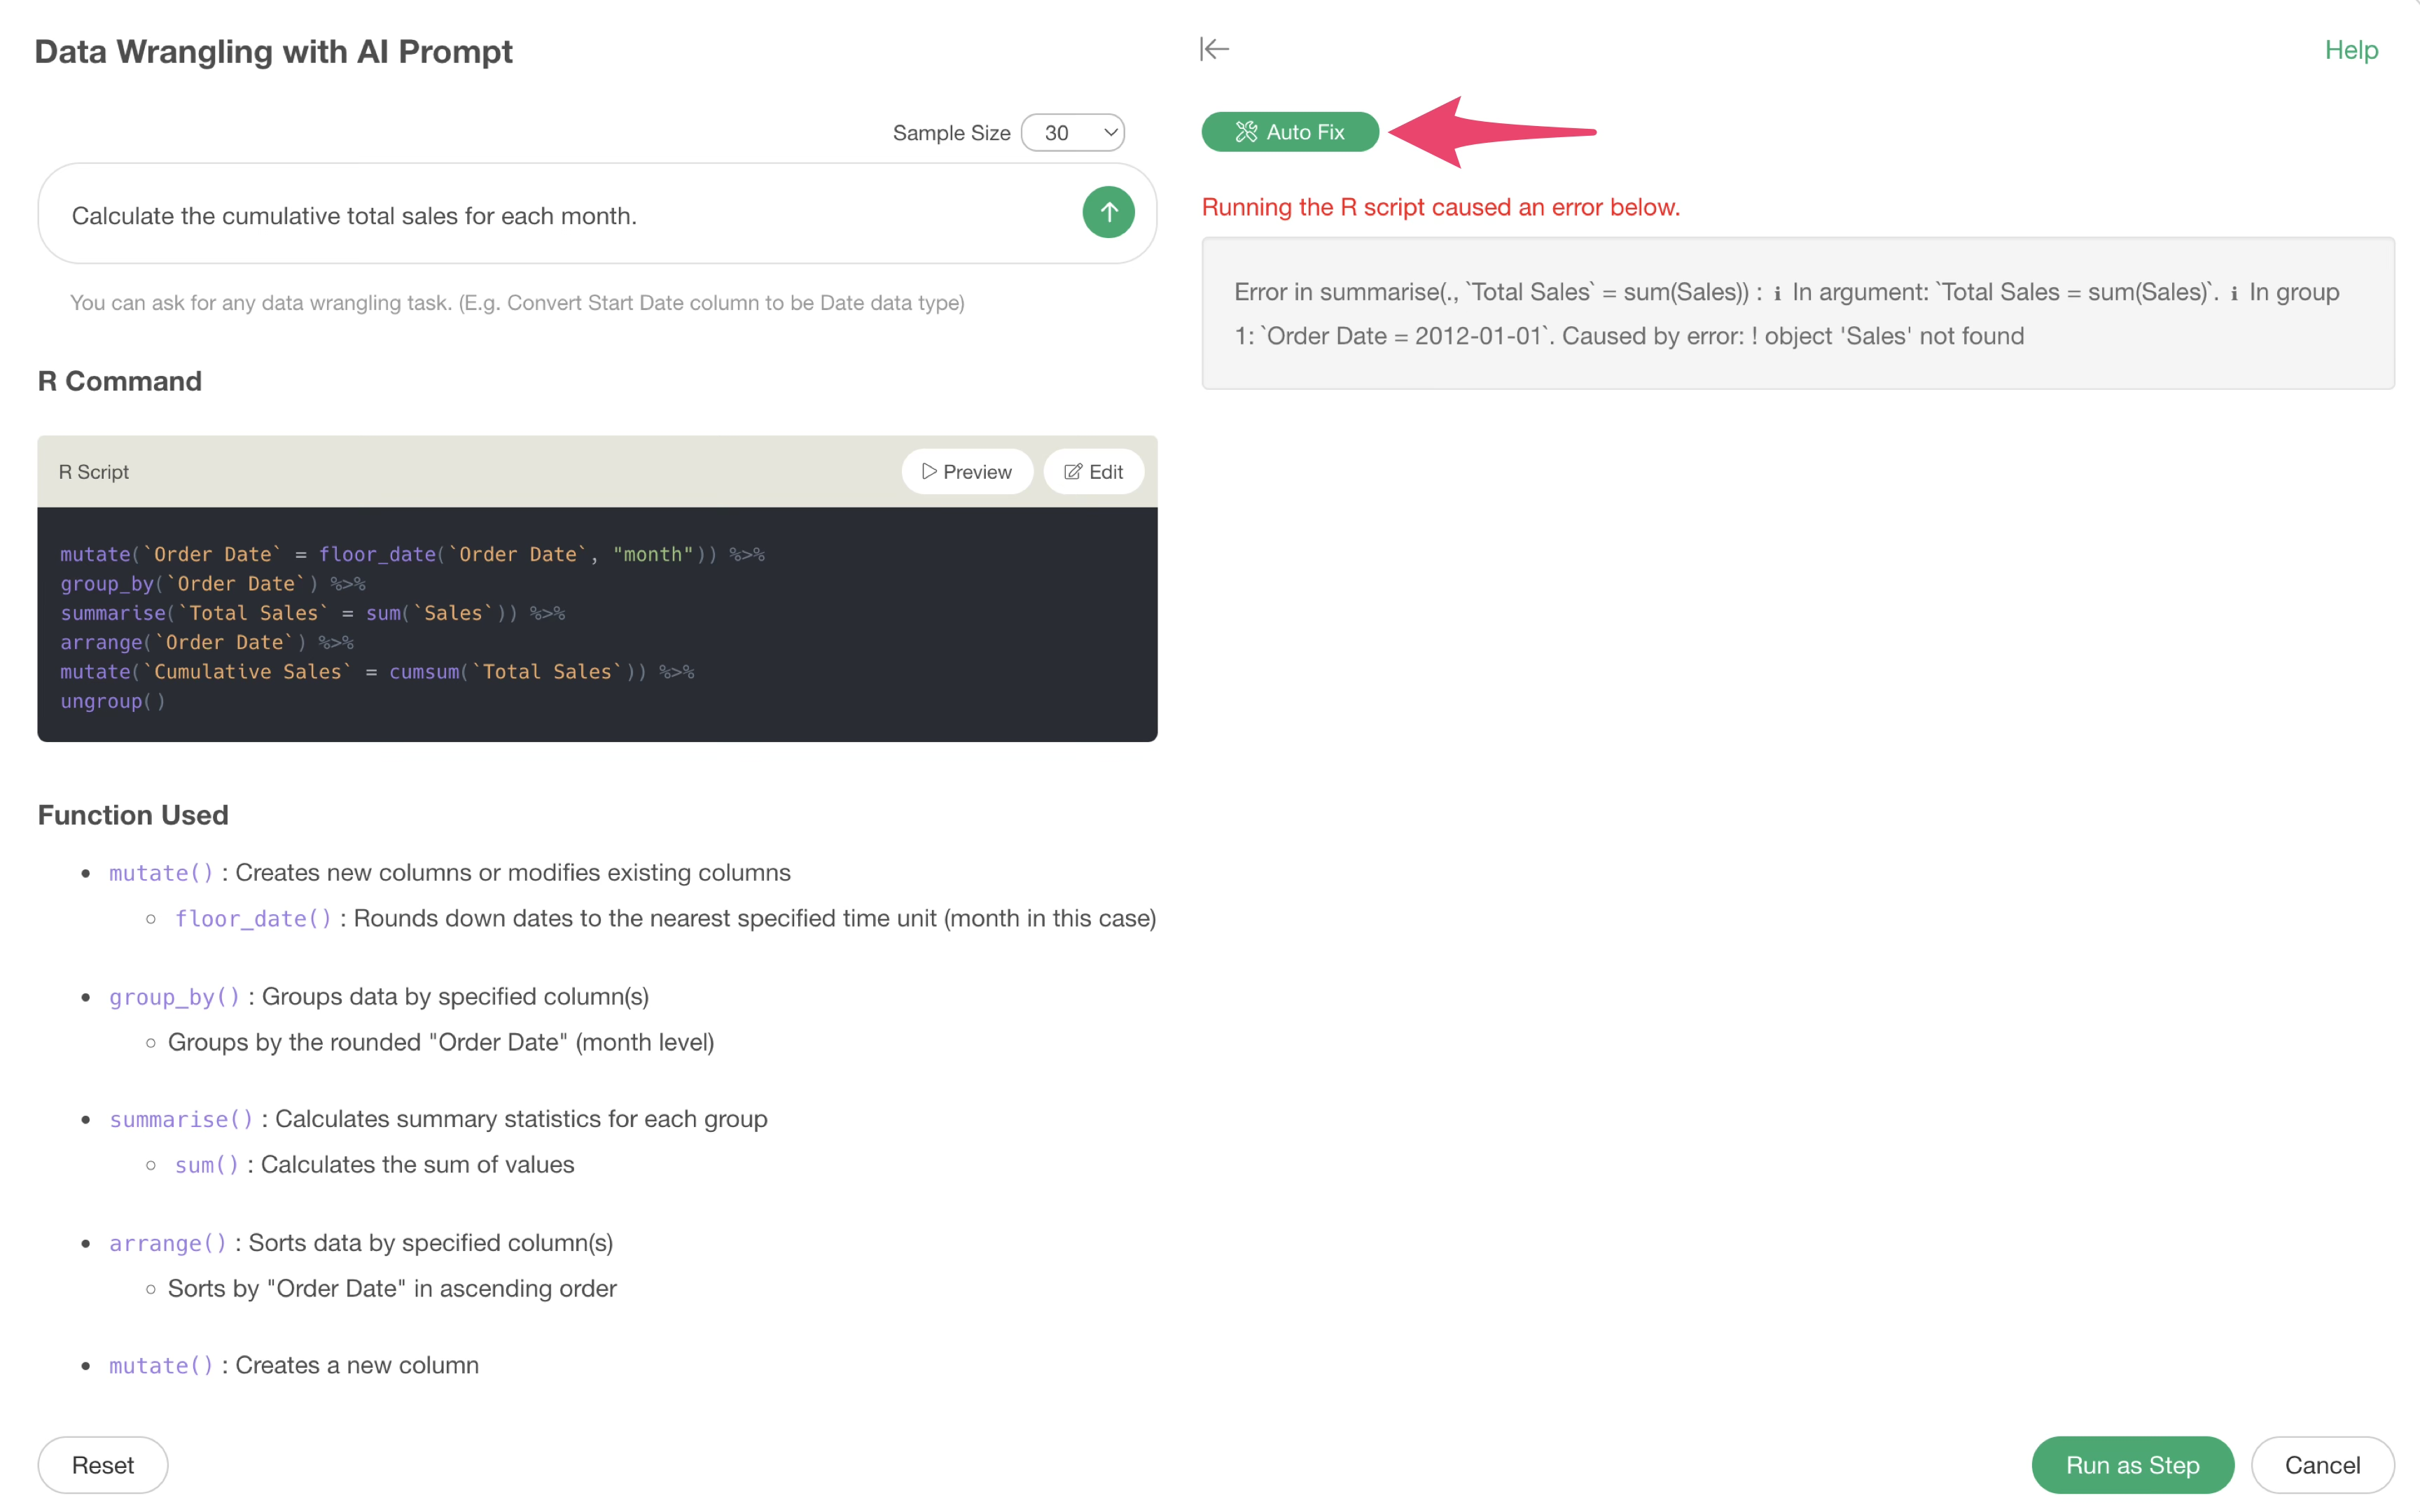
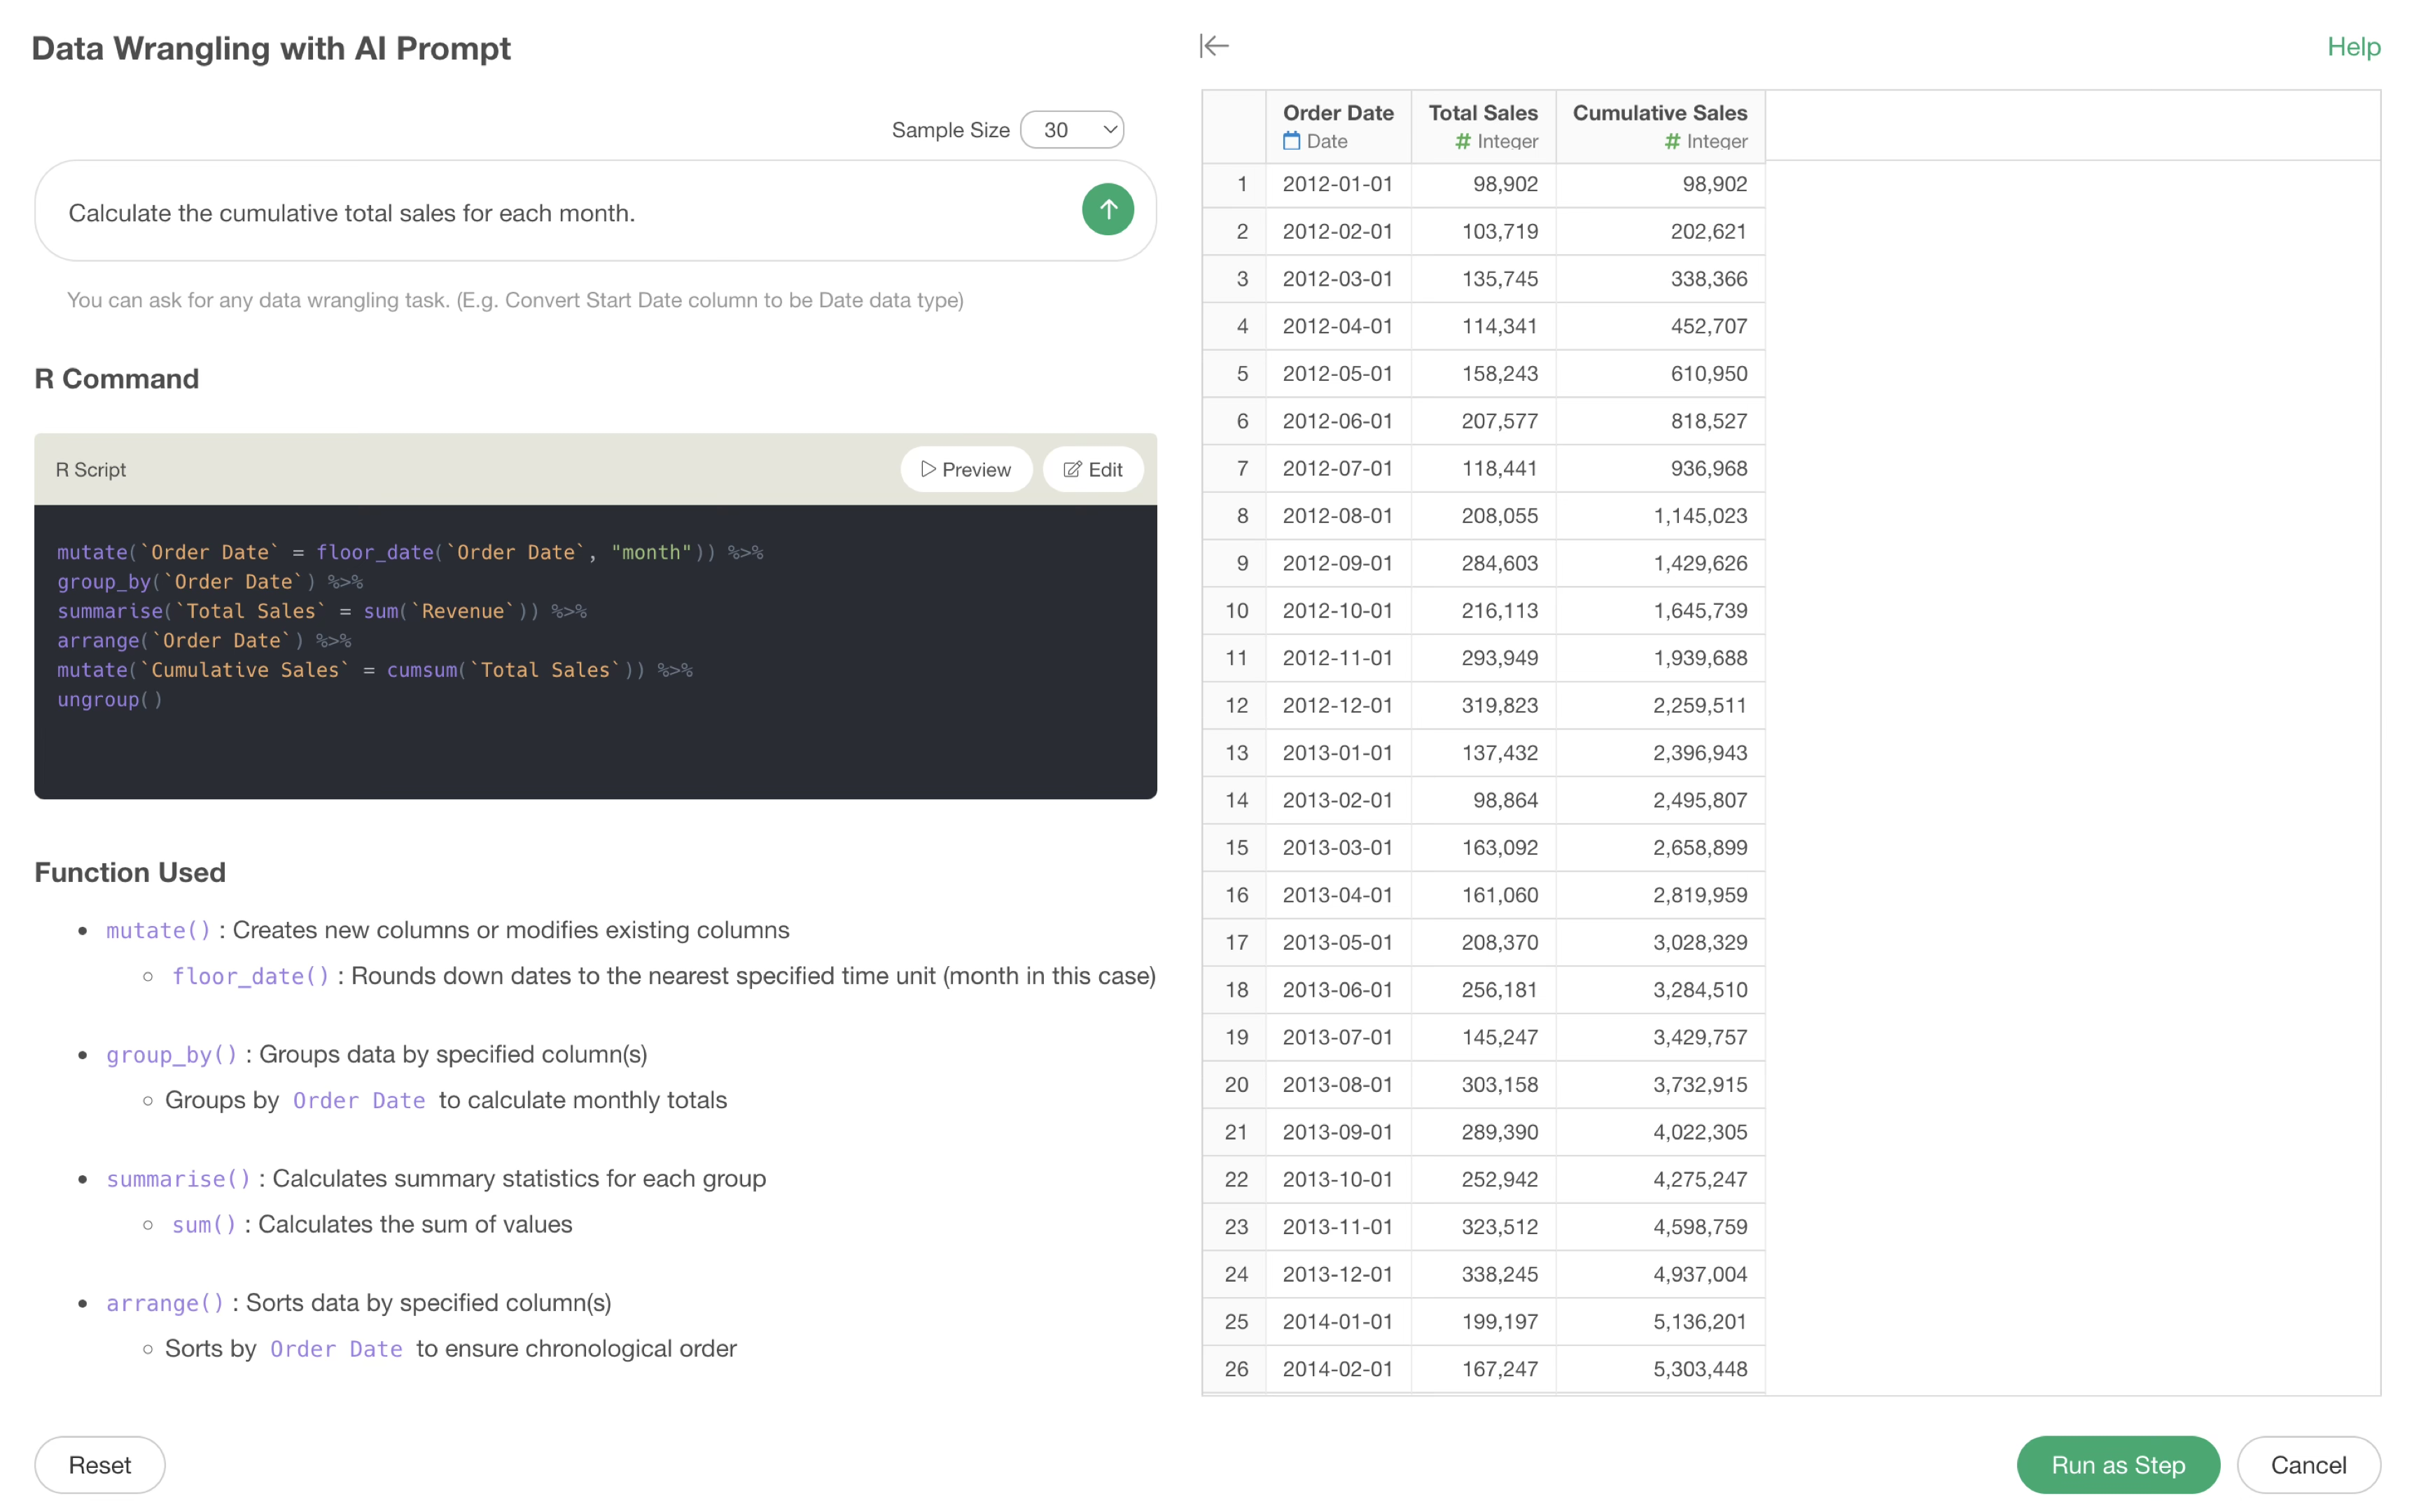
This allows the AI to correct the R command based on the error message and return the result.
This concludes the AI Prompt version of data wrangling in Exploratory.