How to Use Exploratory Part 7 - Parameters
This note is the seventh installment of “How to Use Exploratory,” designed to help you start using Exploratory efficiently, focusing on “Parameters.”
In Exploratory, you can monitor business indicators (KPIs) using Dashboards. Within this, the Interactive Filter feature allows you to display charts filtered to specific groups by clicking.
On the other hand, if you want to filter data more flexibly, such as specifying a date range or a numerical range, the “Parameters” feature is recommended.
In addition to filtering data, parameters can also make dashboards more interactive by changing calculation methods or the content of SQL queries to databases.
This tutorial is expected to take about 20 minutes.
Let’s get started!
1. Importing a Project
This time, we will use “Employee” data as sample data. The sample project can be downloaded here.
Open Exploratory and drag and drop the project you just downloaded.
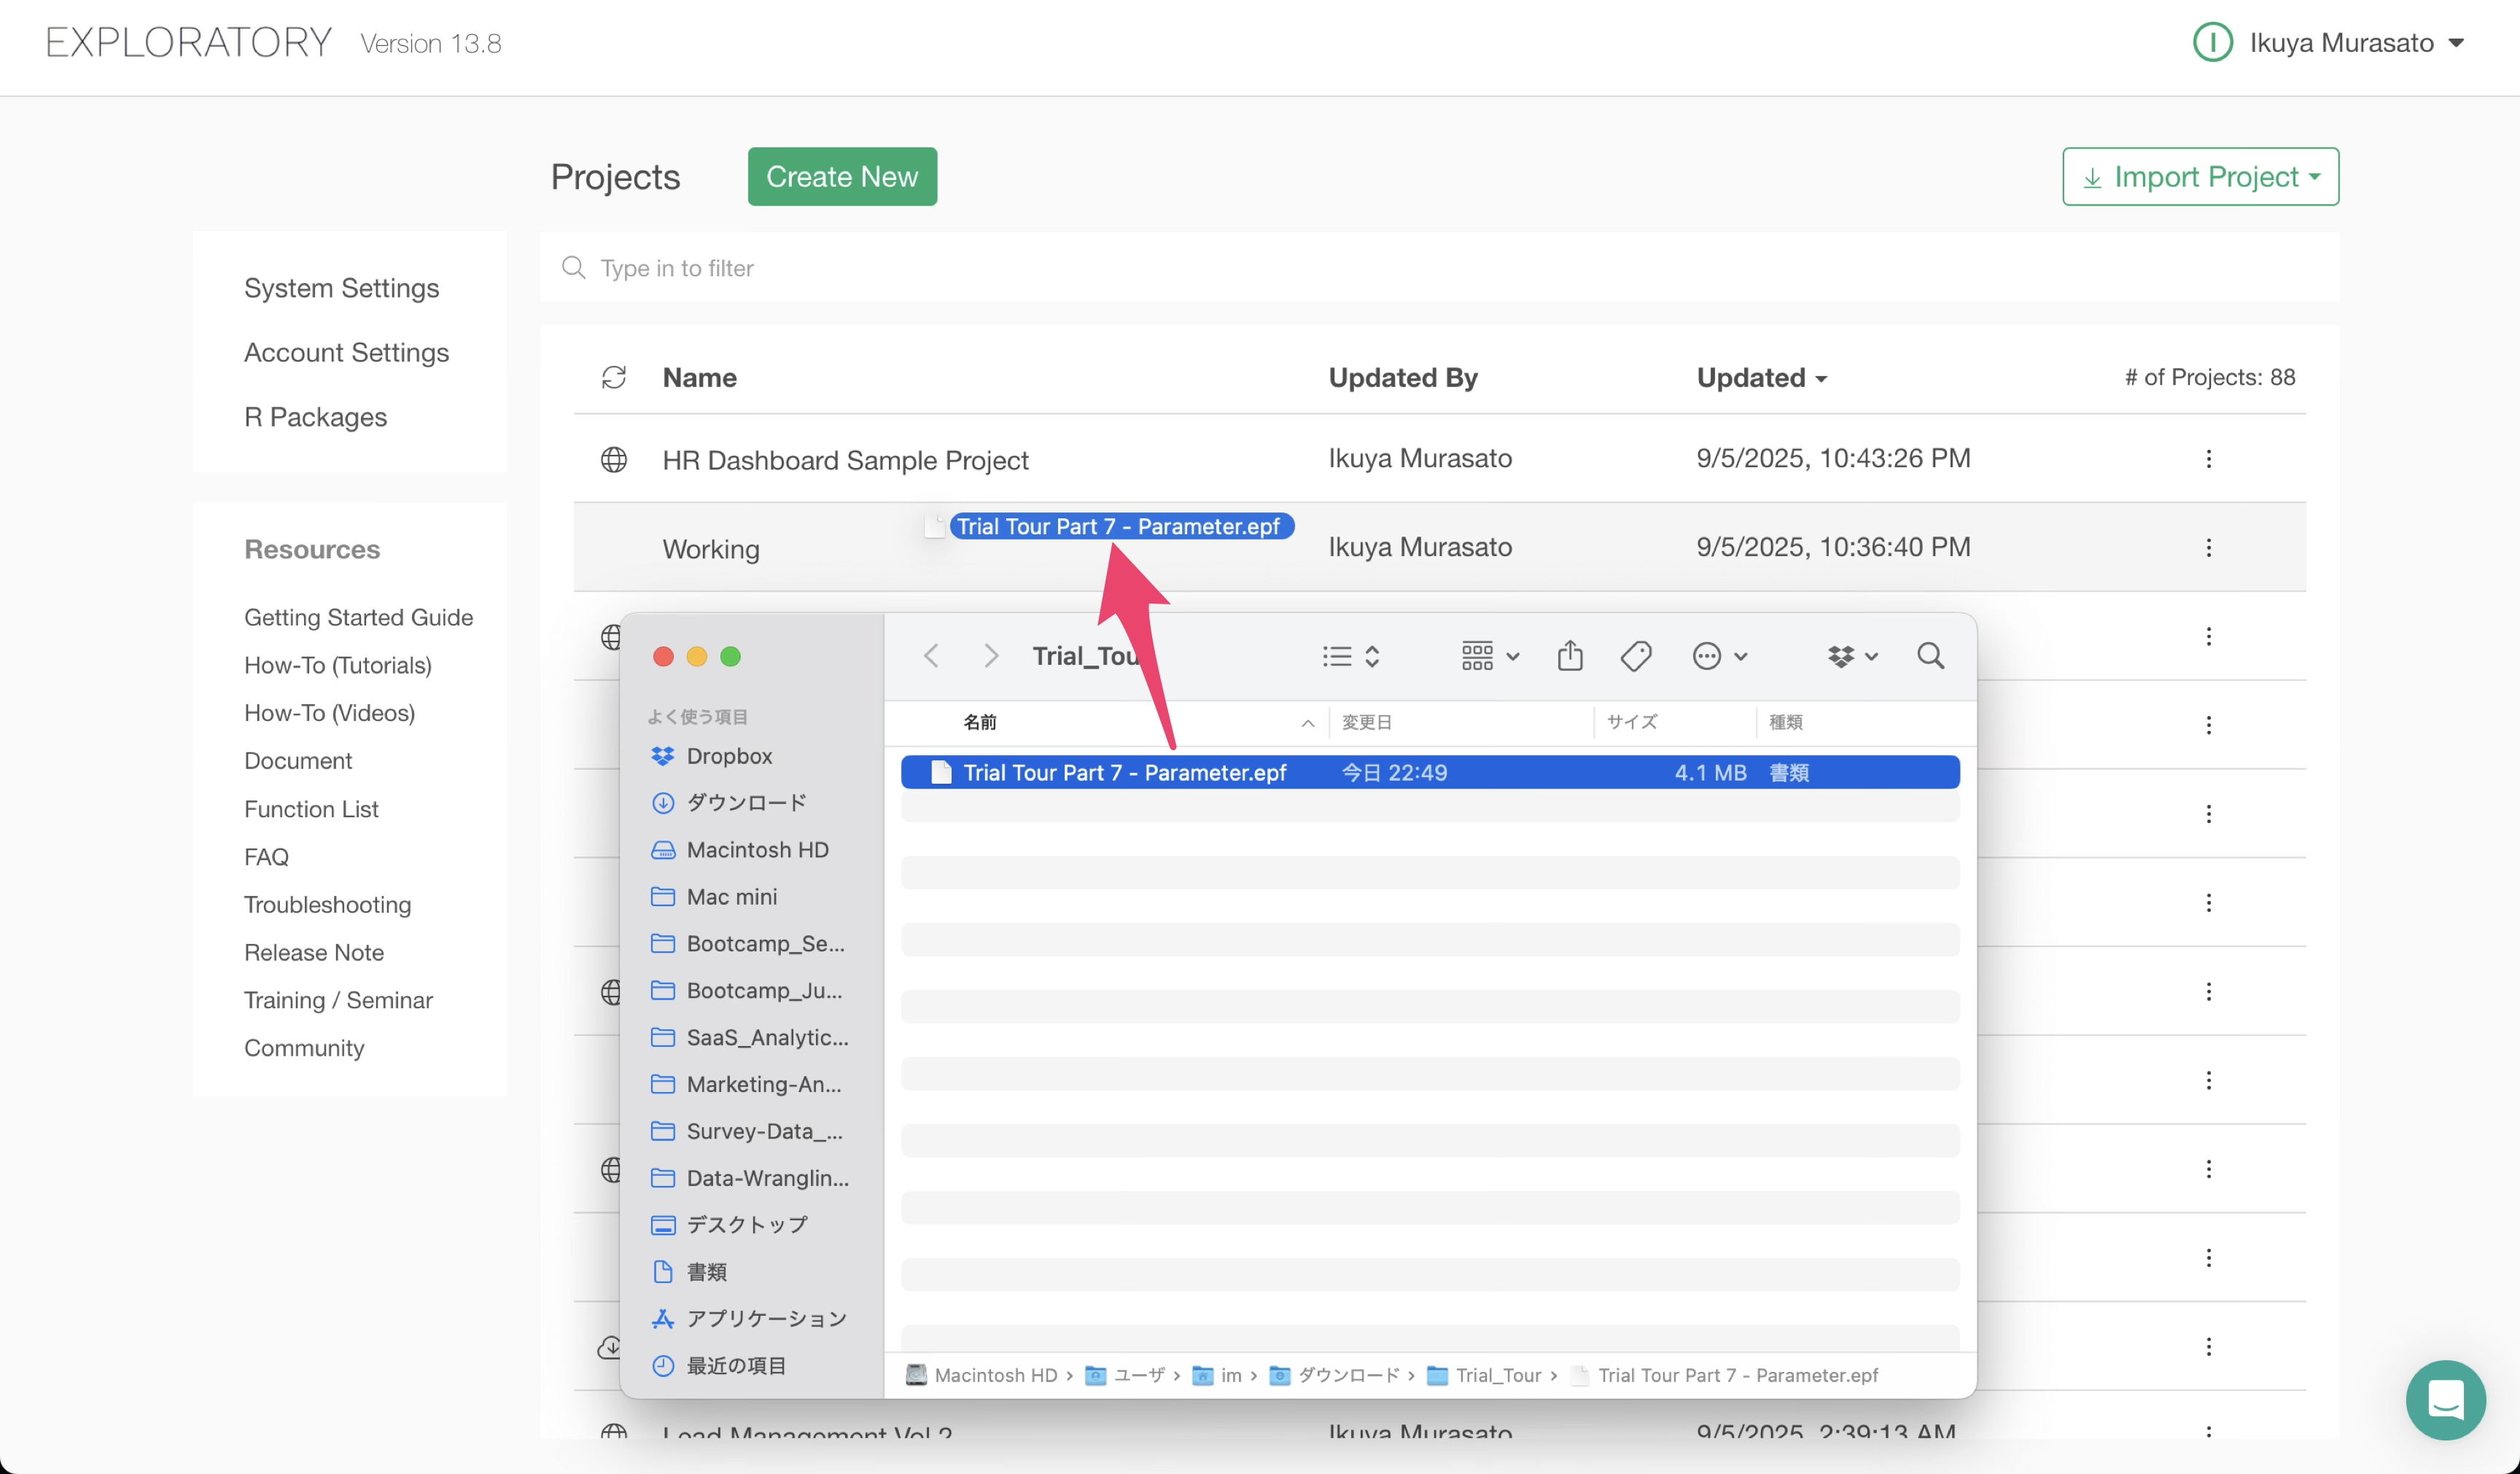
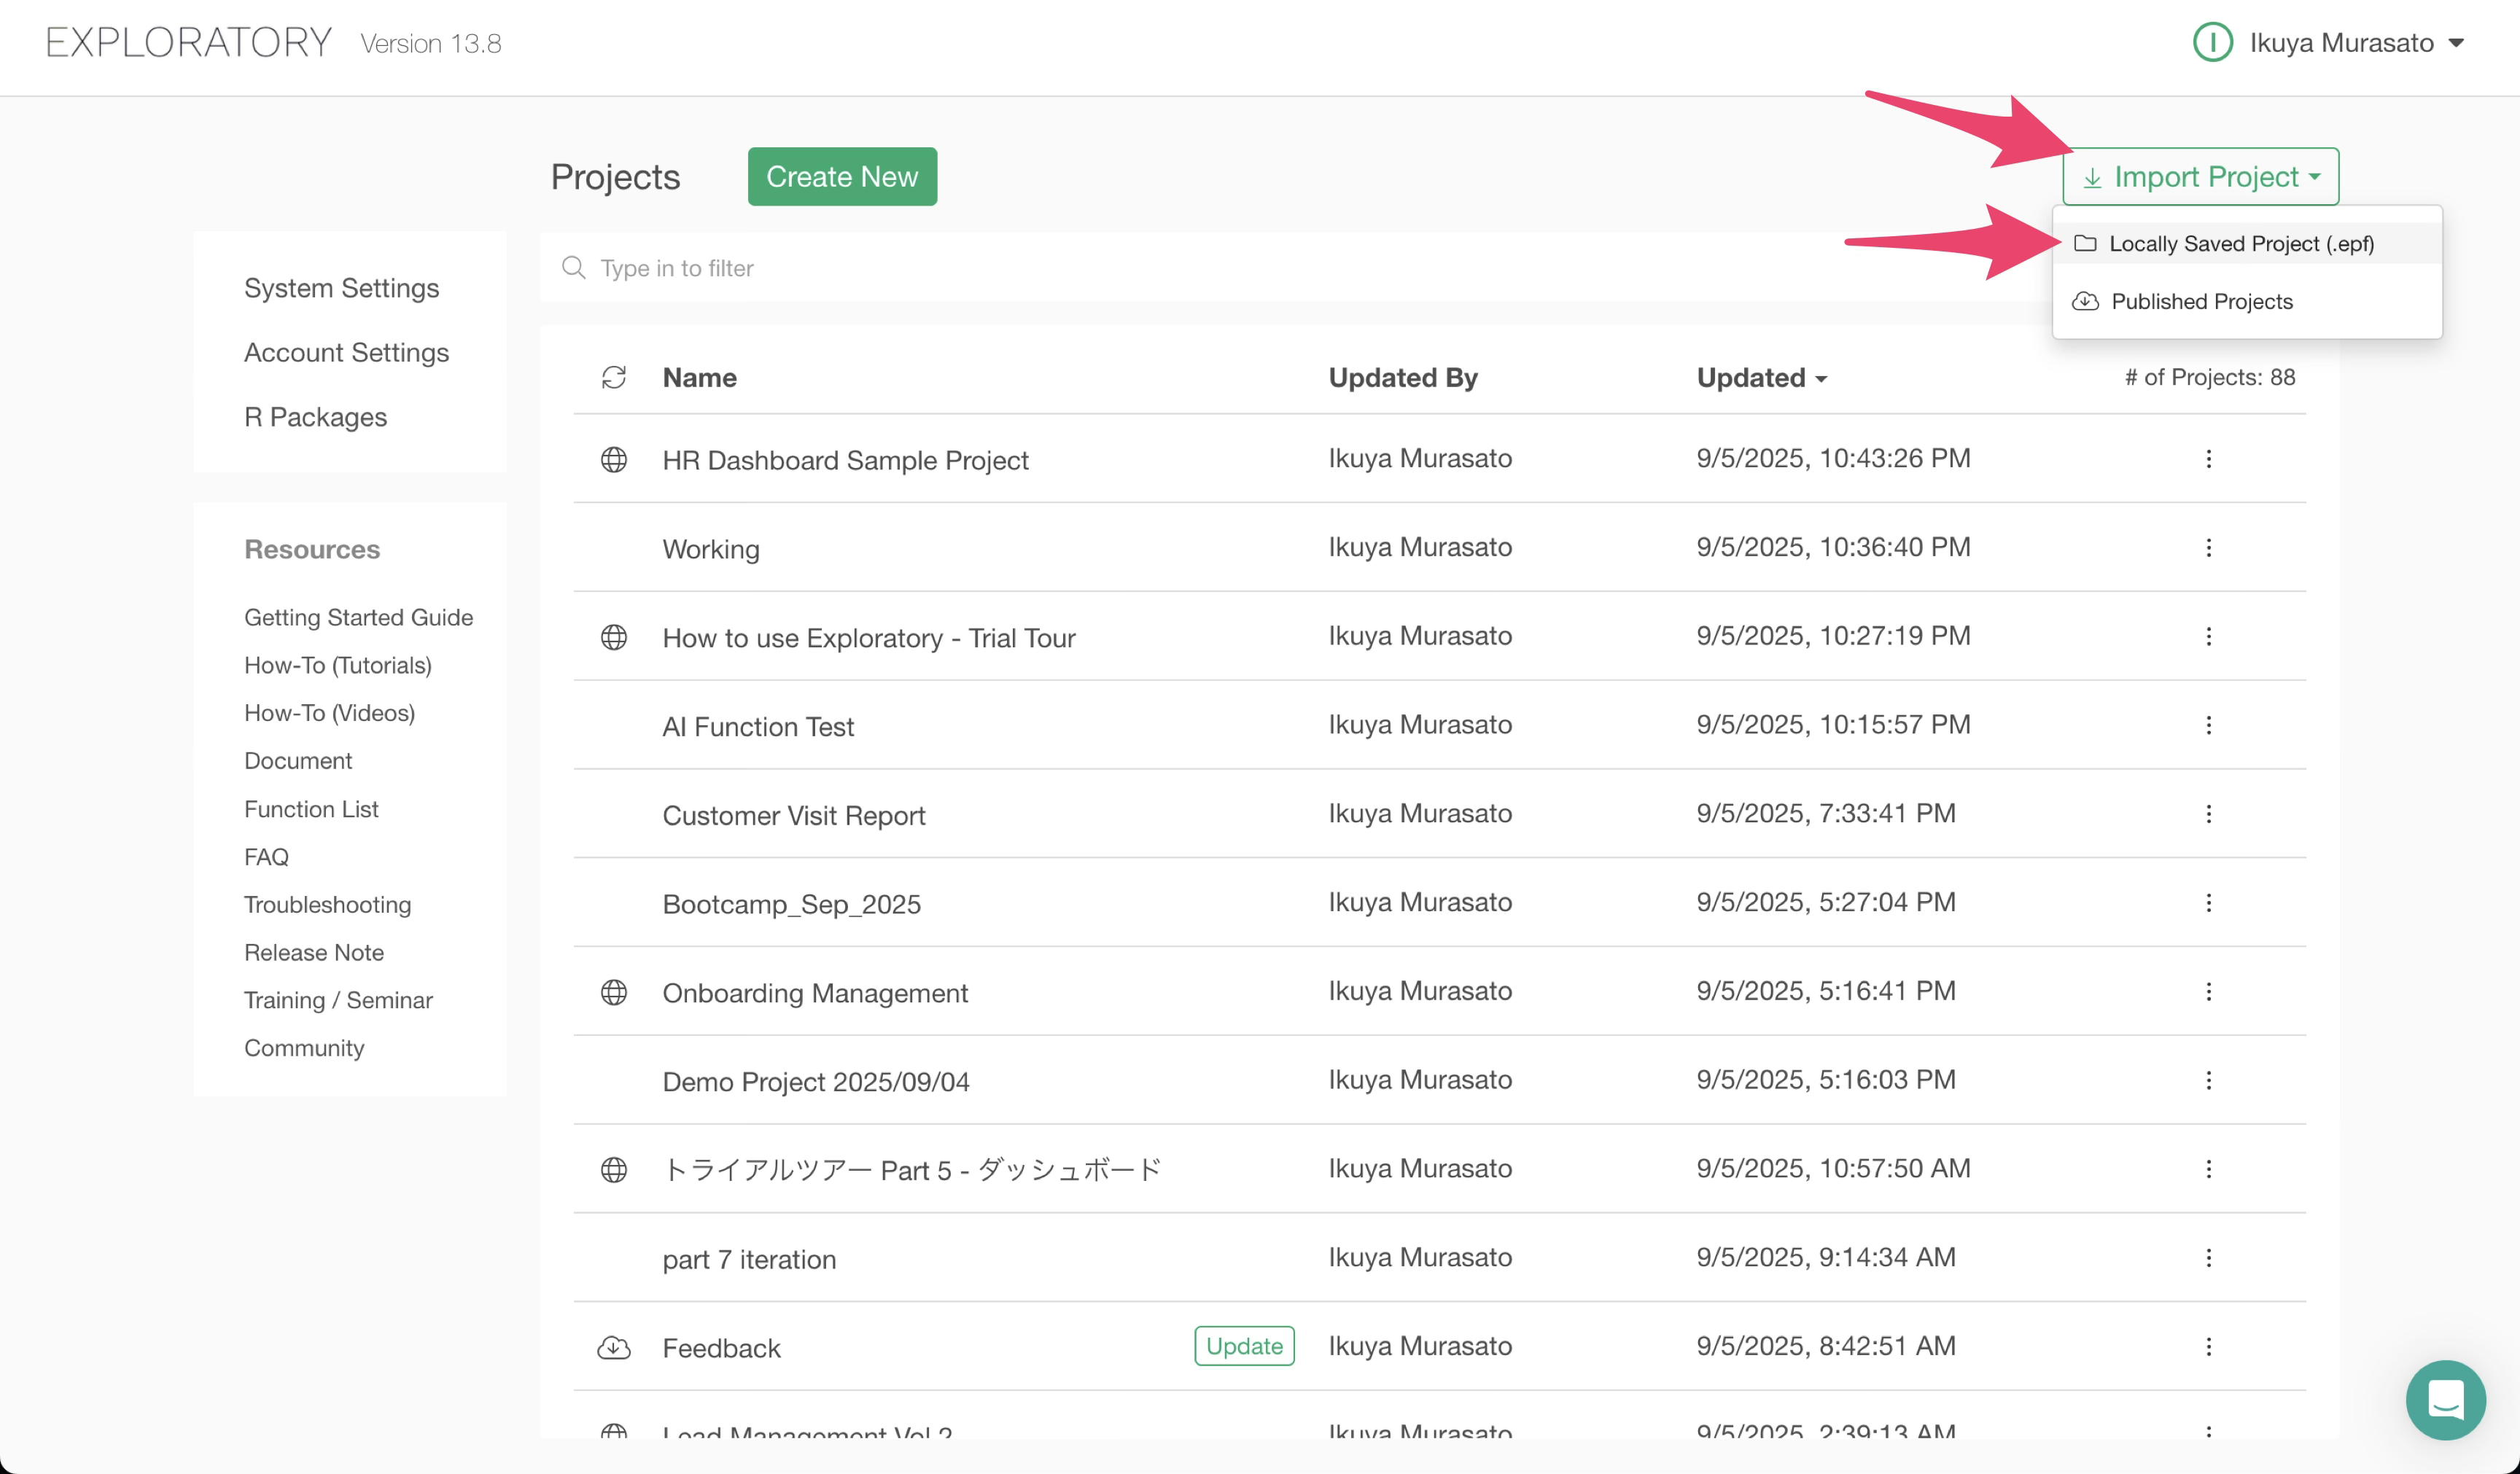
Alternatively, you can click the “Import Project” button, select “Locally Saved Project (.epf),” and then choose the project file to import it.
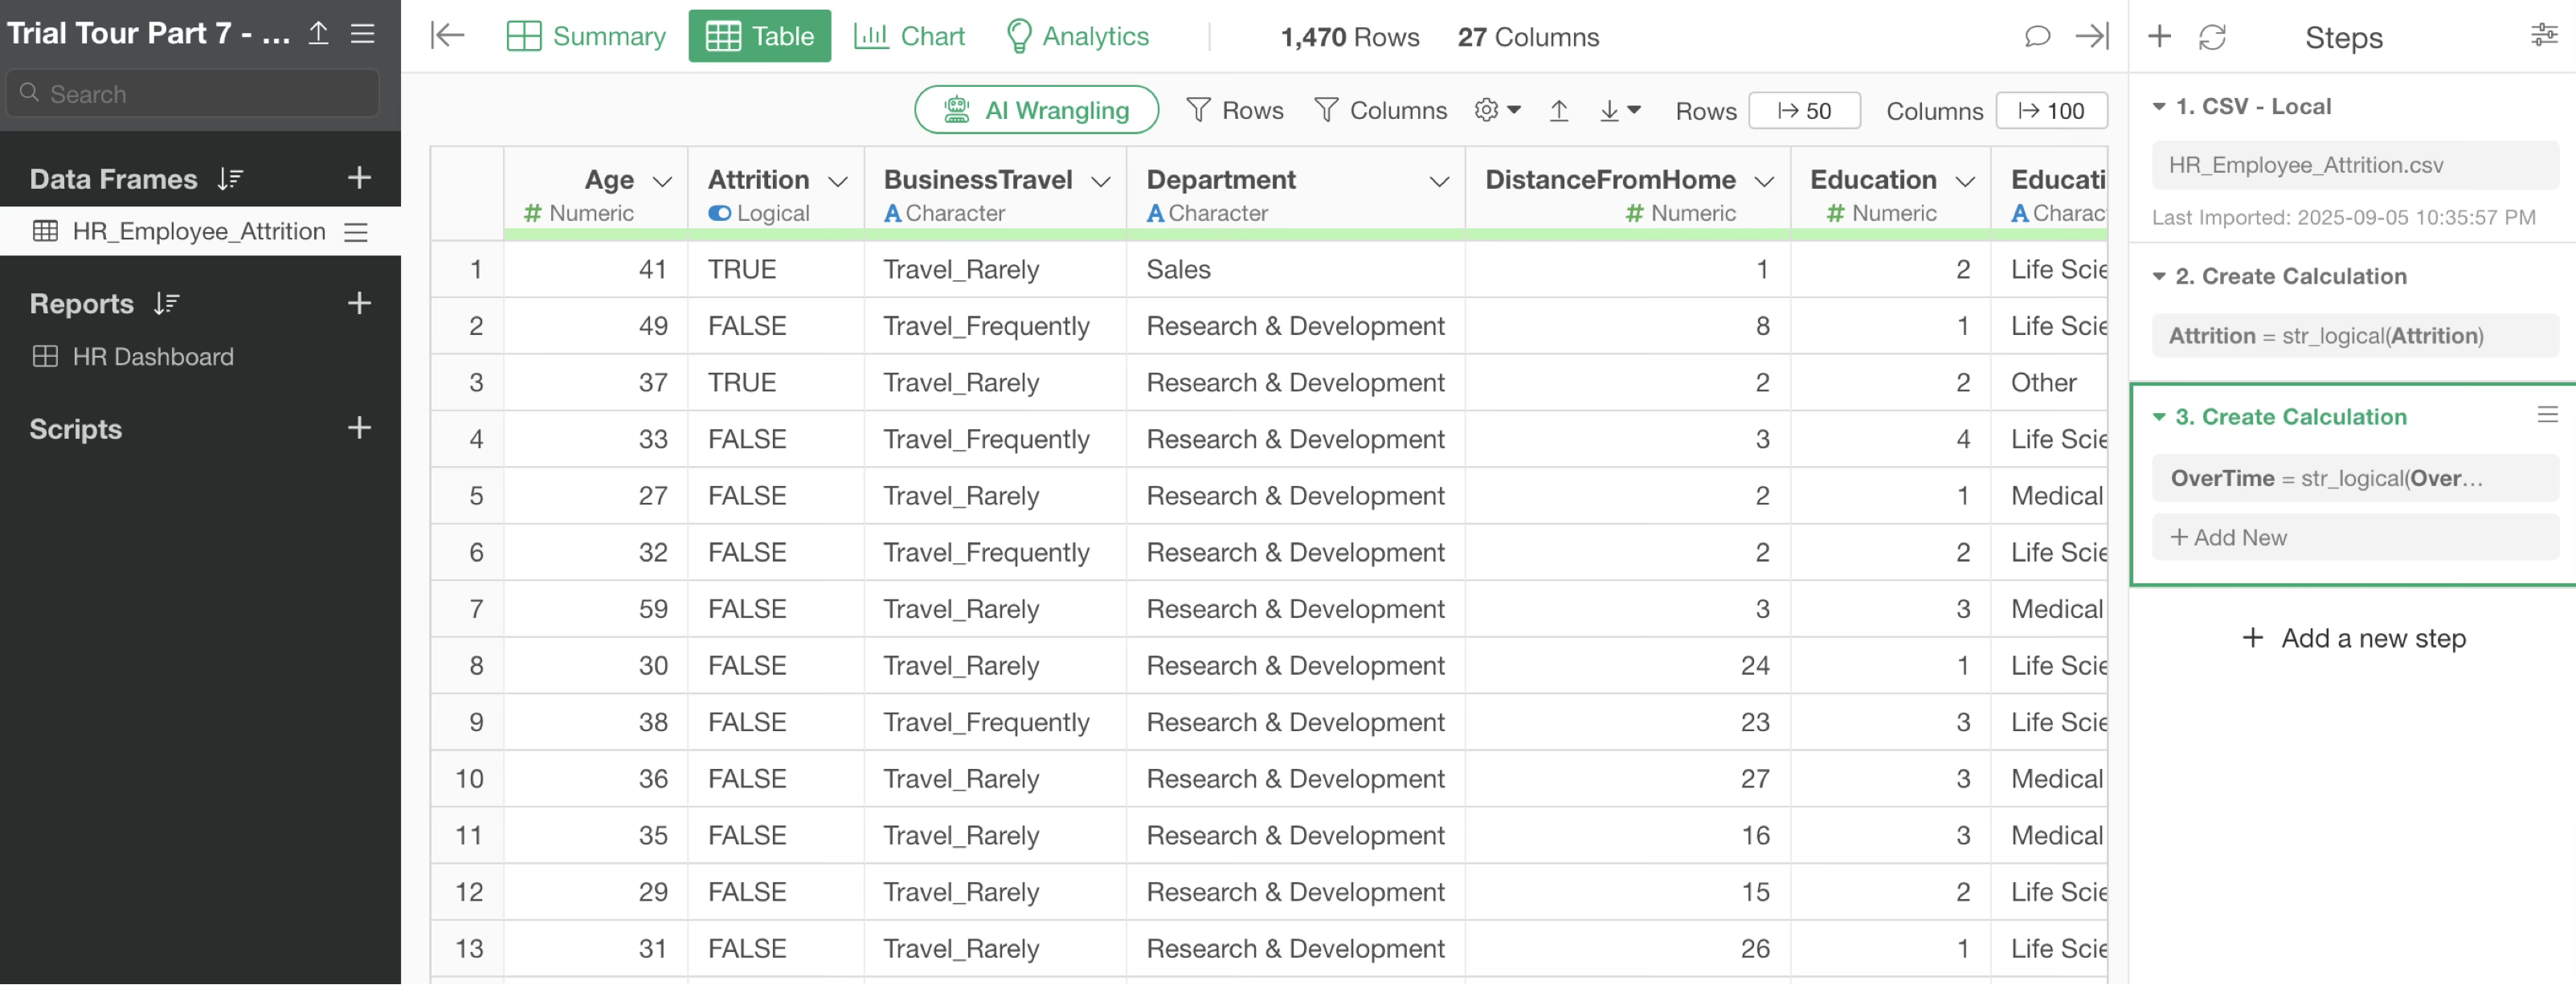
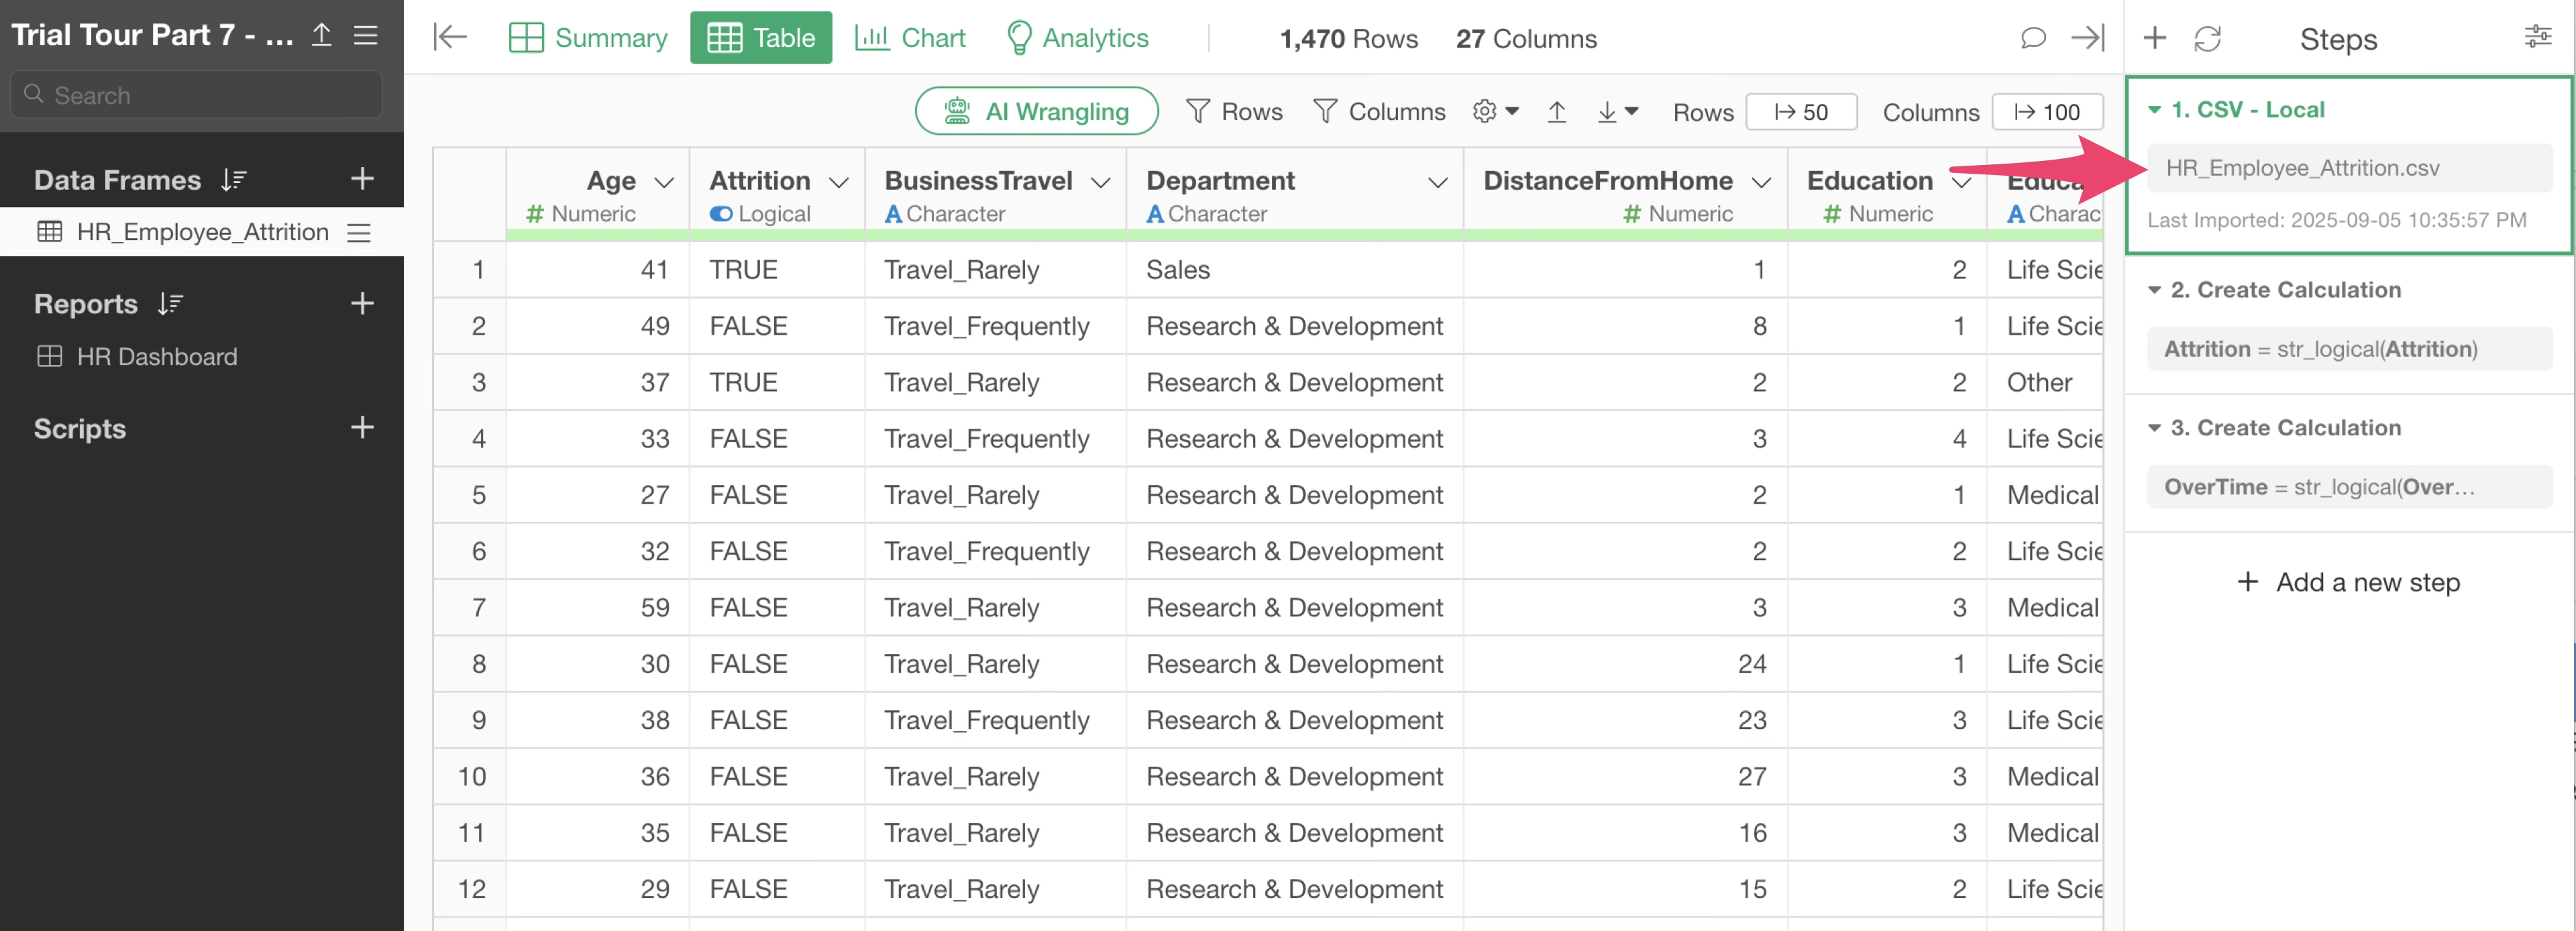
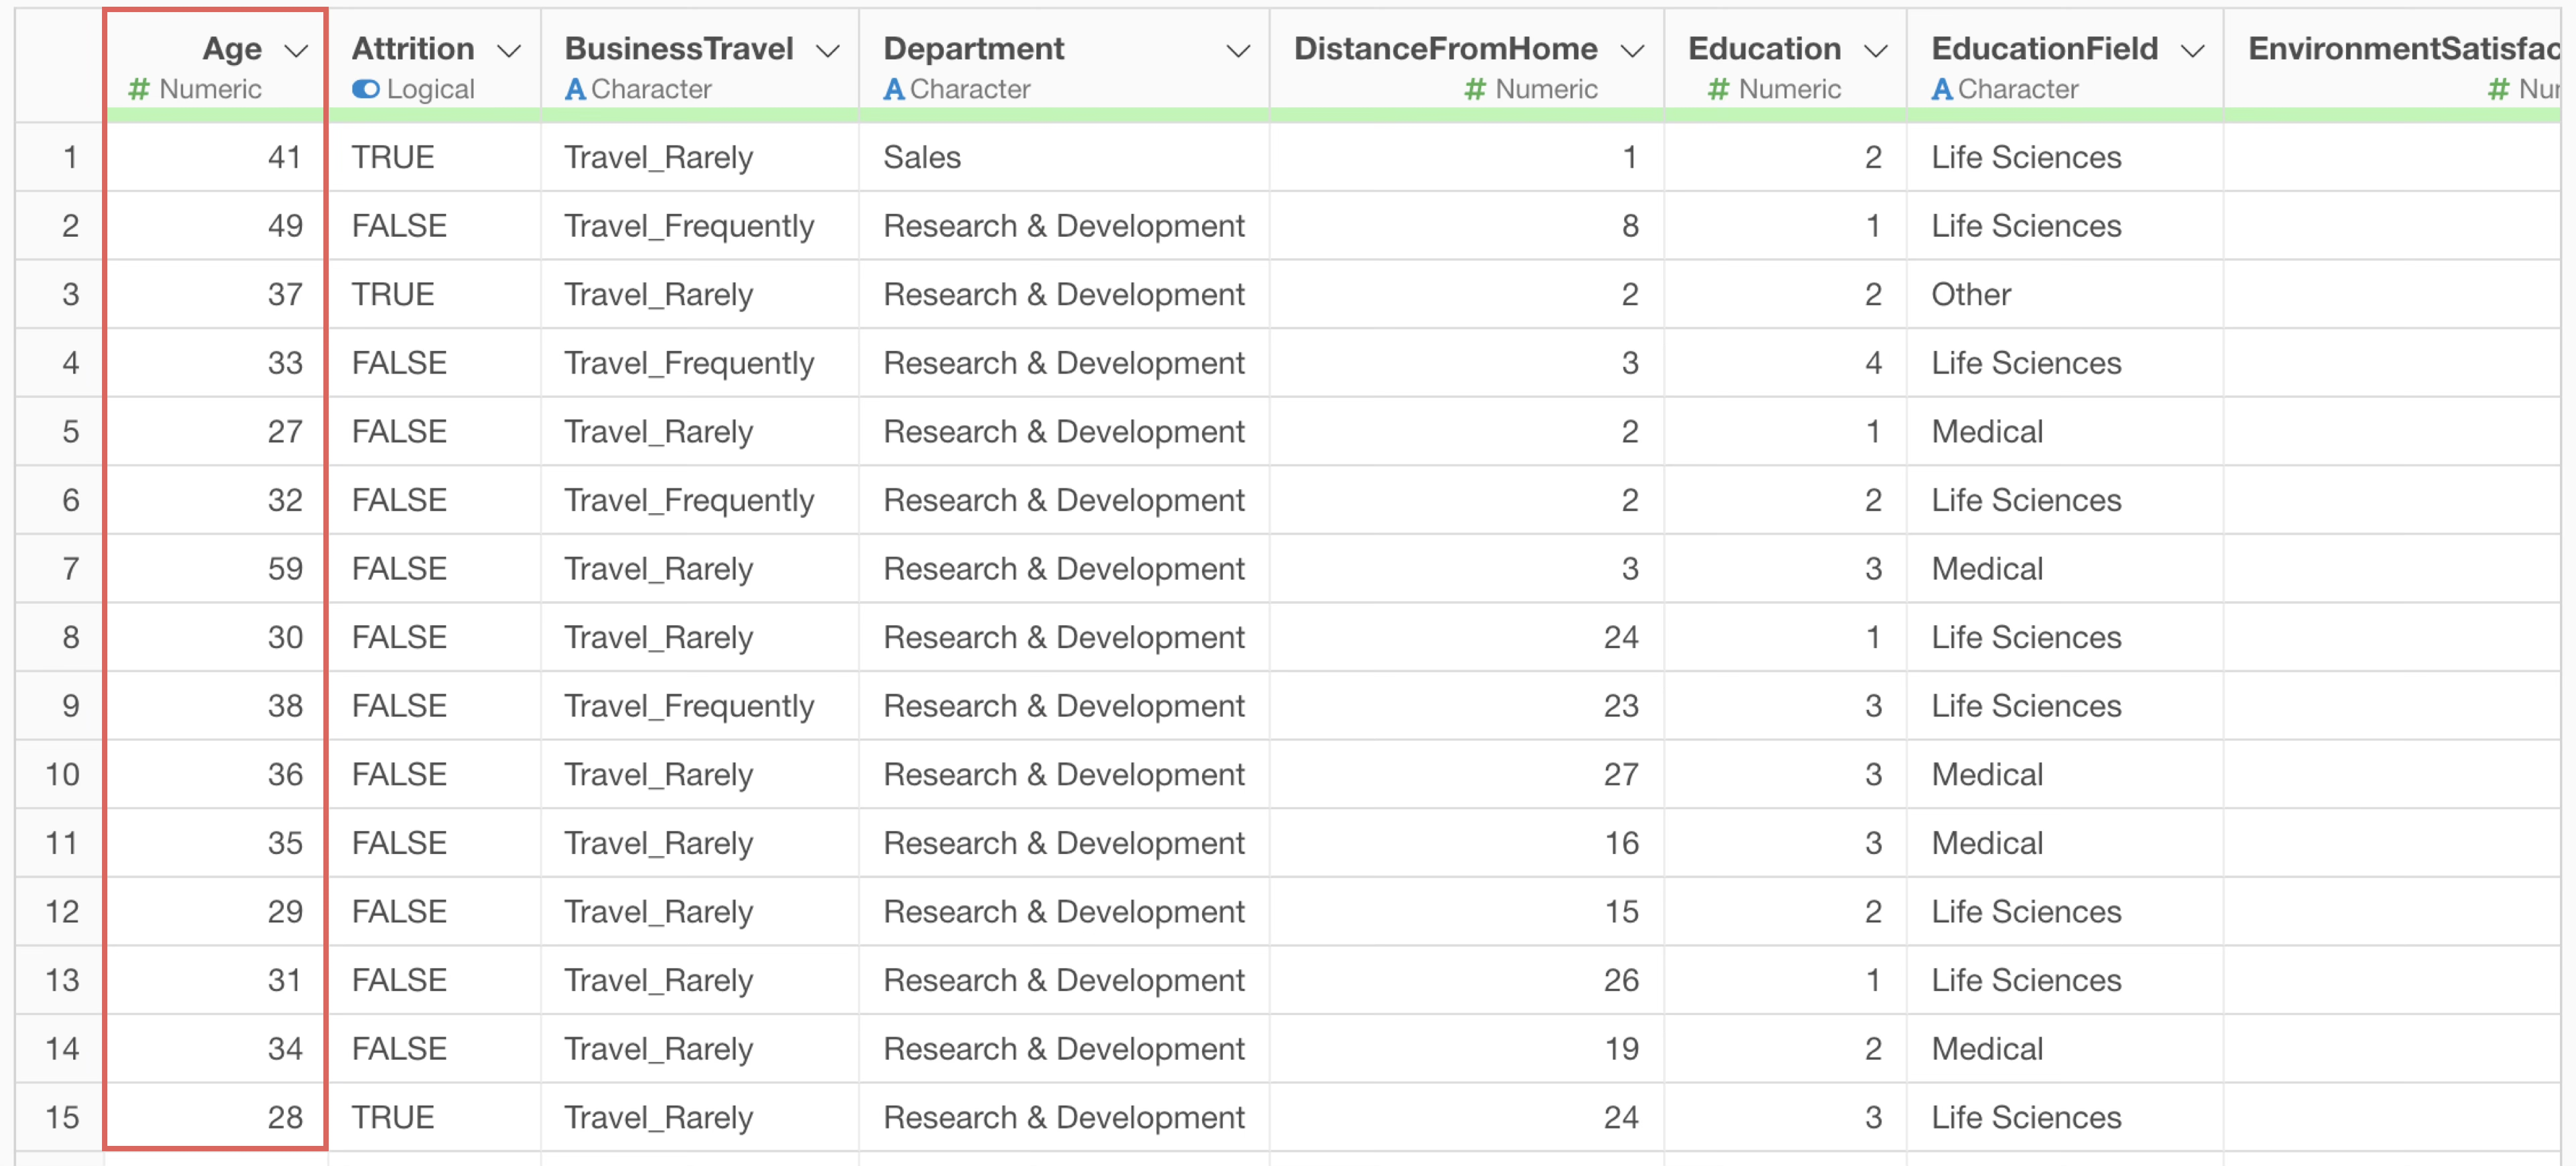
Opening the project reveals that it contains employee data.
2. Step Filter
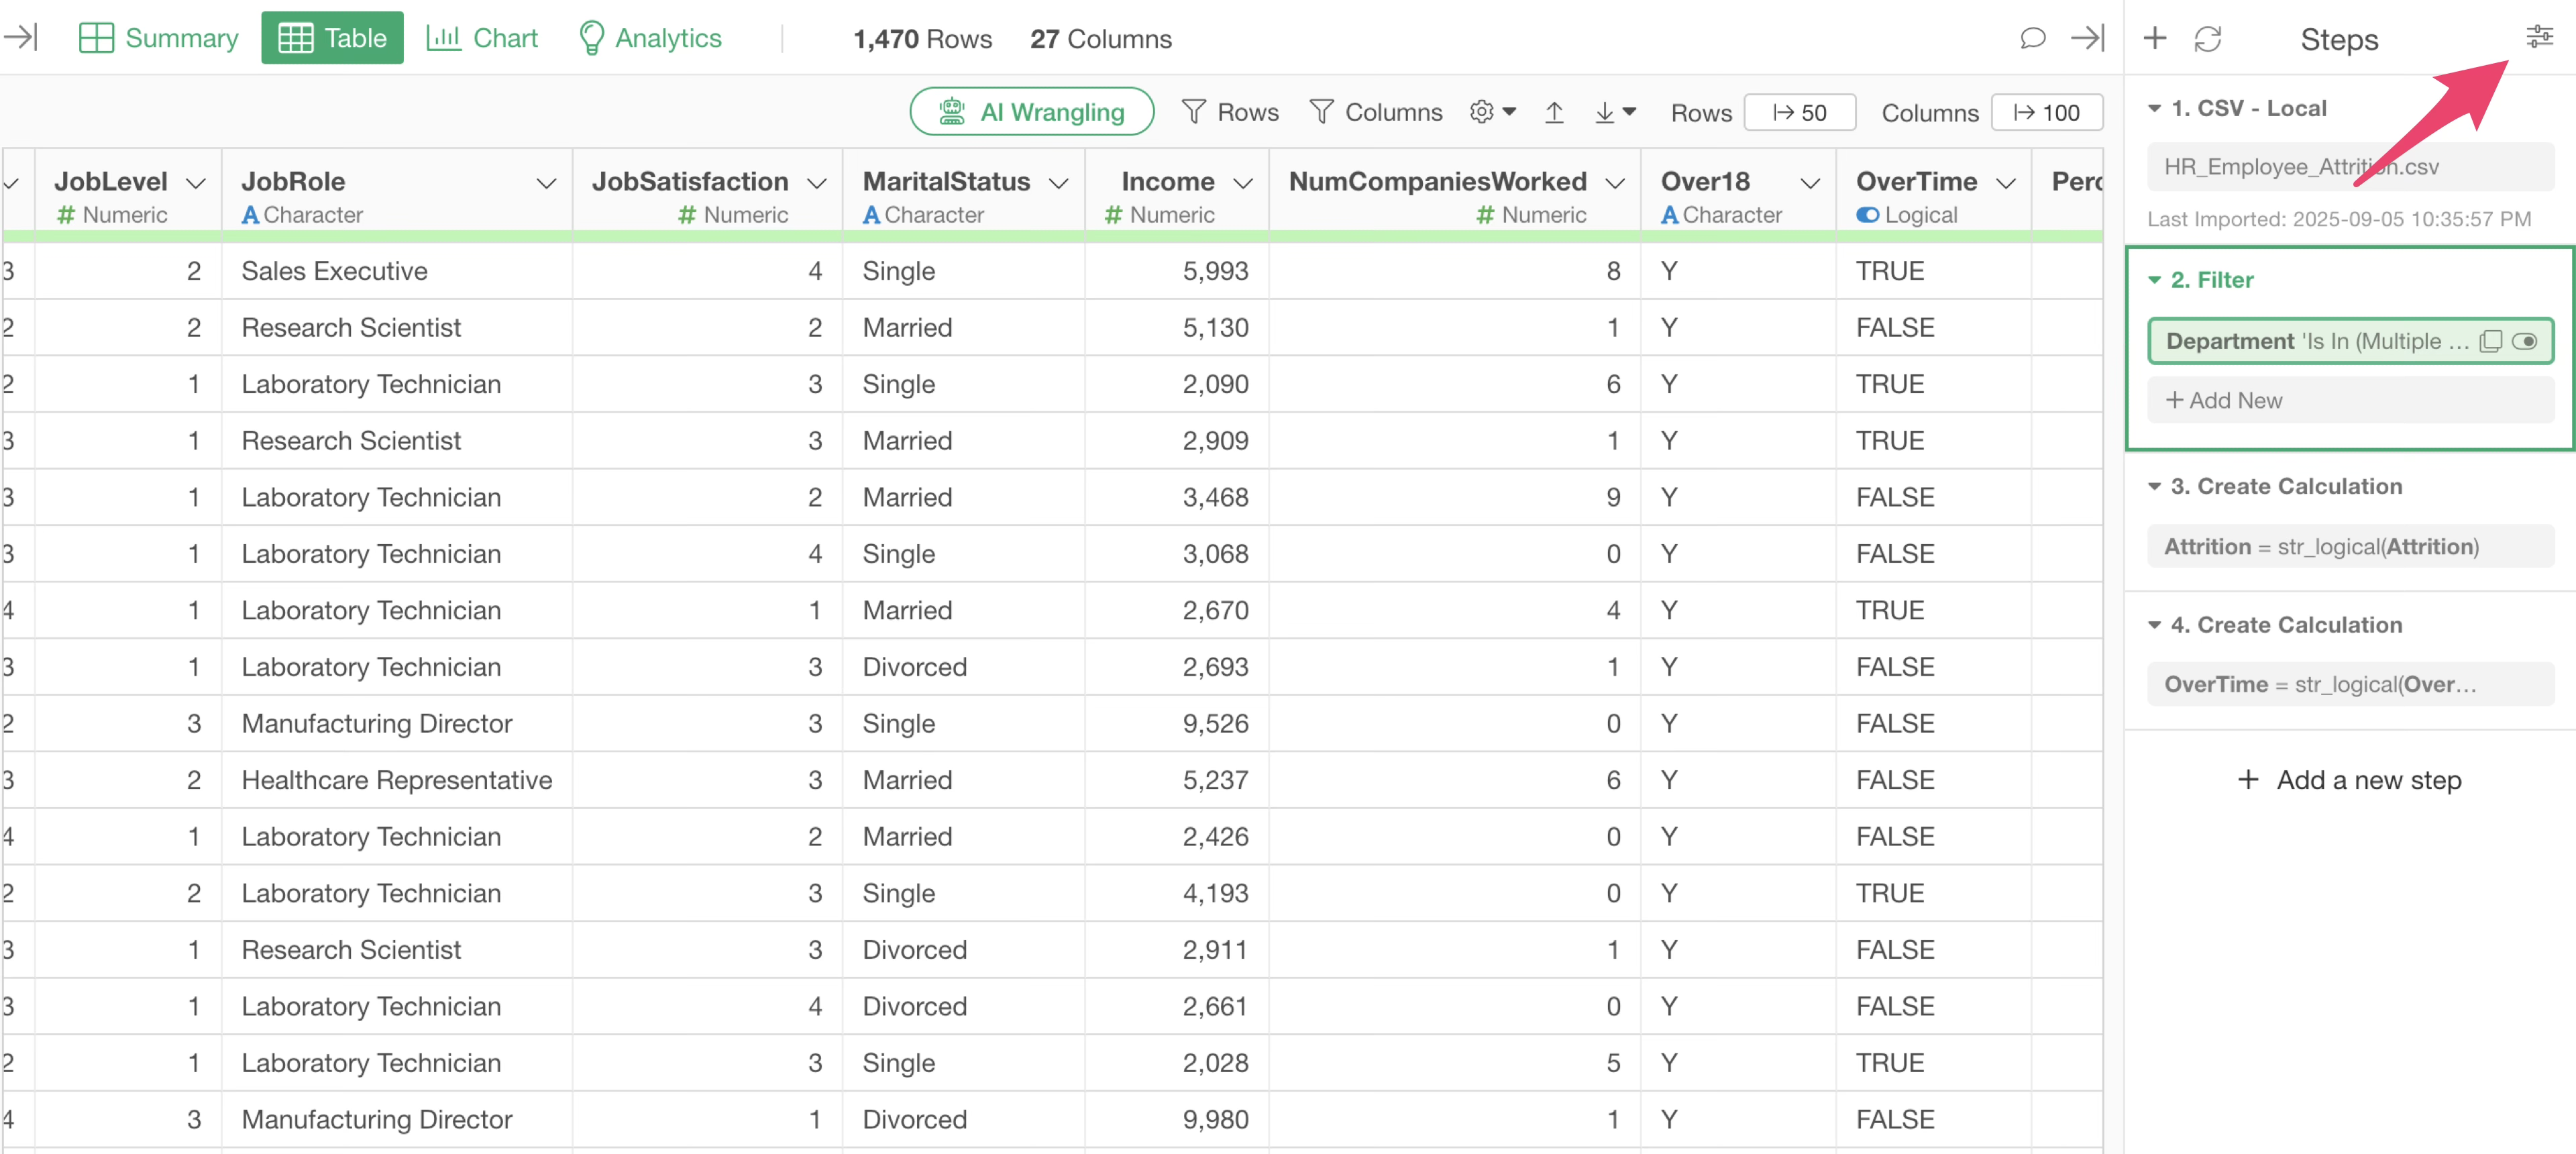
Open the Table View and click the first step.
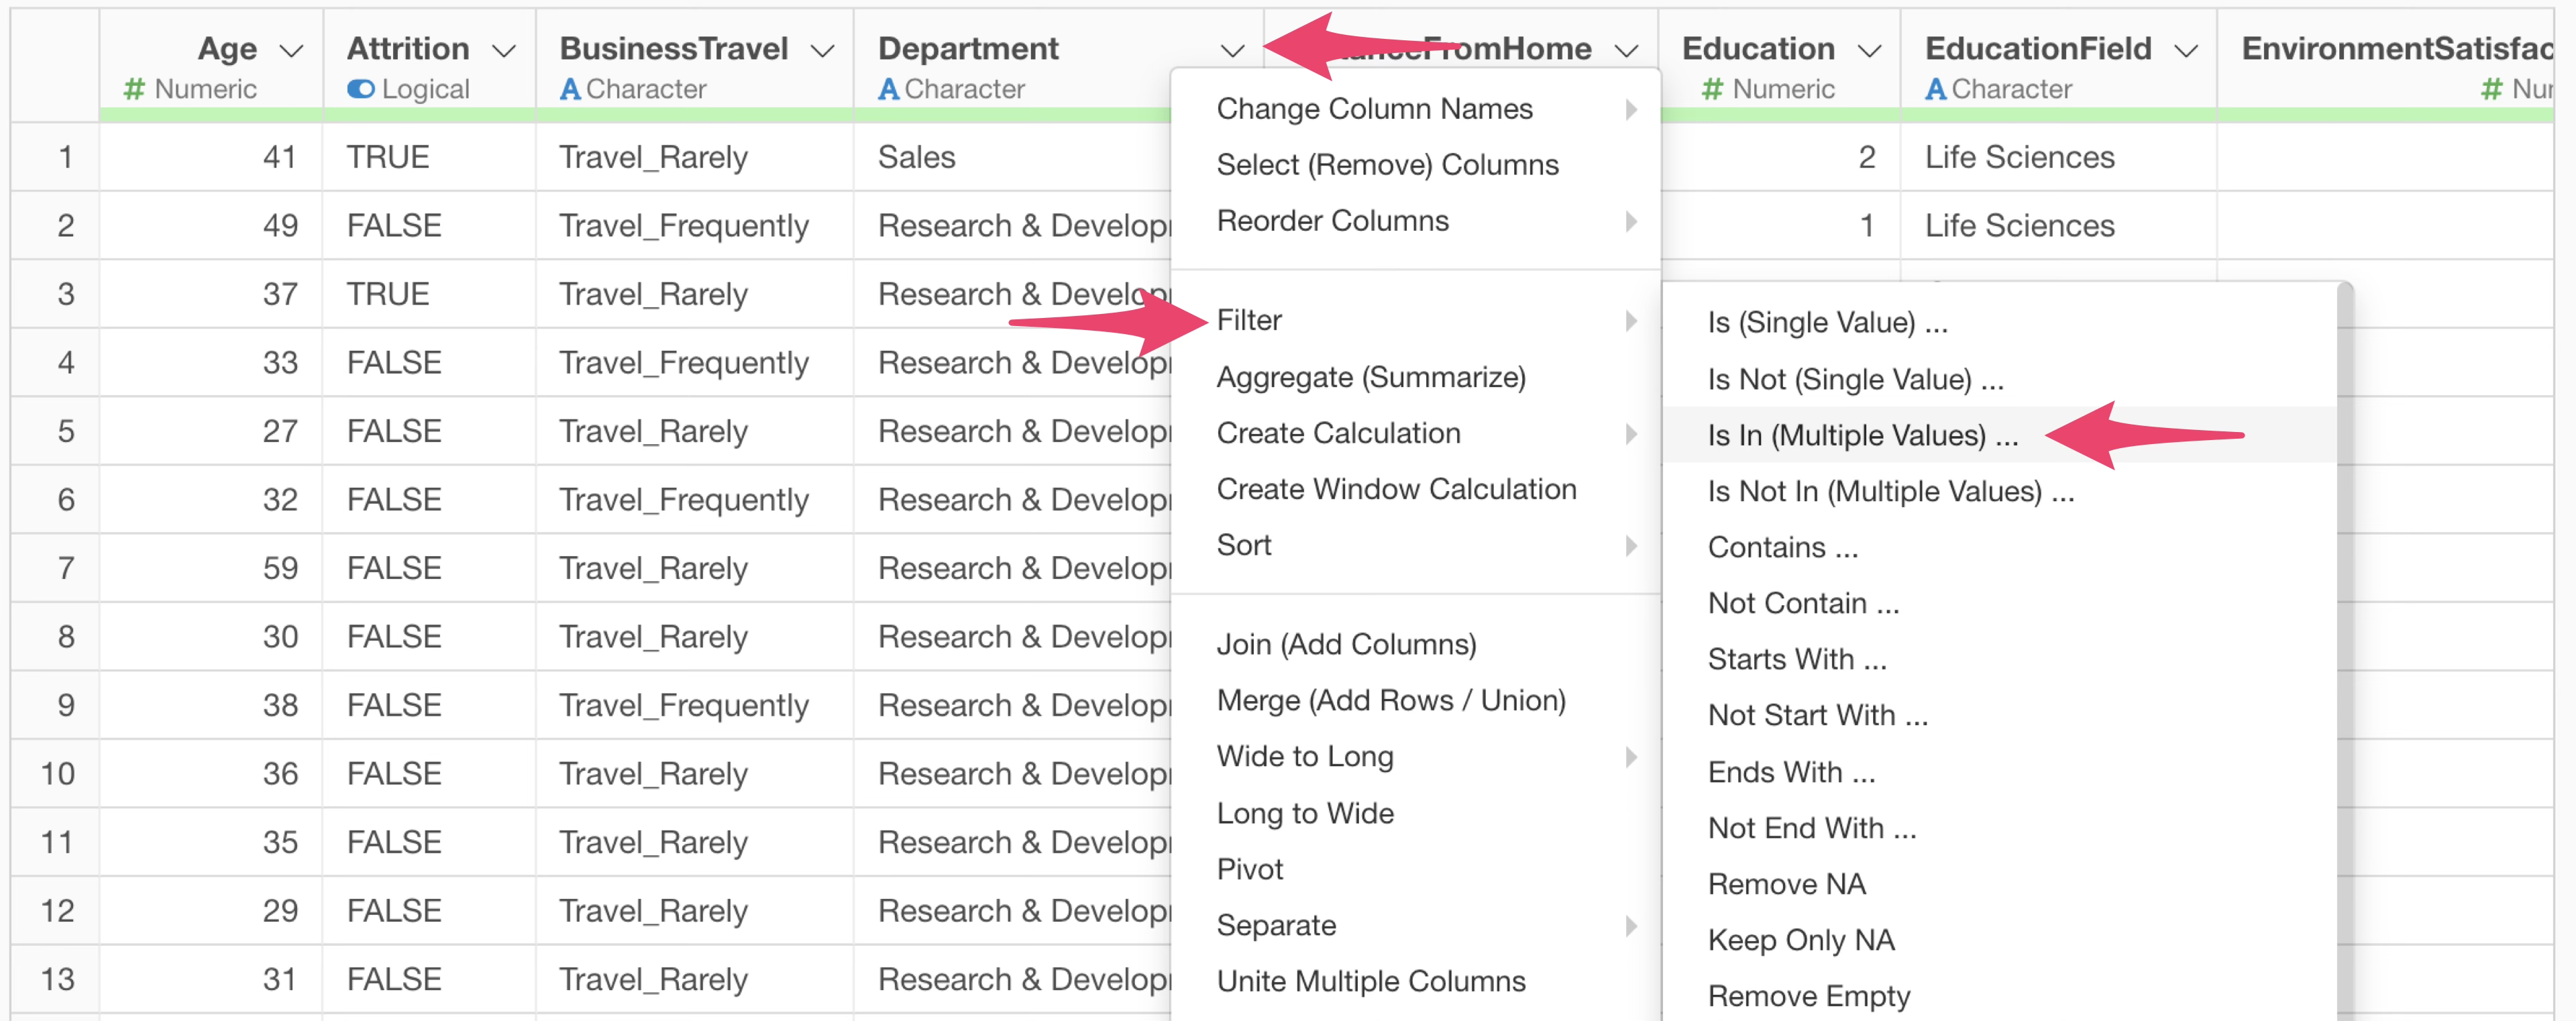
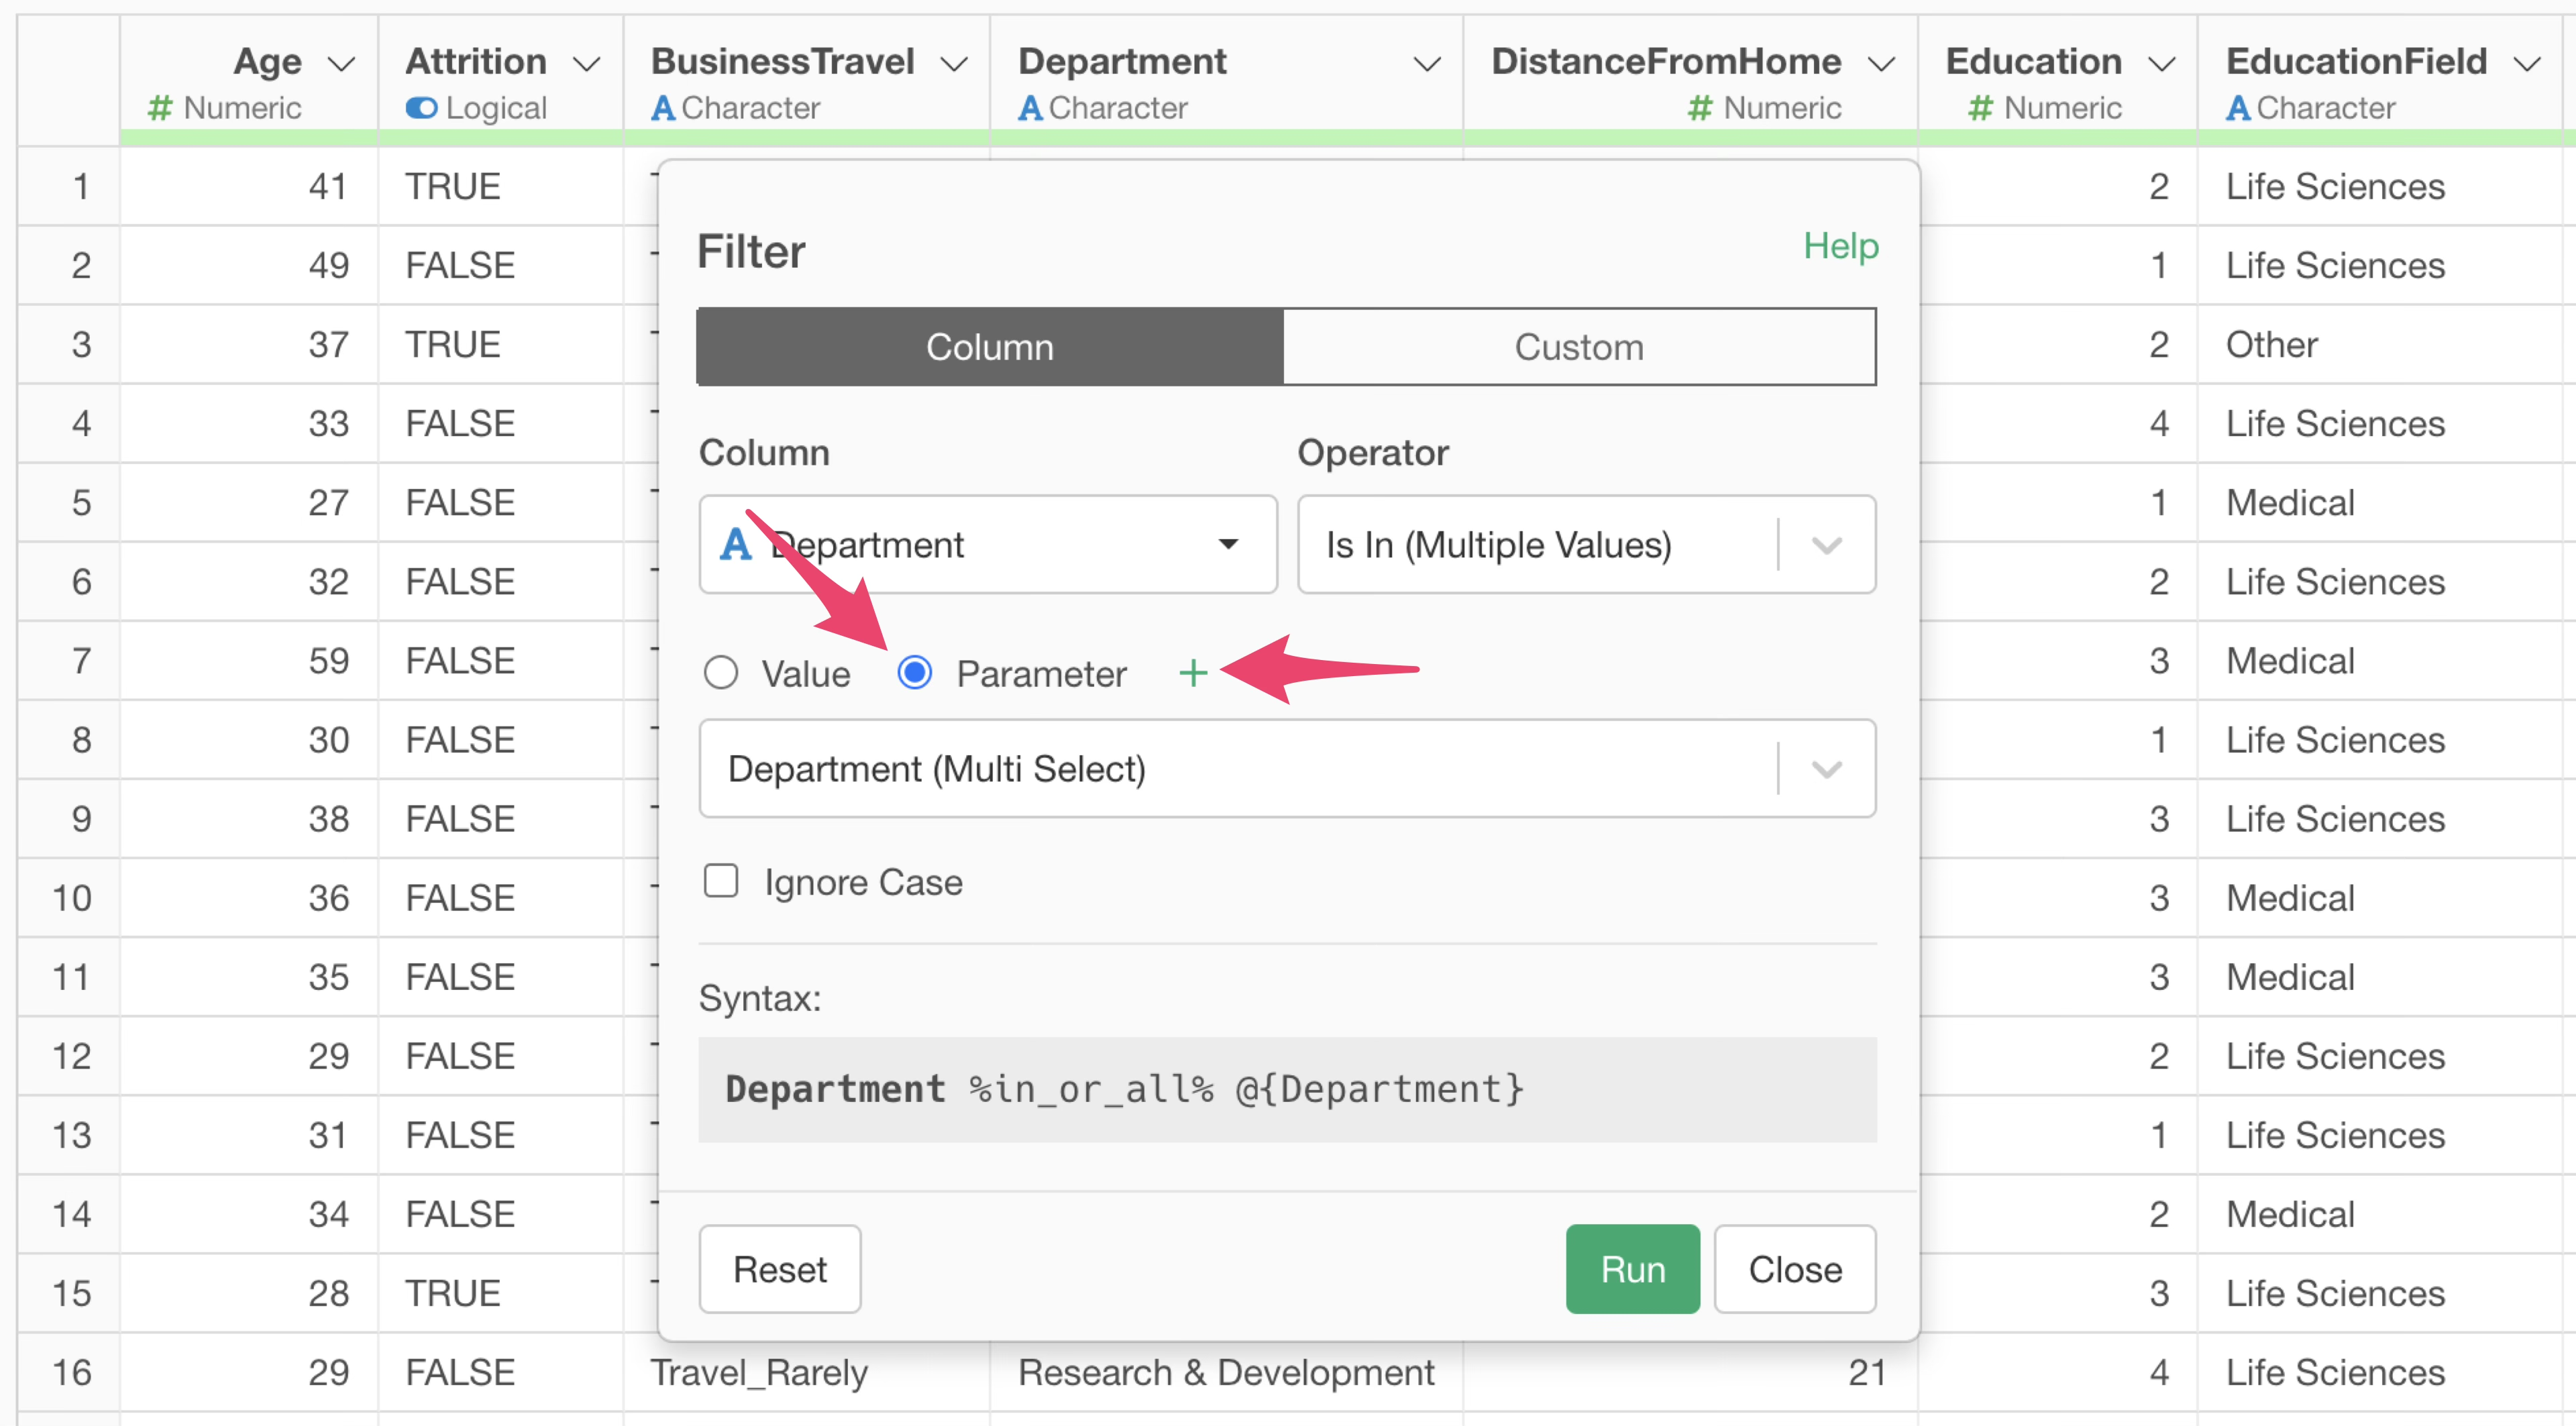
We want to filter by department using a parameter, so select “Filter” from the Department column header menu, and then choose “is in (Multiple Values).”
The filter dialog will appear. Select “Parameter” and click the “Plus” button.
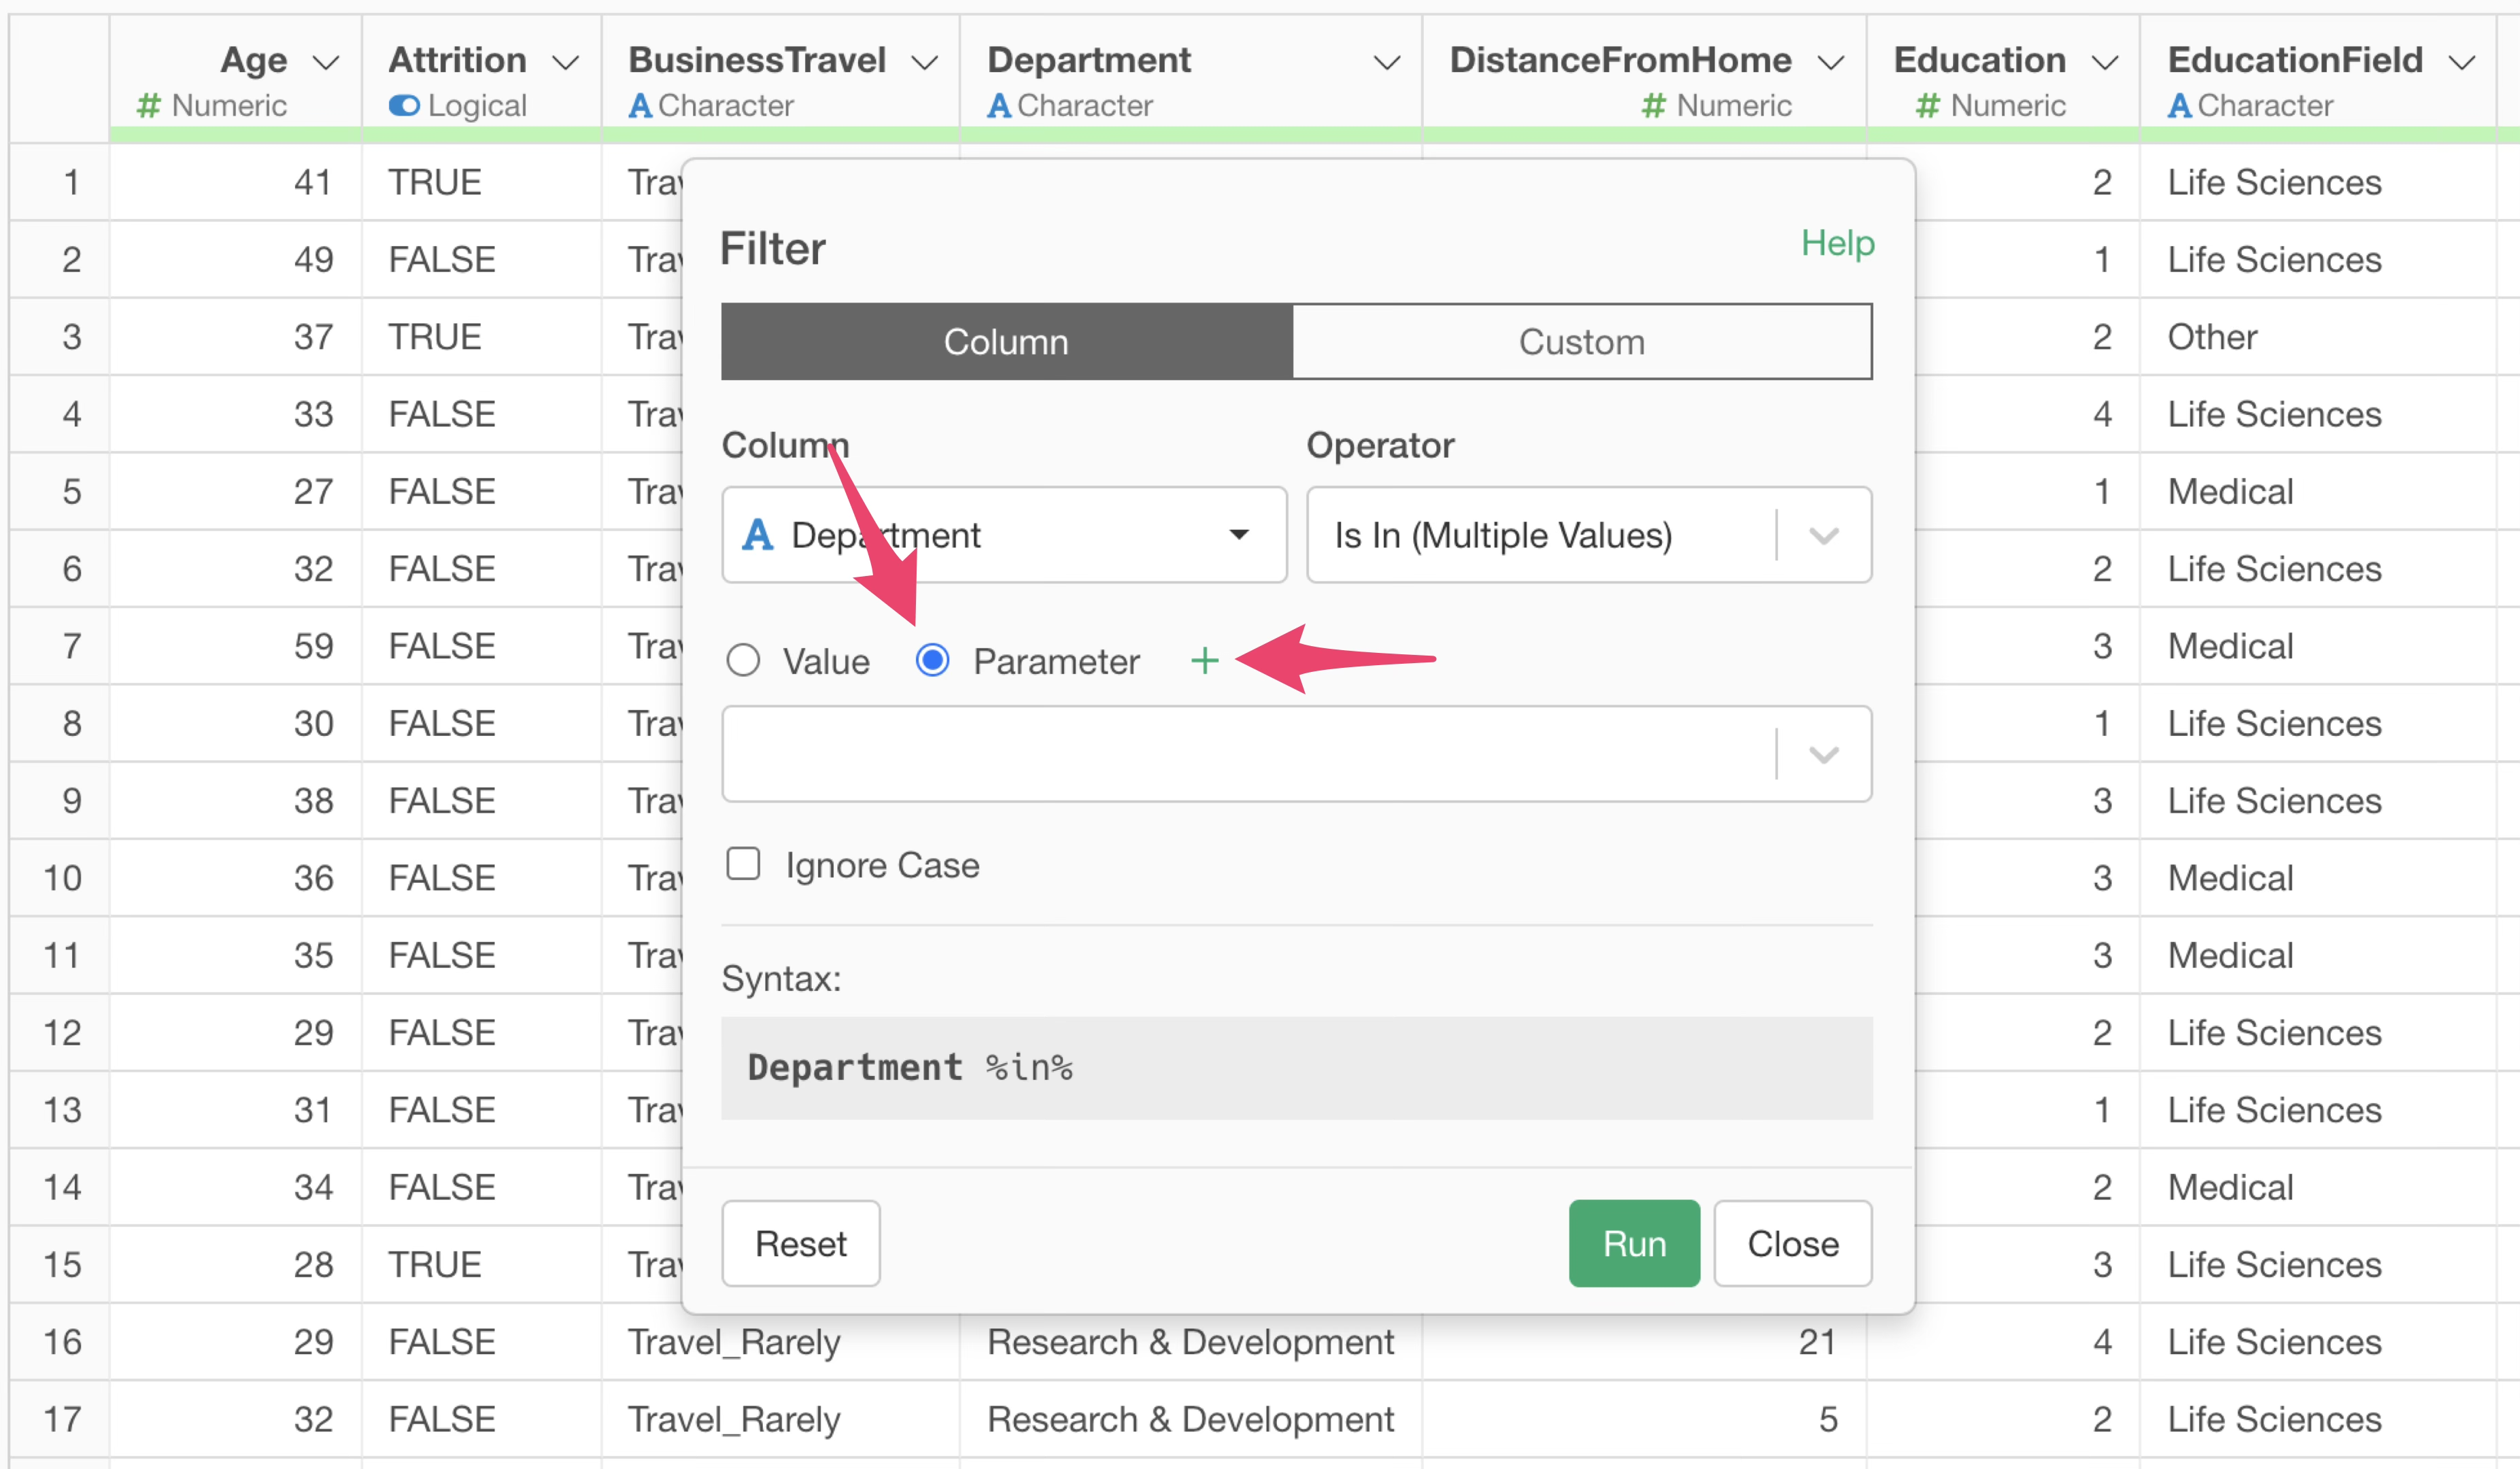
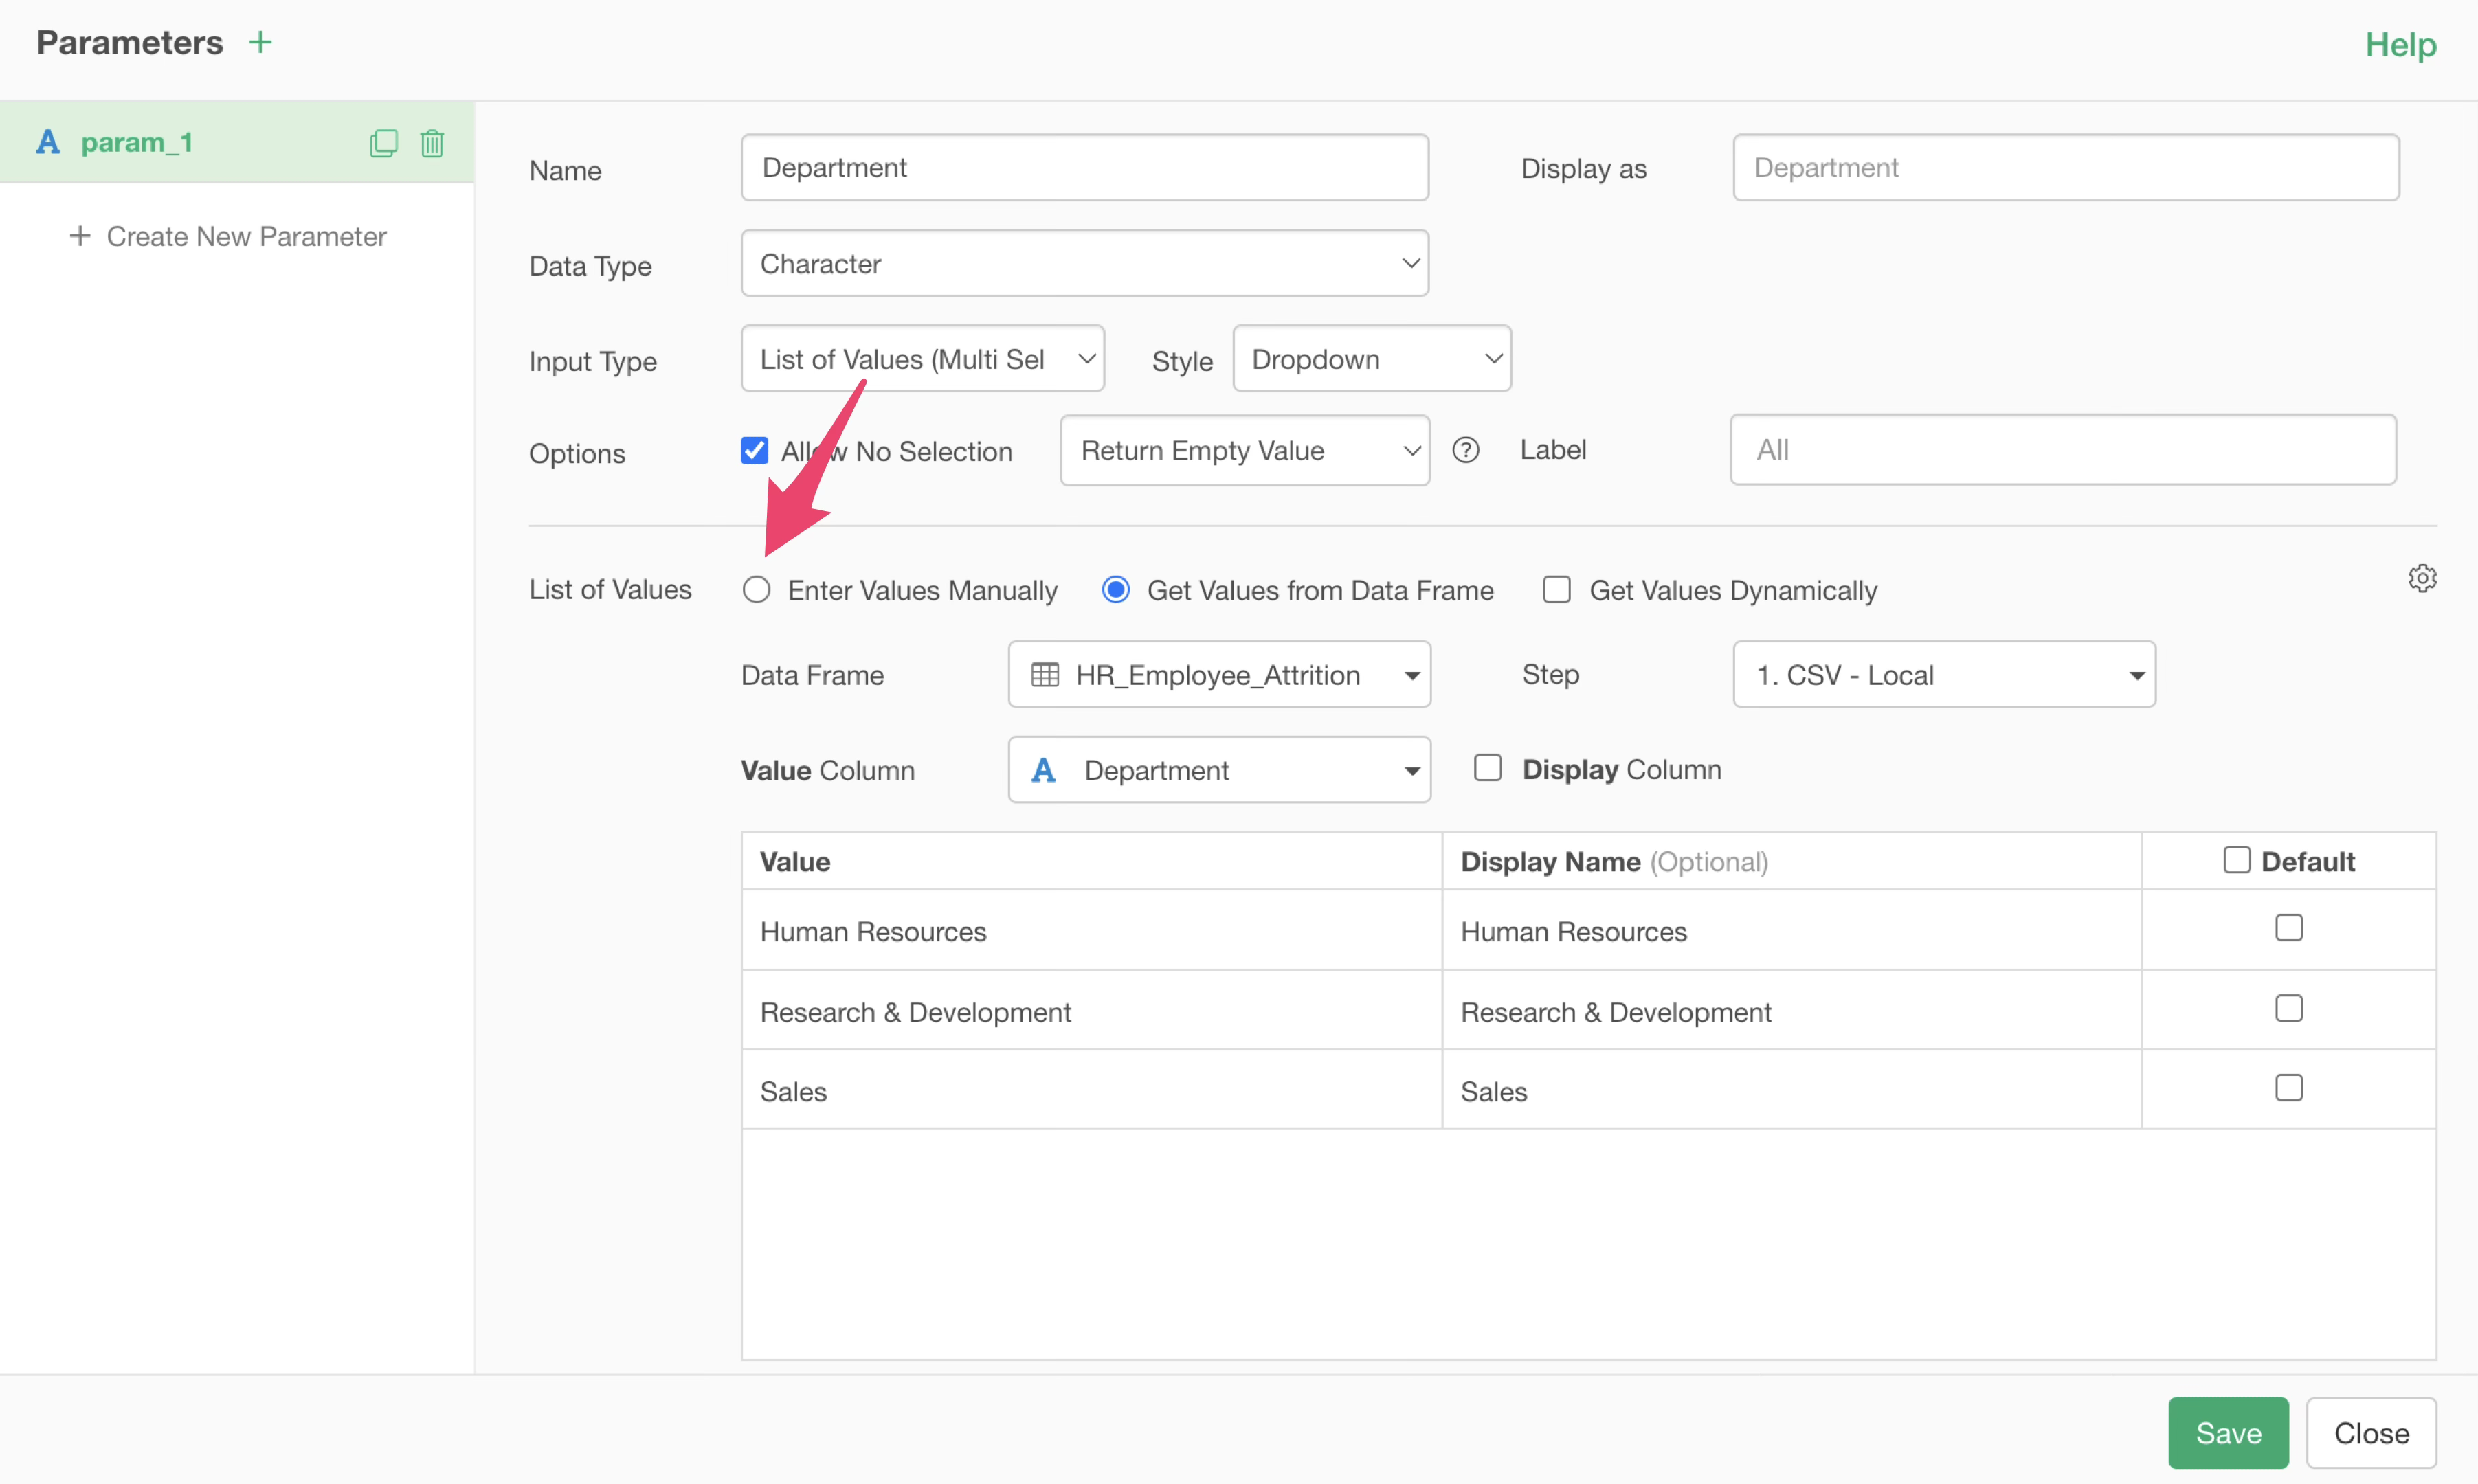
The parameter creation dialog will open.
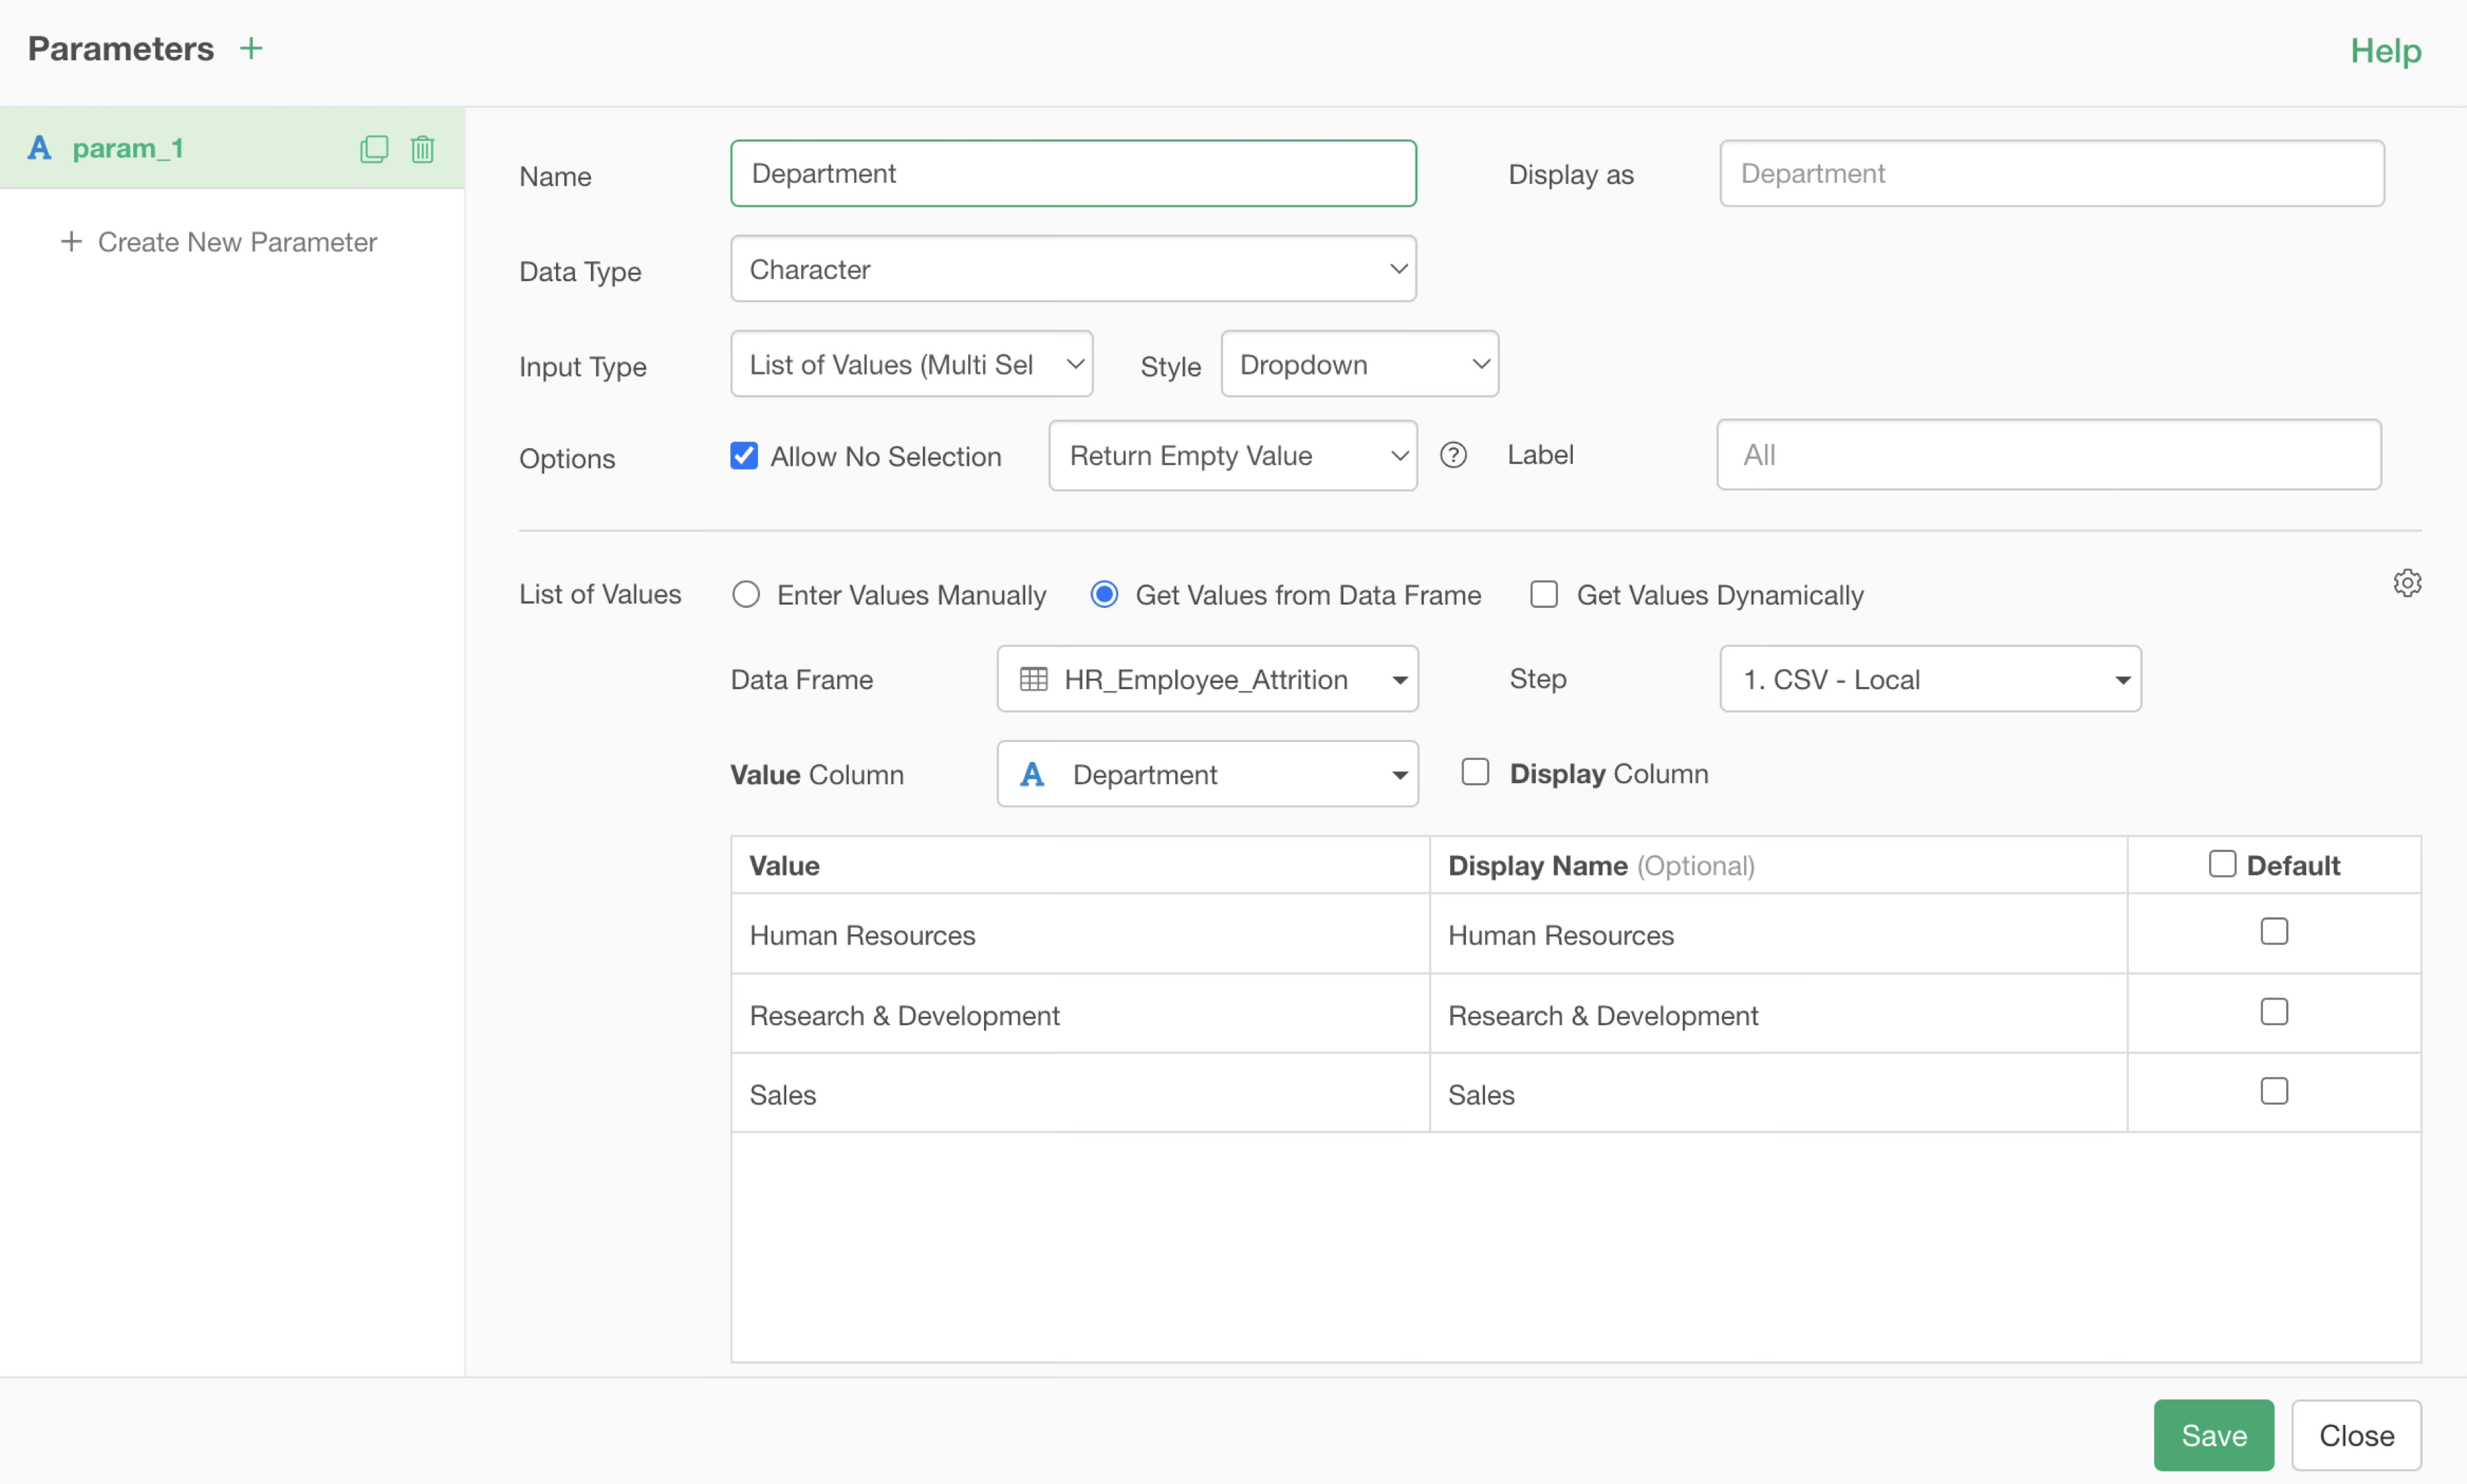
Specify the parameter name Only alphanumeric characters and underscores ( _ ) can be used for the name.
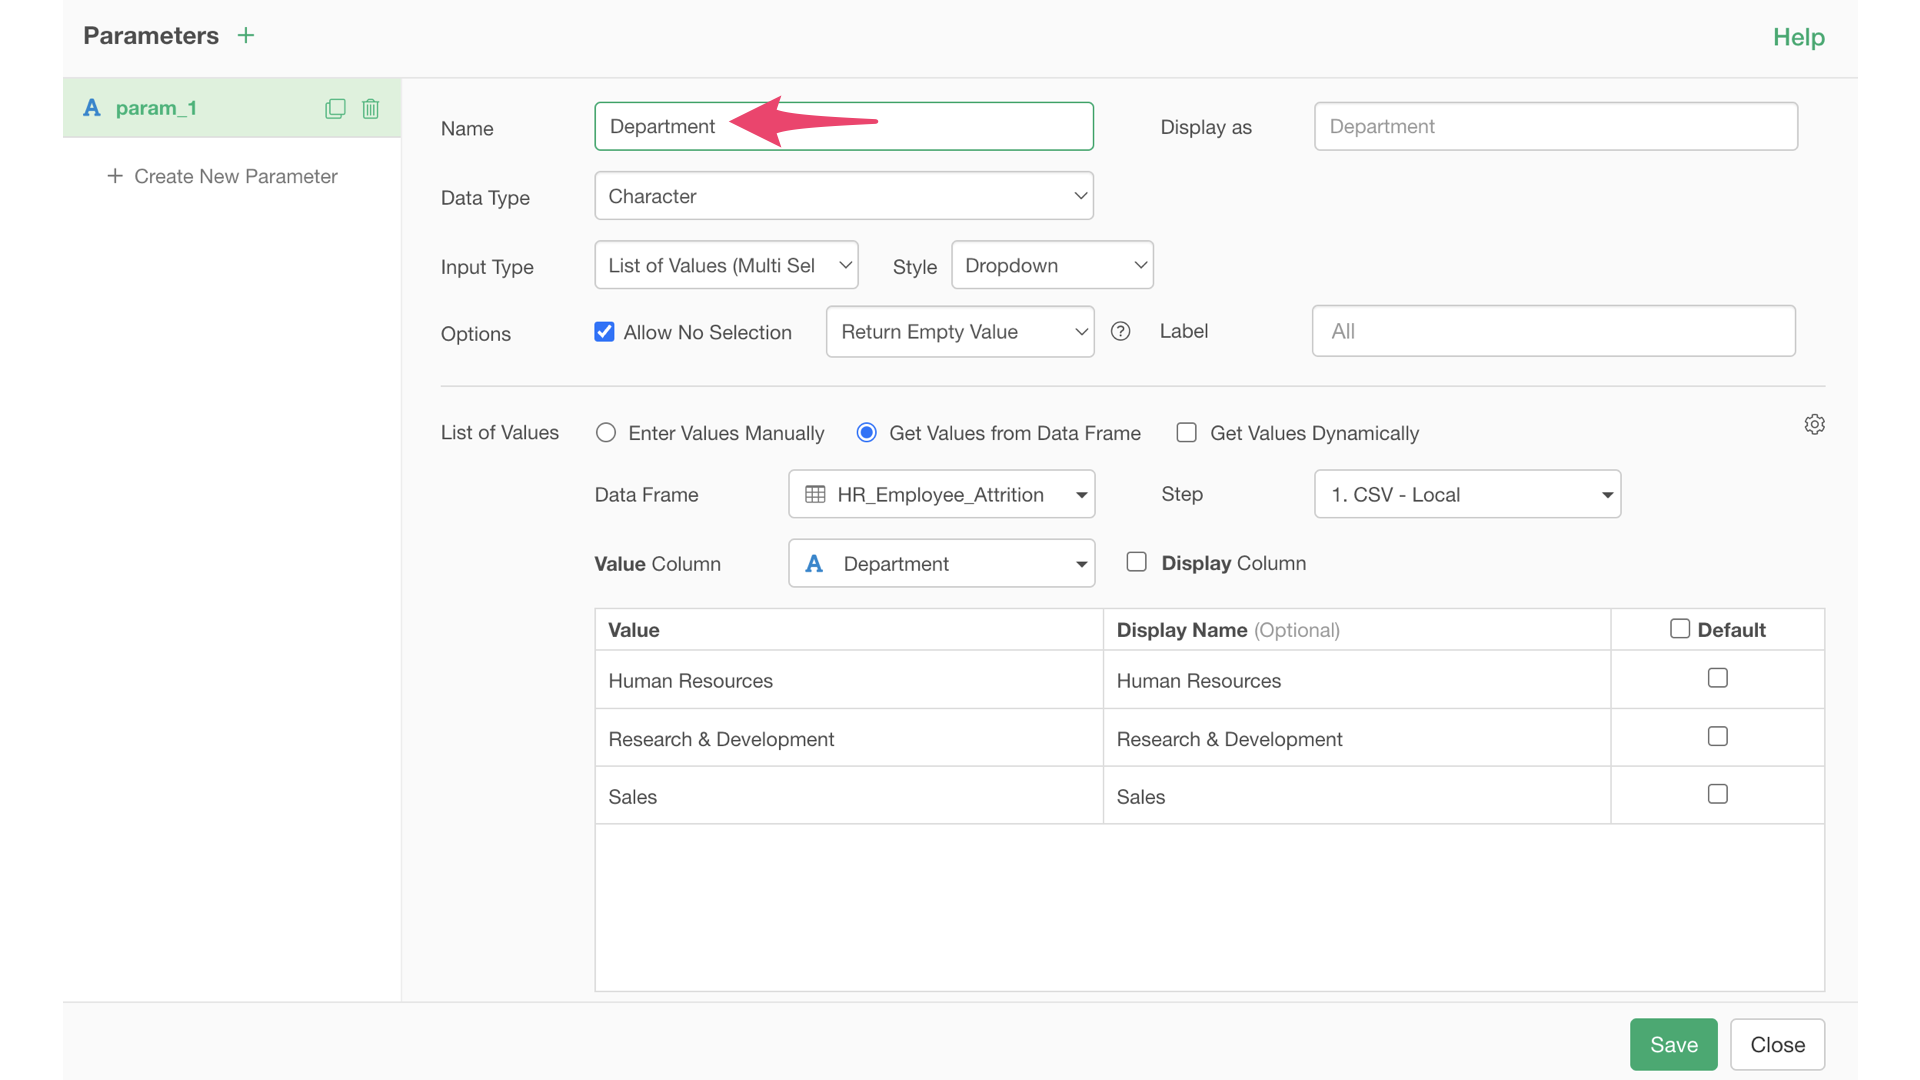
“Character” is selected for the data type, and “List of Values (Multiple Selection)” is specified for the input type.
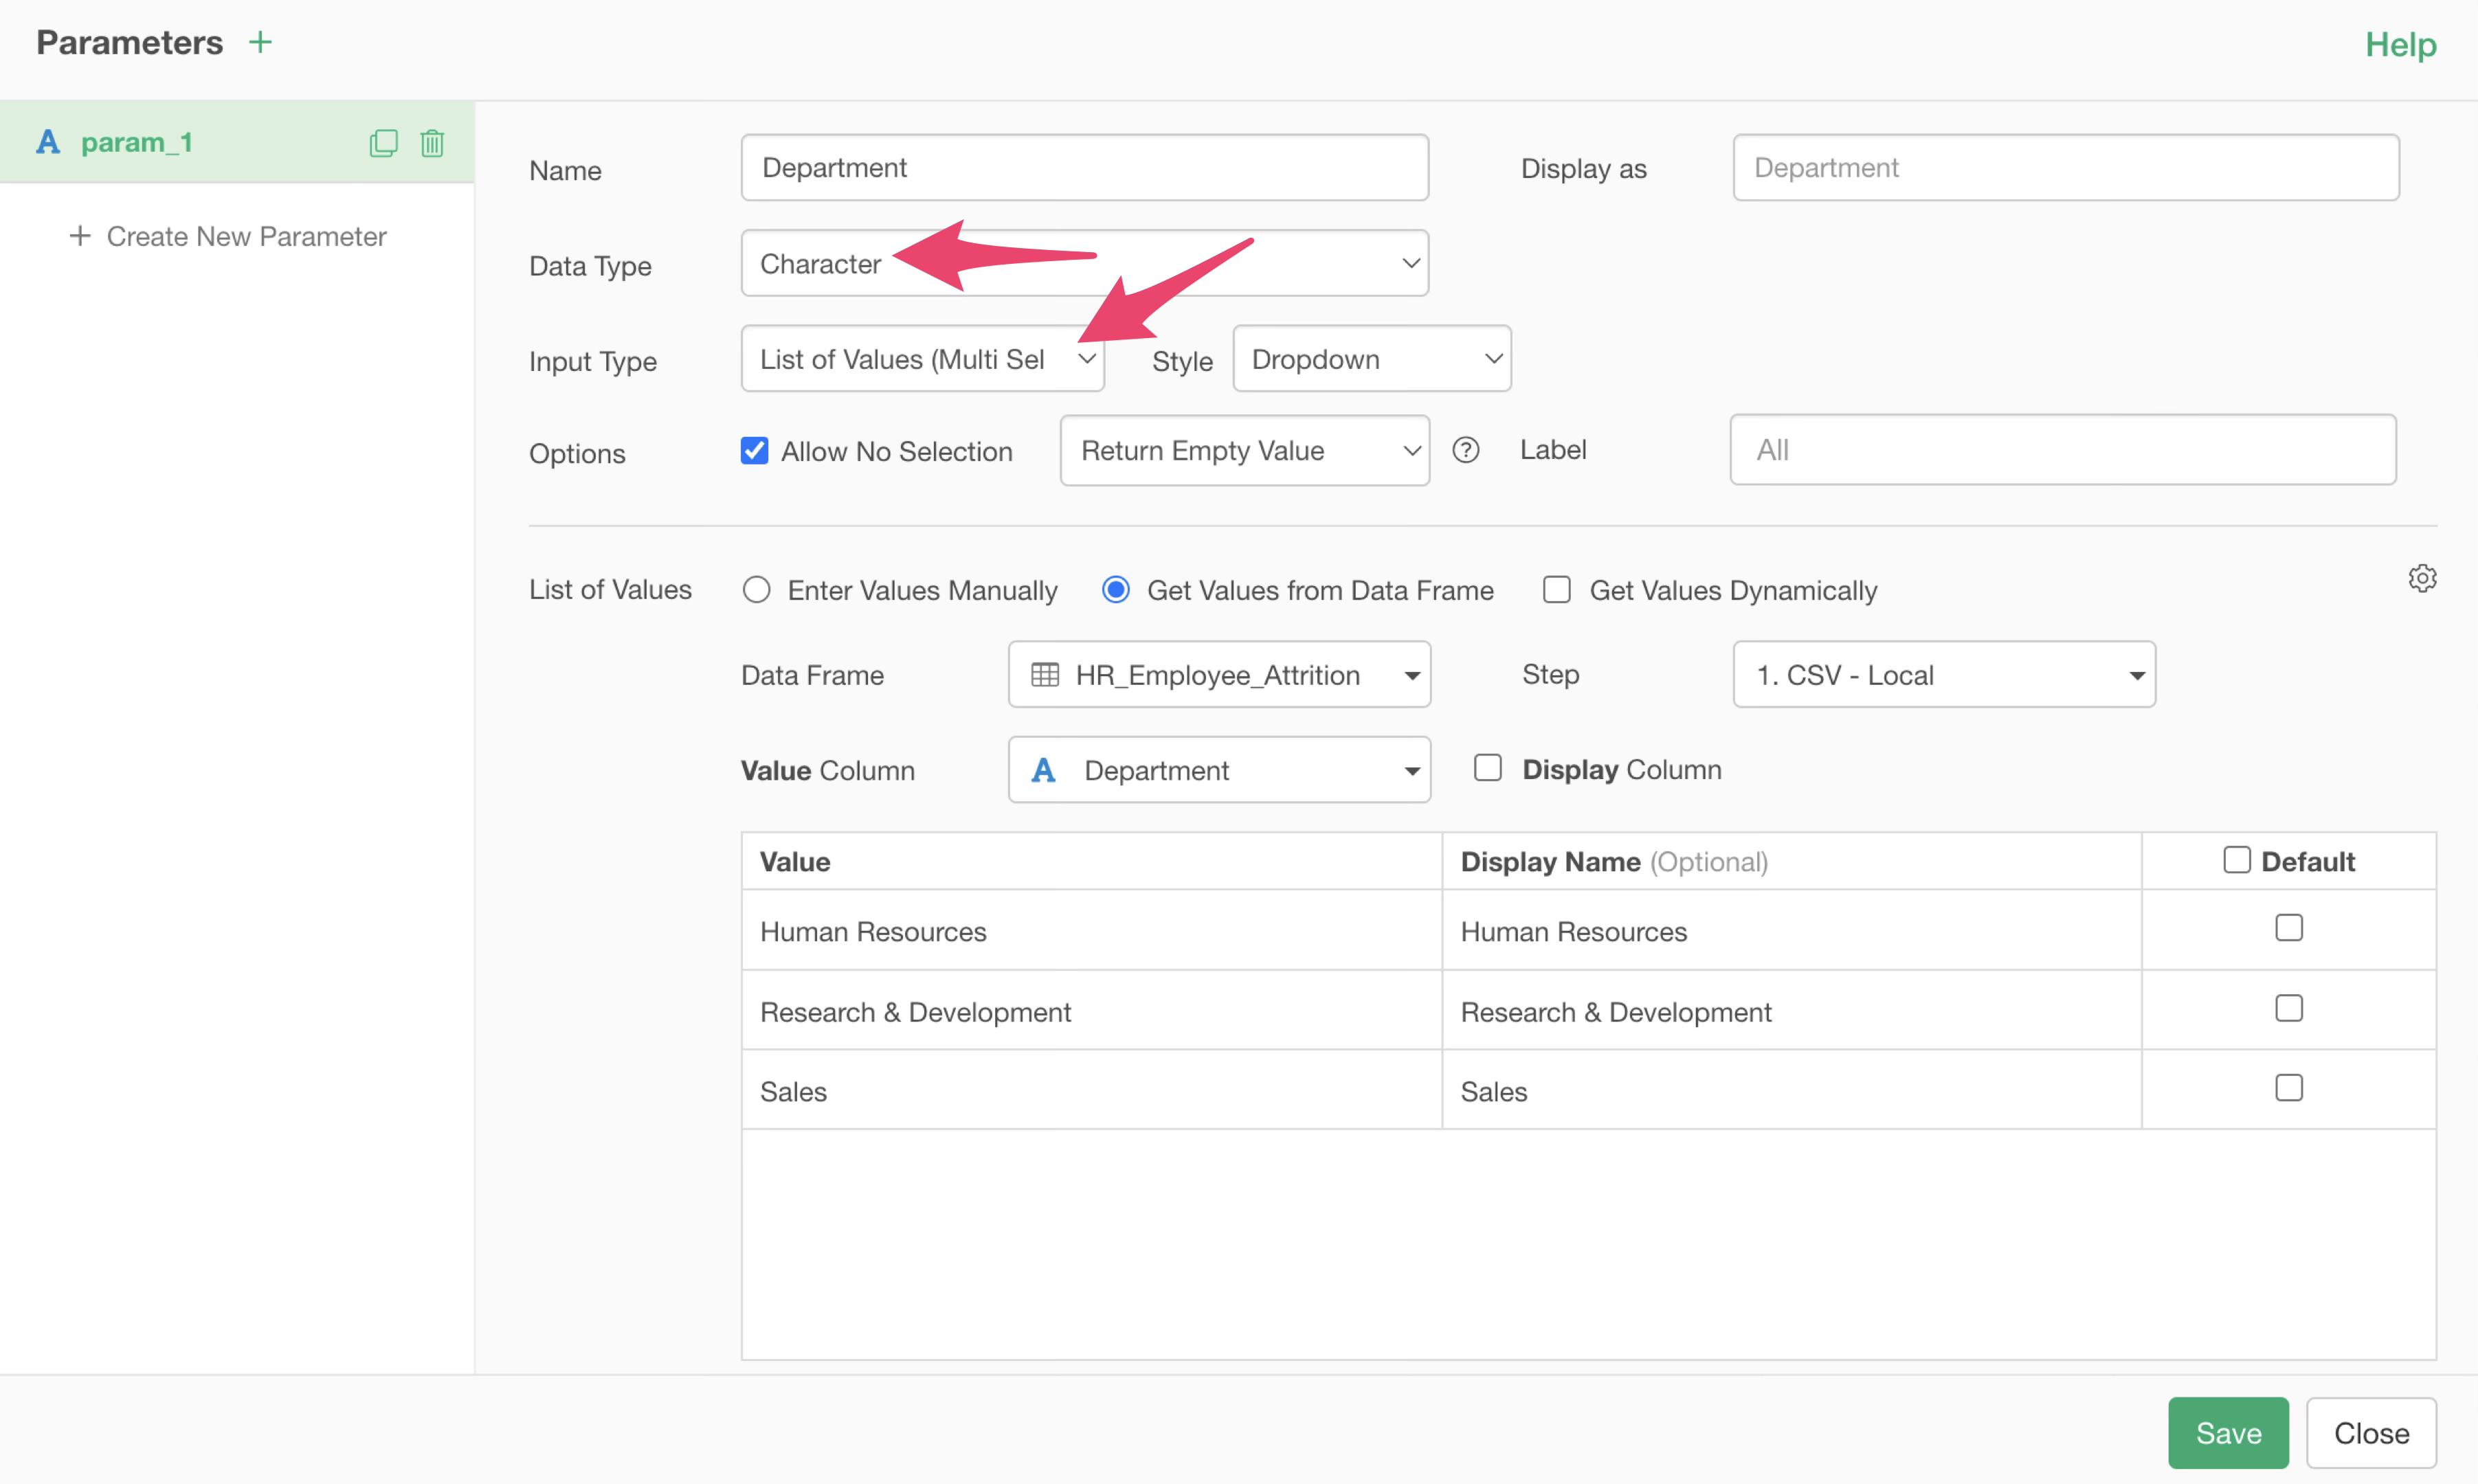
This data type and input type must match the data type and operator of the data to be filtered.
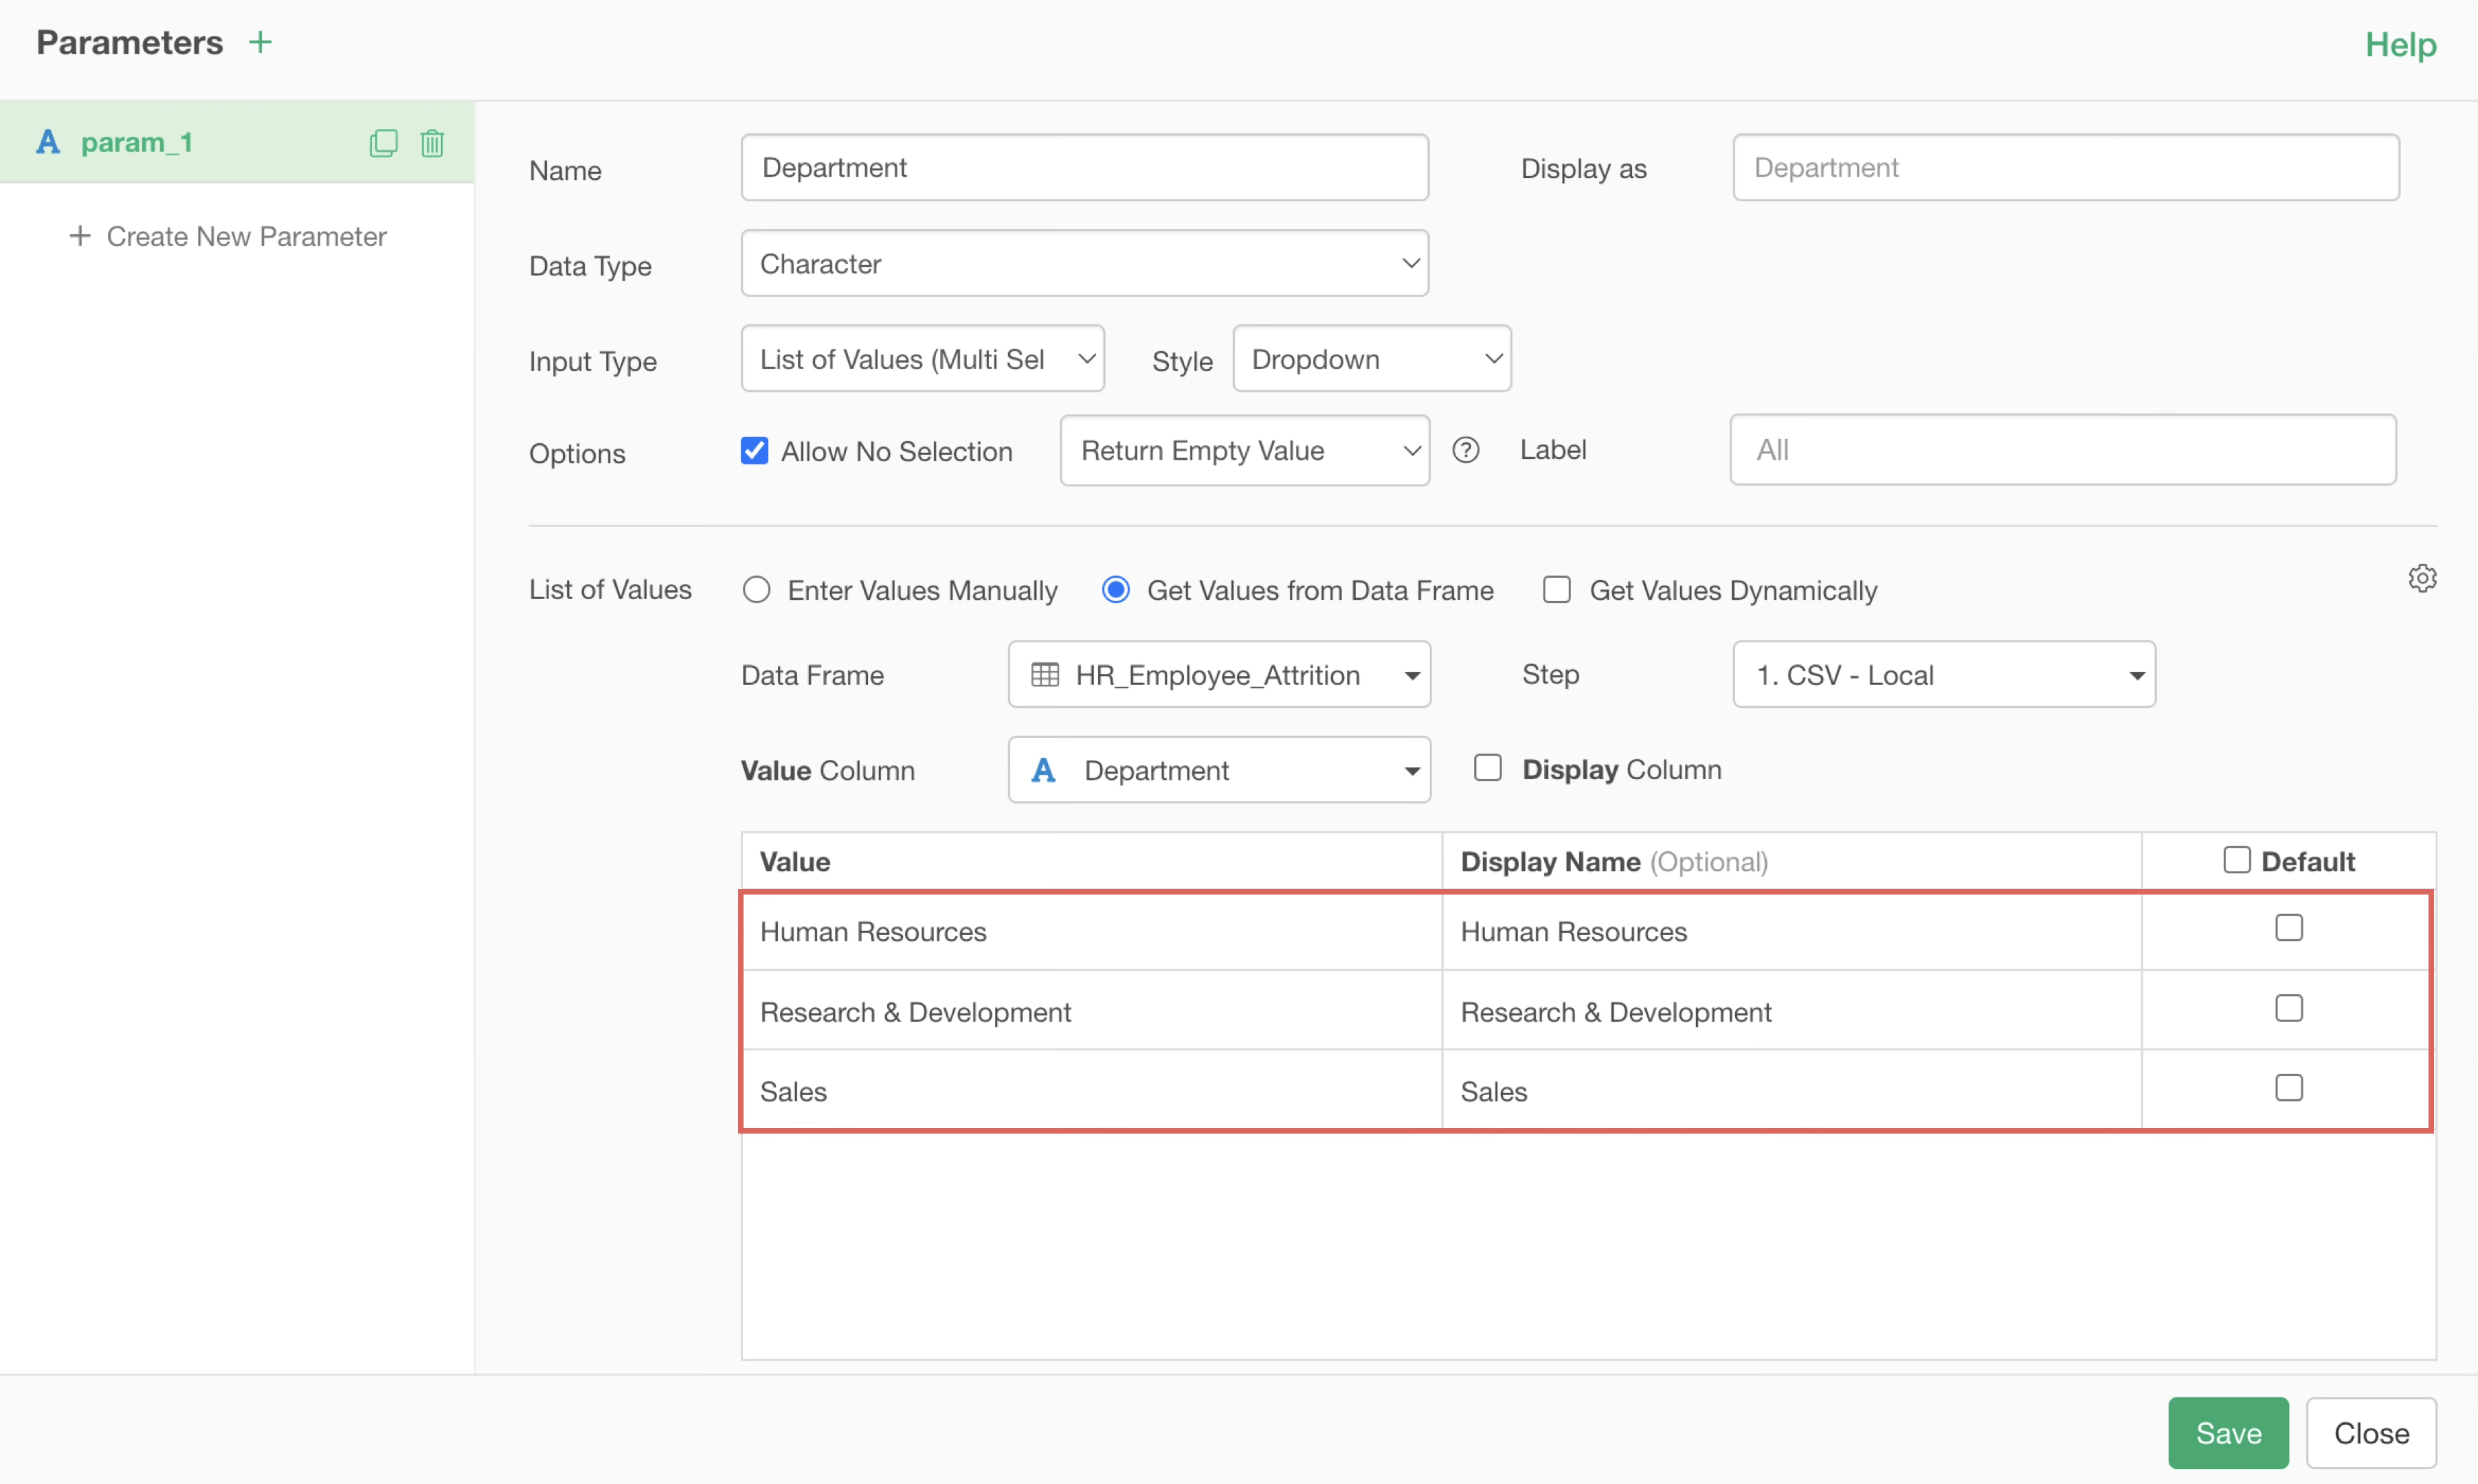
The list of values is already set as shown below.
If you want to get values from a data frame, you can use the values of a specific column from a specific step in the data frame you choose.
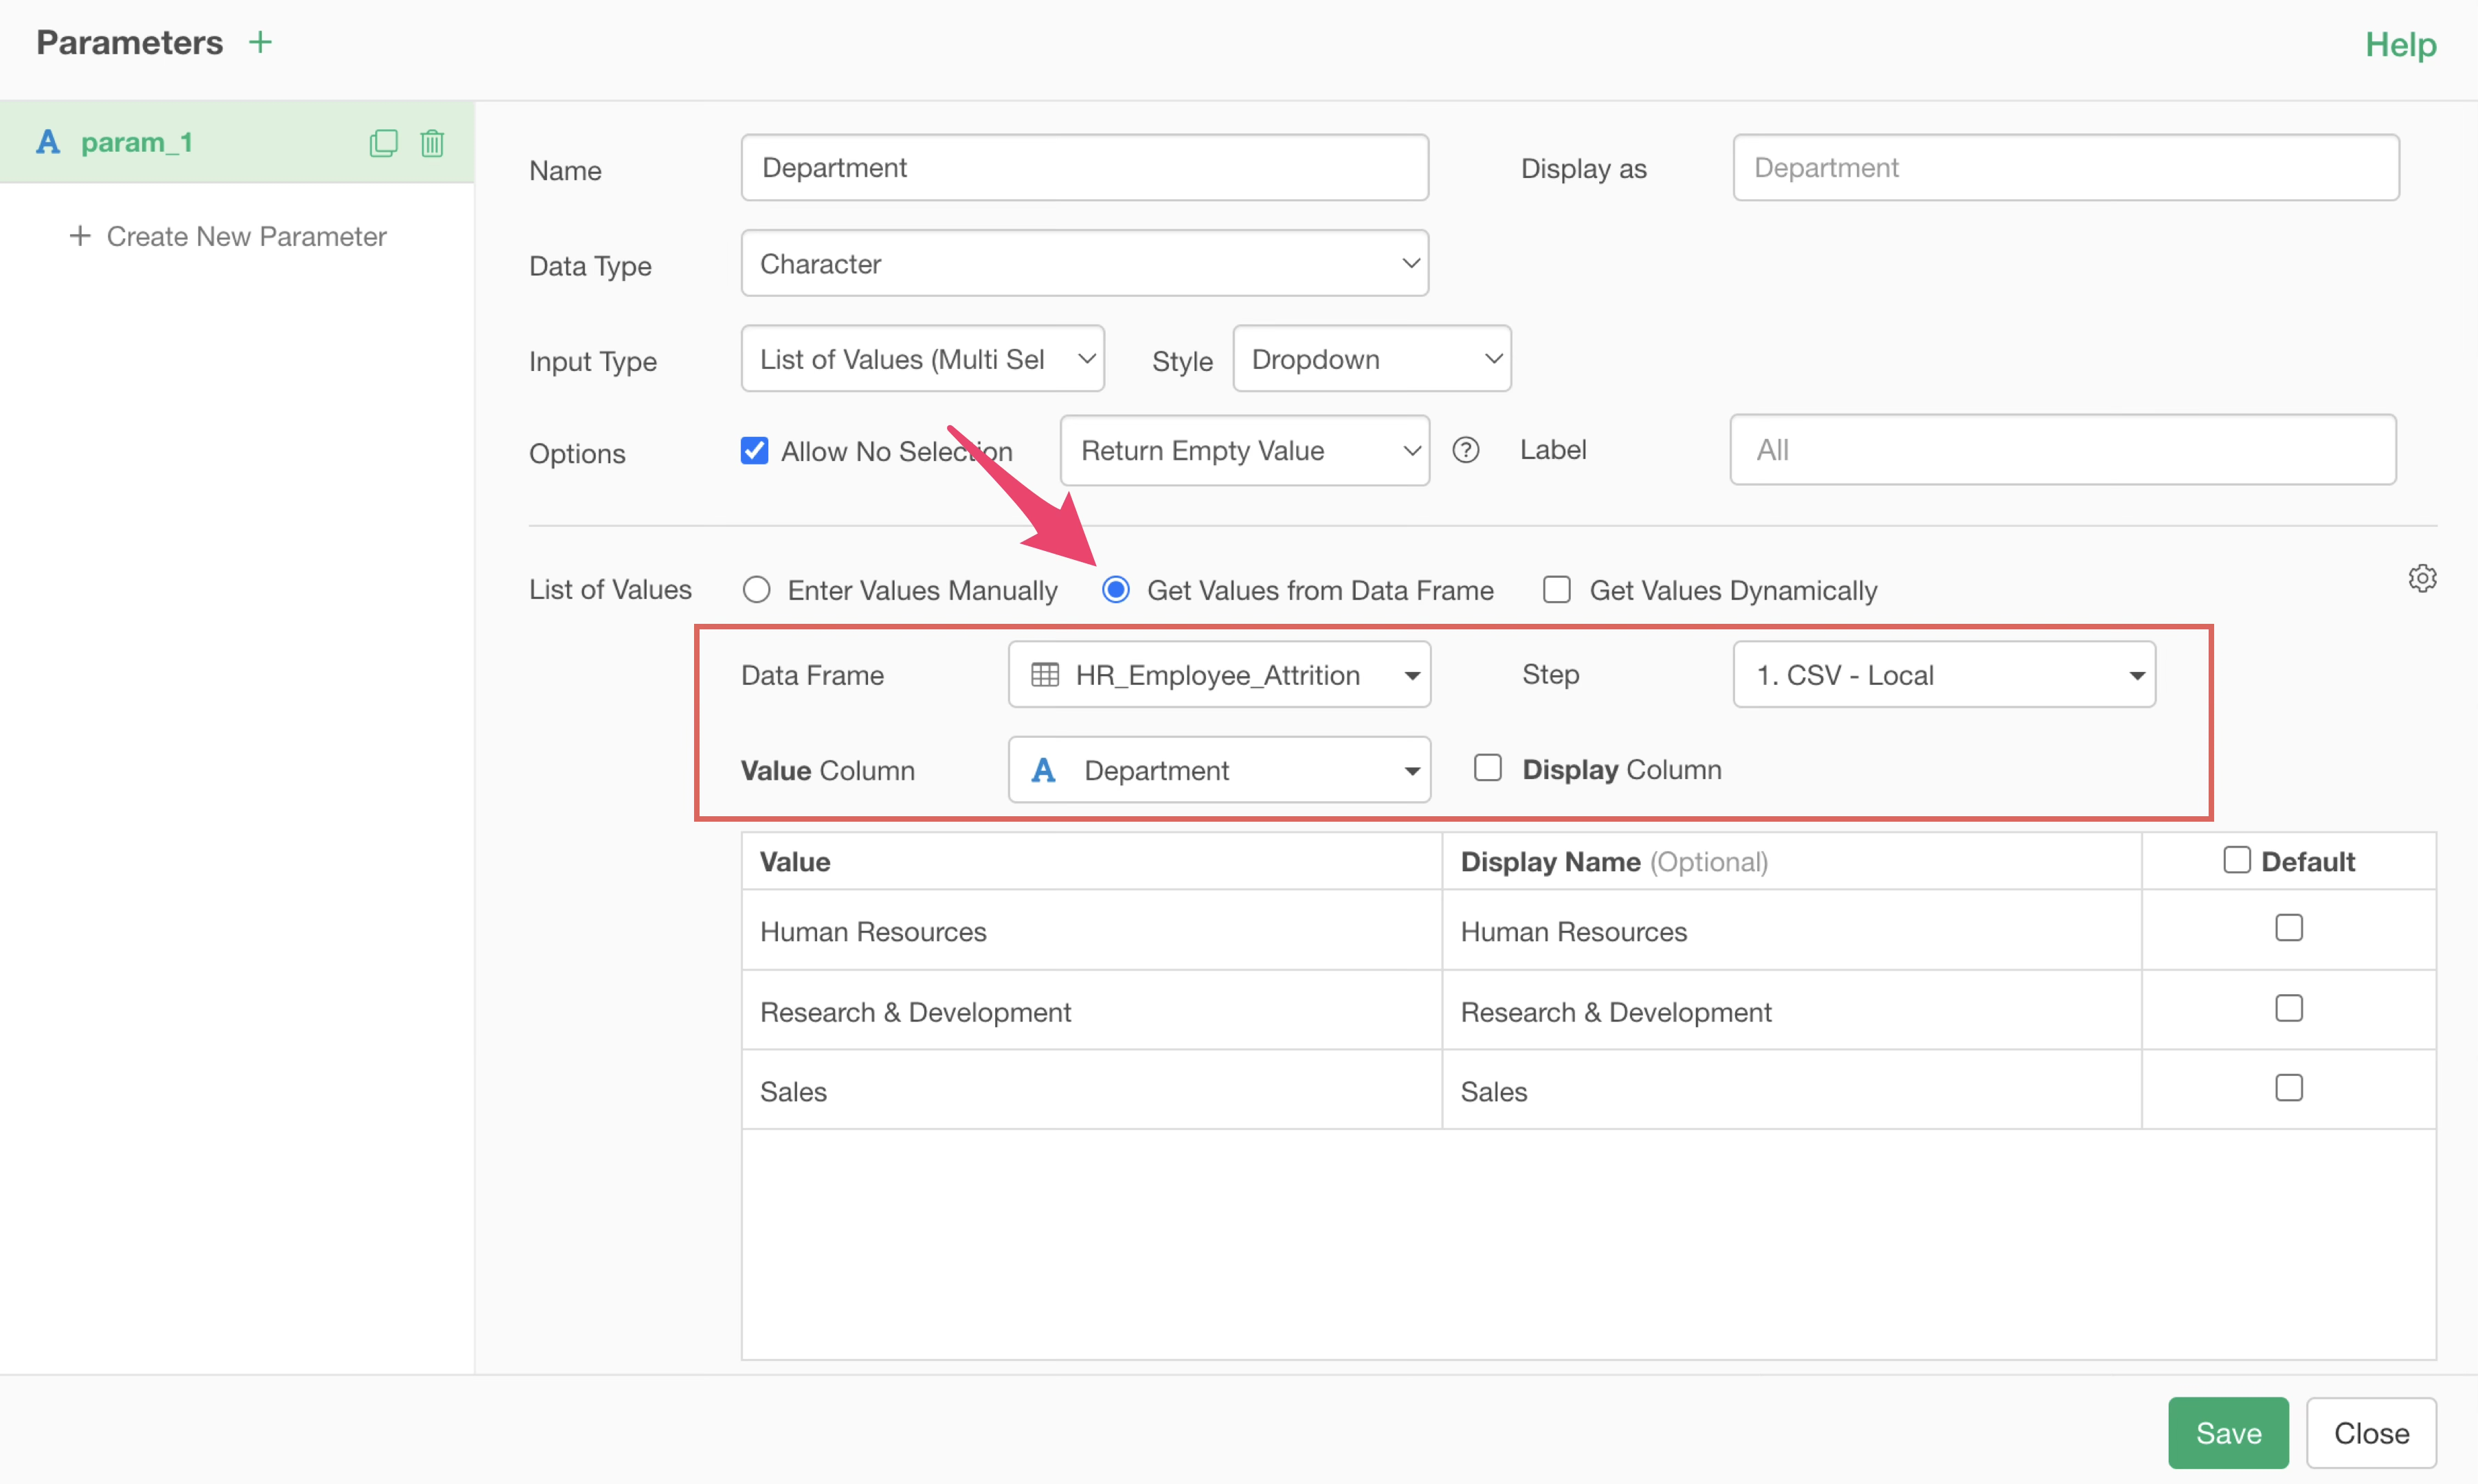
If you want to set values manually, please use “Enter values manually.”
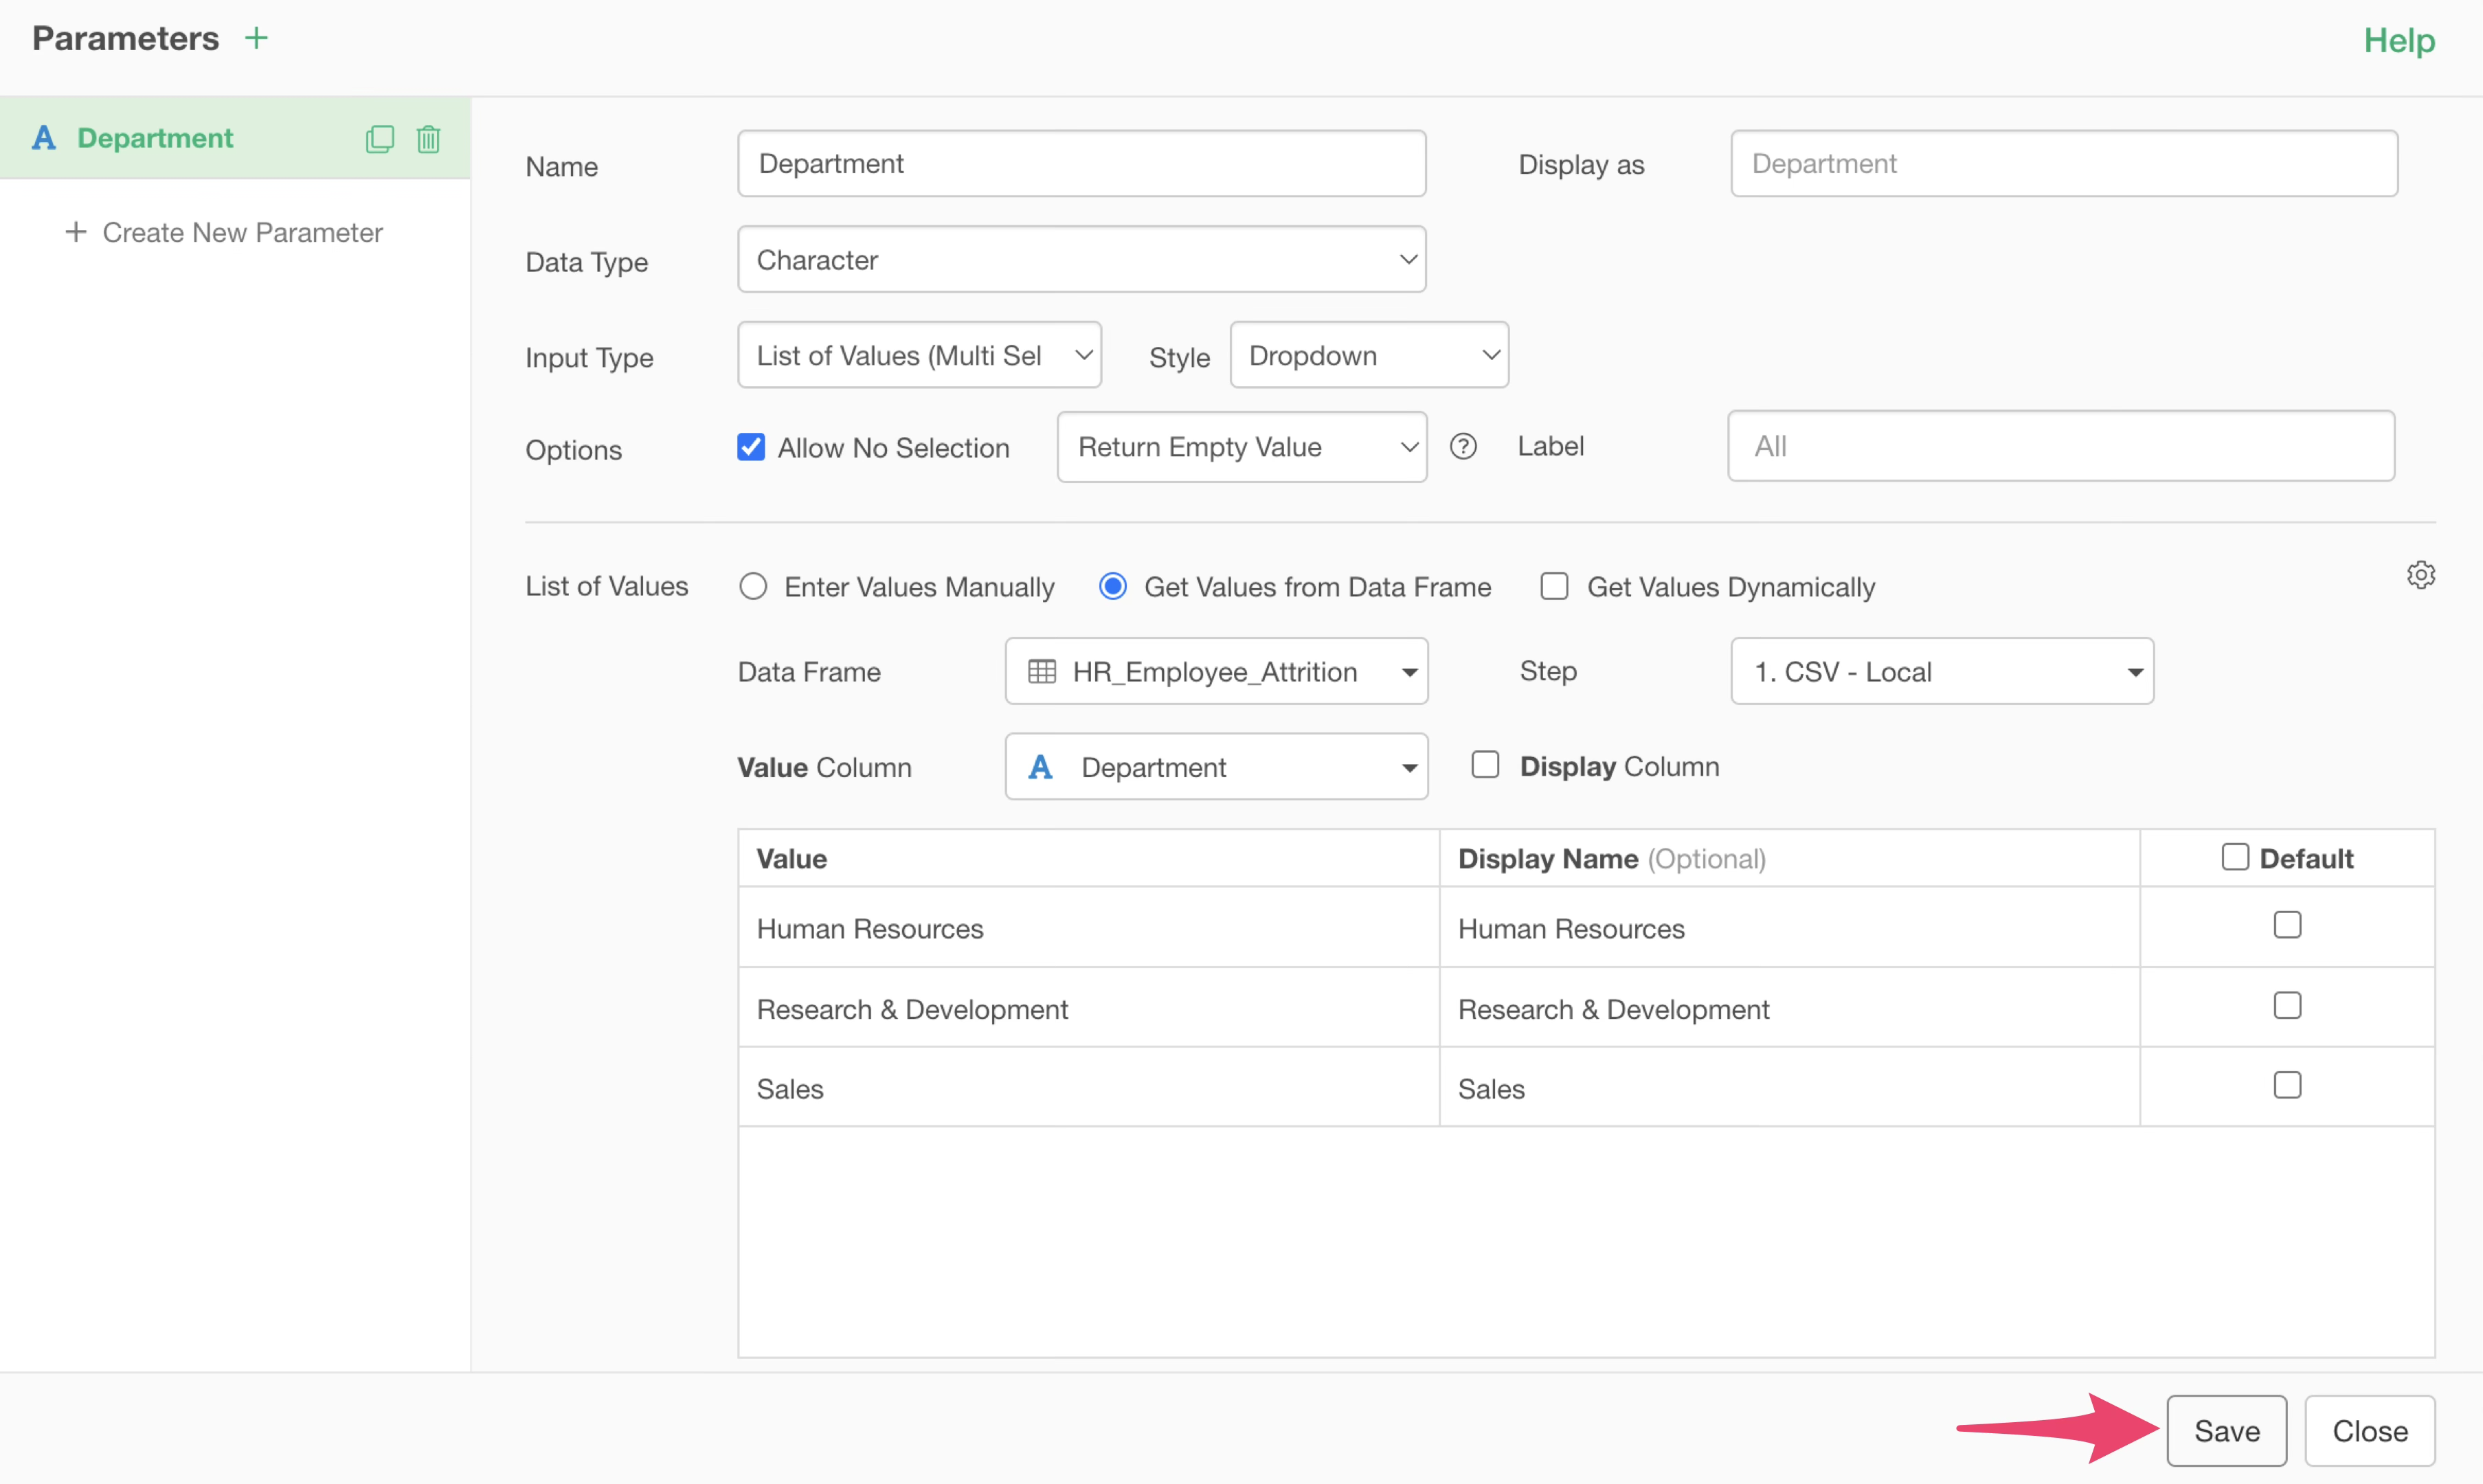
Once the parameter settings are complete, click the “Save” button.
The parameter you just created is set in the filter dialog, so click the “Run” button.
This allows you to set a parameter for the department column.
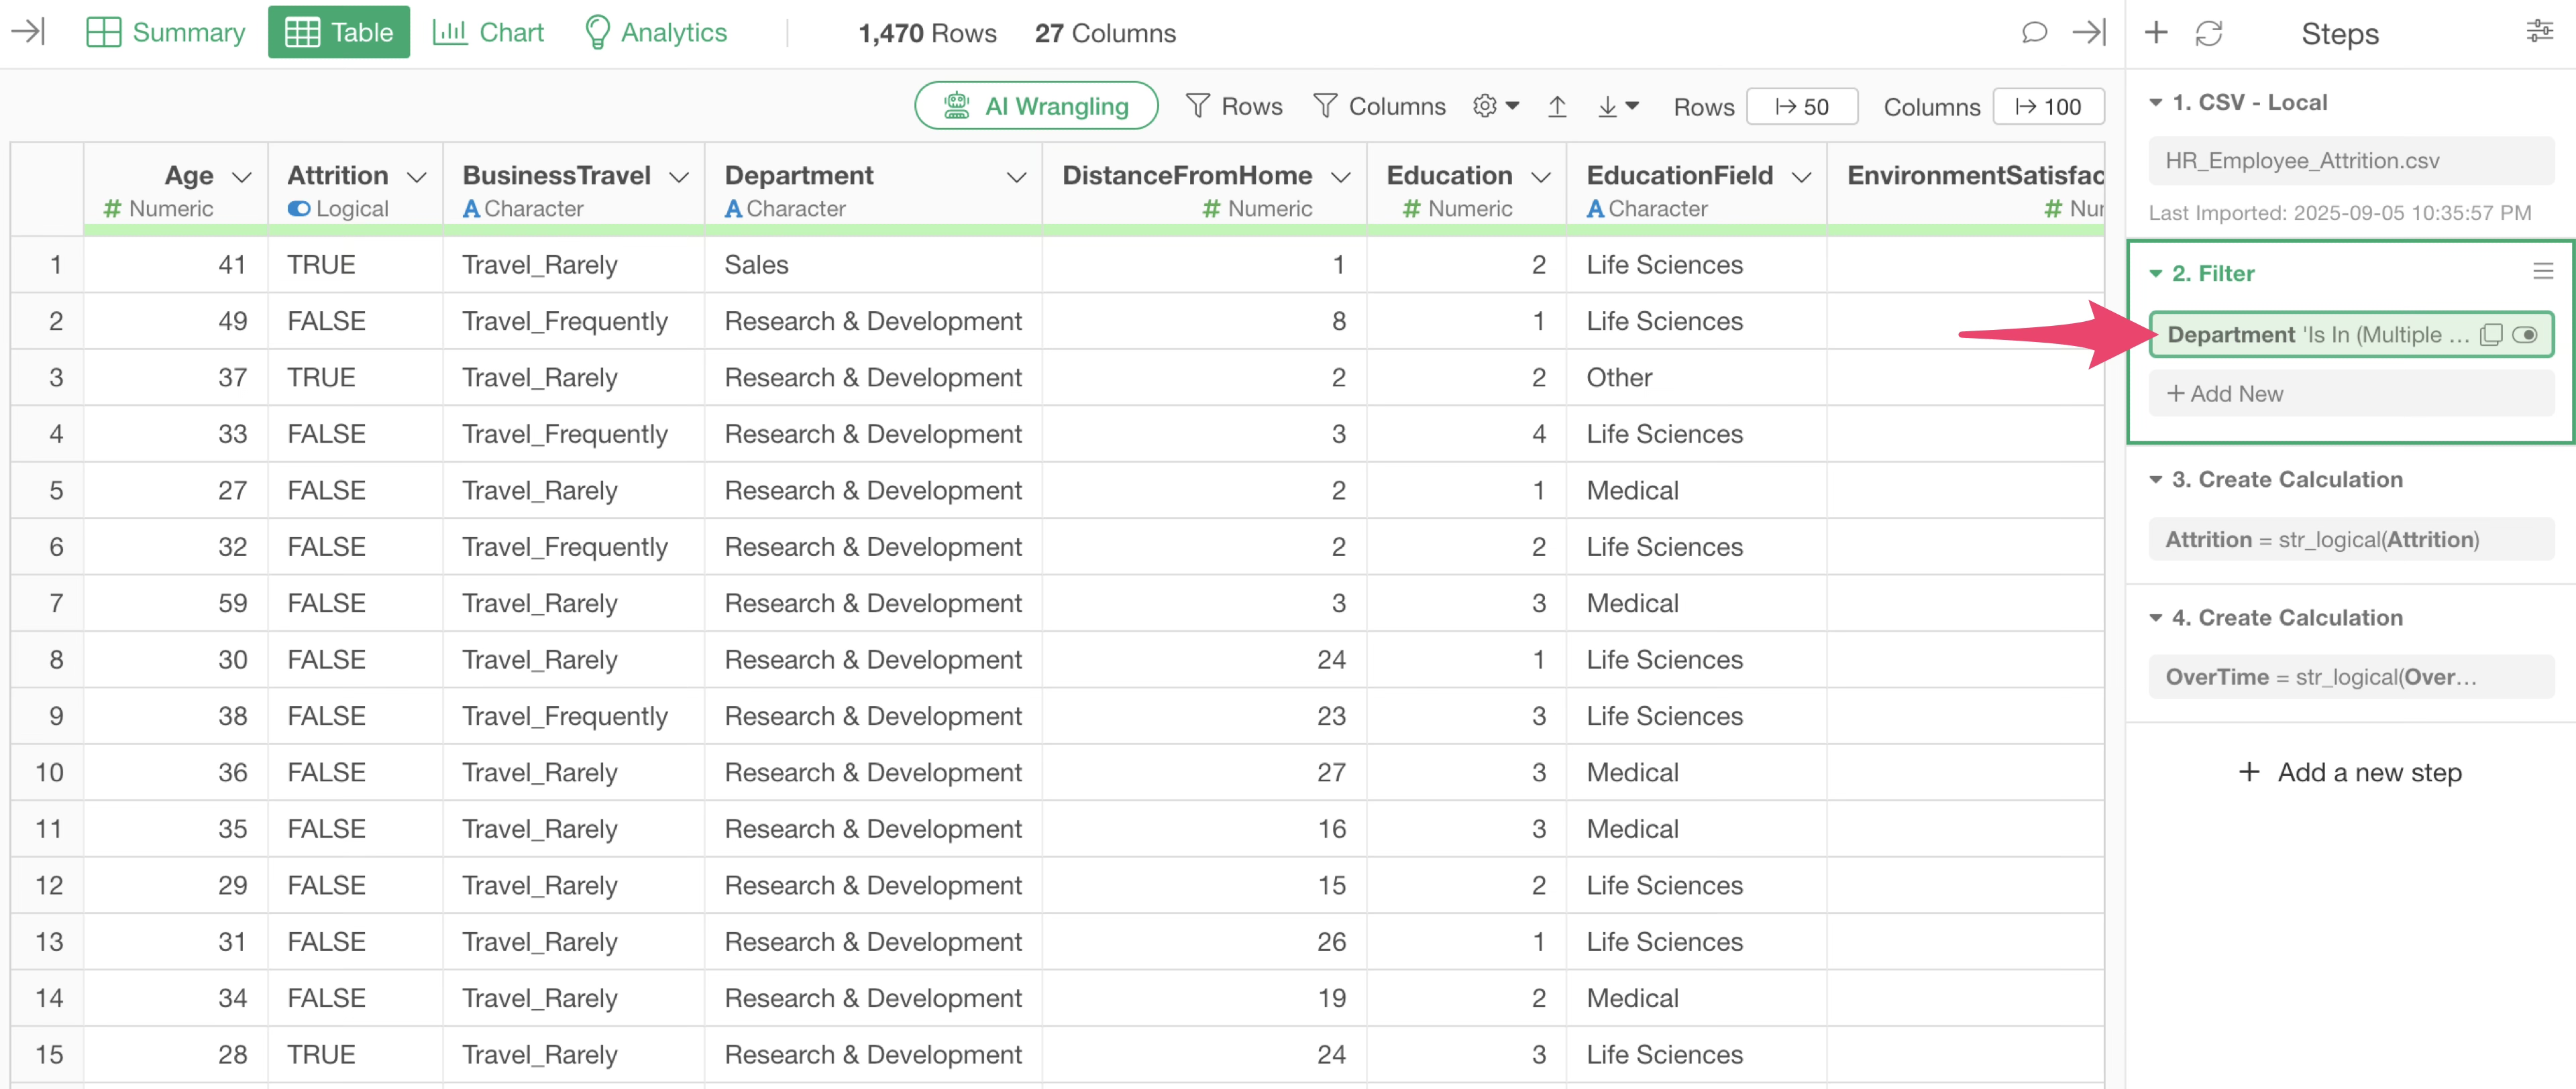
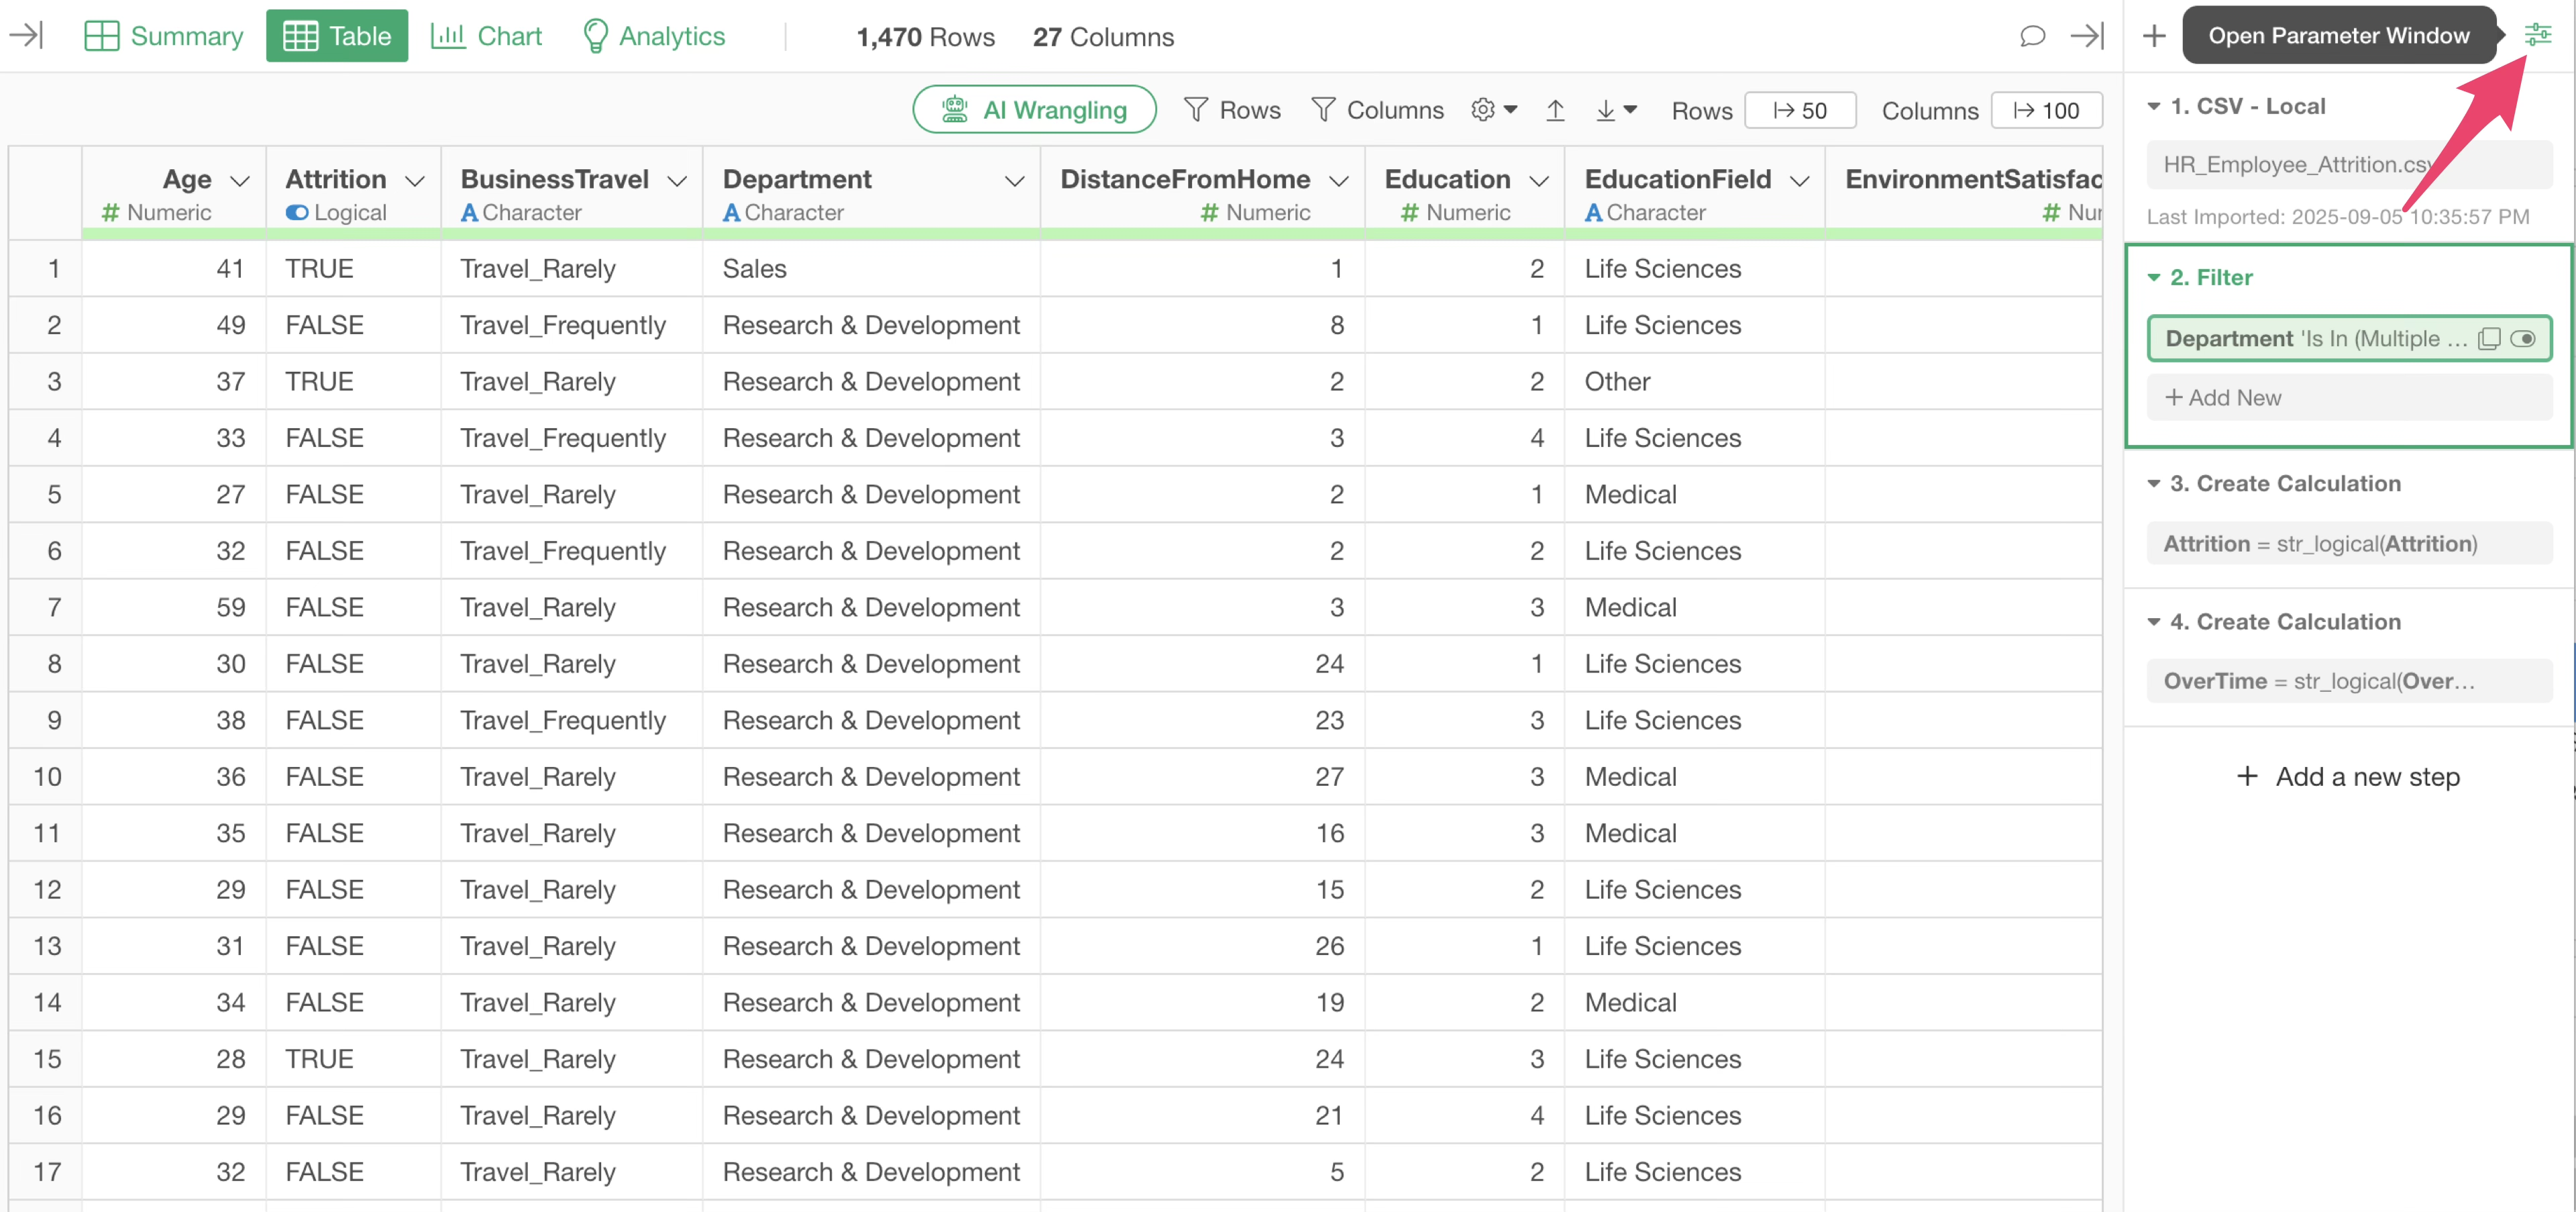
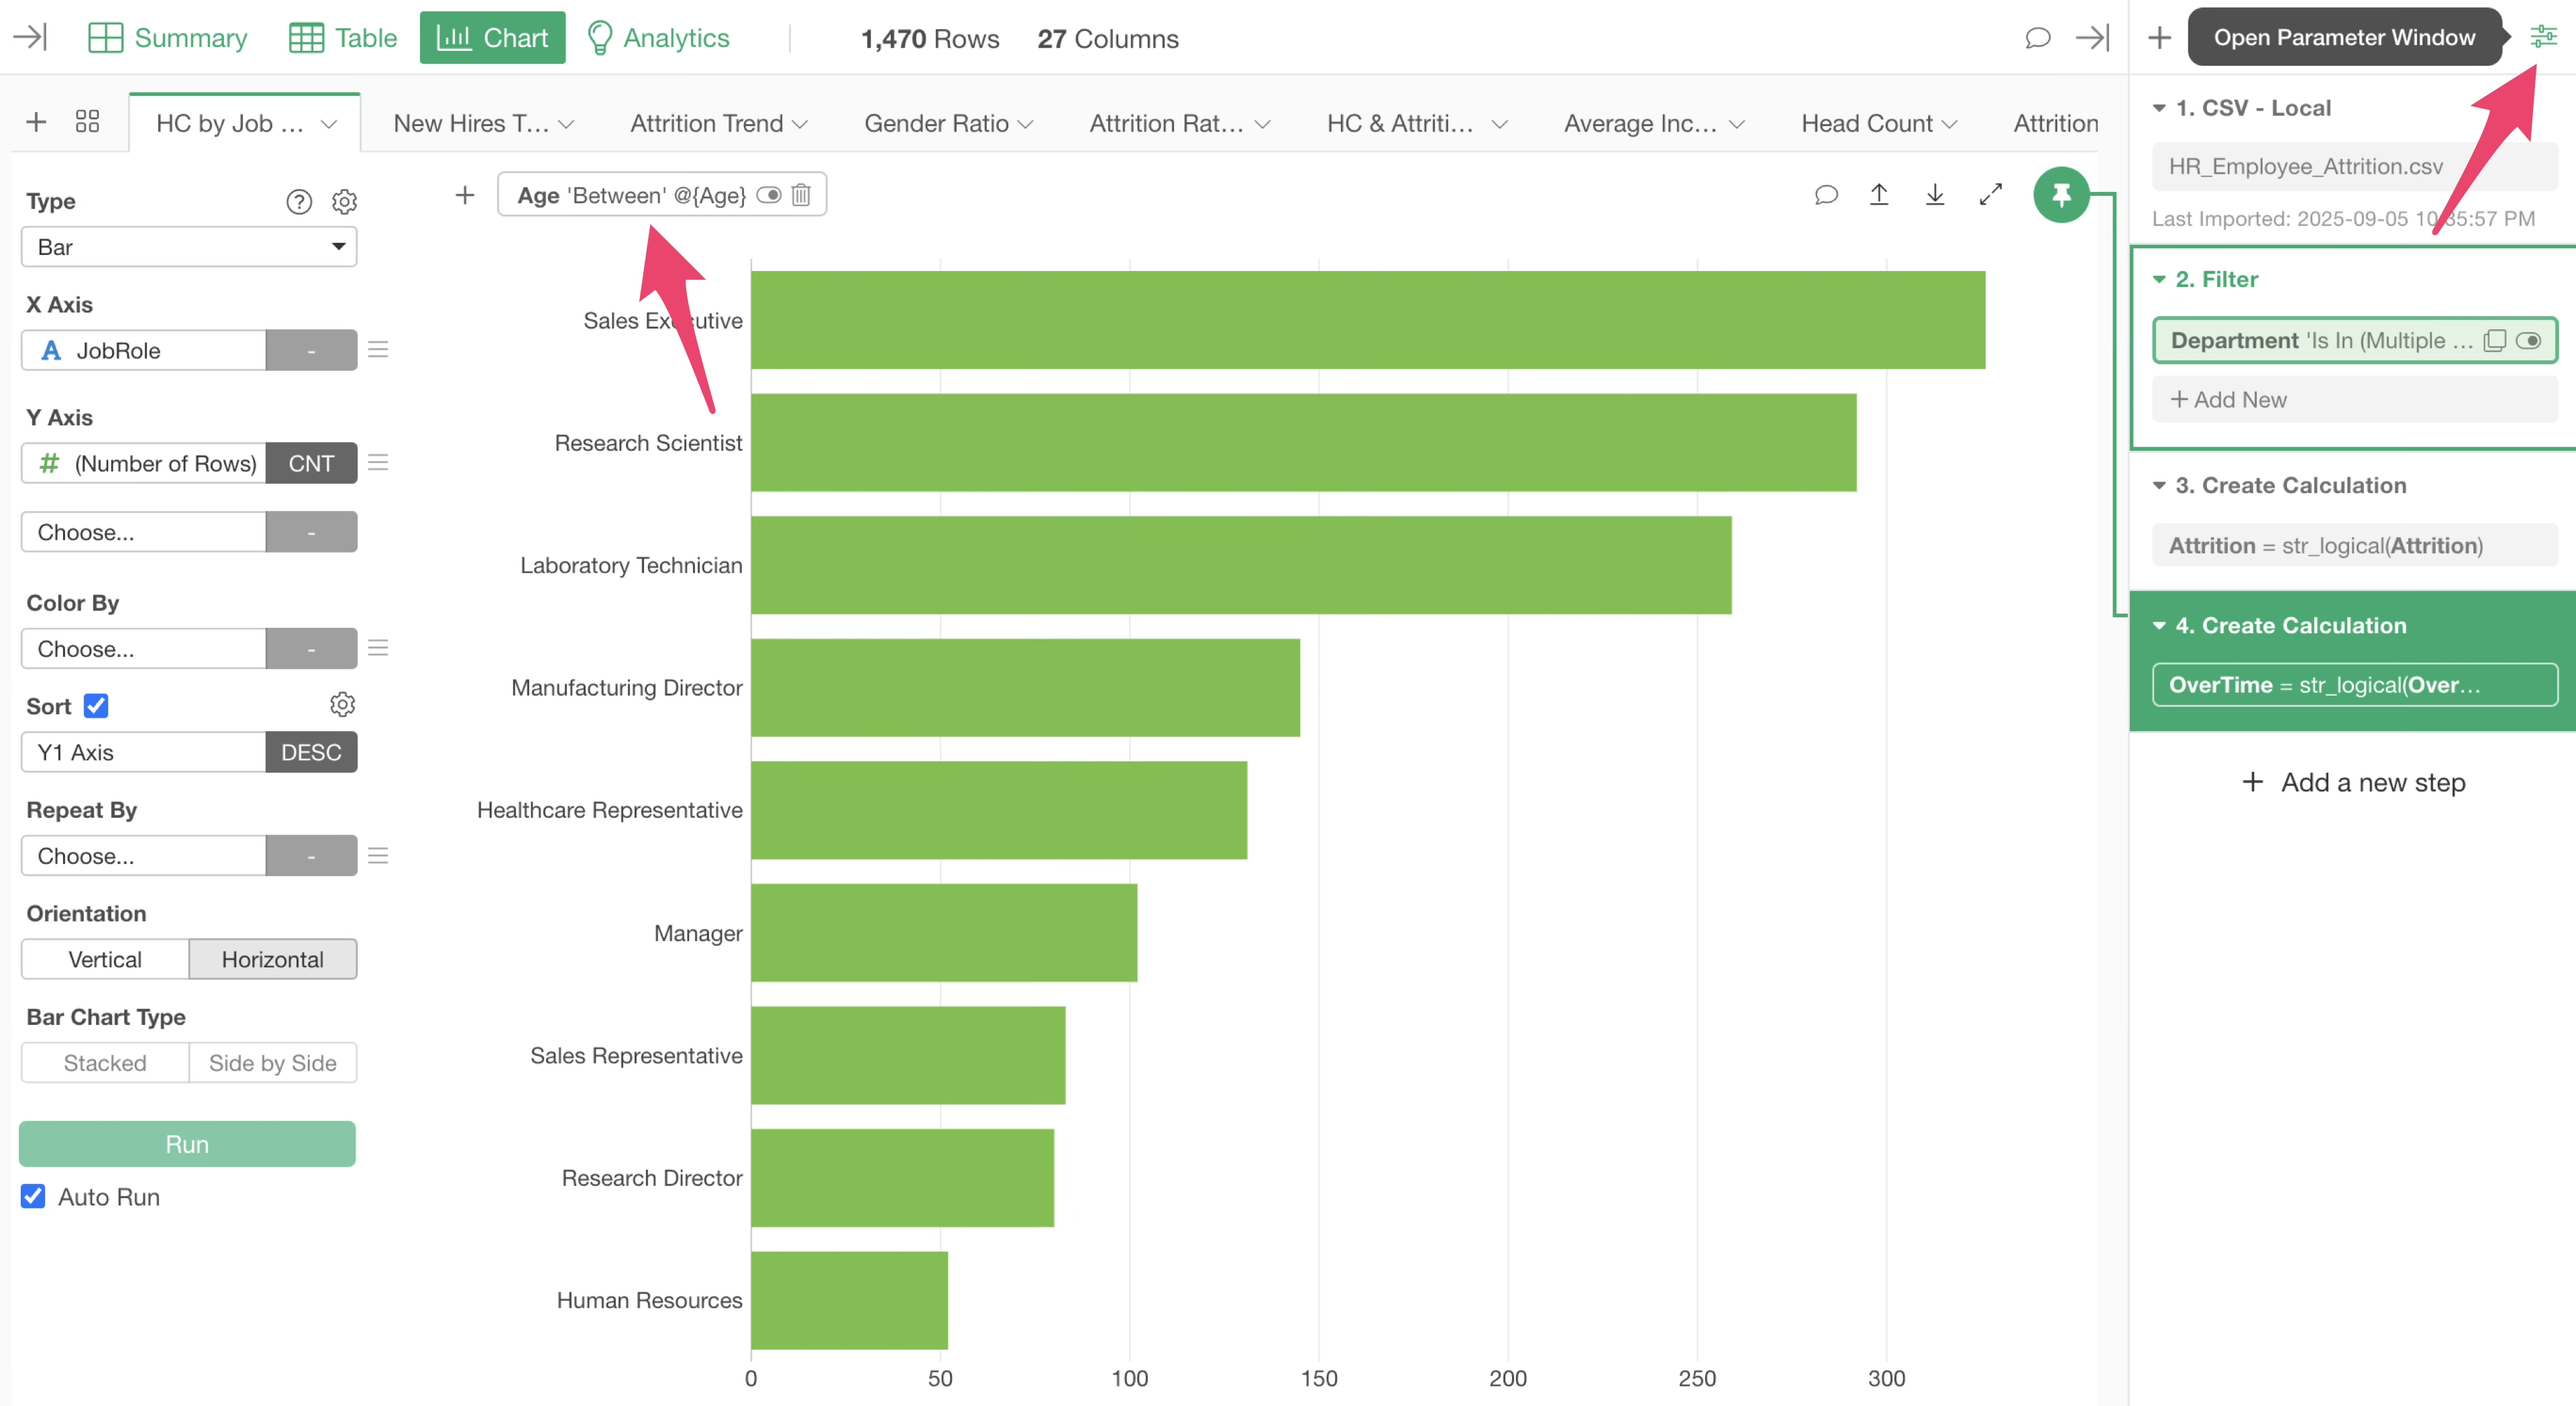
Click the “Open Parameter Window” button in the upper right corner of the screen.
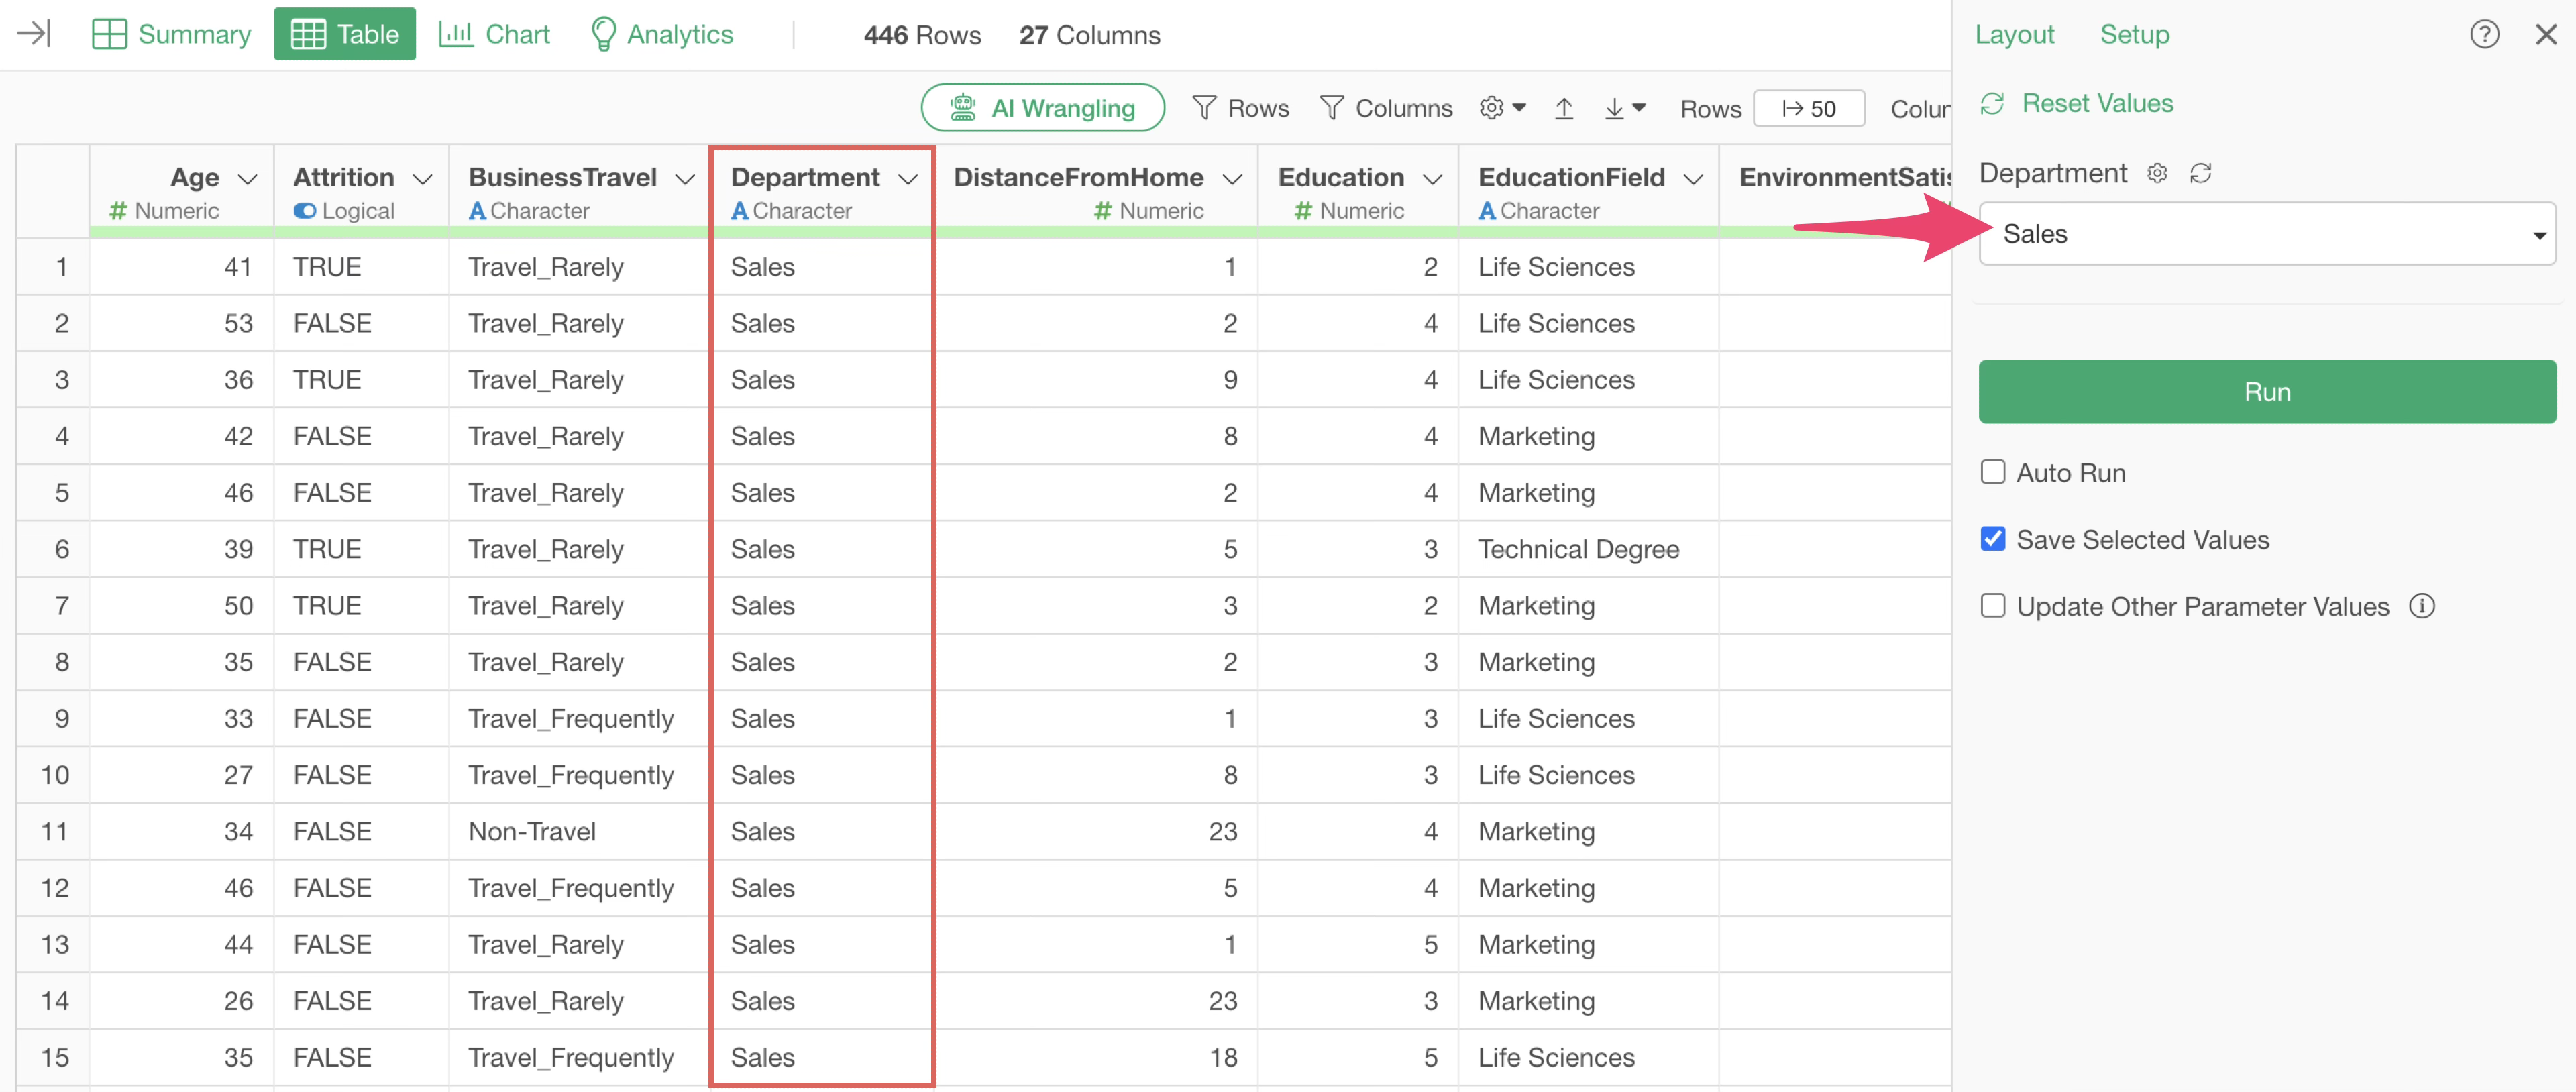
For example, by selecting “Sales” for the department and running it, you can confirm that the data is filtered to the Sales department.
Let’s move to the chart view.
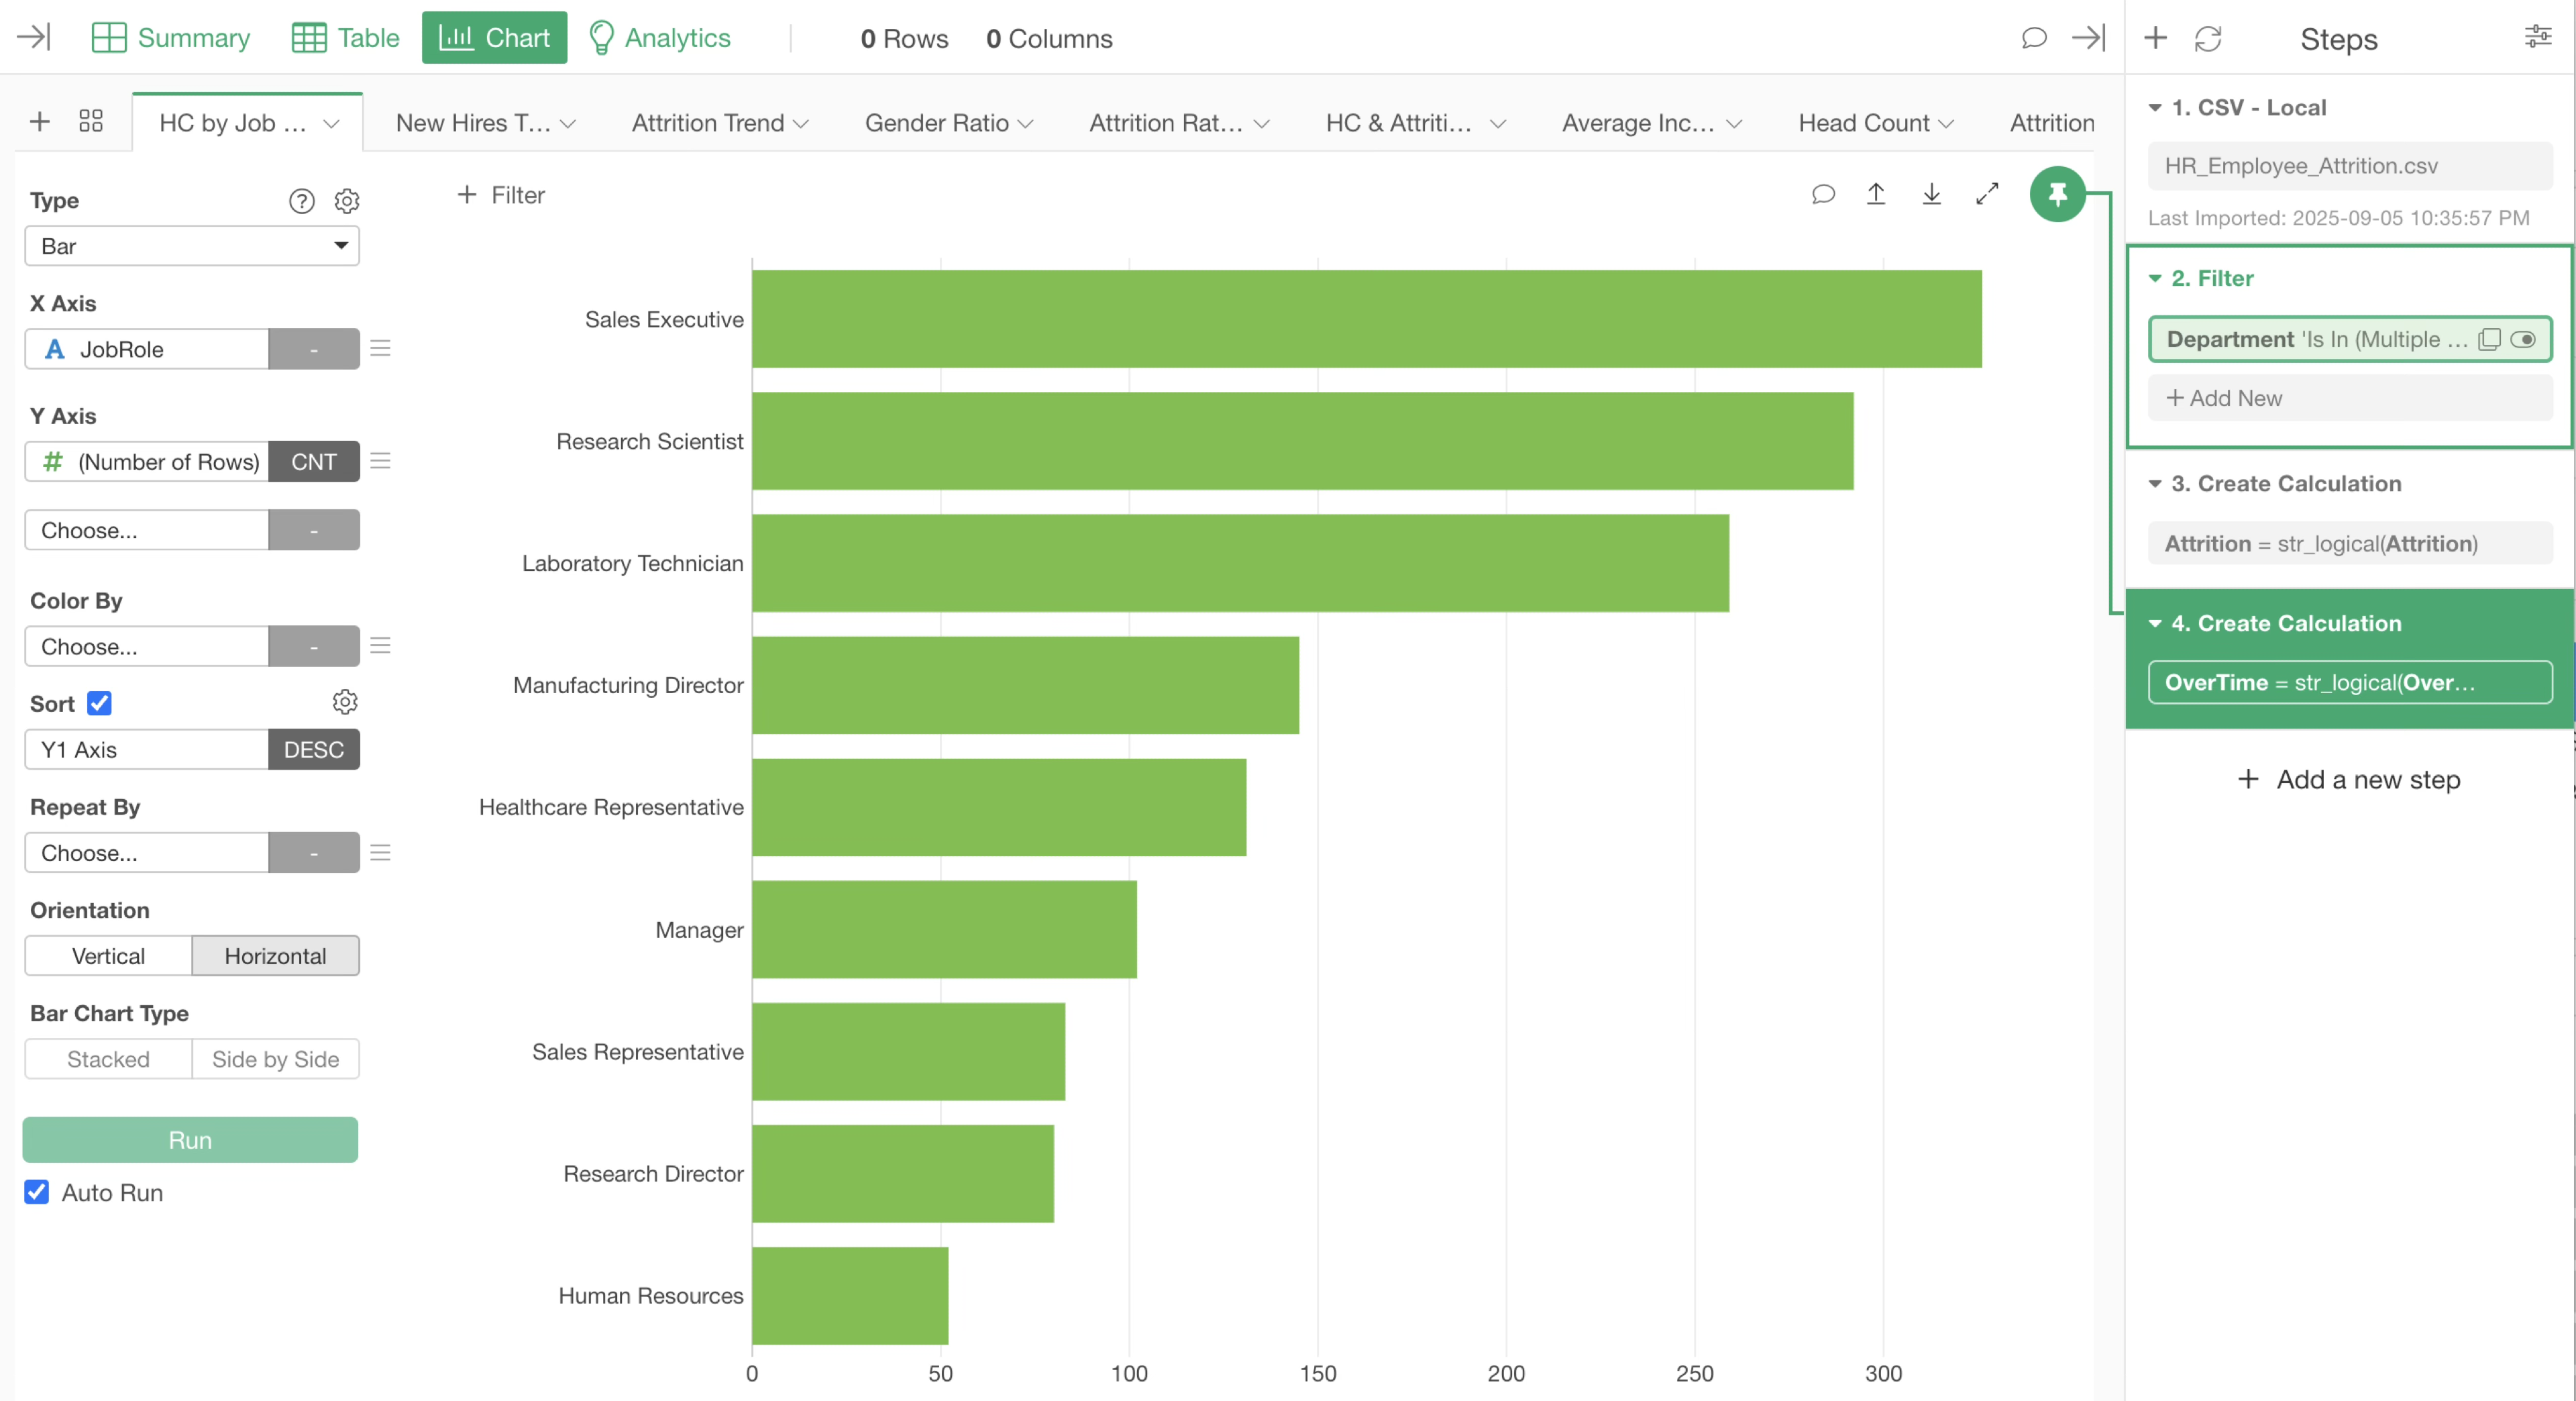
This time, we will display a bar chart of the number of employees by job title.
In this chart, a pin is linked to the 4th step, so the parameter in step 2 is already applied.
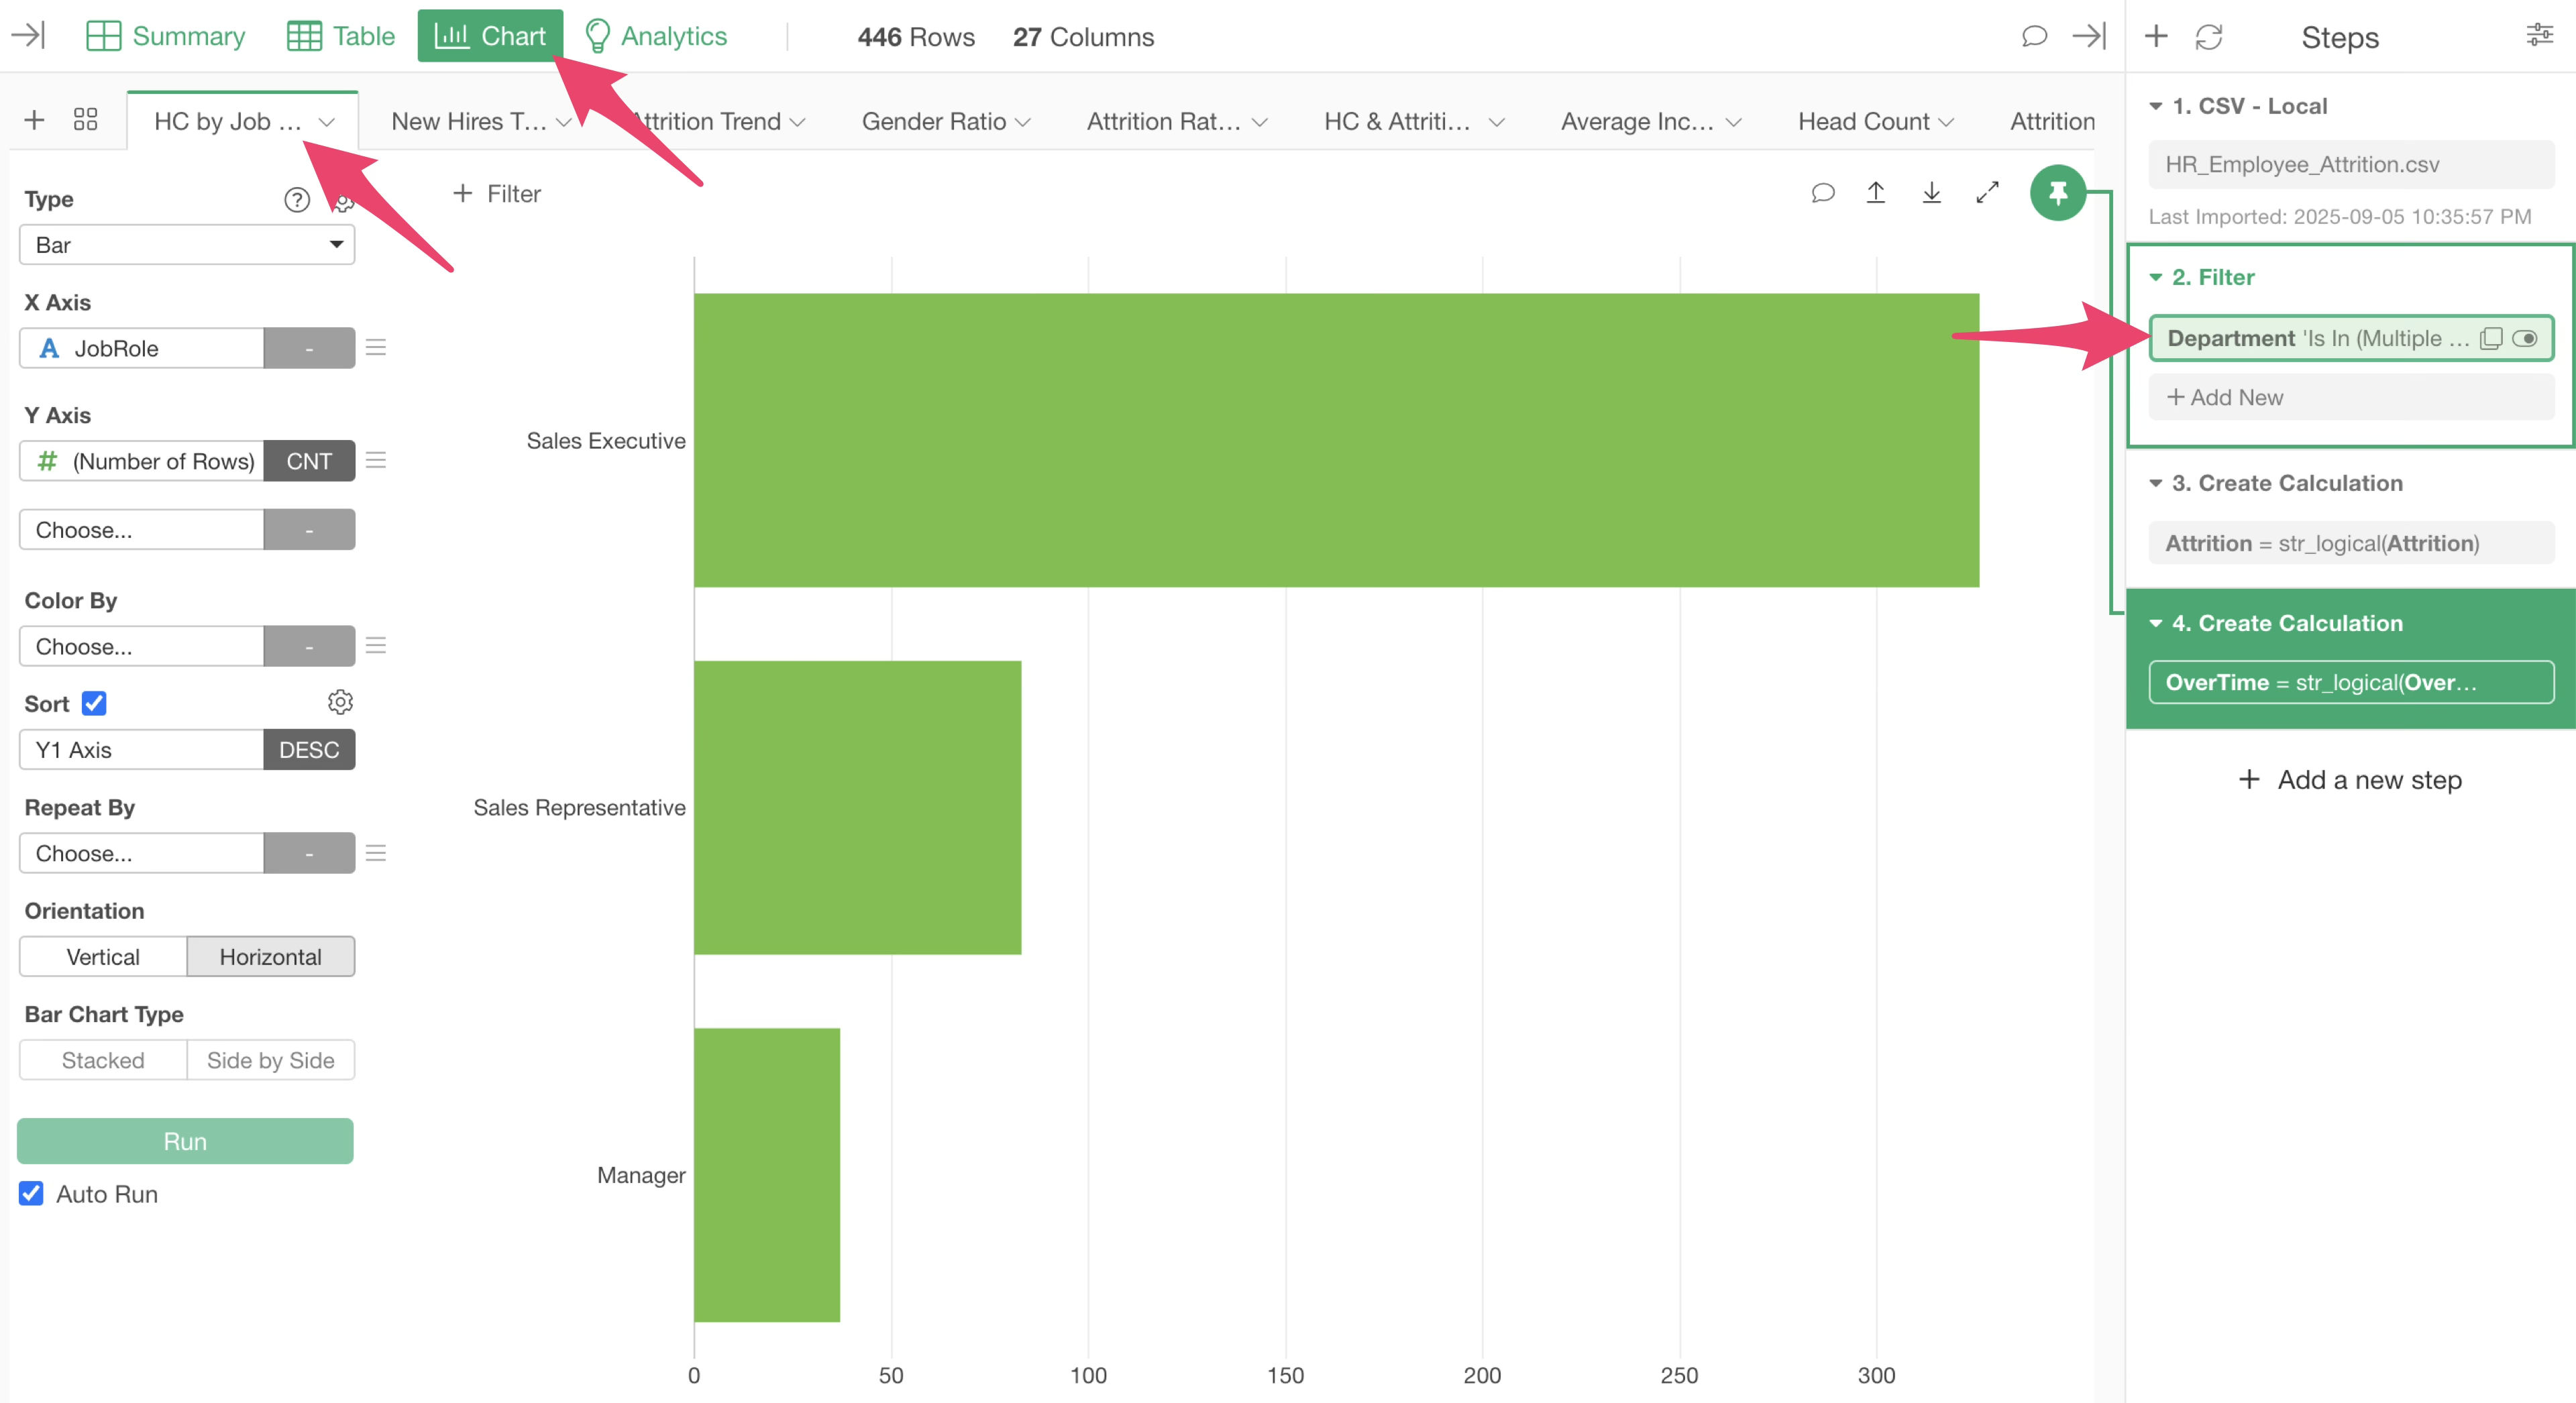
Therefore, you can use the “Department” parameter in the second step and filter it to the values whatever you want.
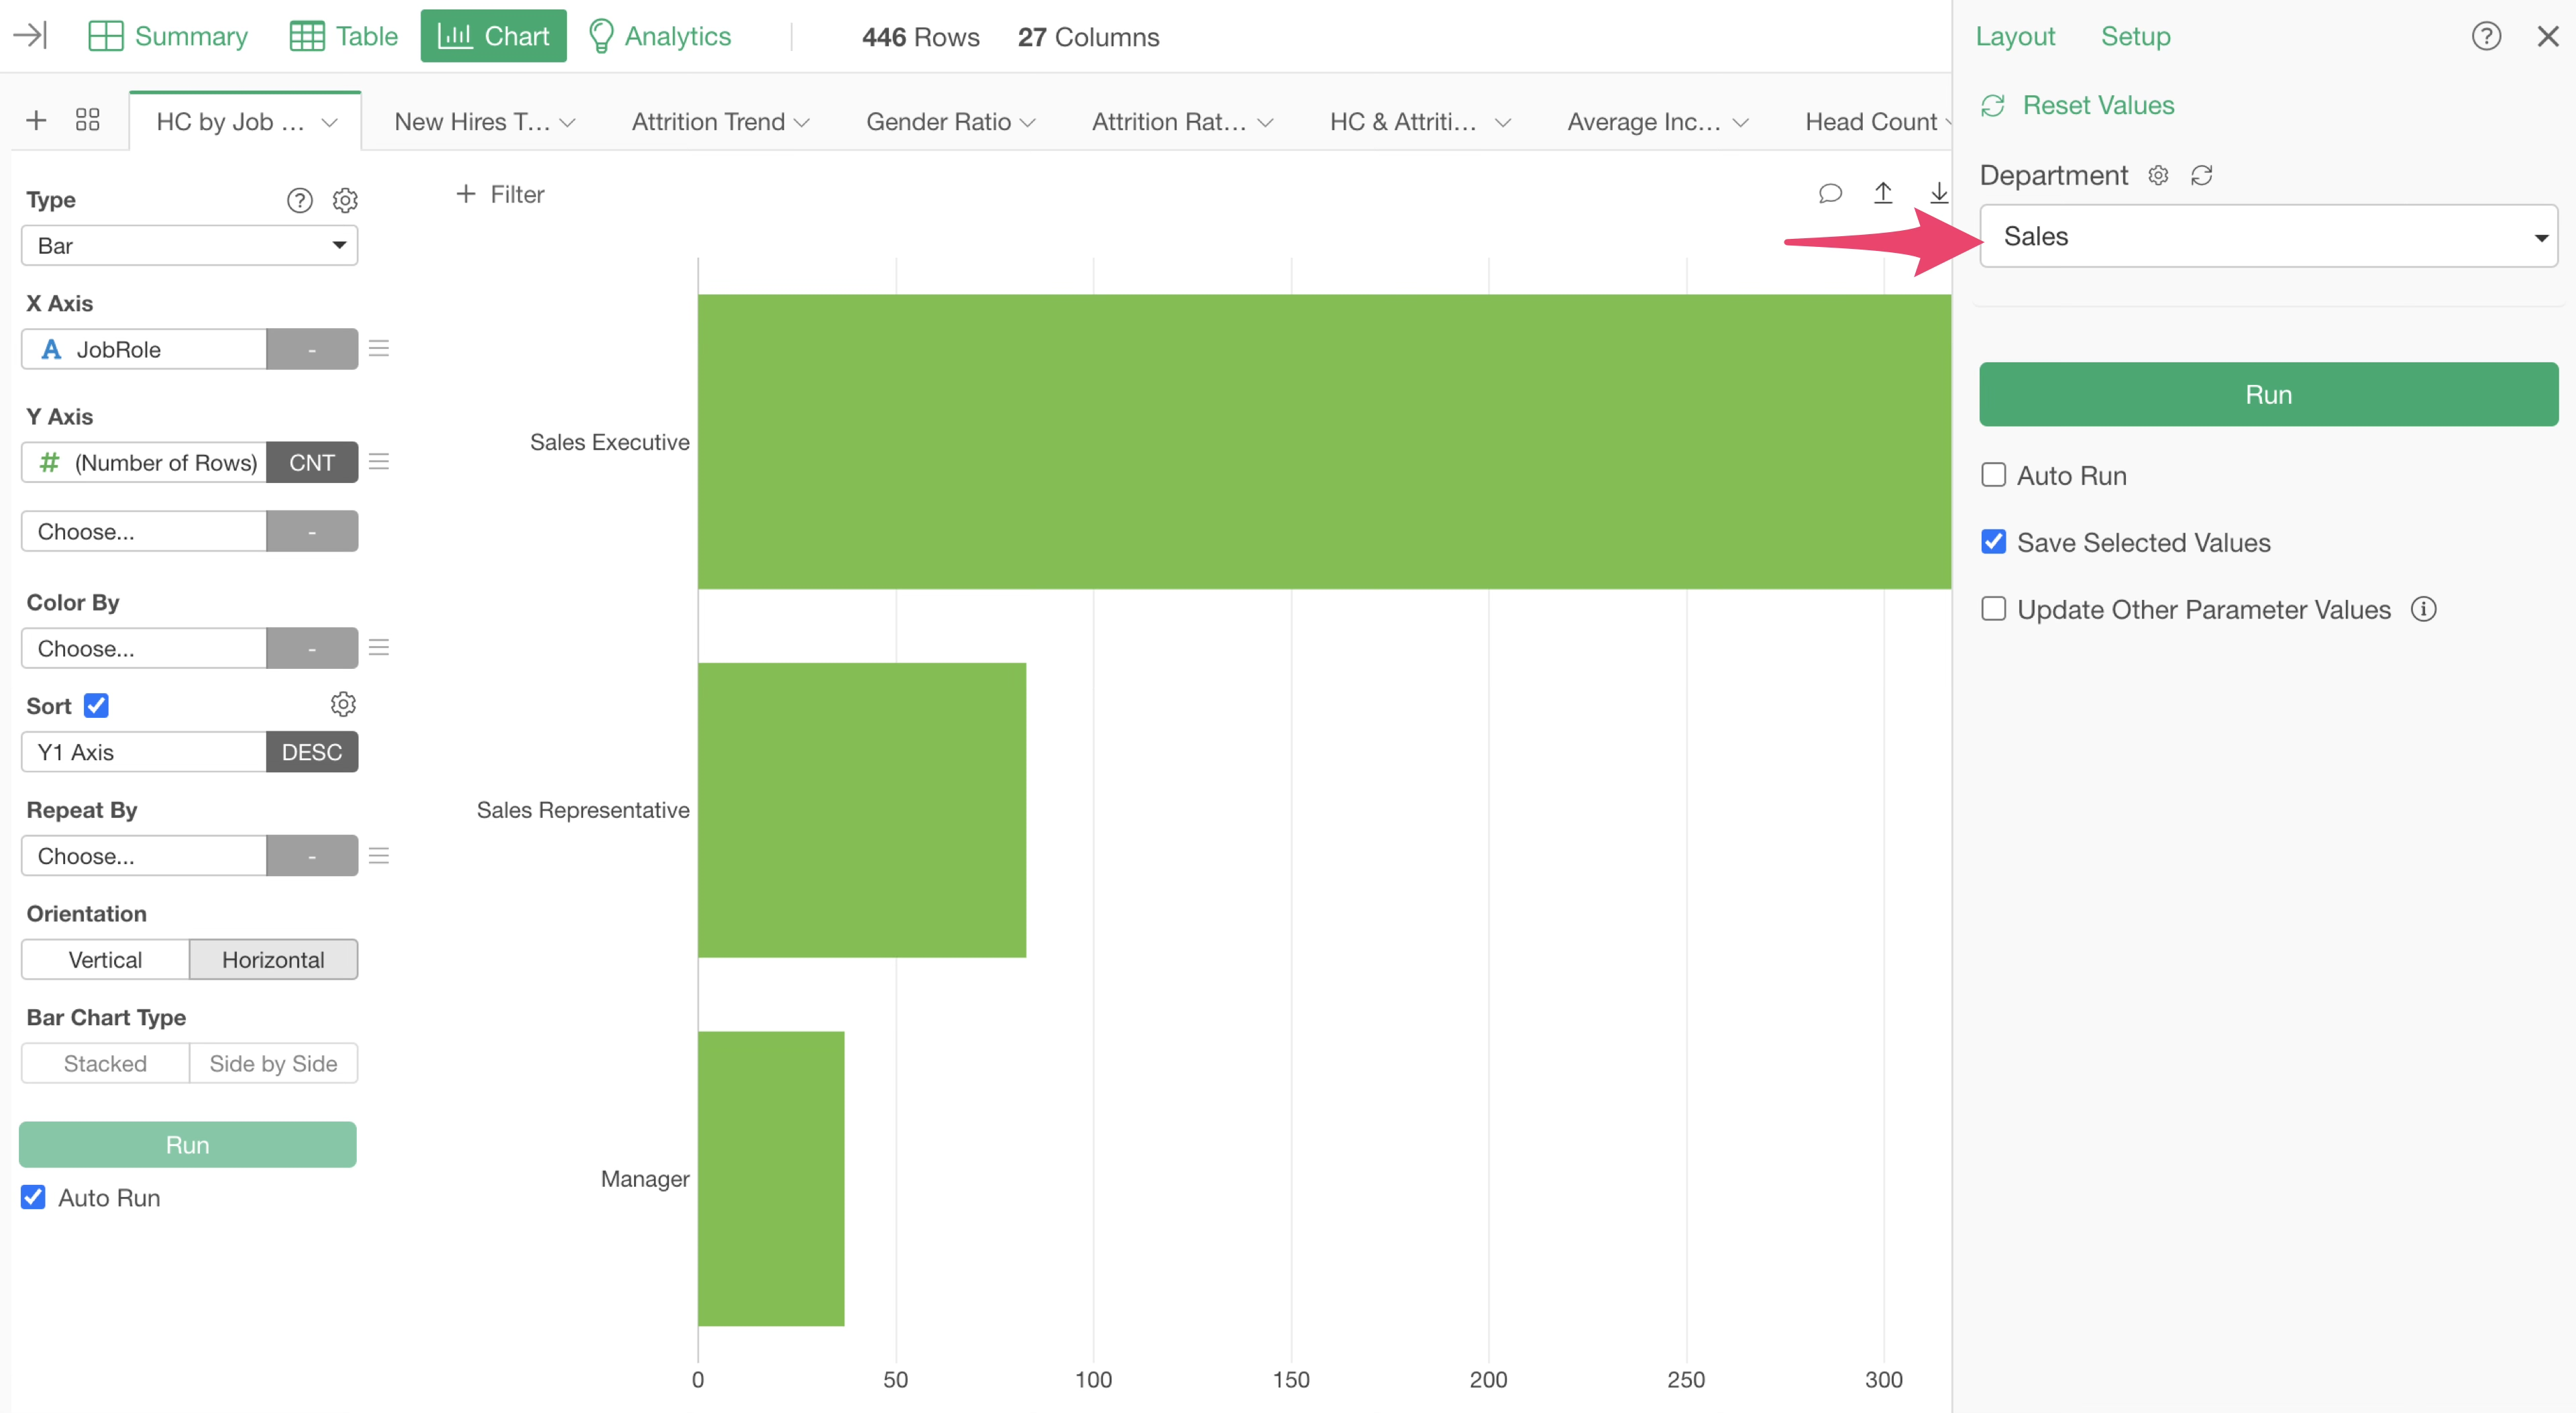
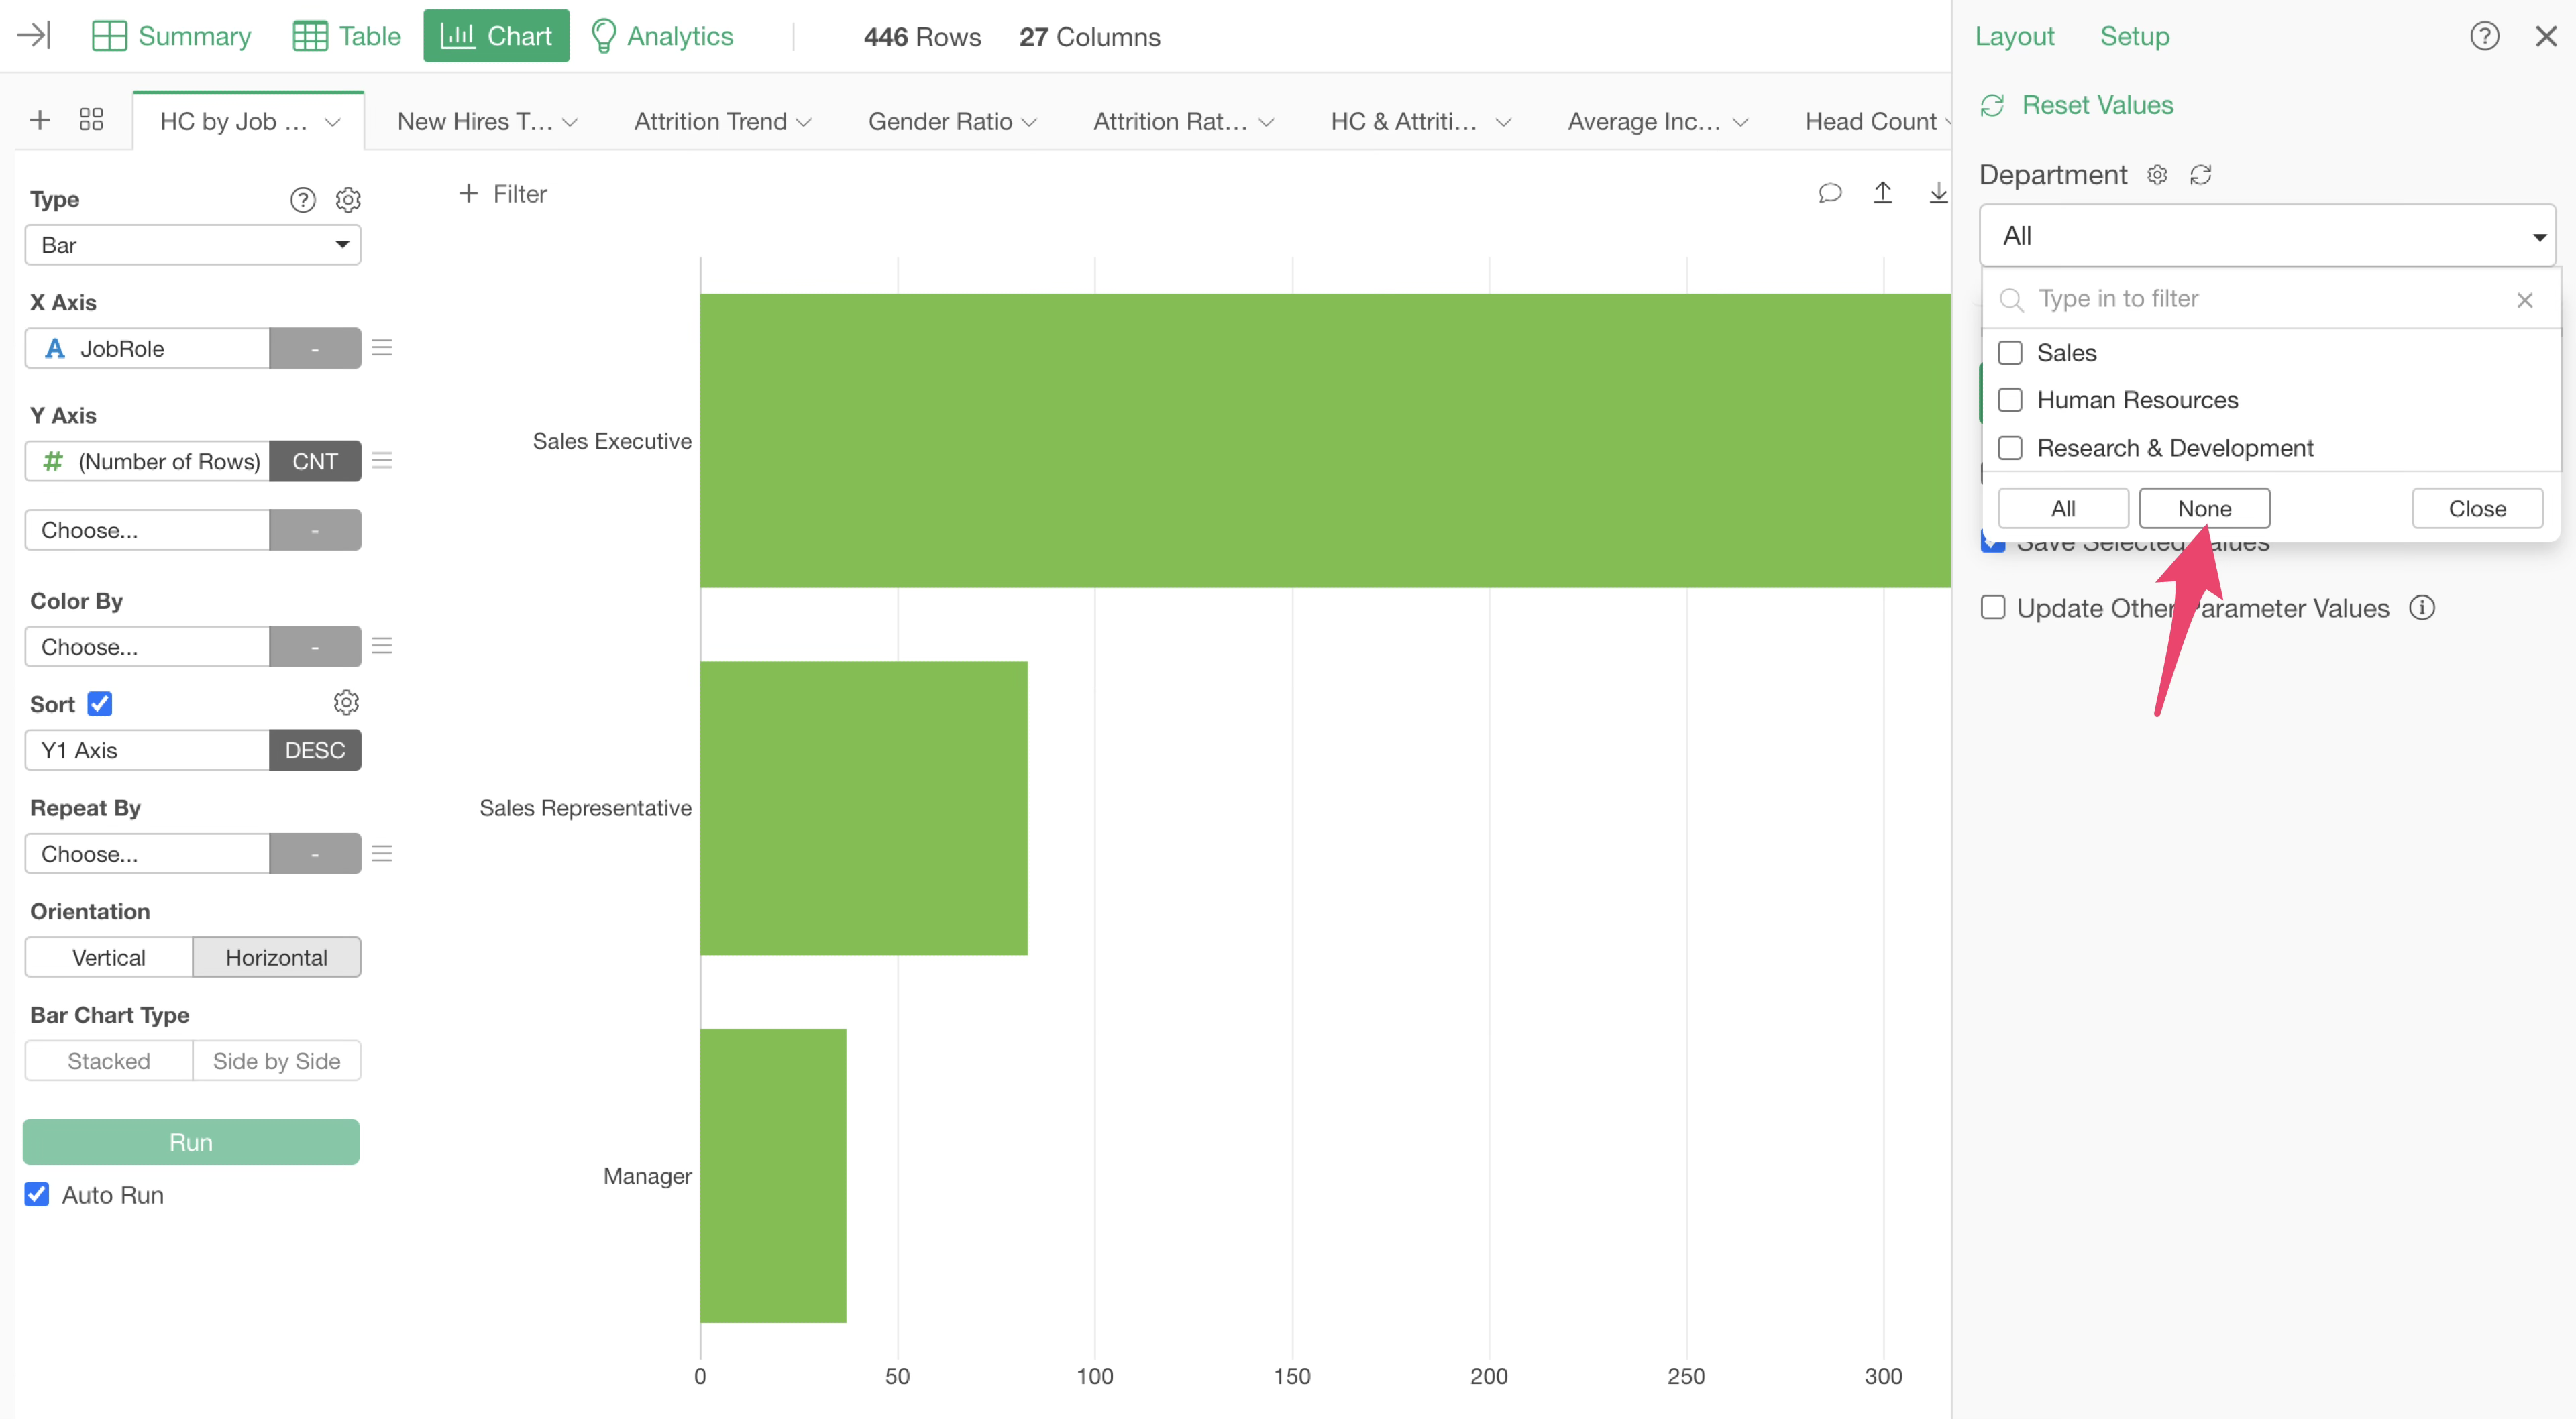
If you want to clear the filtering conditions and select all values, you can do it by choosing “None” and running it with nothing checked.
3. Chart Filter
Previously, we set parameters as a step filter, and all charts linked to that step were parameterized.
However, if you want to use parameters only for specific charts, you can set them using “Chart Filter.”
For example, in a chart showing the number of employees by job title, you might want to determine how many employees are in each job title by setting an age range.
Therefore, we want to create a parameter based on the “Age” column and apply it to the chart mentioned earlier.
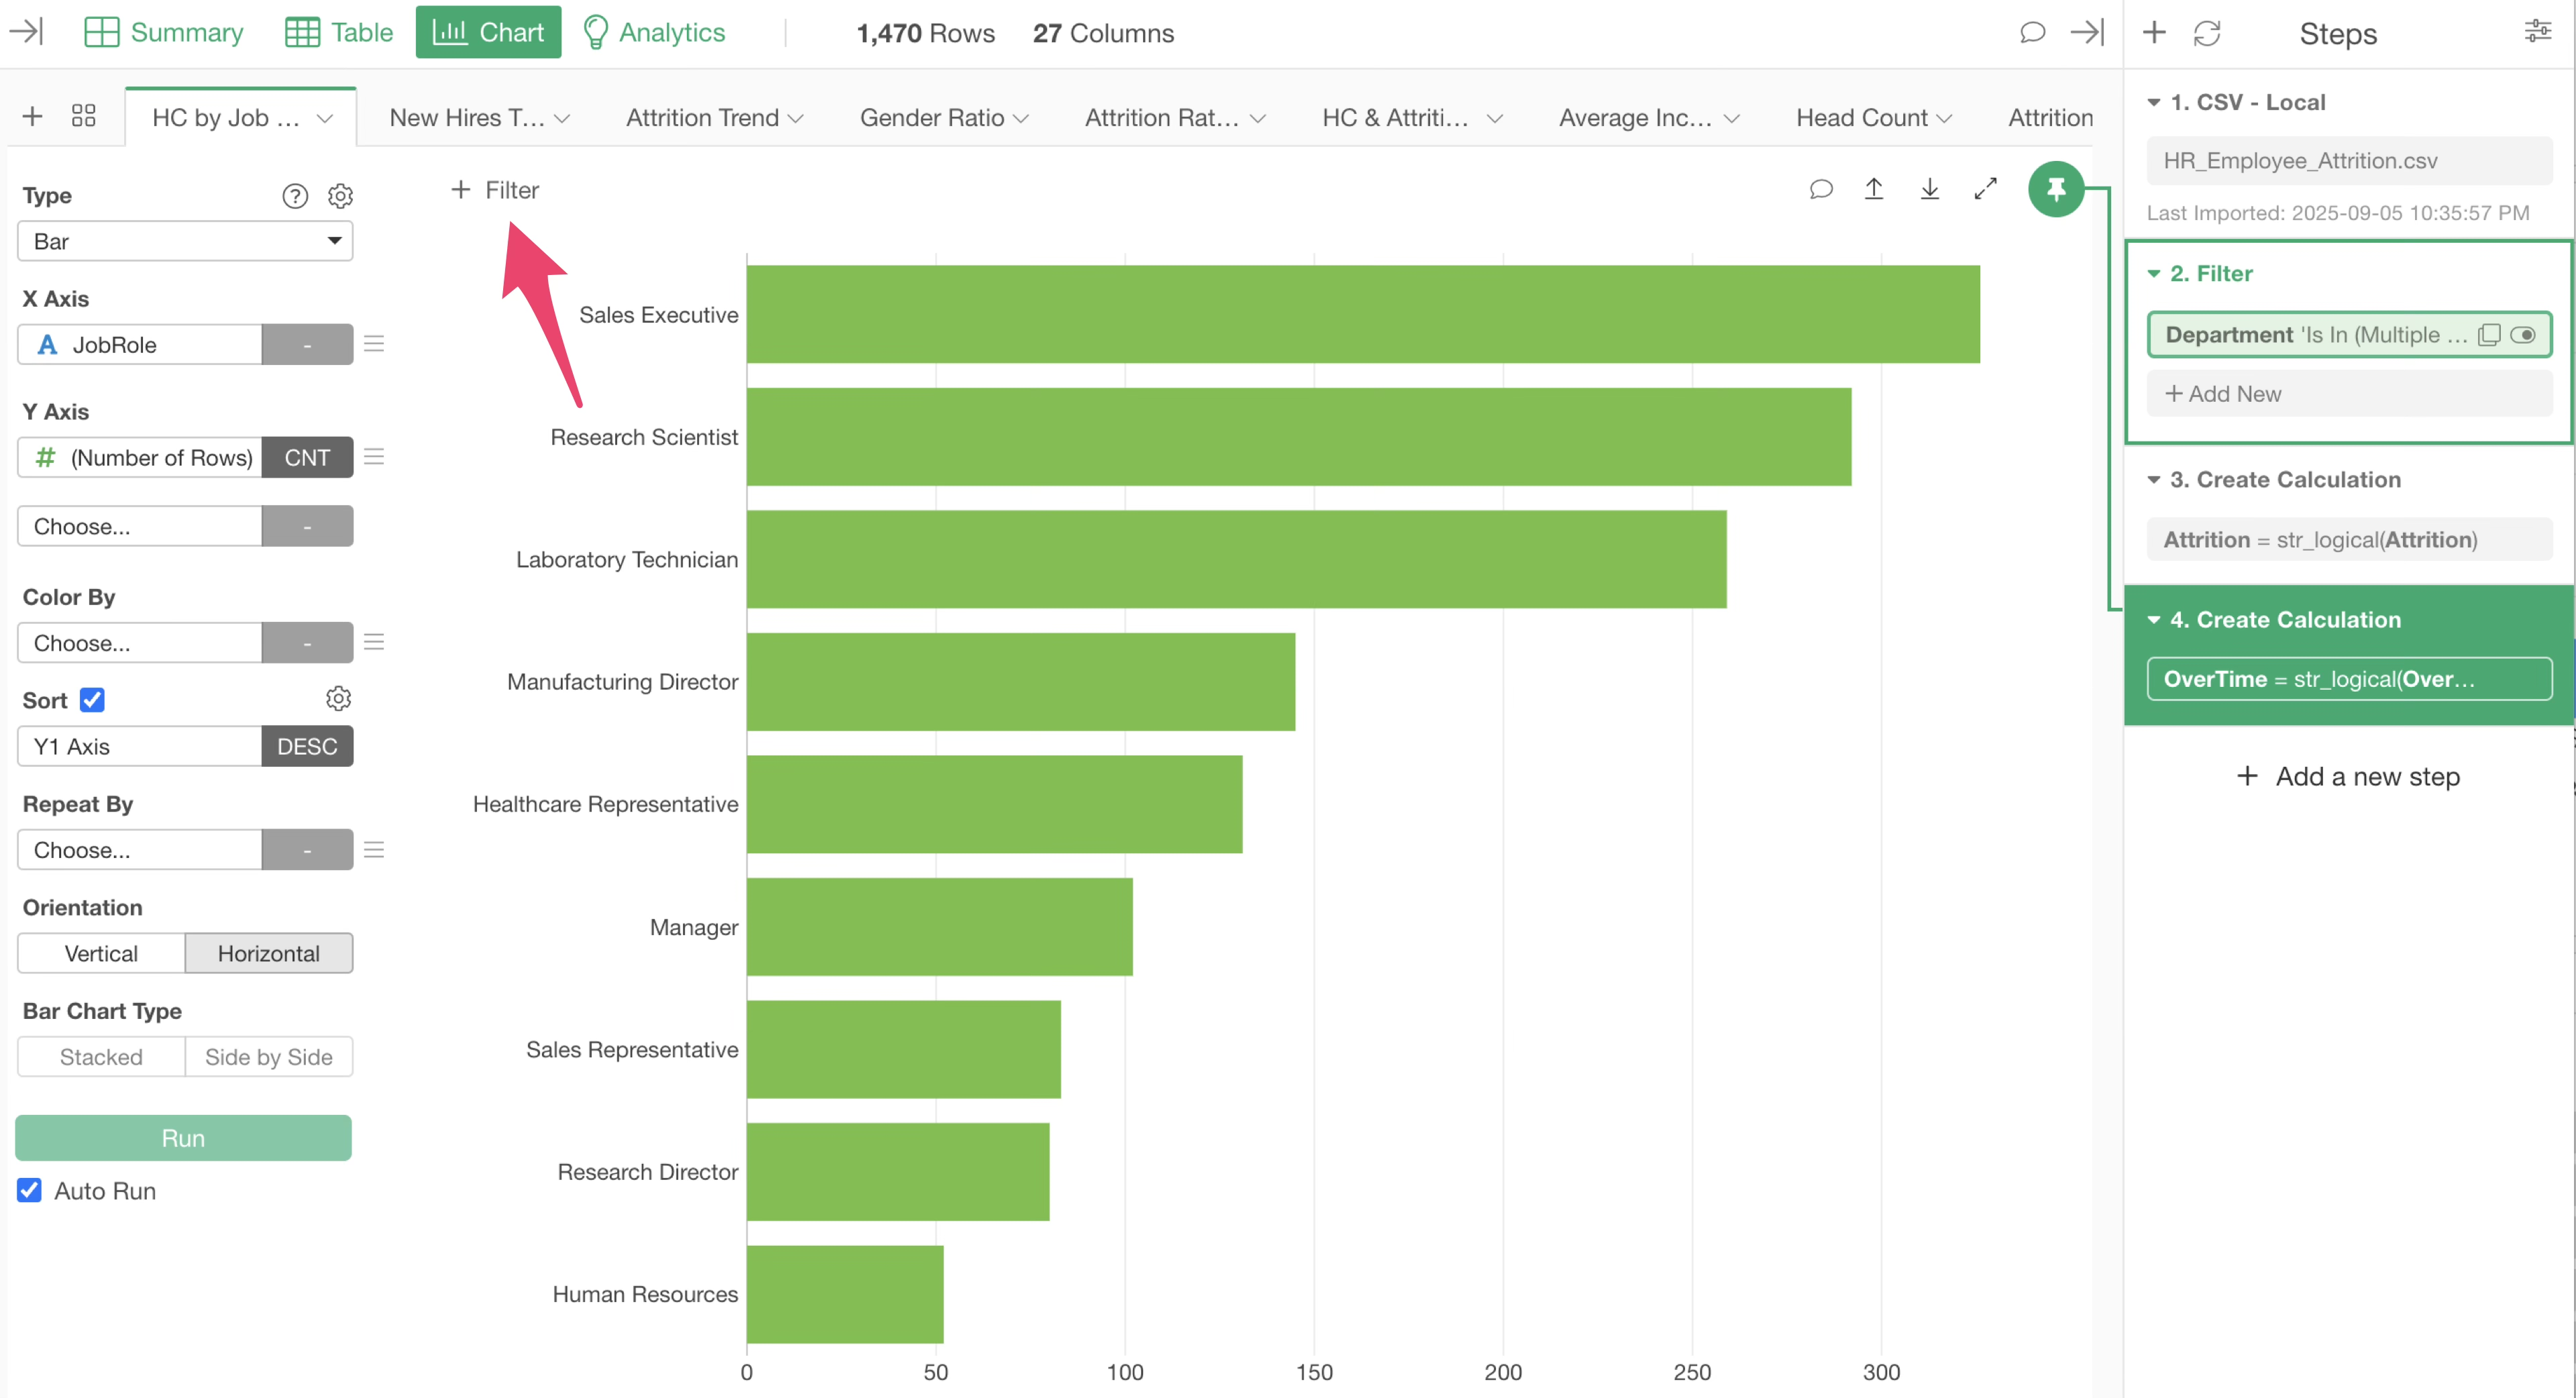
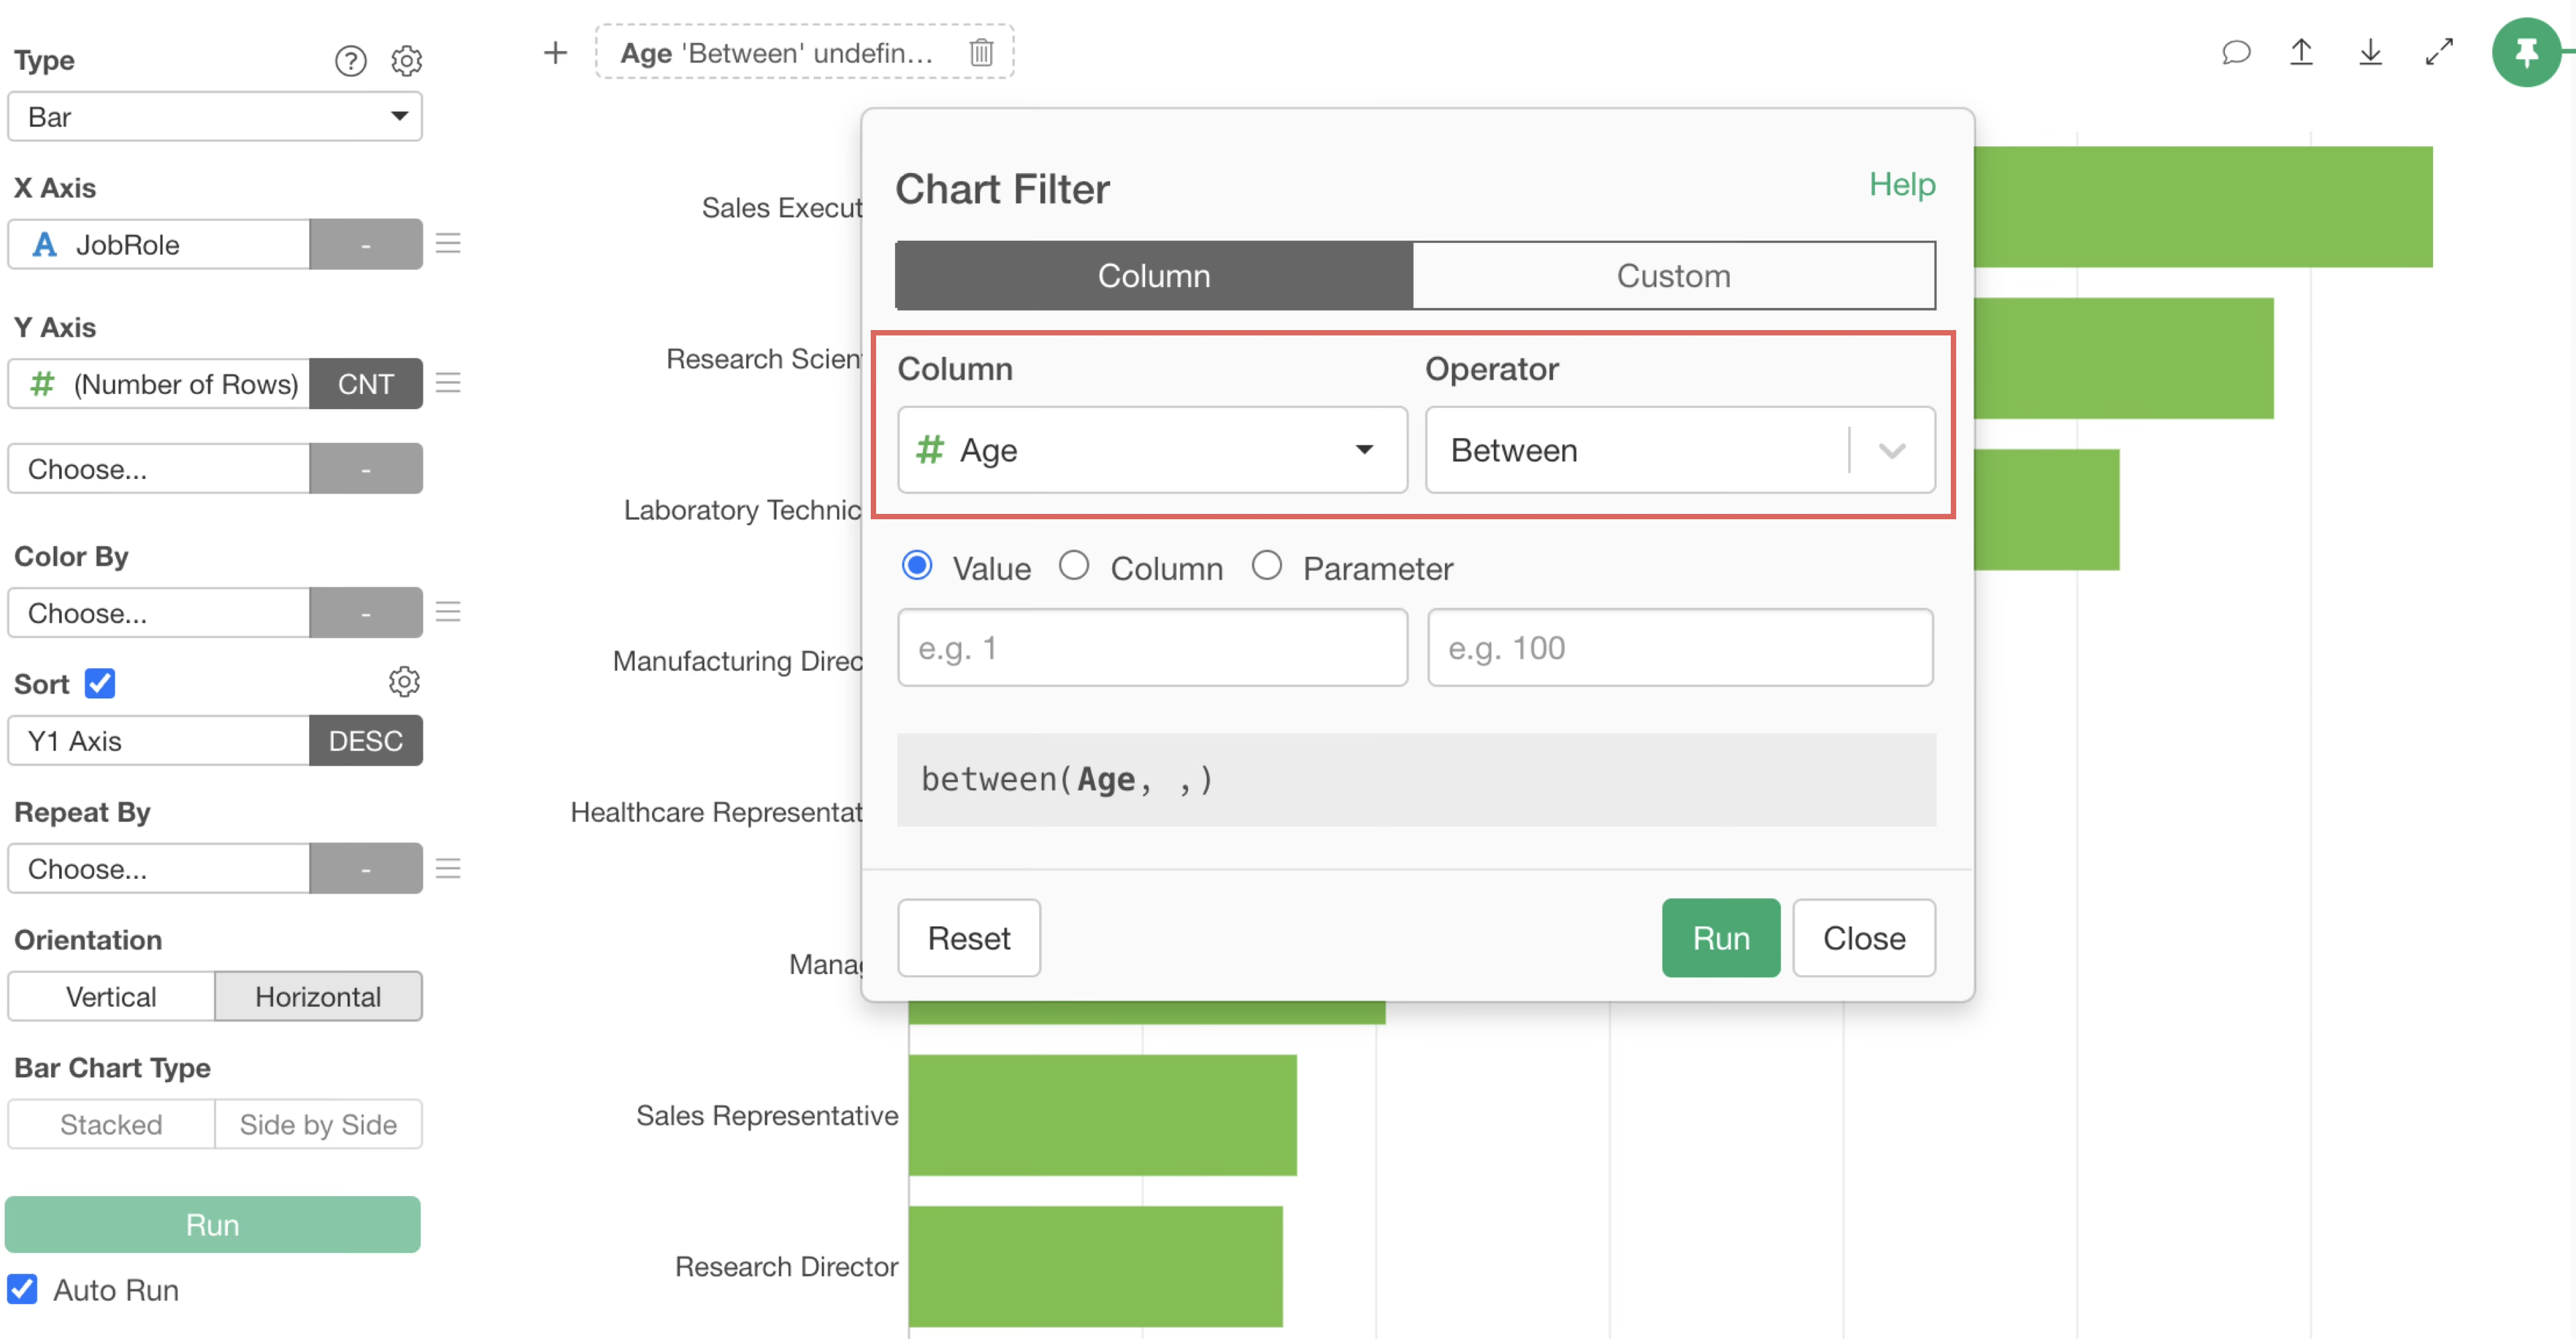
Open the chart showing the number of employees by job title and click “Filter” in the chart.
The chart filter dialog will appear. Select “Age” for the column and “Between” for the operator.
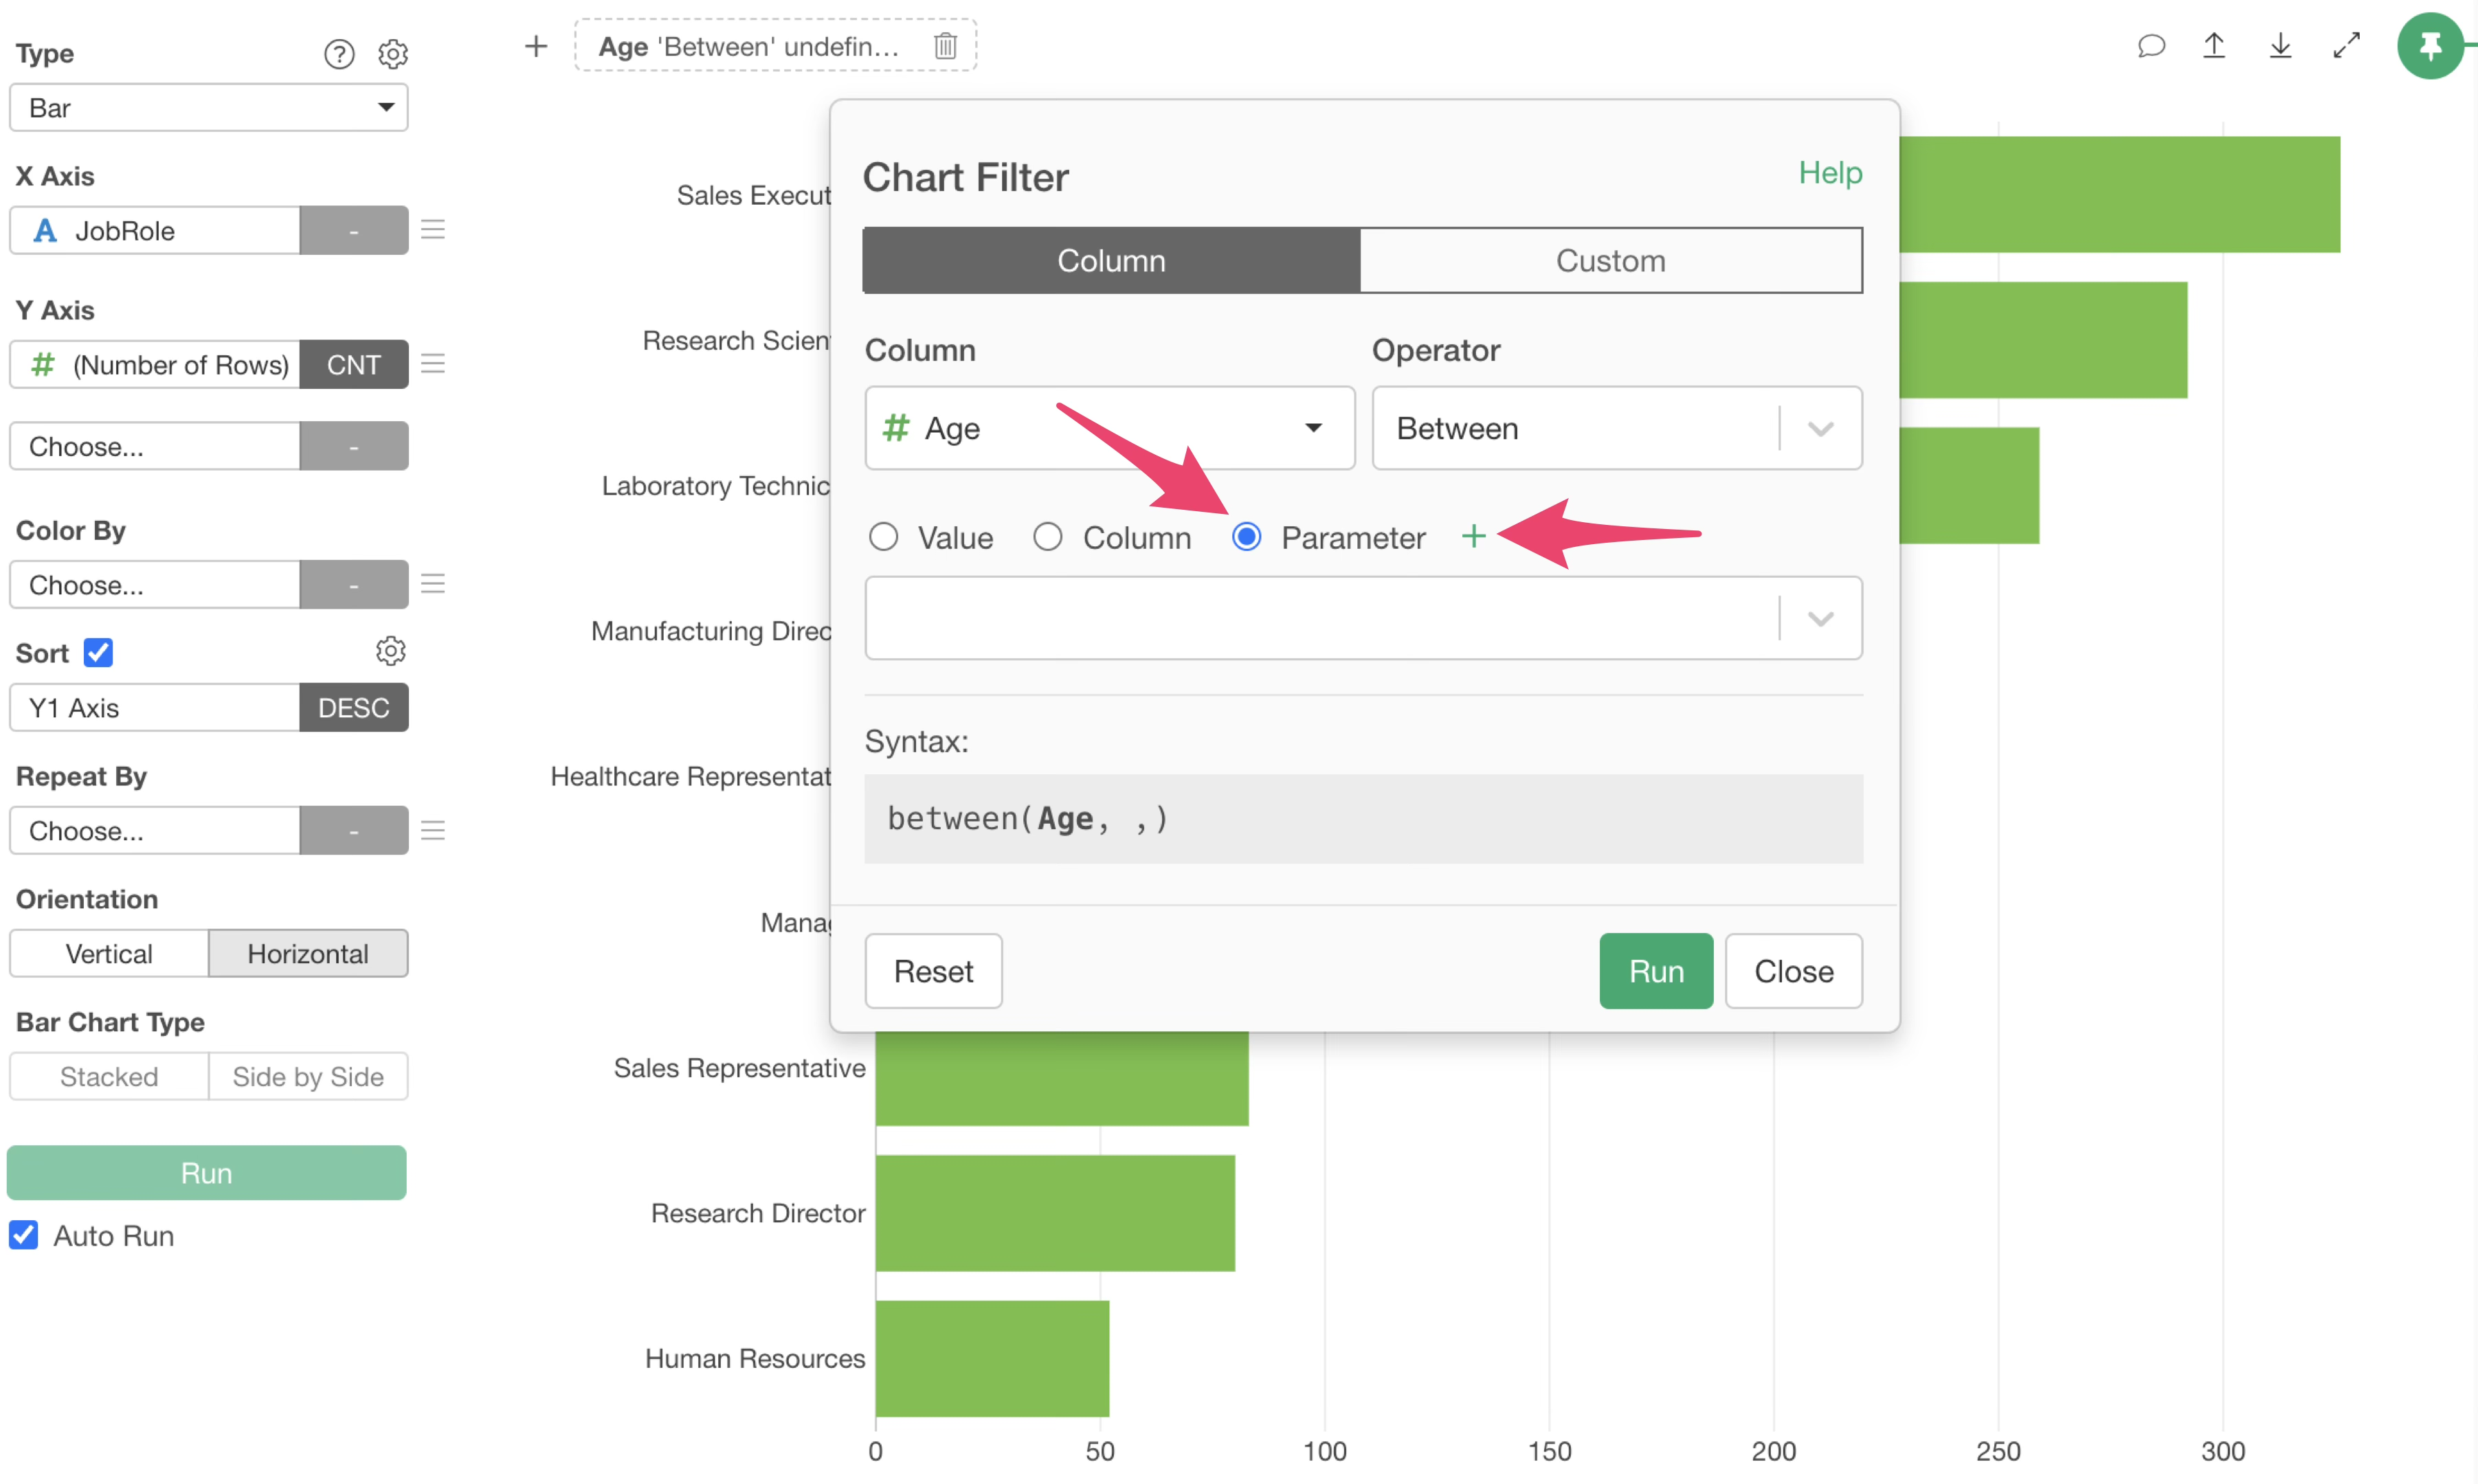
Select “Parameter” for the type and click the “Plus” button to create a new one.
The parameter creation dialog will appear, so specify the parameter name.
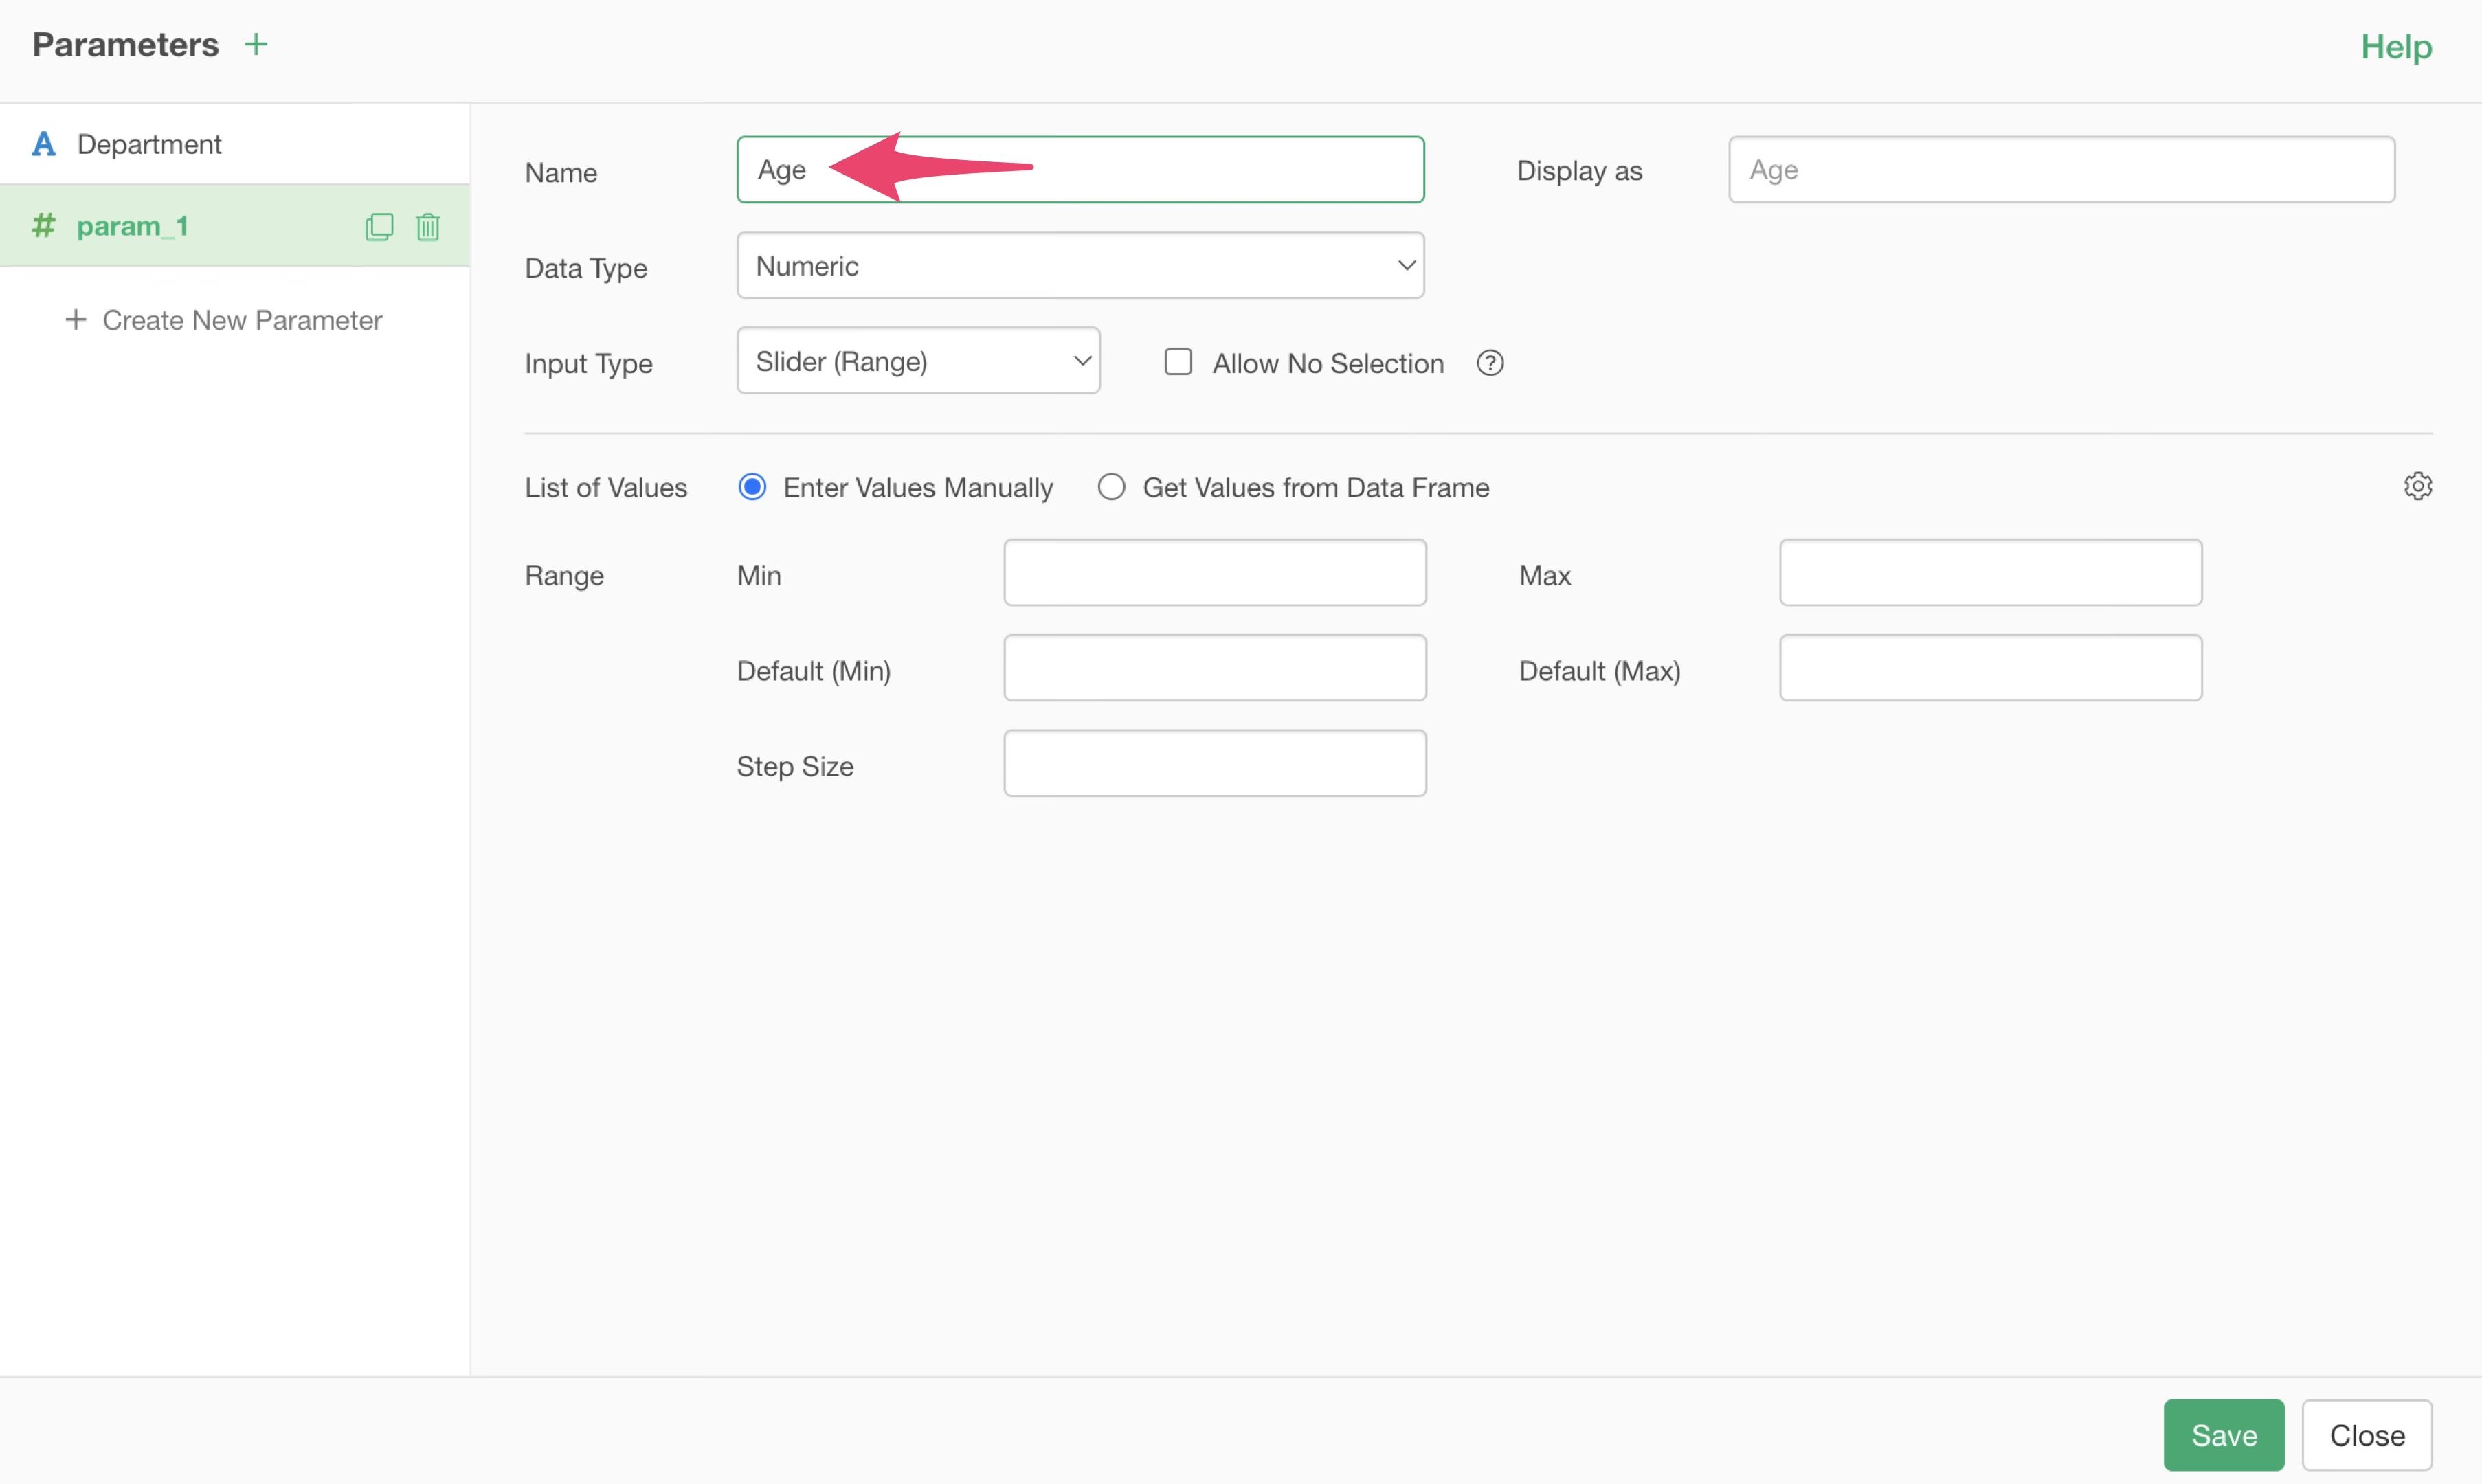
“Numeric” is selected for the data type, and “Slider (Range)” is specified for the input type.
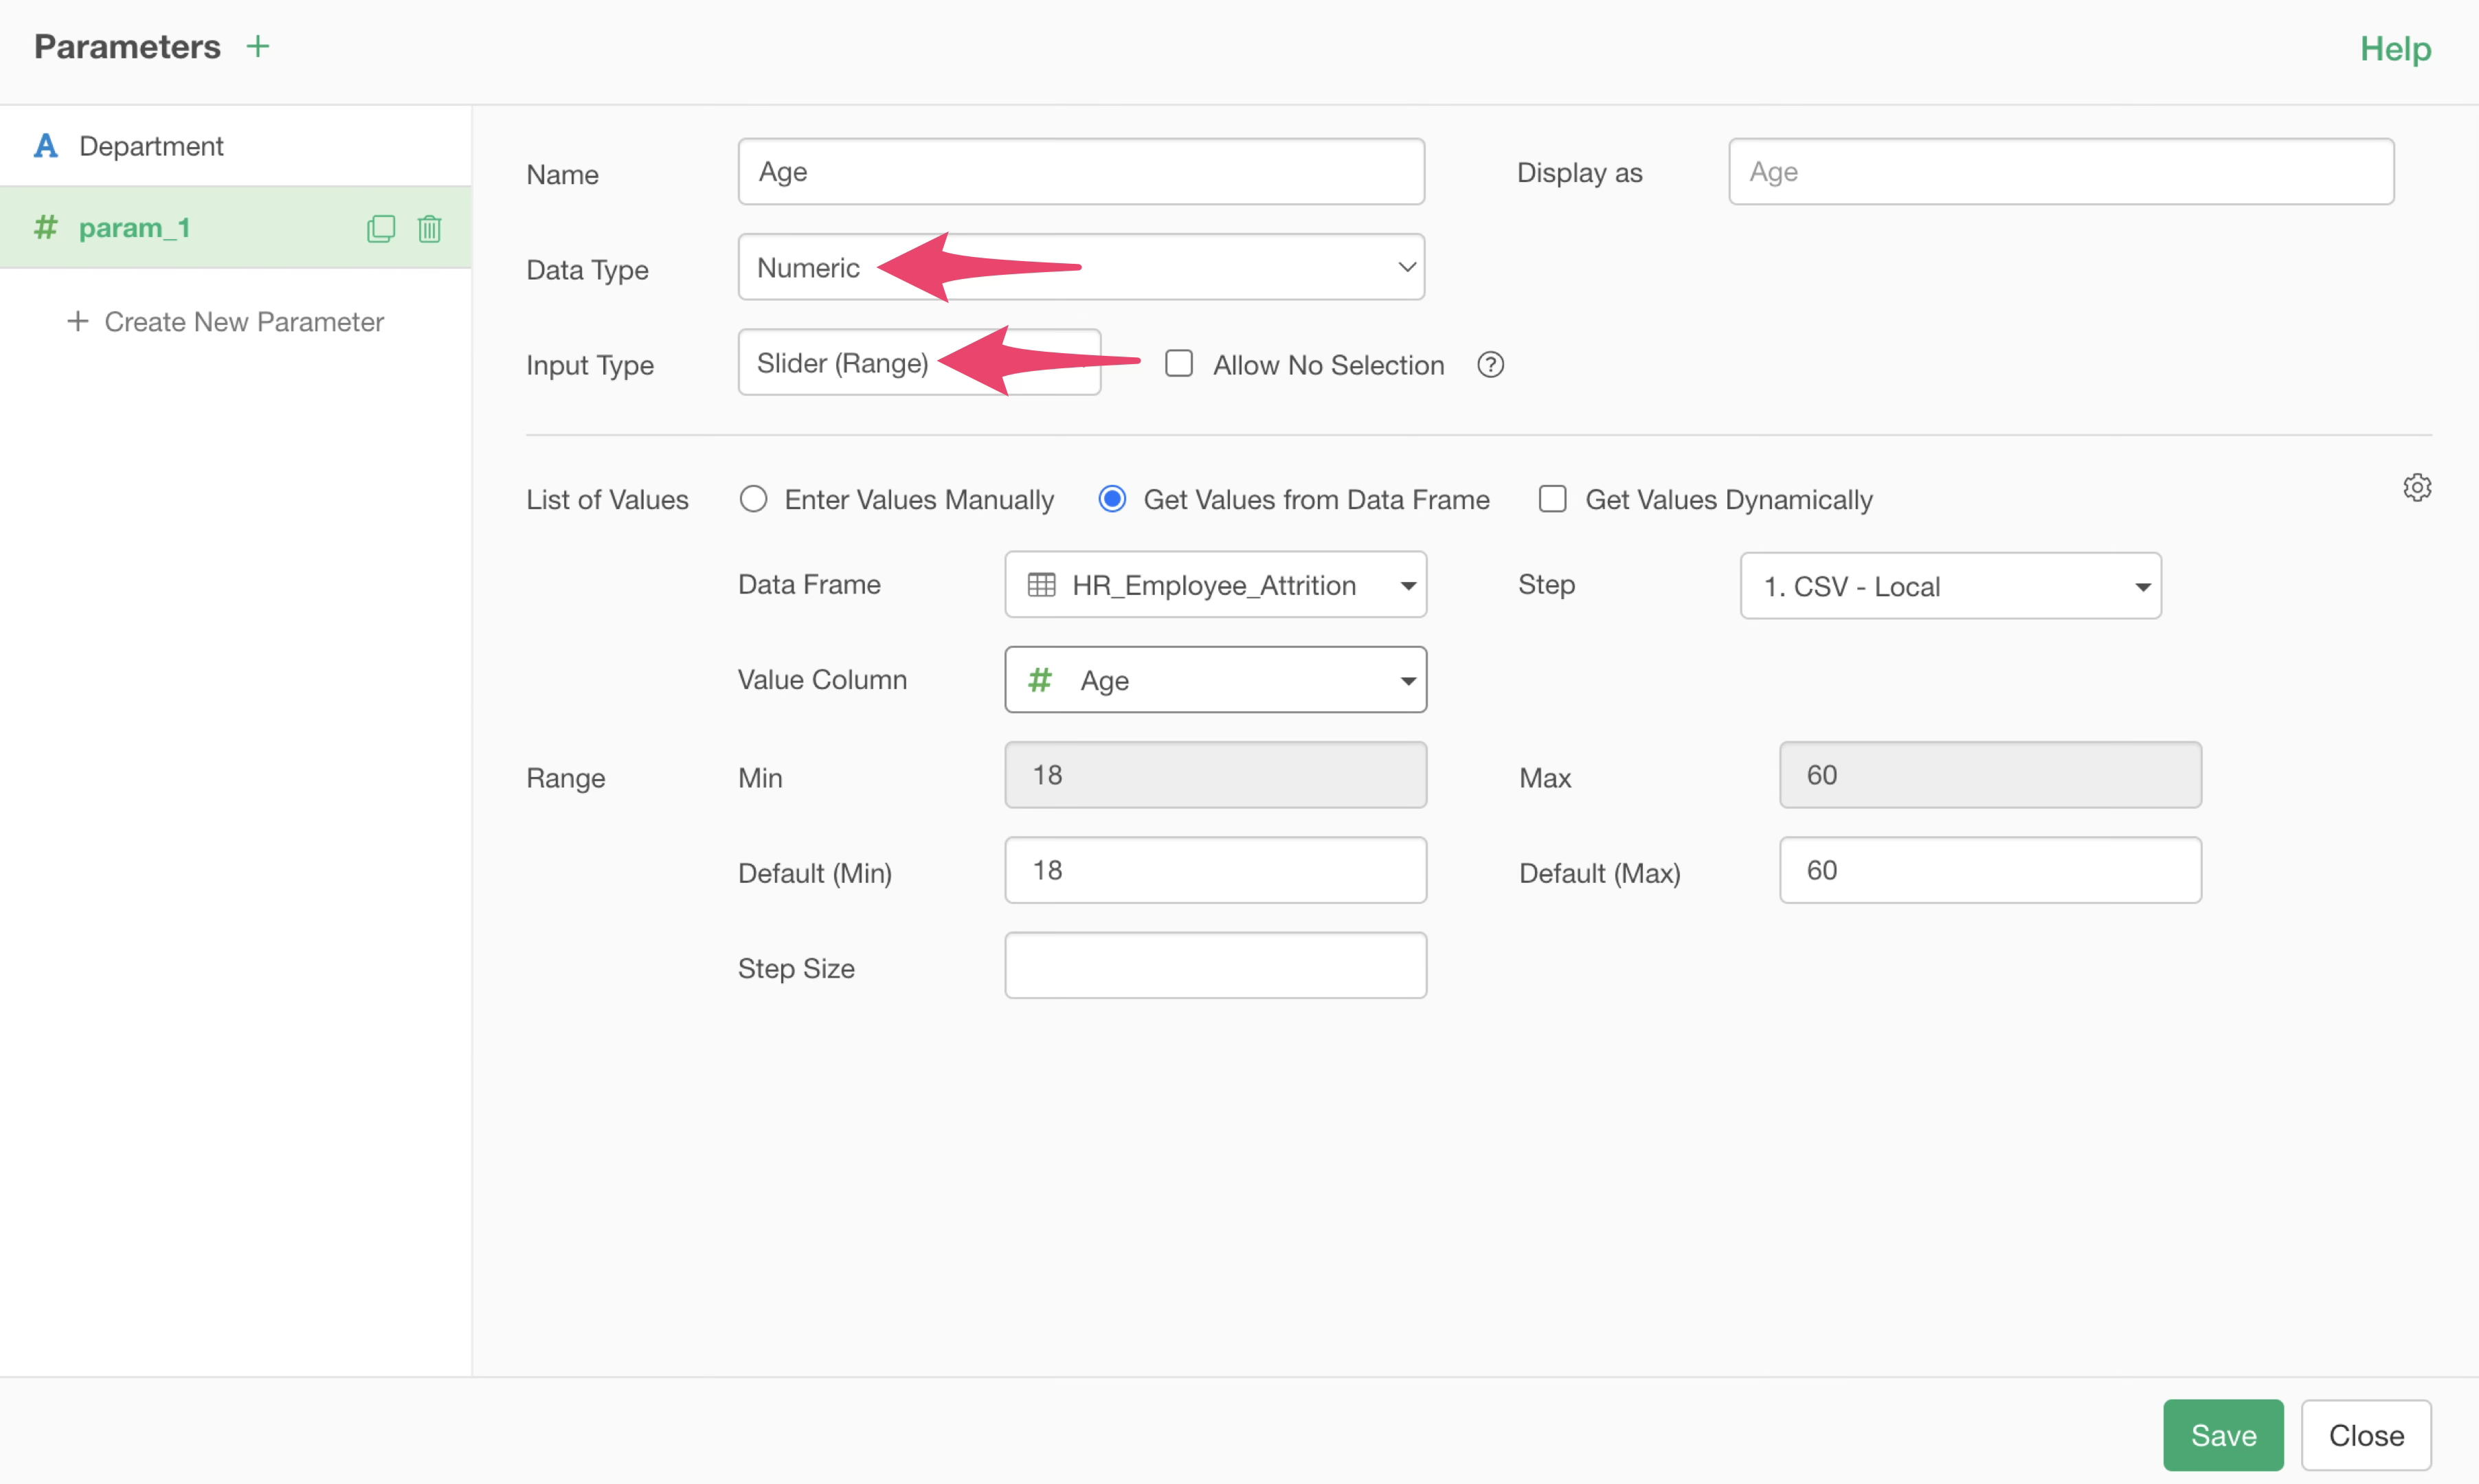
Select “Get values from Data Frame” and specify as follows:
Data Frame: HR_Employee_Attrition
Step: 1. CSV - Local
Value Column: Age
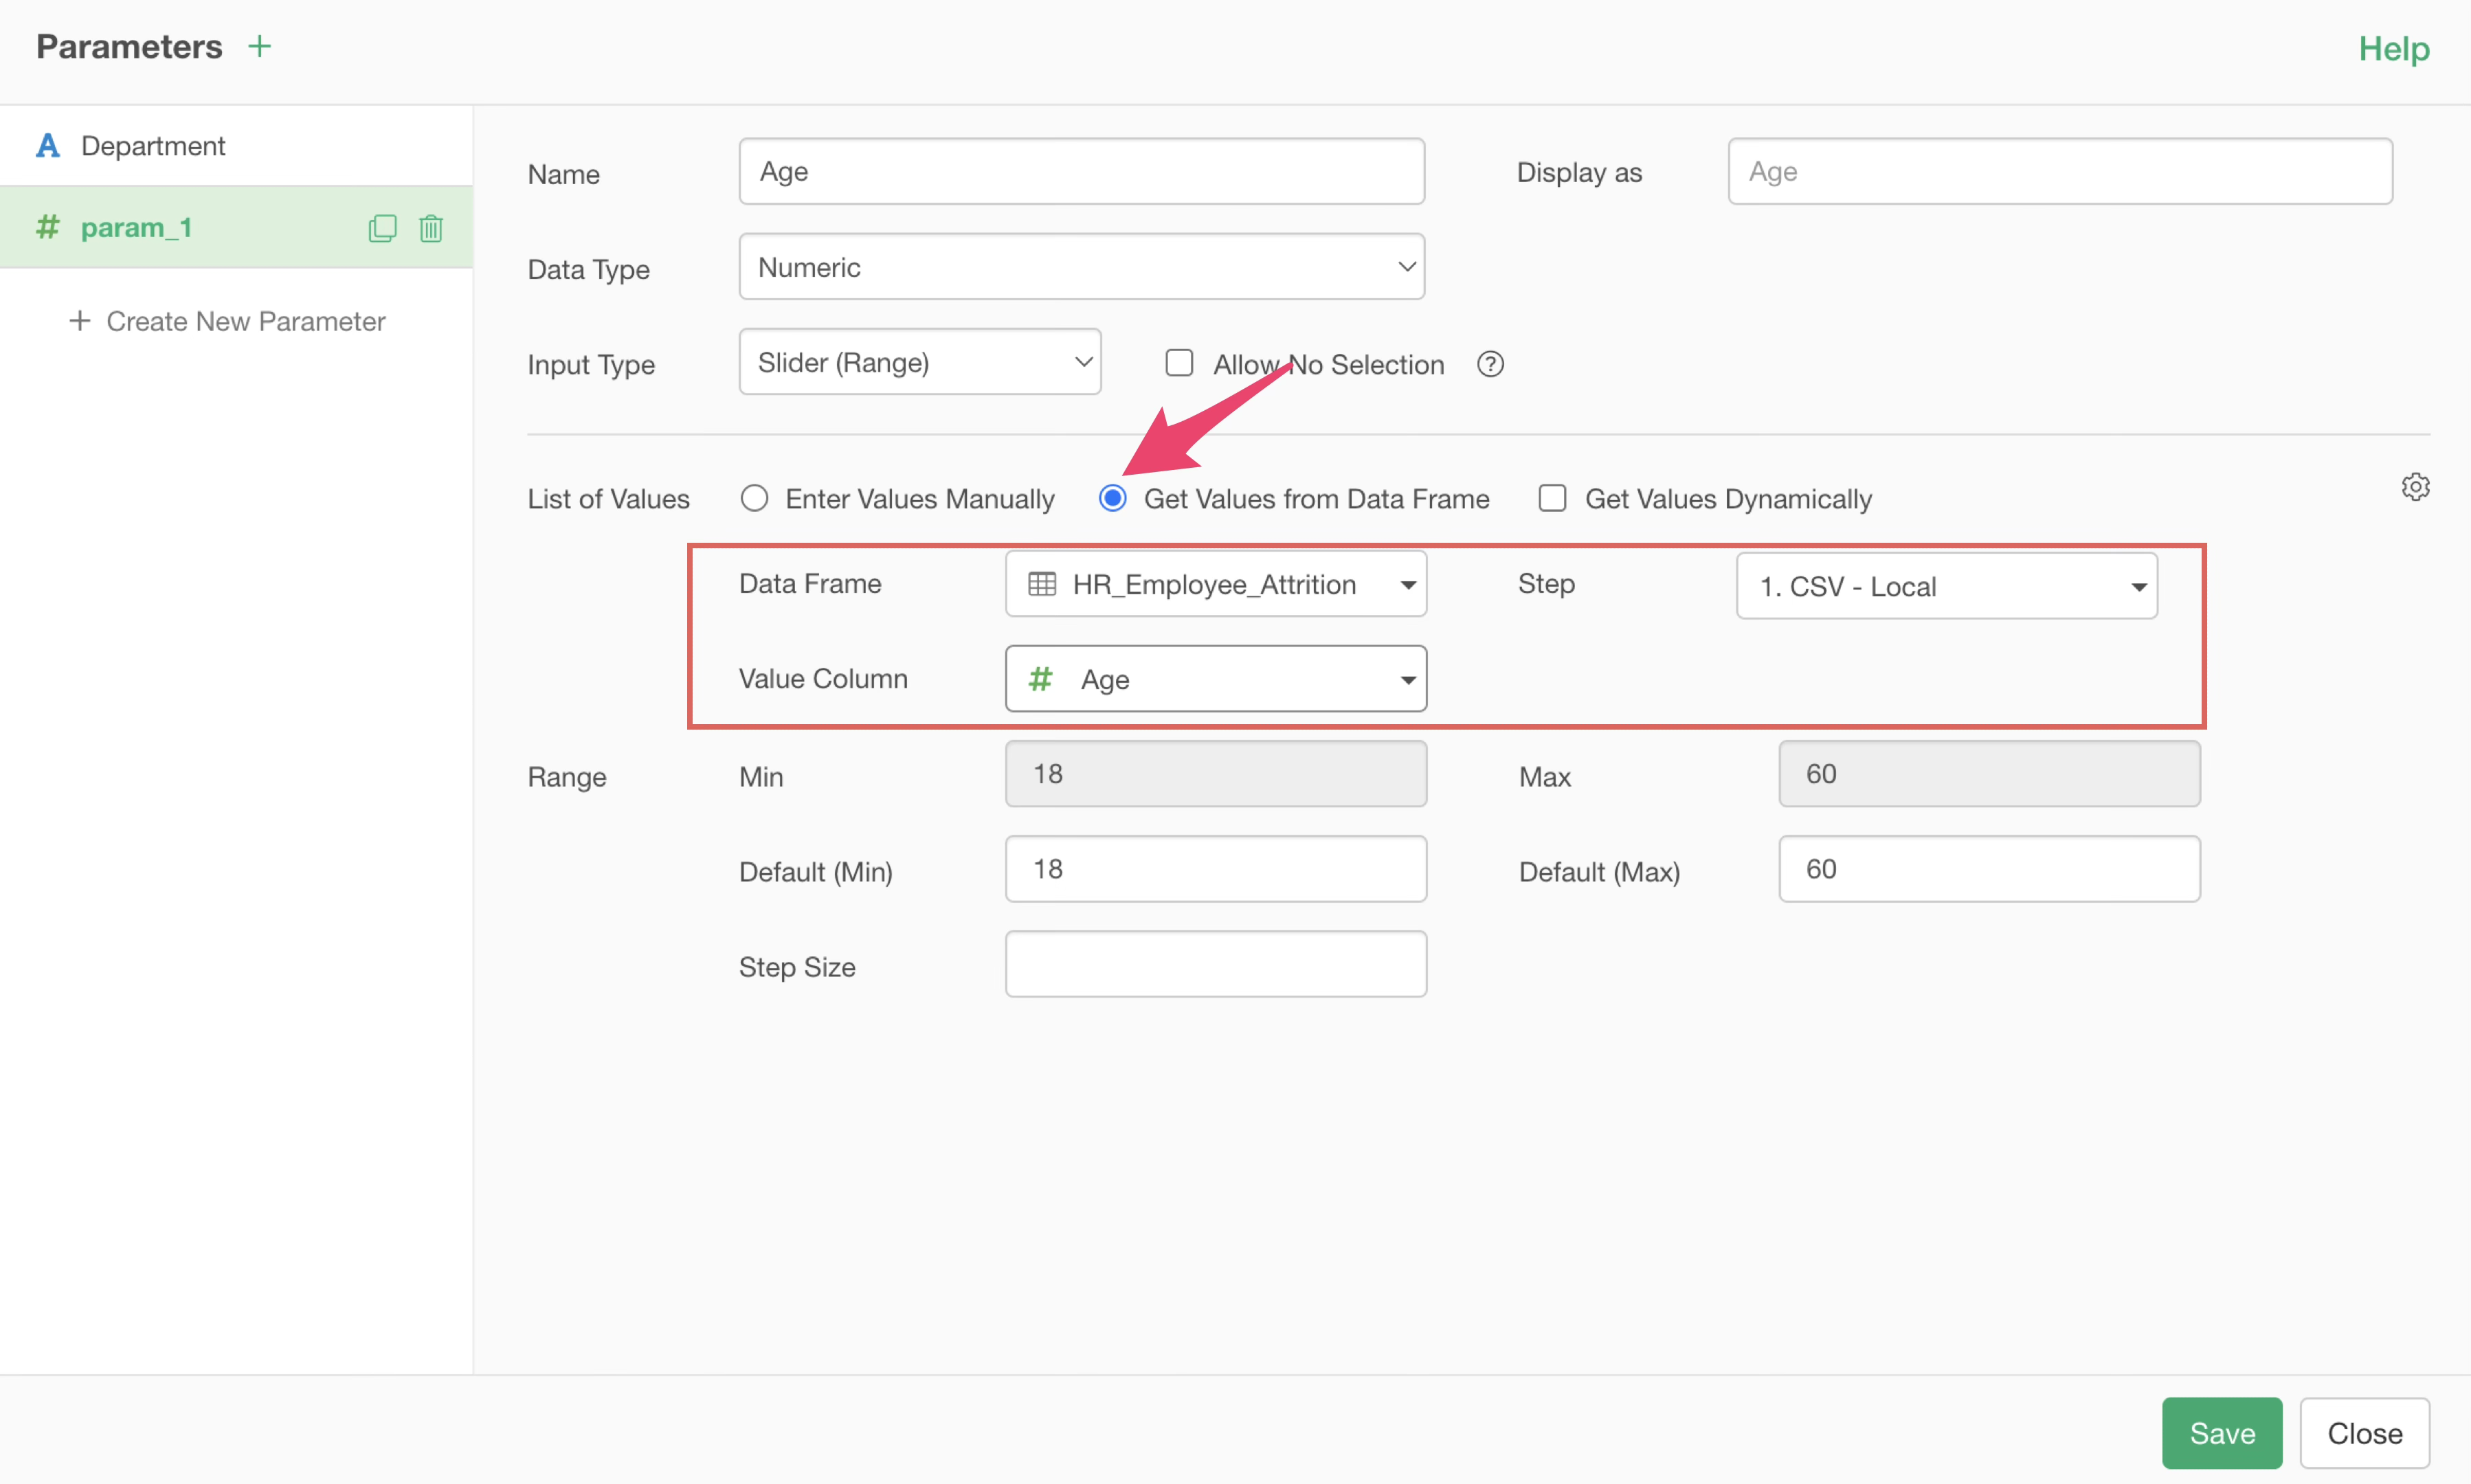
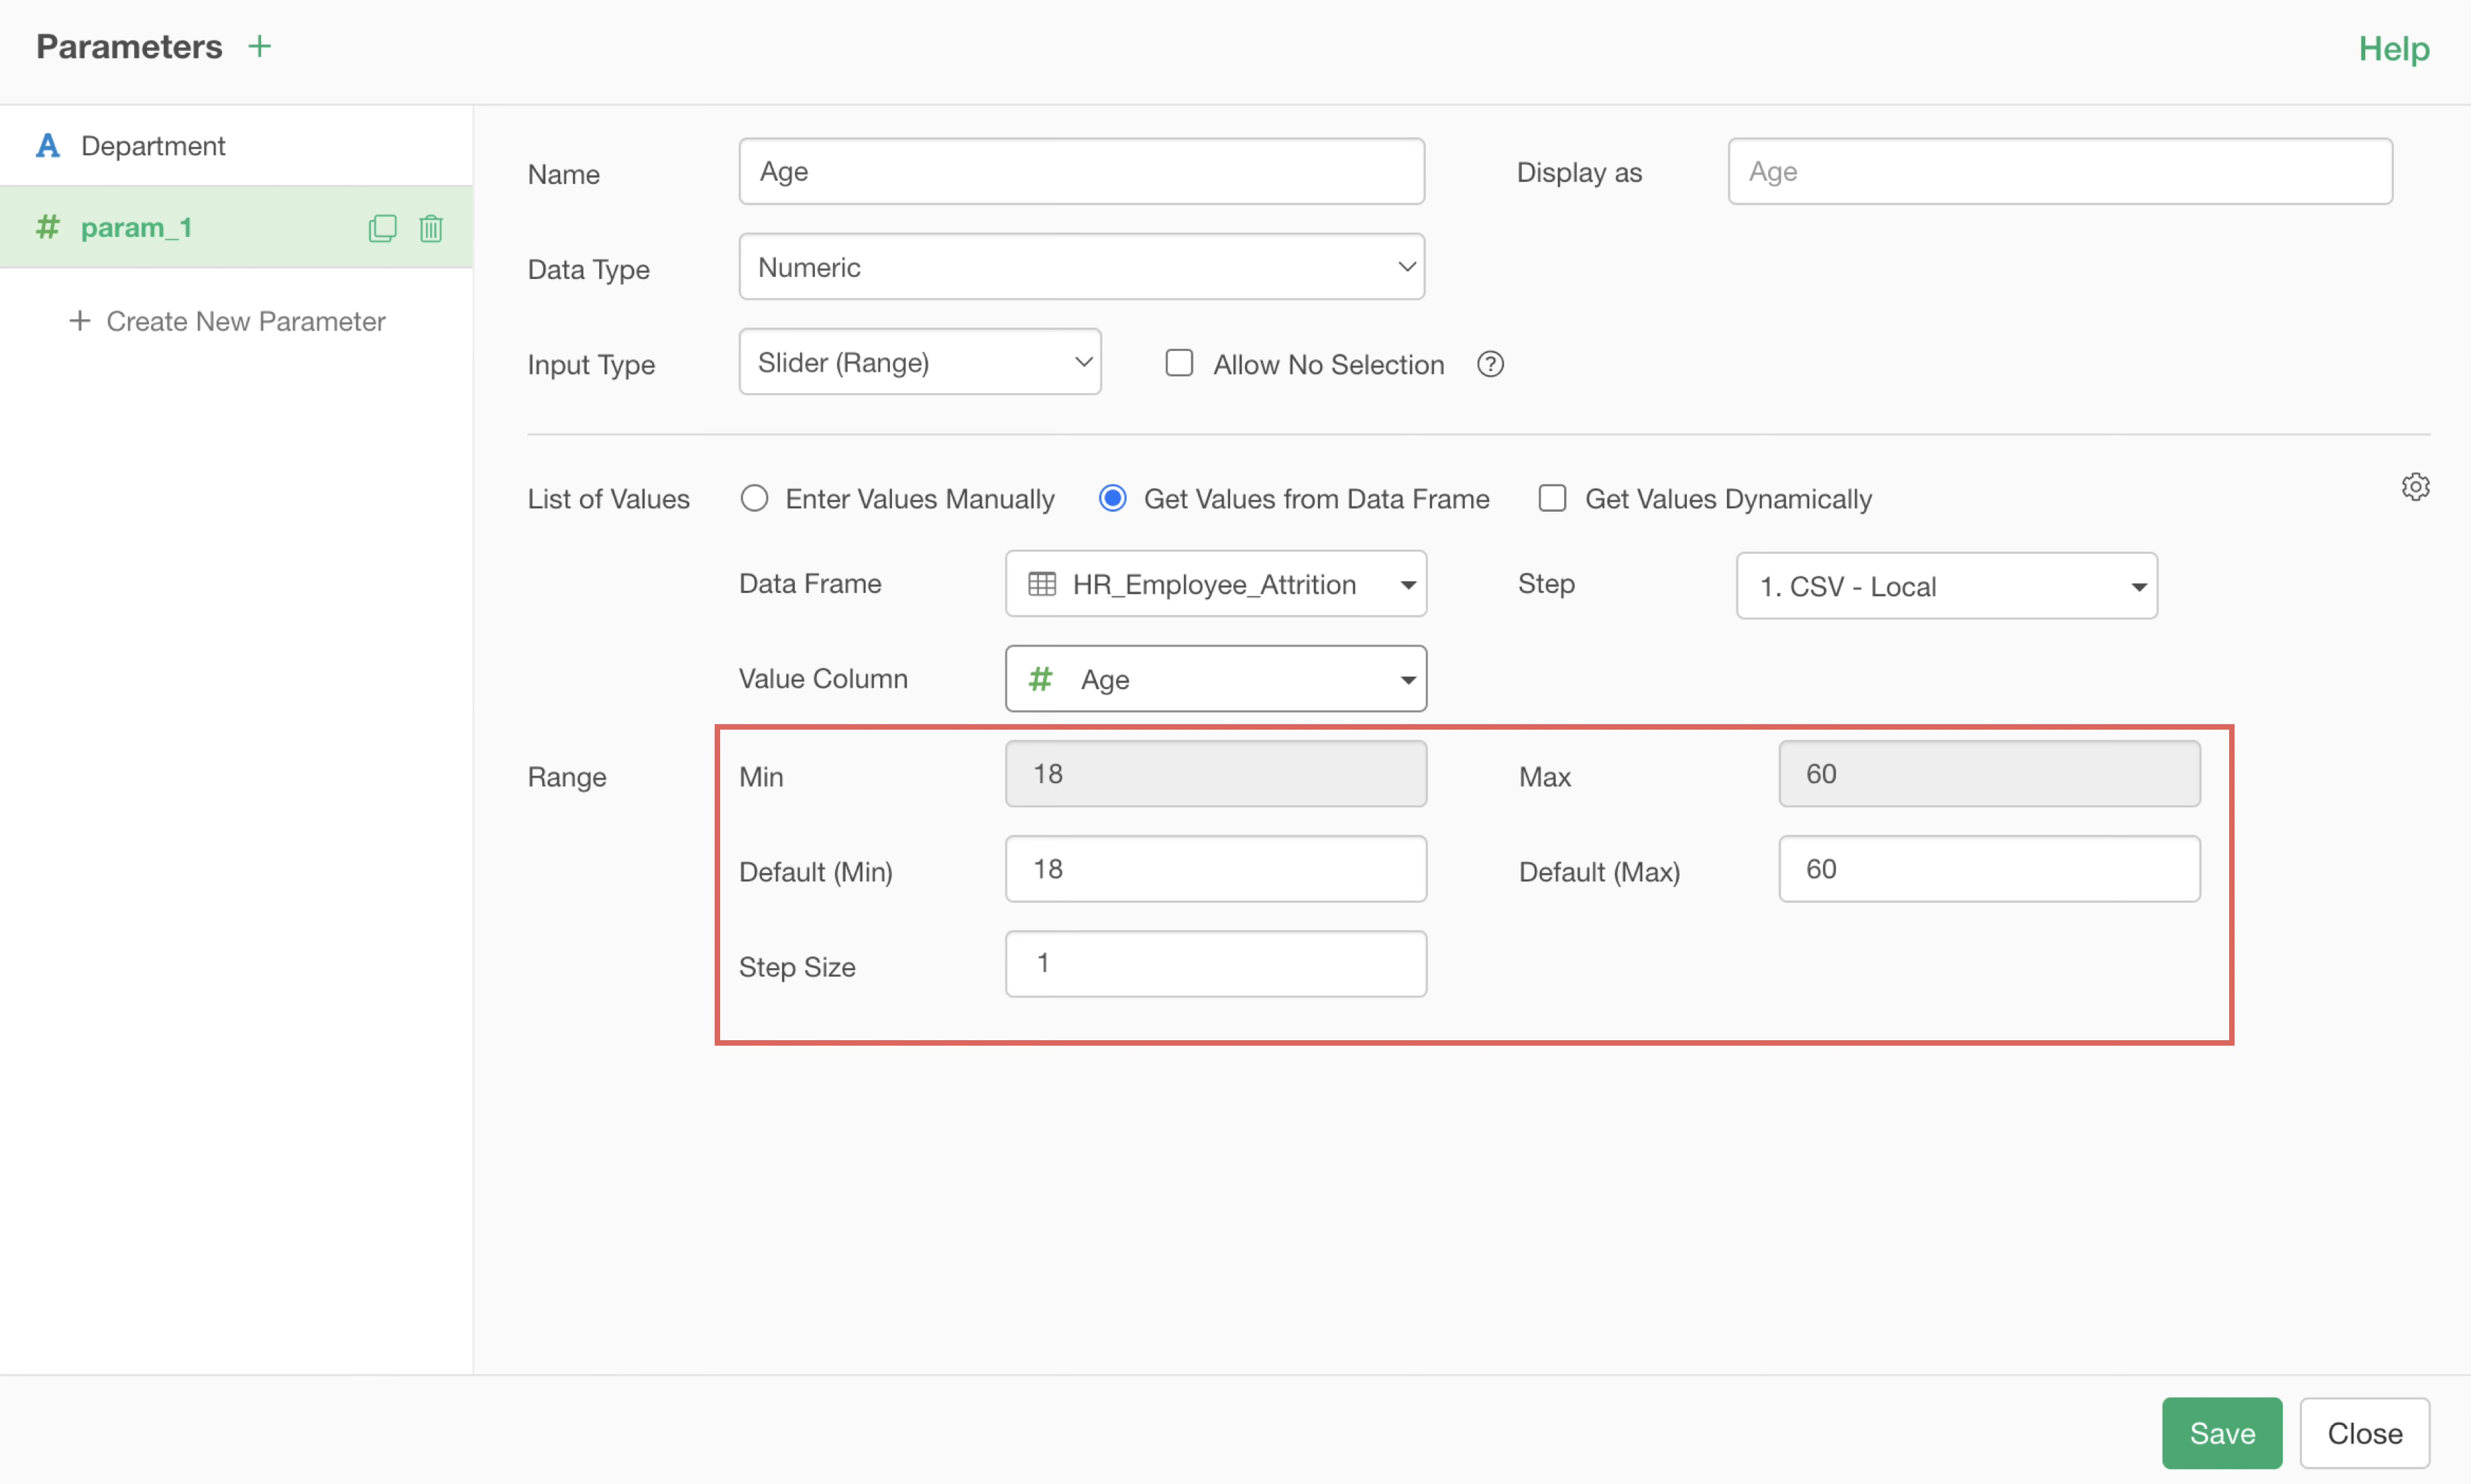
Also, the minimum and maximum age values will be read and set for the value range. The step size is the increment (width) when moving the slider; specifying 1 allows changes in increments of 1.
Save the parameter and set the age parameter you just created in the chart filter.
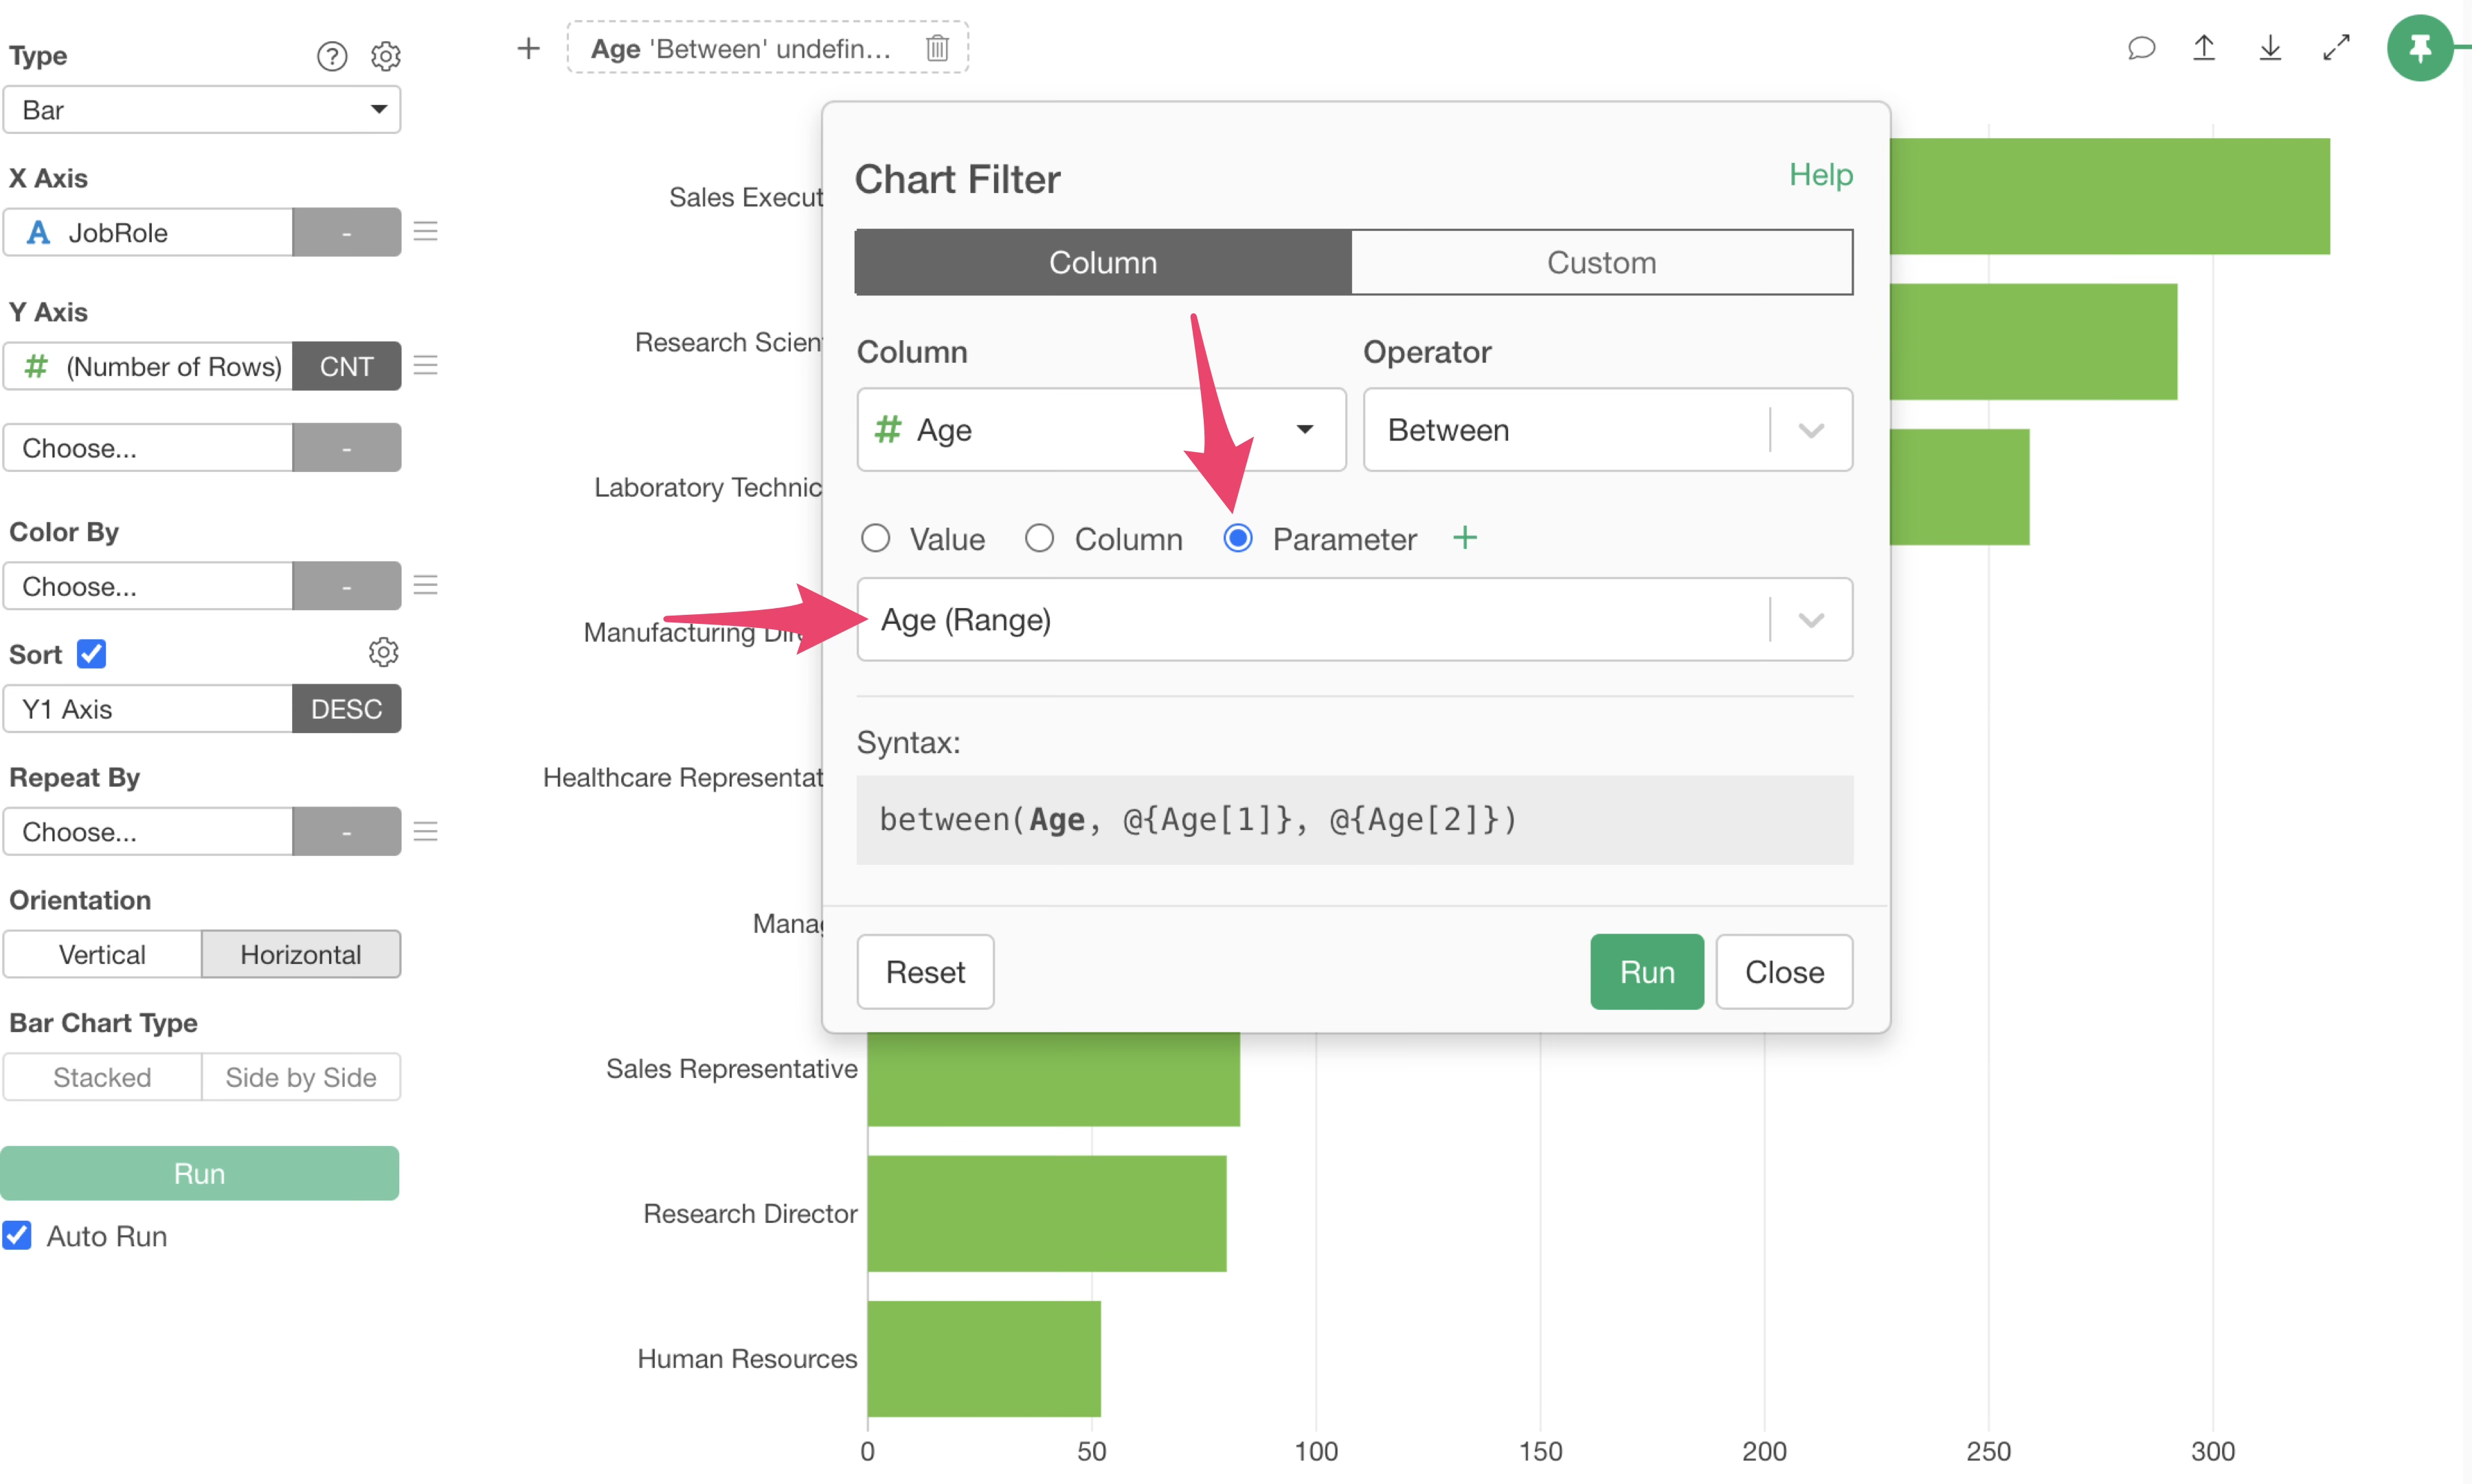
This allows you to apply the age parameter only to this chart.
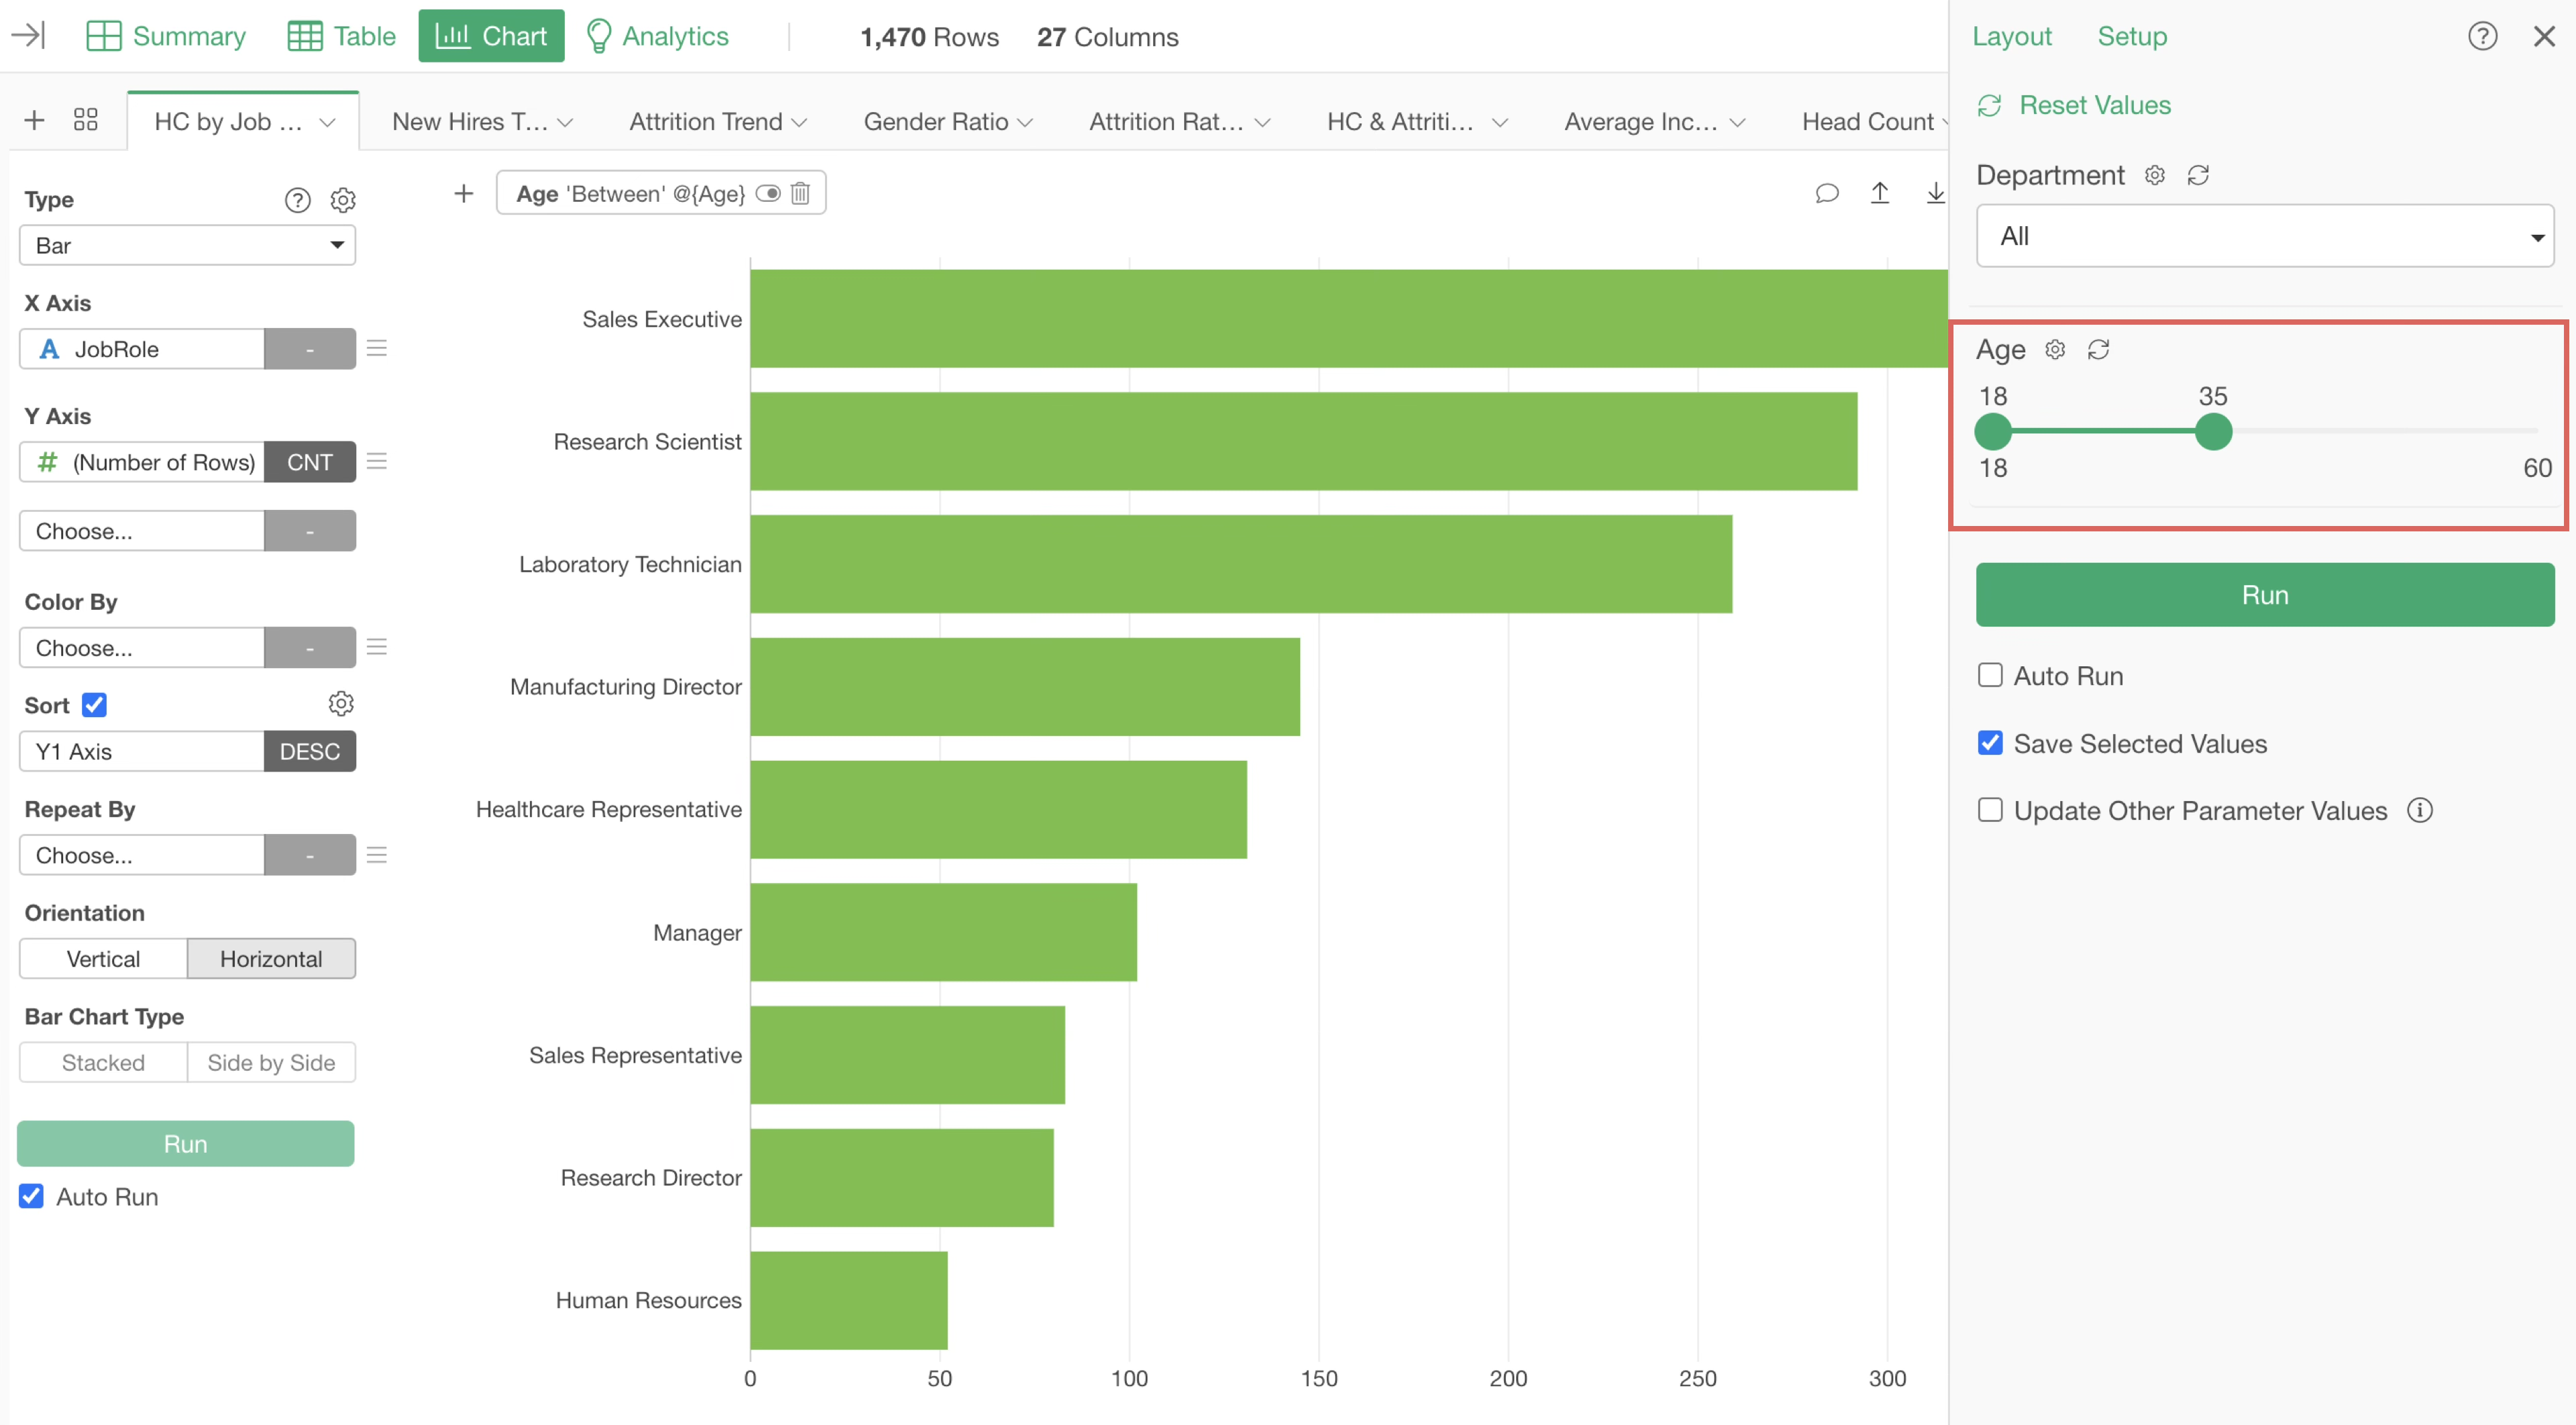
To check the results, open the parameter window.
This allows you to freely specify the age range and view the results in the chart.
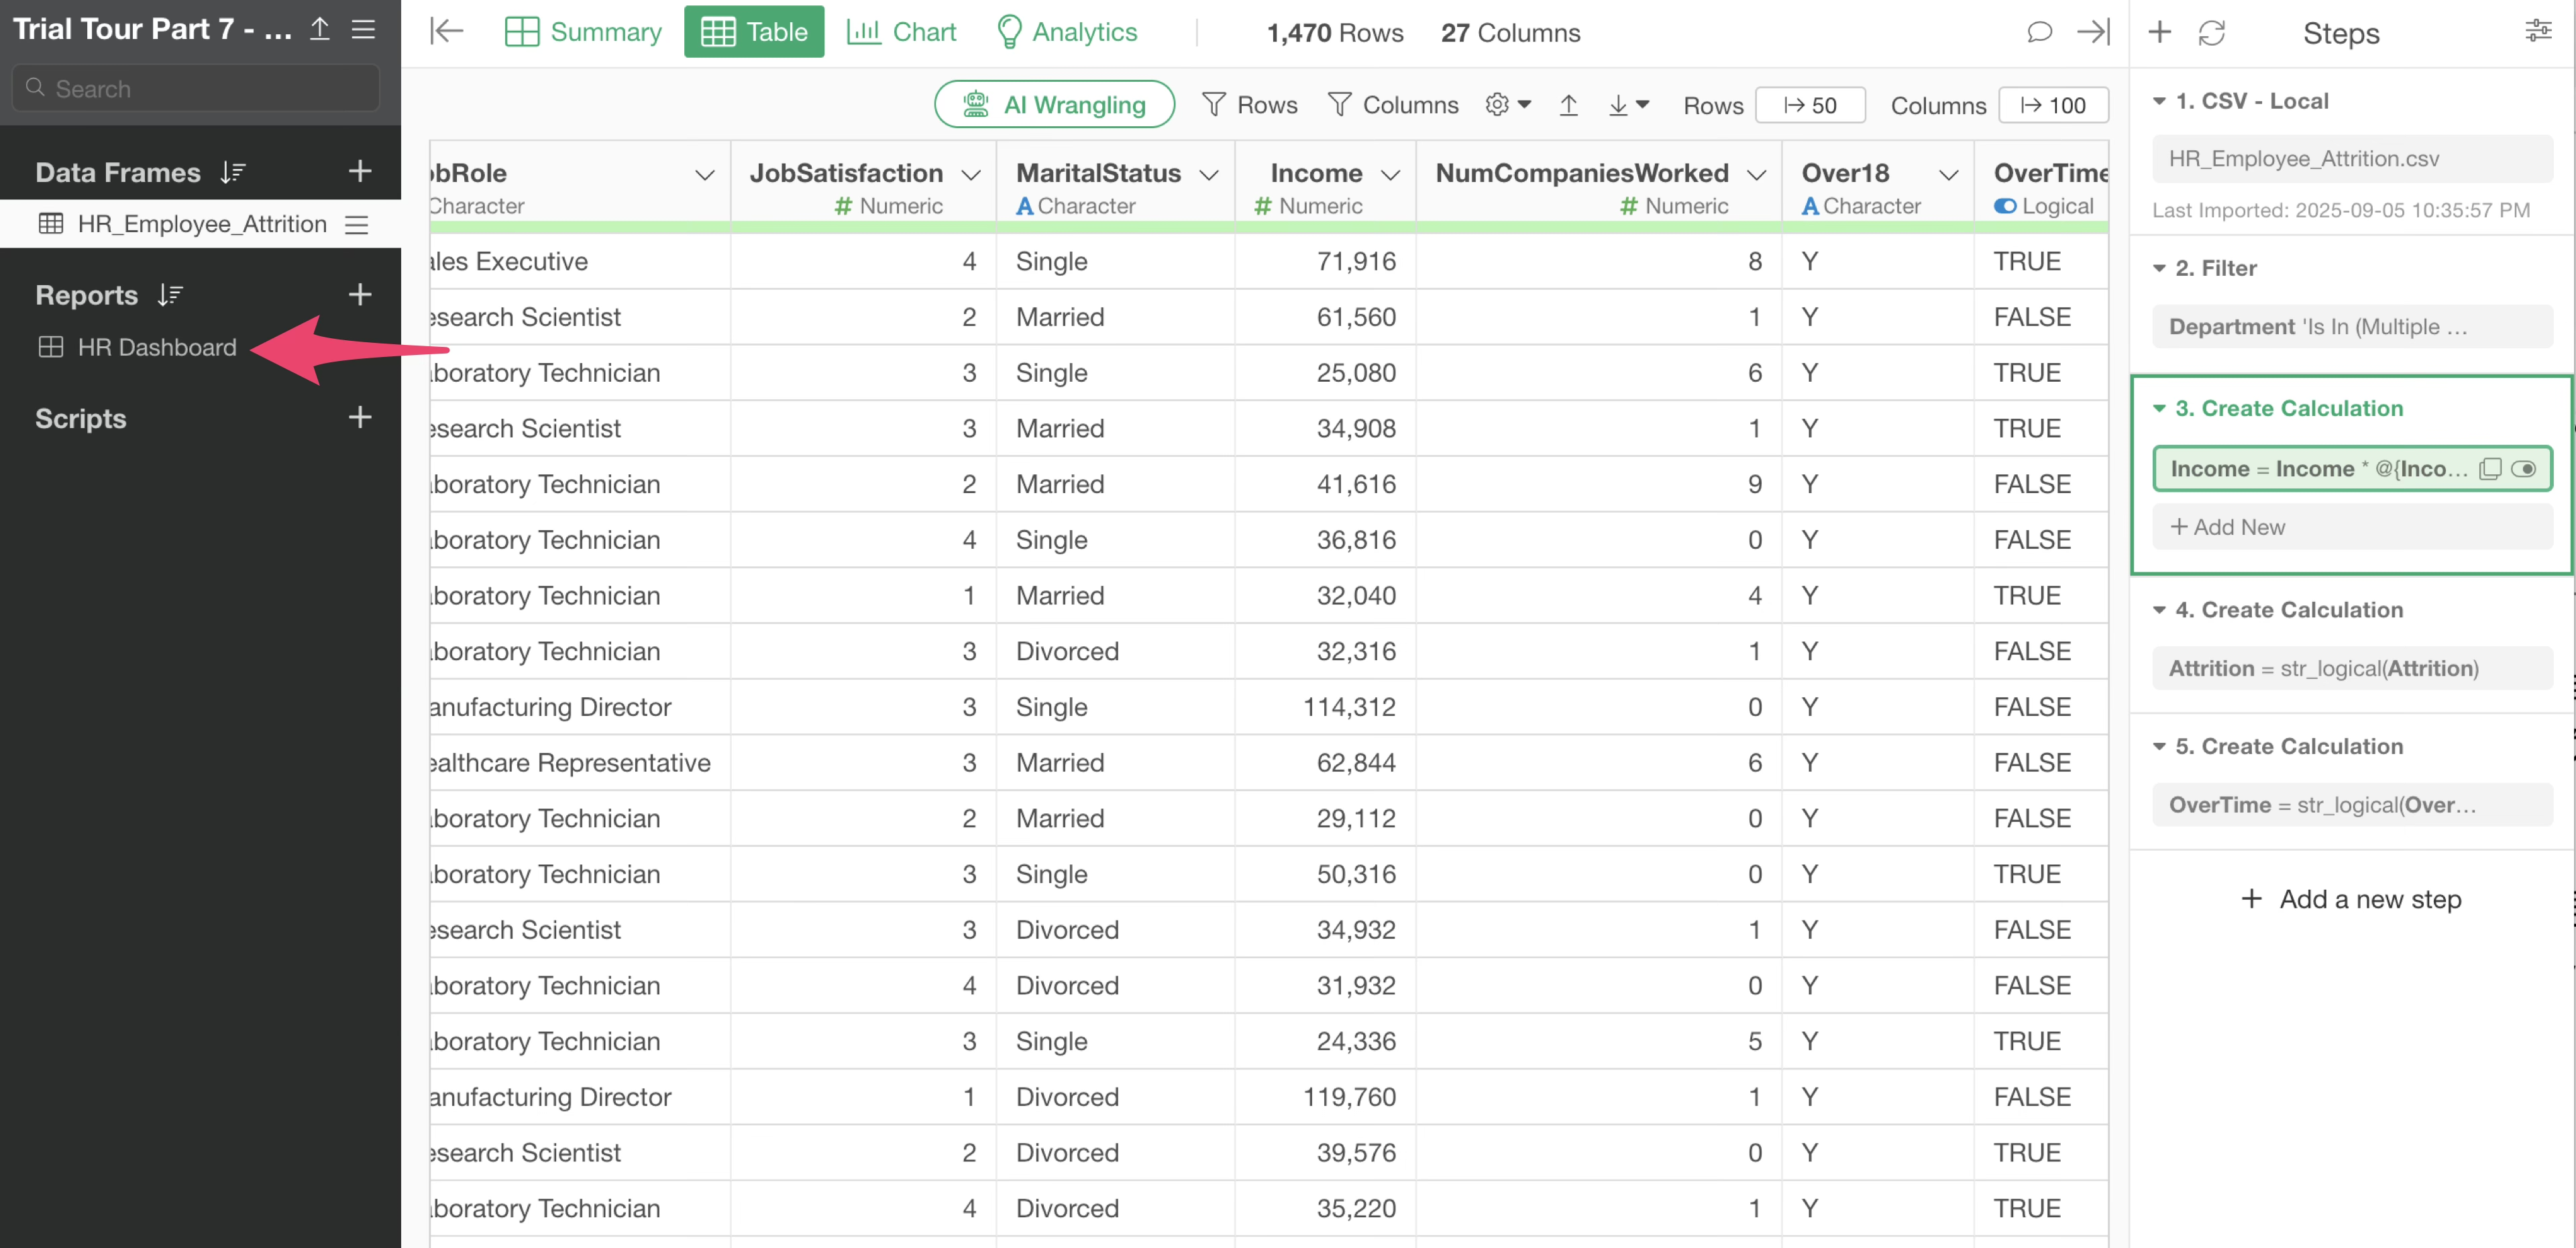
4. Calculations
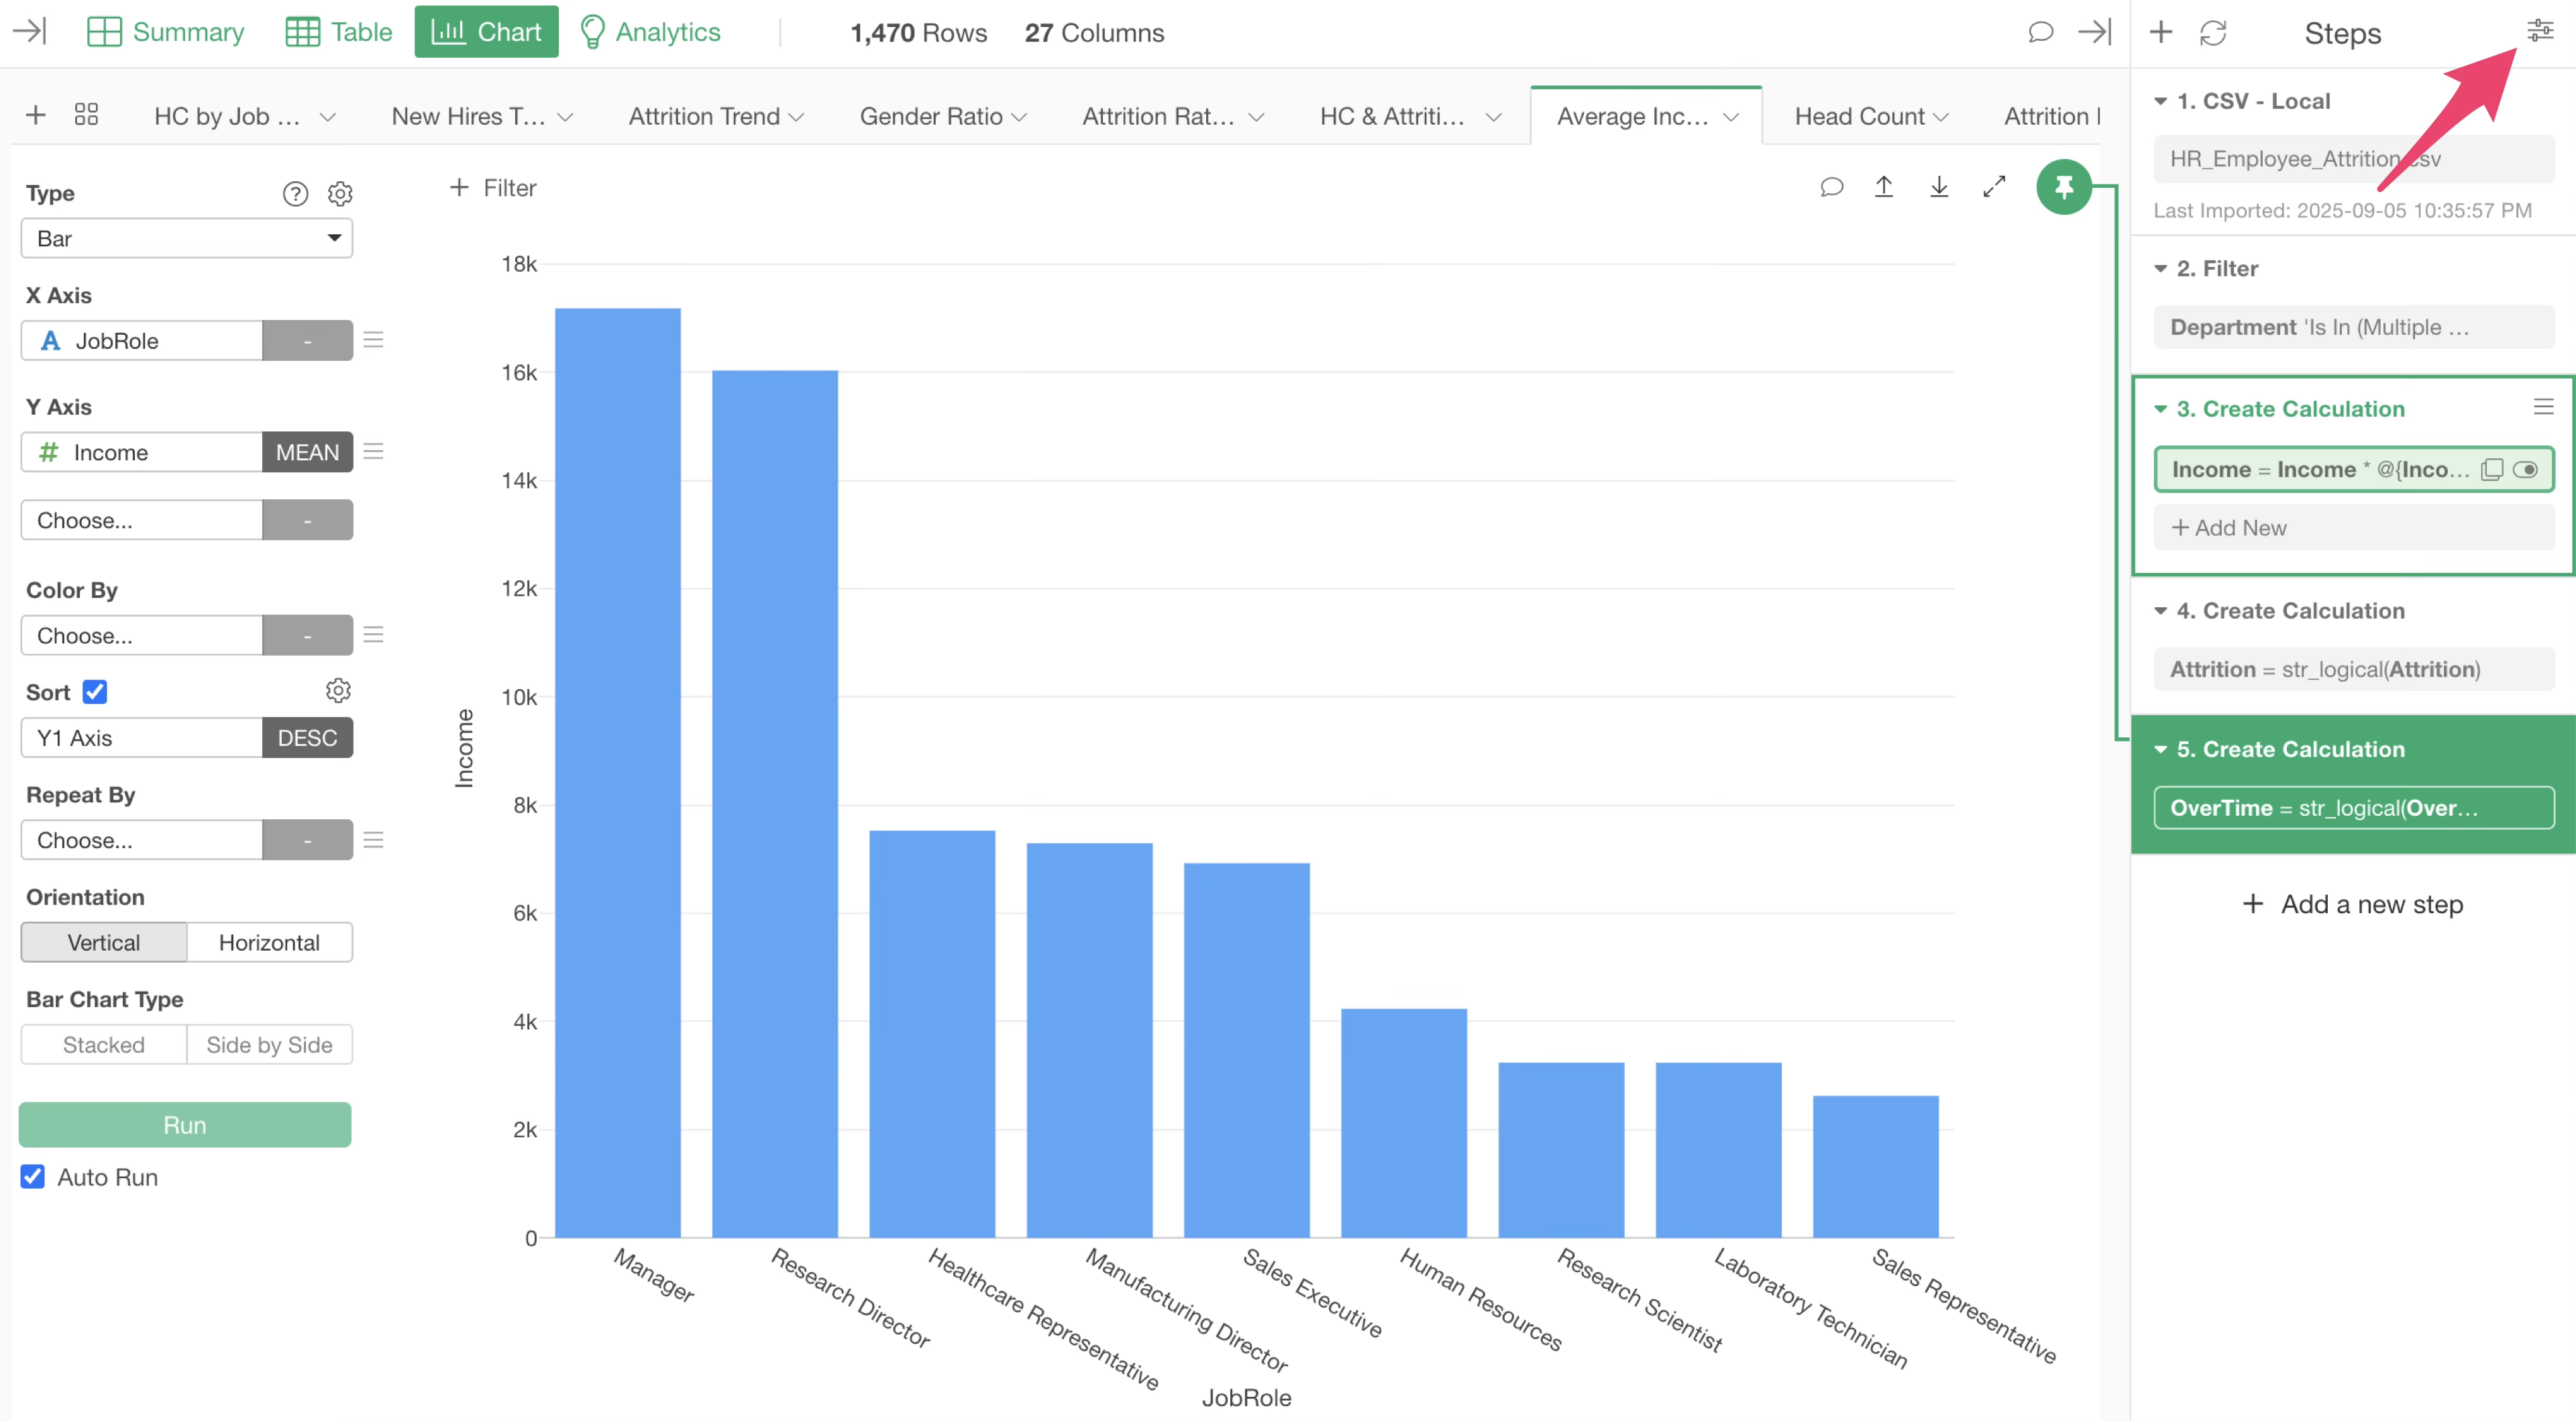
For example, suppose there is a bar chart visualizing the average income by job role, as shown below.
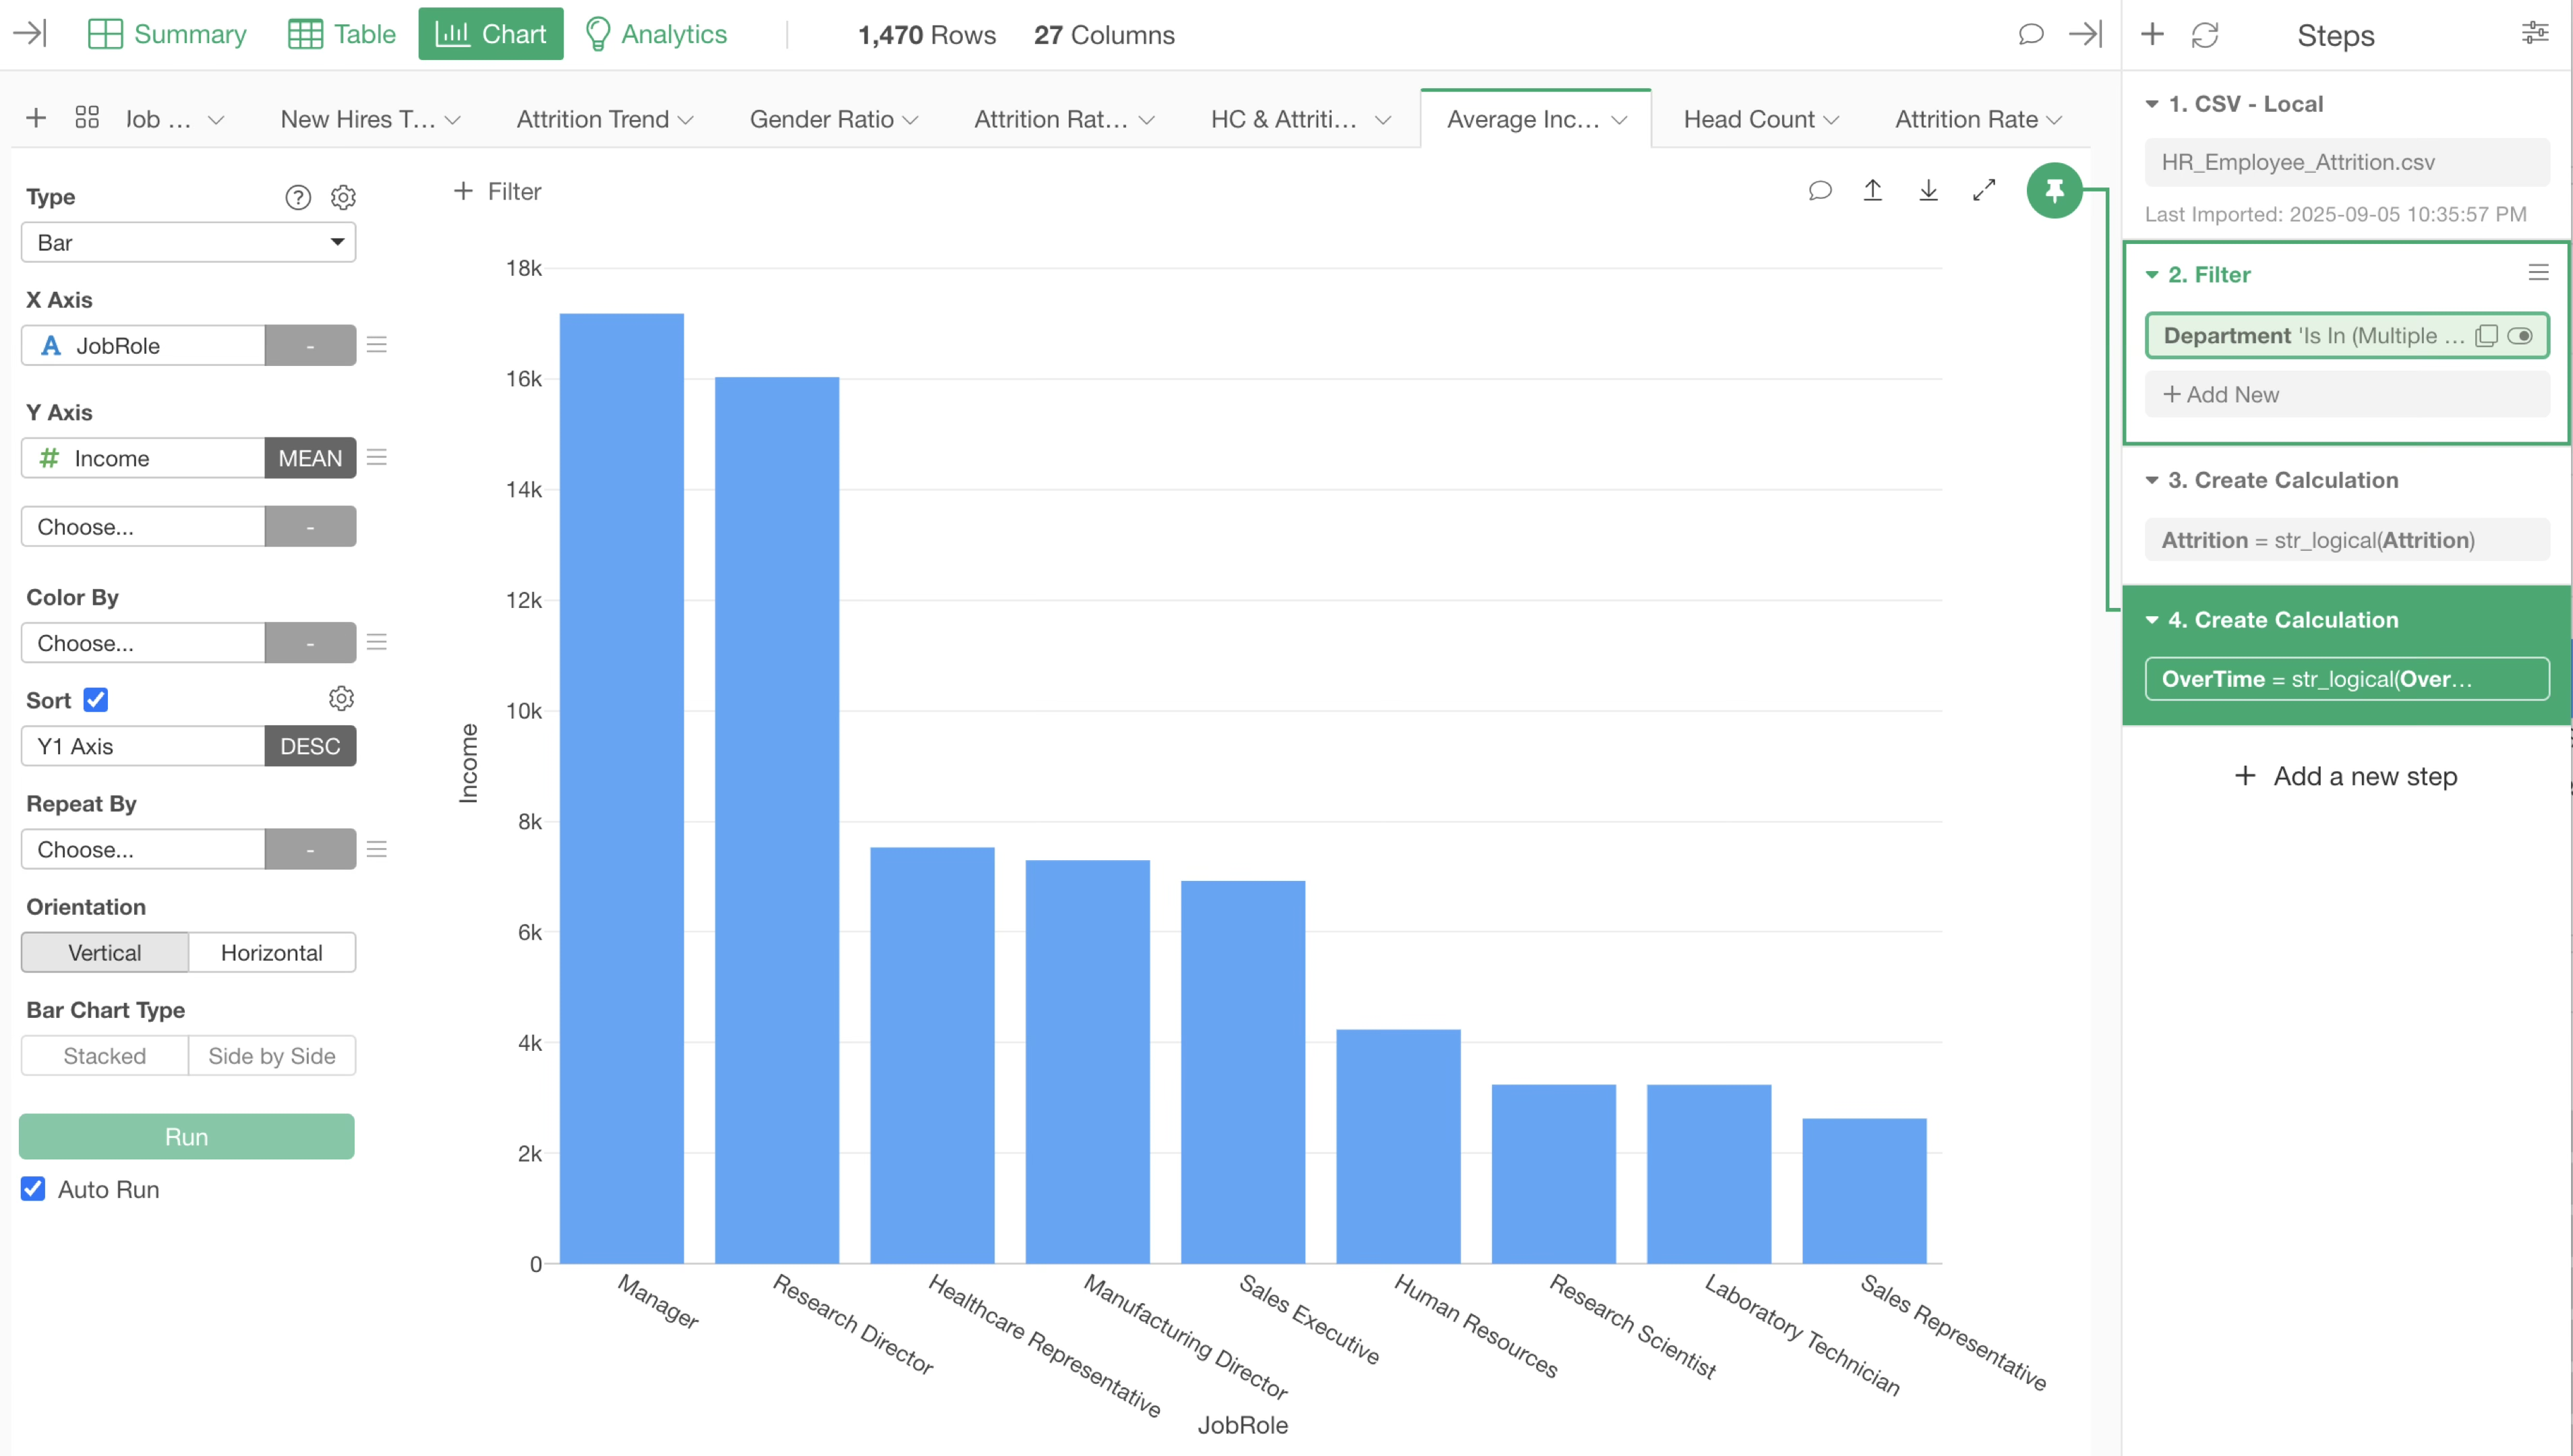
Since “Income” represents monthly income, let’s make it possible to view the previous chart in terms of either monthly or yearly income.
For monthly income, the values can be used as-is. For yearly income, however, we need to multiply the current values by 12.
To switch between calculating yearly income (Income * 12) or simply displaying monthly income (Income * 1), we’ll use a parameter inside the calculation formula.
To create a new parameter, open the Parameter Window.
Click “Setup” button within the Parameter Window.

The parameter creation dialog appeared, so click “Create New Parameter.”
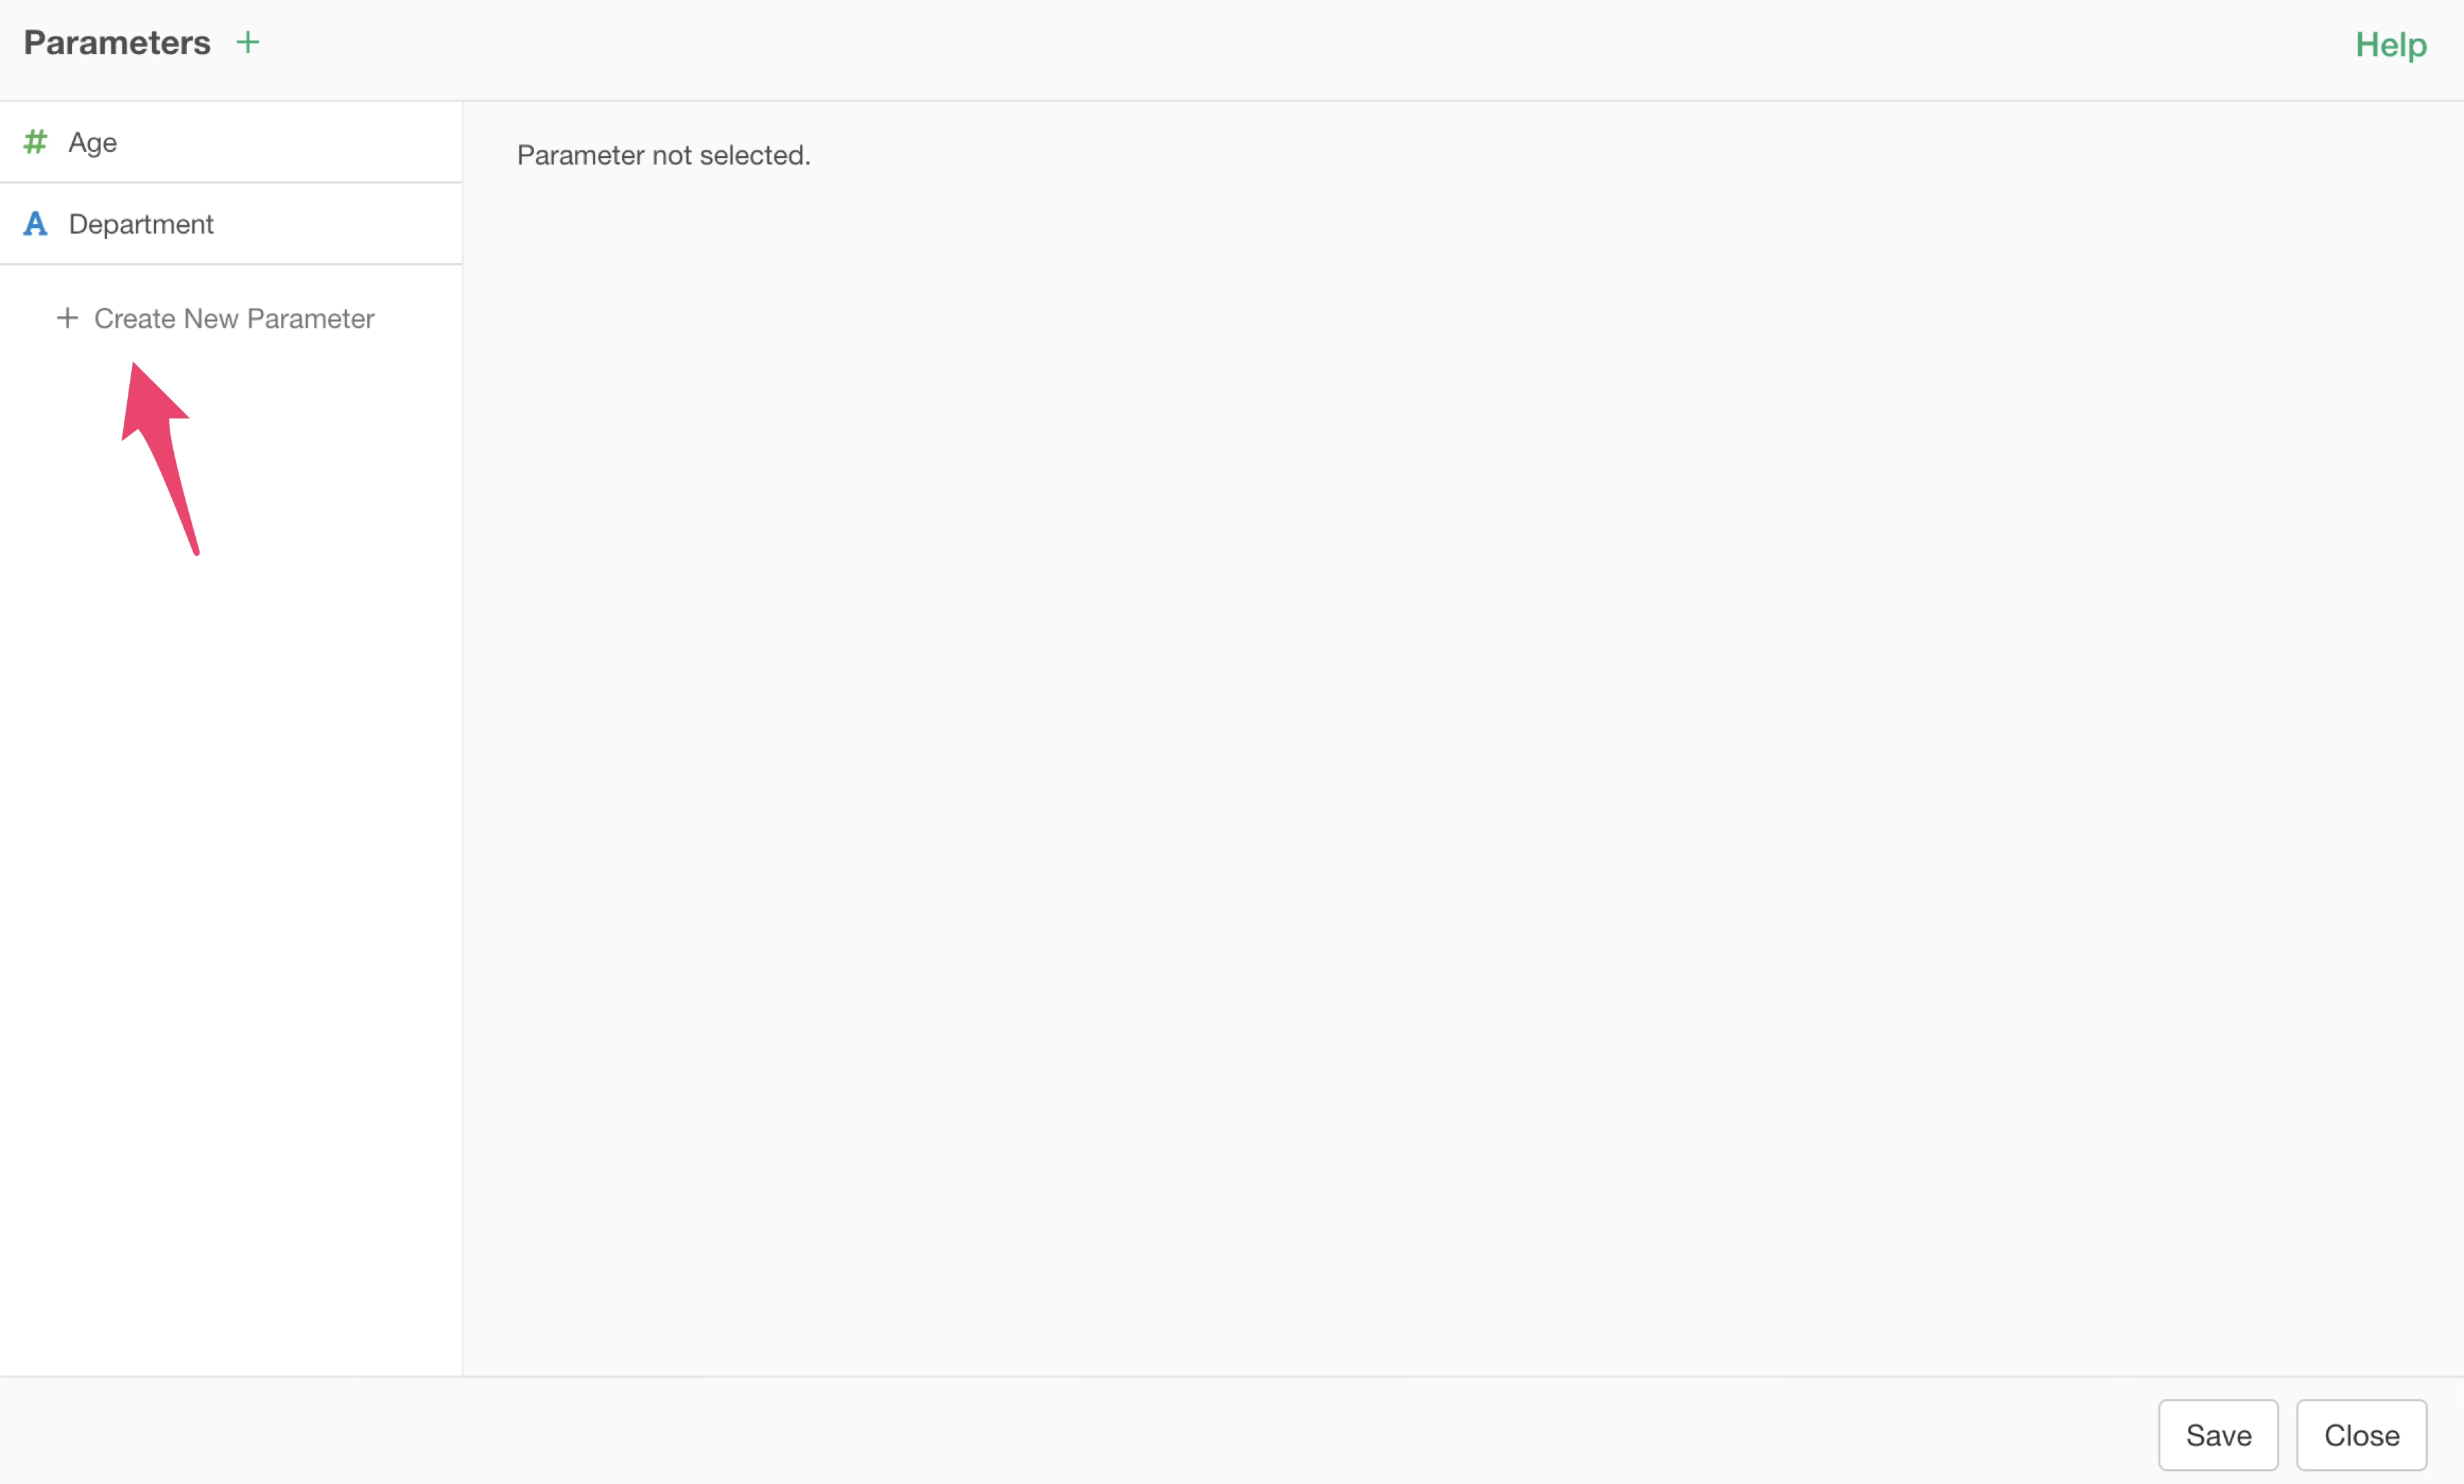
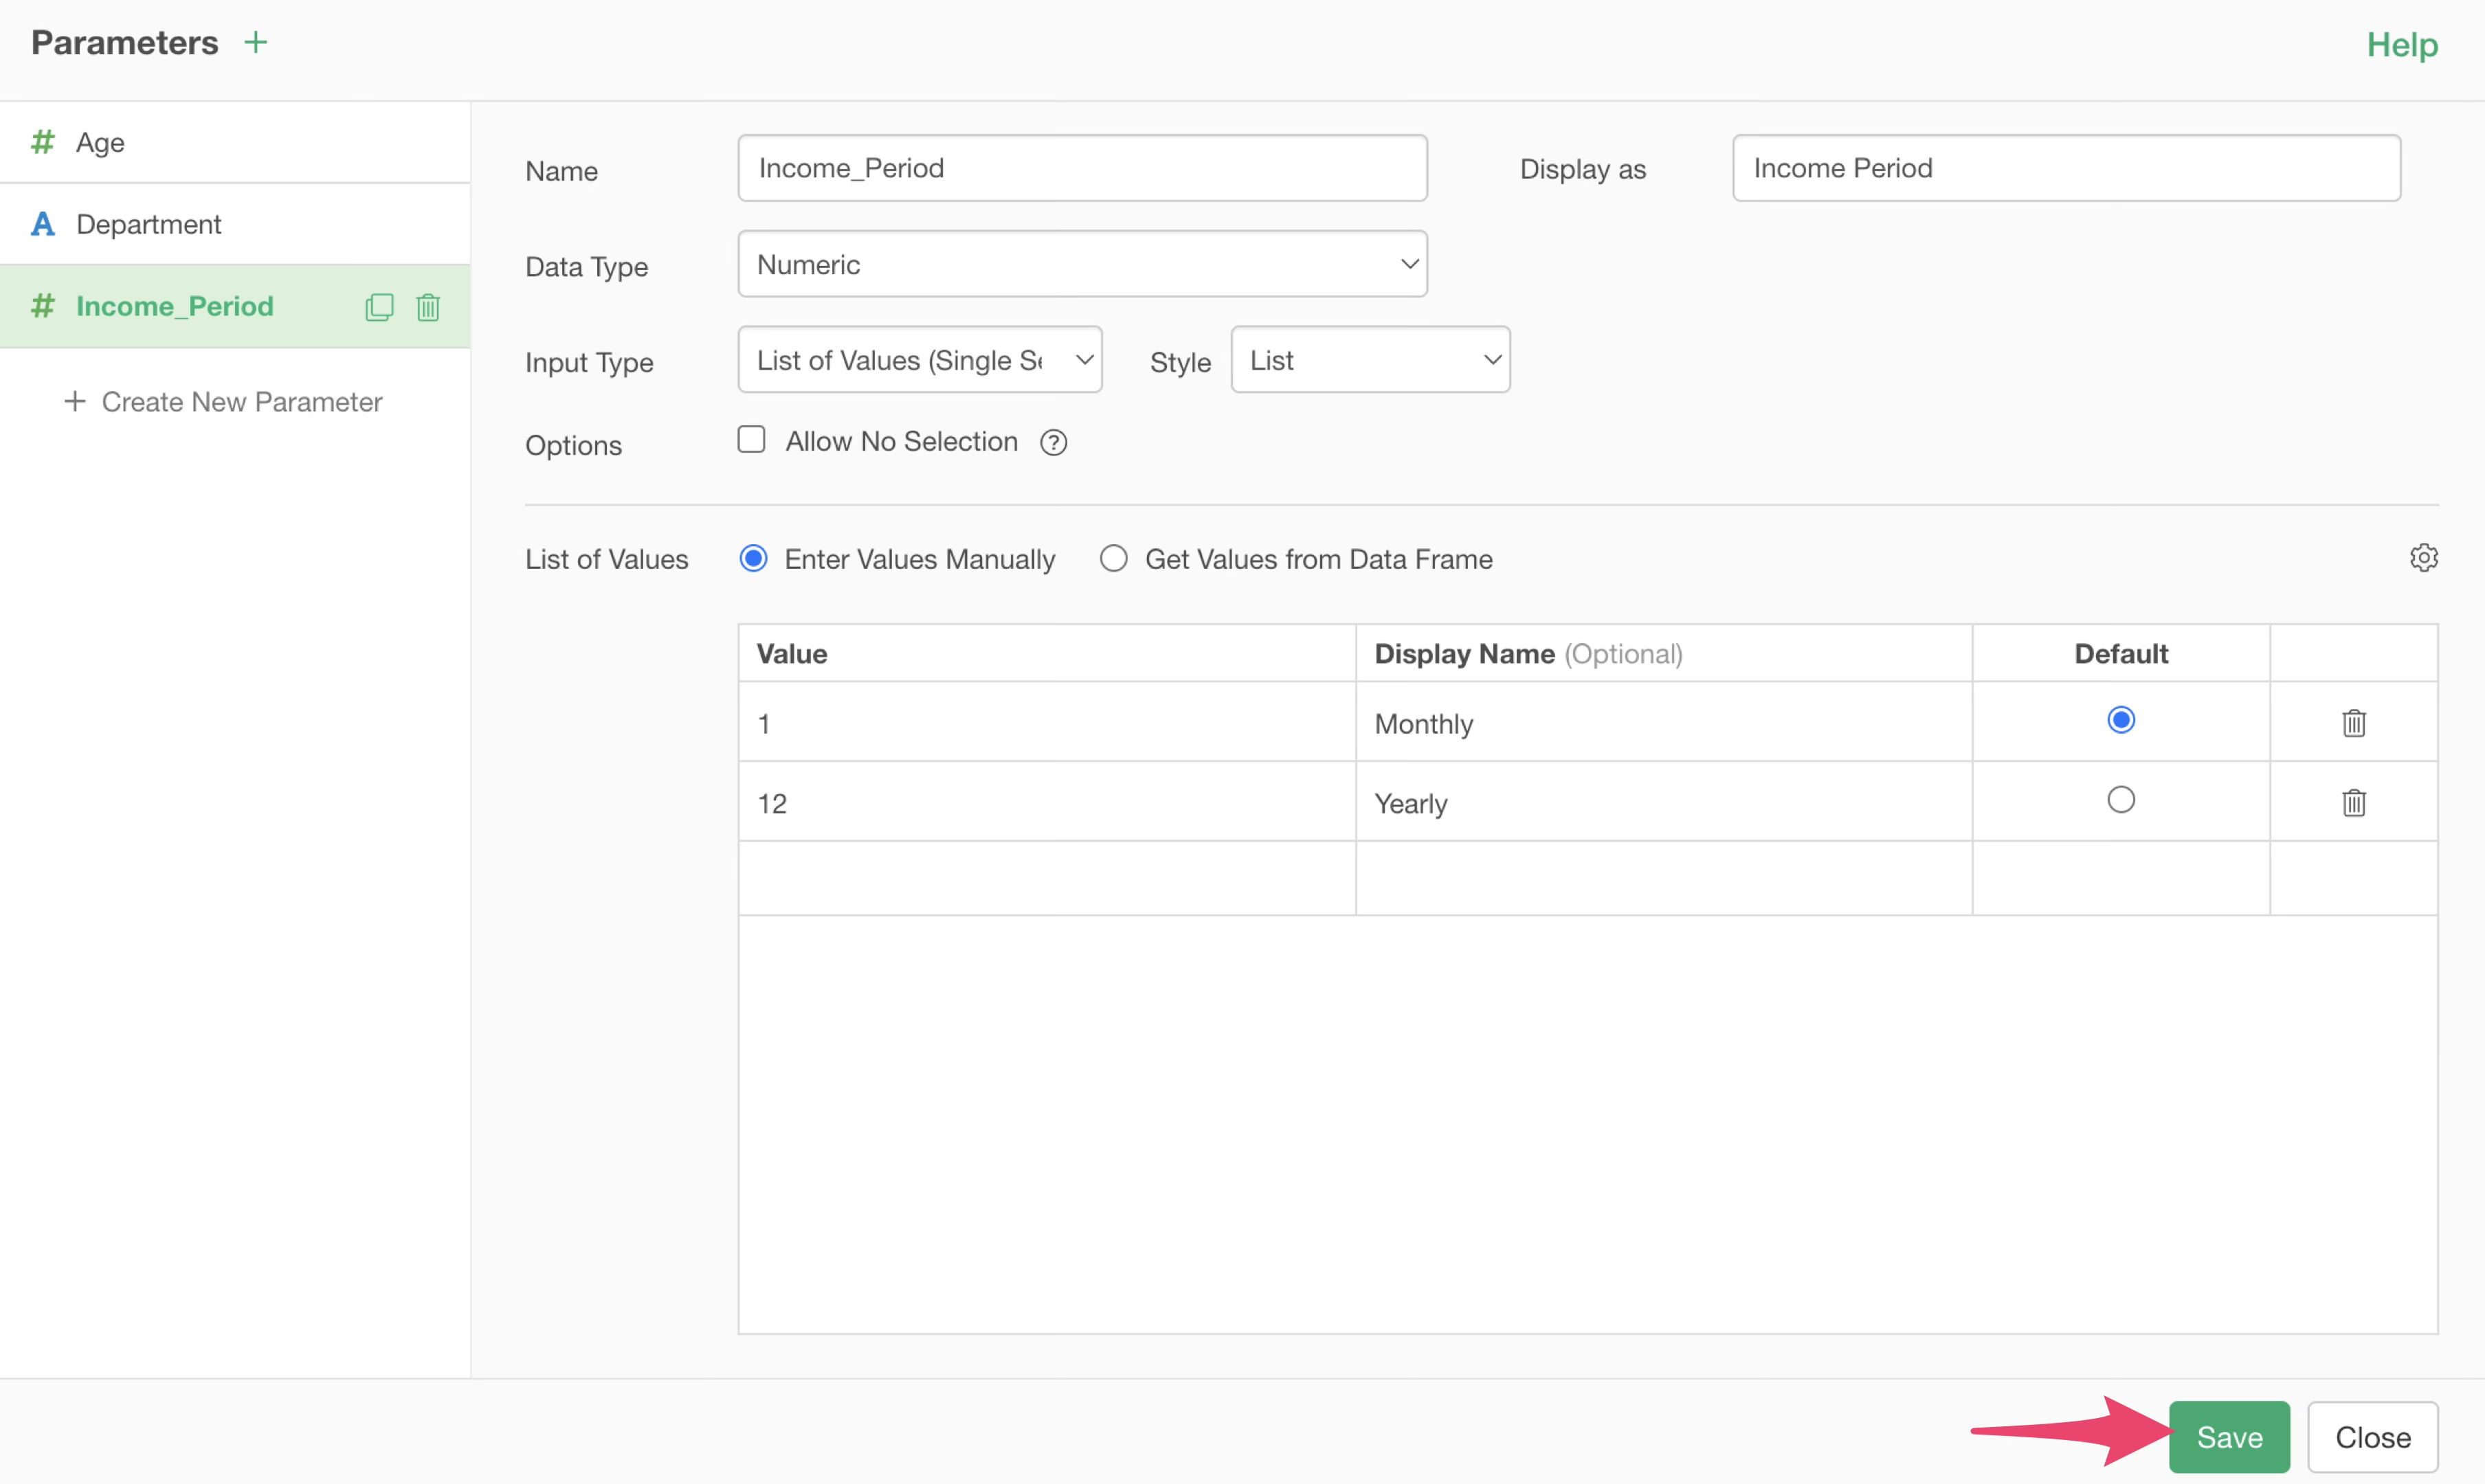
A new parameter has been created, so specify the parameter name.
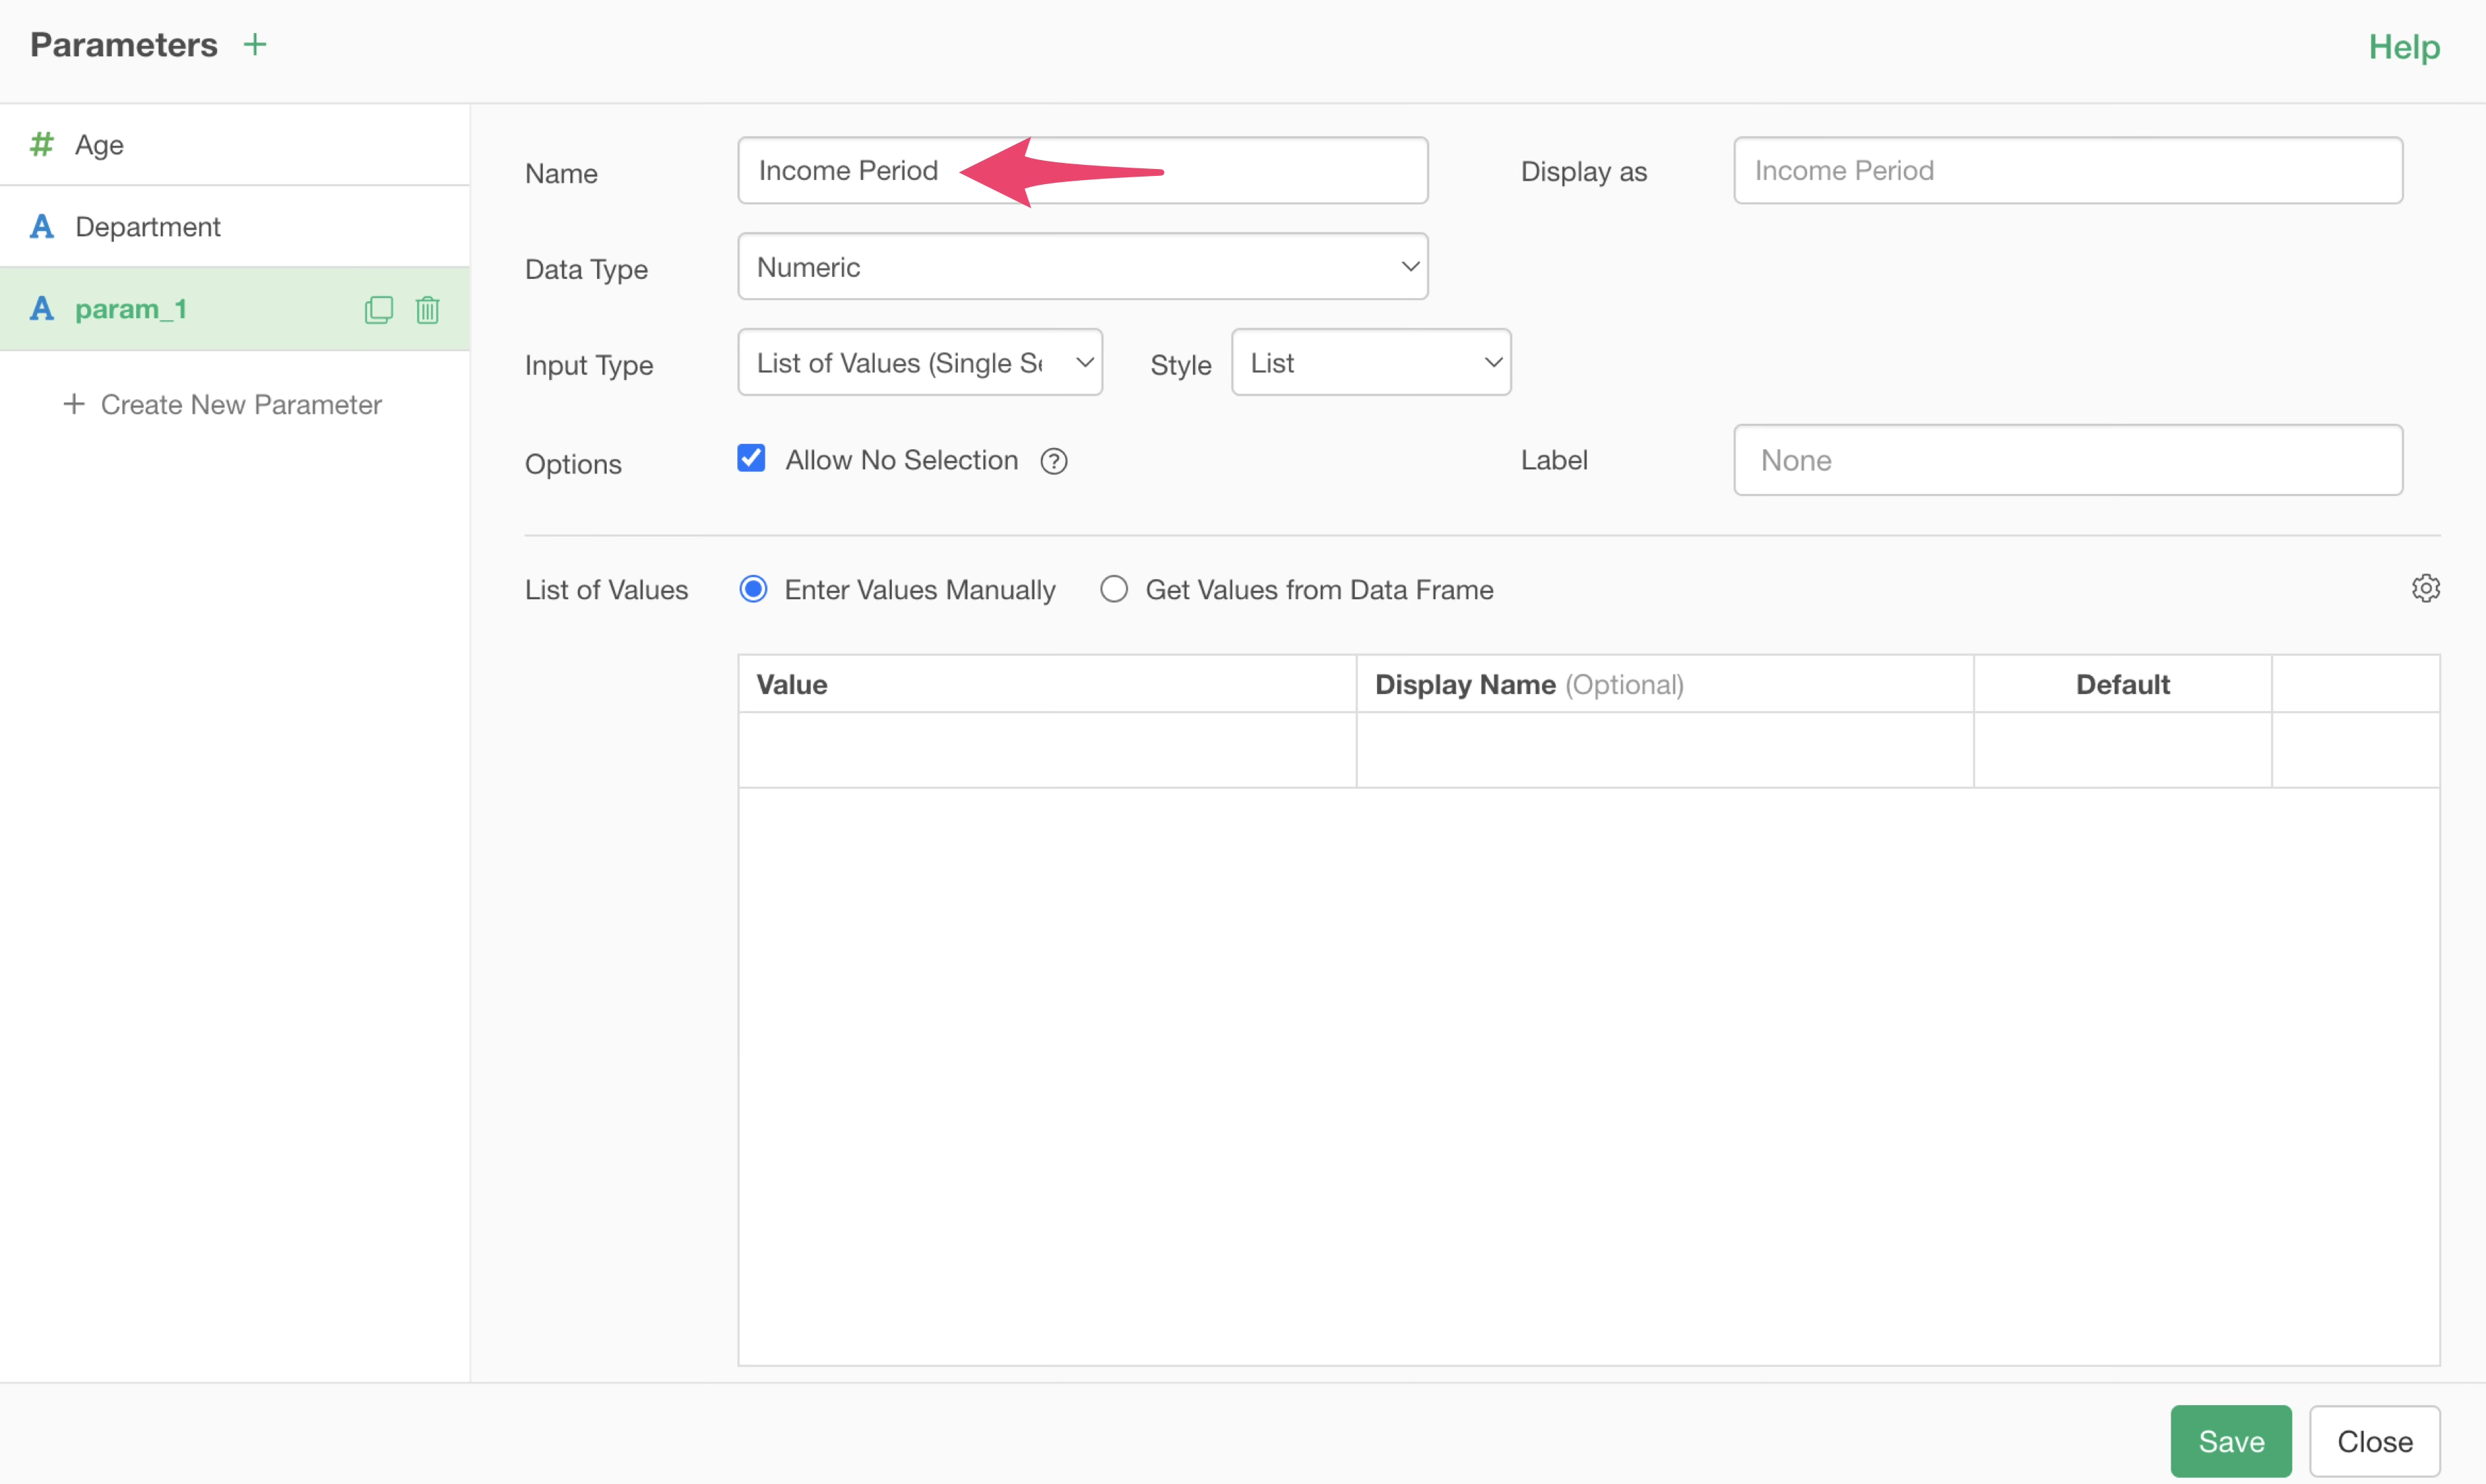
Again, note that spaces are not allowed in parameter names. If you want to use spaces or another language for display, you can specify a label in “Display As”.
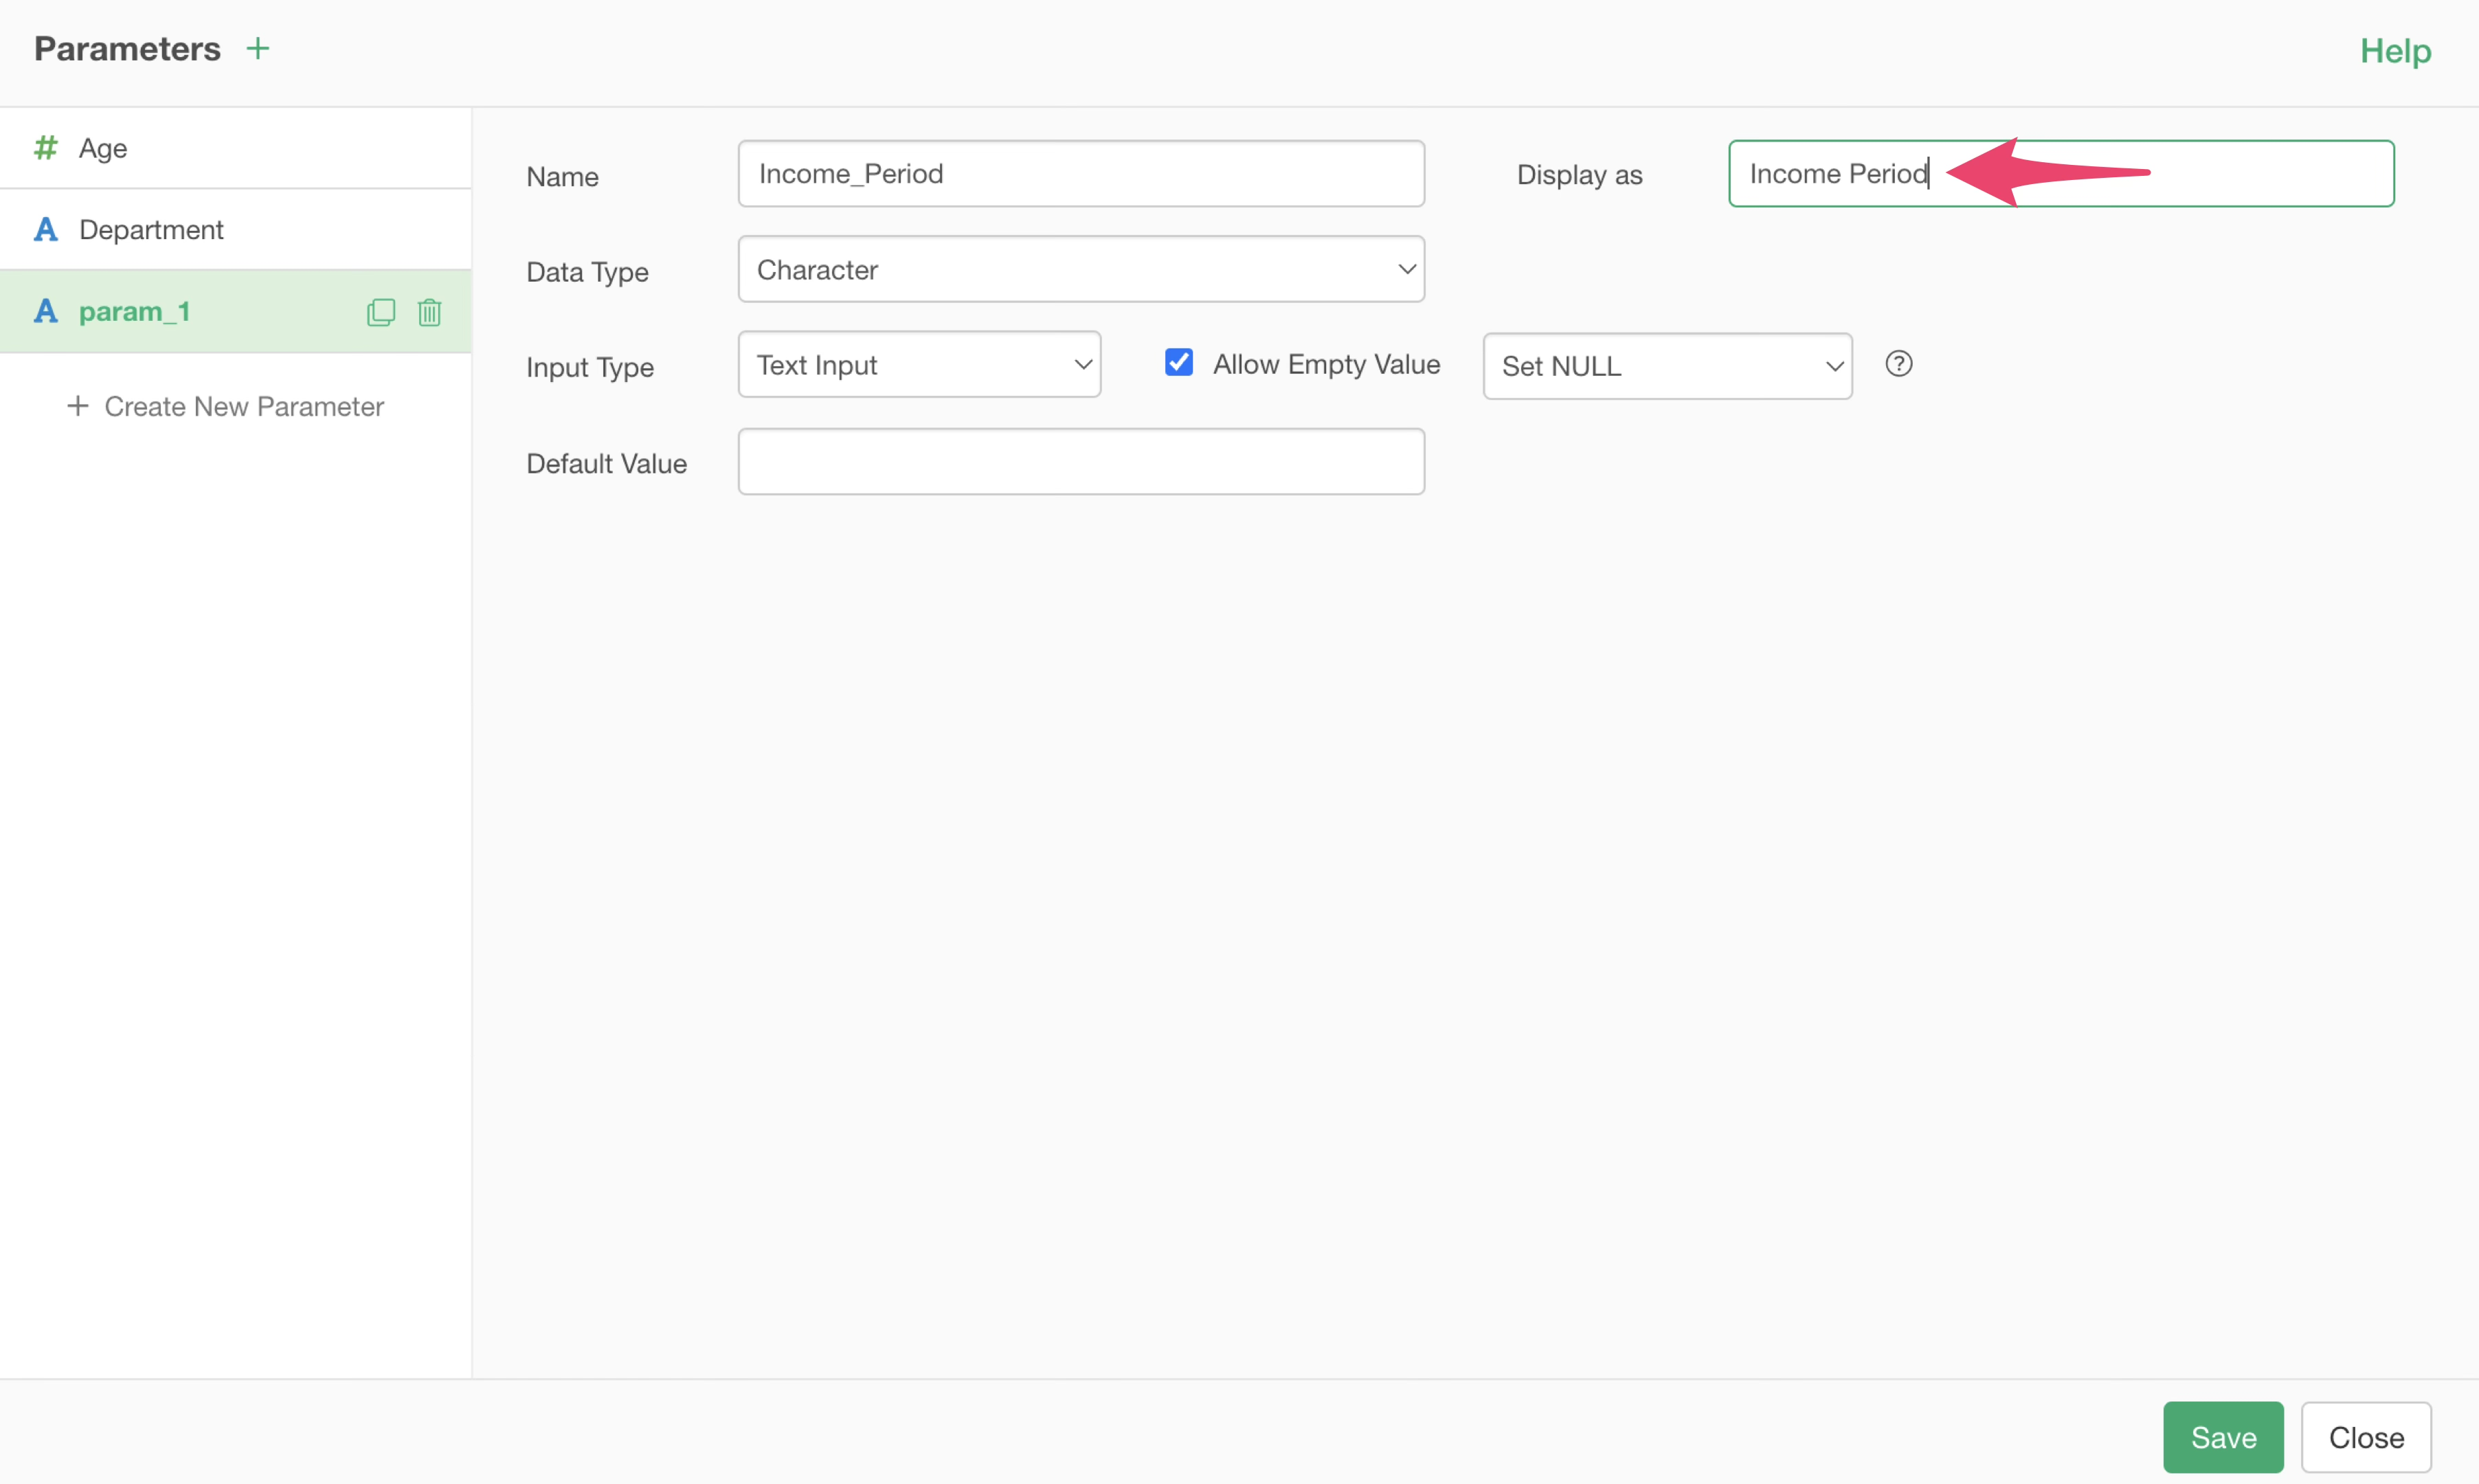
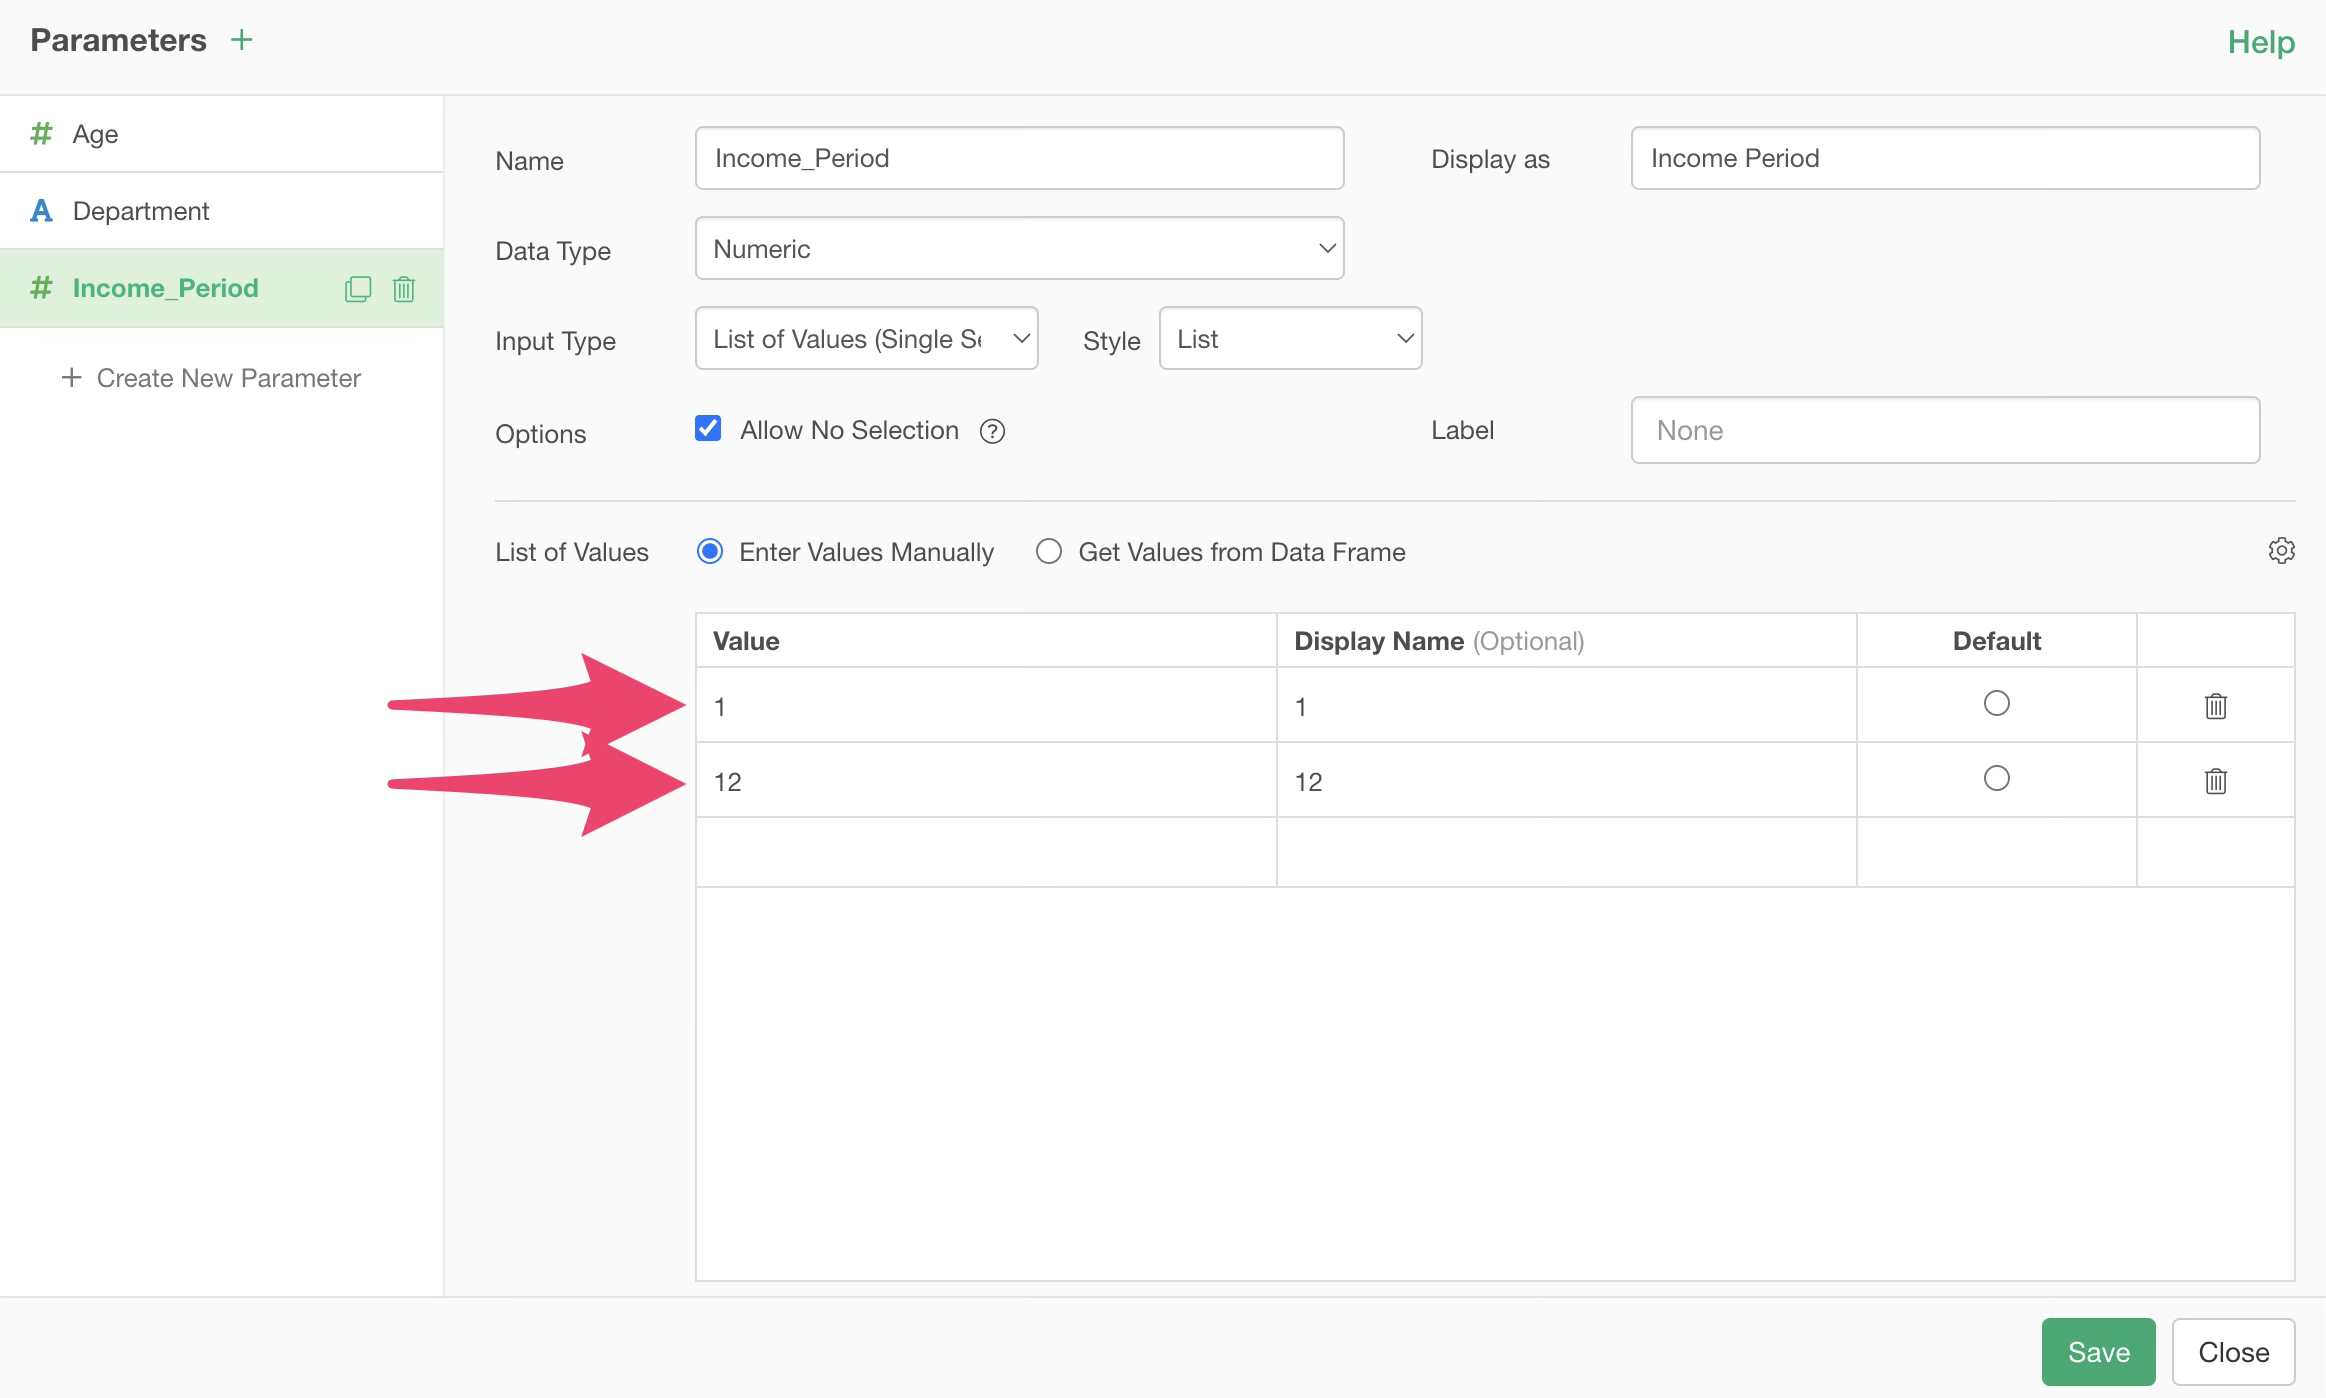
Next, set the Data Type to “Numeric” and the Input Type to “List of Values (Single Select)”.
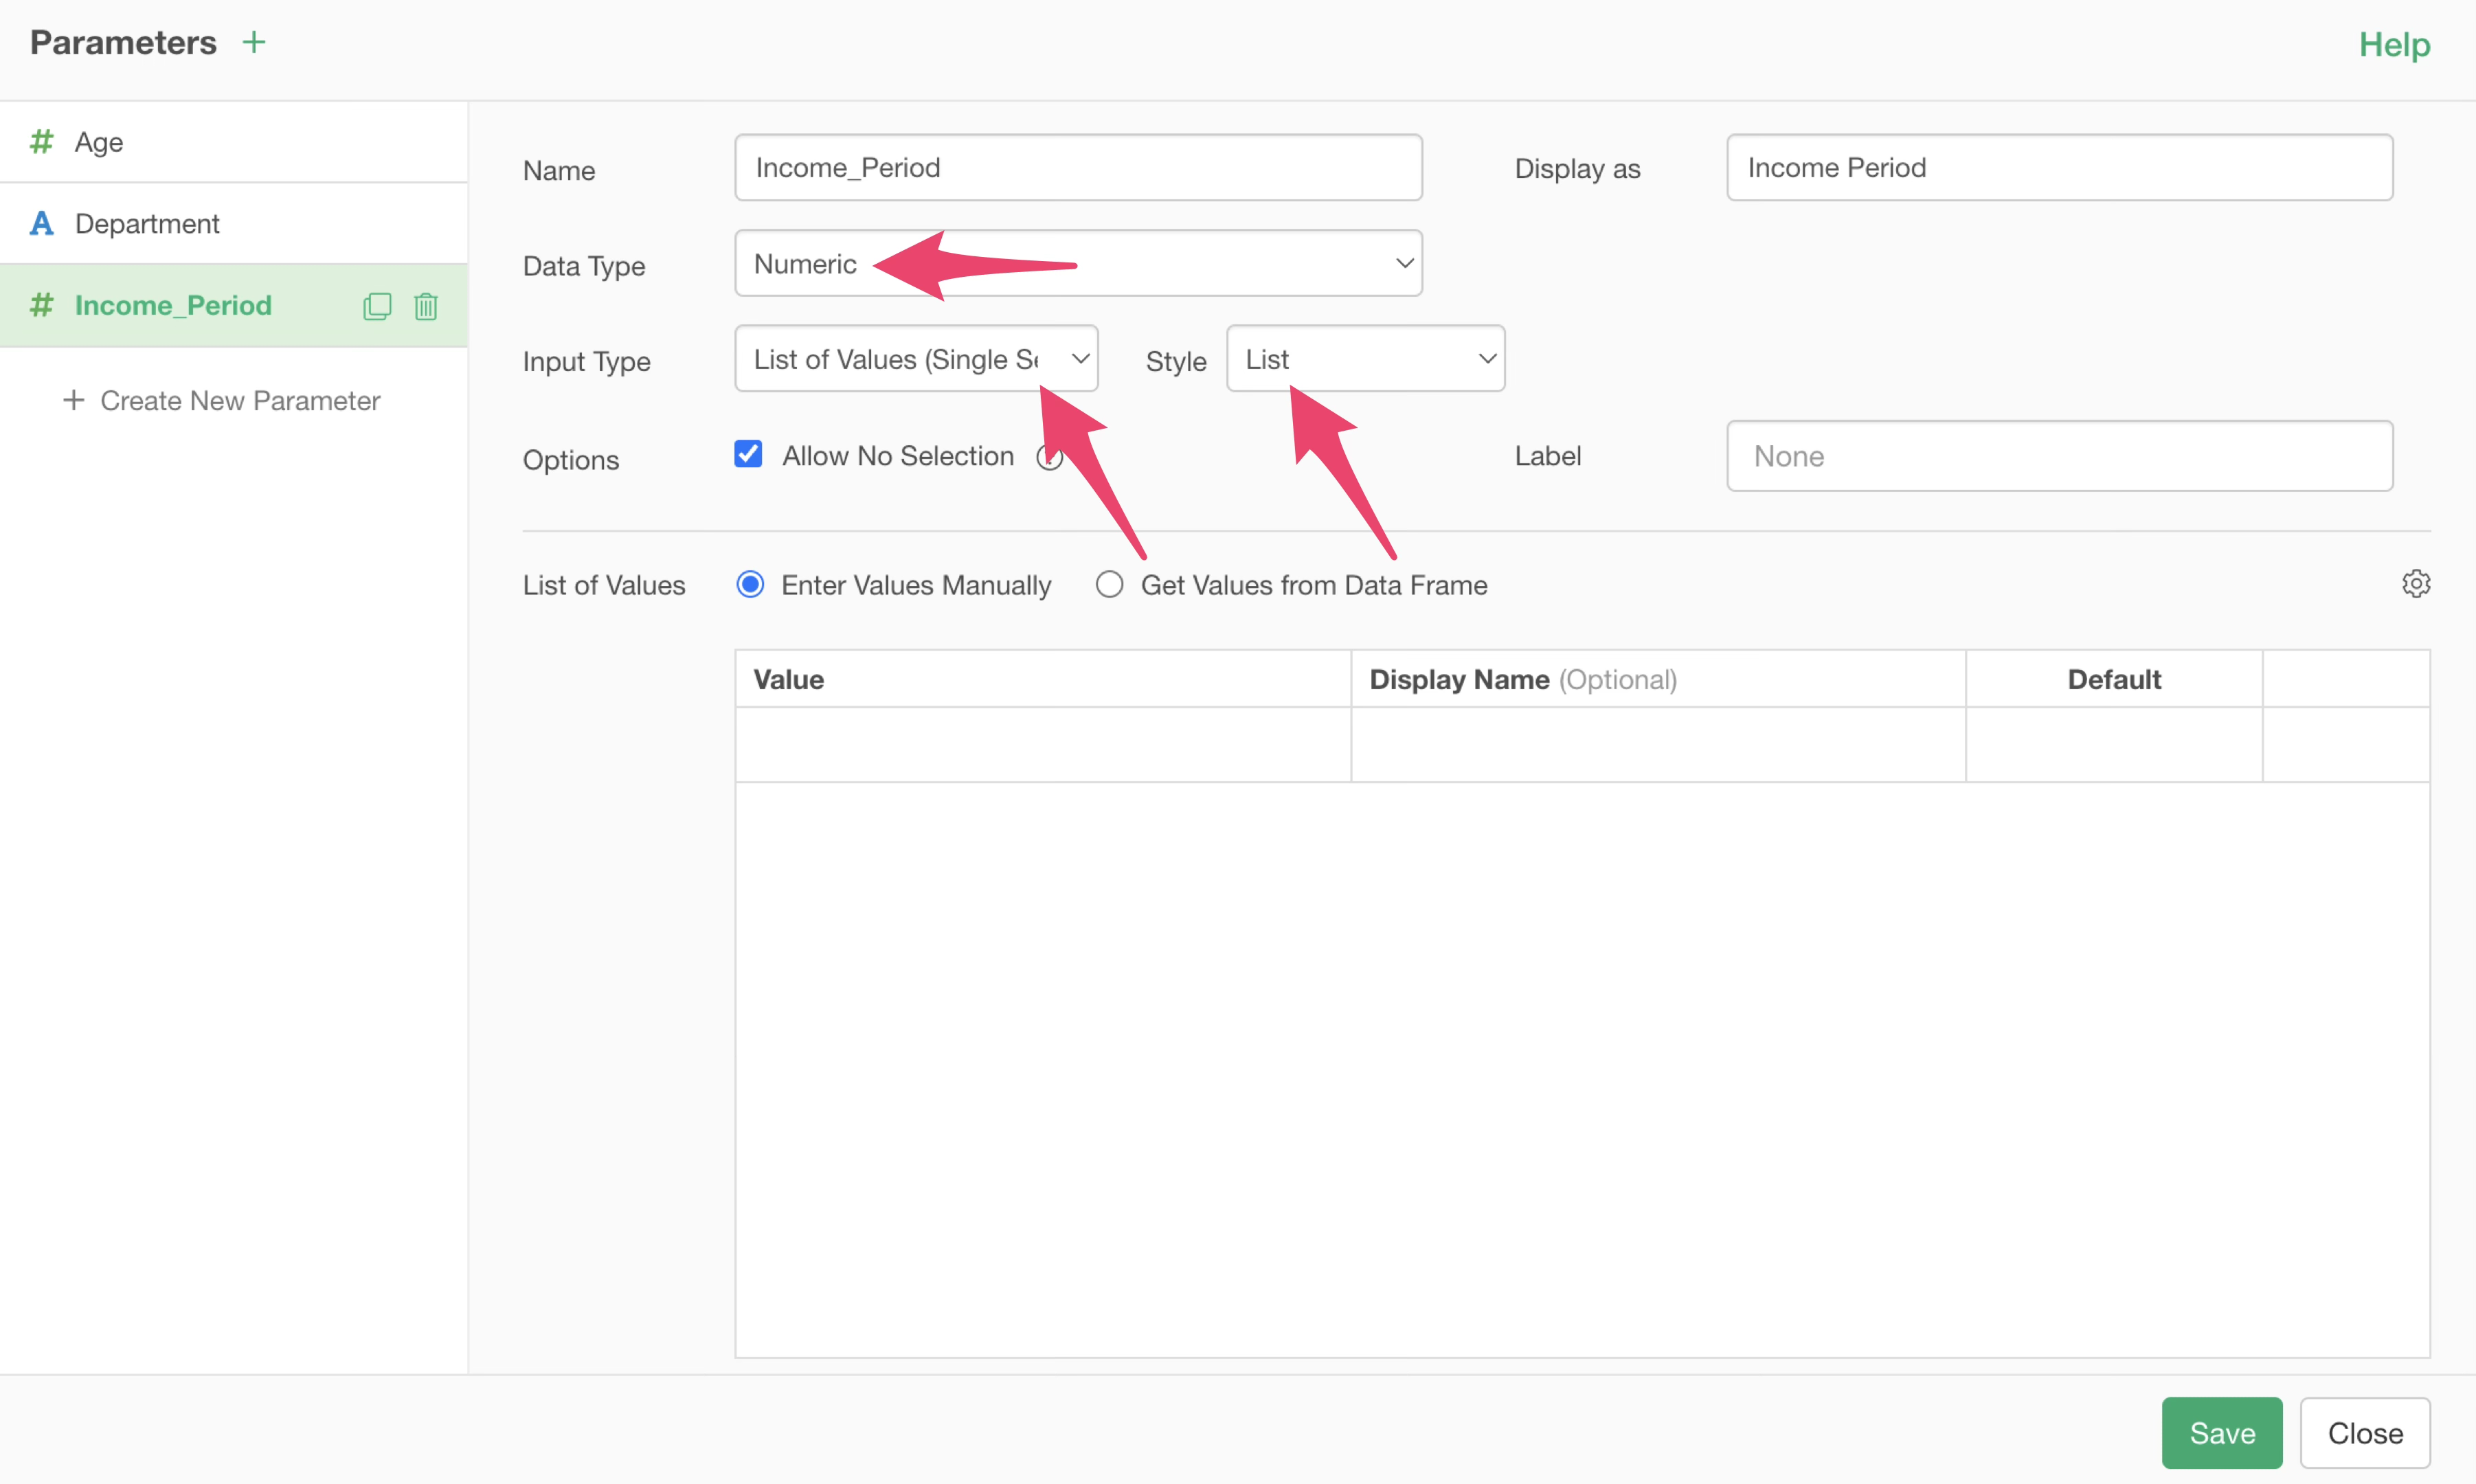
Check Enter Values Manually and type 1 and 12 into the values table.
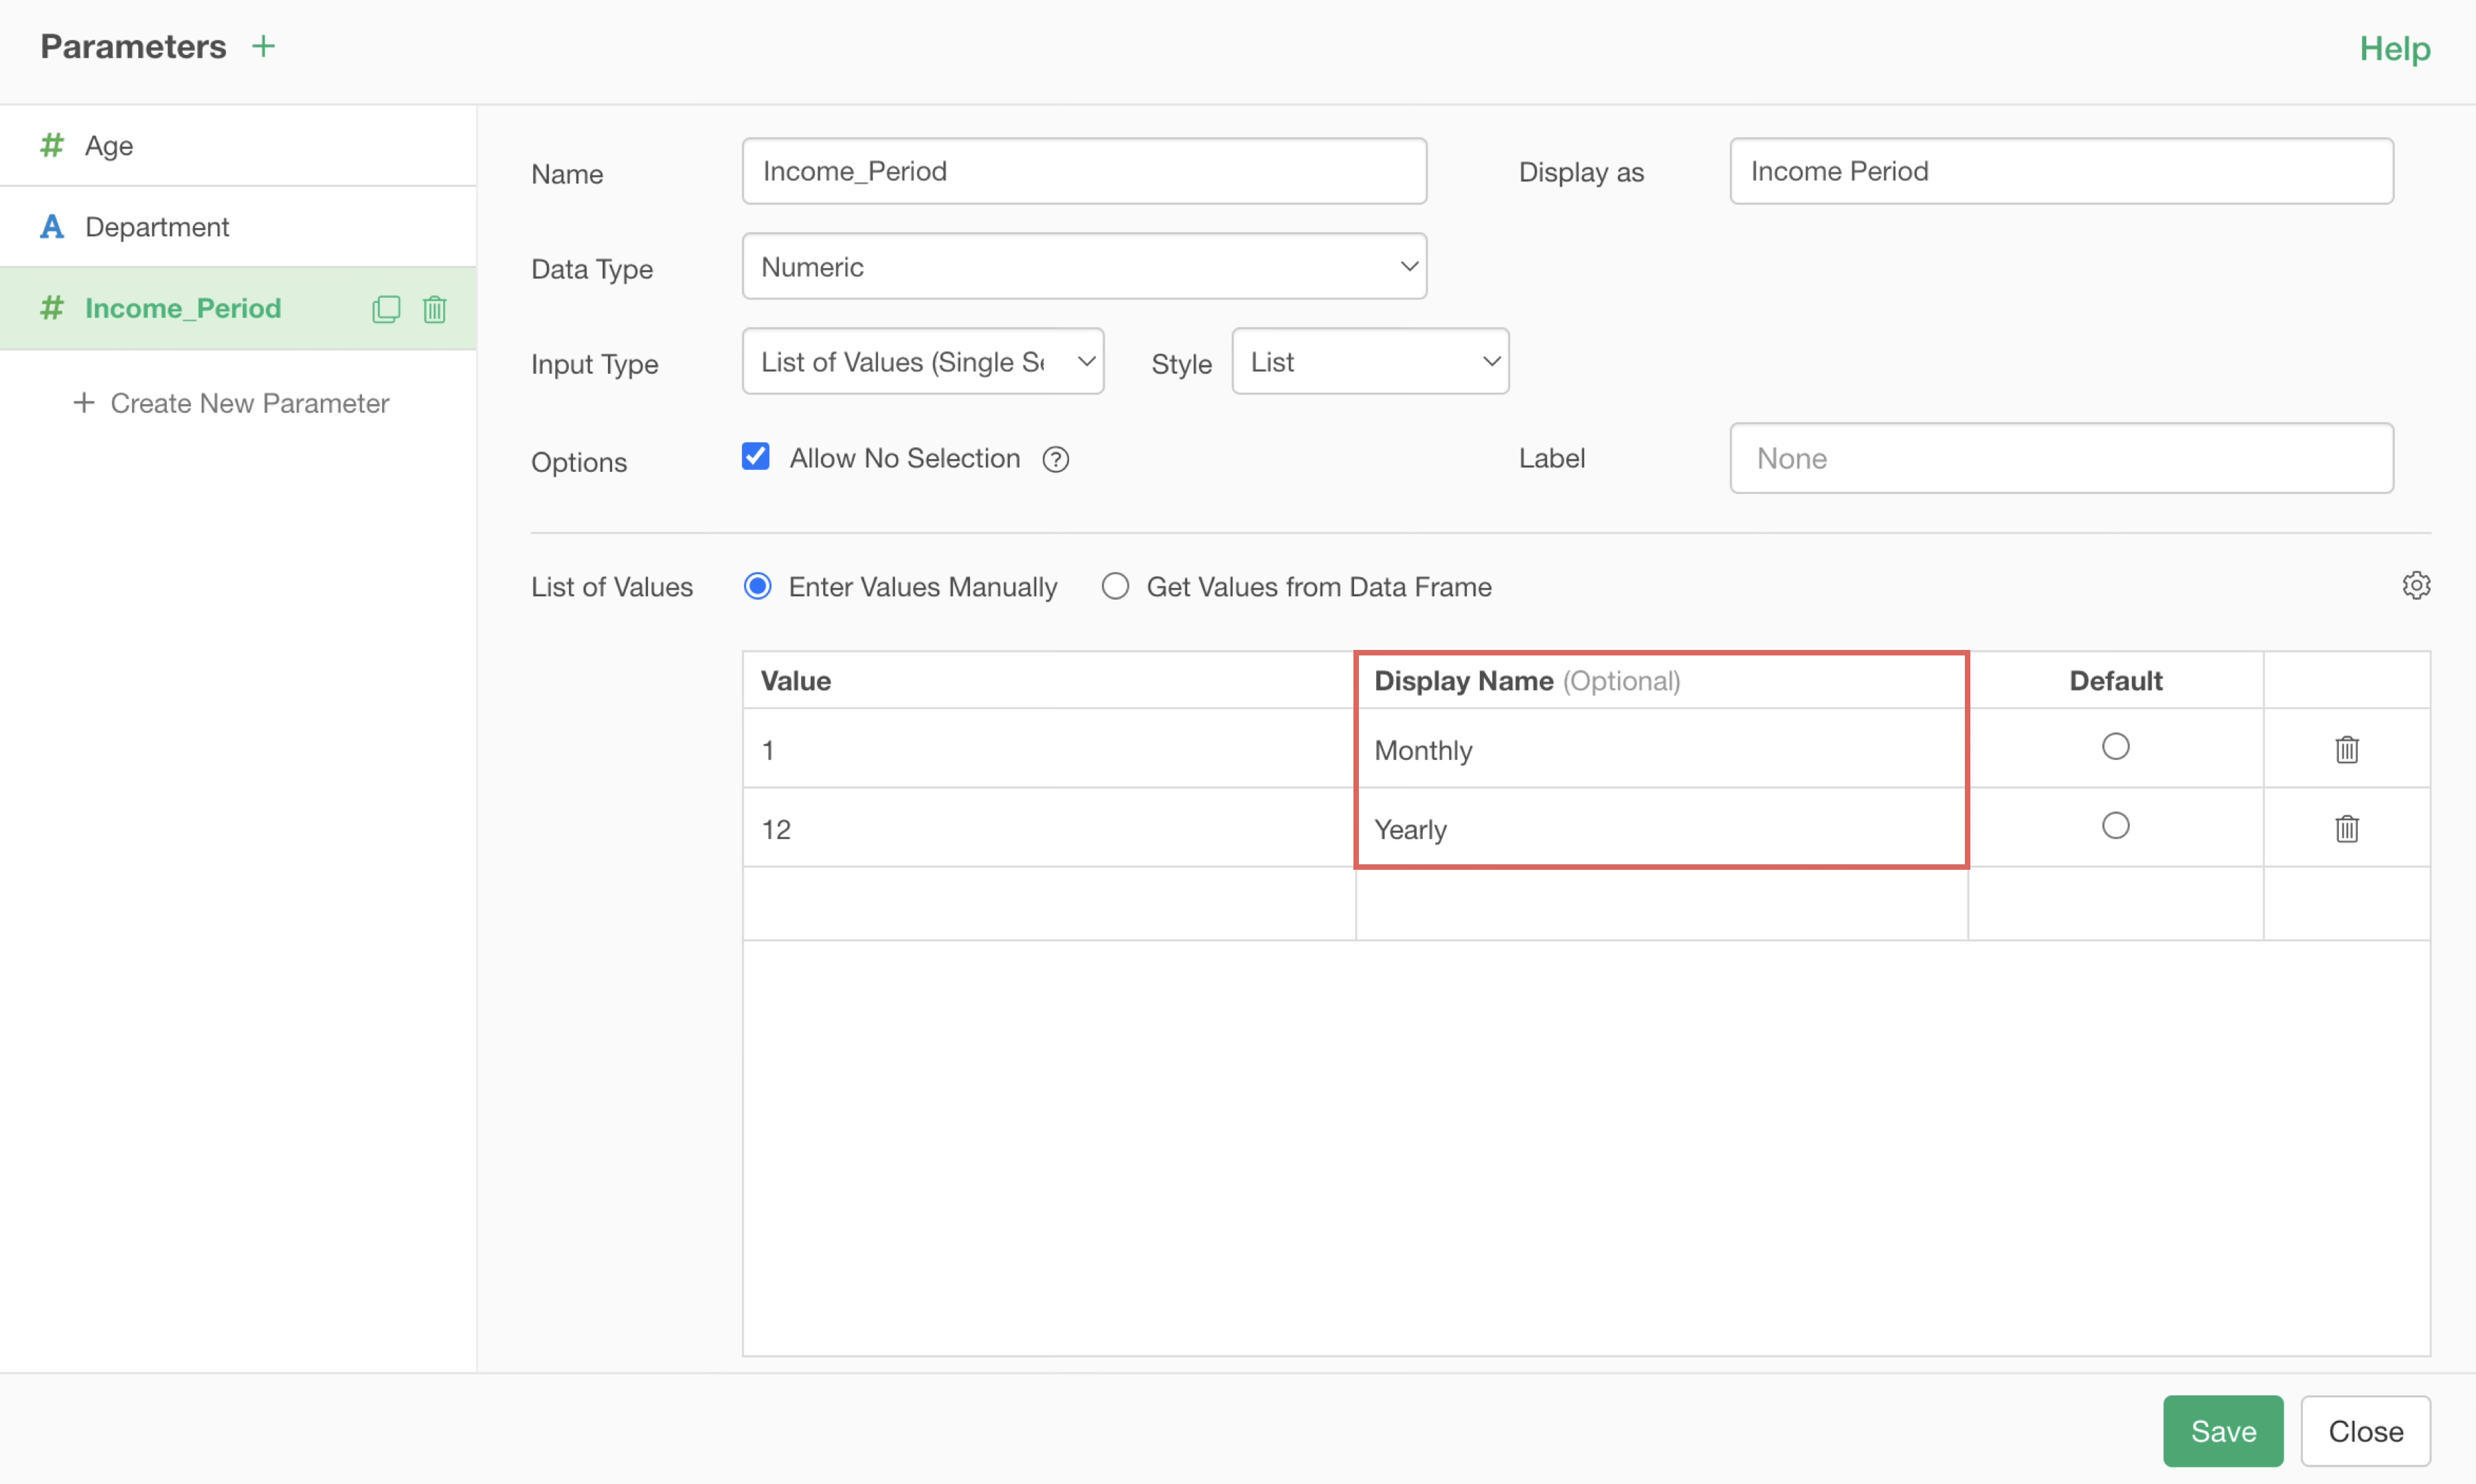
You can also assign display names to these values. For example, set the display name to “Monthly” when the value is 1, and to “Yearly” when the value is 12.
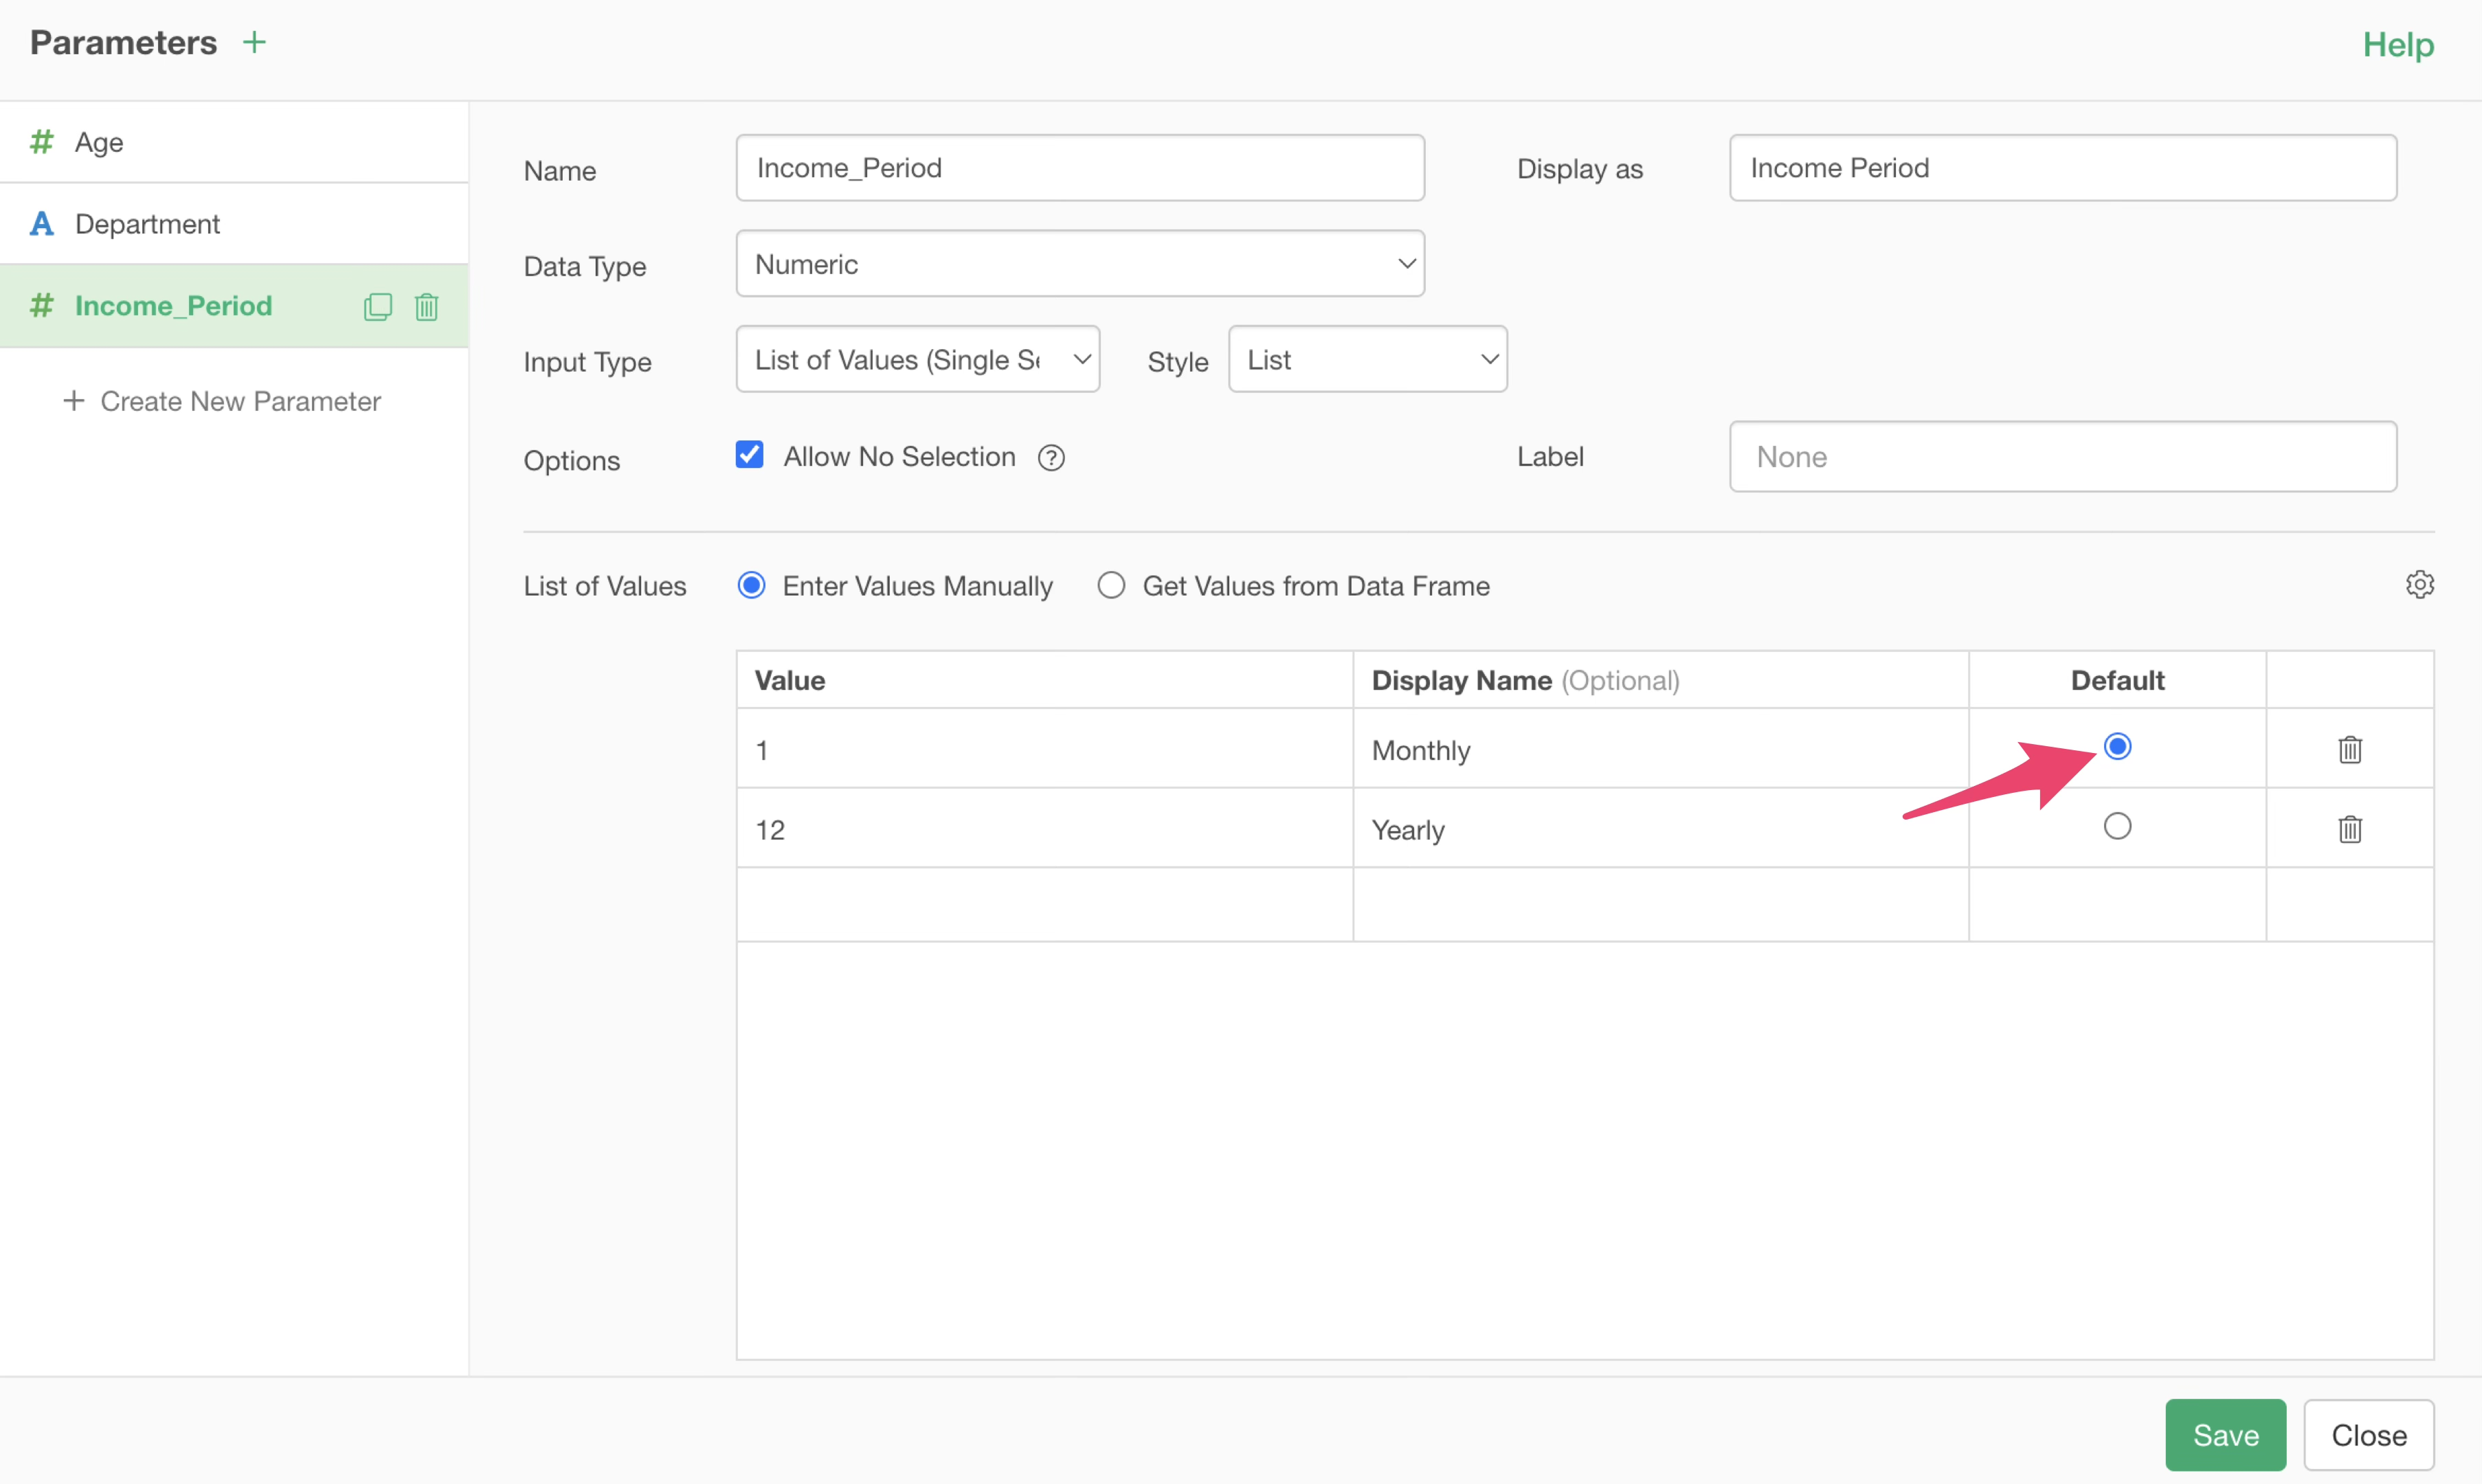
Since we want the set the Income column to default to monthly, set 1 as the default.
Because it’s necessary to ensure that only 1 or 12 can be selected, uncheck “Allow No Selection” under Options.
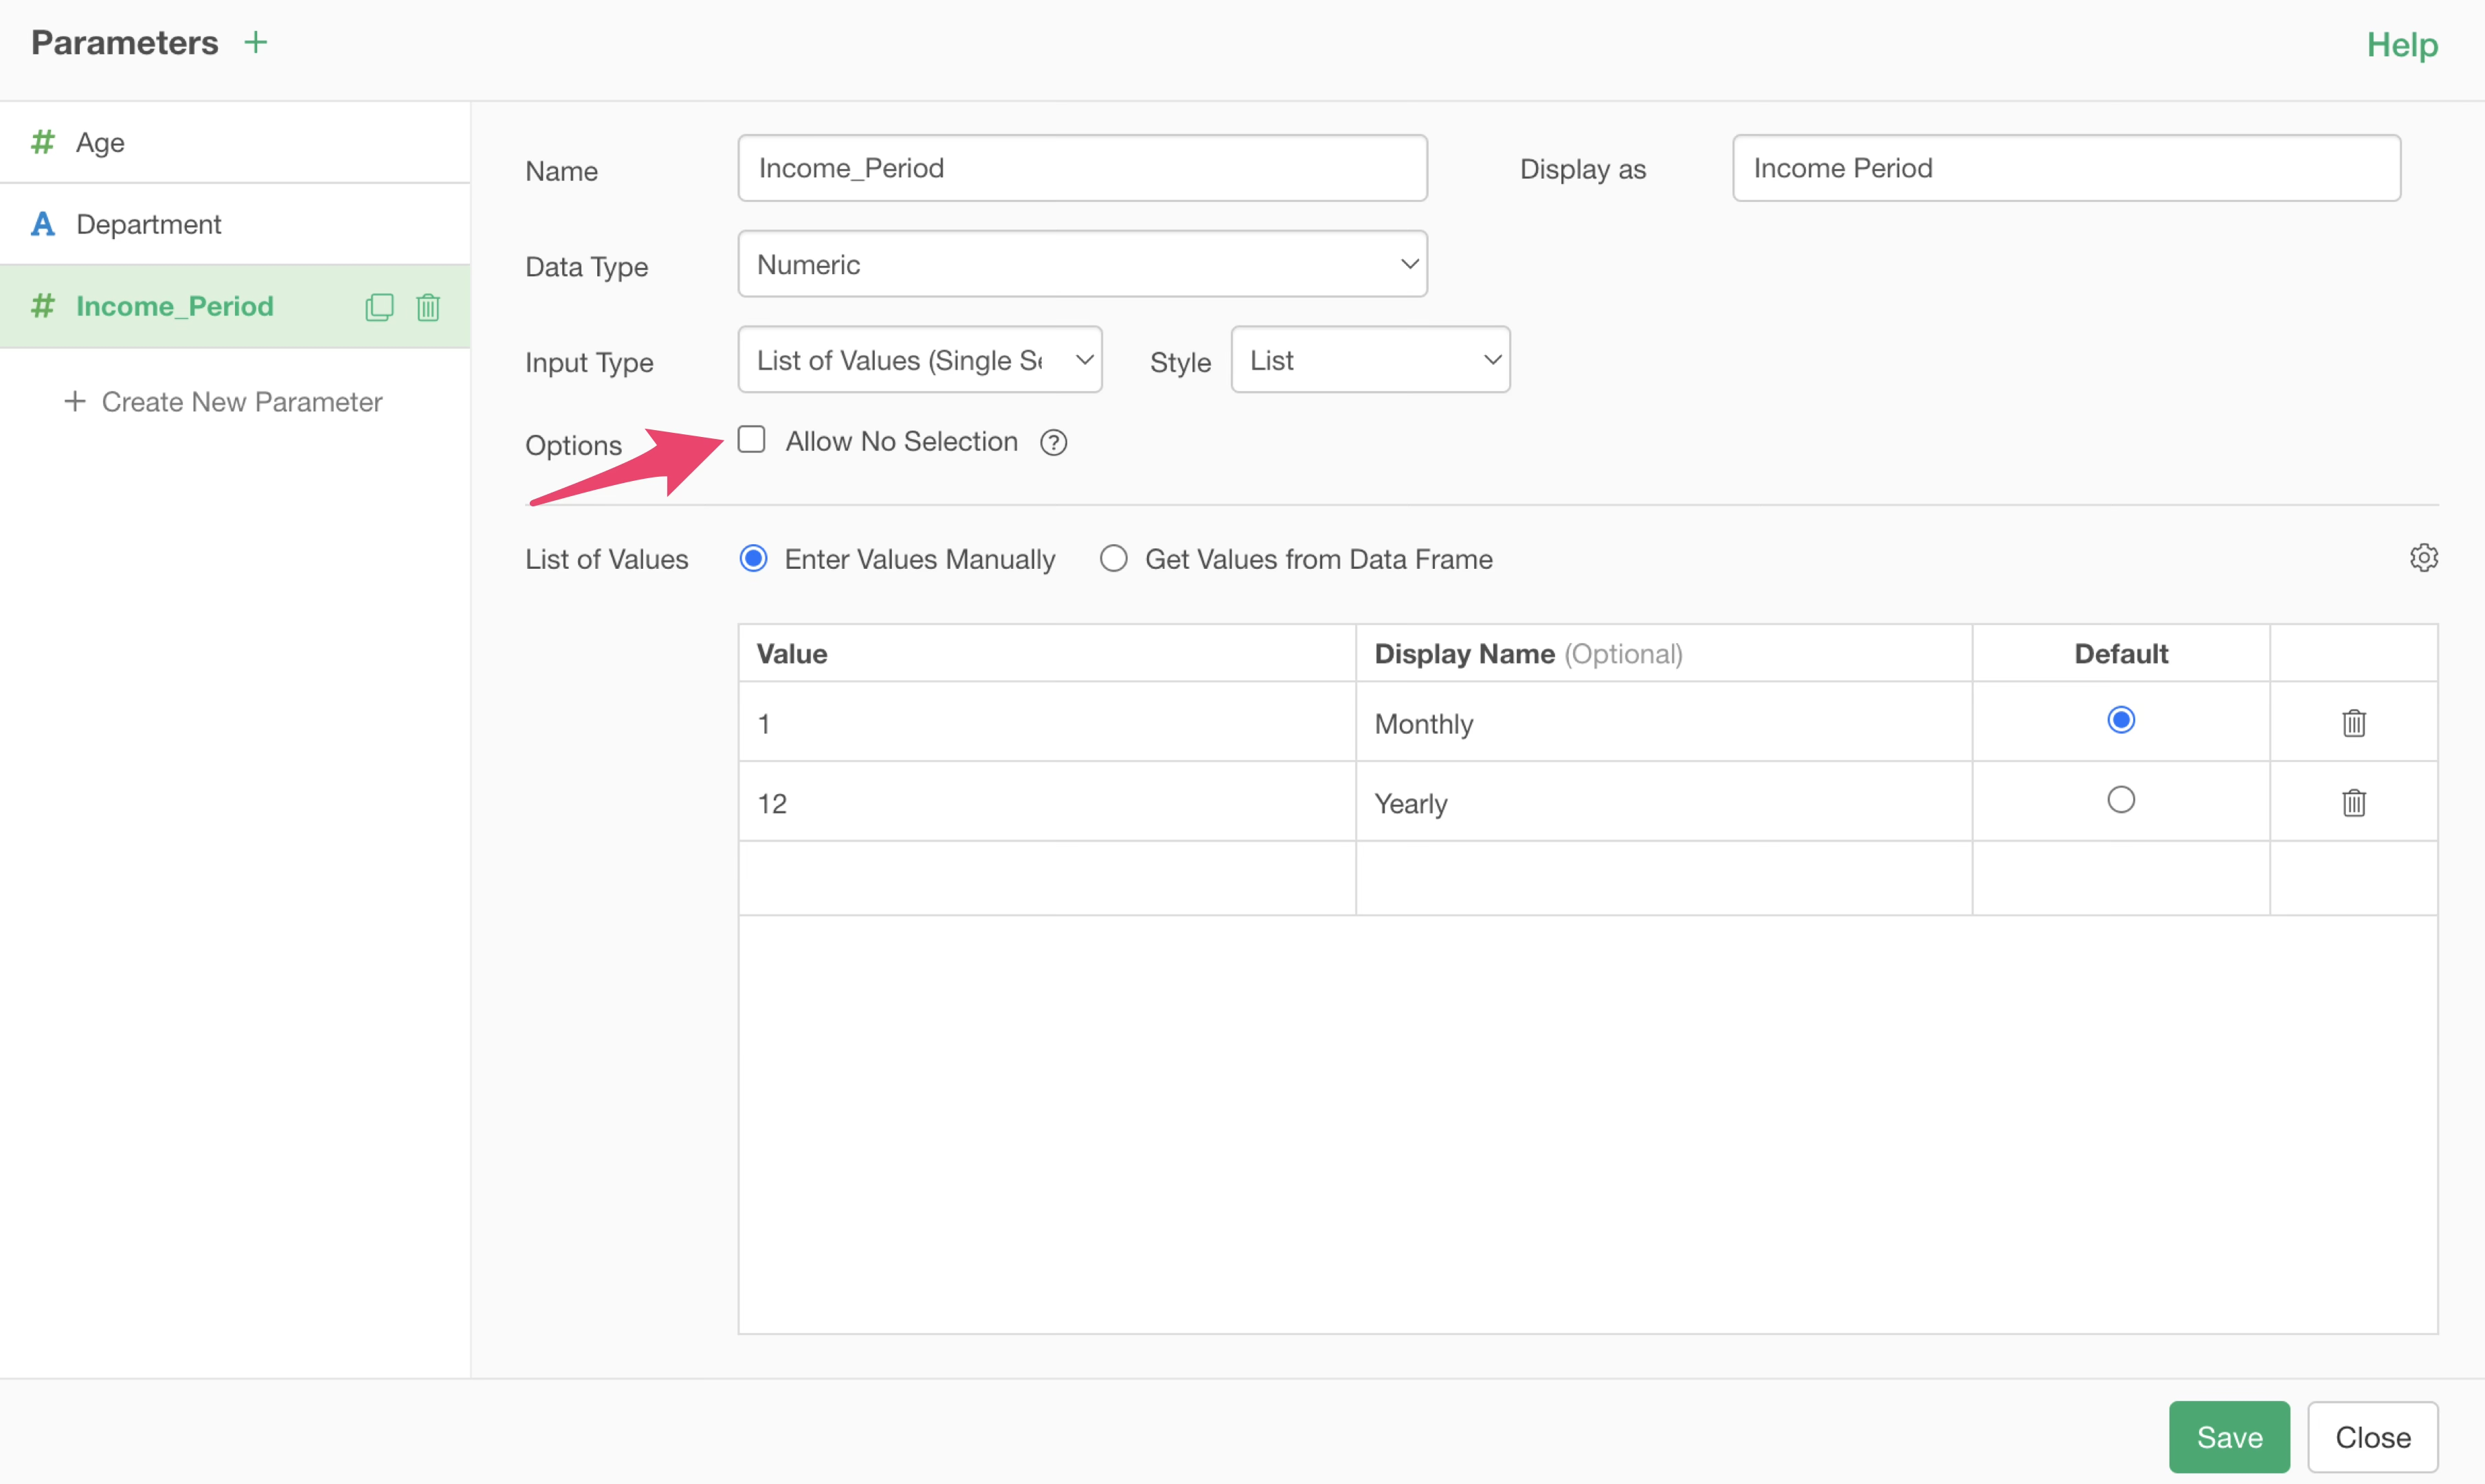
Once the parameter settings are complete, click the “Save” button.
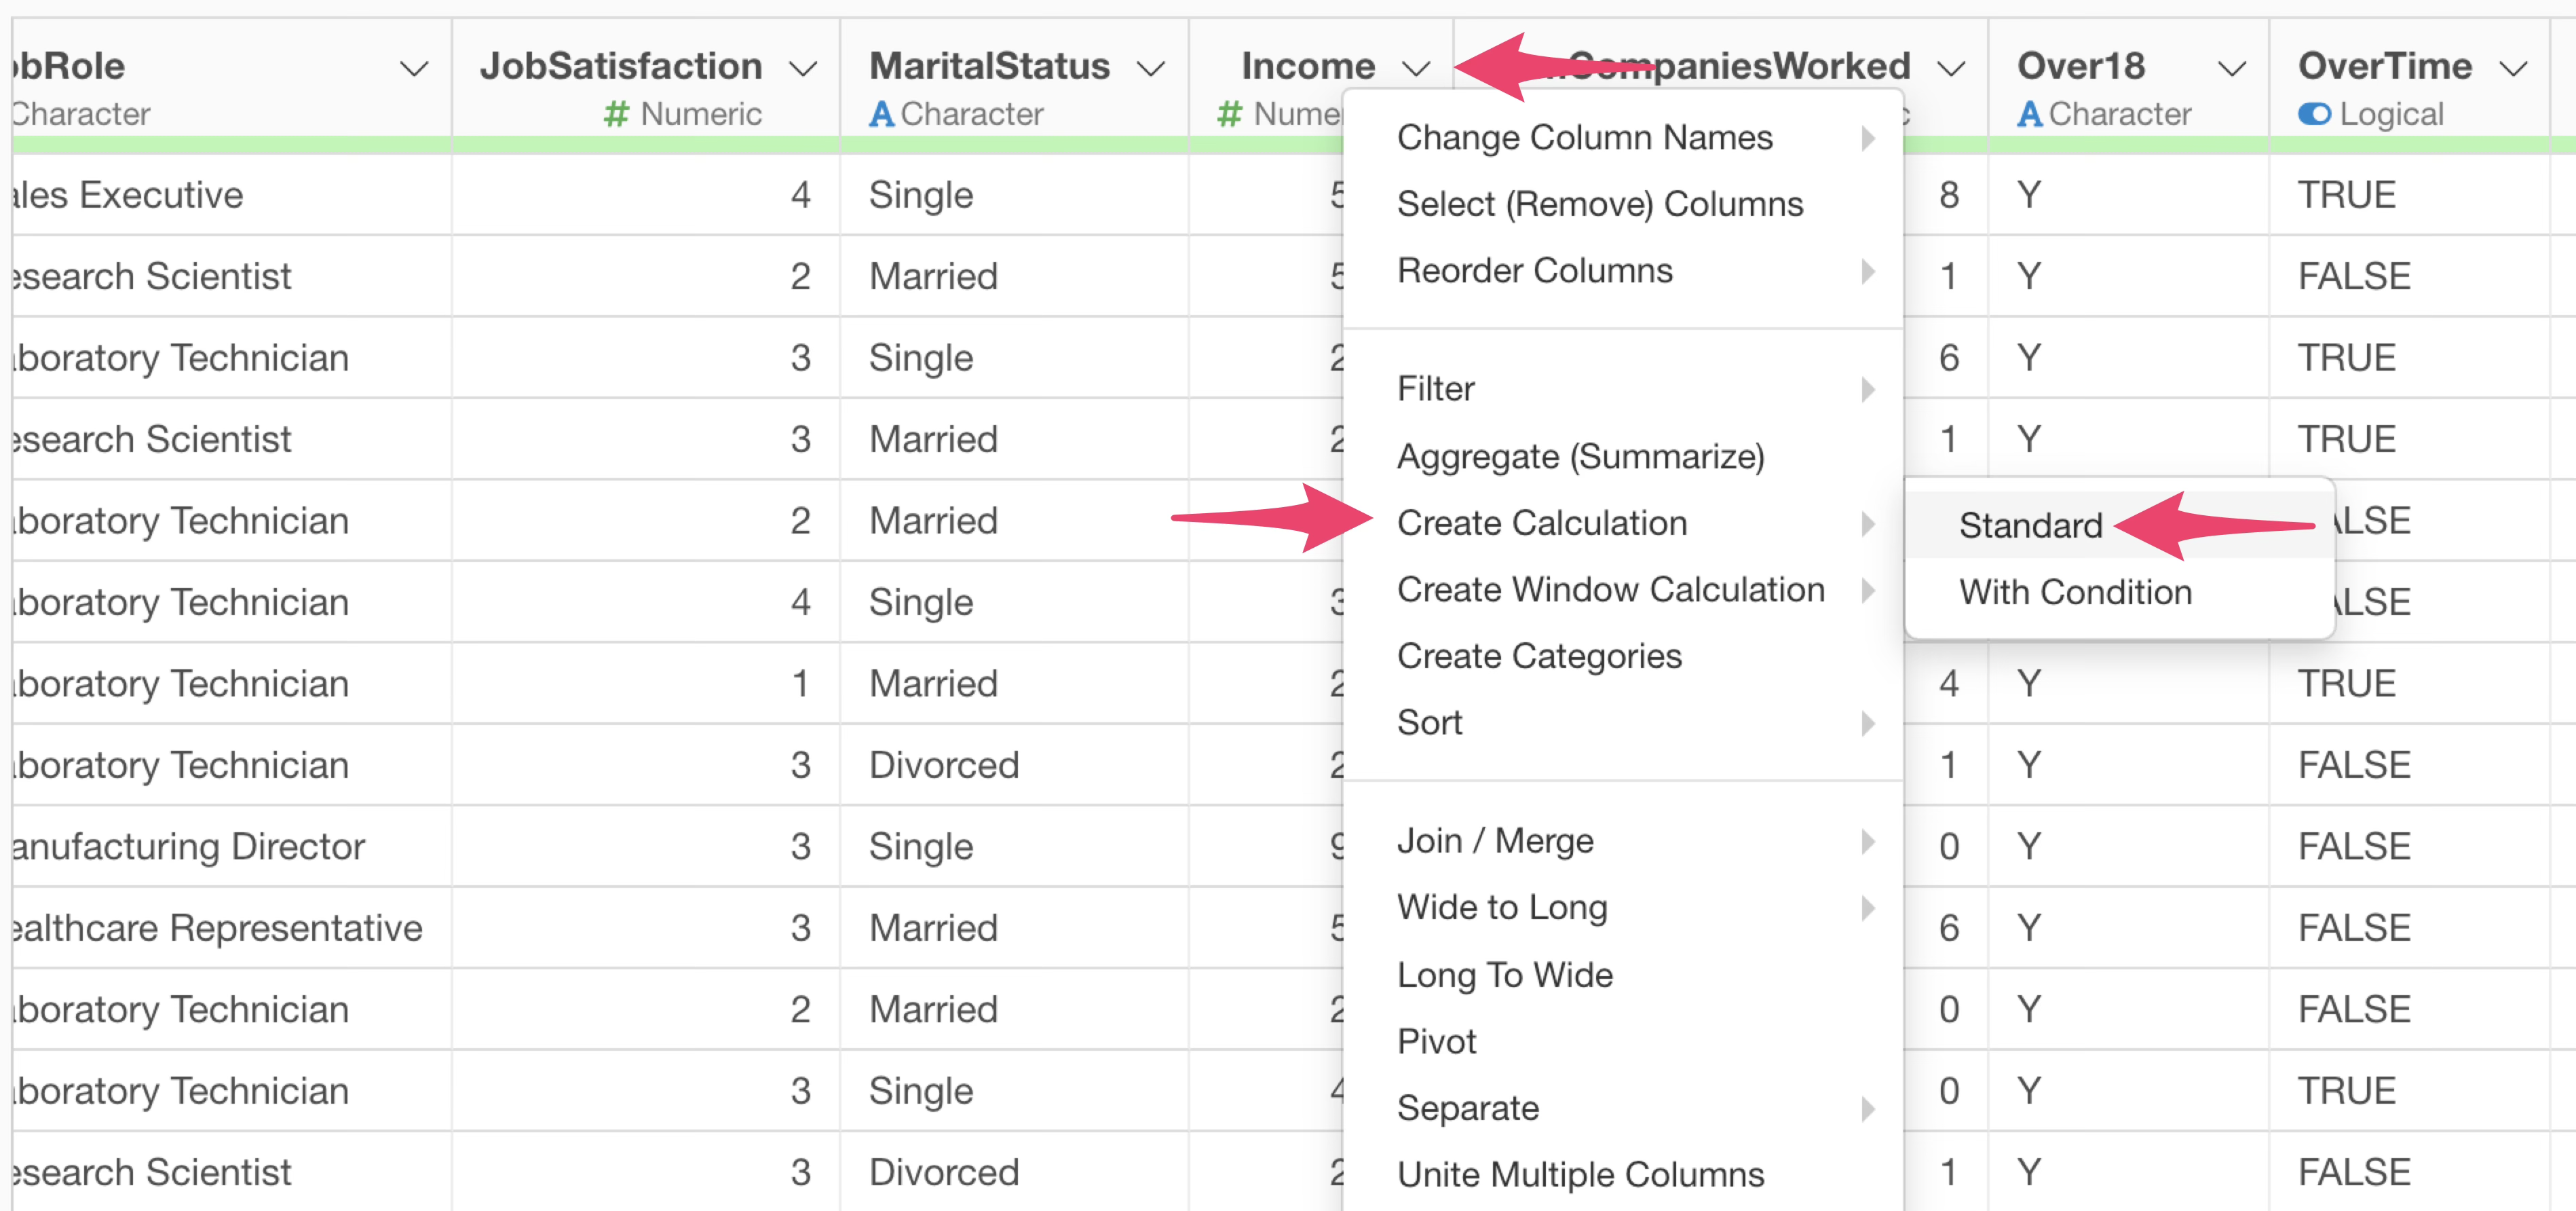
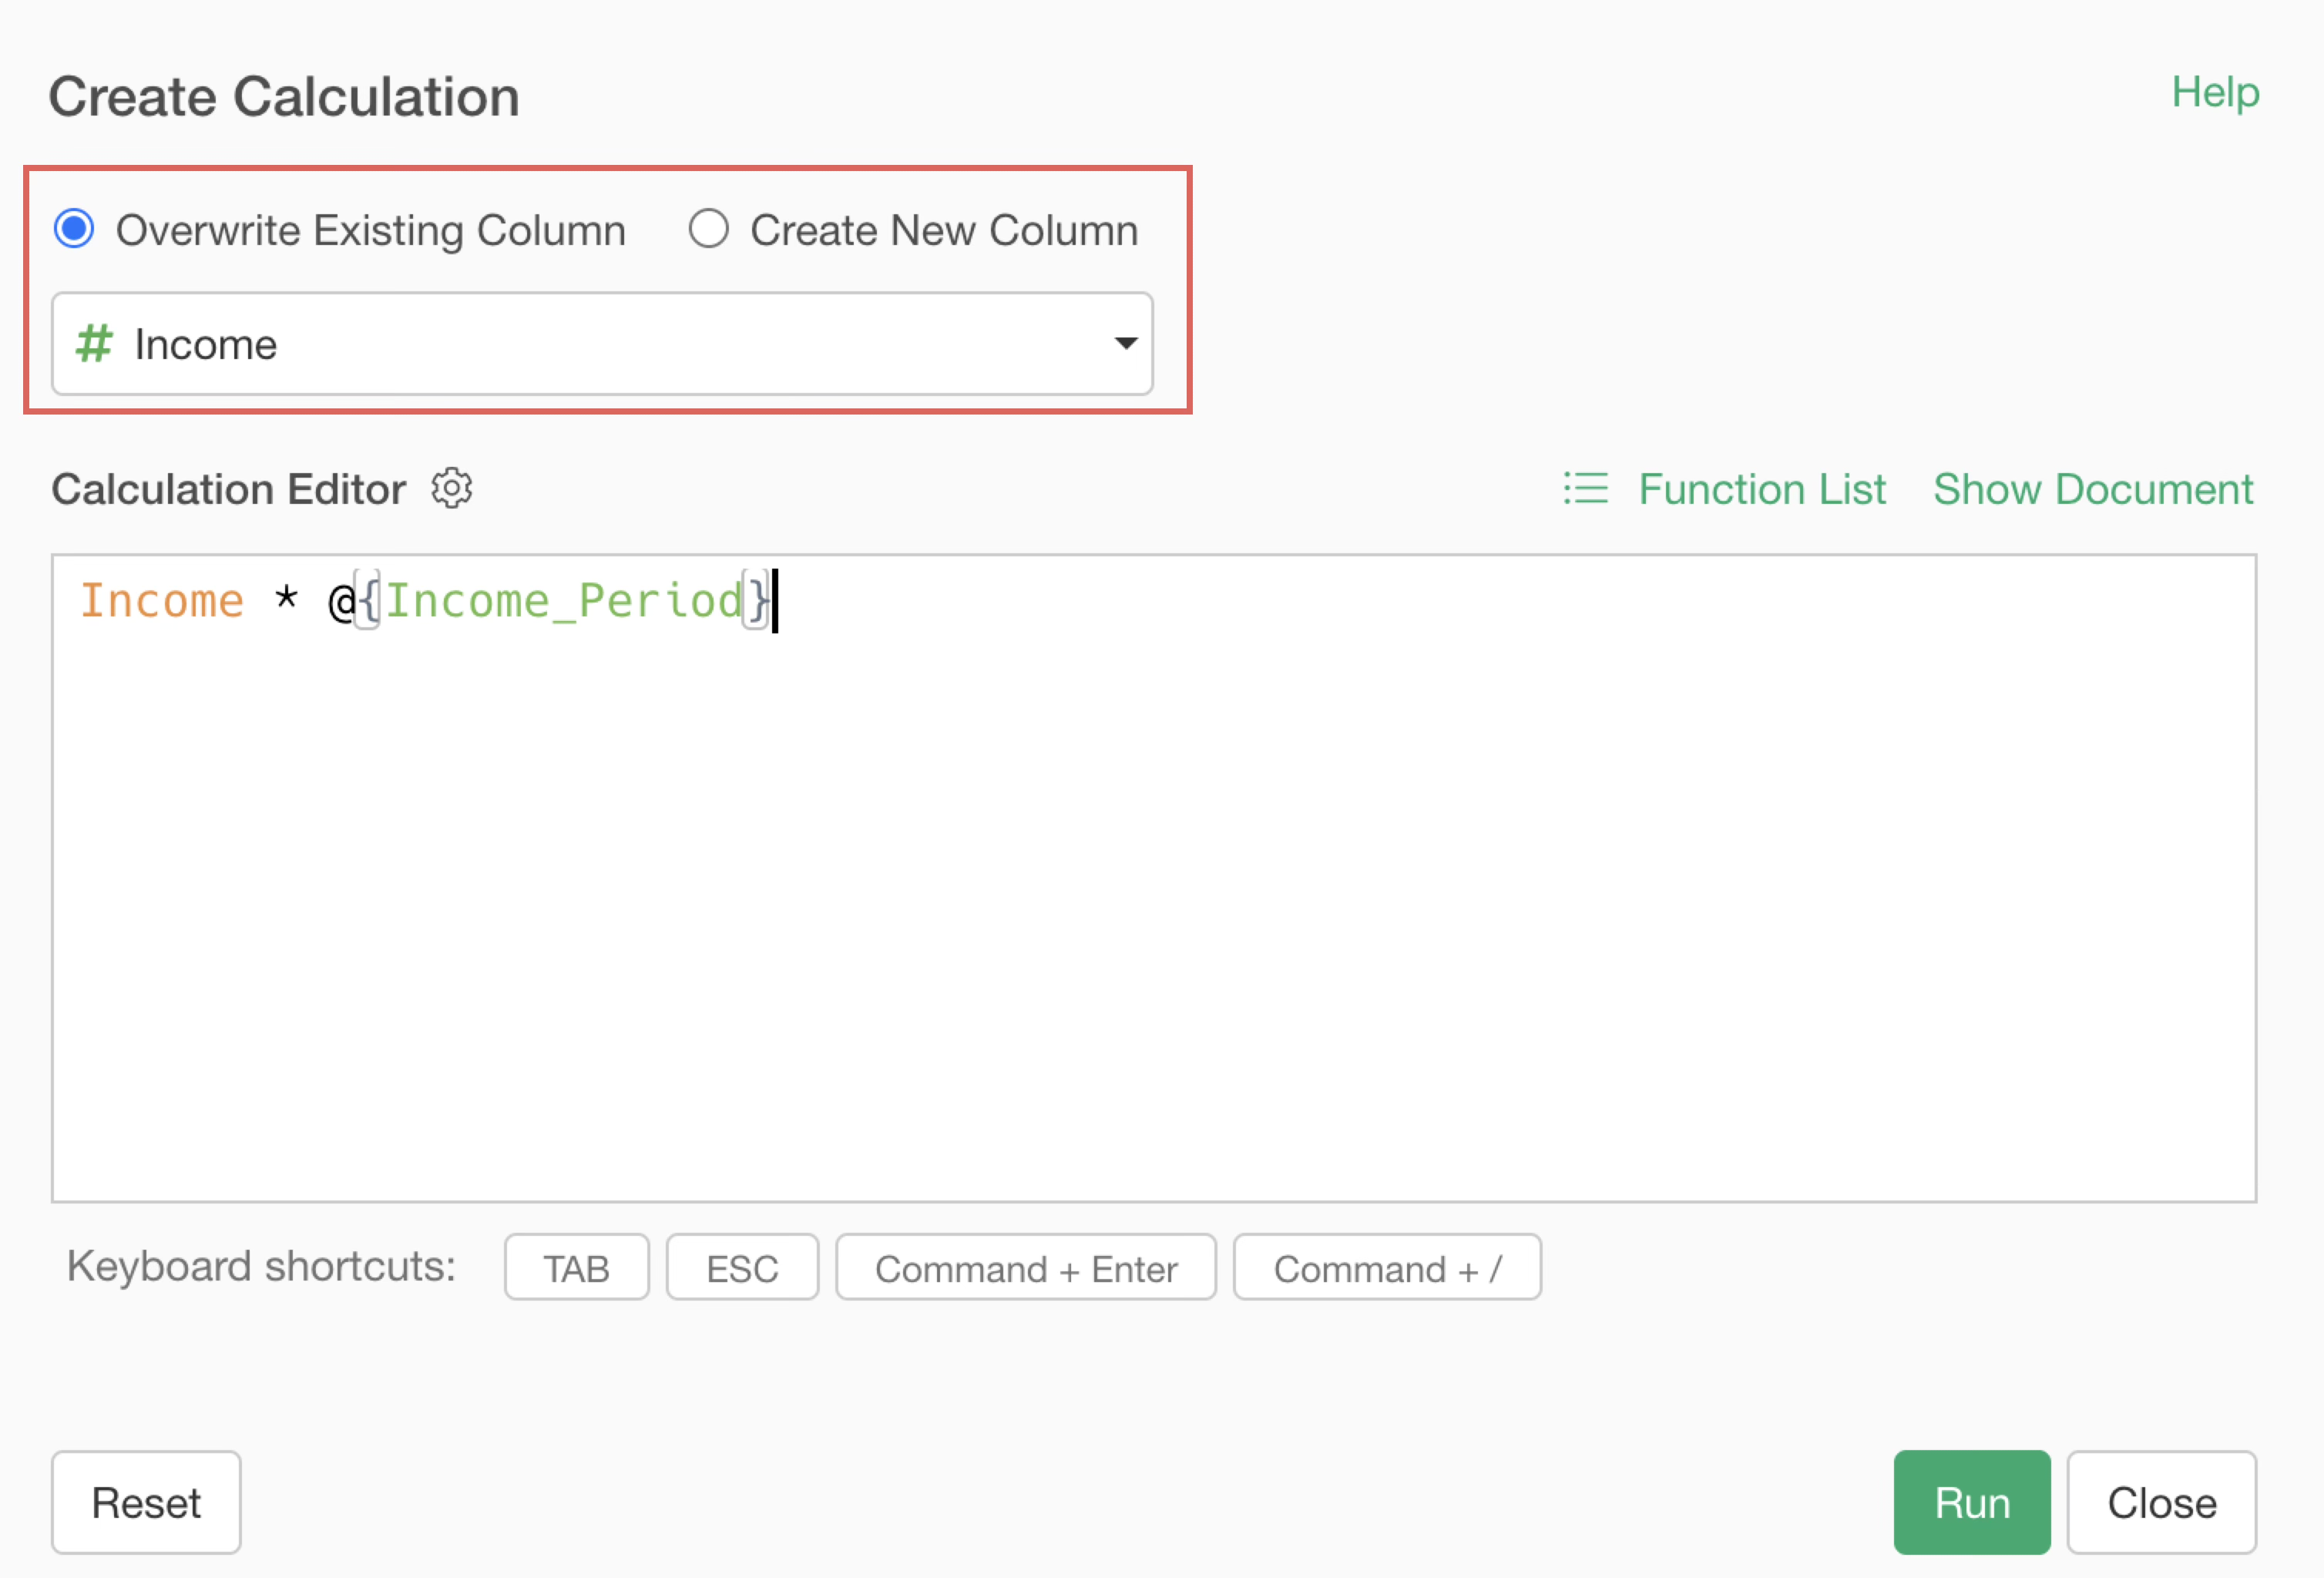
Next, from the salary column, select “Create Calculation” and then “Standard.”
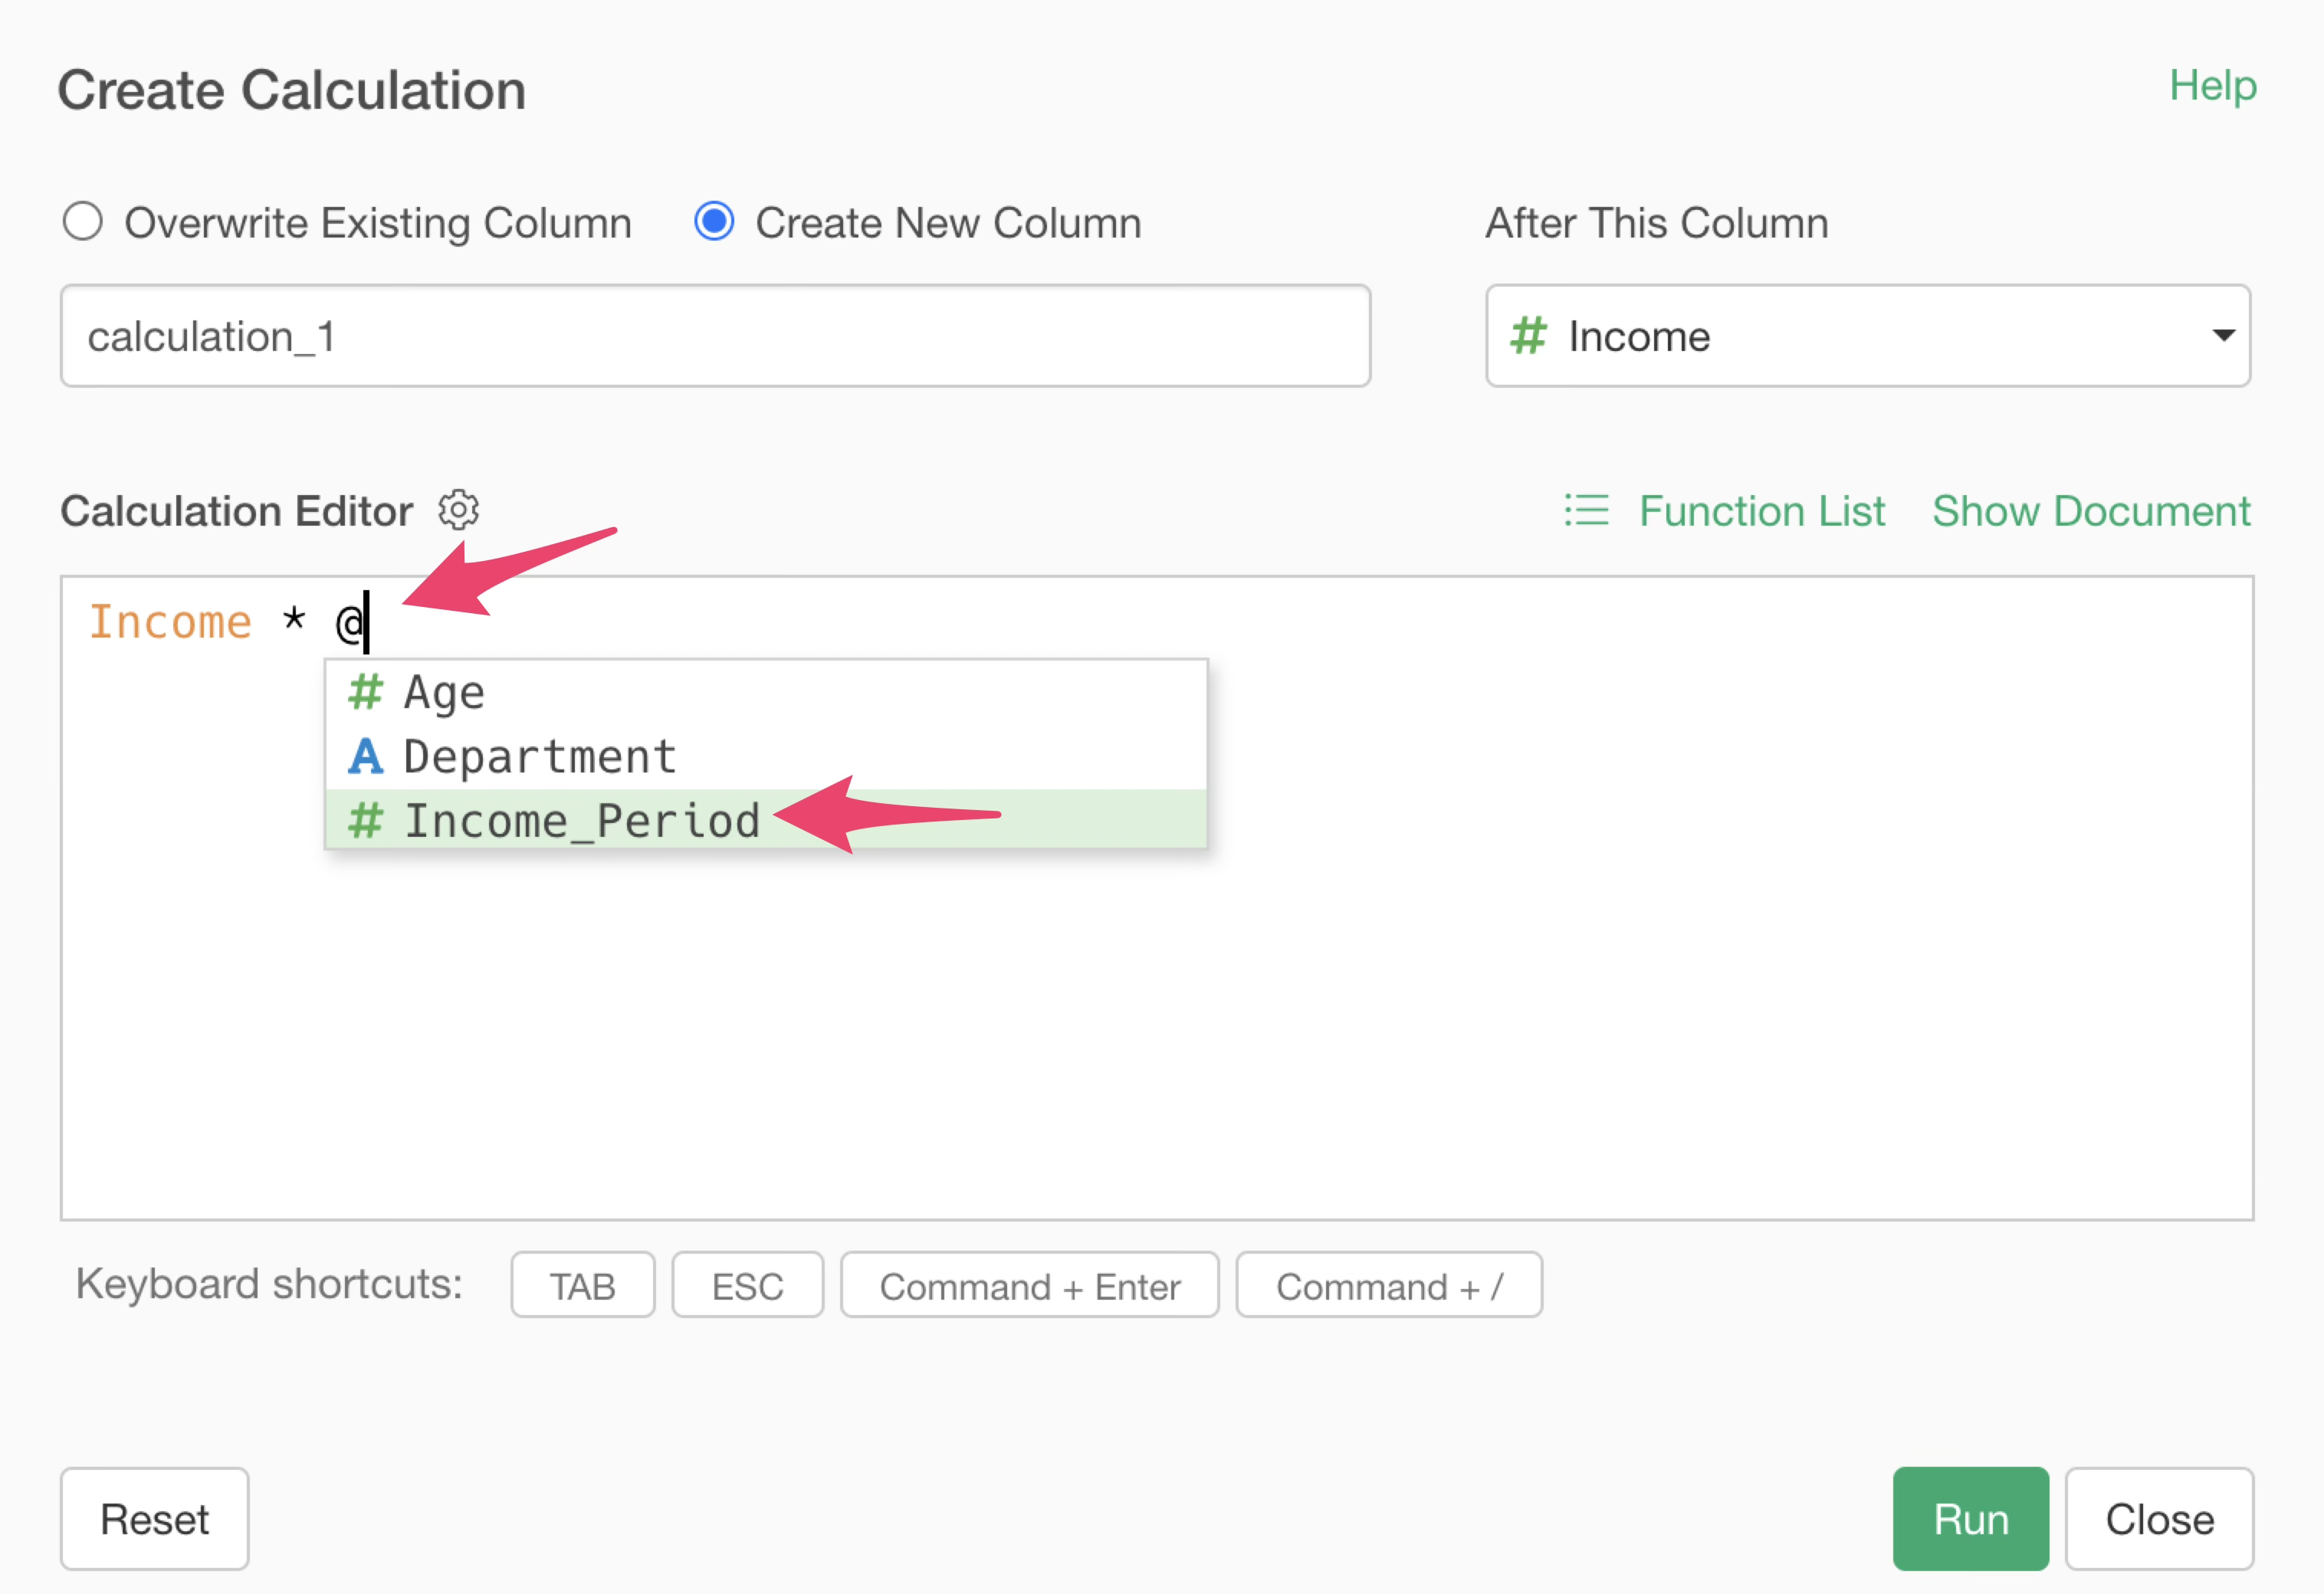
The “Create Calculation” dialog appears, and we want to multiply the income by the” Income Period” parameter we just created. By typing “@” in the calculation editor, parameters created in this project will appear as candidates.
 Specify
the following in the calculation editor:
Specify
the following in the calculation editor:
Income * @{Income_Period}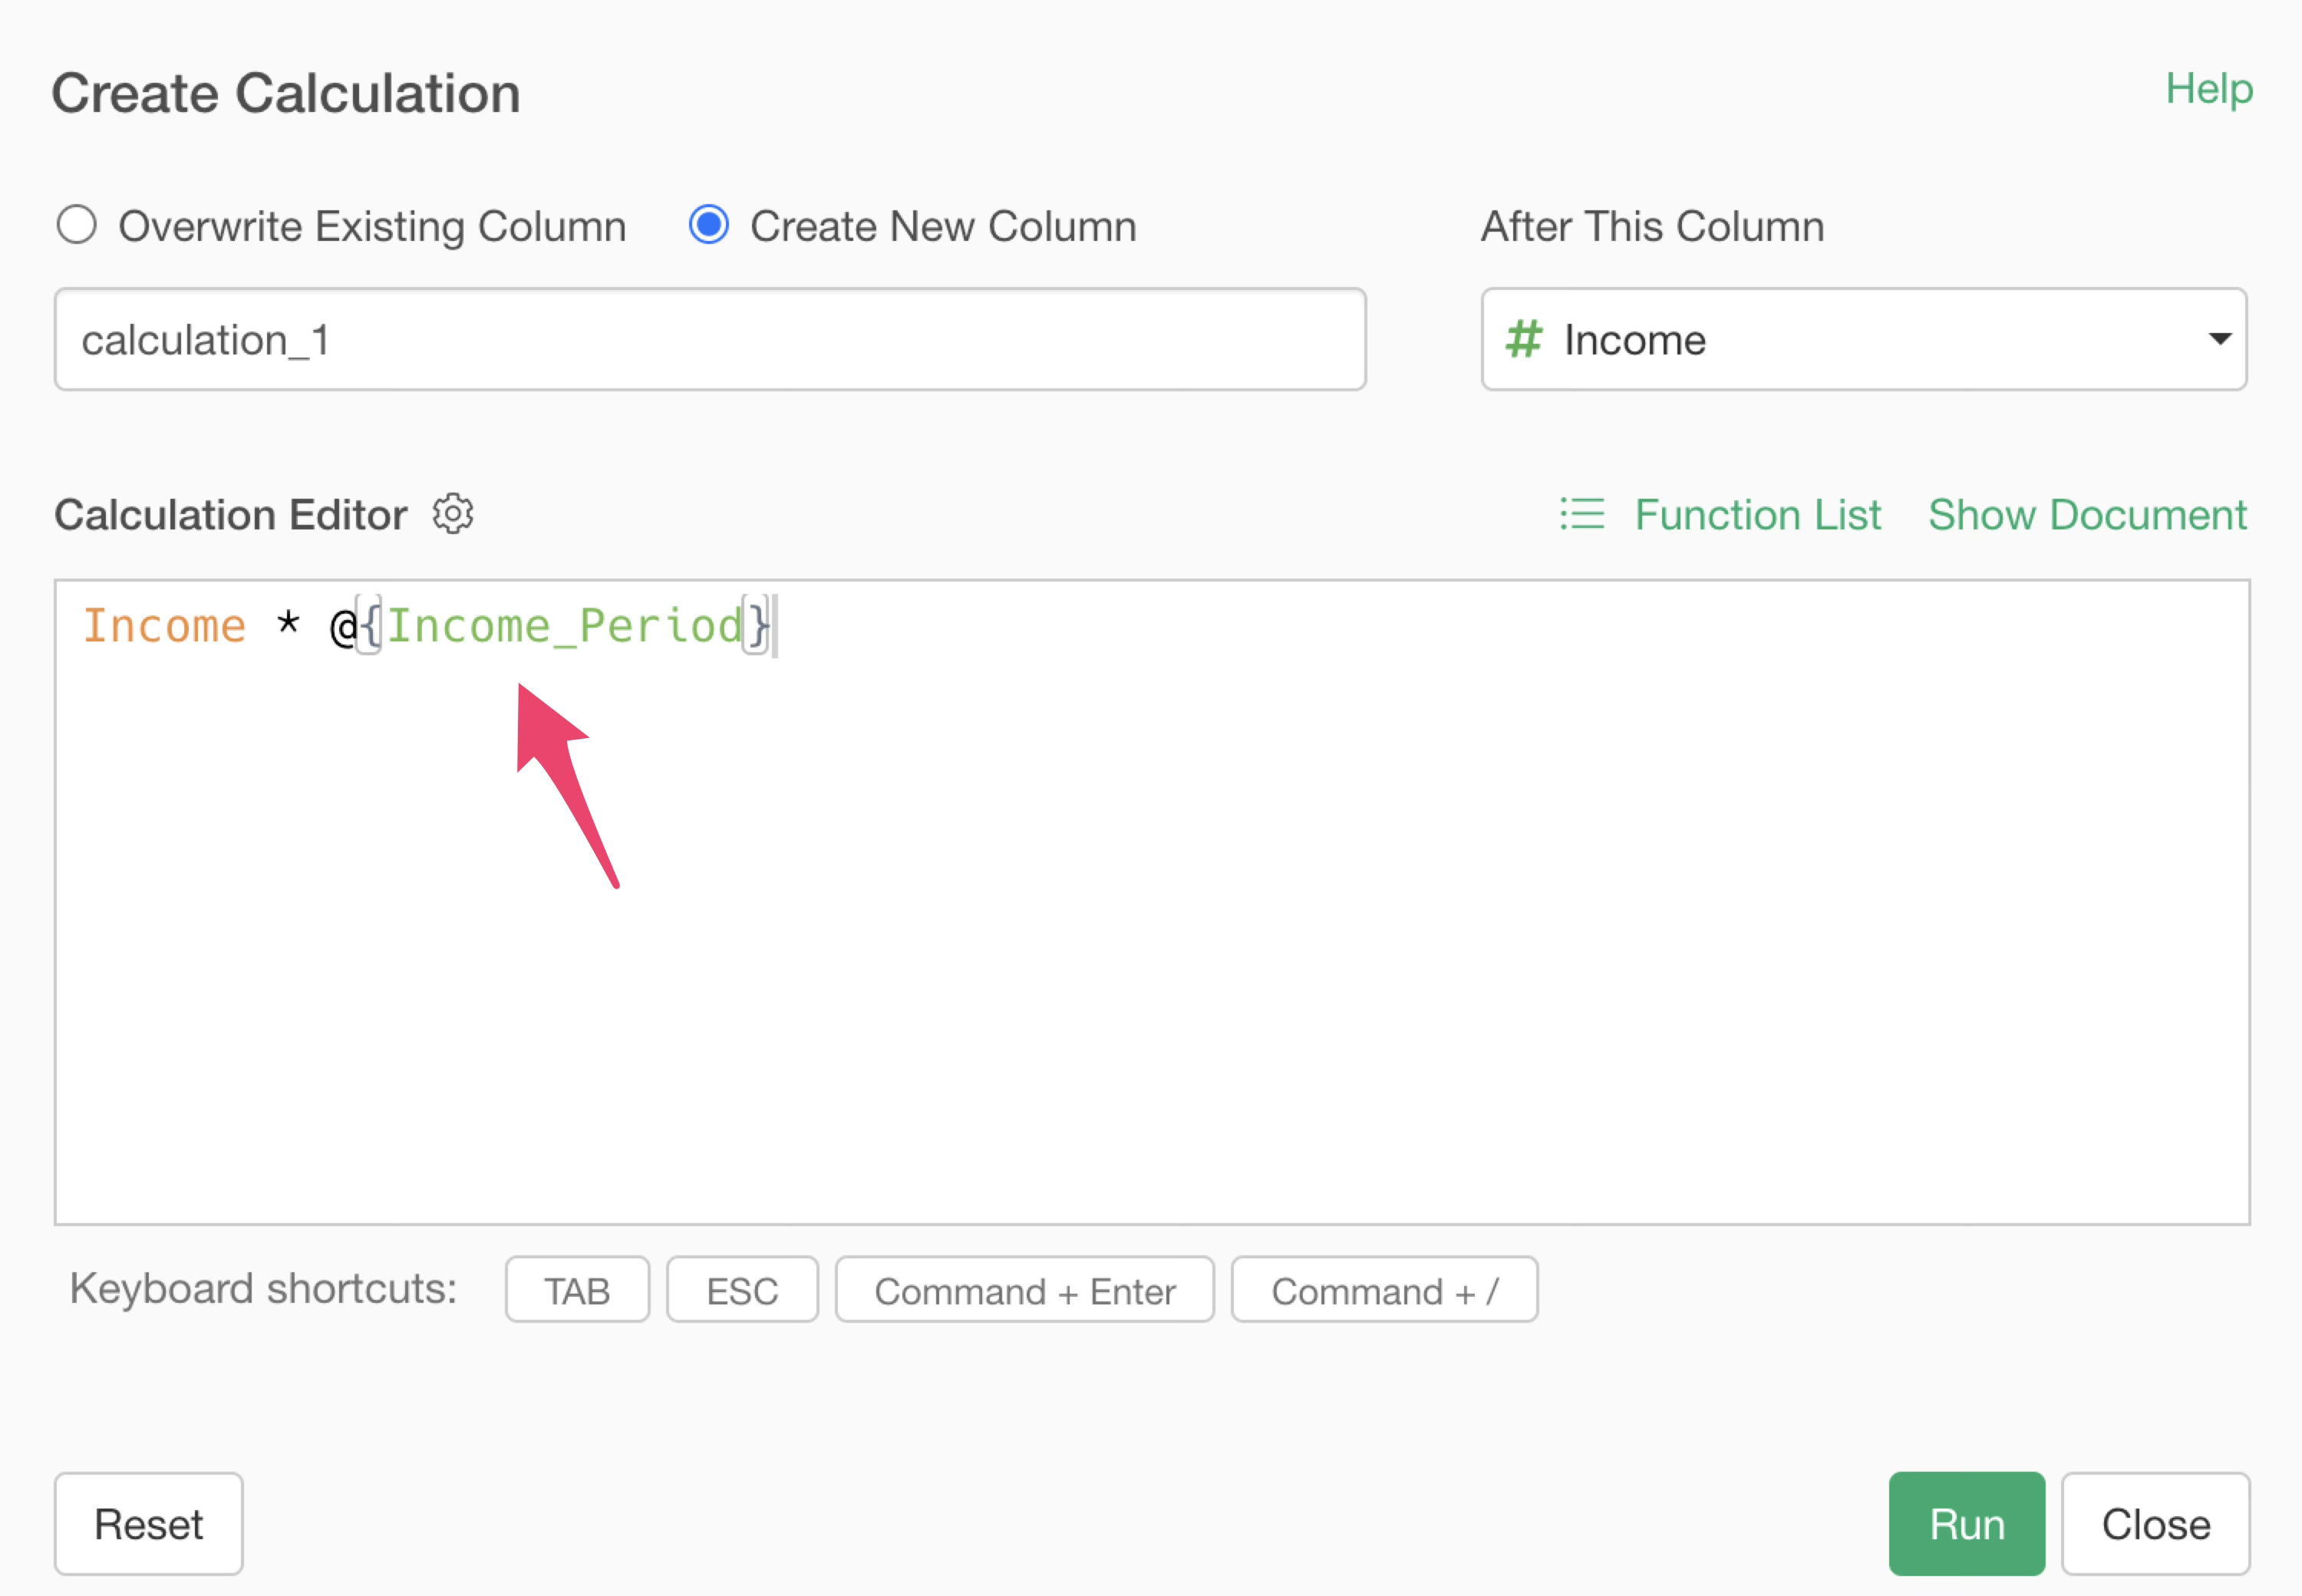
To overwrite the Income column, check “Overwrite Existing Column” and click “Run”.
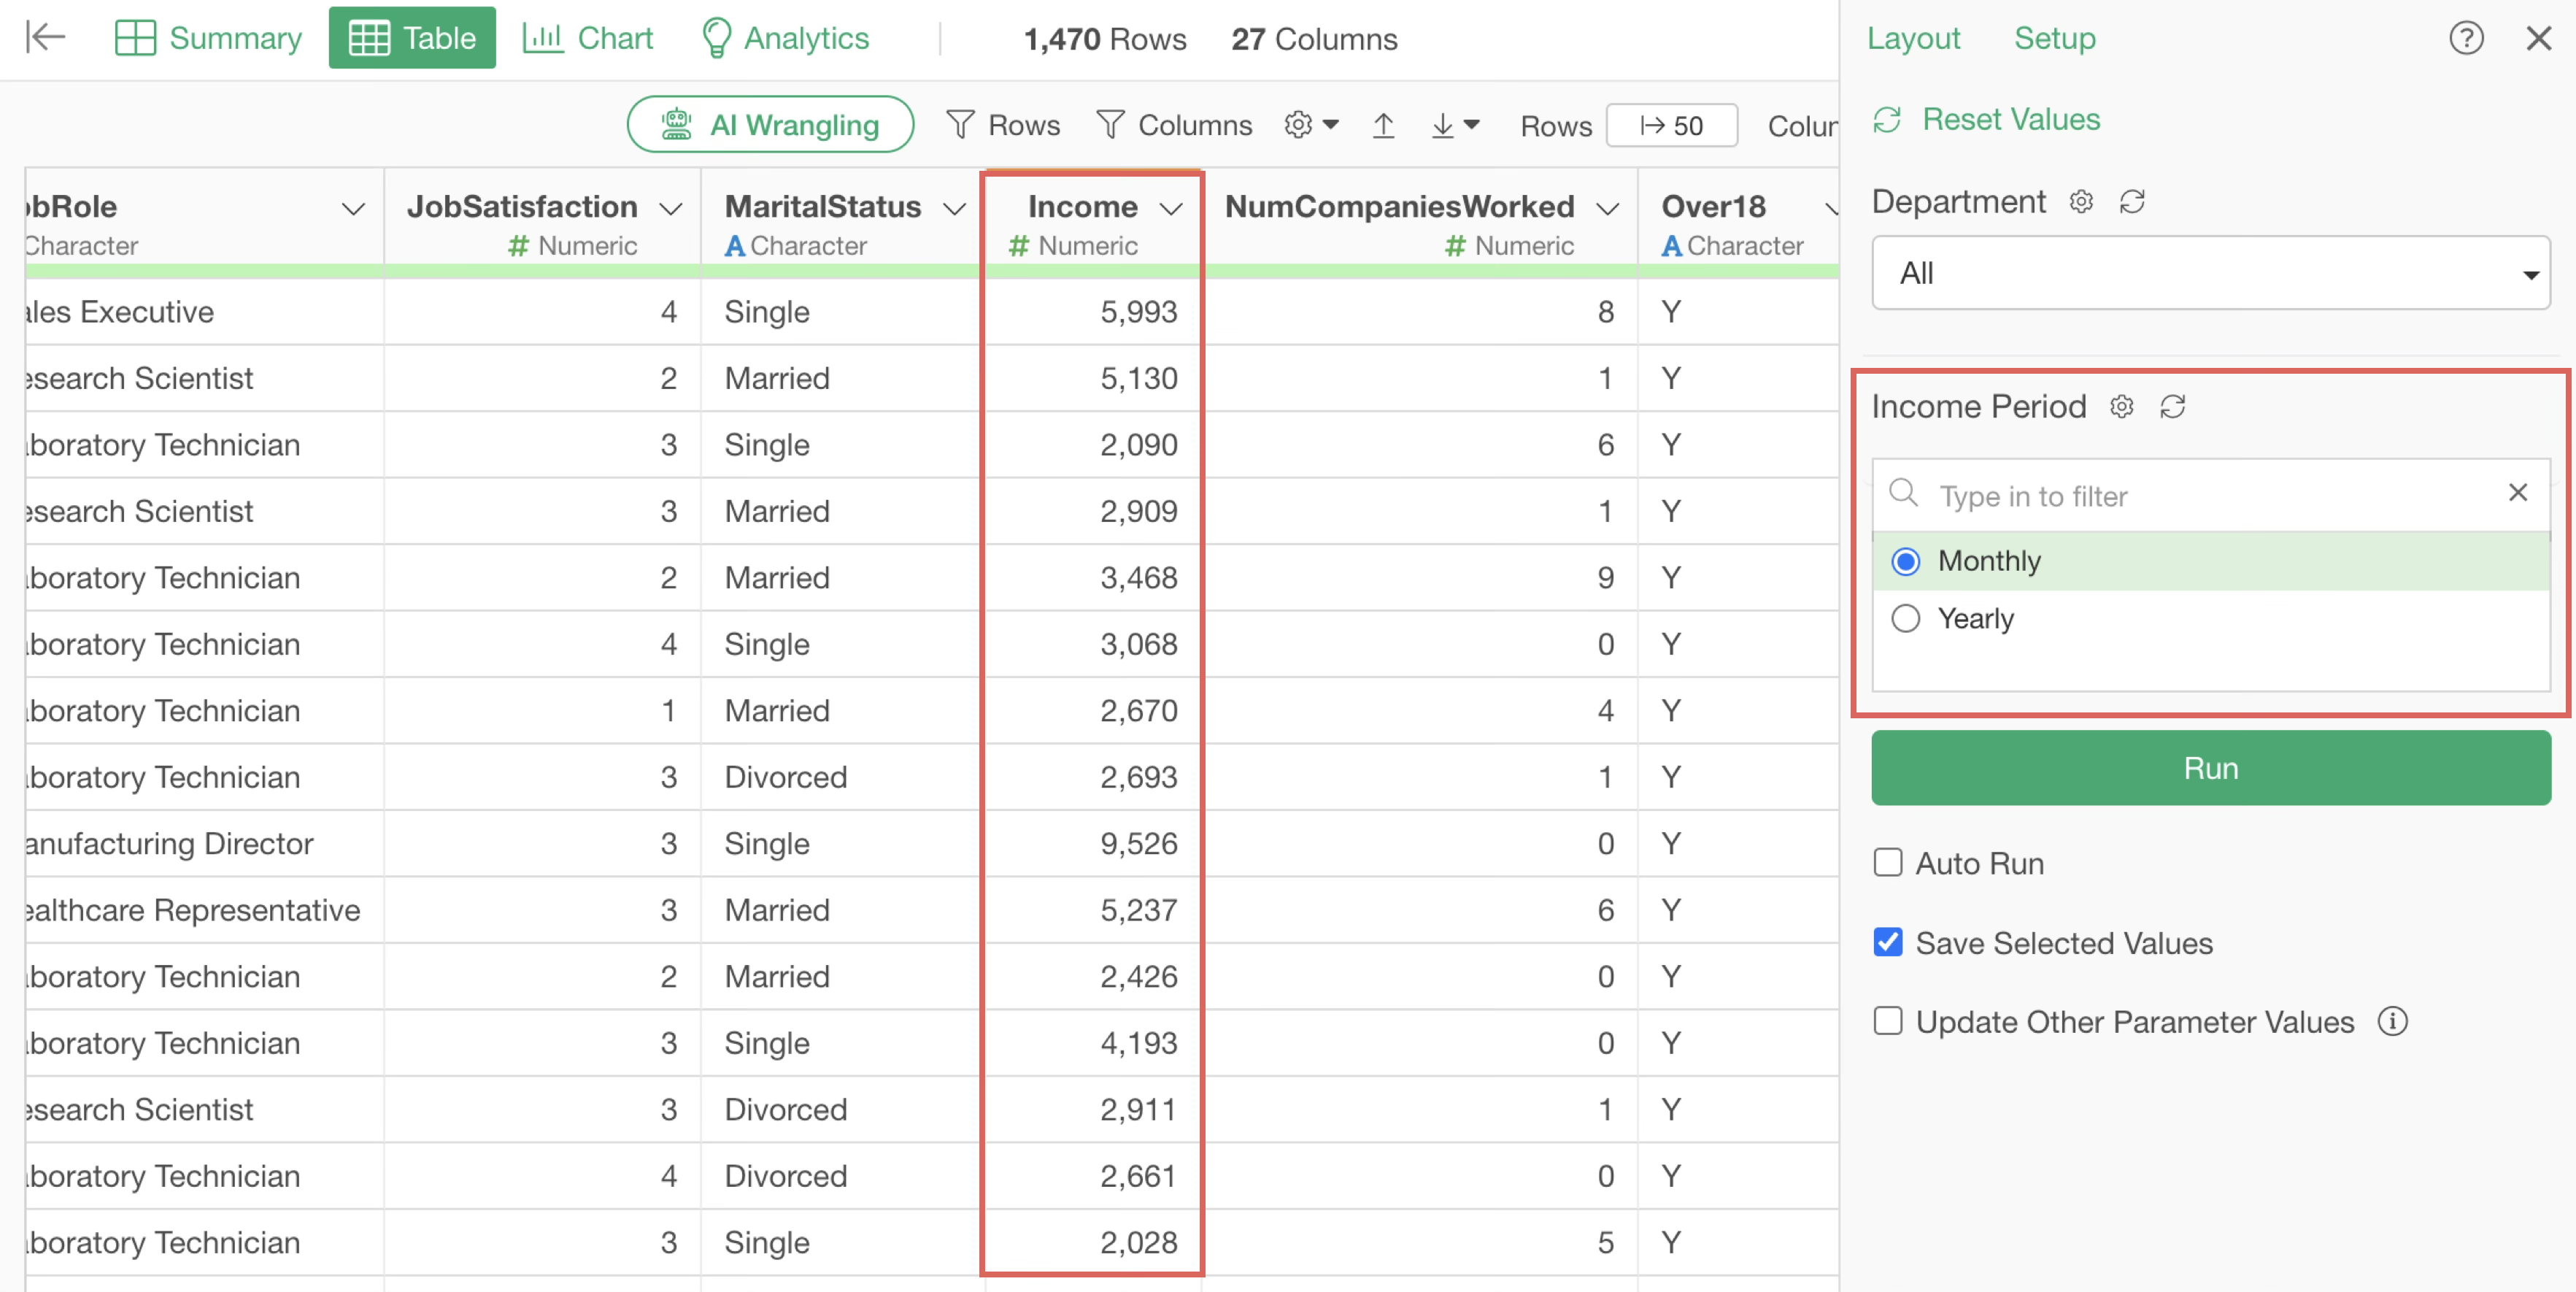
Because the default value is 1, Income won’t change at first. But if you open the Parameter Window, you’ll see the options for monthly and yearly income.
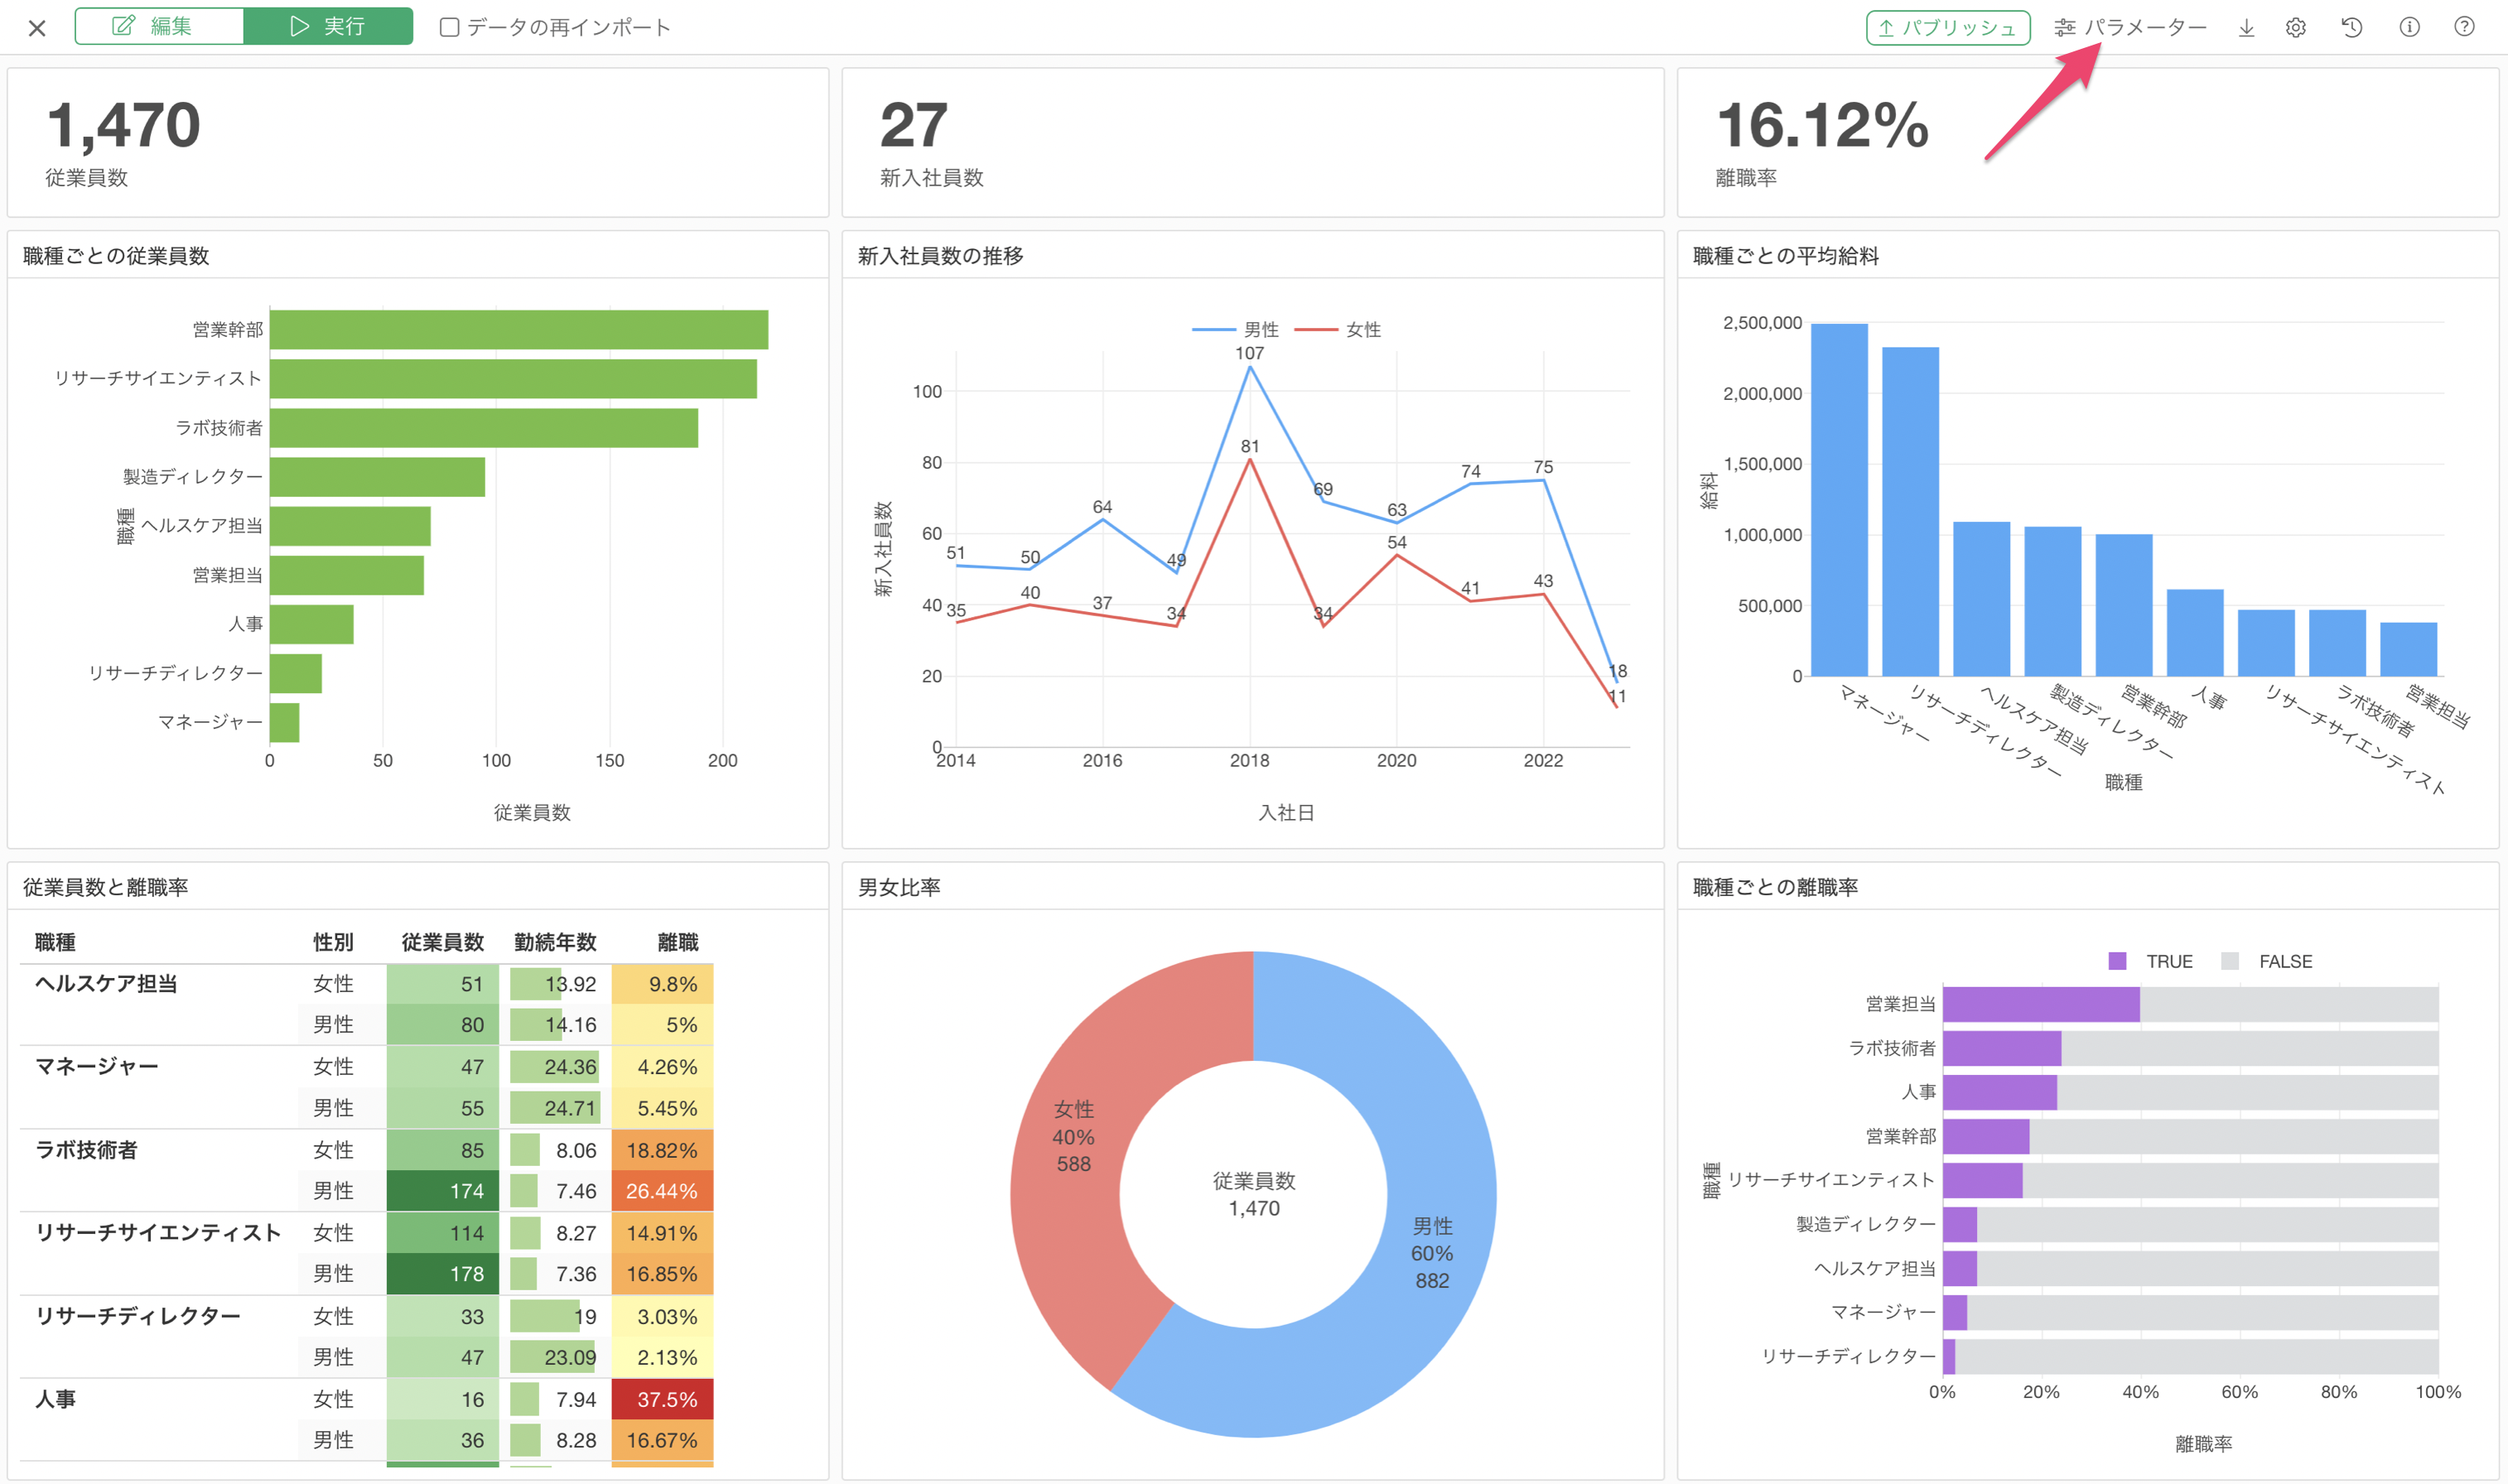
Go to the Chart View, open the chart showing the average income by job role, and open the Parameter Window.
Change the parameter value to “Yearly” and click Run.
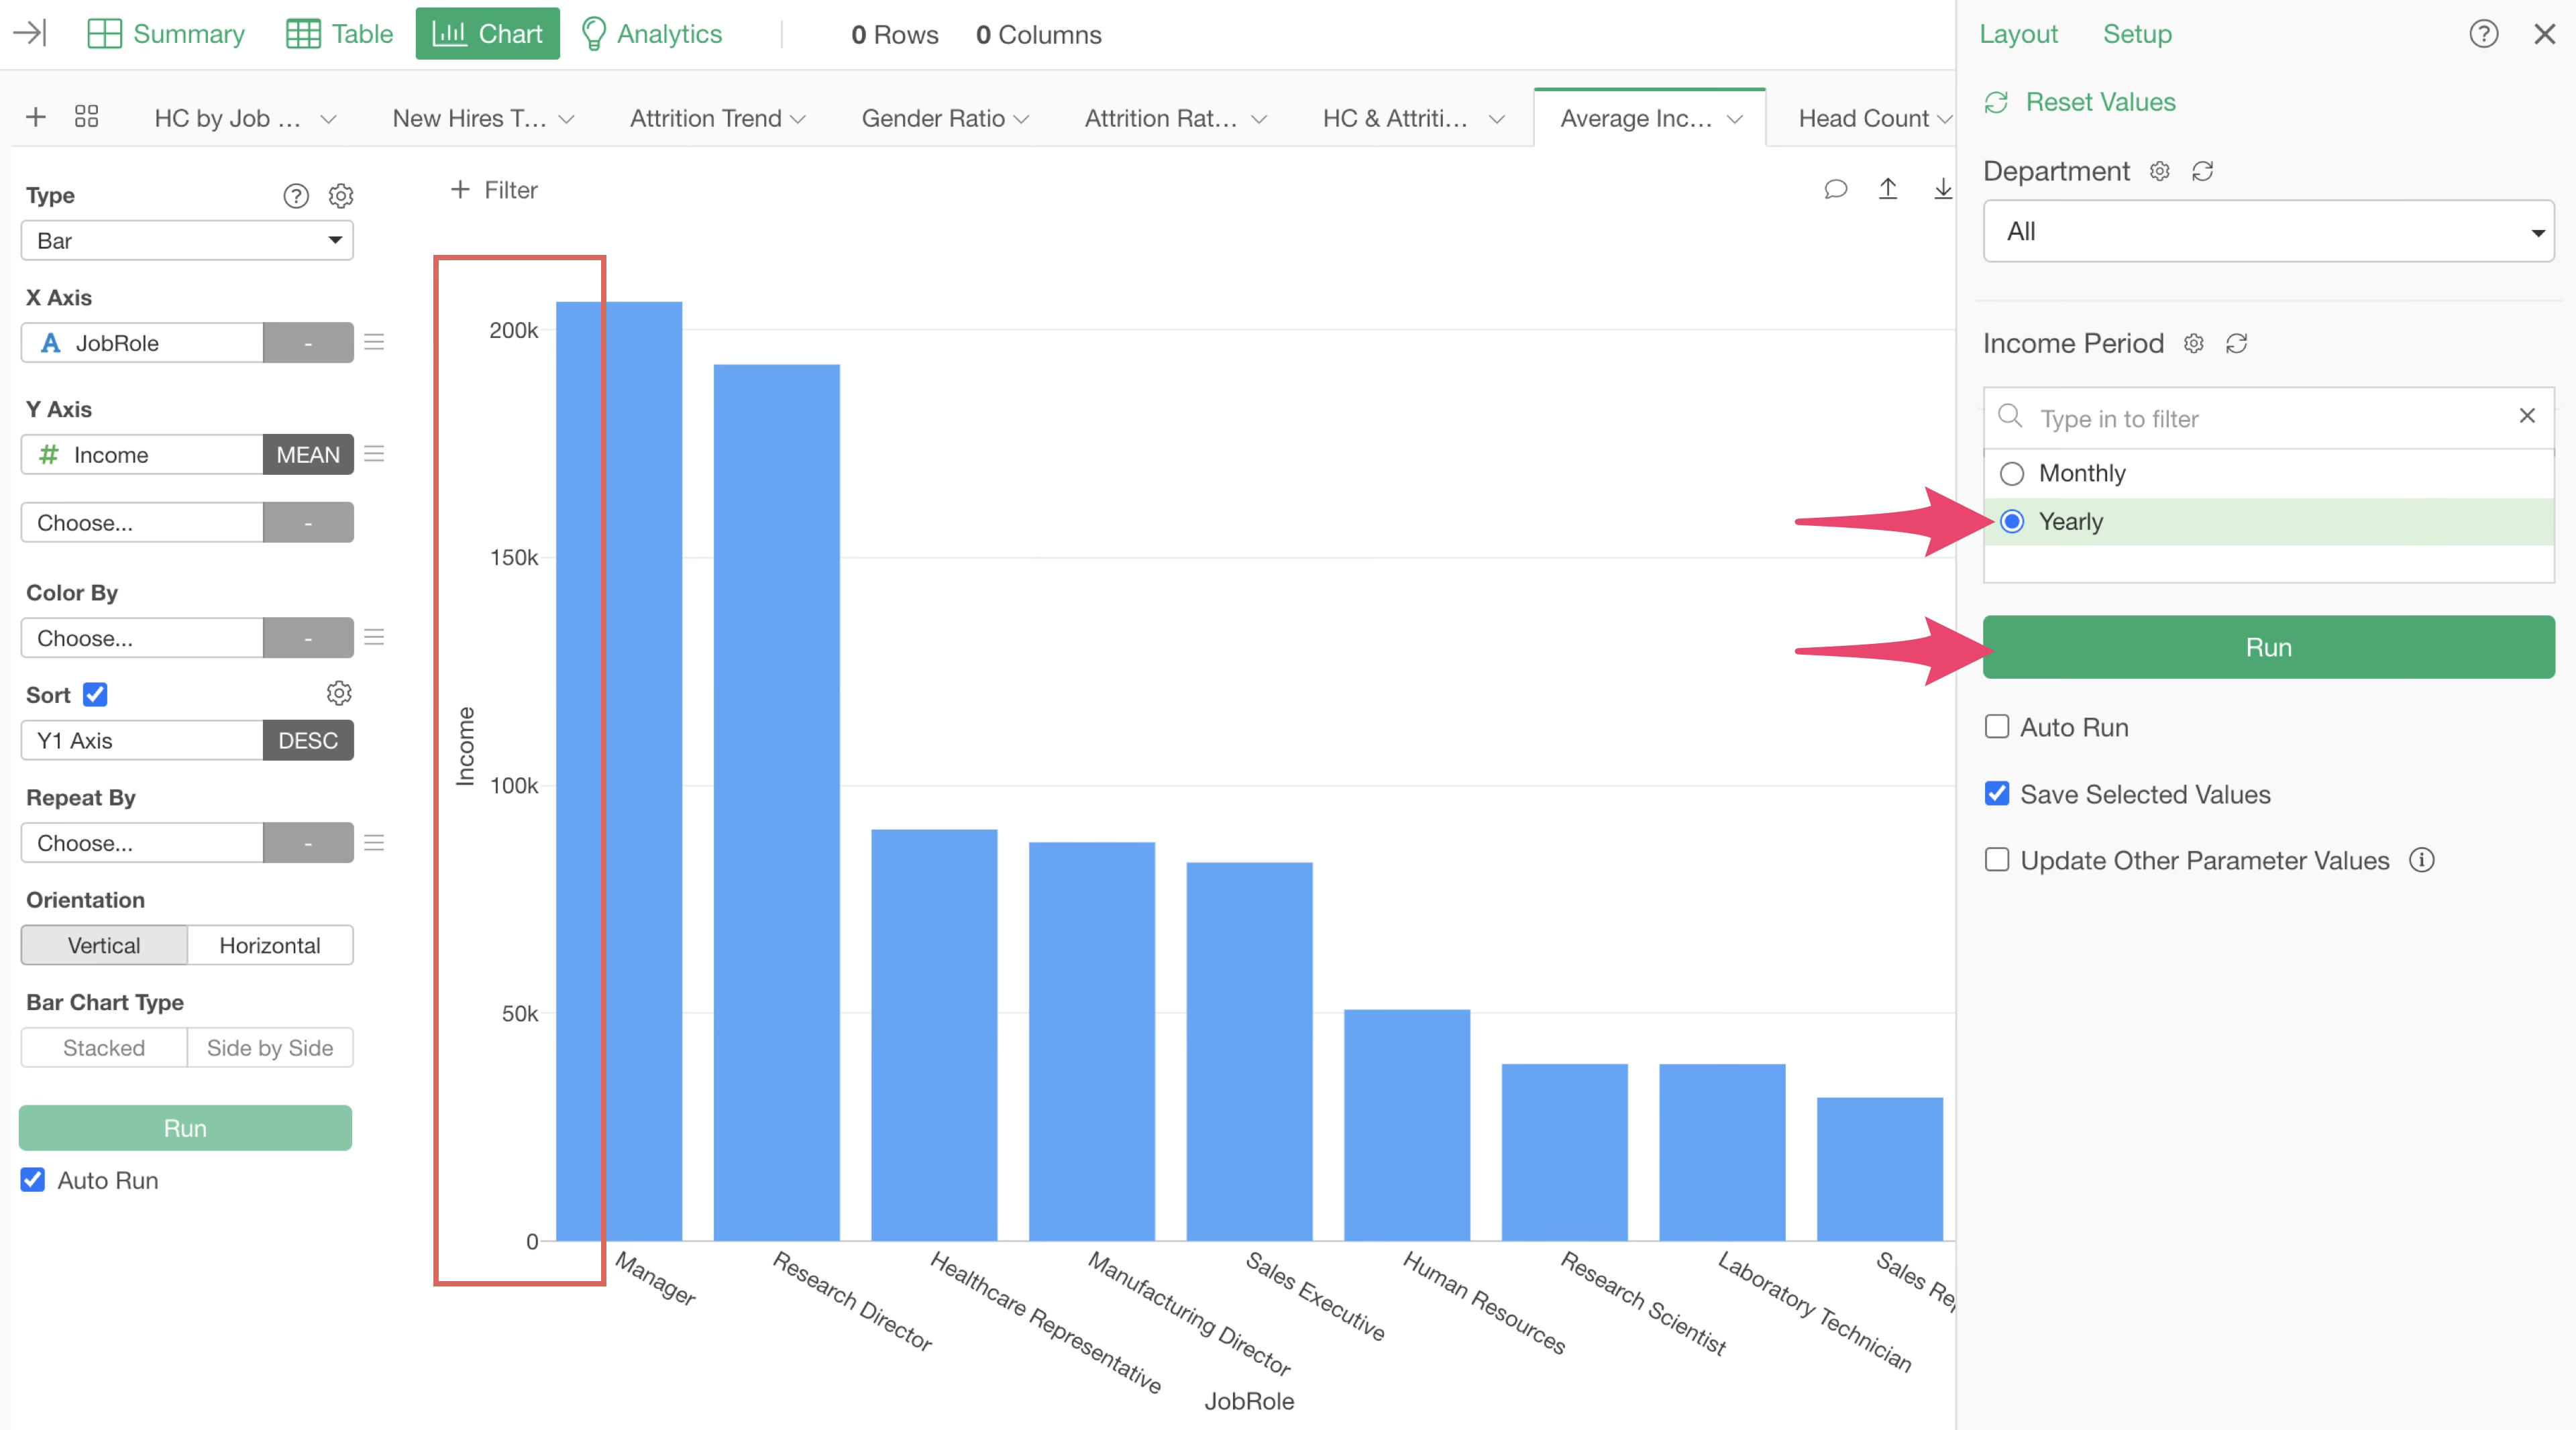
You should now see that the income values have switched from monthly to yearly.
5. Operating Parameters in Dashboards
As we set up earlier, if parameters are applied to a chart, they can be used in a dashboard without any additional settings.
Open “Employee Dashboard” in the report section.
The dashboard window will appear, so click the “Run” button.
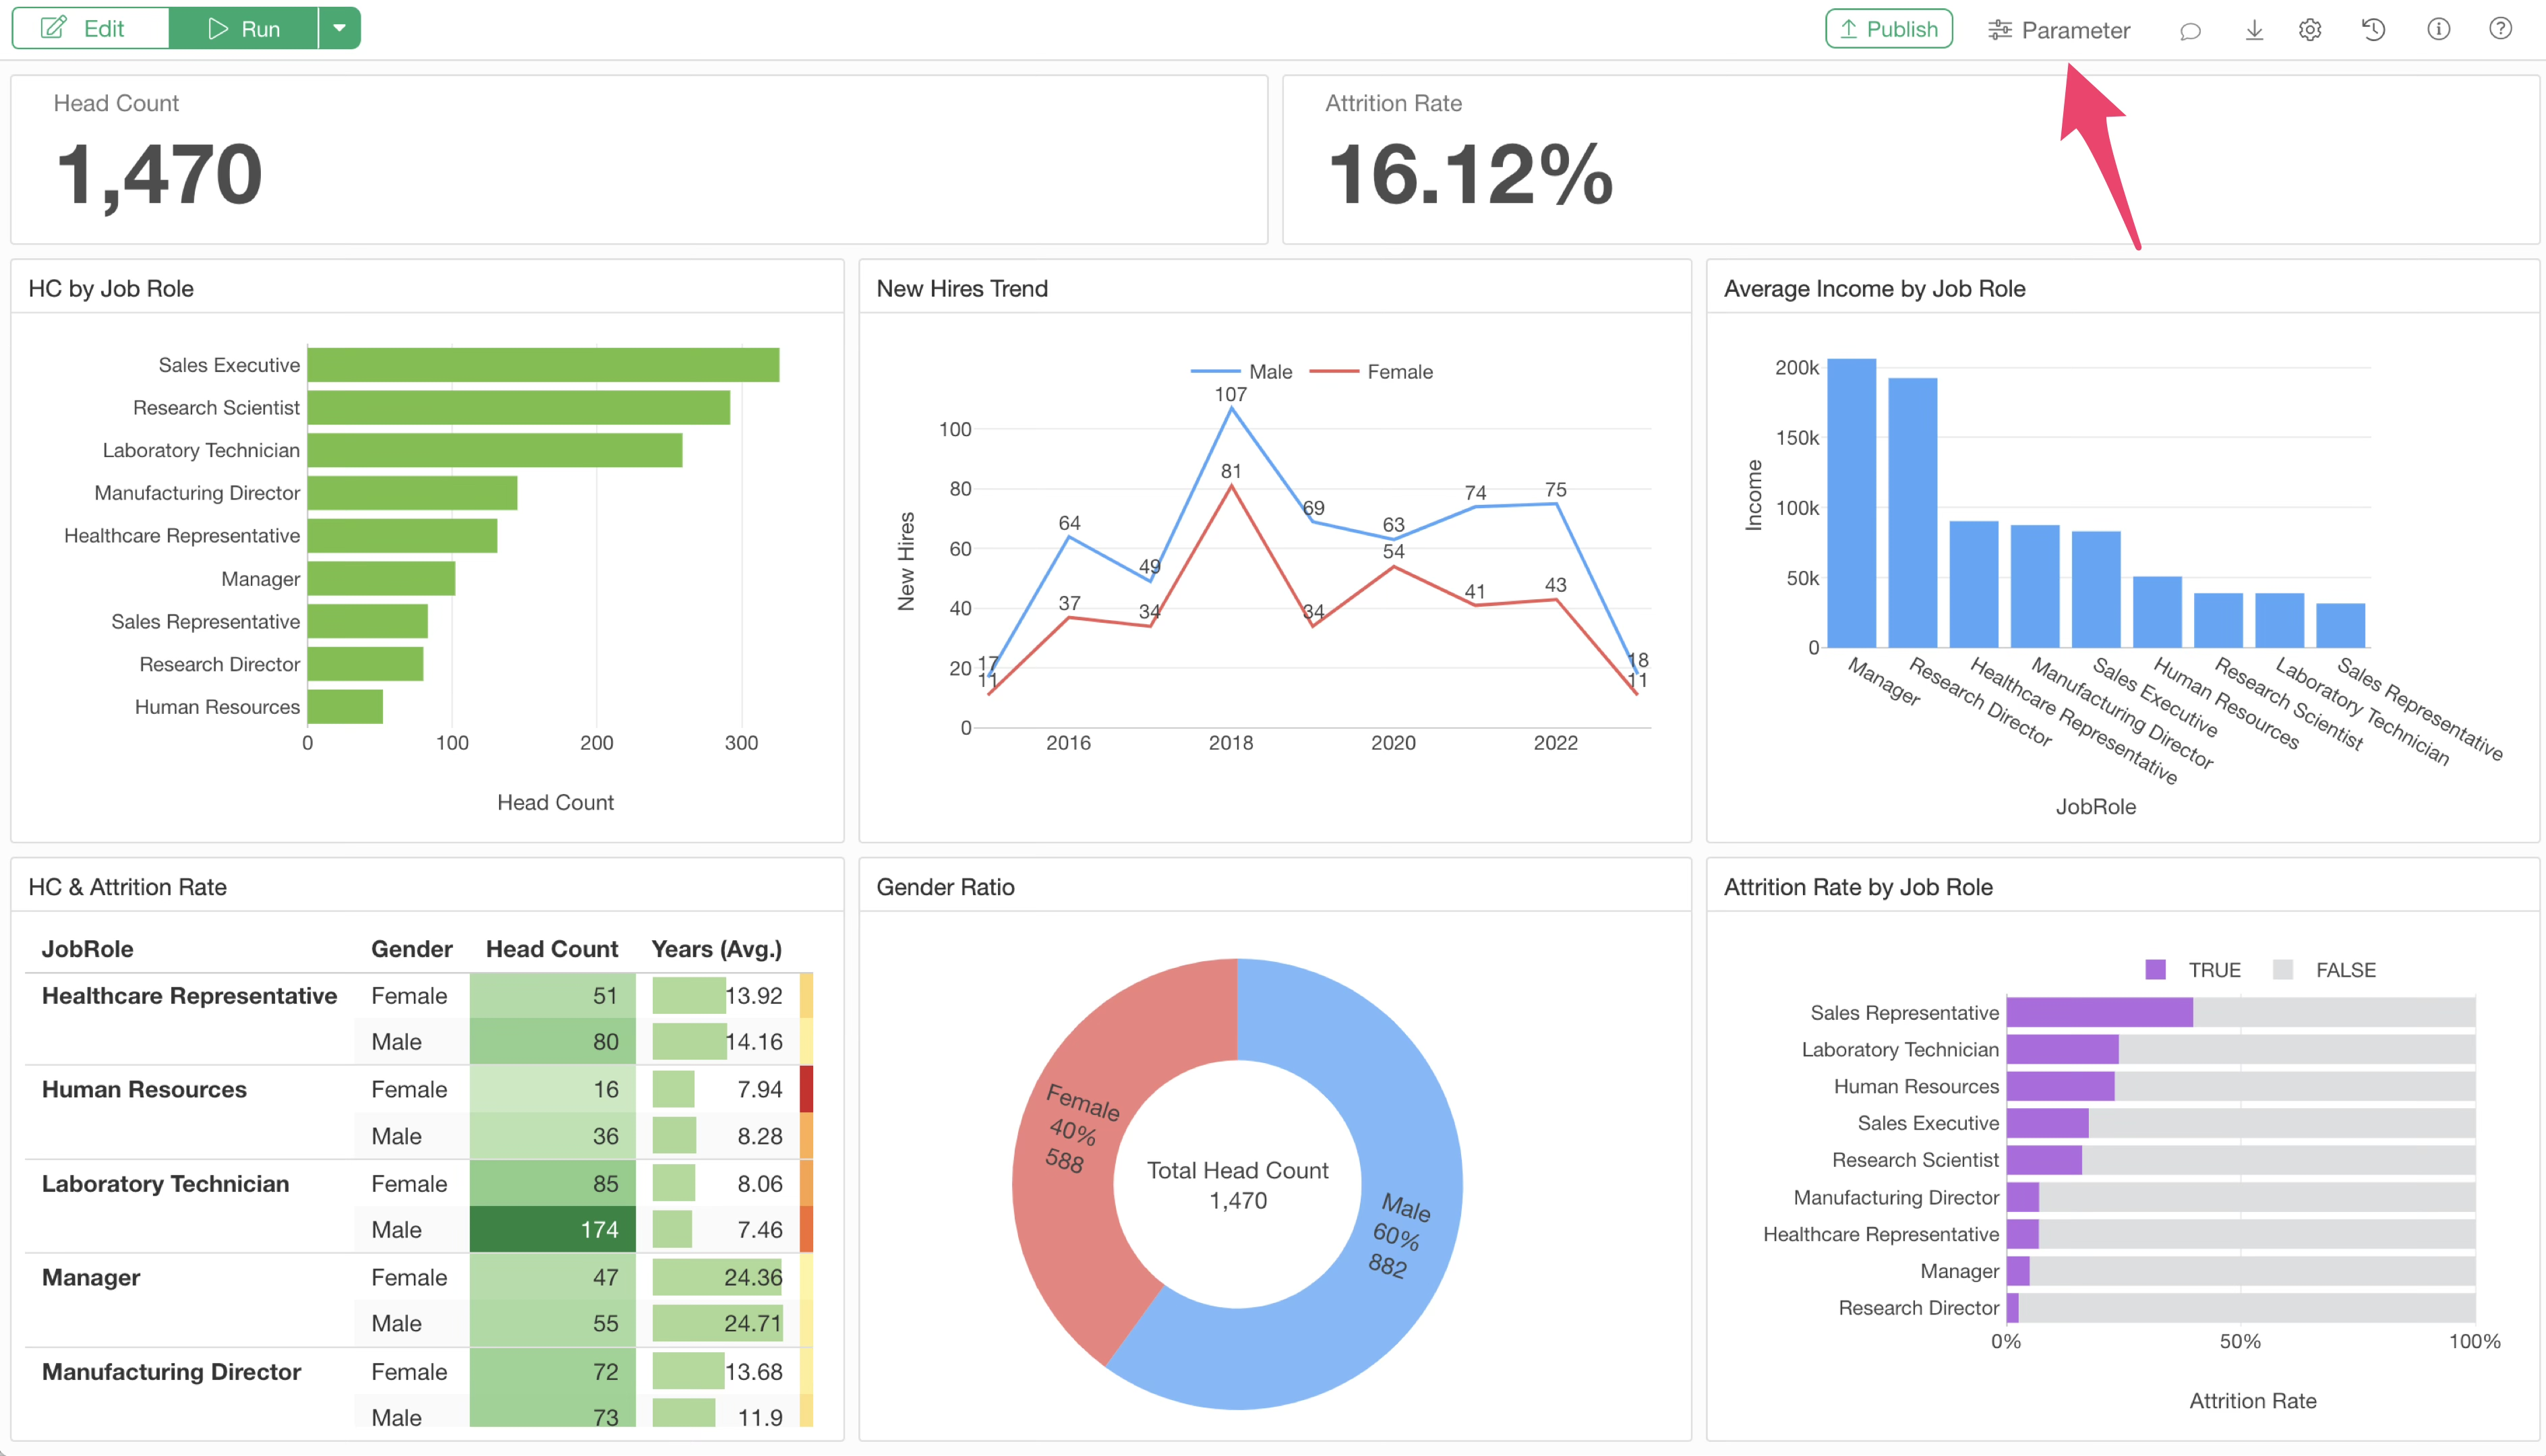
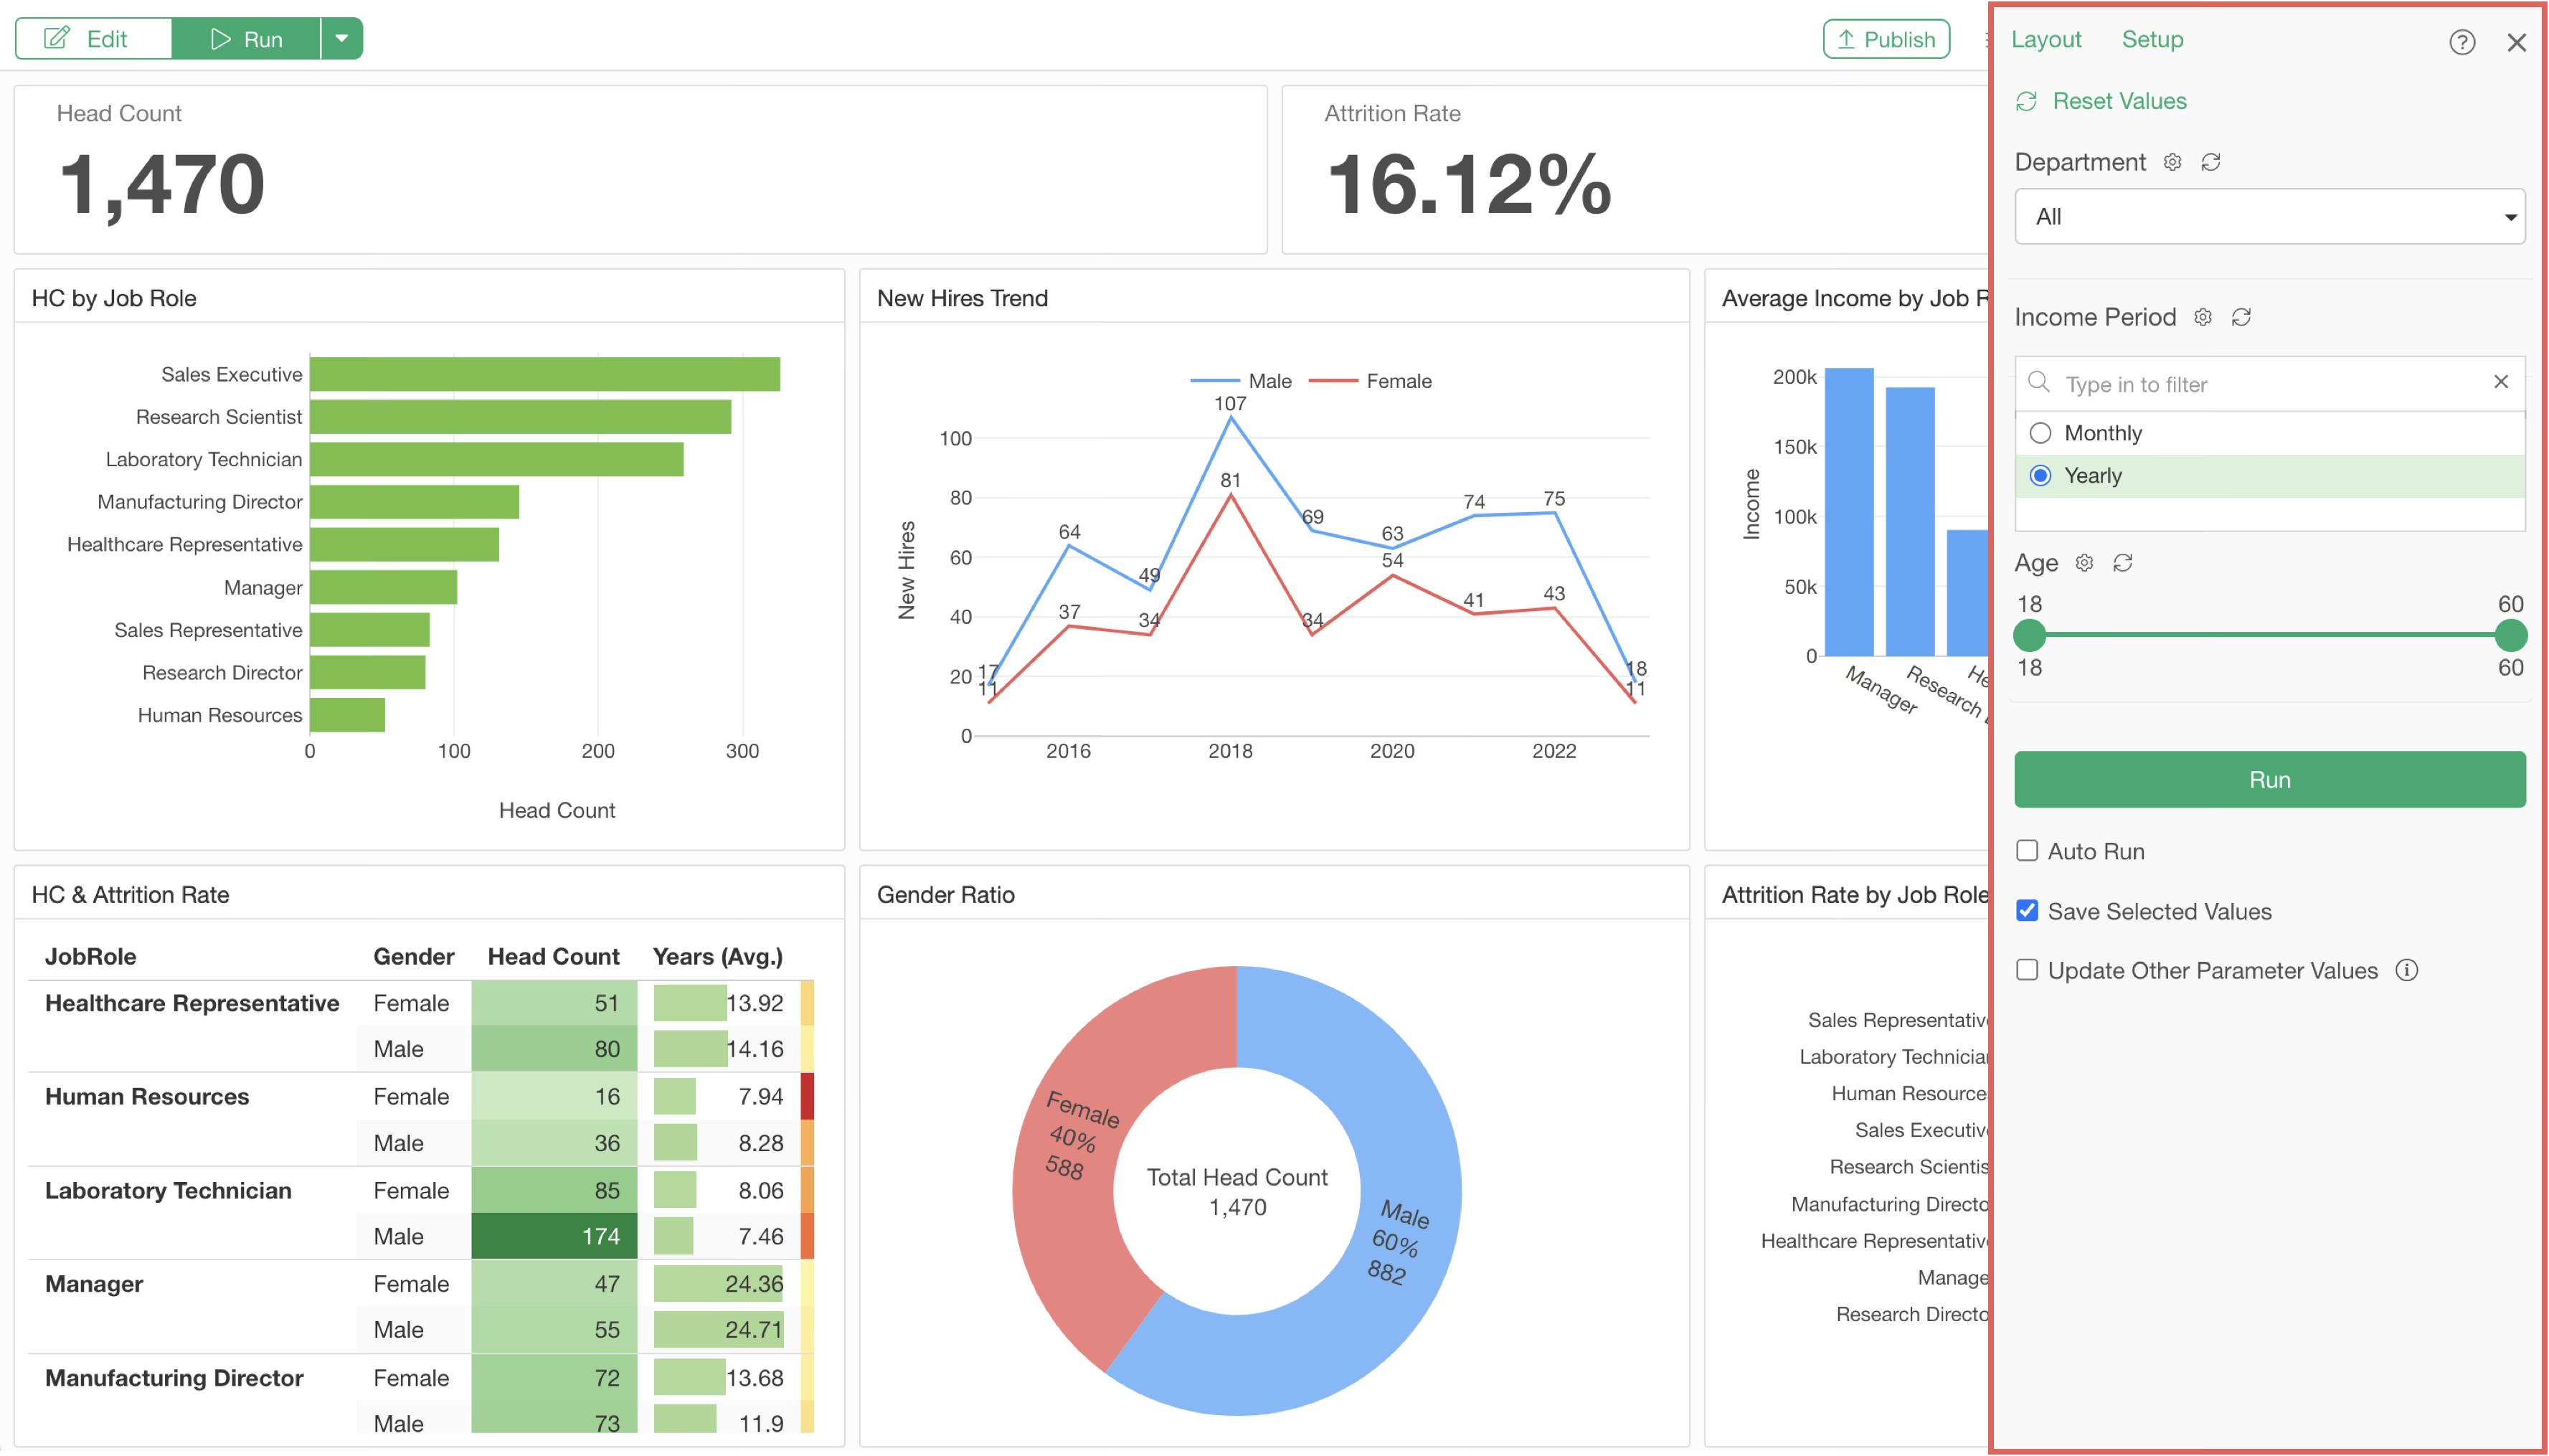
If parameters are set for charts within the dashboard, a “Parameters” button will appear in the upper right corner.
Clicking the “Parameters” button will list the parameters you set earlier, allowing you to change their values and dynamically view the results.

Also, when you publish a dashboard with parameters to the server, the parameters will appear in the same way. You can change their values directly from the browser, allowing you to flexibly update the contents of the dashboard.
This concludes the parameters section of the Exploratory usage guide!
There are many other features not covered in this tutorial. If you want to learn more about parameters, please see below.
How to Create Parameters - Link