How to Use Note Editor in Exploratory for Beginners
This is a hands-on tutorial that you can follow to learn how to use Exploratory's Note Editor to create interactive note quickly. It is a part of 'How to Use Exploratory' series where you can learn how to use various features of Exploratory Desktop. If you haven't check out other tutorial notes!
- How to Start Exploratory for Beginners - Basic - Link
- How to Clean & Transform Data in Exploratory for Beginners - Link
- How to Create Dashboard with Exploratory for Beginners - Link
If you prefer to watching video here's one for you!
1. Import a Sample Project
You can import data for this tutorial by importing a sample project.
Download the sample project from here and save it to your PC.
Once it's downloaded, open the Projects page (Main Window) in Exploratory, and drag-and-drop the downloaded project into Exploratory.

Alternatively, you can select 'Locally Saved Project (.epf)' from the Import Project button menu, and select the downloaded project file to import as well.

Once the project is imported, open the project, and open the HR Employee Attrition data frame. You should see a series of charts already created.

In this tutorial, we are going to add some of the charts to a newly created Note.
Let's start by creating a new Note!
2. Create a New Note
Select 'Create Note' from the Plus button menu next to the 'Reports'.

Type in the new Note name. (e.g. HR Data Analysis Report)

Once you click on the Create button, a new empty Note is opened with the Note Editor.

3. Format Text
You can start typing in text just like you would do with other text editors. Here, we'll introduce you a few useful features.
Header
Type in something like 'HR Data Analysis Report'.
You can select the text and select 'Header 1' from the Header menu.

Now the text is formatted as the 'Header 1' format.

Alternatively, you can type '#' sign at the beginning of the sentence like the below, instead of using the toolbar menu.
# HR Data Analysis ReportThis will automatically change the text to the Header 1 format. If you type two '##' like the below, it will change it to the Header 2 format.
## HR Data Analysis ReportBullet Point
Now, let's type in something like the below.
We have made our data analysis in the following areas:

Head Count
New Hires
Attrition Rate

The data used in this data analysis is shared at this page.
Now, let's make the the blue highlighted part of the text to be bullet points by selecting them and selecting the Bullet Point button in the toolbar.


Alternatively, you can simply make the text to be bullet pointed by adding '-' like the below.
- Header Count
- New Hires
- Attrition Rate
URL Link
Now, let's make the blue highlighted part of the text to be an URL link by clicking on the URL link button or typing 'Command/Control + K' (short cut key).

Type in the following URL in the URL dialog and hit an Enter key.
https://exploratory.io/data/kanaugust/HR-Employee-Attrition-Tog2pMA0AH
You can check out other short cut keys you can use in the Note Editor by clicking on the Keyboard button.

4. Add Chart
Now, let's add a chart from the HR Employee Attrition data frame.
Move the cursor position to somewhere you want to insert a chart.

Then, click on the Plus button and select 'Chart' from the menu.

It will open a Chart selection dialog.
 In this project, we have only one data frame. But if you have multiple data frames you can select the one where you have created charts.
For this tutorial, select 'HC by Job Role' chart and click 'OK' button. This will add the chart to the Note.

Let's add a Header 2 text right before the chart.

You can click on the white space area on the chart, which will highlight the chart with green borders.
 There are two things you can do once the chart is highlighted.
First, you can hit a Delete key to delete the chart or change the chart size. Second, you can change the chart's display size by selecting one of the icons at the top of the chart.

Now, there are 3 things you can do with the chart itself.
First, you can click on a part of the chart to show the detail data.

Second, you can move the mouse over on the chart, which will show you two icon buttons, then you can download the data or the image of the chart.

Third, from the same icon buttons, you can click on the Expand icon to show the chart in a full window size.

5. Add Image
You can add images to the note very easily.
You can download a sample image from this link.
First, let's create a space at the top so that we can add an image here.

There are a few ways to insert images in Exploratory.
The easiest way is to drag-and-drop an image file that is saved on your PC.

Alternatively, you can copy the image file (Command / Control + C) and then paste it (Command/Control + P) to the Editor.

6. Add Table
This is NOT about the table you create under the Chart view. If you want to insert such tables though, you can simply select the Chart menu under the Plus button then select the table.
This is about a table with text input. Sometimes, you want to write something in a table format. In such cases, you can select 'Table' under the Plus button menu.
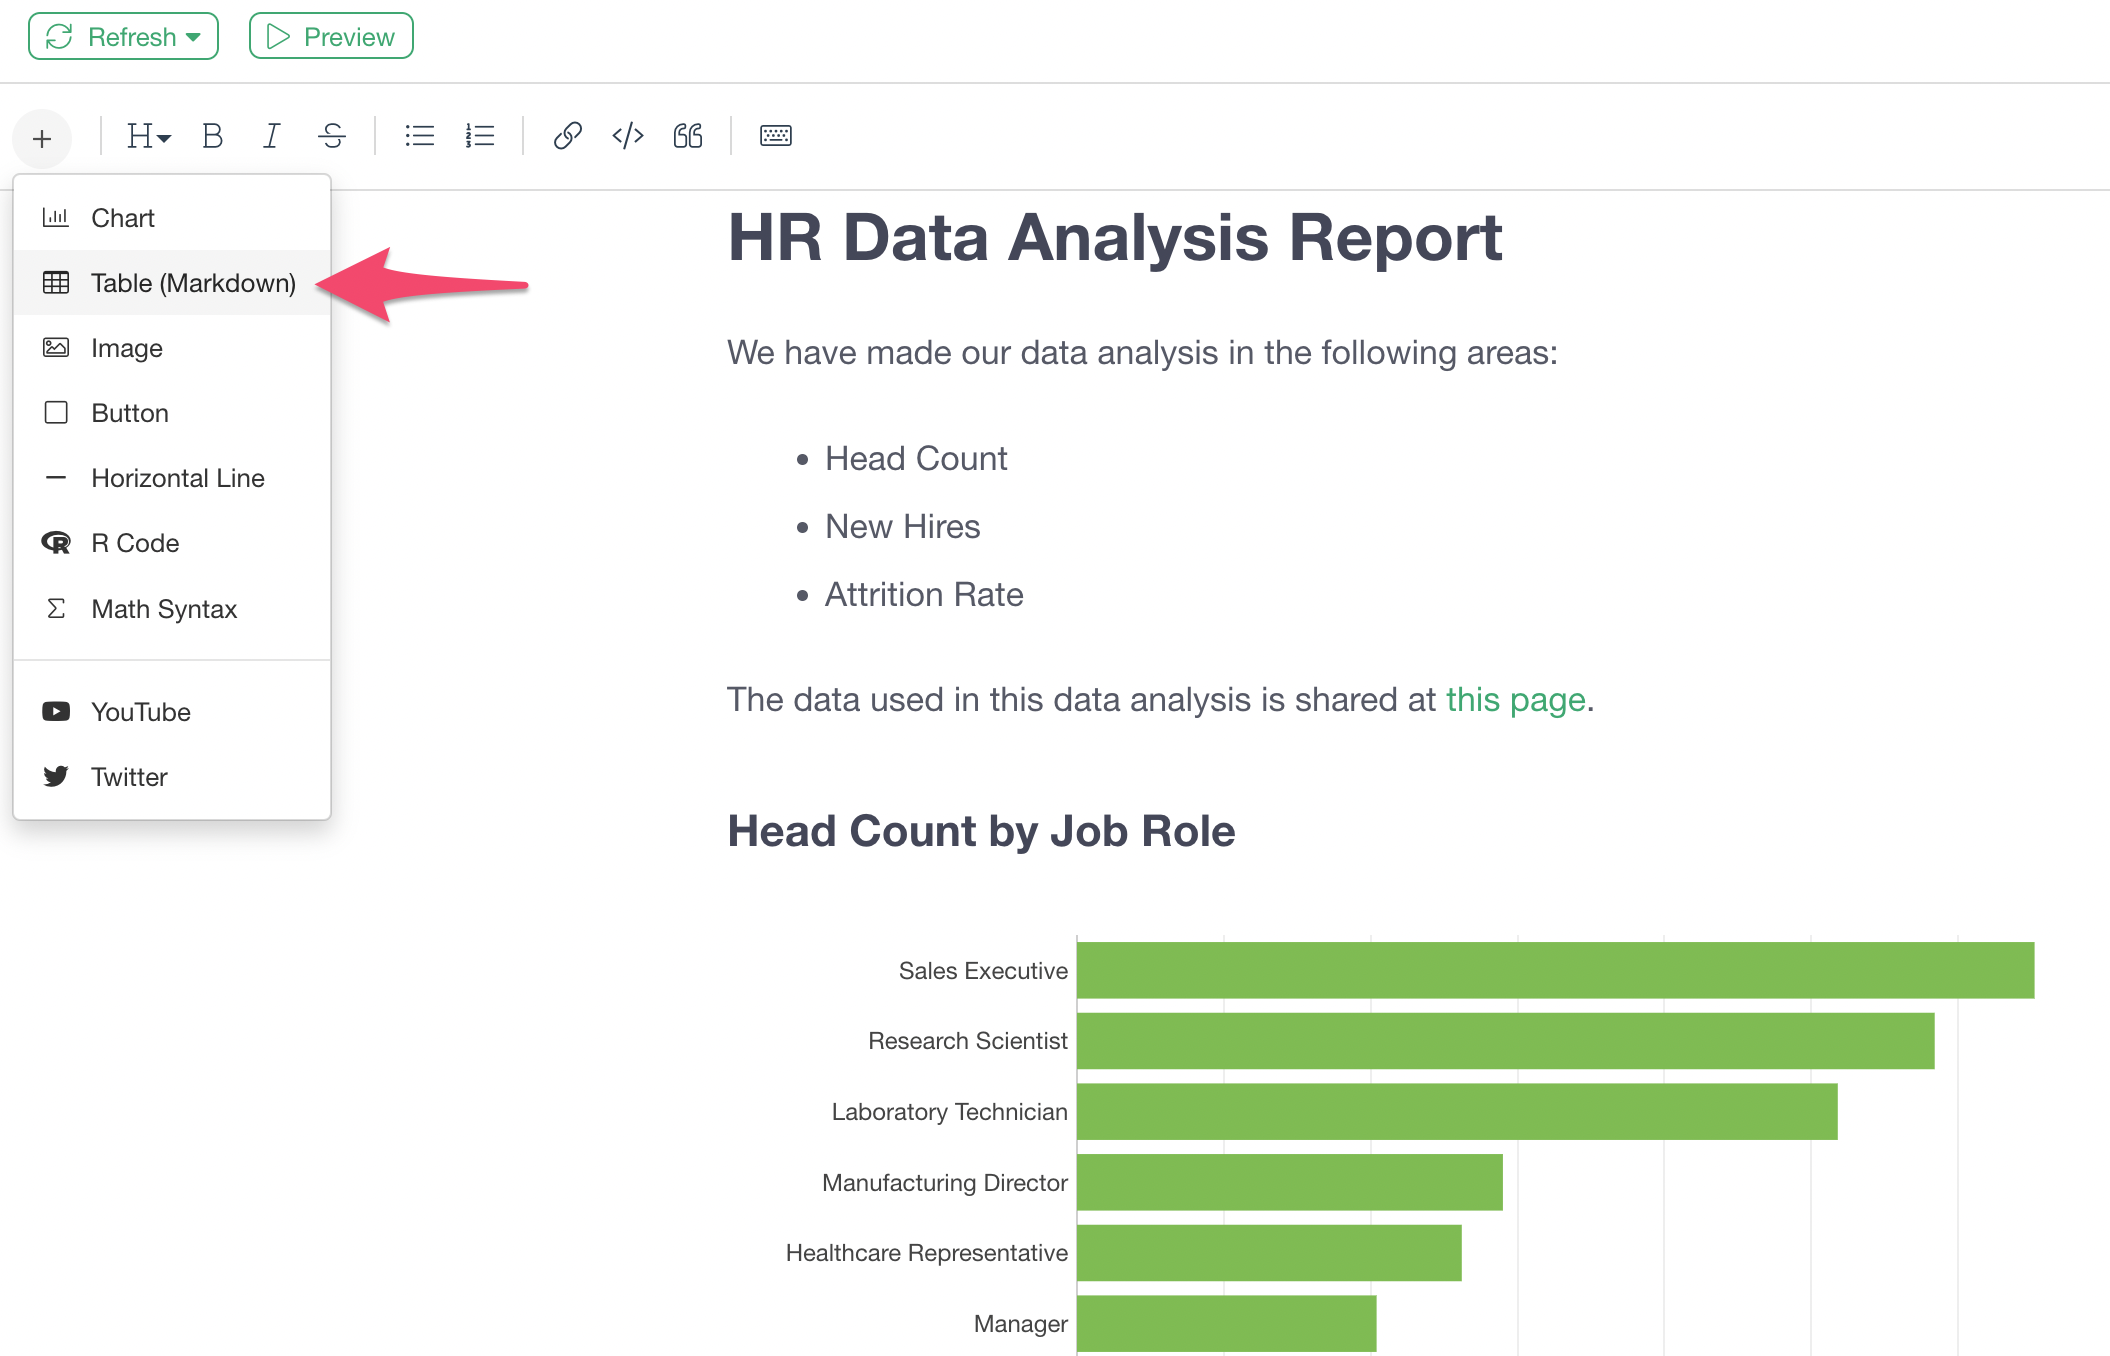
And type in whatever text you'd like.

You can click on the green area to delete a column or row.

And you can add a row or a column.

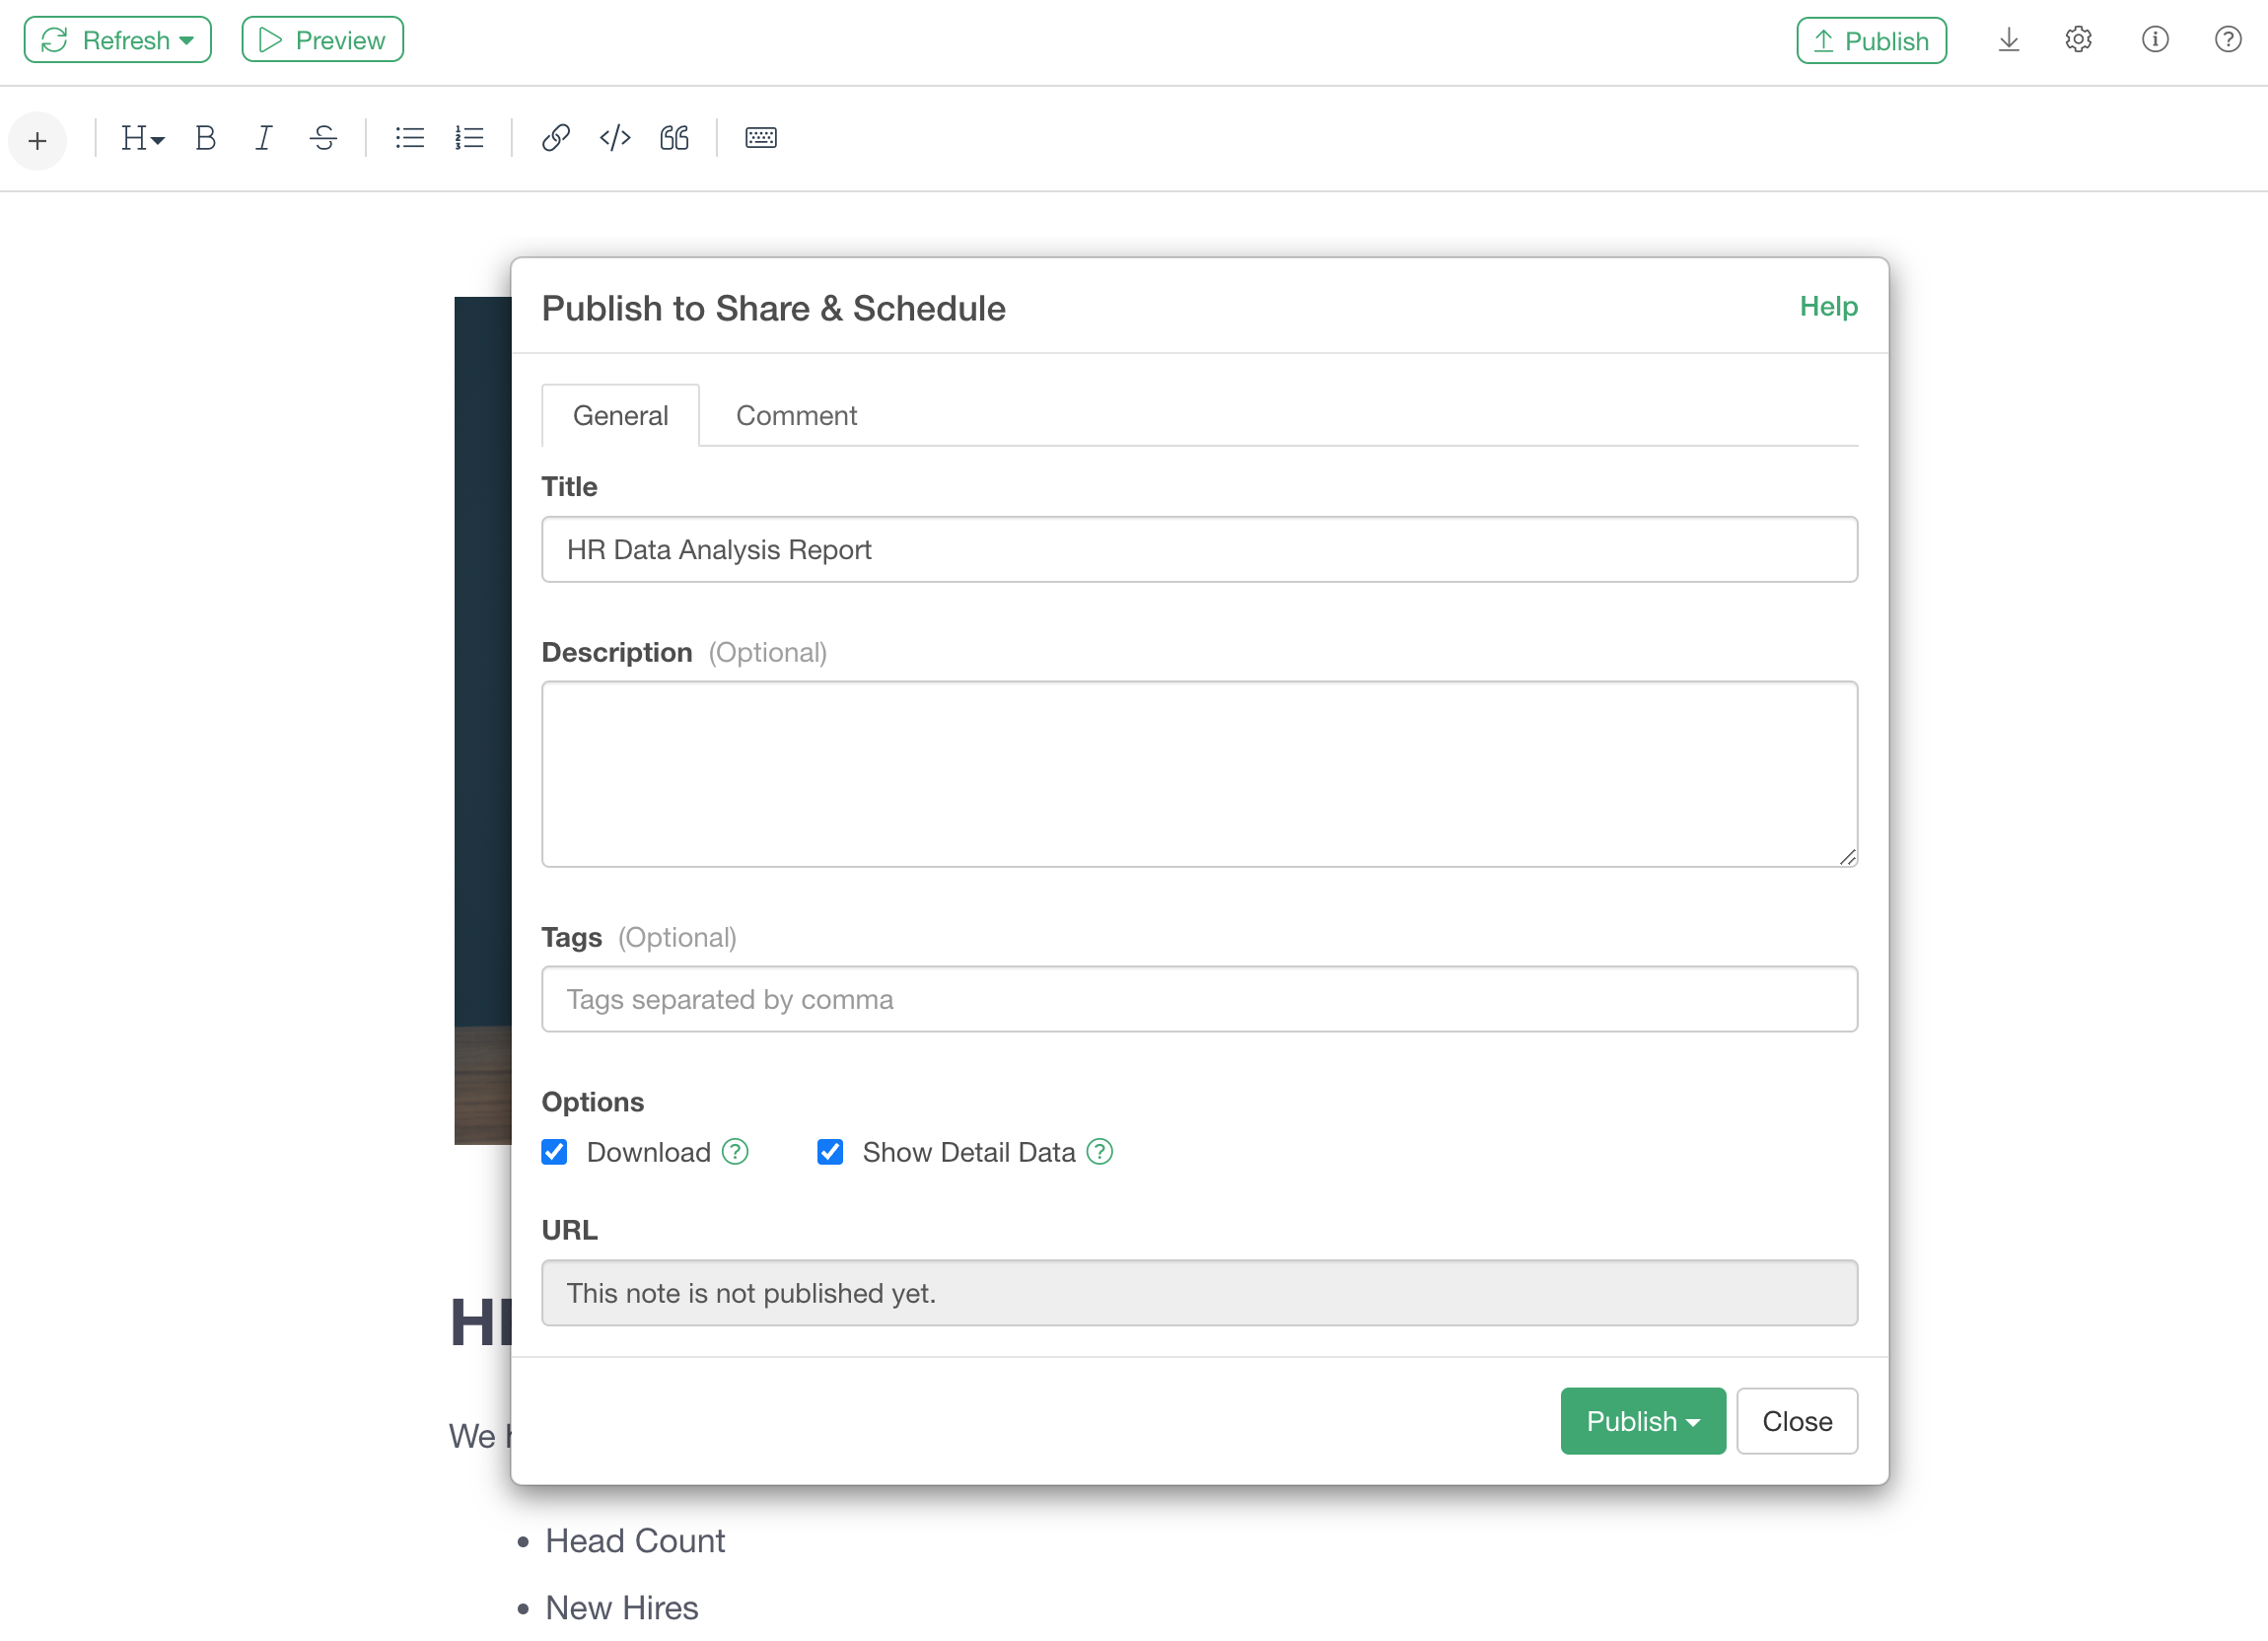
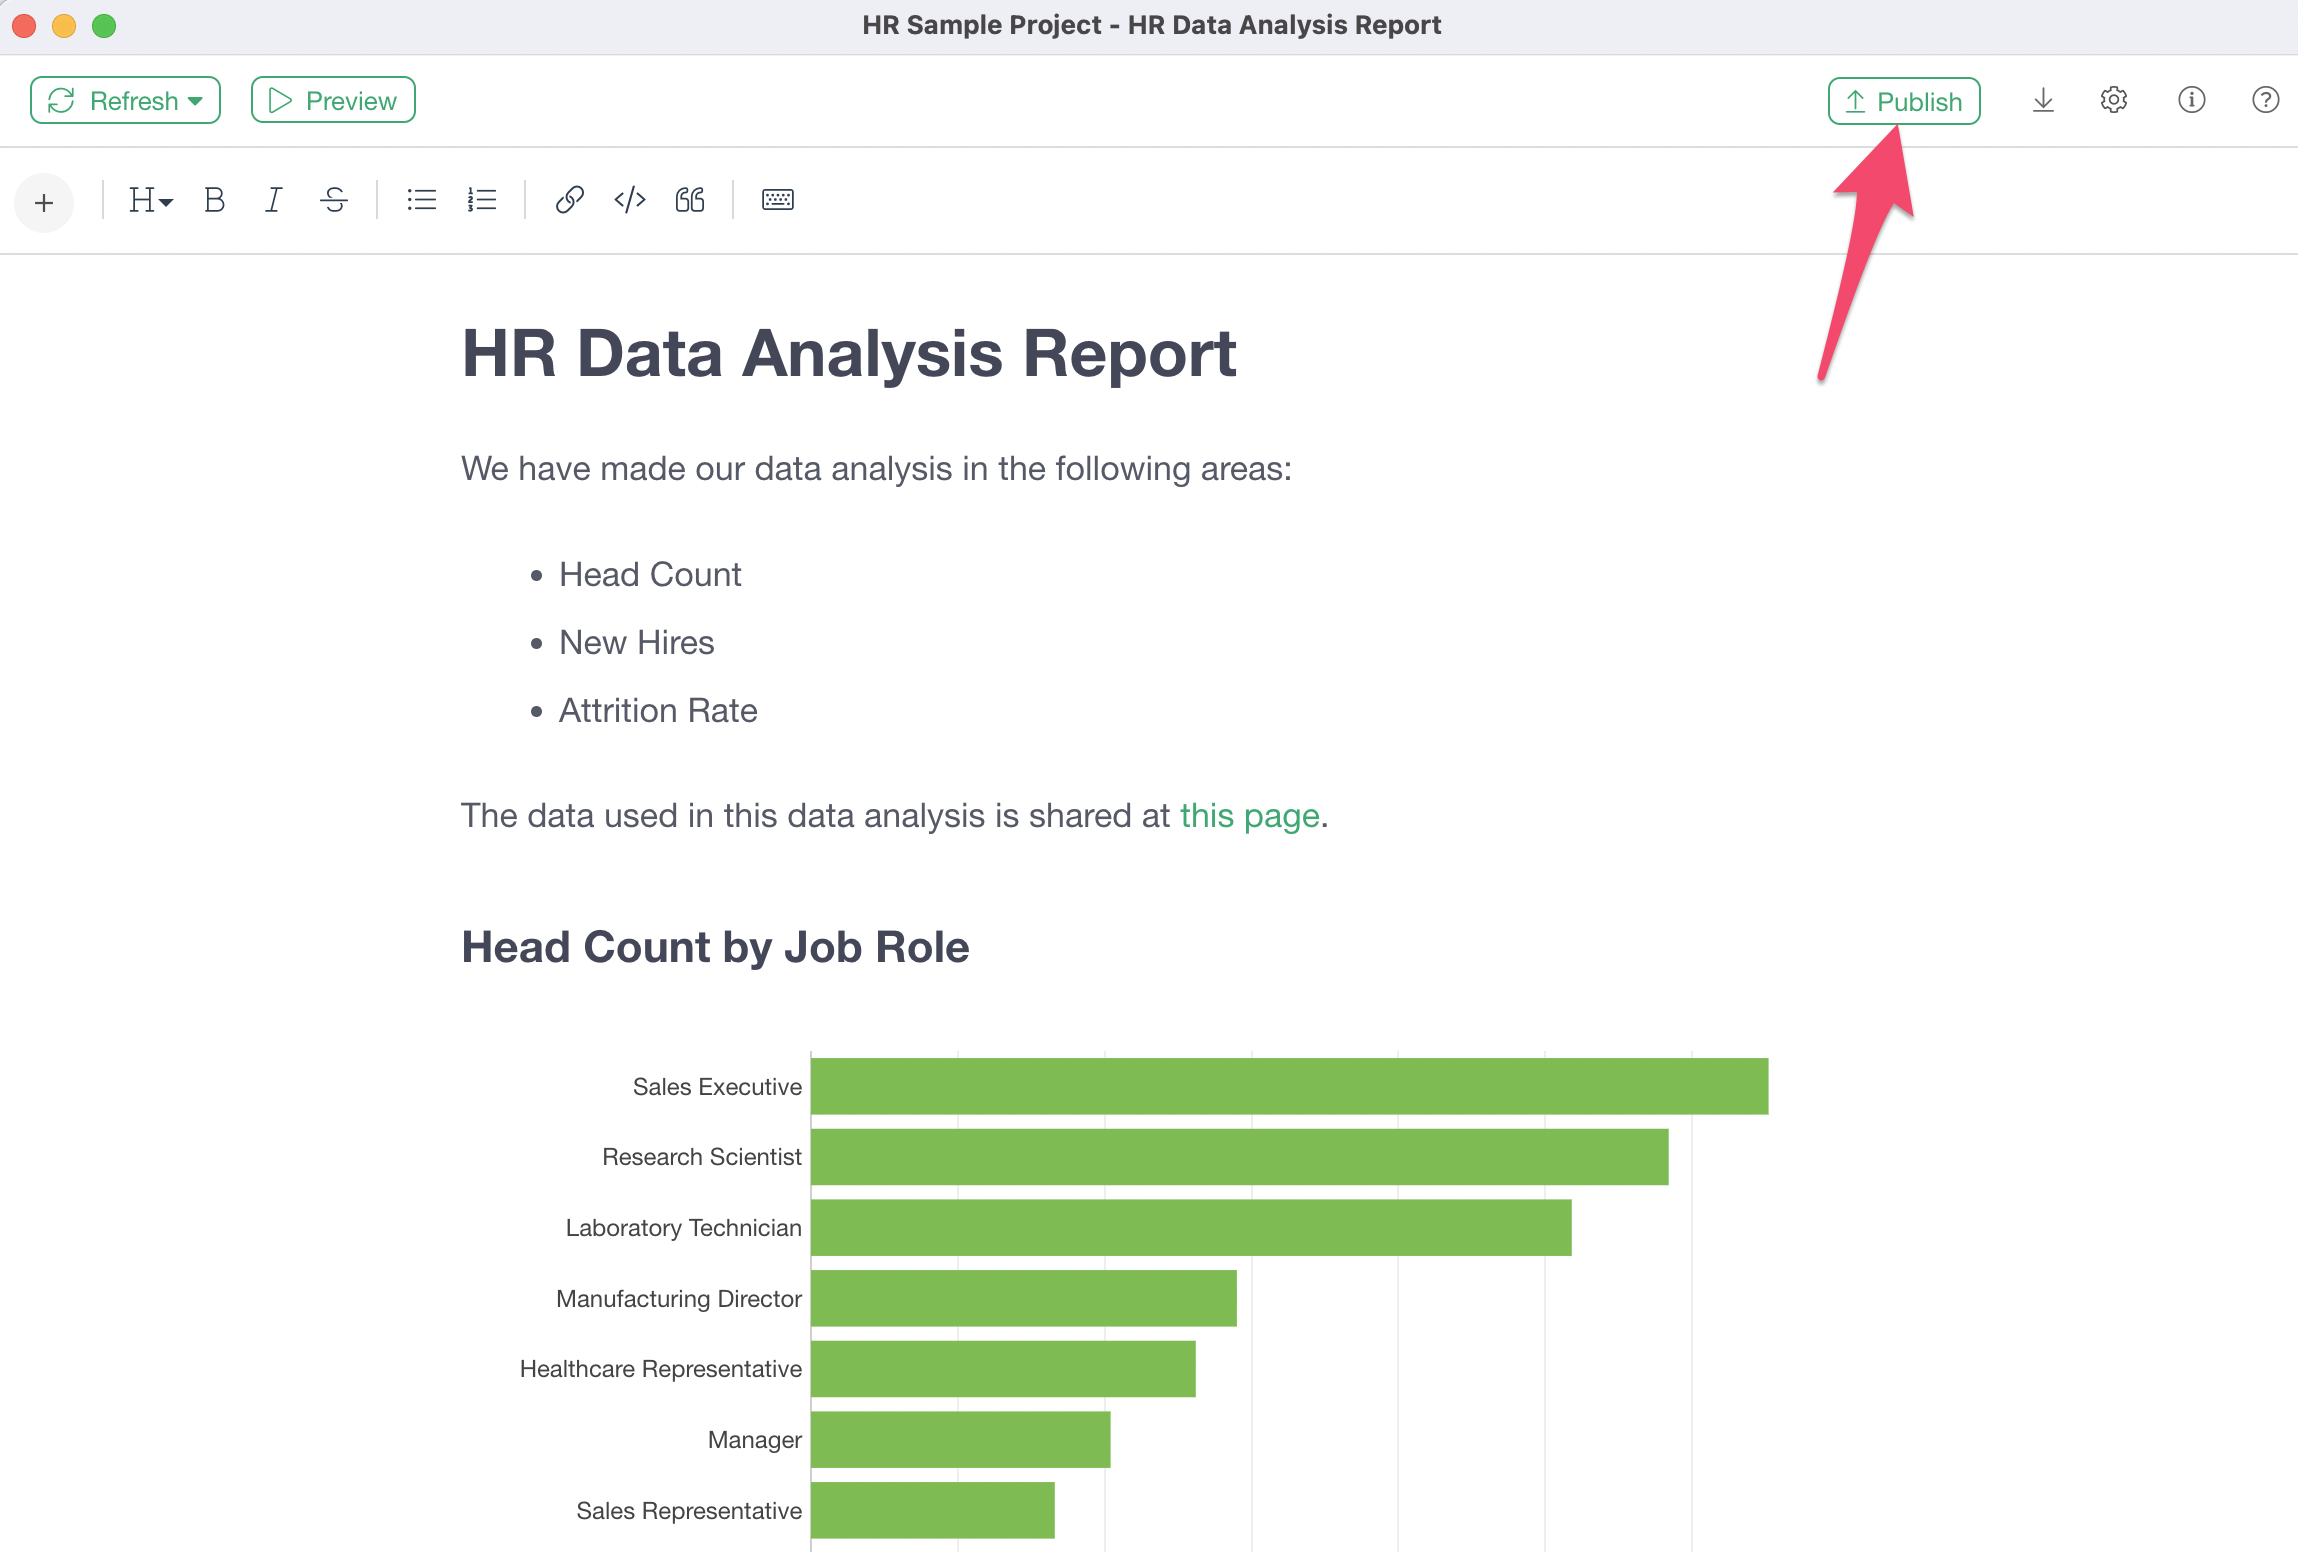 You can simply click on the Publish button to publish the Note you have created.