How to Create a Treemap
A treemap is a chart suitable for representing data with a hierarchical structure.
The area of each rectangle indicates the magnitude of the value, and by representing parent categories with similar colors, you can visually grasp the proportion of the parent category to the whole, as well as the proportion of child categories to the whole or the parent category.
It is particularly effective when you want to understand at a glance “which part occupies how much of the whole” at each hierarchy level, such as sales composition by category.
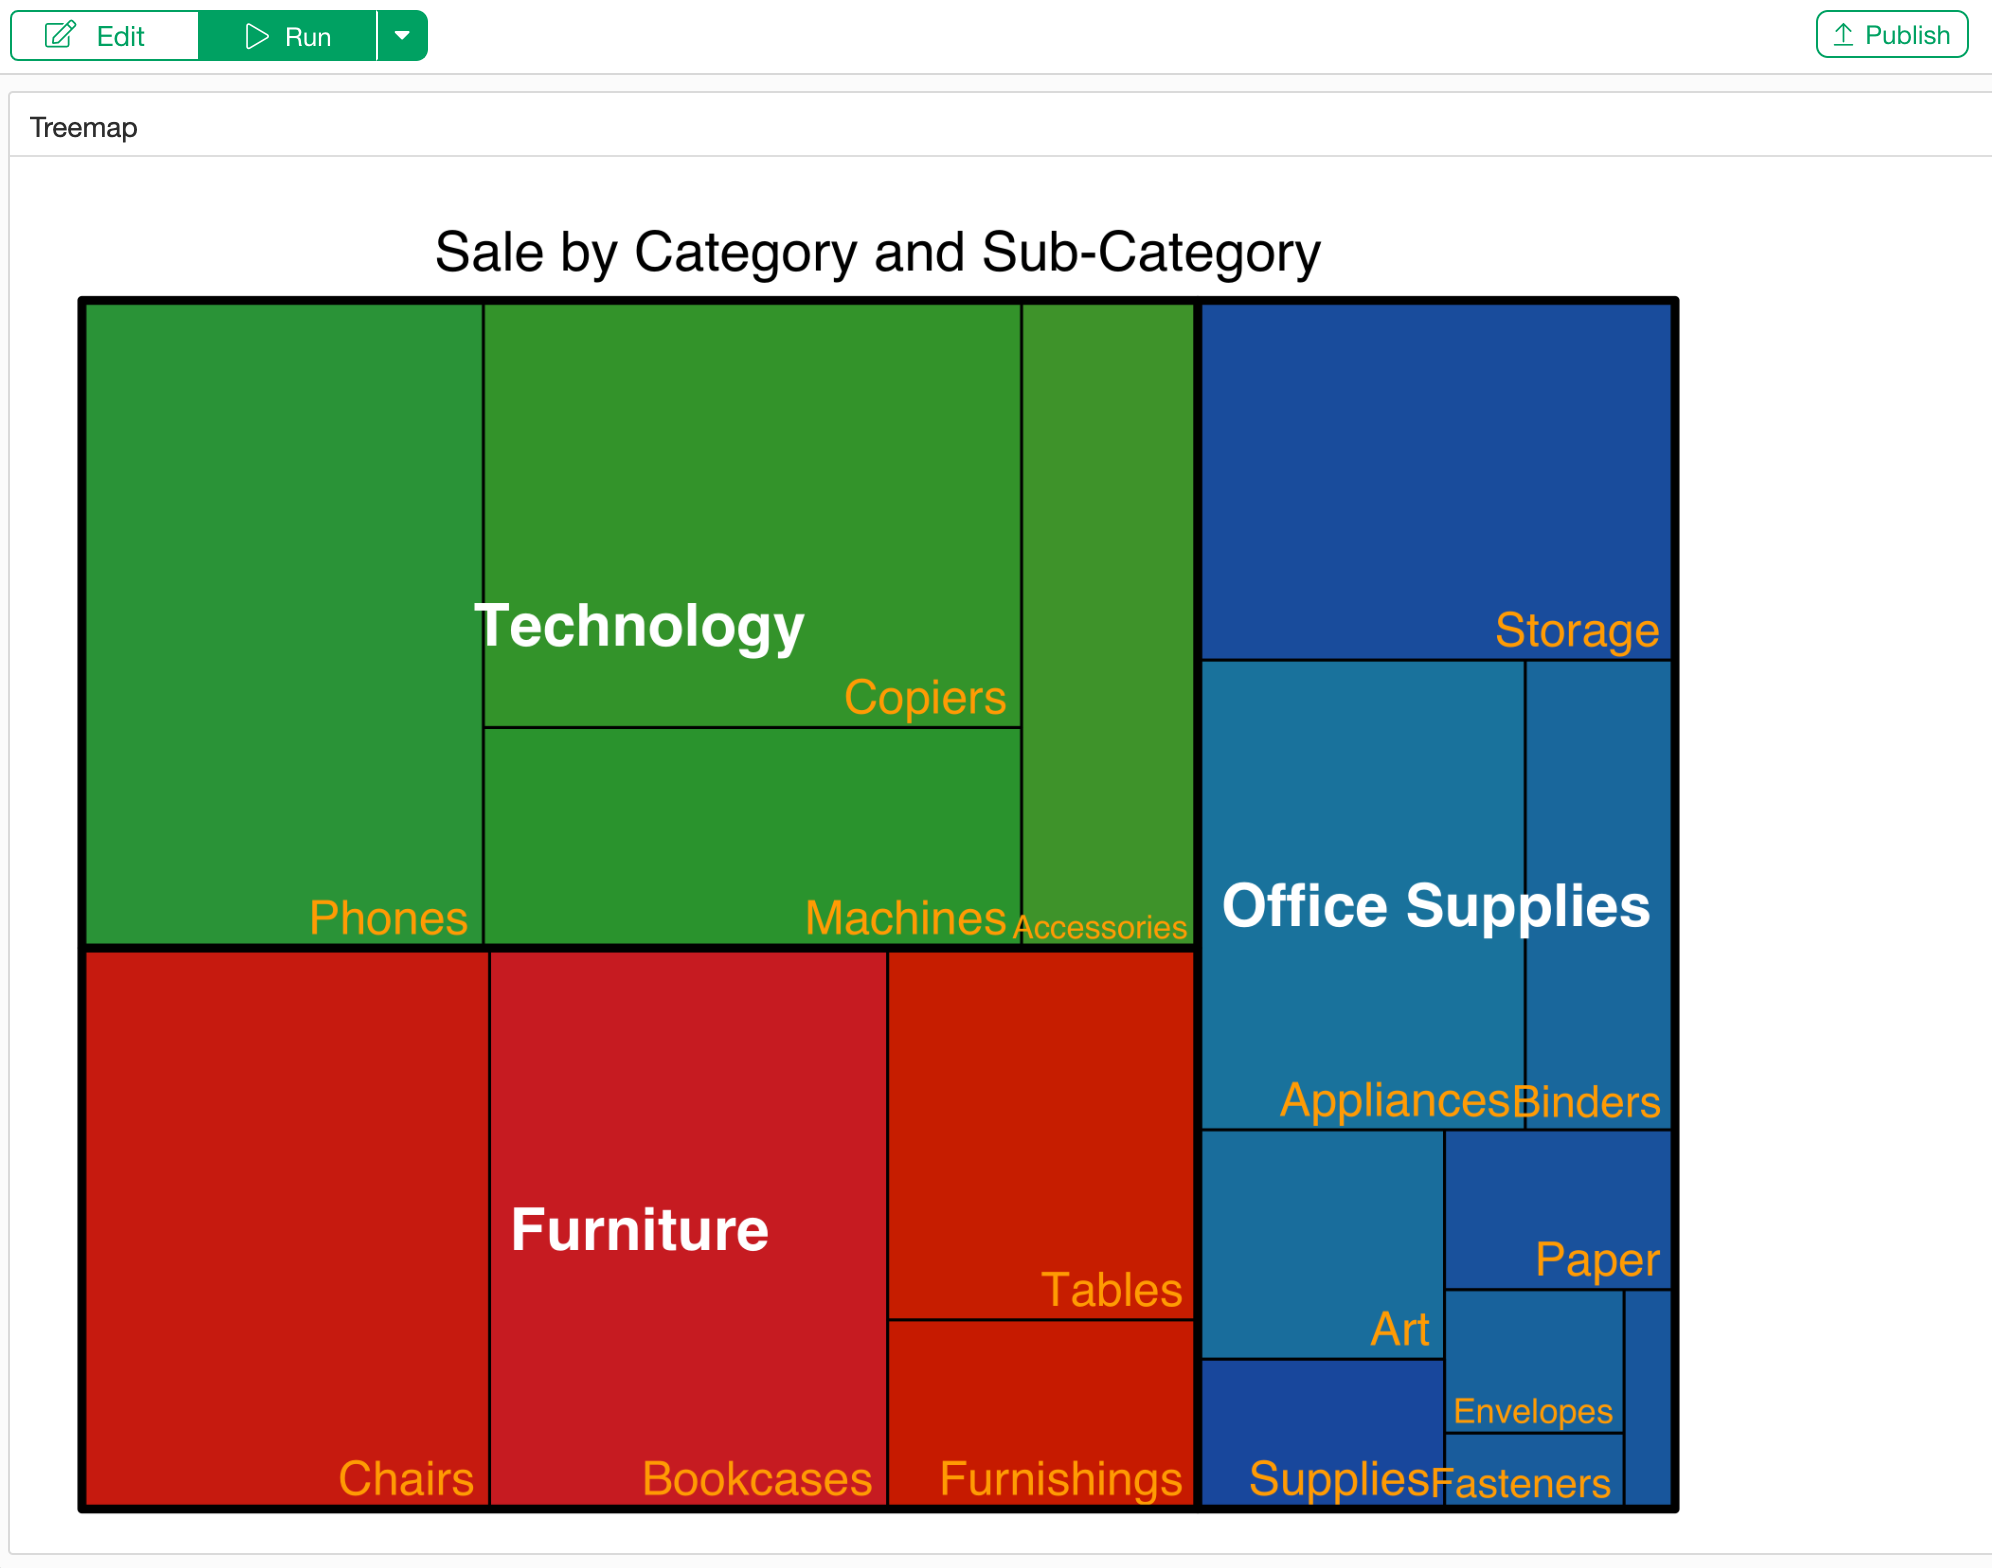
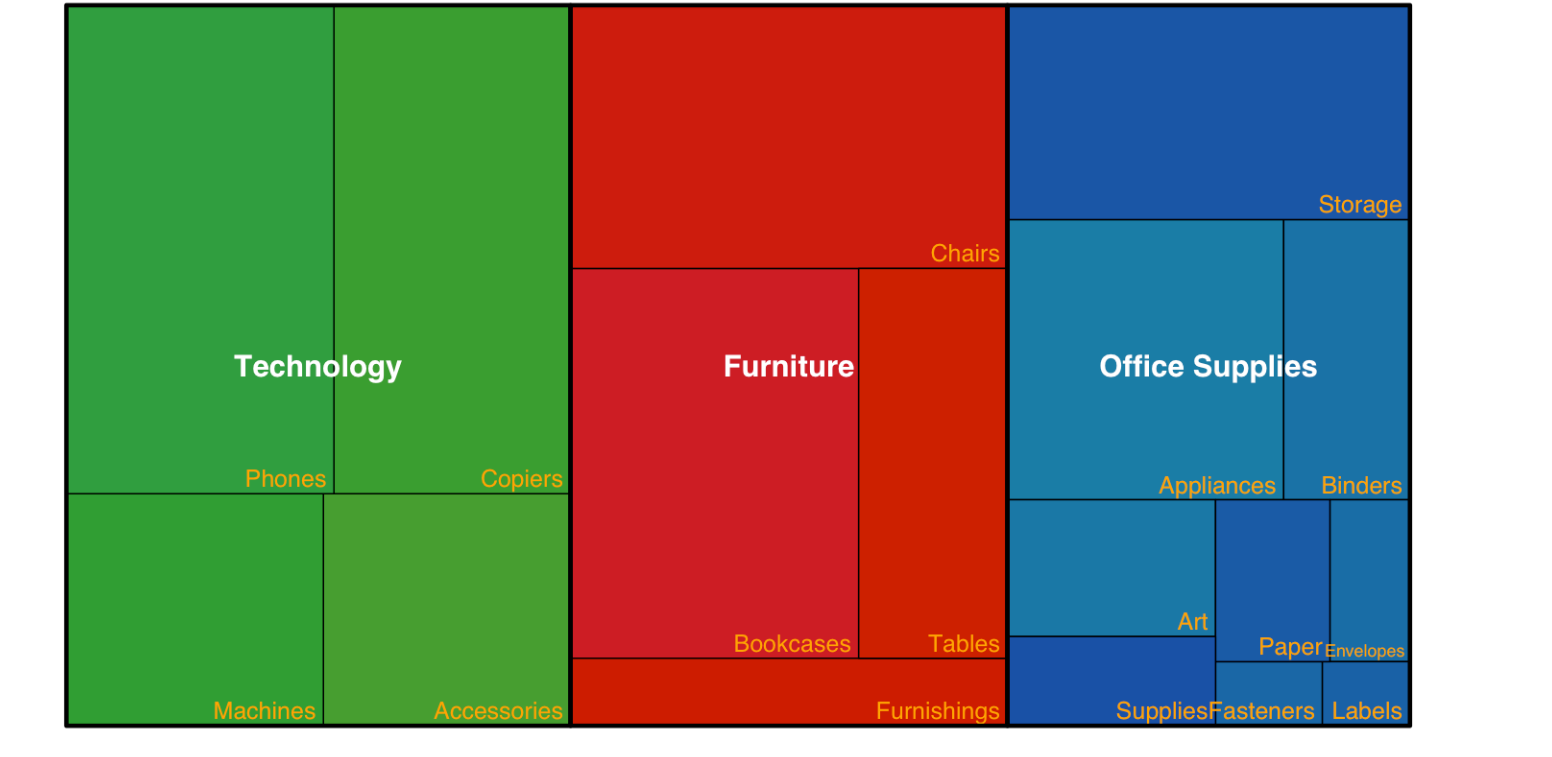
For example, the figure above shows sales data classified into categories and sub-categories using a treemap. The area of each rectangle represents the sales amount, and it can be seen that the larger the area, the higher the sales for that category.
Data Required for a Treemap
To create a treemap, you need aggregated data that has a hierarchical structure, such as Category and Sub-Category.
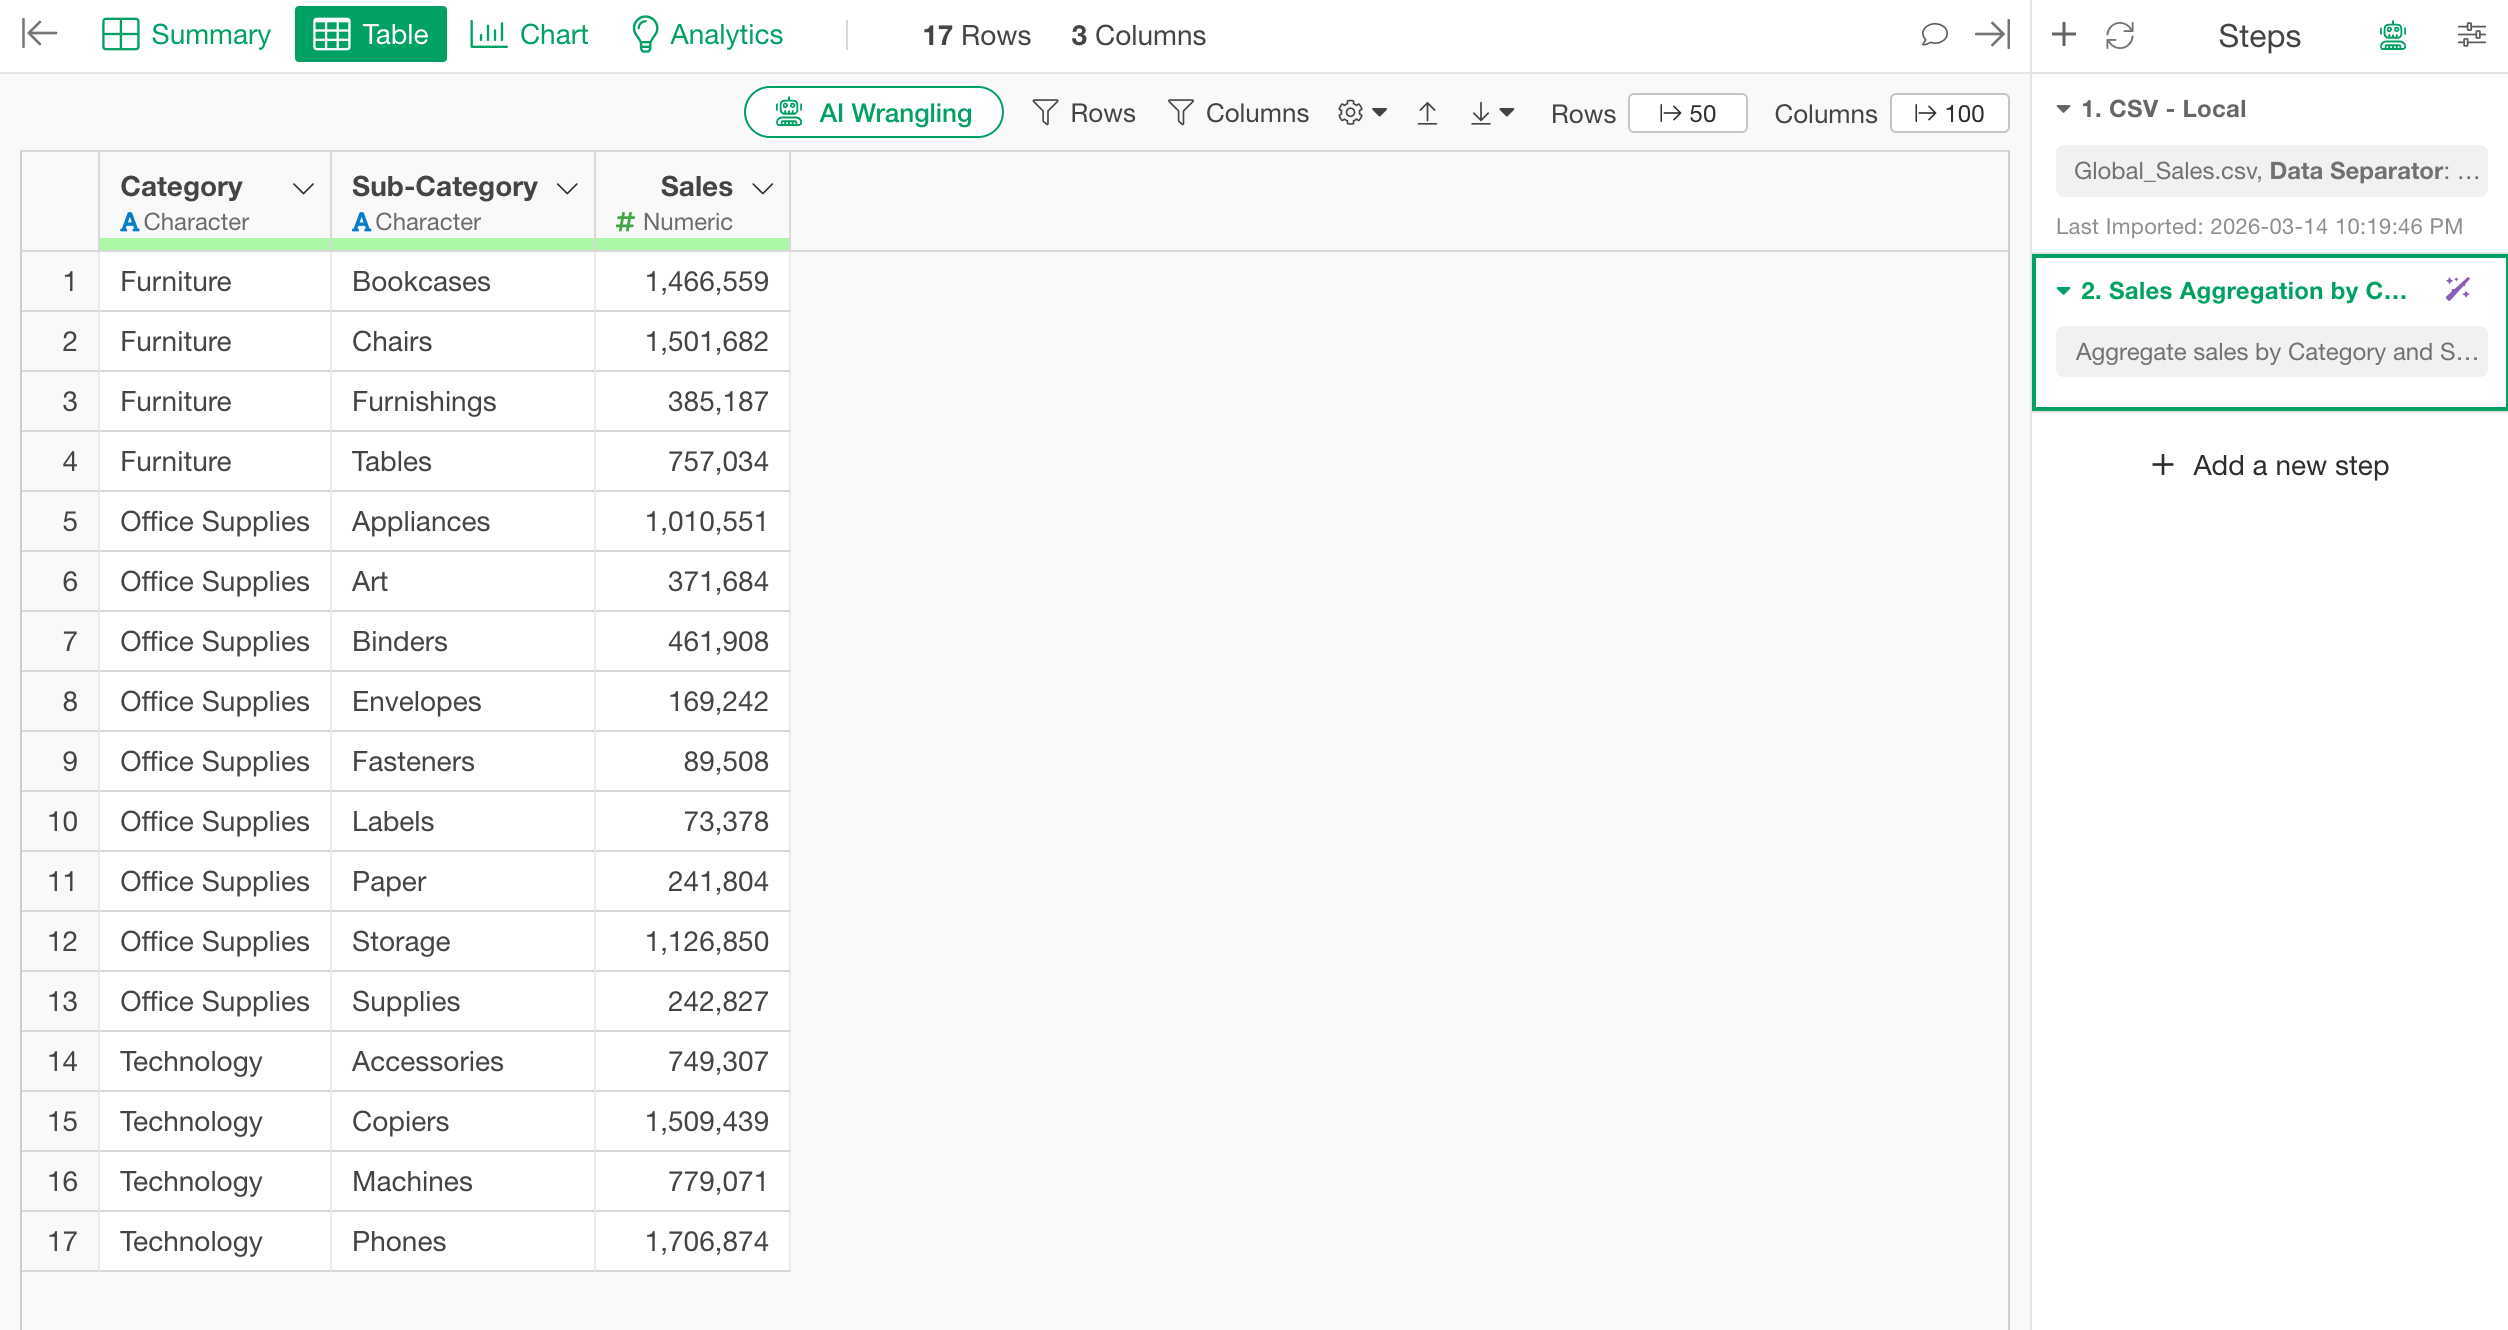
The above is aggregated sales data for each product sub-category, but such data is rarely available at hand. In many cases, it is common to have unaggregated data like the following.
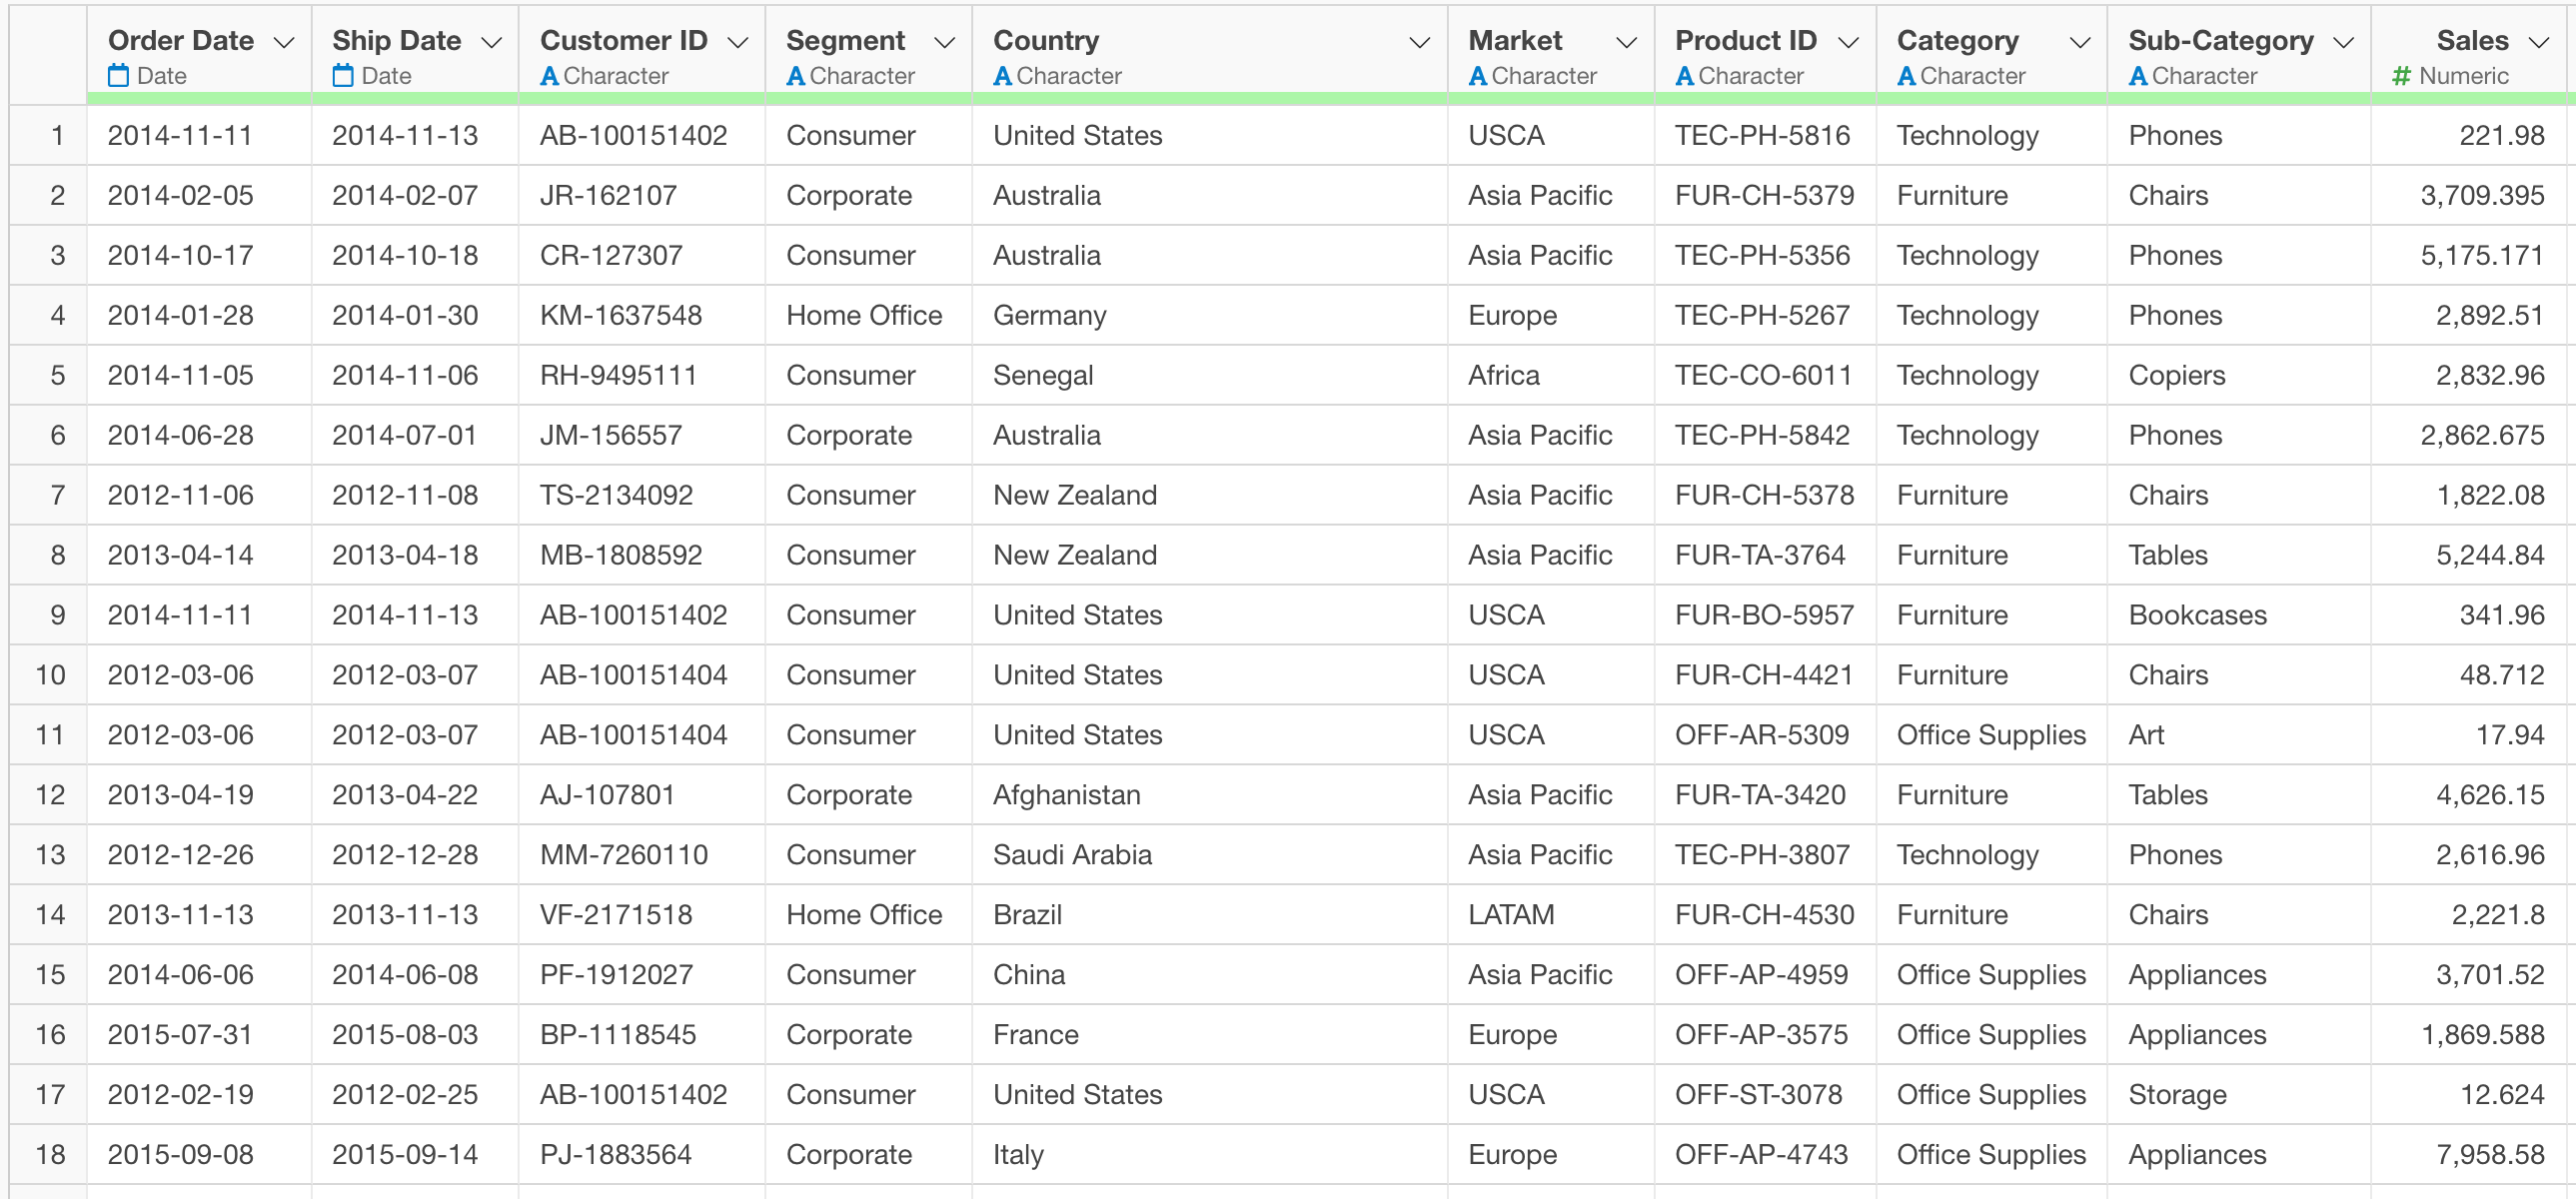
In such cases, it is necessary to aggregate the data.
Installing the treemap Library
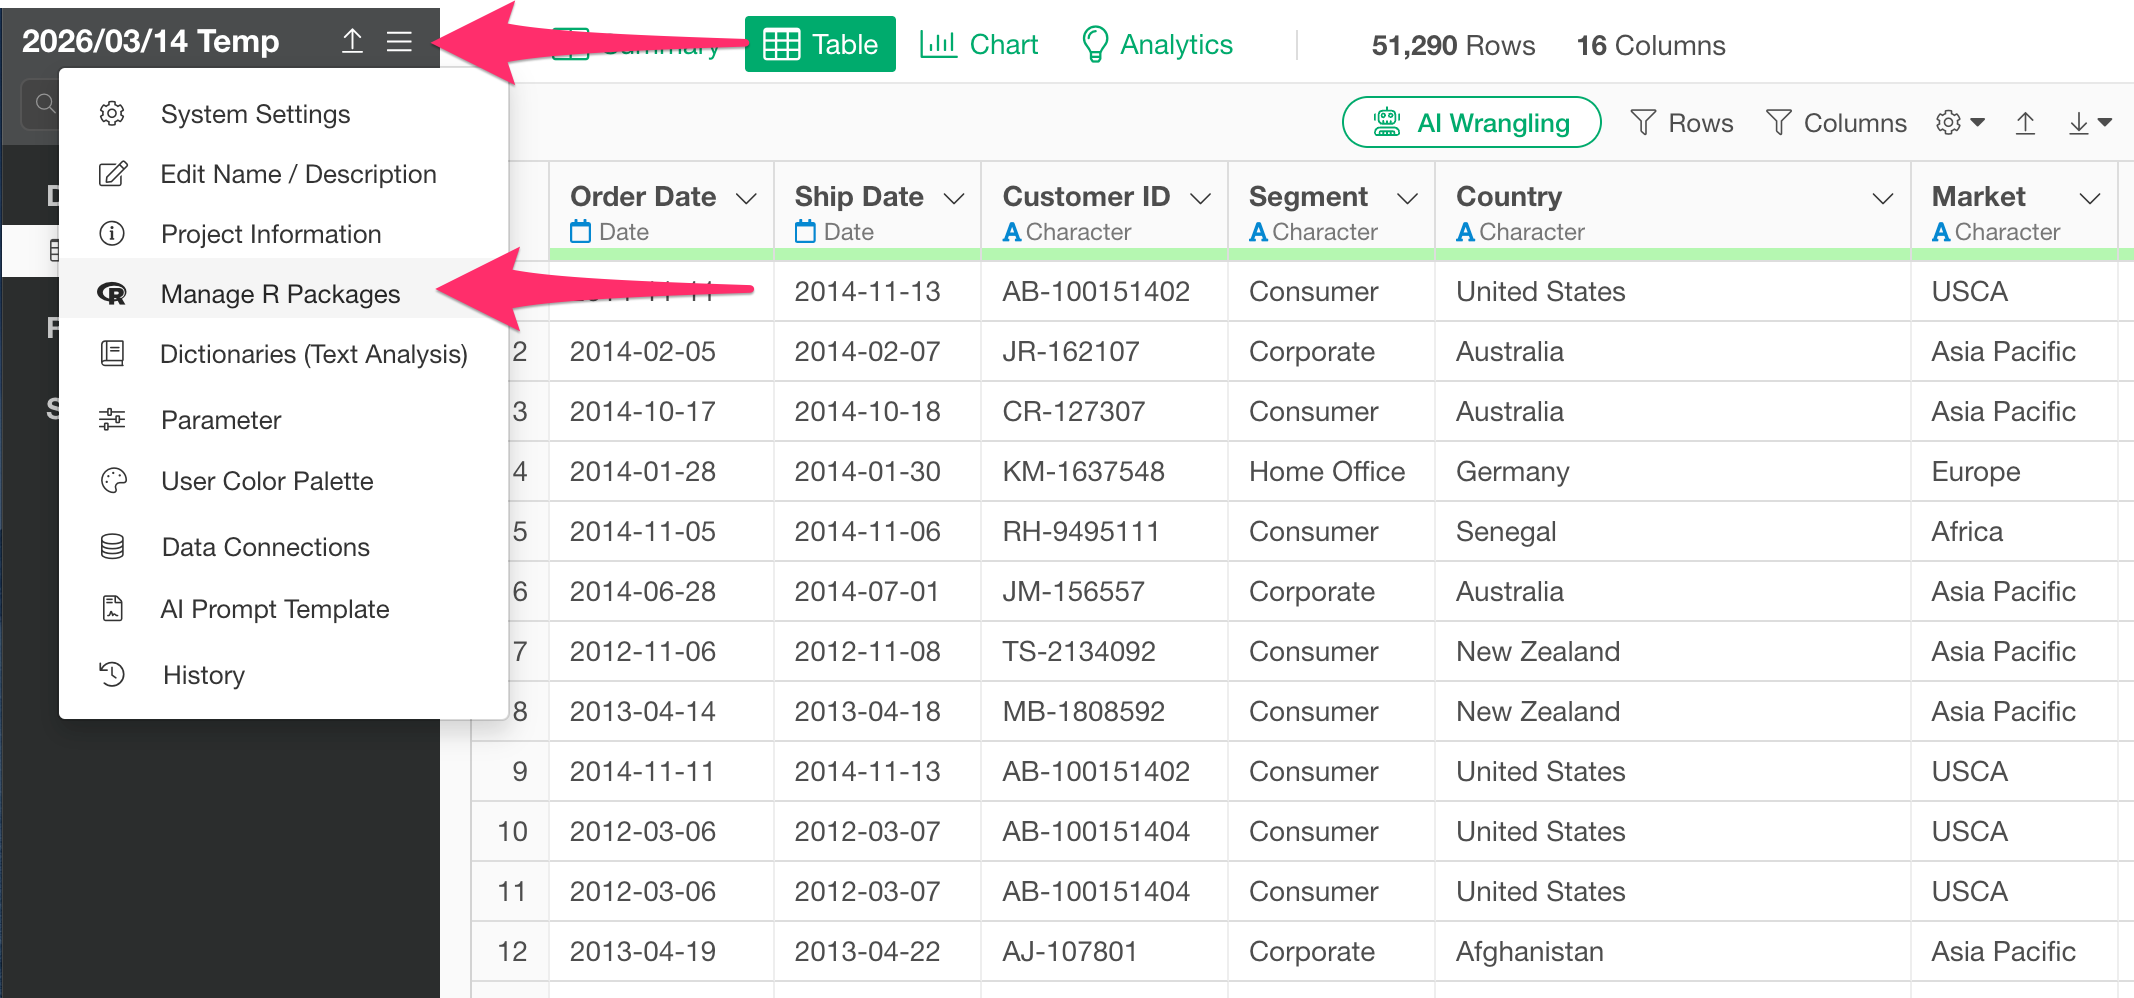
We will use the treemap library to create the treemap. From the project menu, select Manage R Packages.
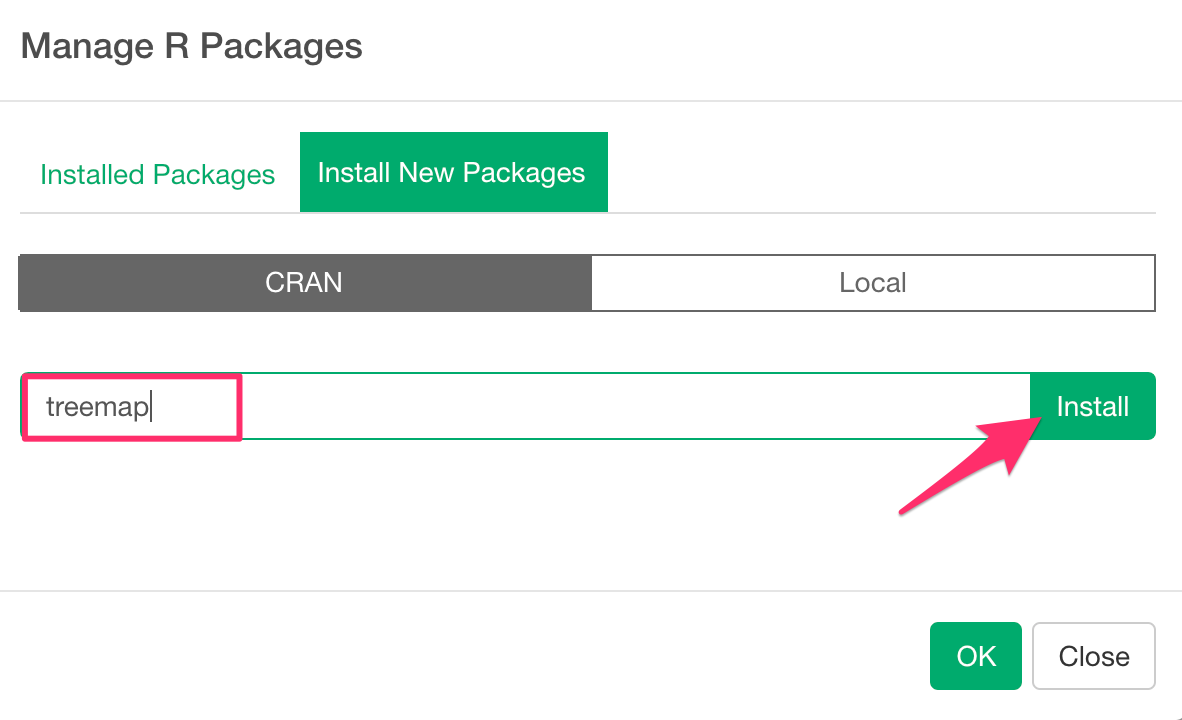
Next, type “treemap” in the text box and click the Install button.
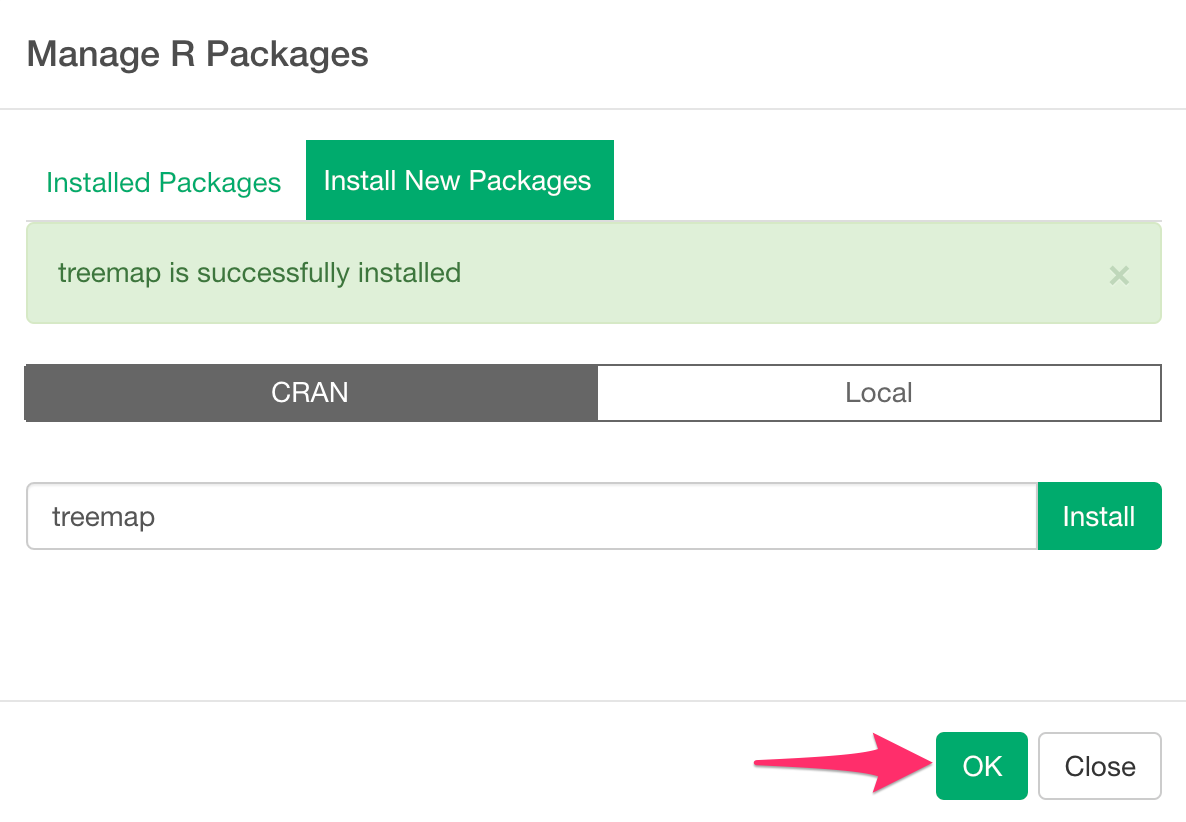
When the message “Package ‘treemap’ is successfully installed” appears, click the OK button.
Now you are ready to create a treemap.
Creating a Treemap
In this example, we will use data where each row represents one order to create a treemap regarding sales for product categories and product sub-categories.
You can download the sample data from here.
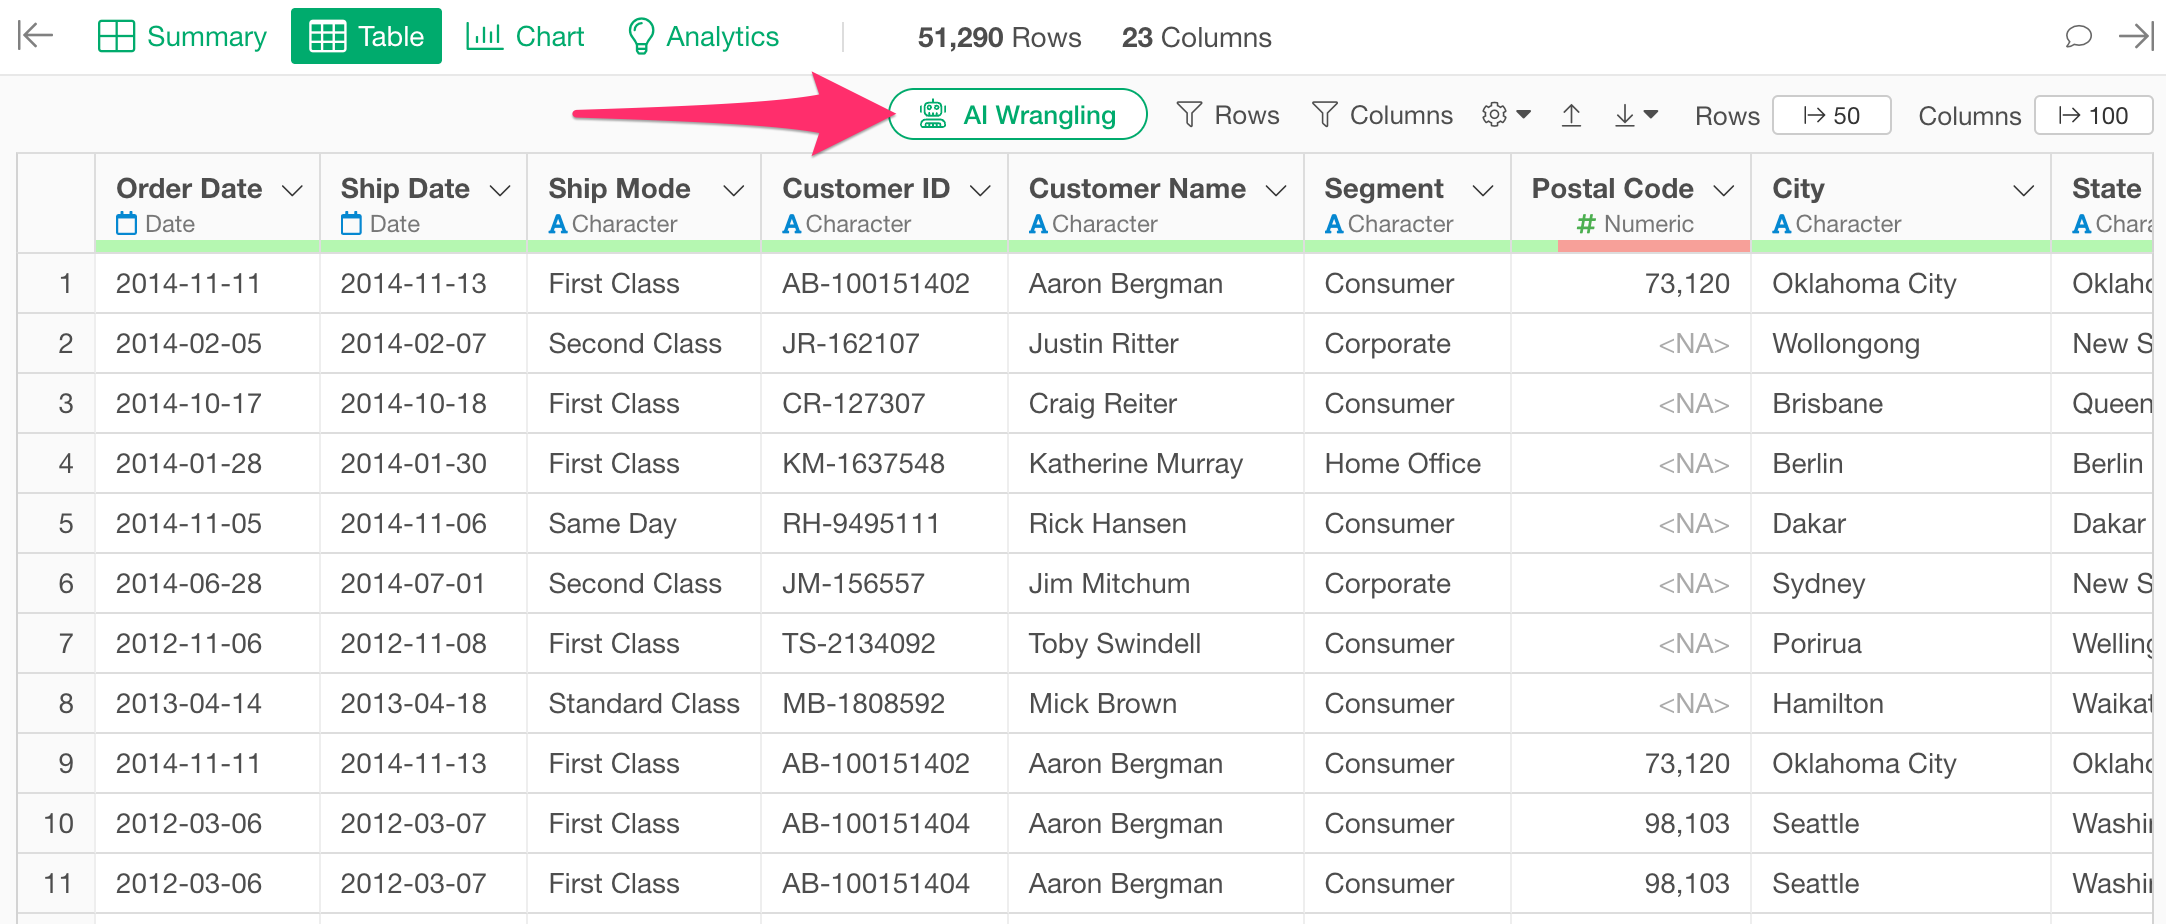
First, since this data is unaggregated, we will aggregate the sales for each product sub-category along with the product category information.
Select the AI Wrangling button at the top of the screen.
When the AI prompt input field appears, execute a prompt like the following:
Aggregate Sales by Category and Sub-category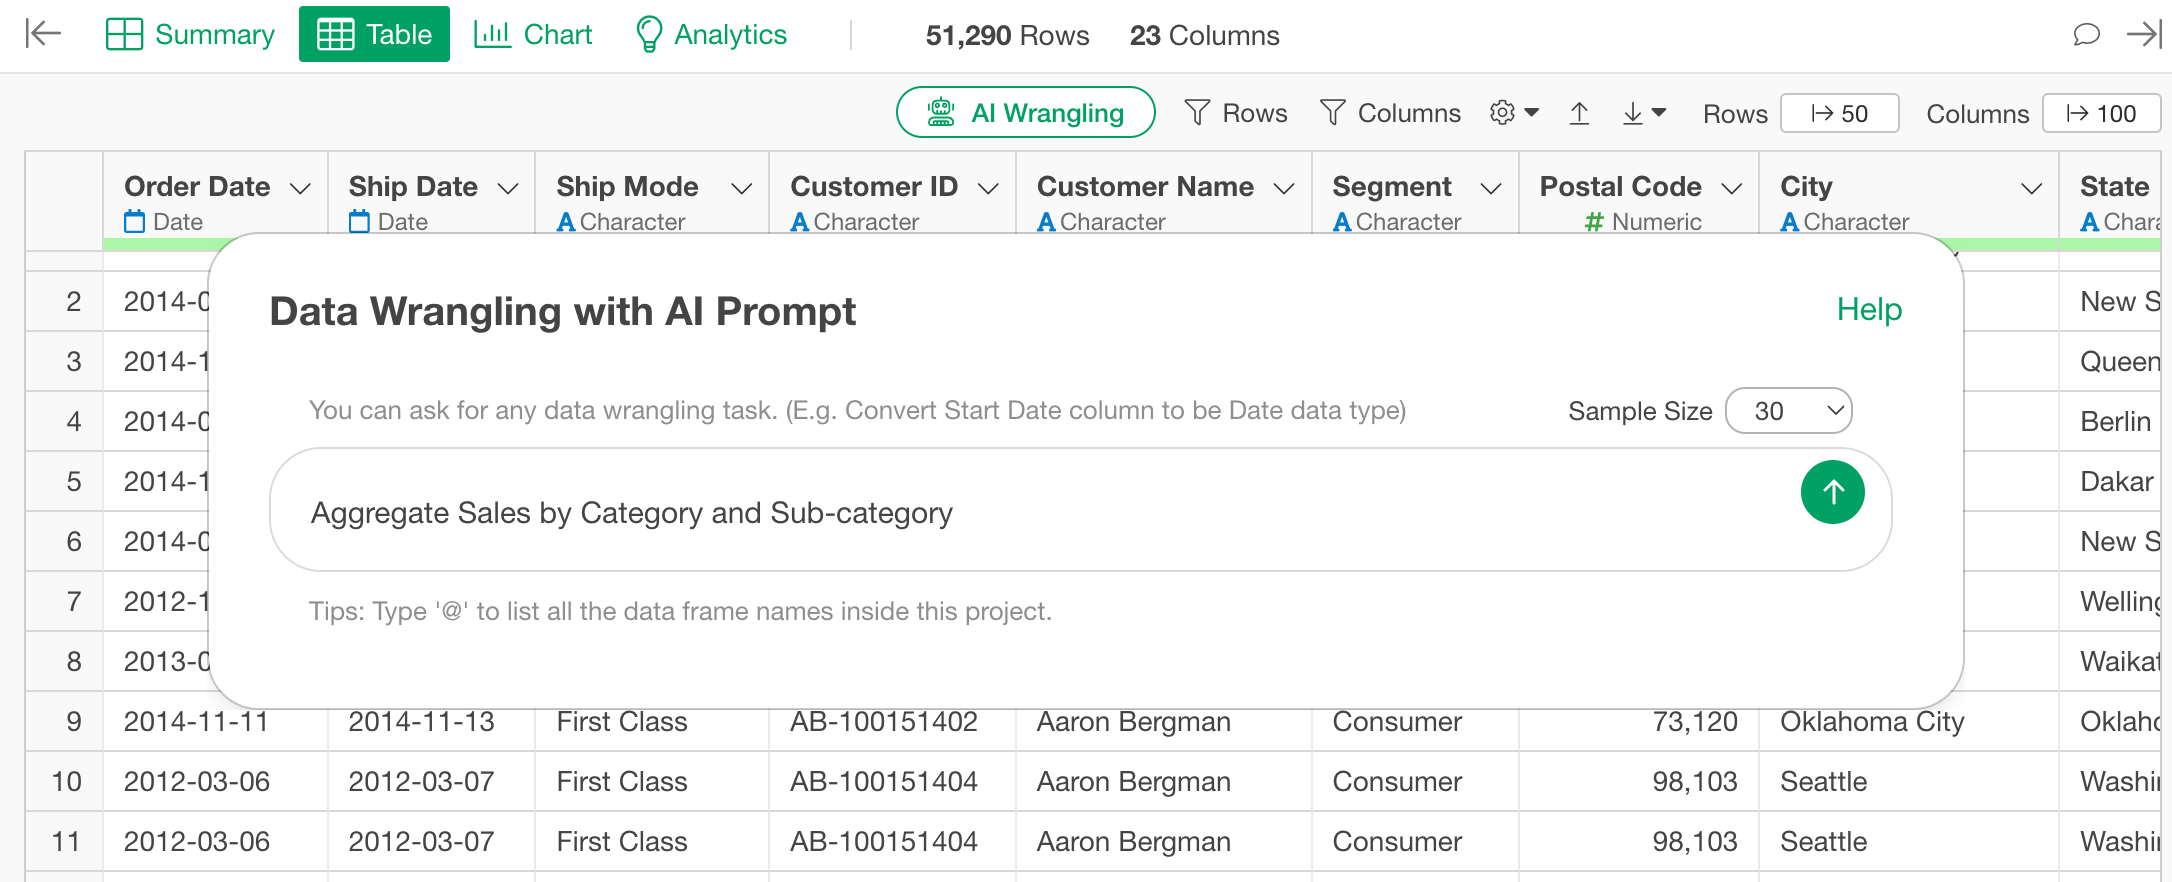
When you execute the prompt, R code will be generated. Check the content and click the “Run as Step” button.
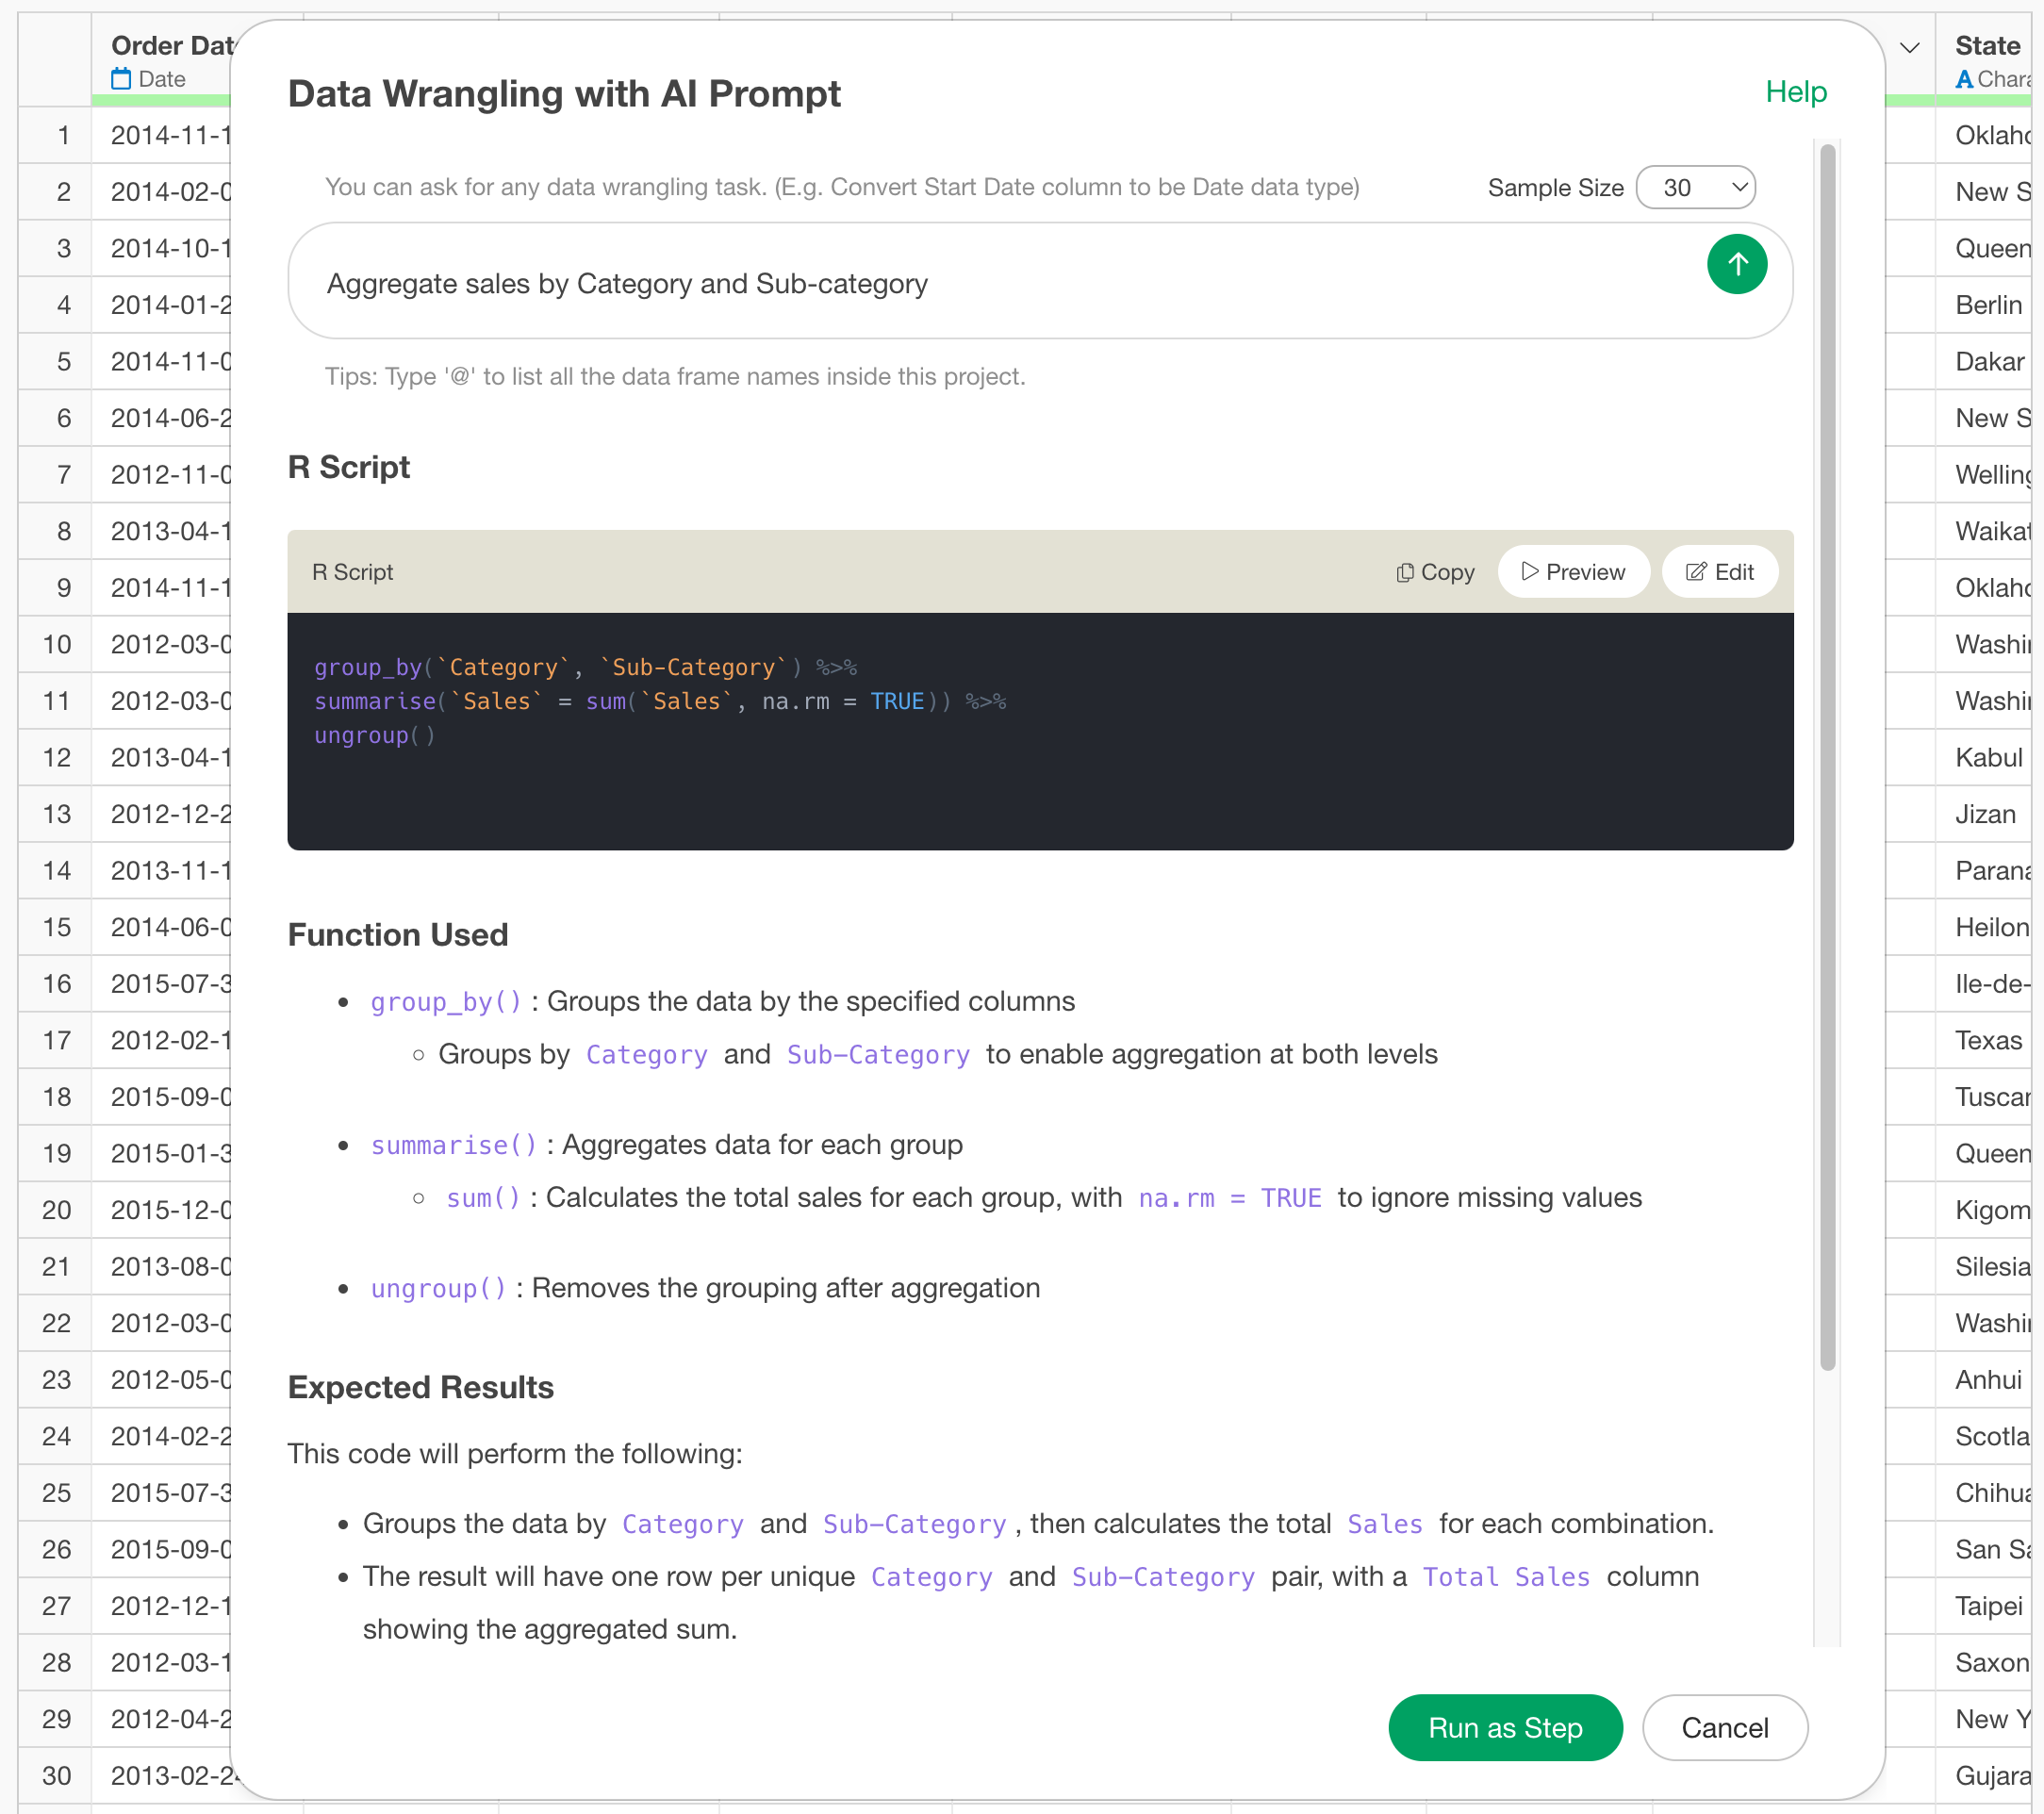
Now the data for the treemap has been created.
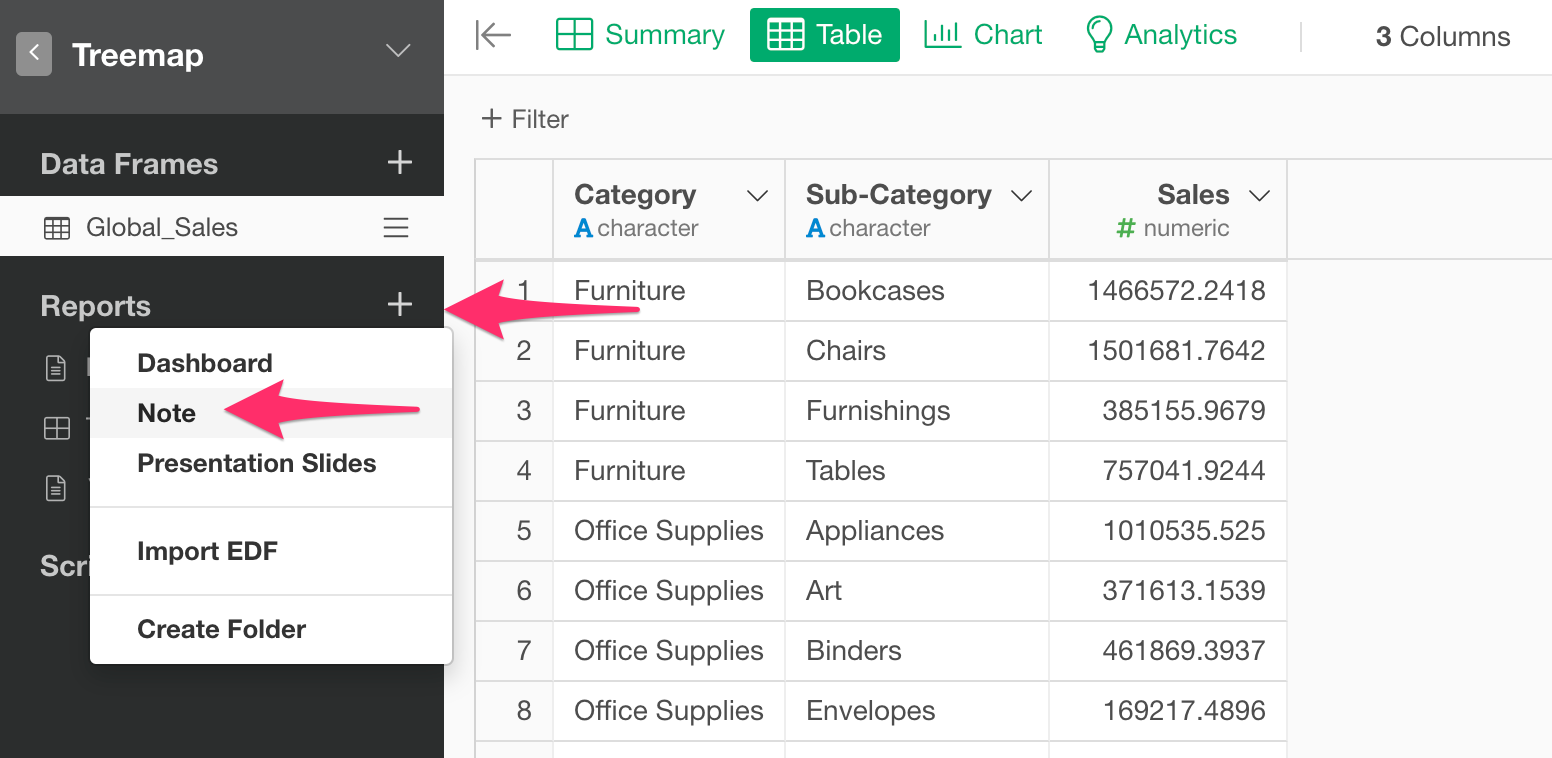
Using this aggregated data, we will now create a treemap on a Note.
Select the Add Report button and click “Create Note”.
When the Note appears, add “R Script” content.
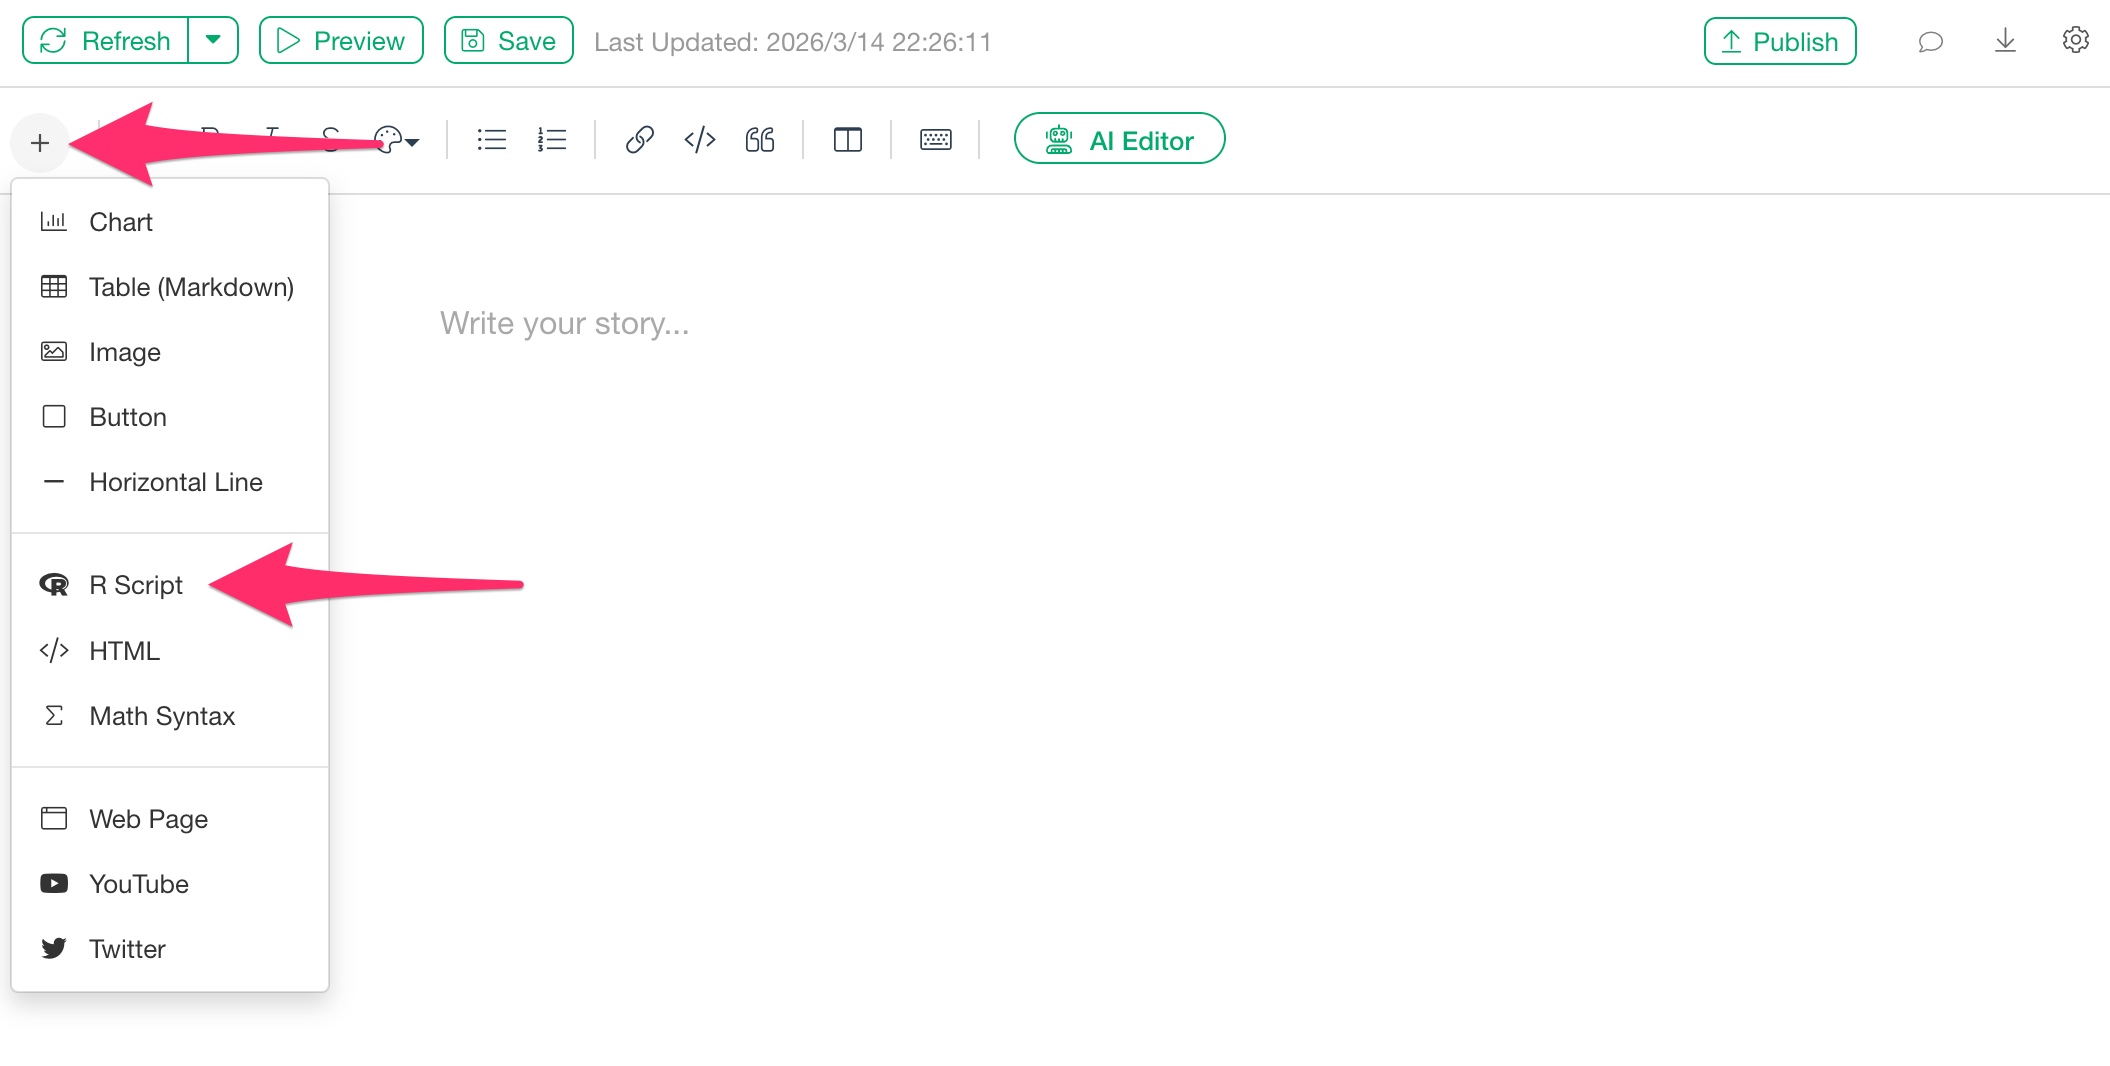
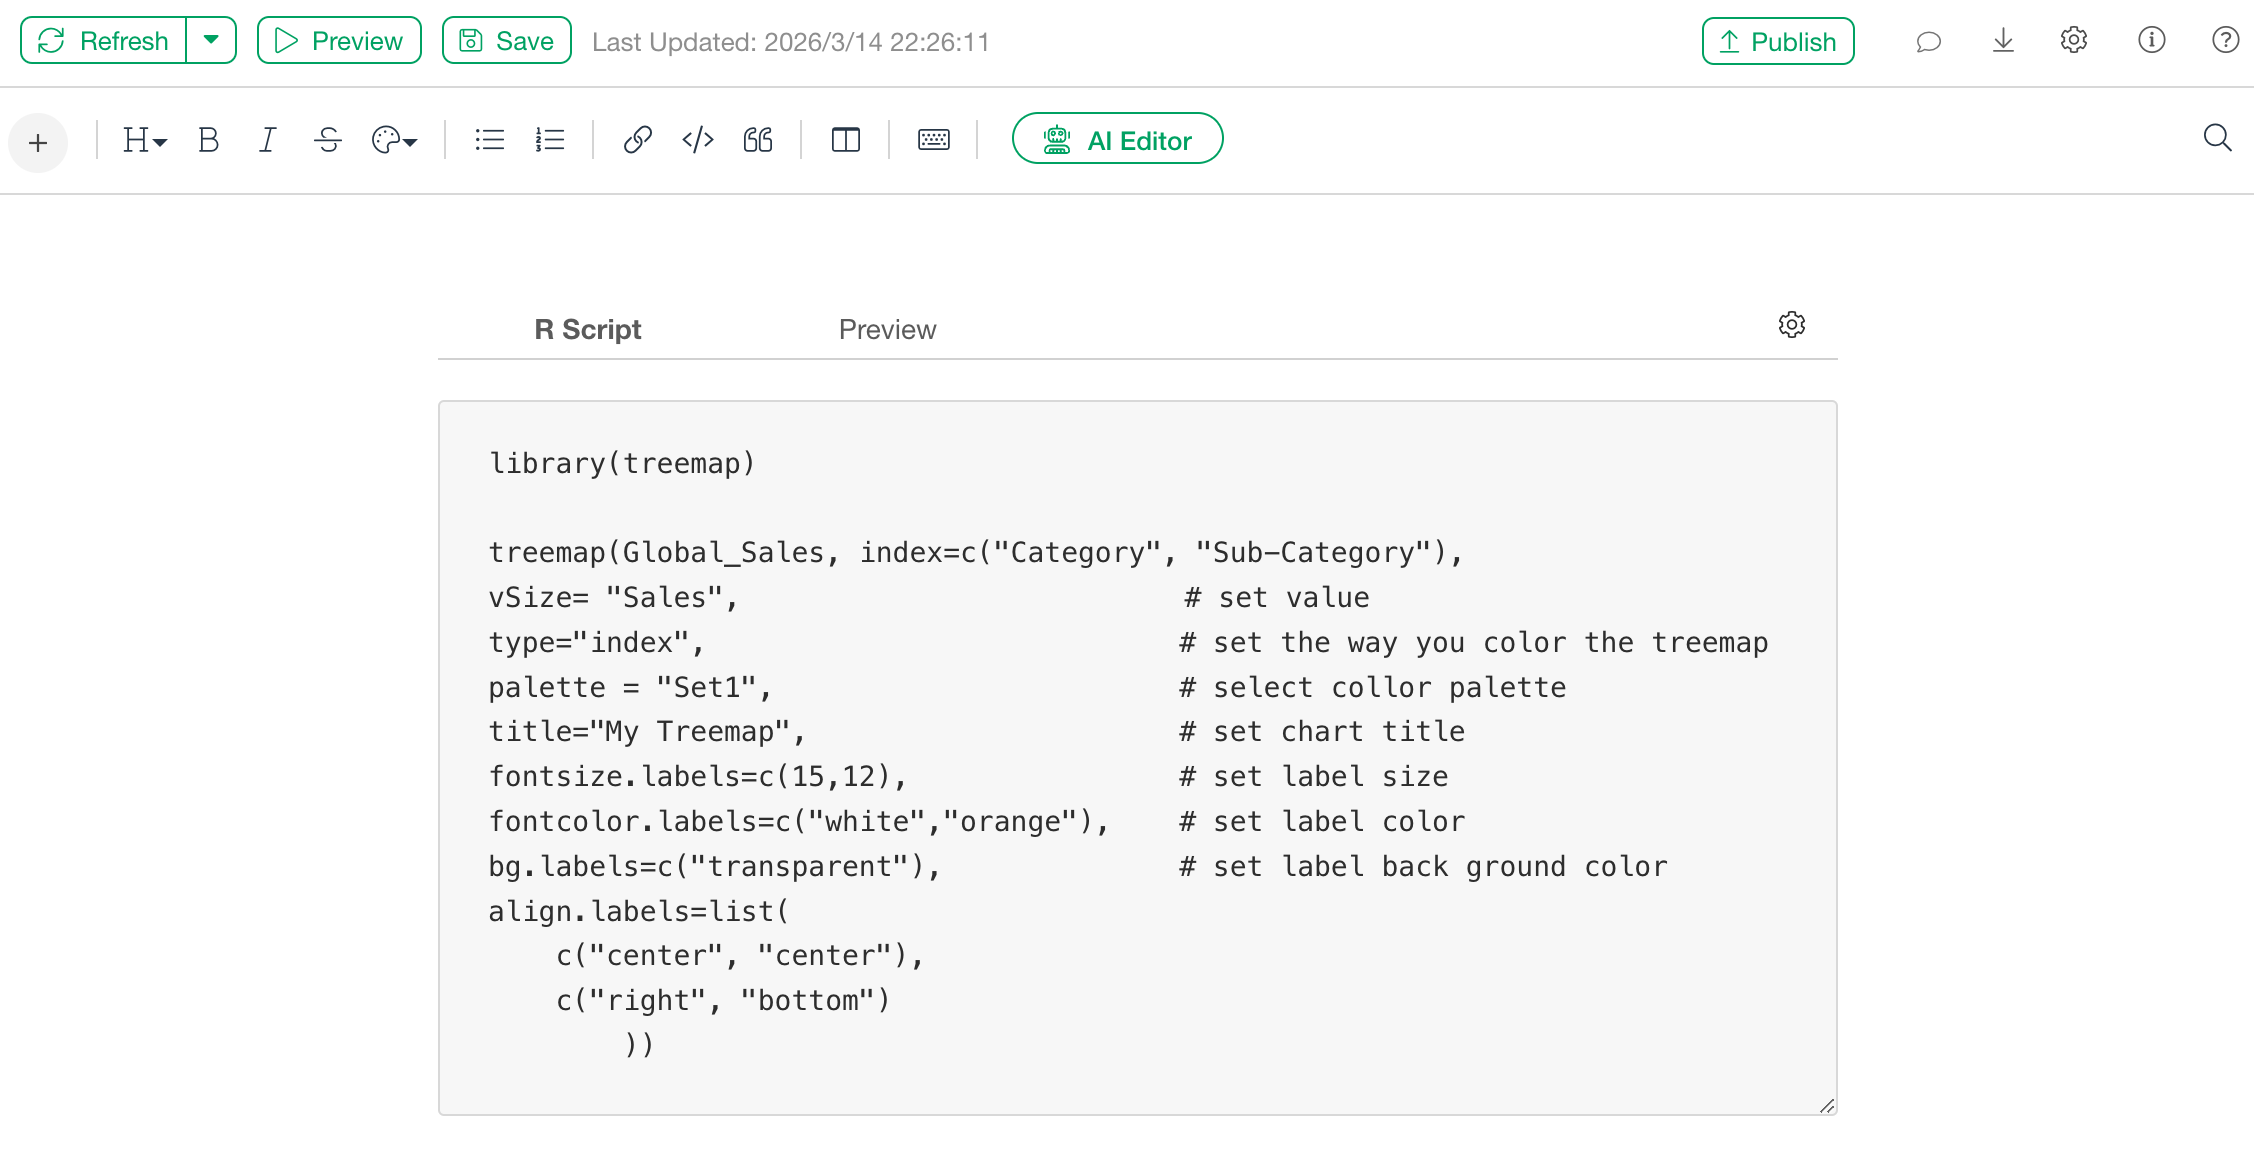
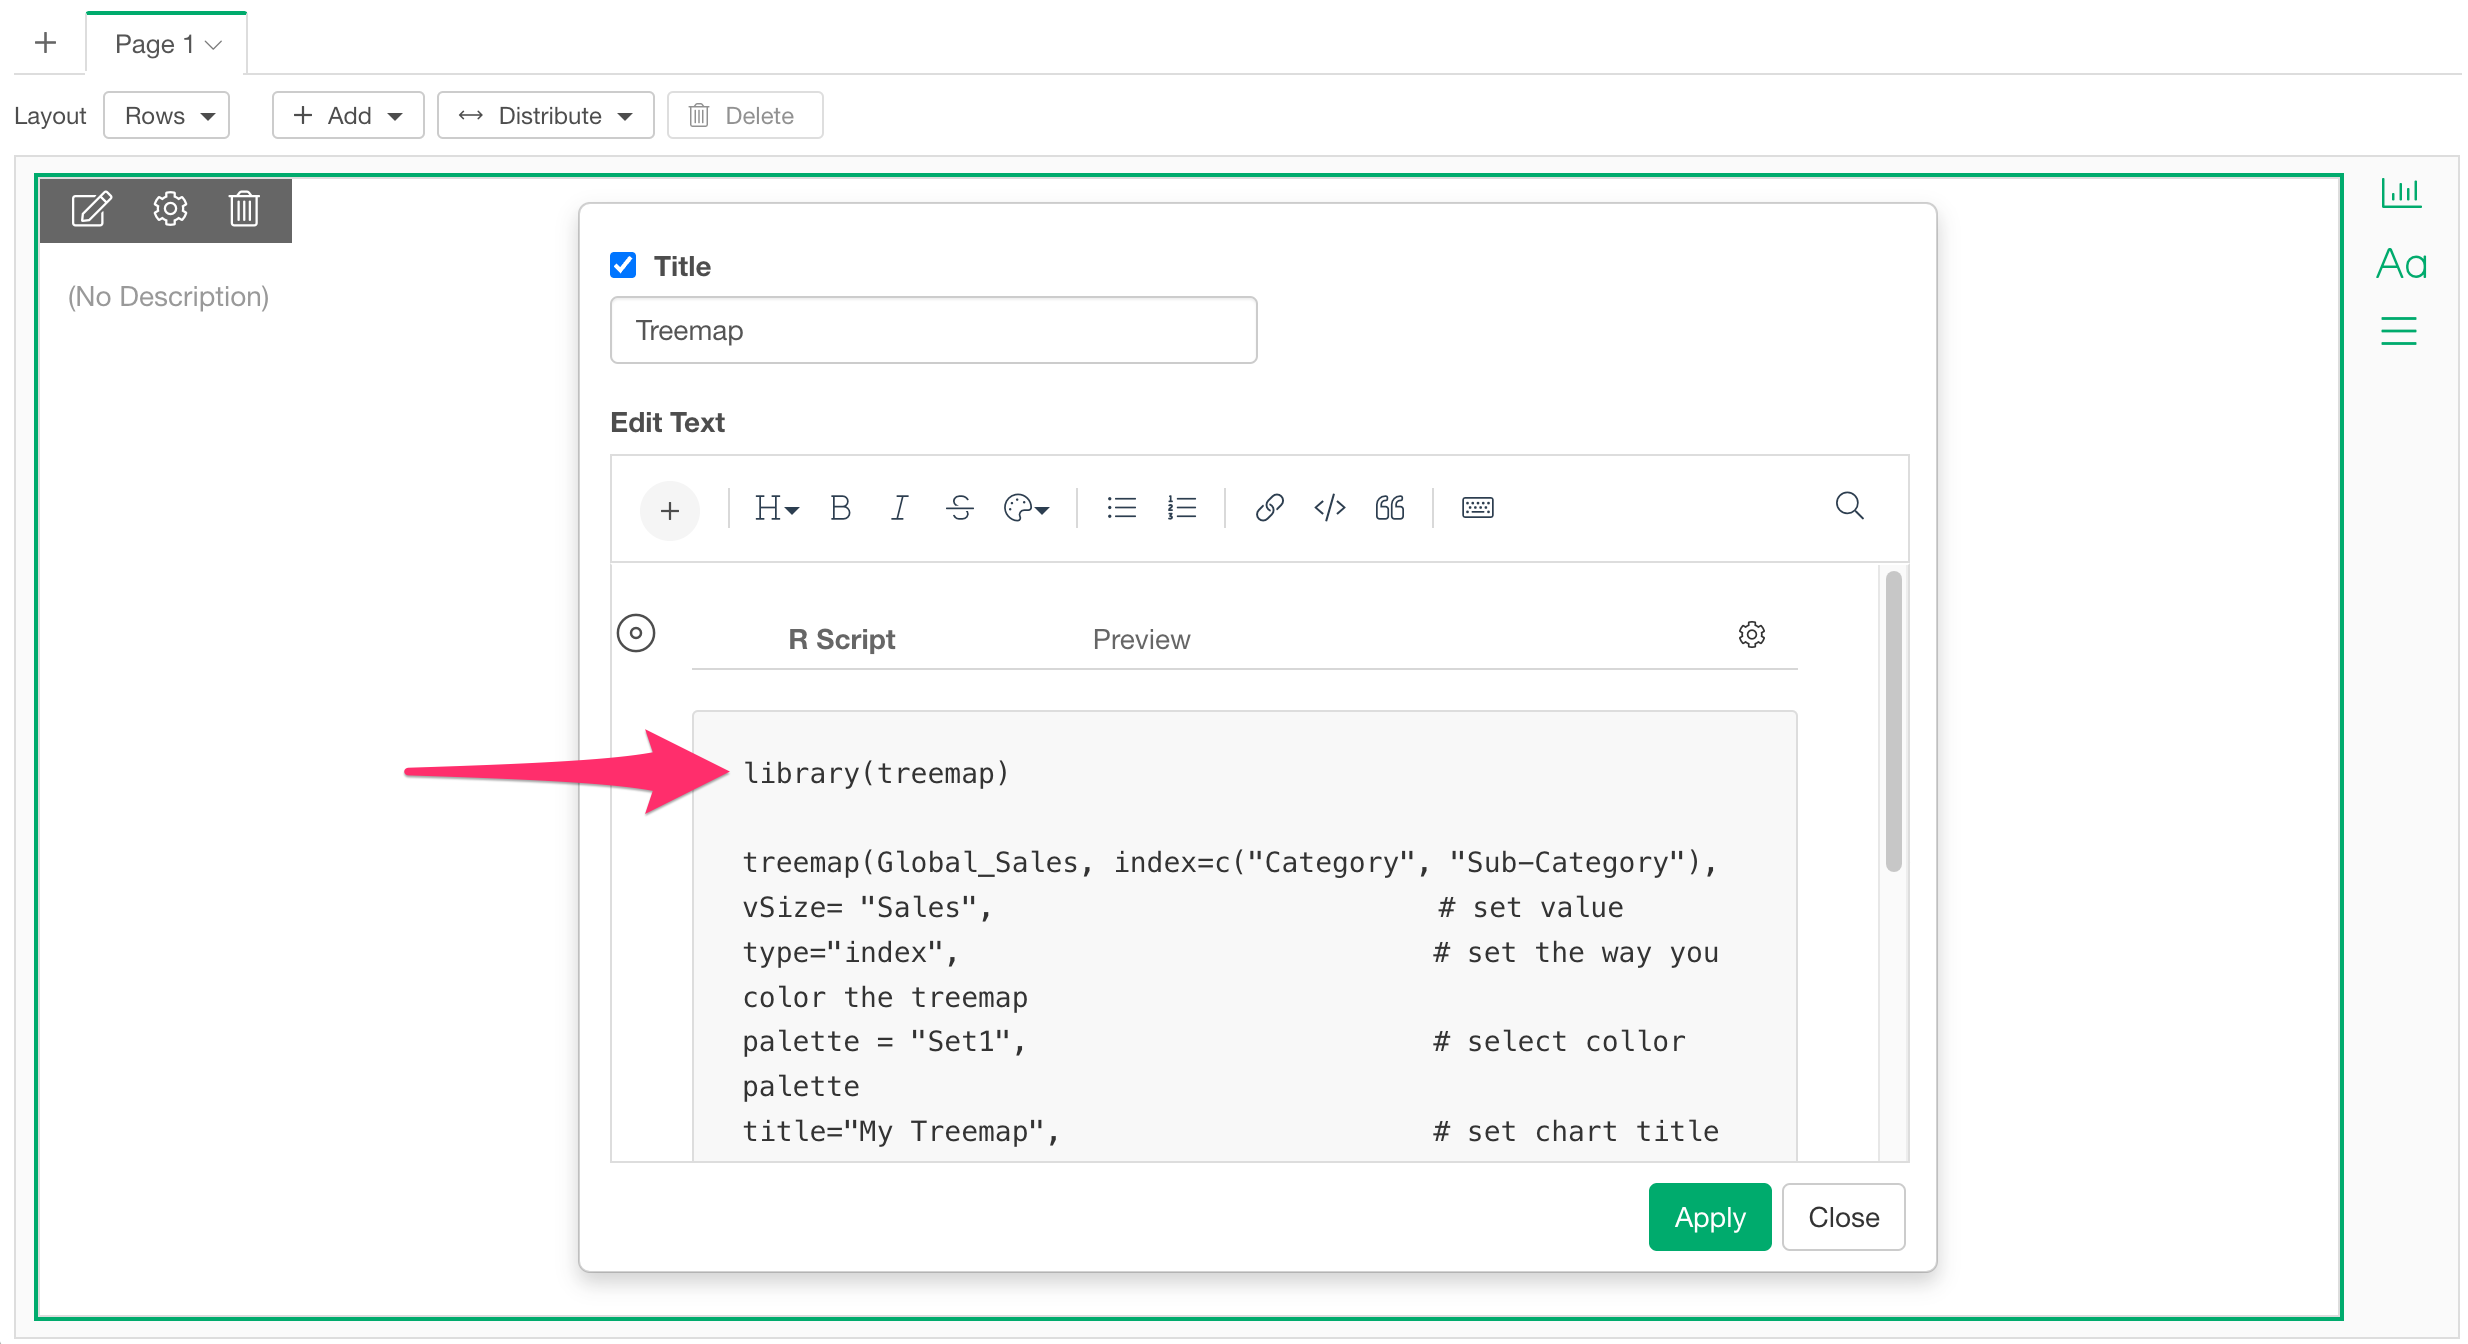
A code block for entering the R script will then be displayed so enter the following code in the script description field:
library(treemap)

treemap(Global_Sales, index=c("Category", "Sub-Category"),
vSize= "Sales",                         # set value
type="index",                            # set the way you color the treemap
palette = "Set1",                        # select collor palette
title="Sale by Category and Sub-Category",  # set chart title
fontsize.labels=c(15,12),                # set label size
fontcolor.labels=c("white","orange"),    # set label color
bg.labels=c("transparent"),              # set label back ground color
align.labels=list(
    c("center", "center"),
    c("right", "bottom")
        ))
Once the input is complete, click the “Preview” button.
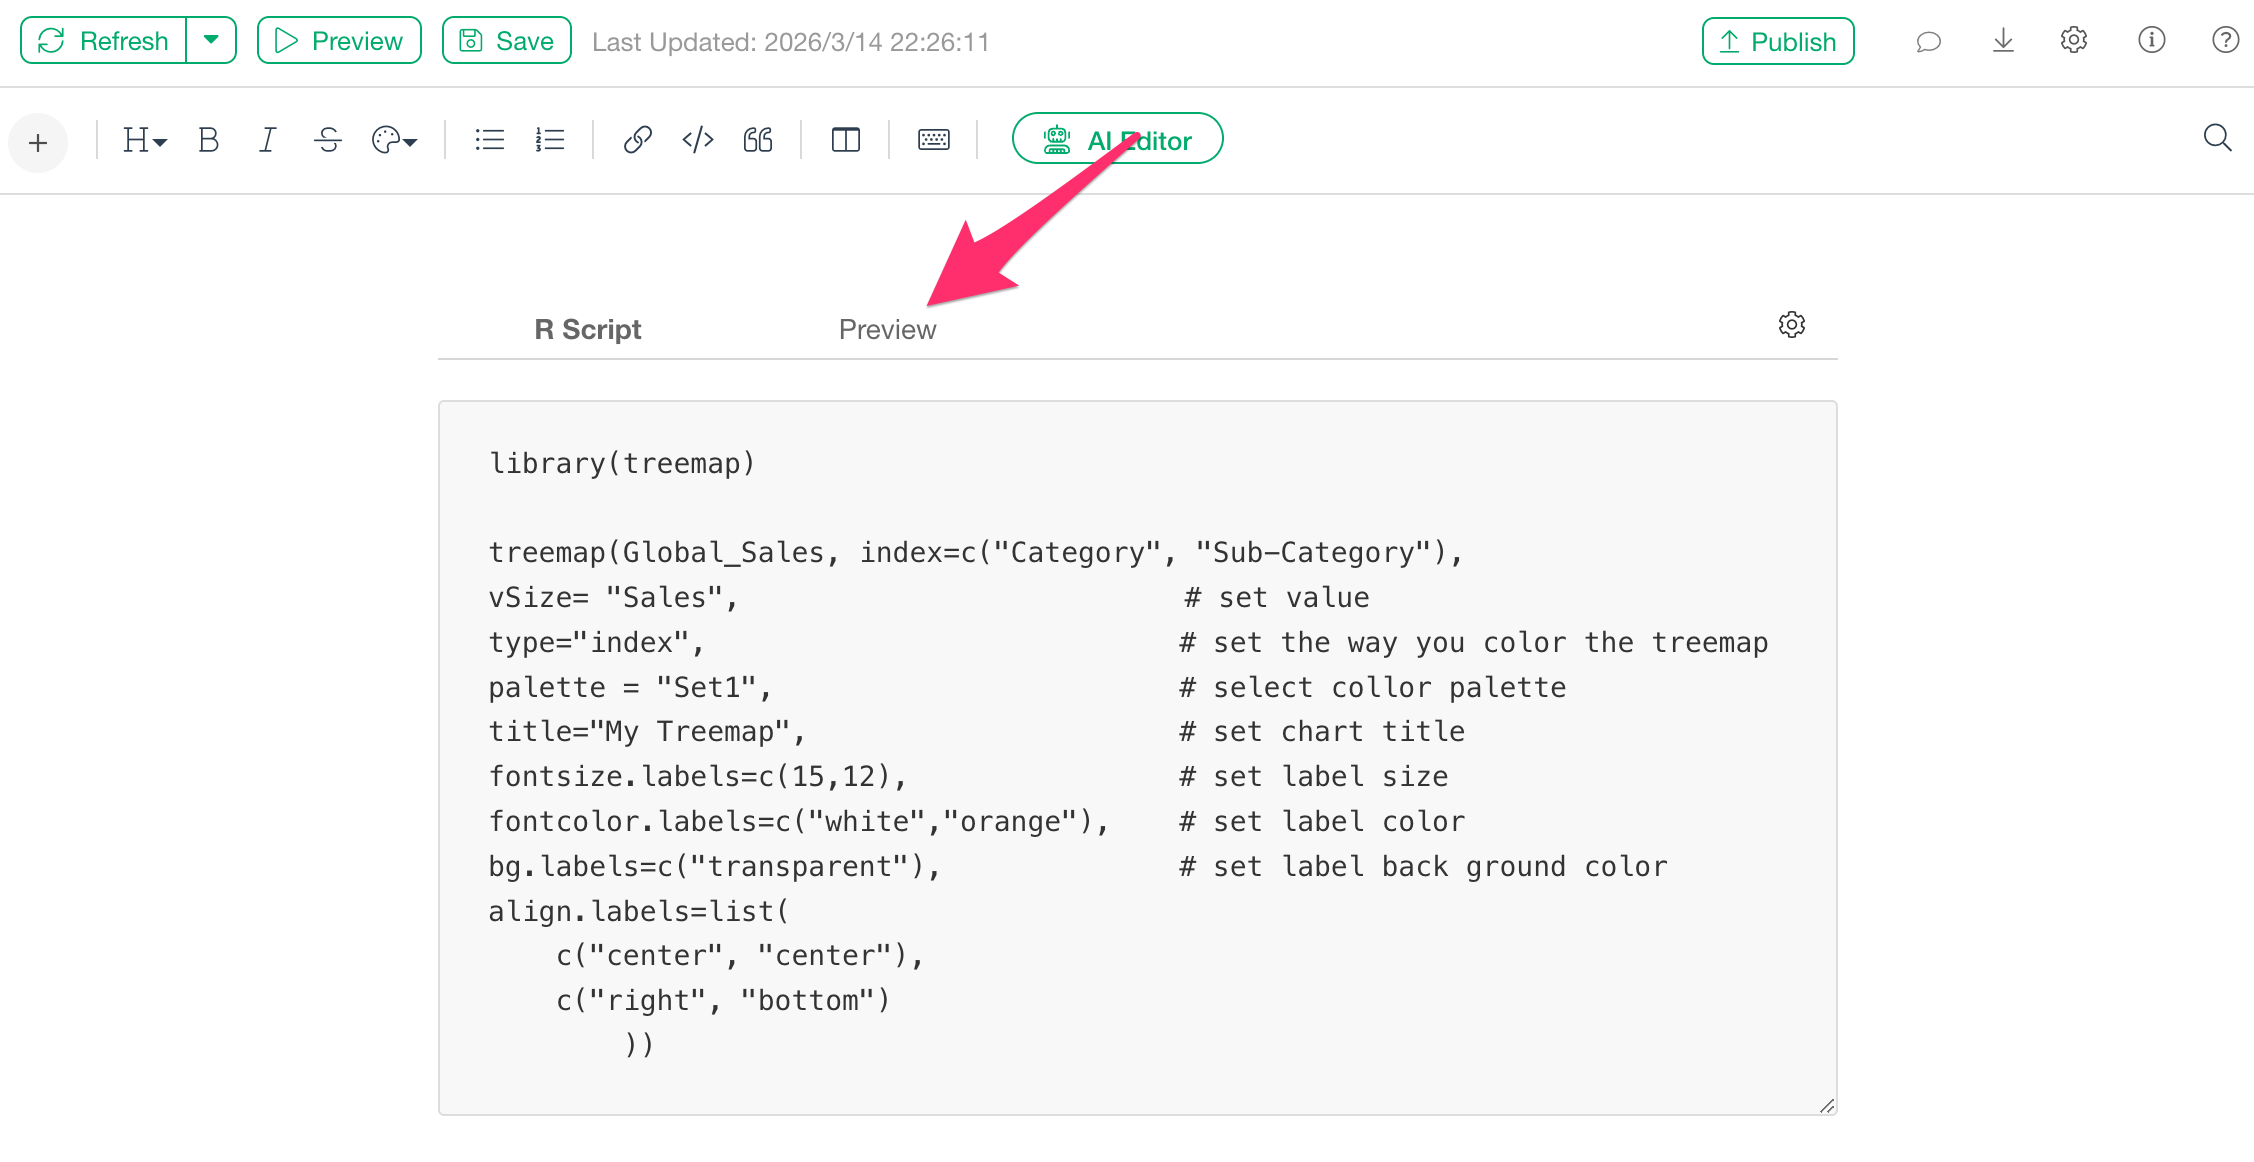
The treemap will then be displayed as follows:
Adding a Treemap to a Dashboard
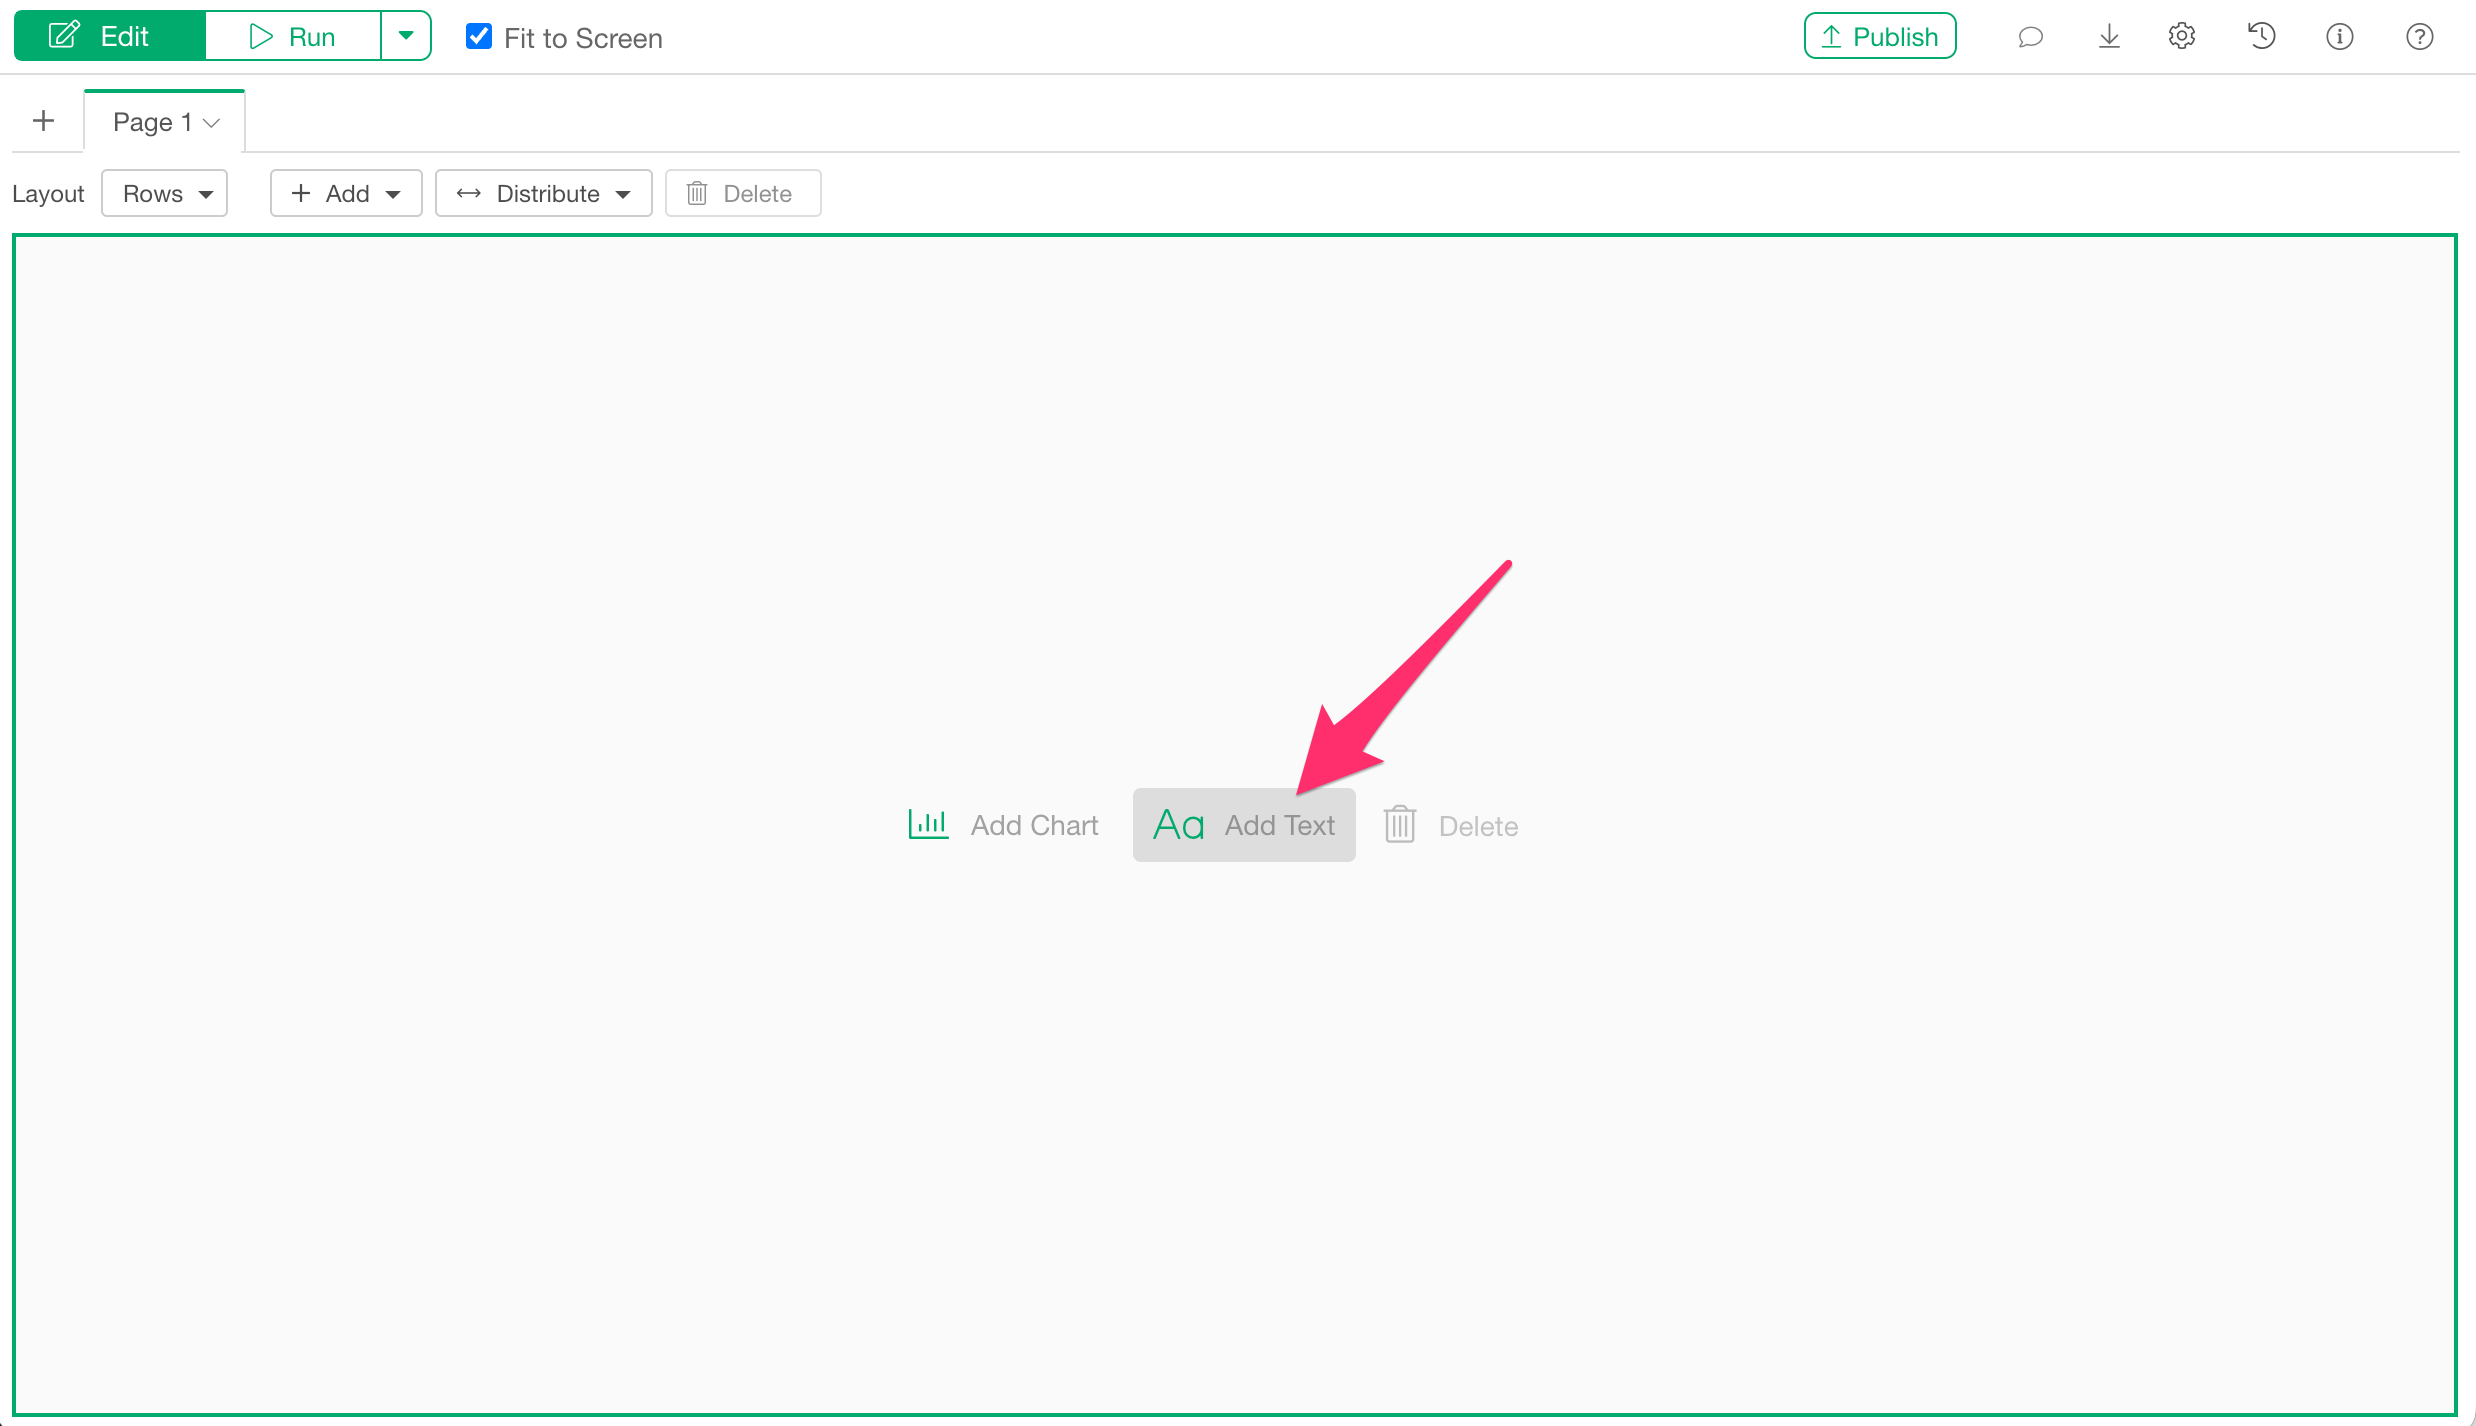
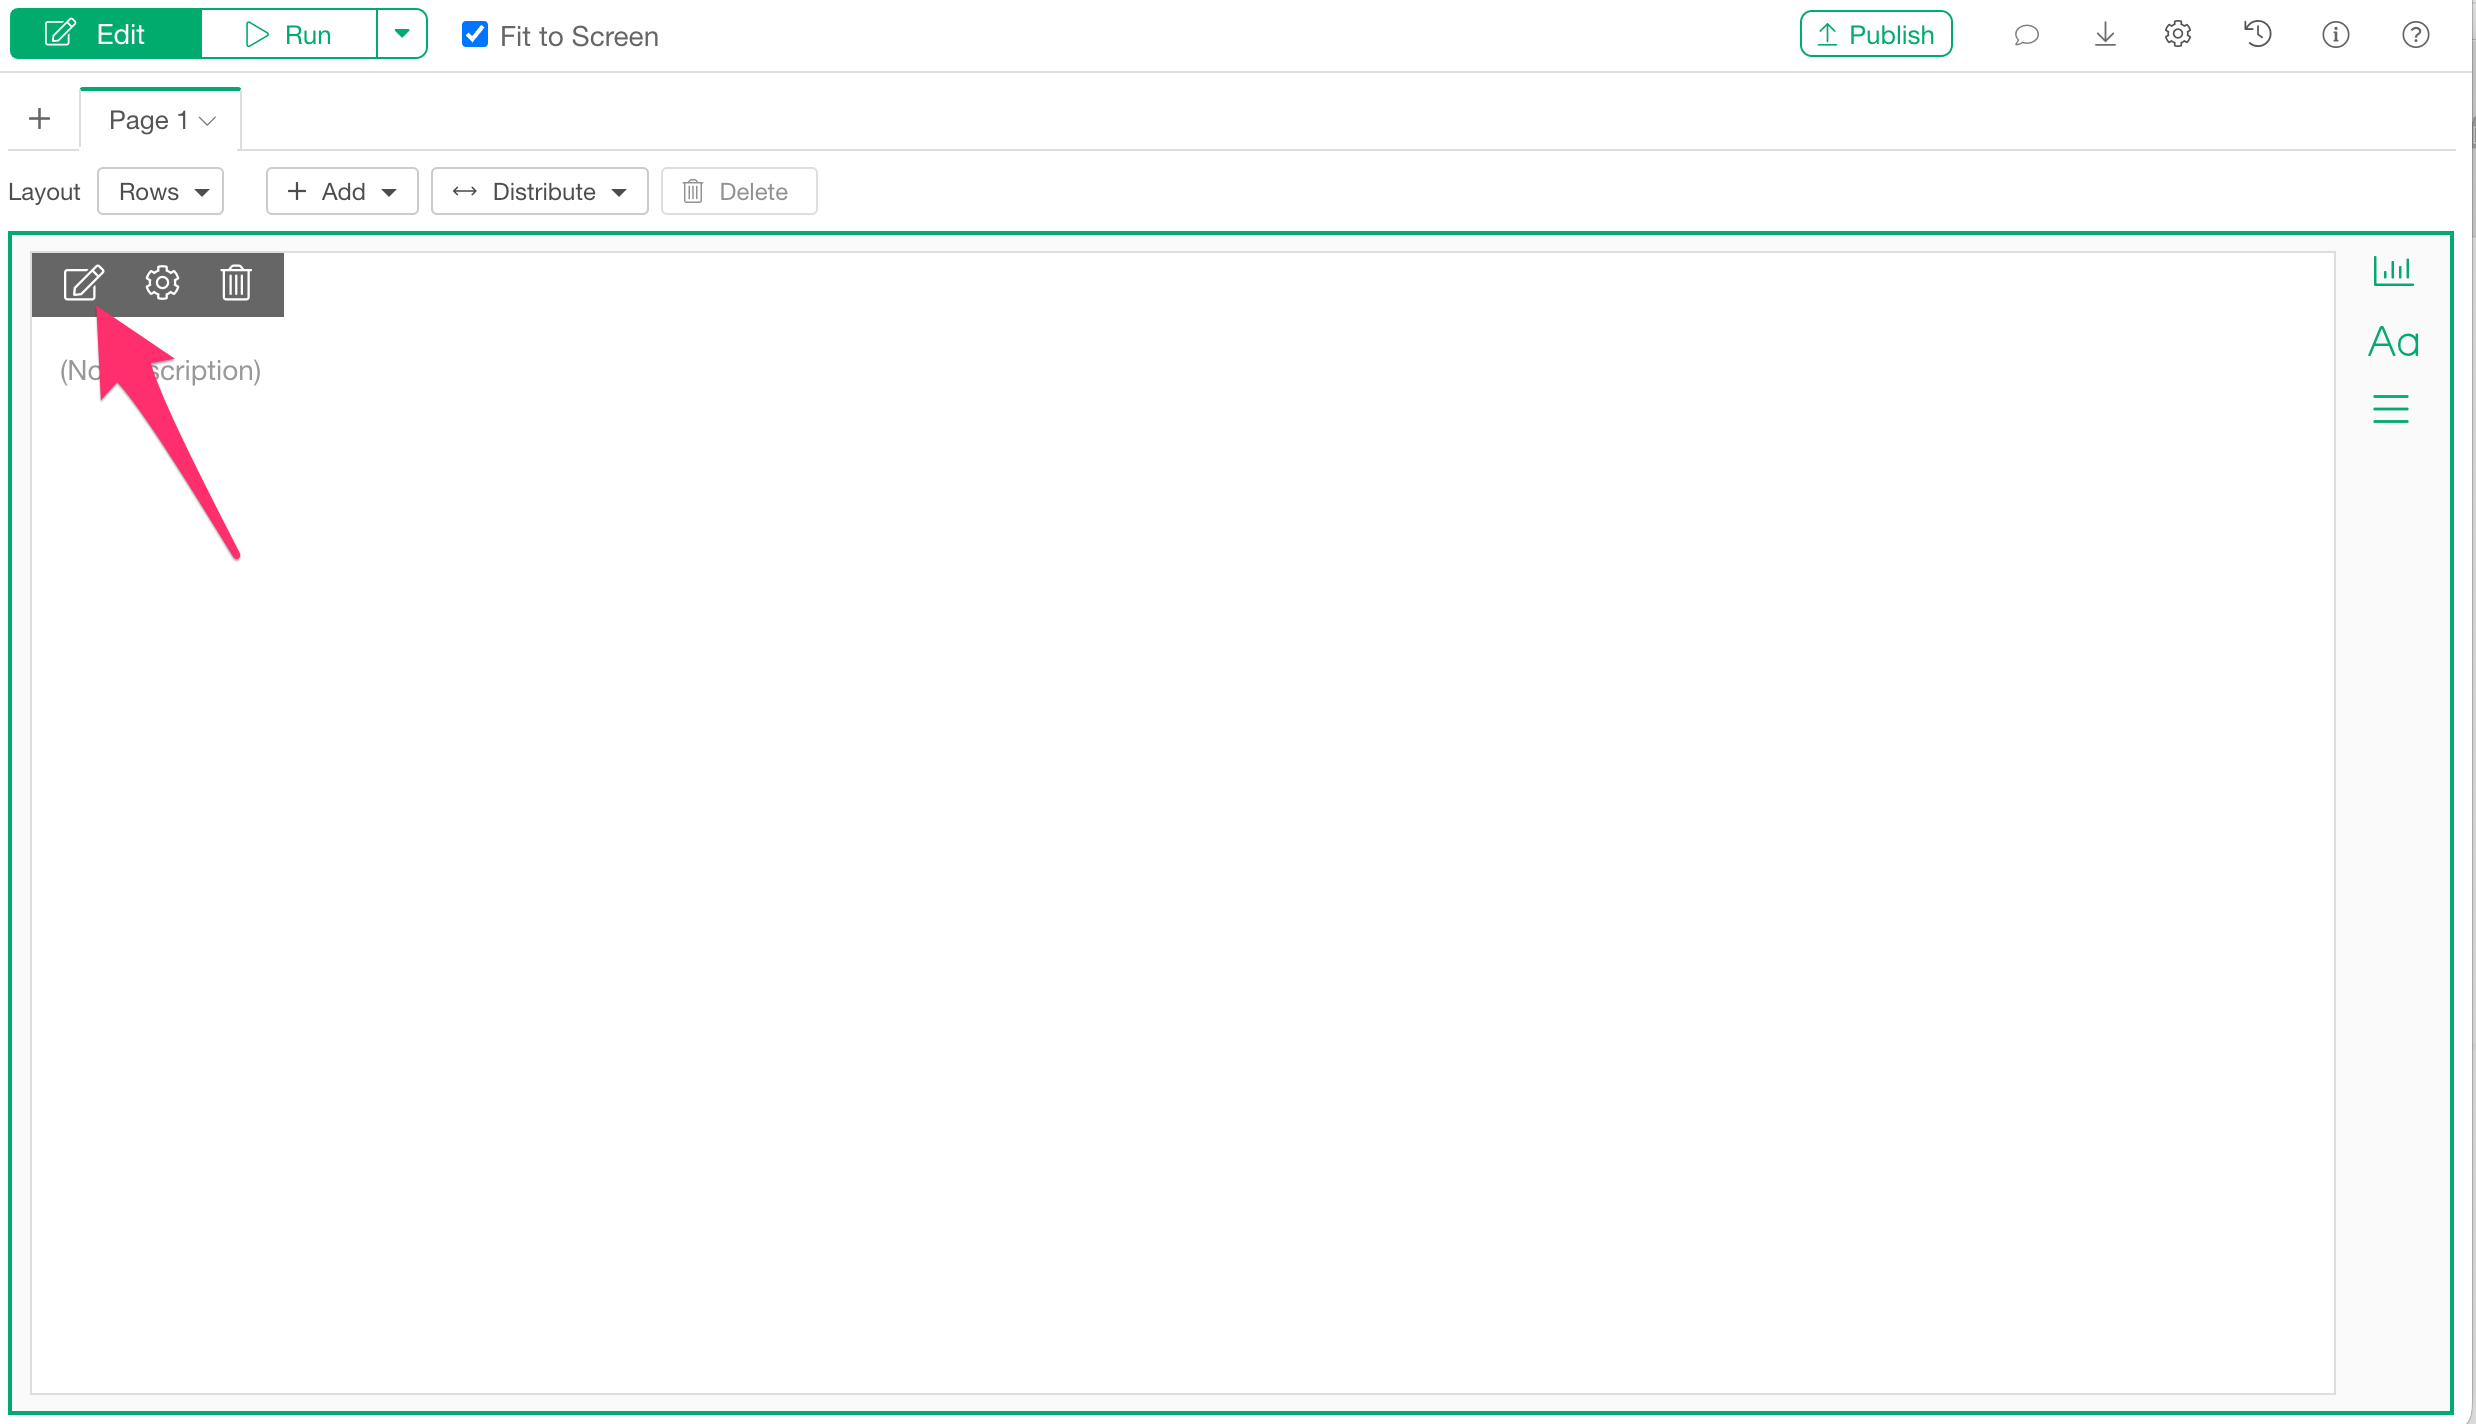
If you want to add a treemap to a dashboard, click the “Add Text” button.
Next, click the text edit icon.
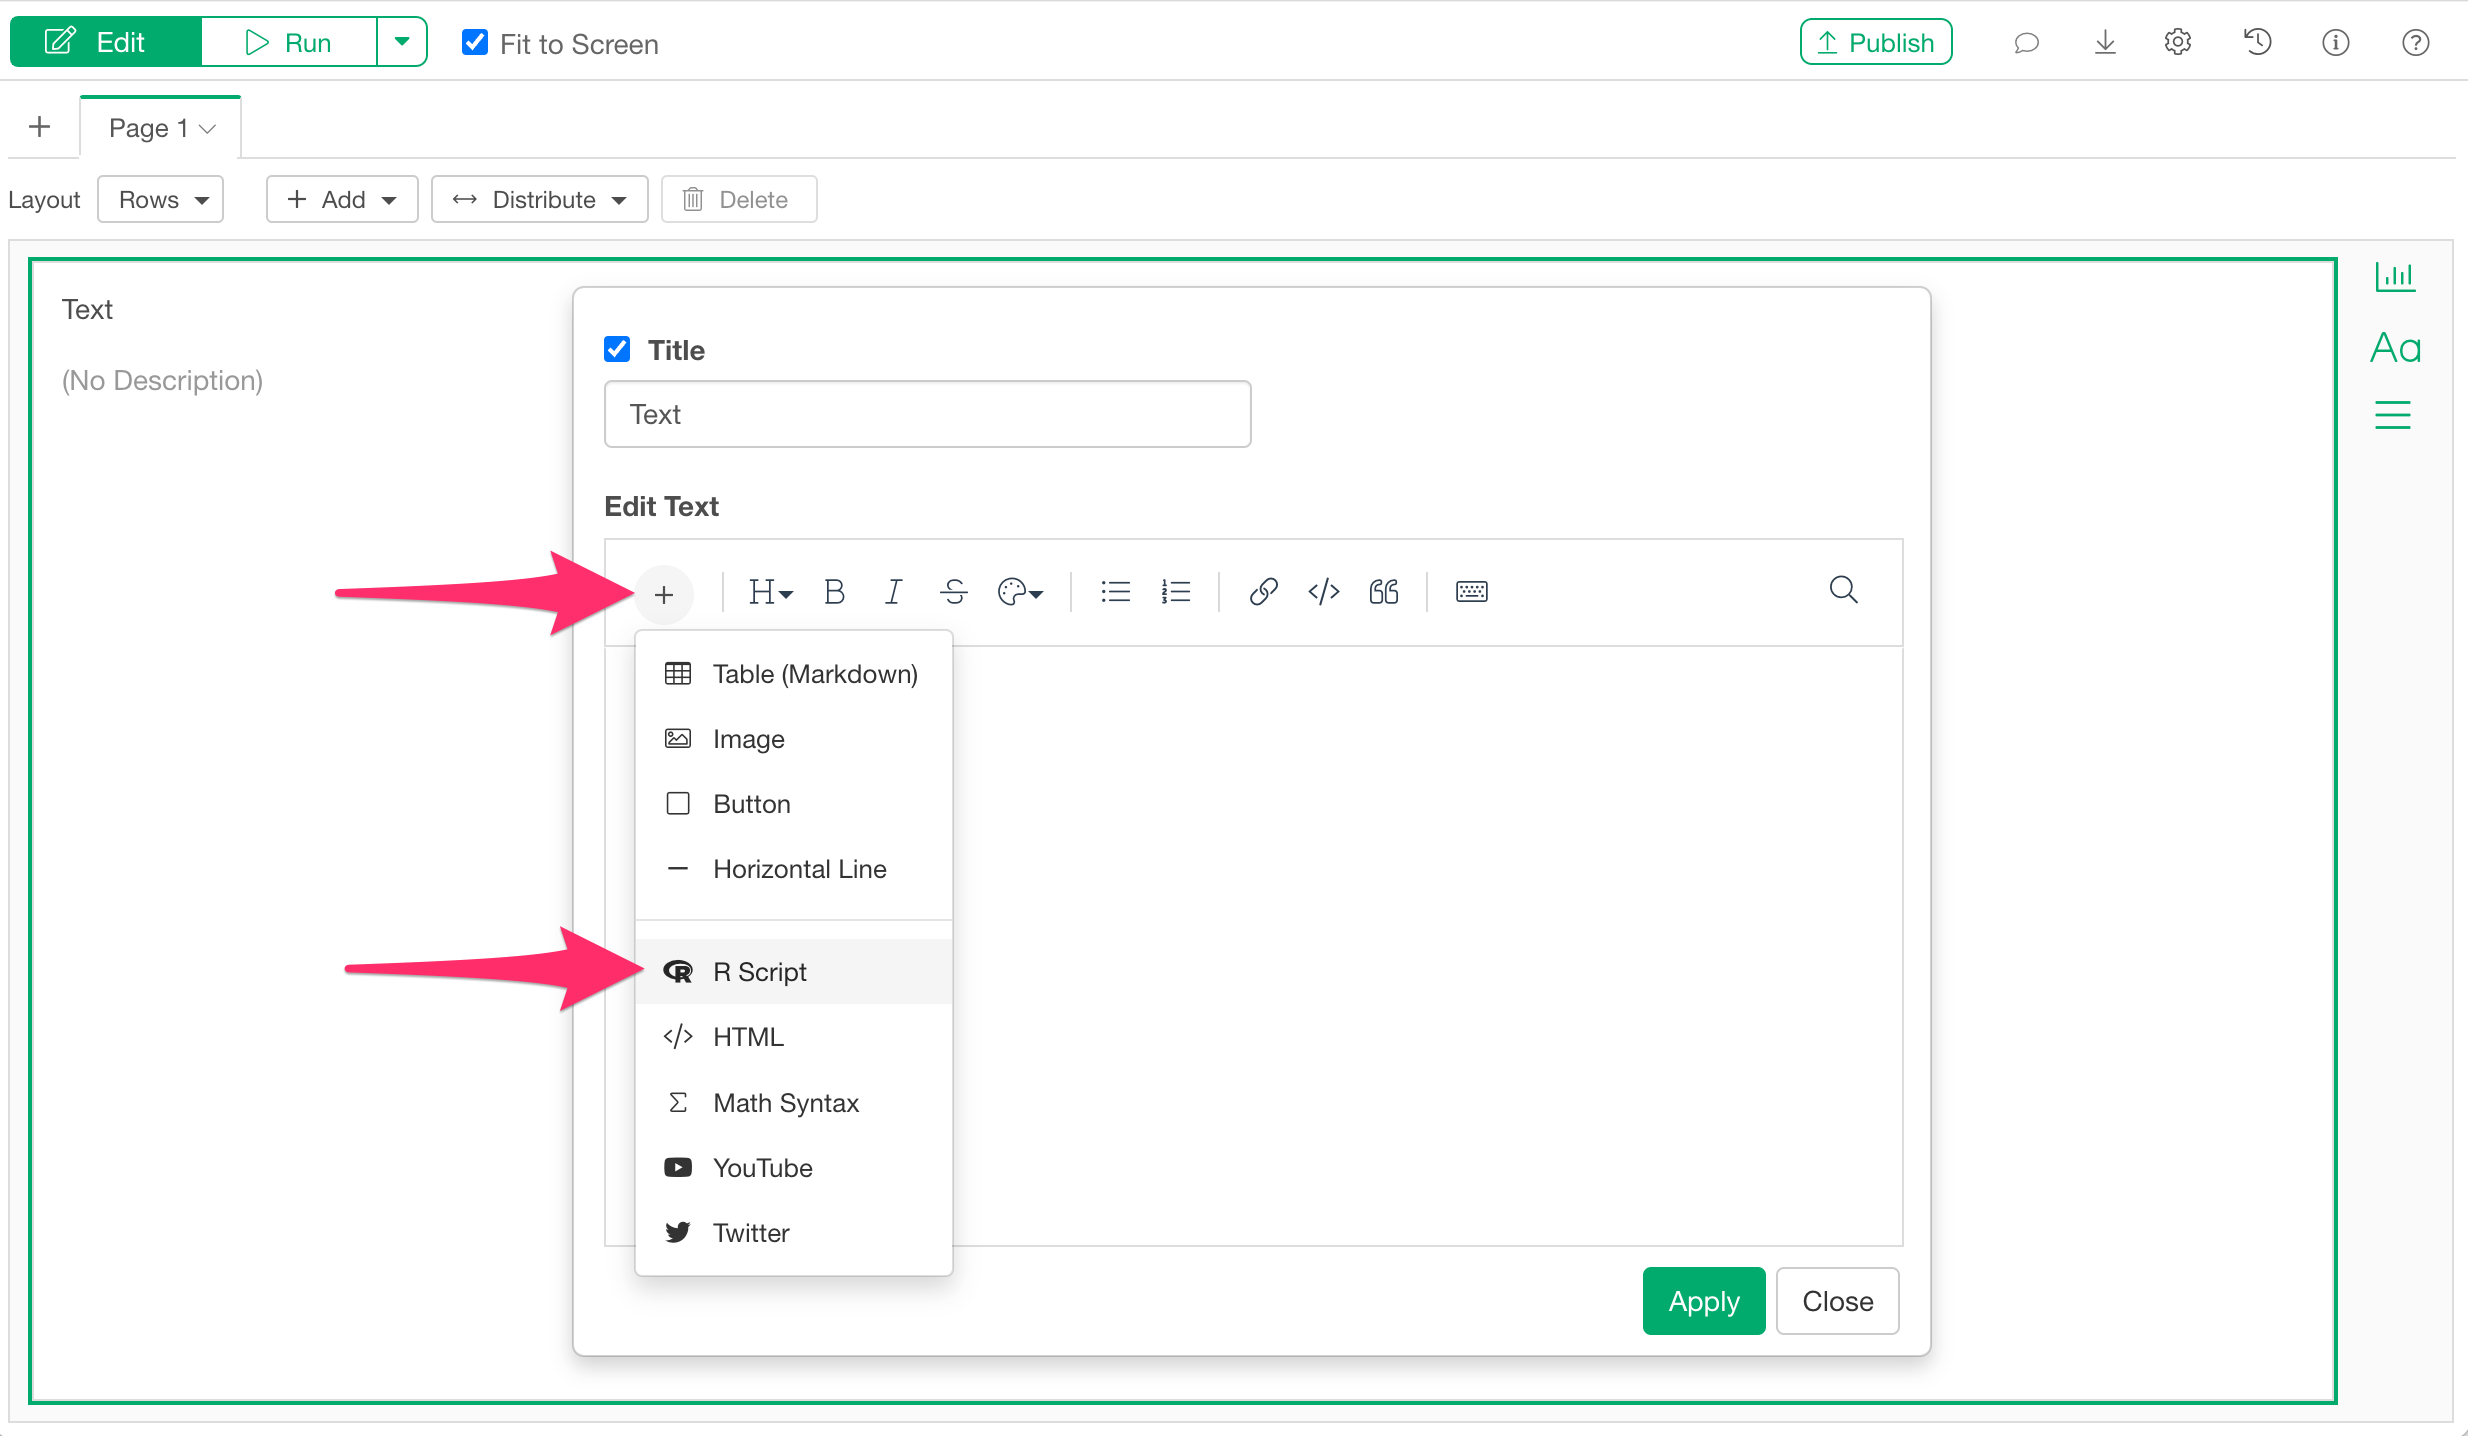
Add an R script code block to the text editor.
Add the code used earlier to the R script input dialog.
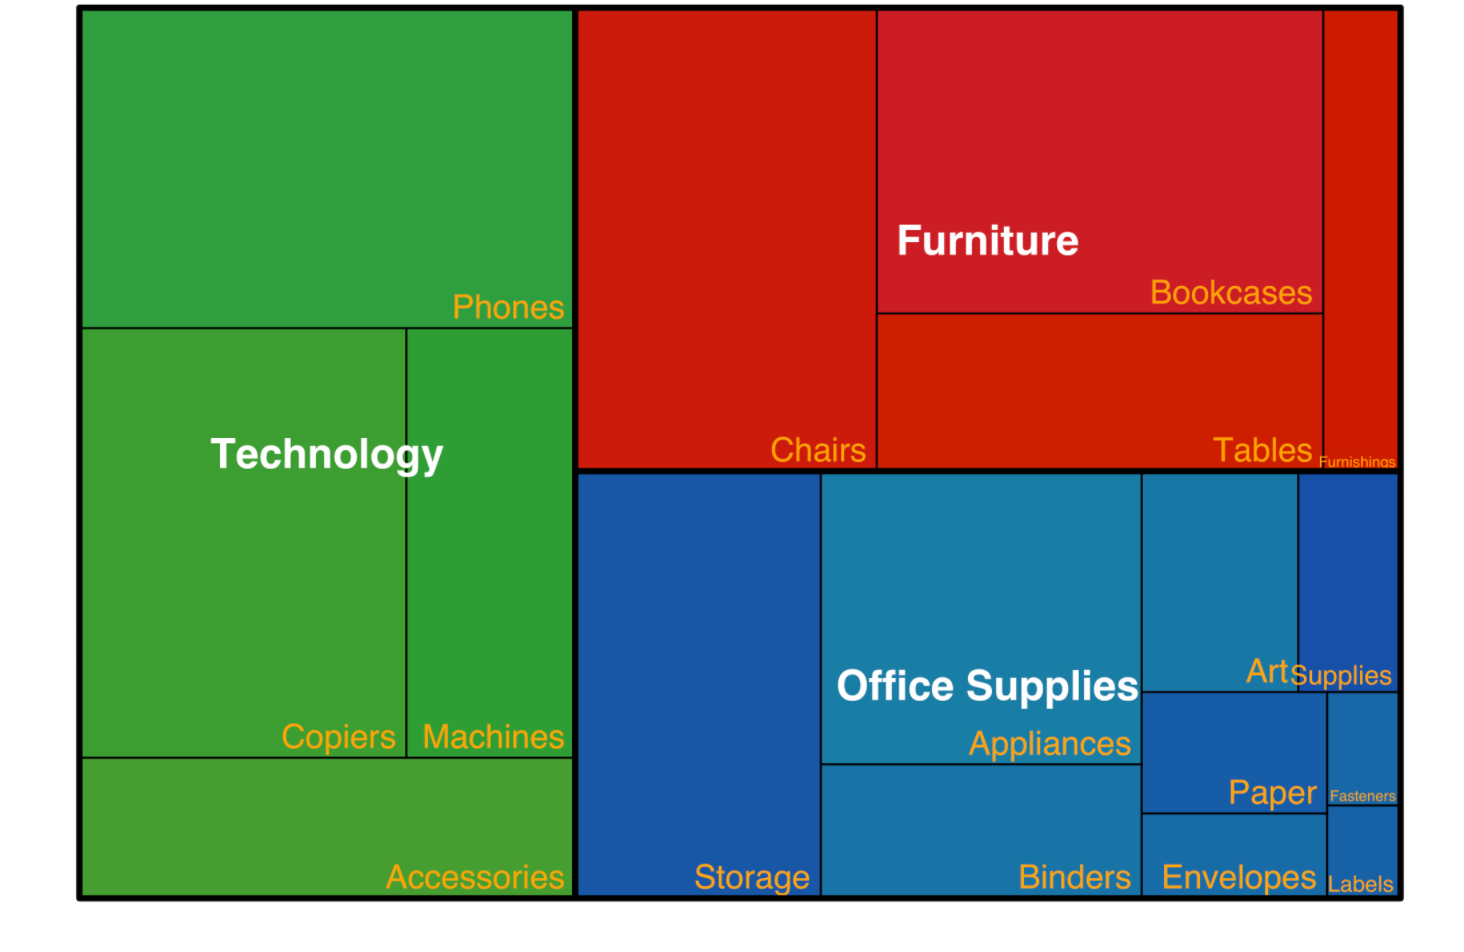
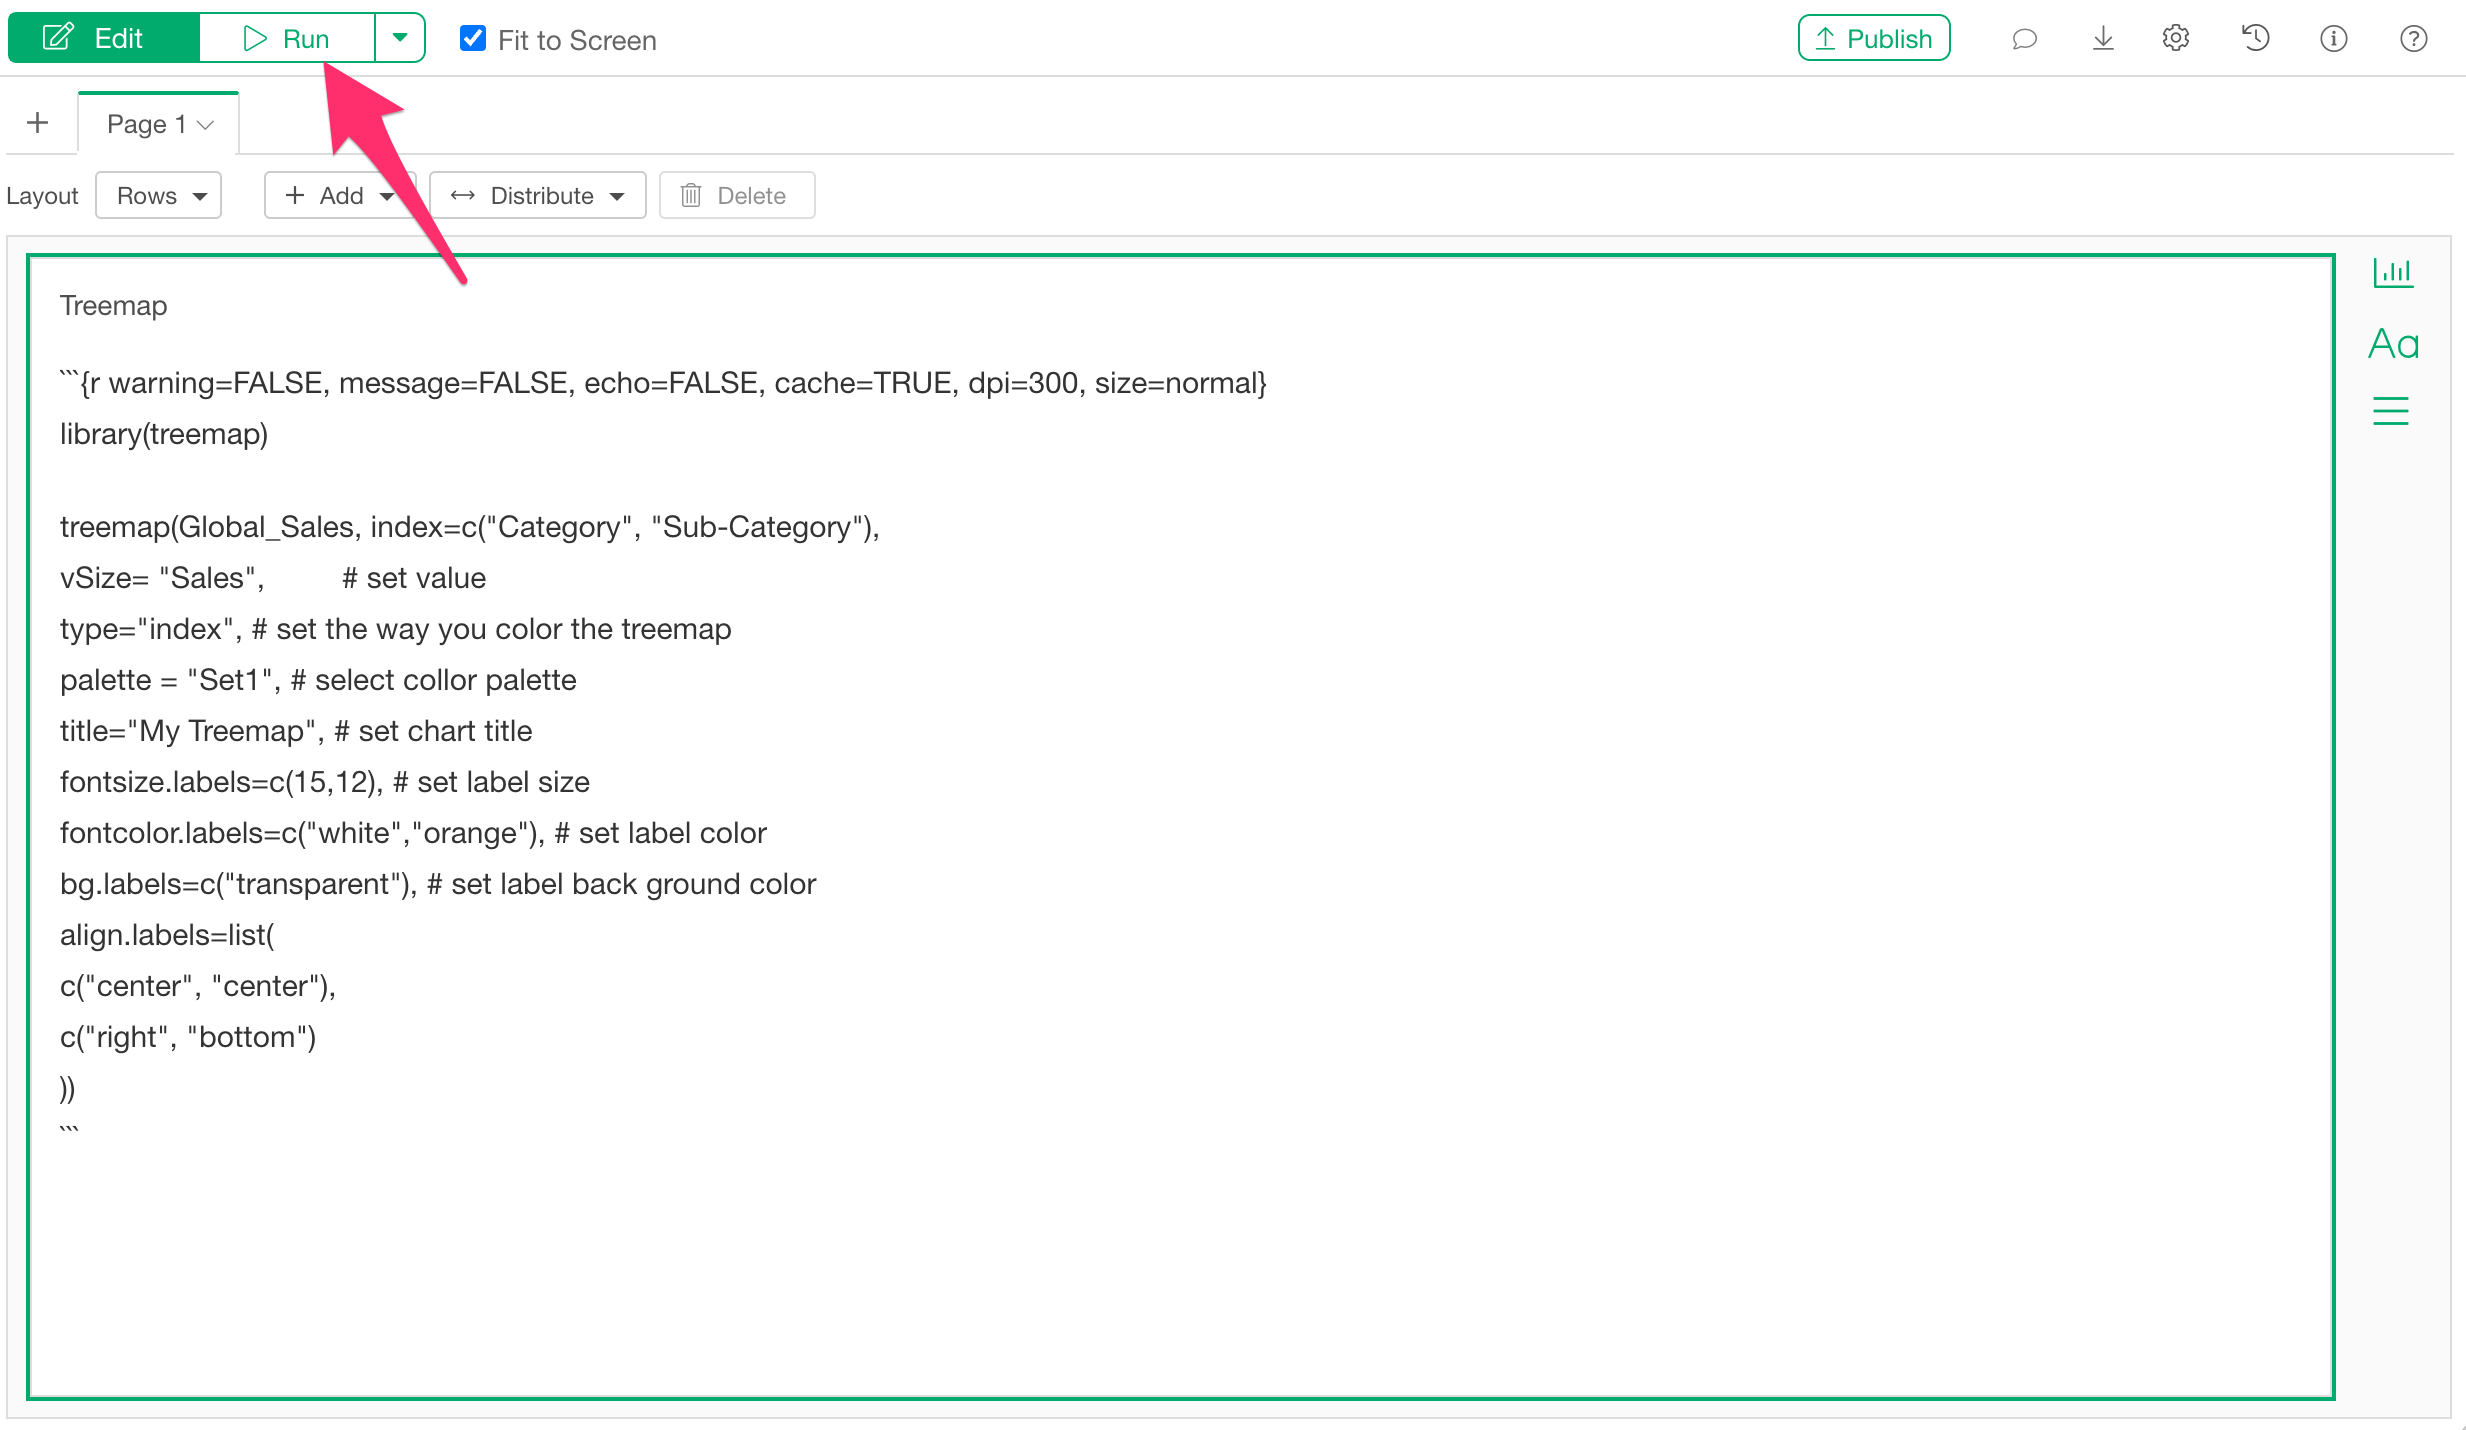
Run the dashboard.
The treemap can now be displayed on the dashboard as well, as shown below.