How to do Huff Model Analysis with AI Prompt
The Huff Model is a spatial analysis model used to estimate which store a consumer is likely to choose when purchasing a specific product or service.
It calculates the probability of each customer visiting each store based on their place of residence, considering the attractiveness of the store (such as its size) and the distance from the customer.
The basic concept of the Huff Model is based on a simple principle: larger stores are more attractive, and distant stores are less likely to be visited.
When we choose a store, we are drawn to large stores with a wide selection of products, but if the journey to get there is long, a psychological brake called “inconvenience” is applied. This model logically organizes that intuition.
Specifically, the probability of a customer selecting a particular store is calculated using the following formula:
Probability of Visitation = Attractiveness / Sum of Attractiveness of All StoresThis formula indicates that the likelihood of a store being chosen is not determined solely by the quality of that store alone, but by its “share” within the total attractiveness of all competing stores in the vicinity.
The key here is the definition of attractiveness:
Attractiveness = Store Size / Distance^Distance Decay CoefficientAttractiveness increases in proportion to the size of the store, but because it is divided by the “power” of the distance, it decreases rapidly as the distance increases.
The degree of this decrease is governed by the “Distance Decay Coefficient,” which is a crucial parameter that should be adjusted based on the industry or product characteristics.
The larger this coefficient, the stronger the impact of distance on store selection.
As a general guideline, for stores handling convenience goods purchased at the nearest location, such as convenience stores or supermarkets, a slight difference in distance can sway the decision; therefore, the coefficient is set high, around 2.0 to 3.0.
On the other hand, for shopping goods where customers visit several stores to compare products before purchasing—such as home electronics or furniture—customers prioritize selection even if the store is somewhat far away. In these cases, the coefficient is set to approximately 1.0 to 1.5.
Furthermore, for specialty goods with high preference, such as brand-name stores or high-end restaurants, the value of making a special trip is high. Consequently, the coefficient becomes even smaller, around 0.5 to 1.0, meaning attractiveness does not drop easily even if the distance is great.
In this way, by combining the “gravitational pull” of store size with the “psychological hurdle of travel” that varies by product, the Huff Model estimates realistic consumer behavior.
Utilizing the Huff Model
By utilizing the Huff Model, companies can optimize store strategies and identify market opportunities.
Quantitatively predicting customer store selection behavior improves the accuracy of various strategic decisions, such as planning new store openings, forecasting sales for existing stores, trade area analysis, and competitor analysis. A major strength is the ability to objectively evaluate the customer-attracting power of each store in an environment where multiple stores compete.
Required Data
To execute the Huff Model, you need two types of data containing the following information:
Customer Data
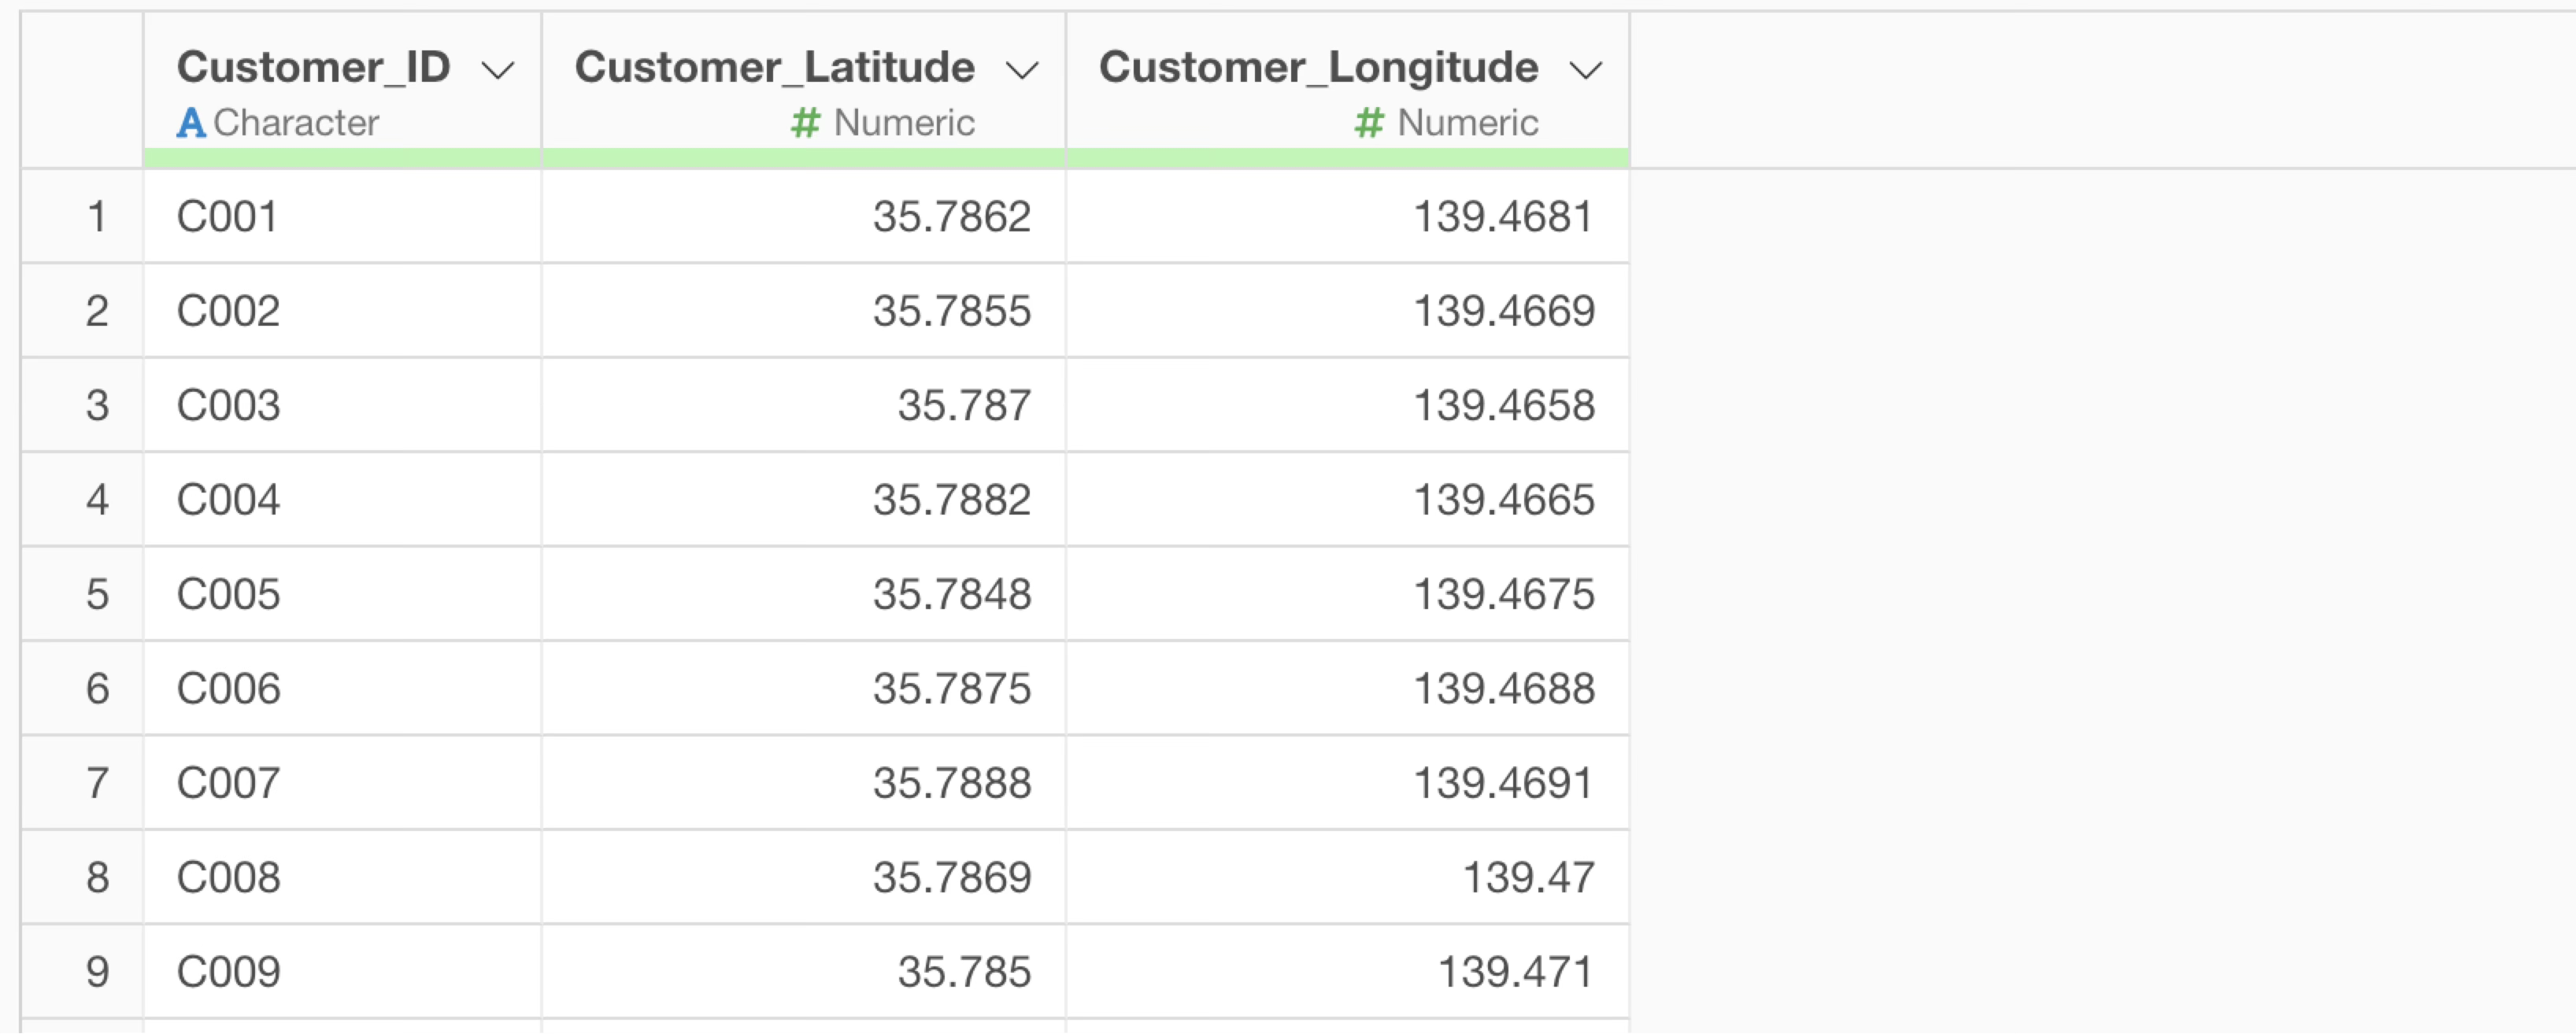
Each row represents one “customer” or a representative point of a residential area being analyzed. The data should include the following columns:
- Information to uniquely identify the customer (Customer ID, Member Number, Area ID, etc.)
- Location information of the customer’s current or residential location (Latitude/Longitude)
Store Data
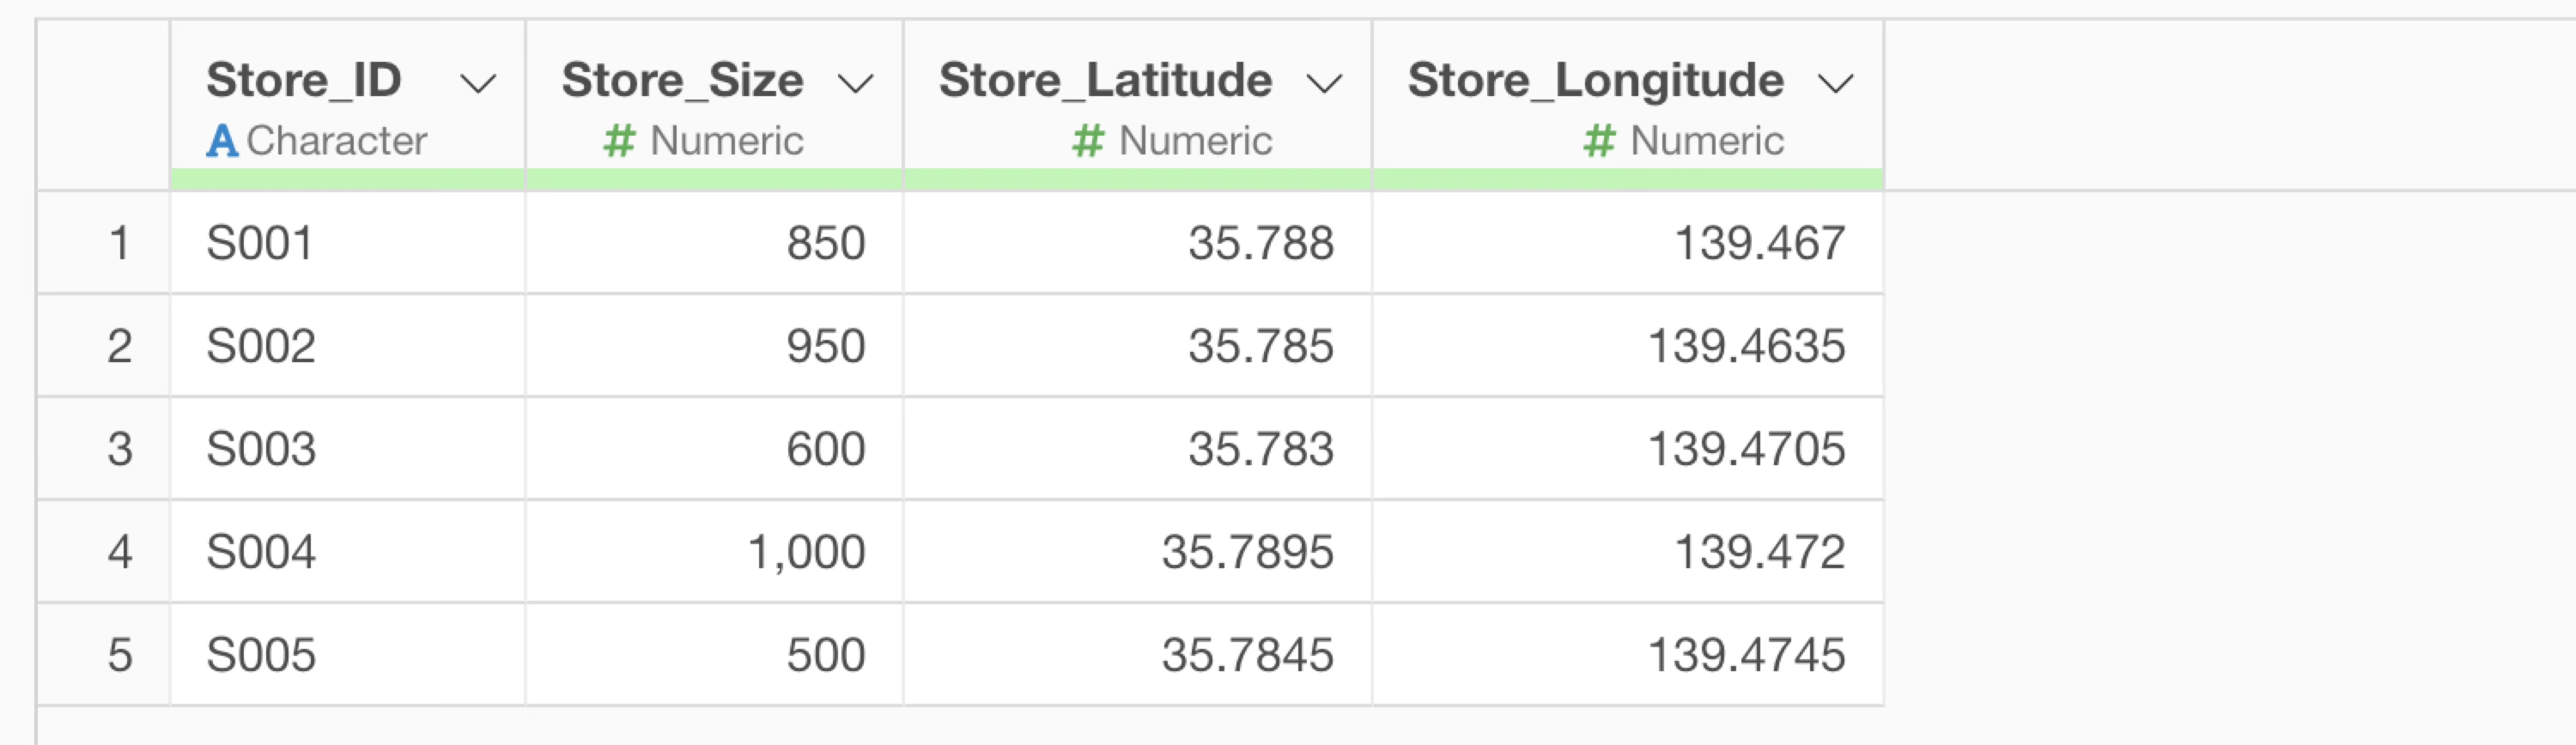
Each row represents one “store.” The data should include the following columns:
- Information to uniquely identify the store (Store ID, Store Name, Branch Number, etc.)
- Numerical values serving as the basis for store attractiveness (Floor area, number of items in stock, number of employees, brand evaluation score, etc.)
- Latitude/Longitude of the store
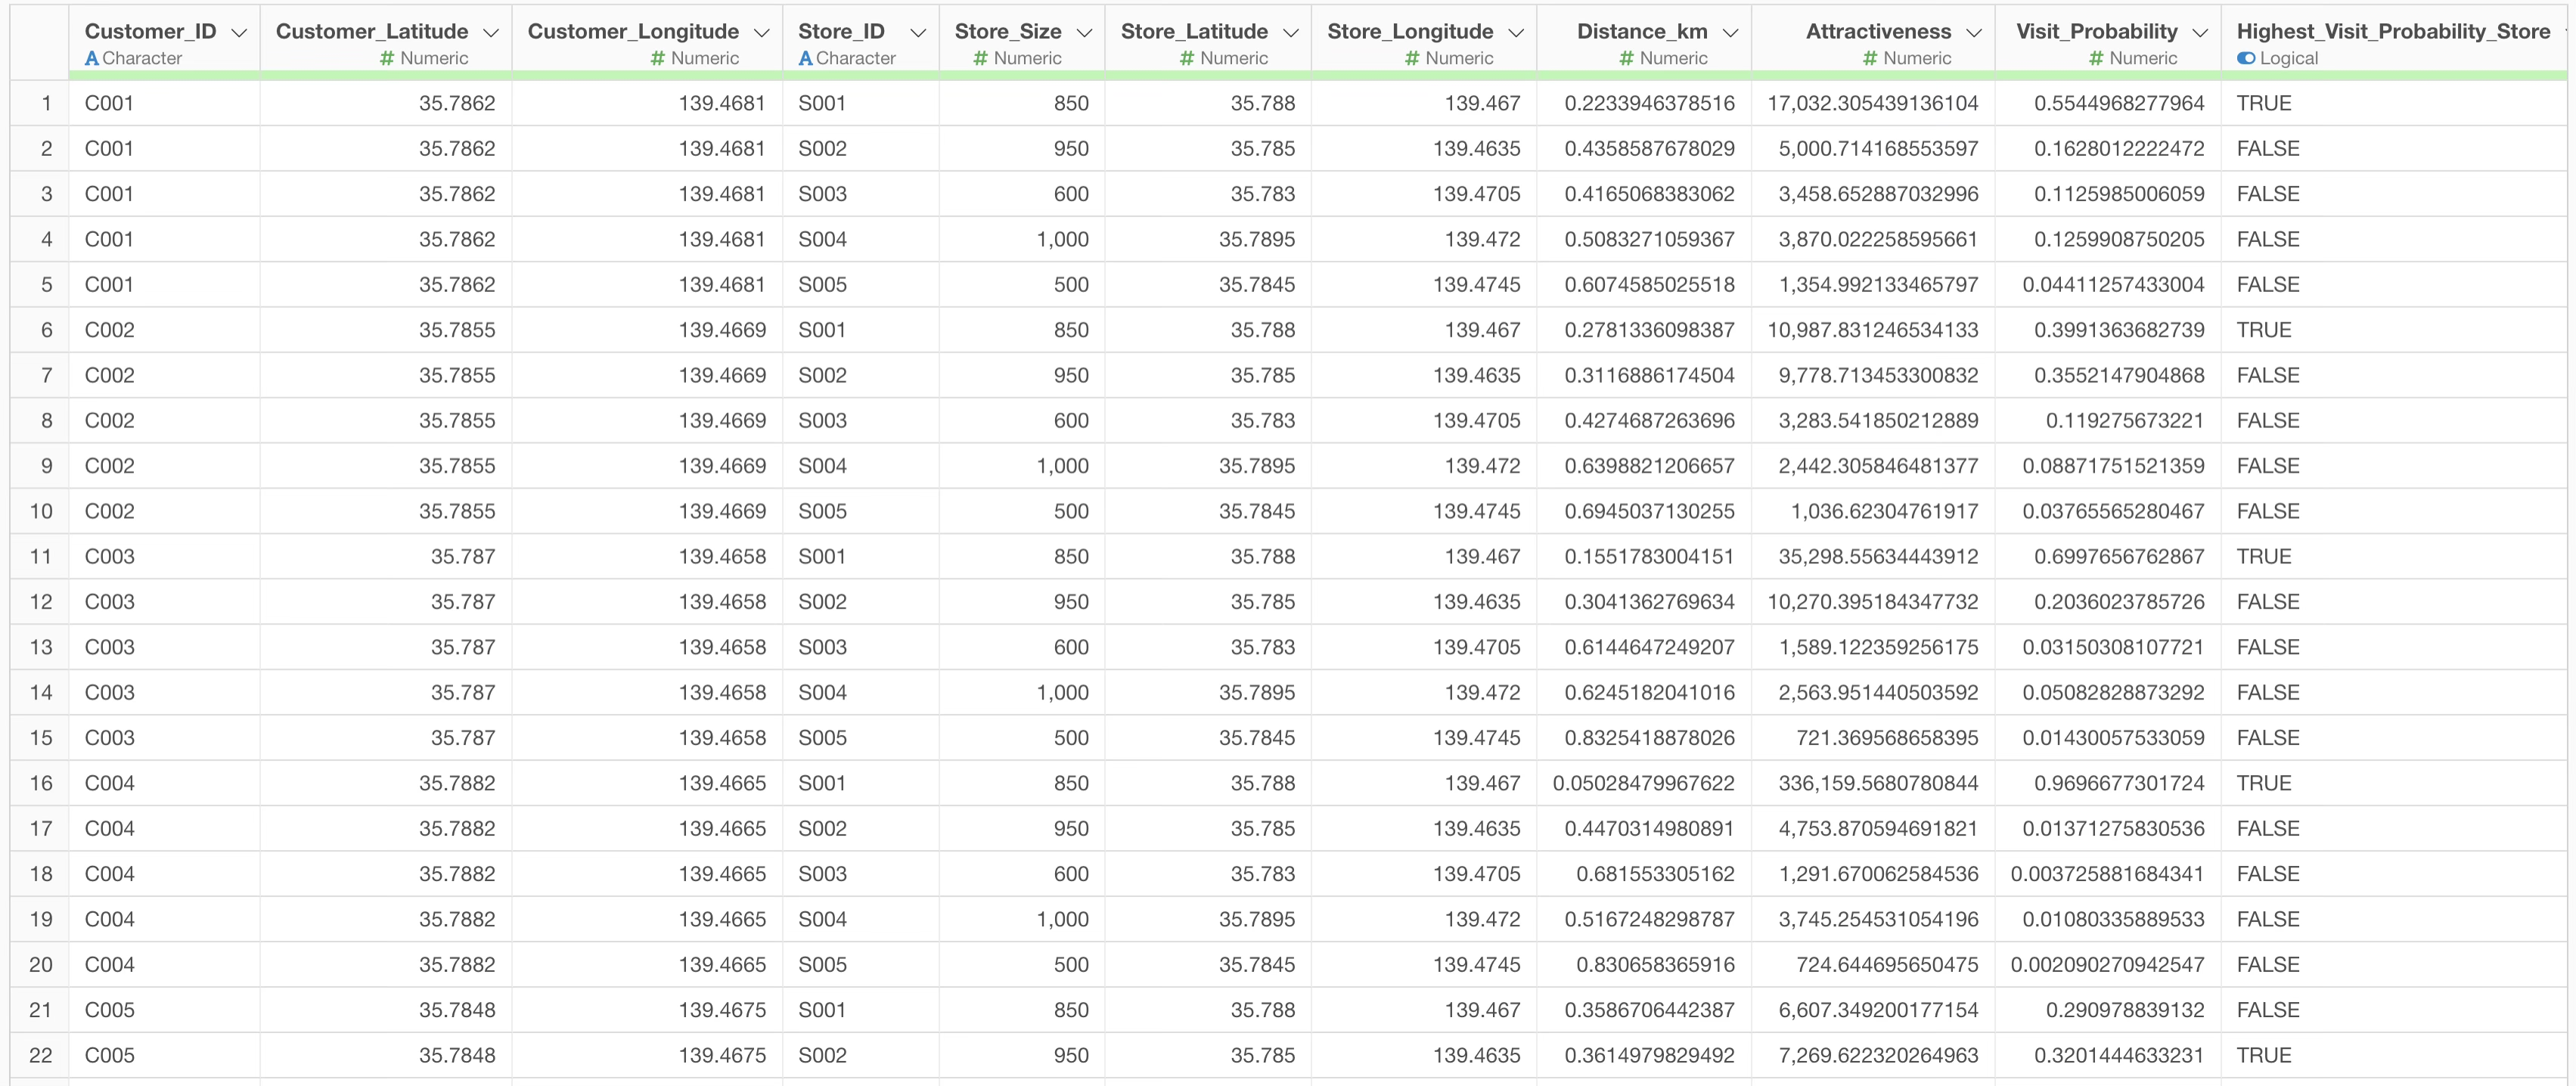
In Huff Model analysis, these two datasets are combined to create analysis data where each row represents a “pair of one customer and one store.”

Executing the Huff Model Using AI Prompts
In this example, we will execute a Huff Model analysis using AI prompts with customer and store data. (Customer data can be downloaded here, and store data here.)
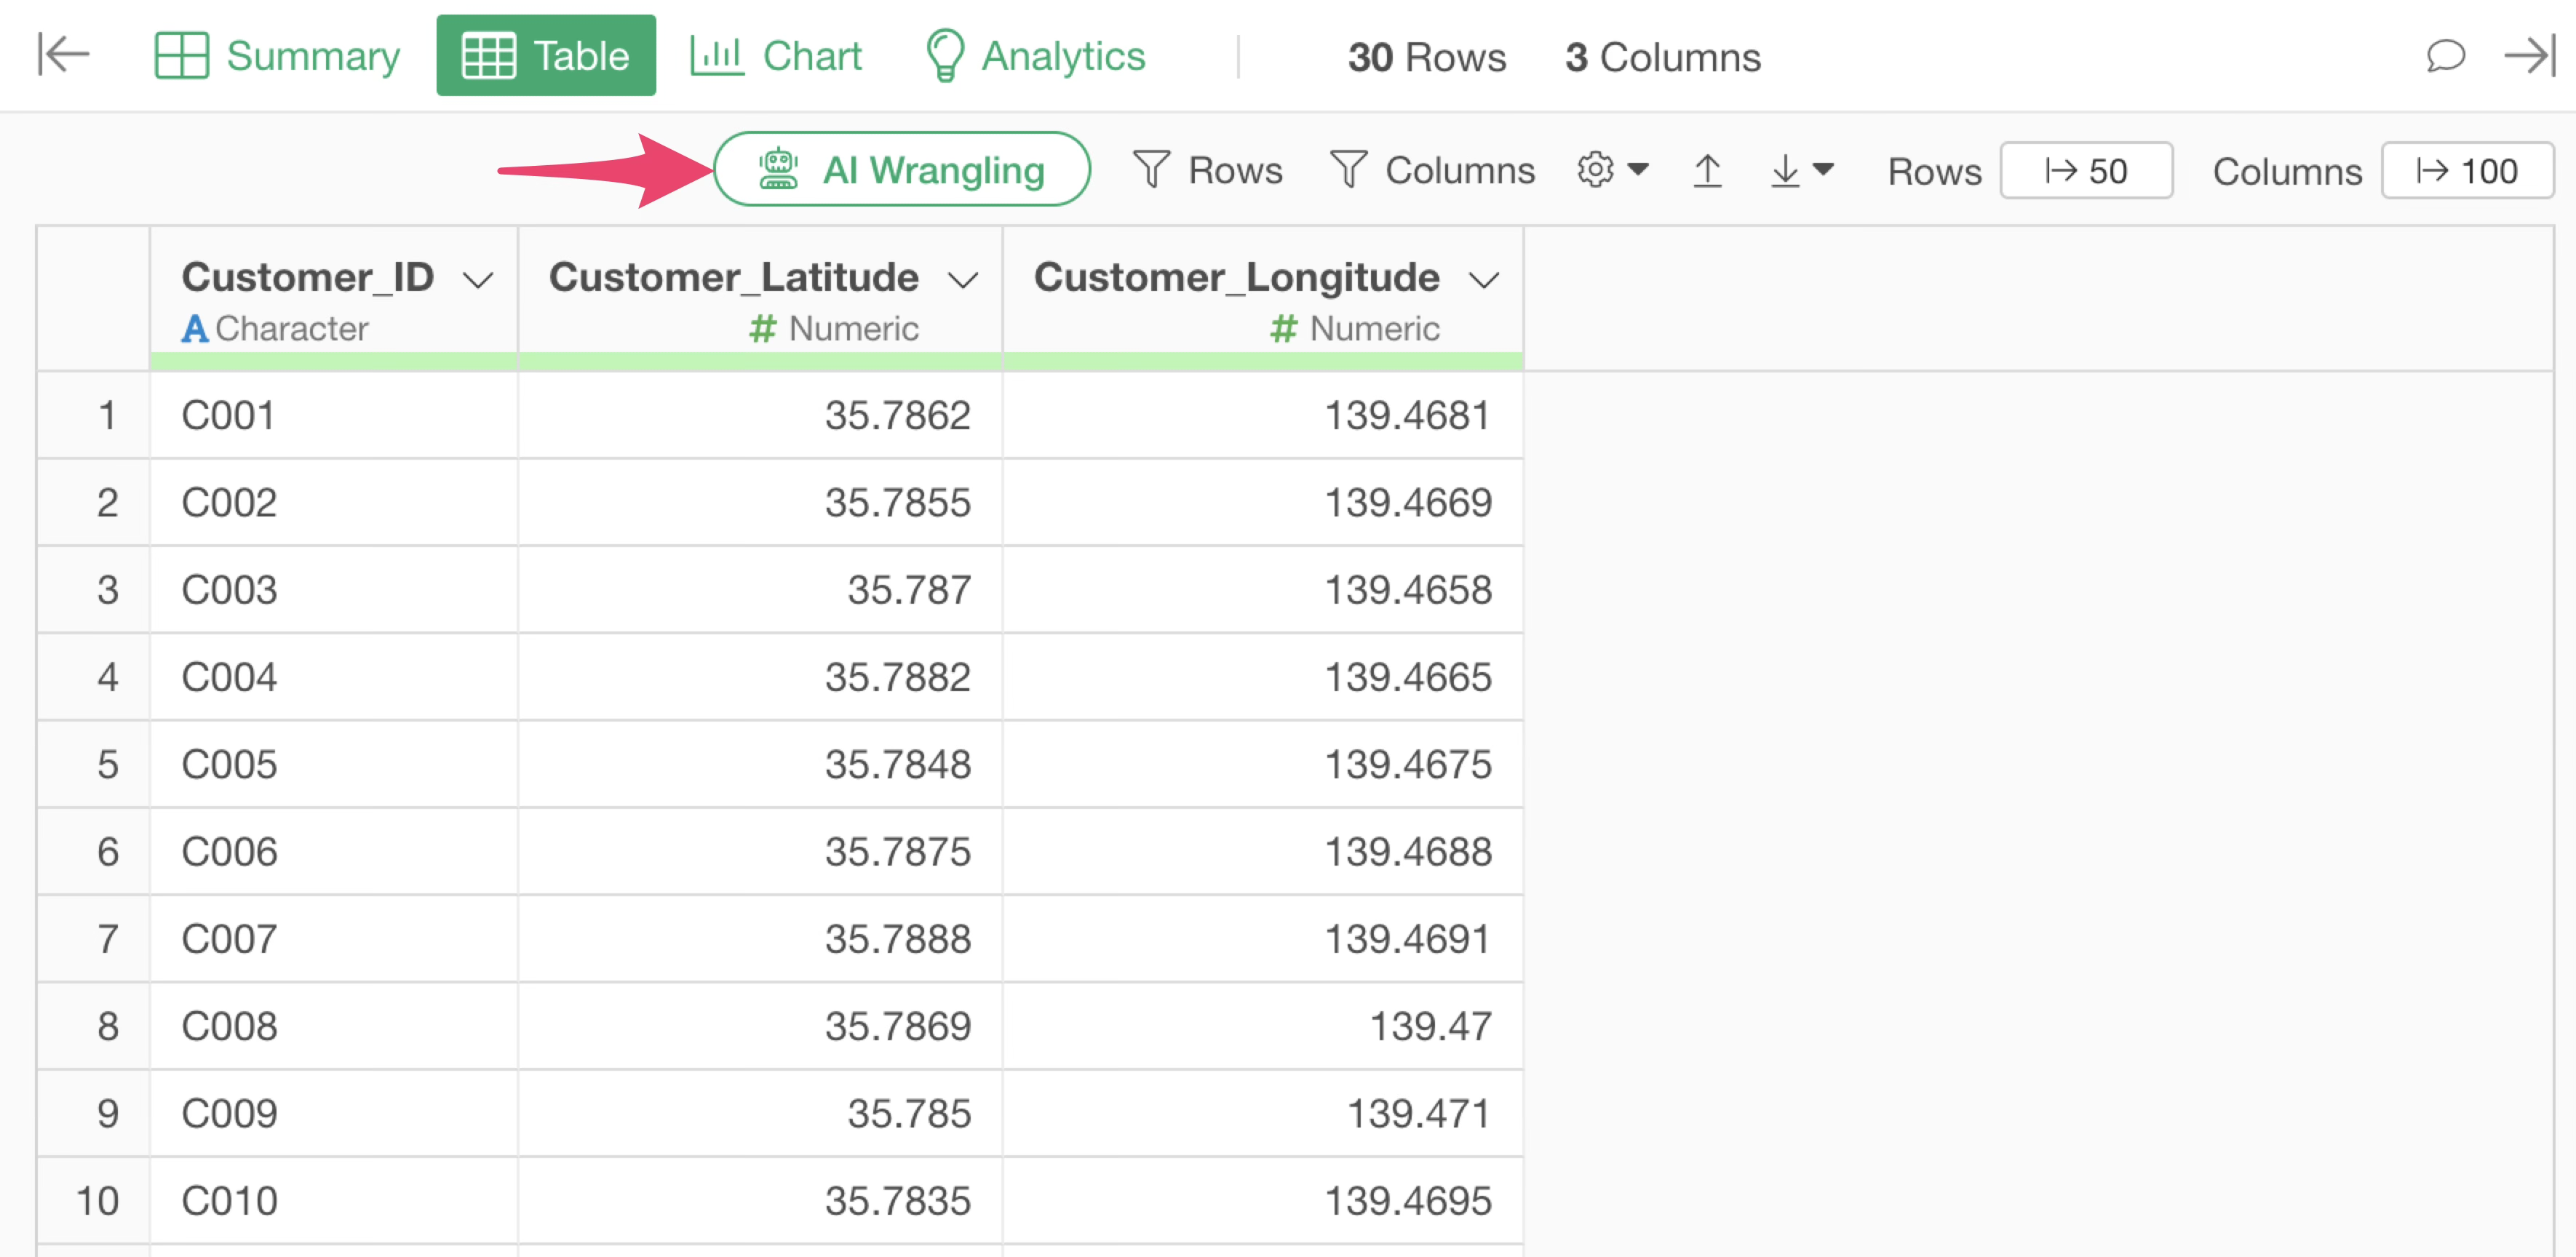
The customer data includes Customer ID and customer location information (Latitude/Longitude).
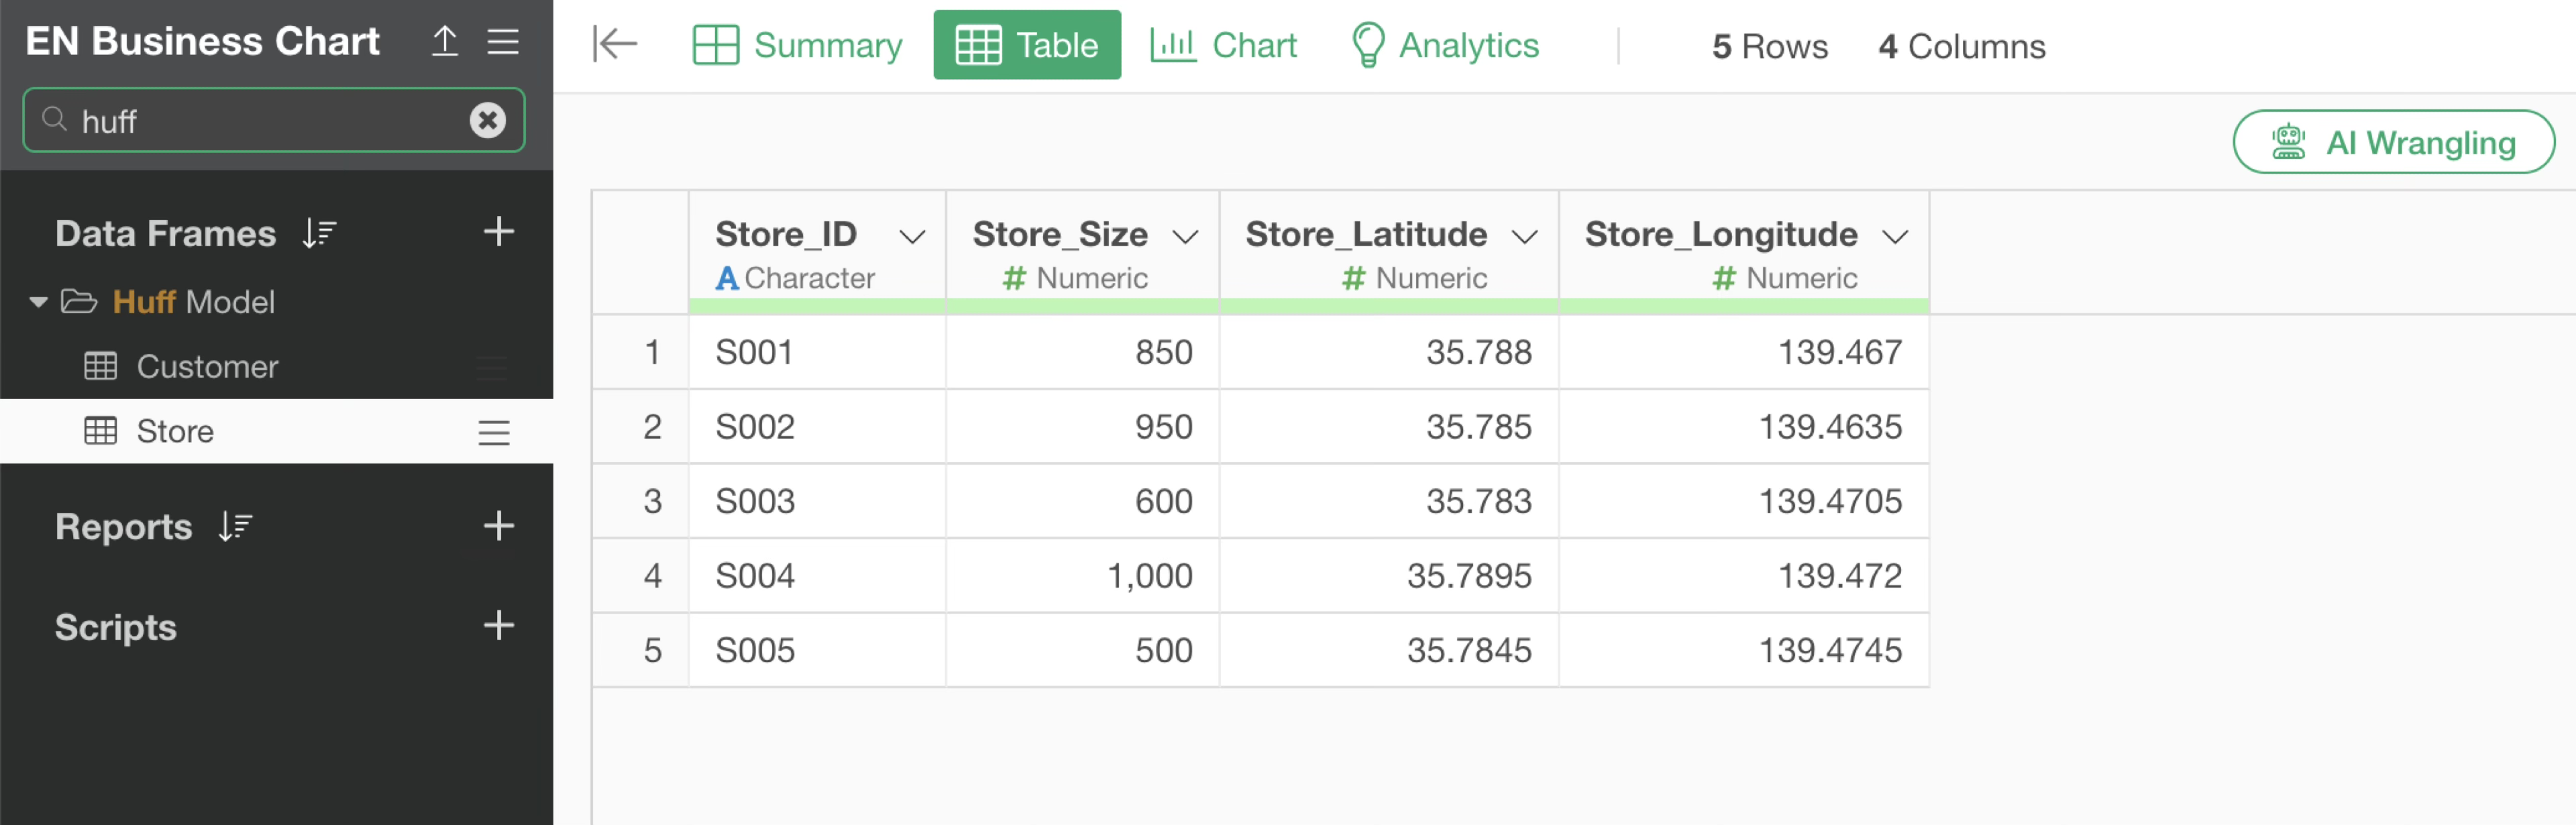
The store data includes Store Name, Store Size (floor area, etc.), and store location information (Latitude/Longitude).
After opening the customer data, click the “AI Wrangling” button.
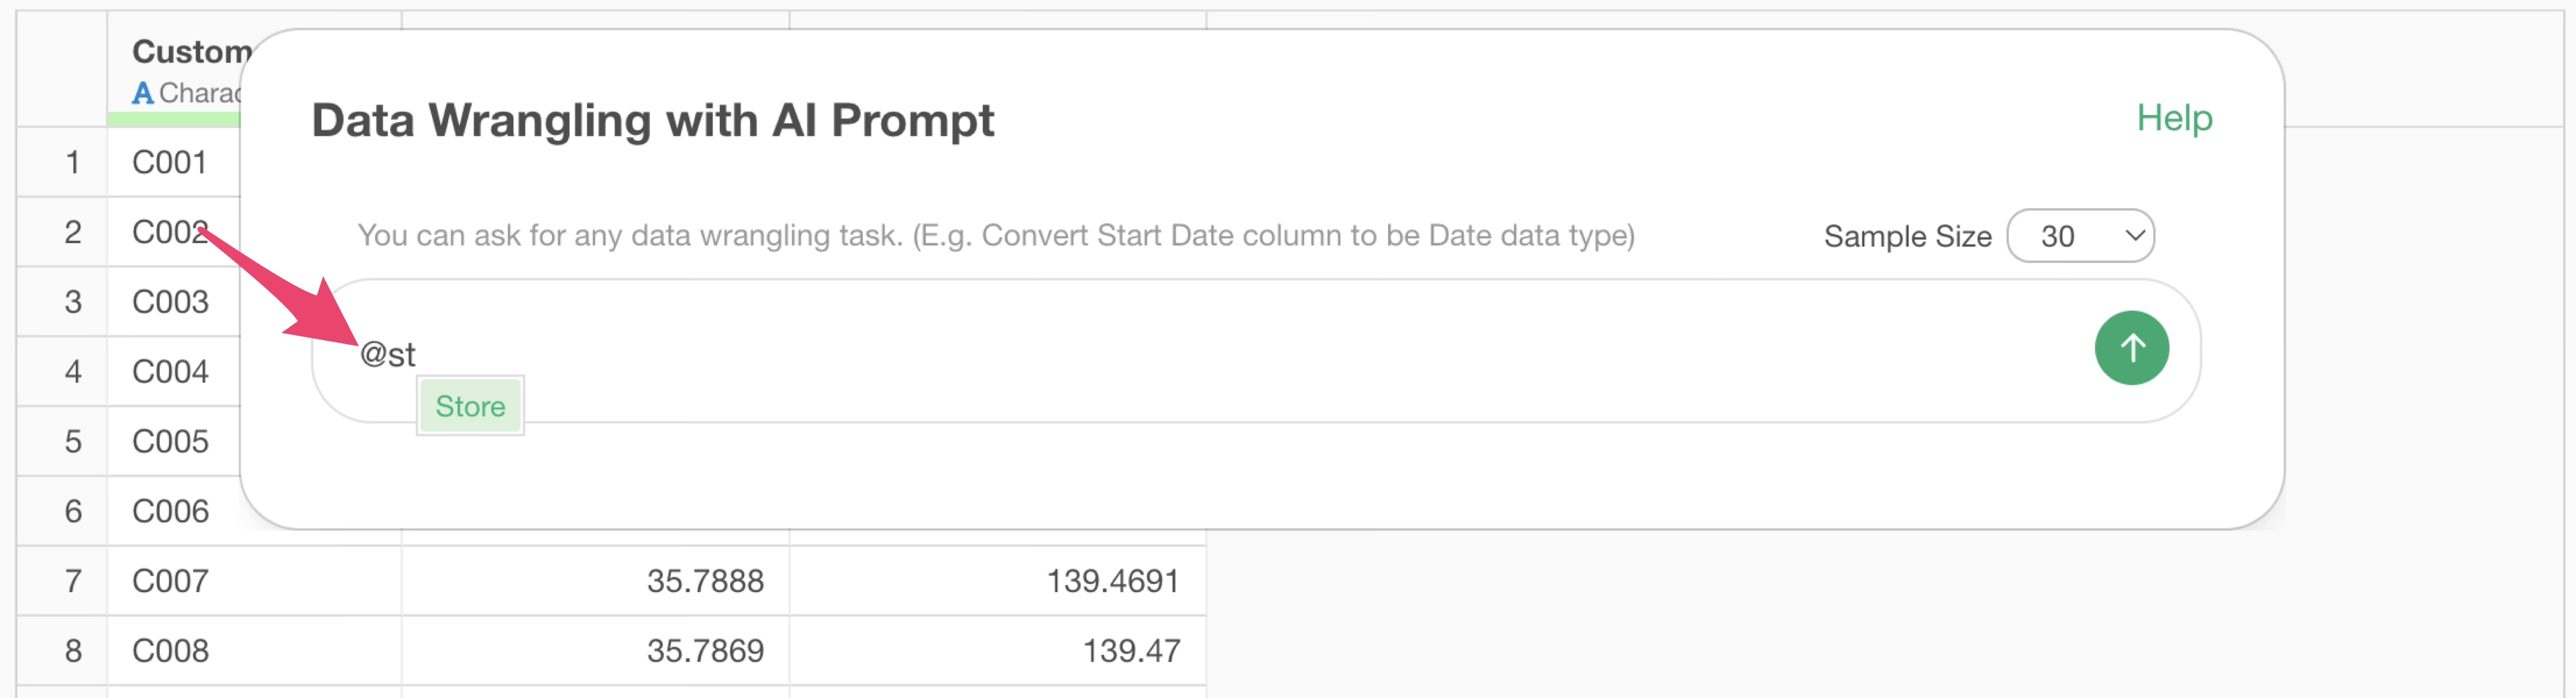
When the AI Prompt dialog opens, type @ and select the
“Store” data frame from within the same project.
Next, enter text like the following and execute:
Run a Huff Model using @Store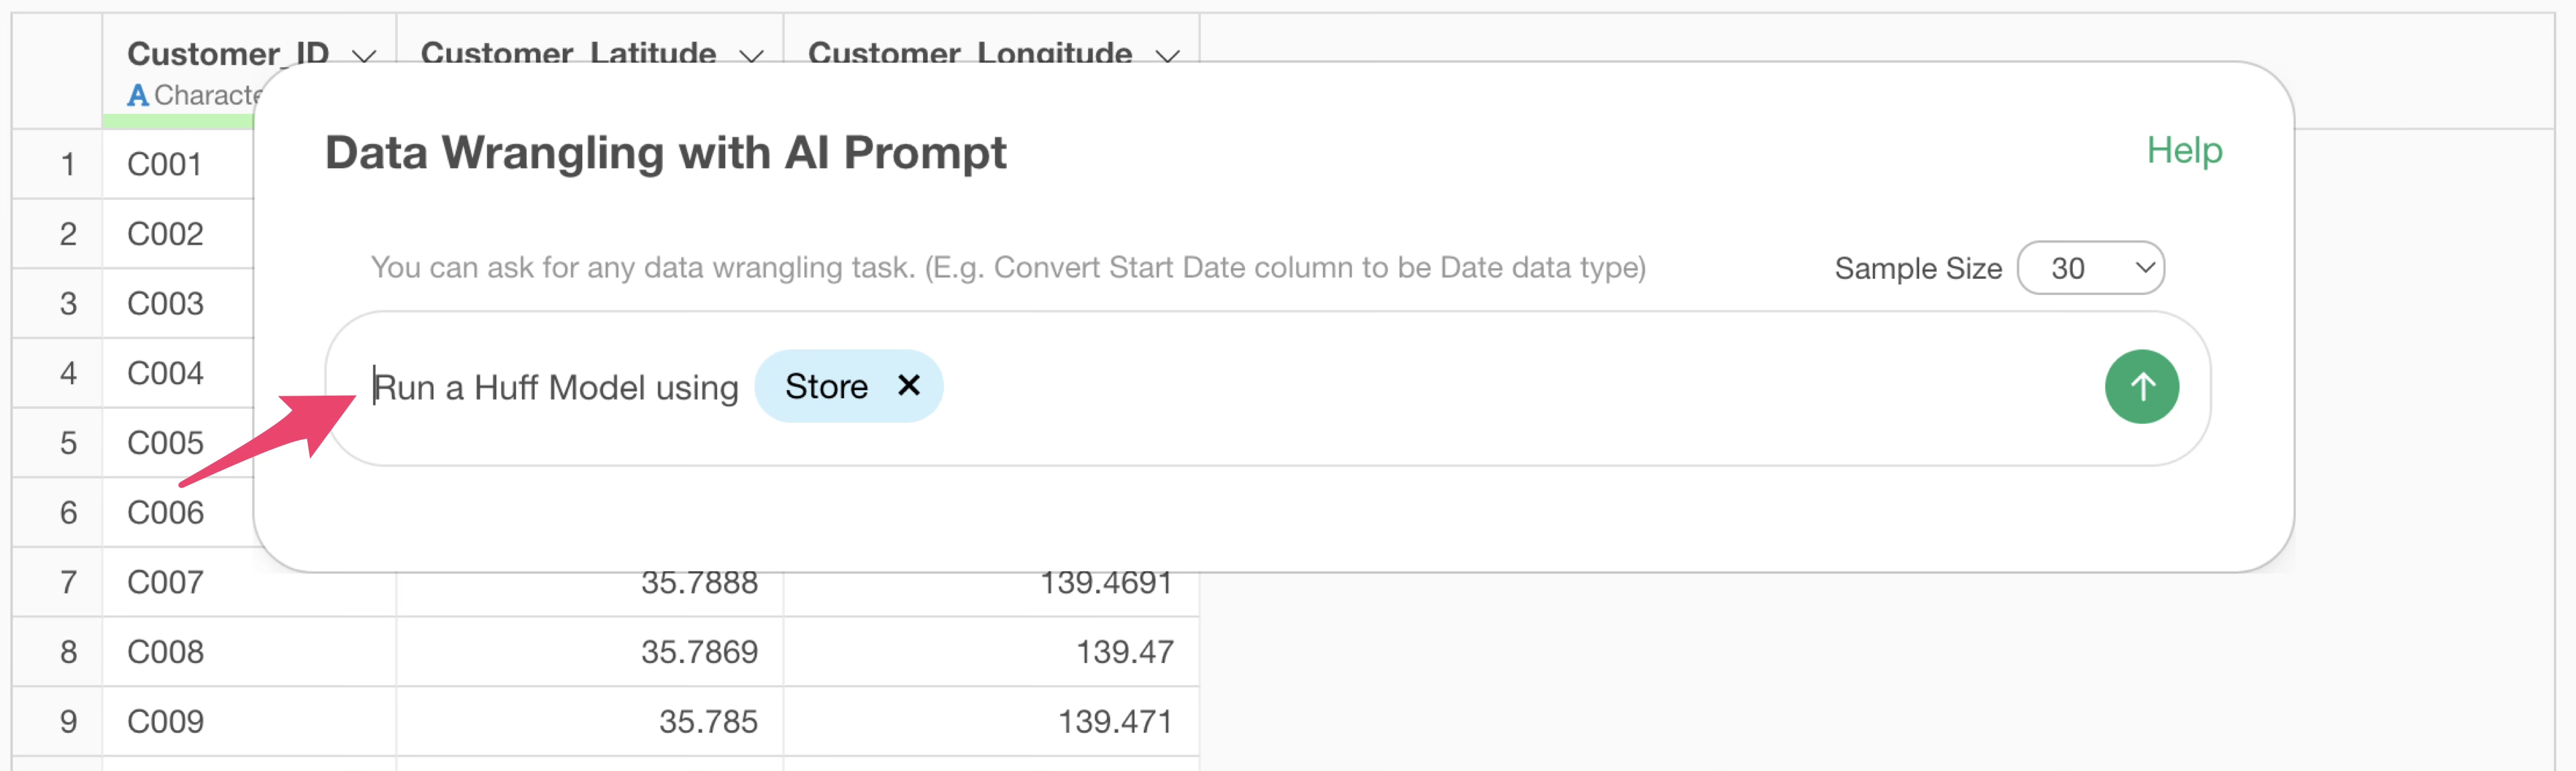
The code to execute the Huff Model will then be generated.
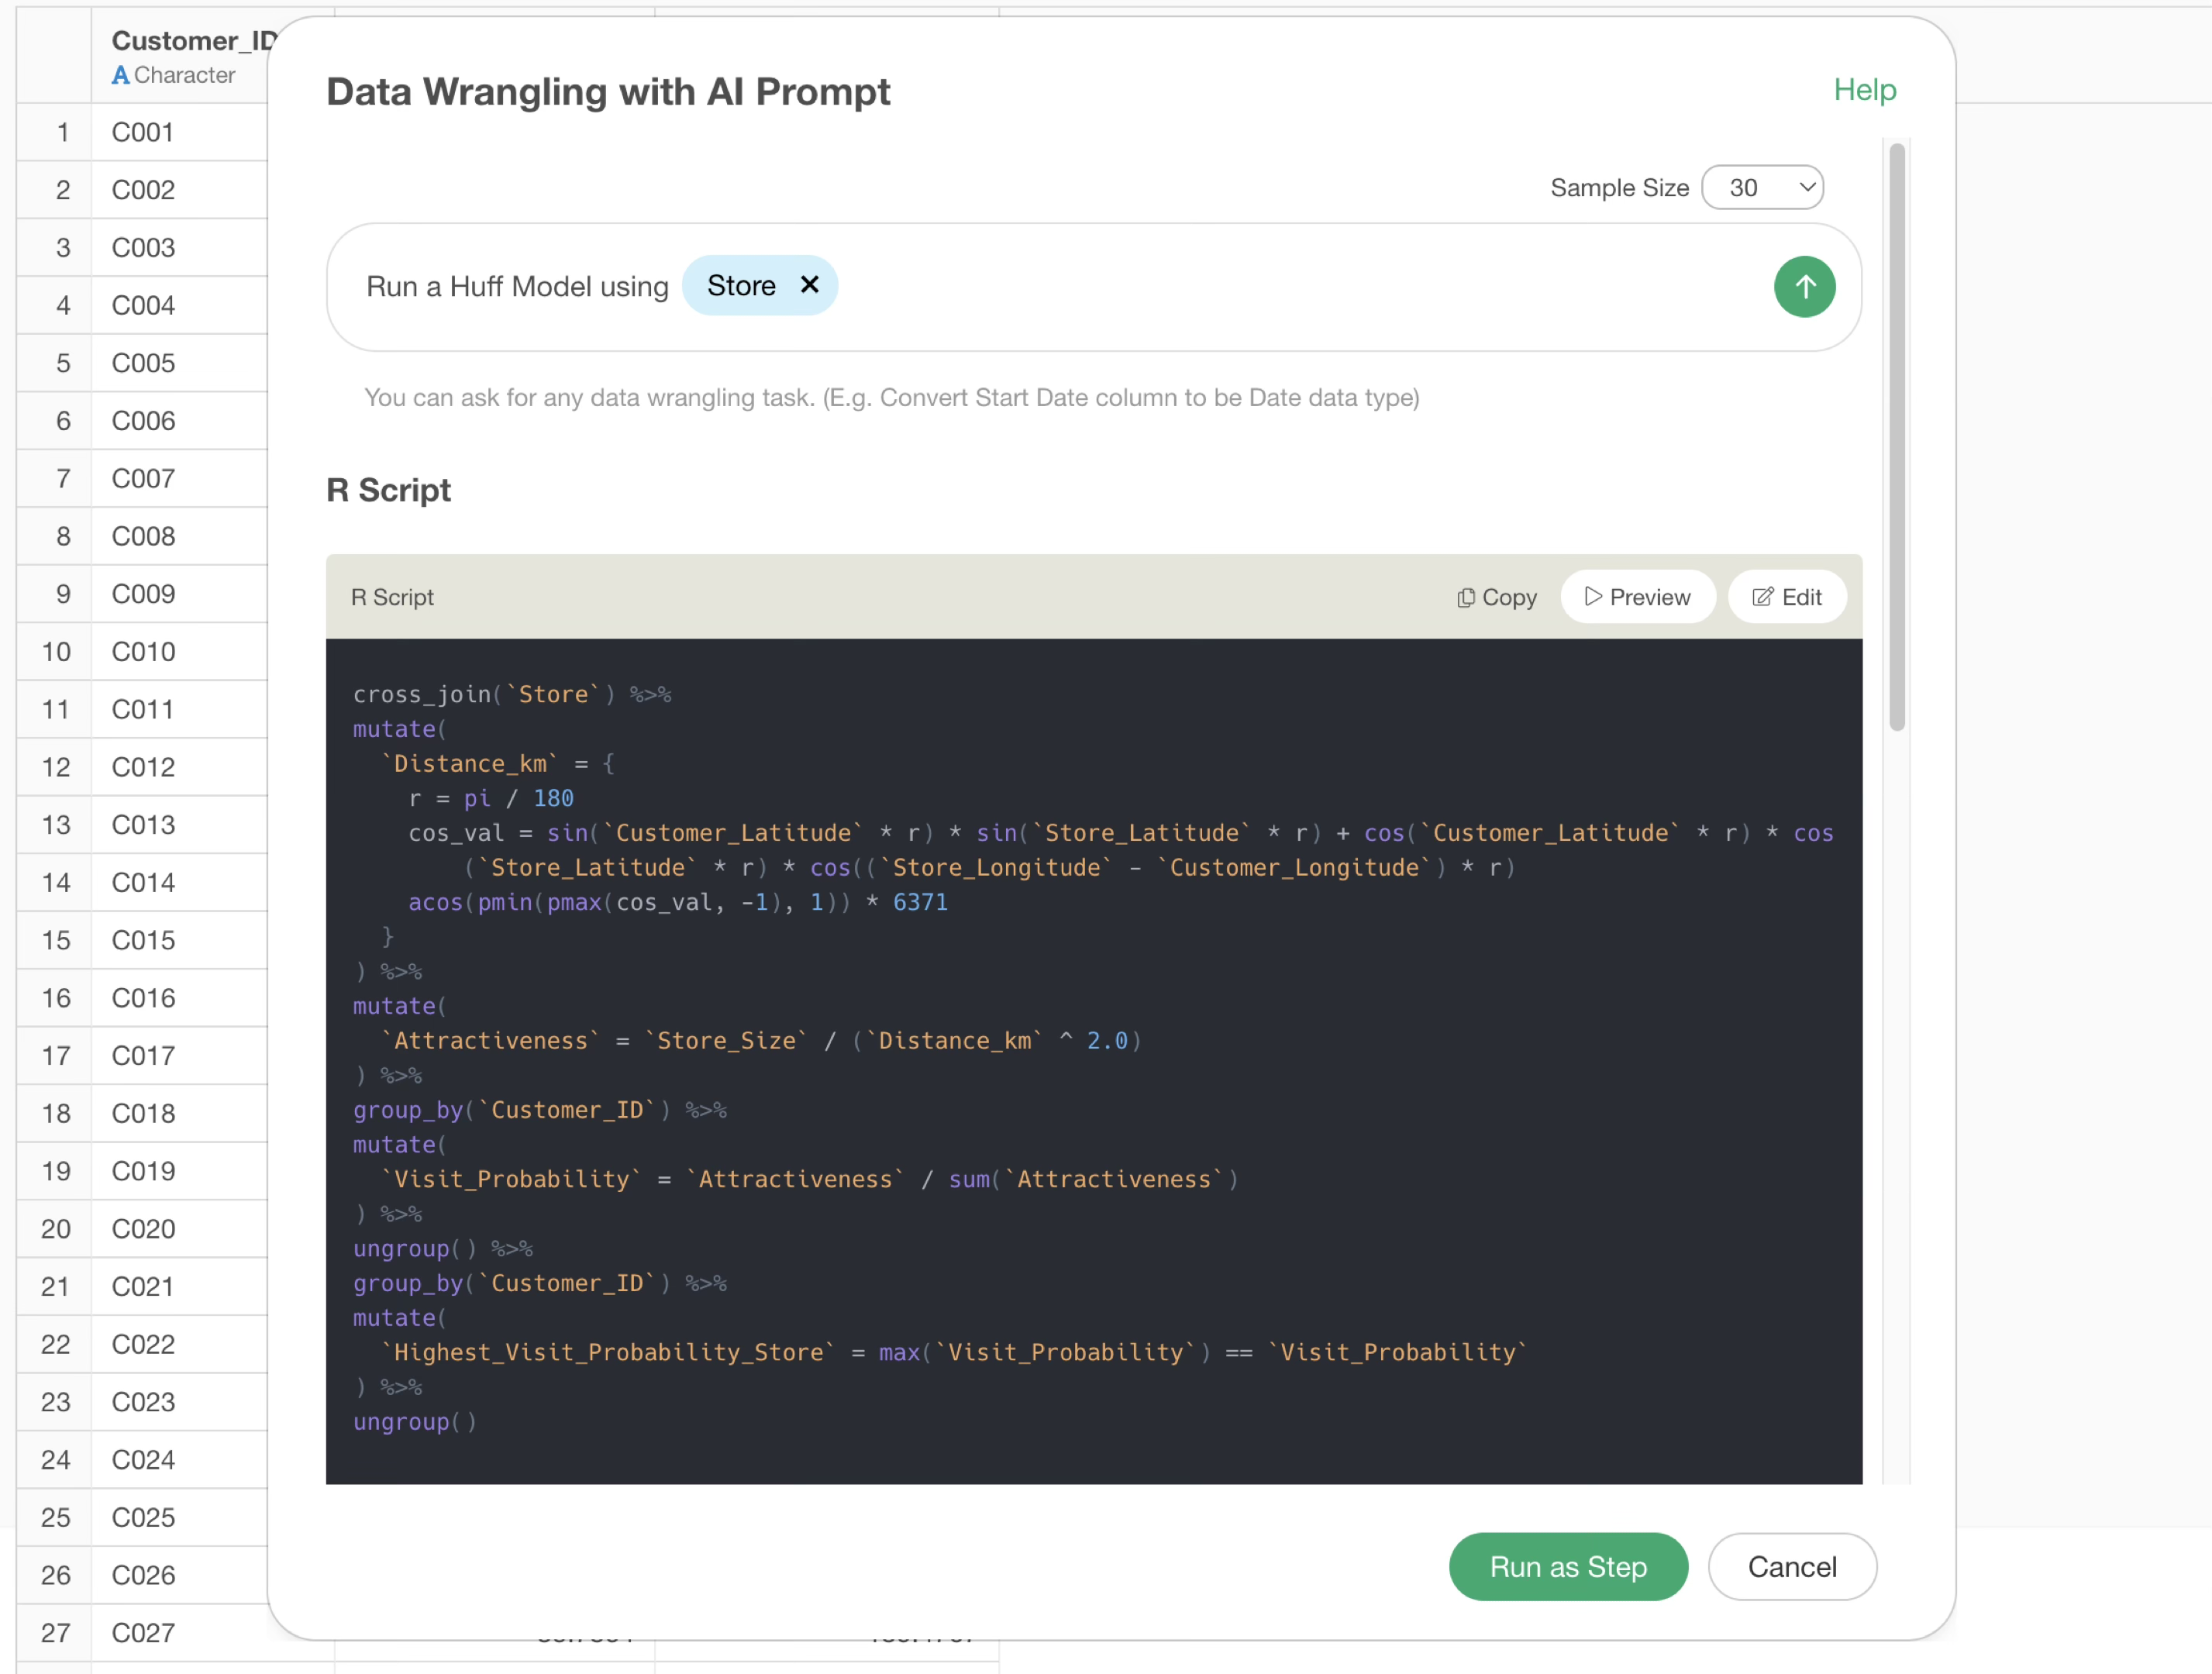
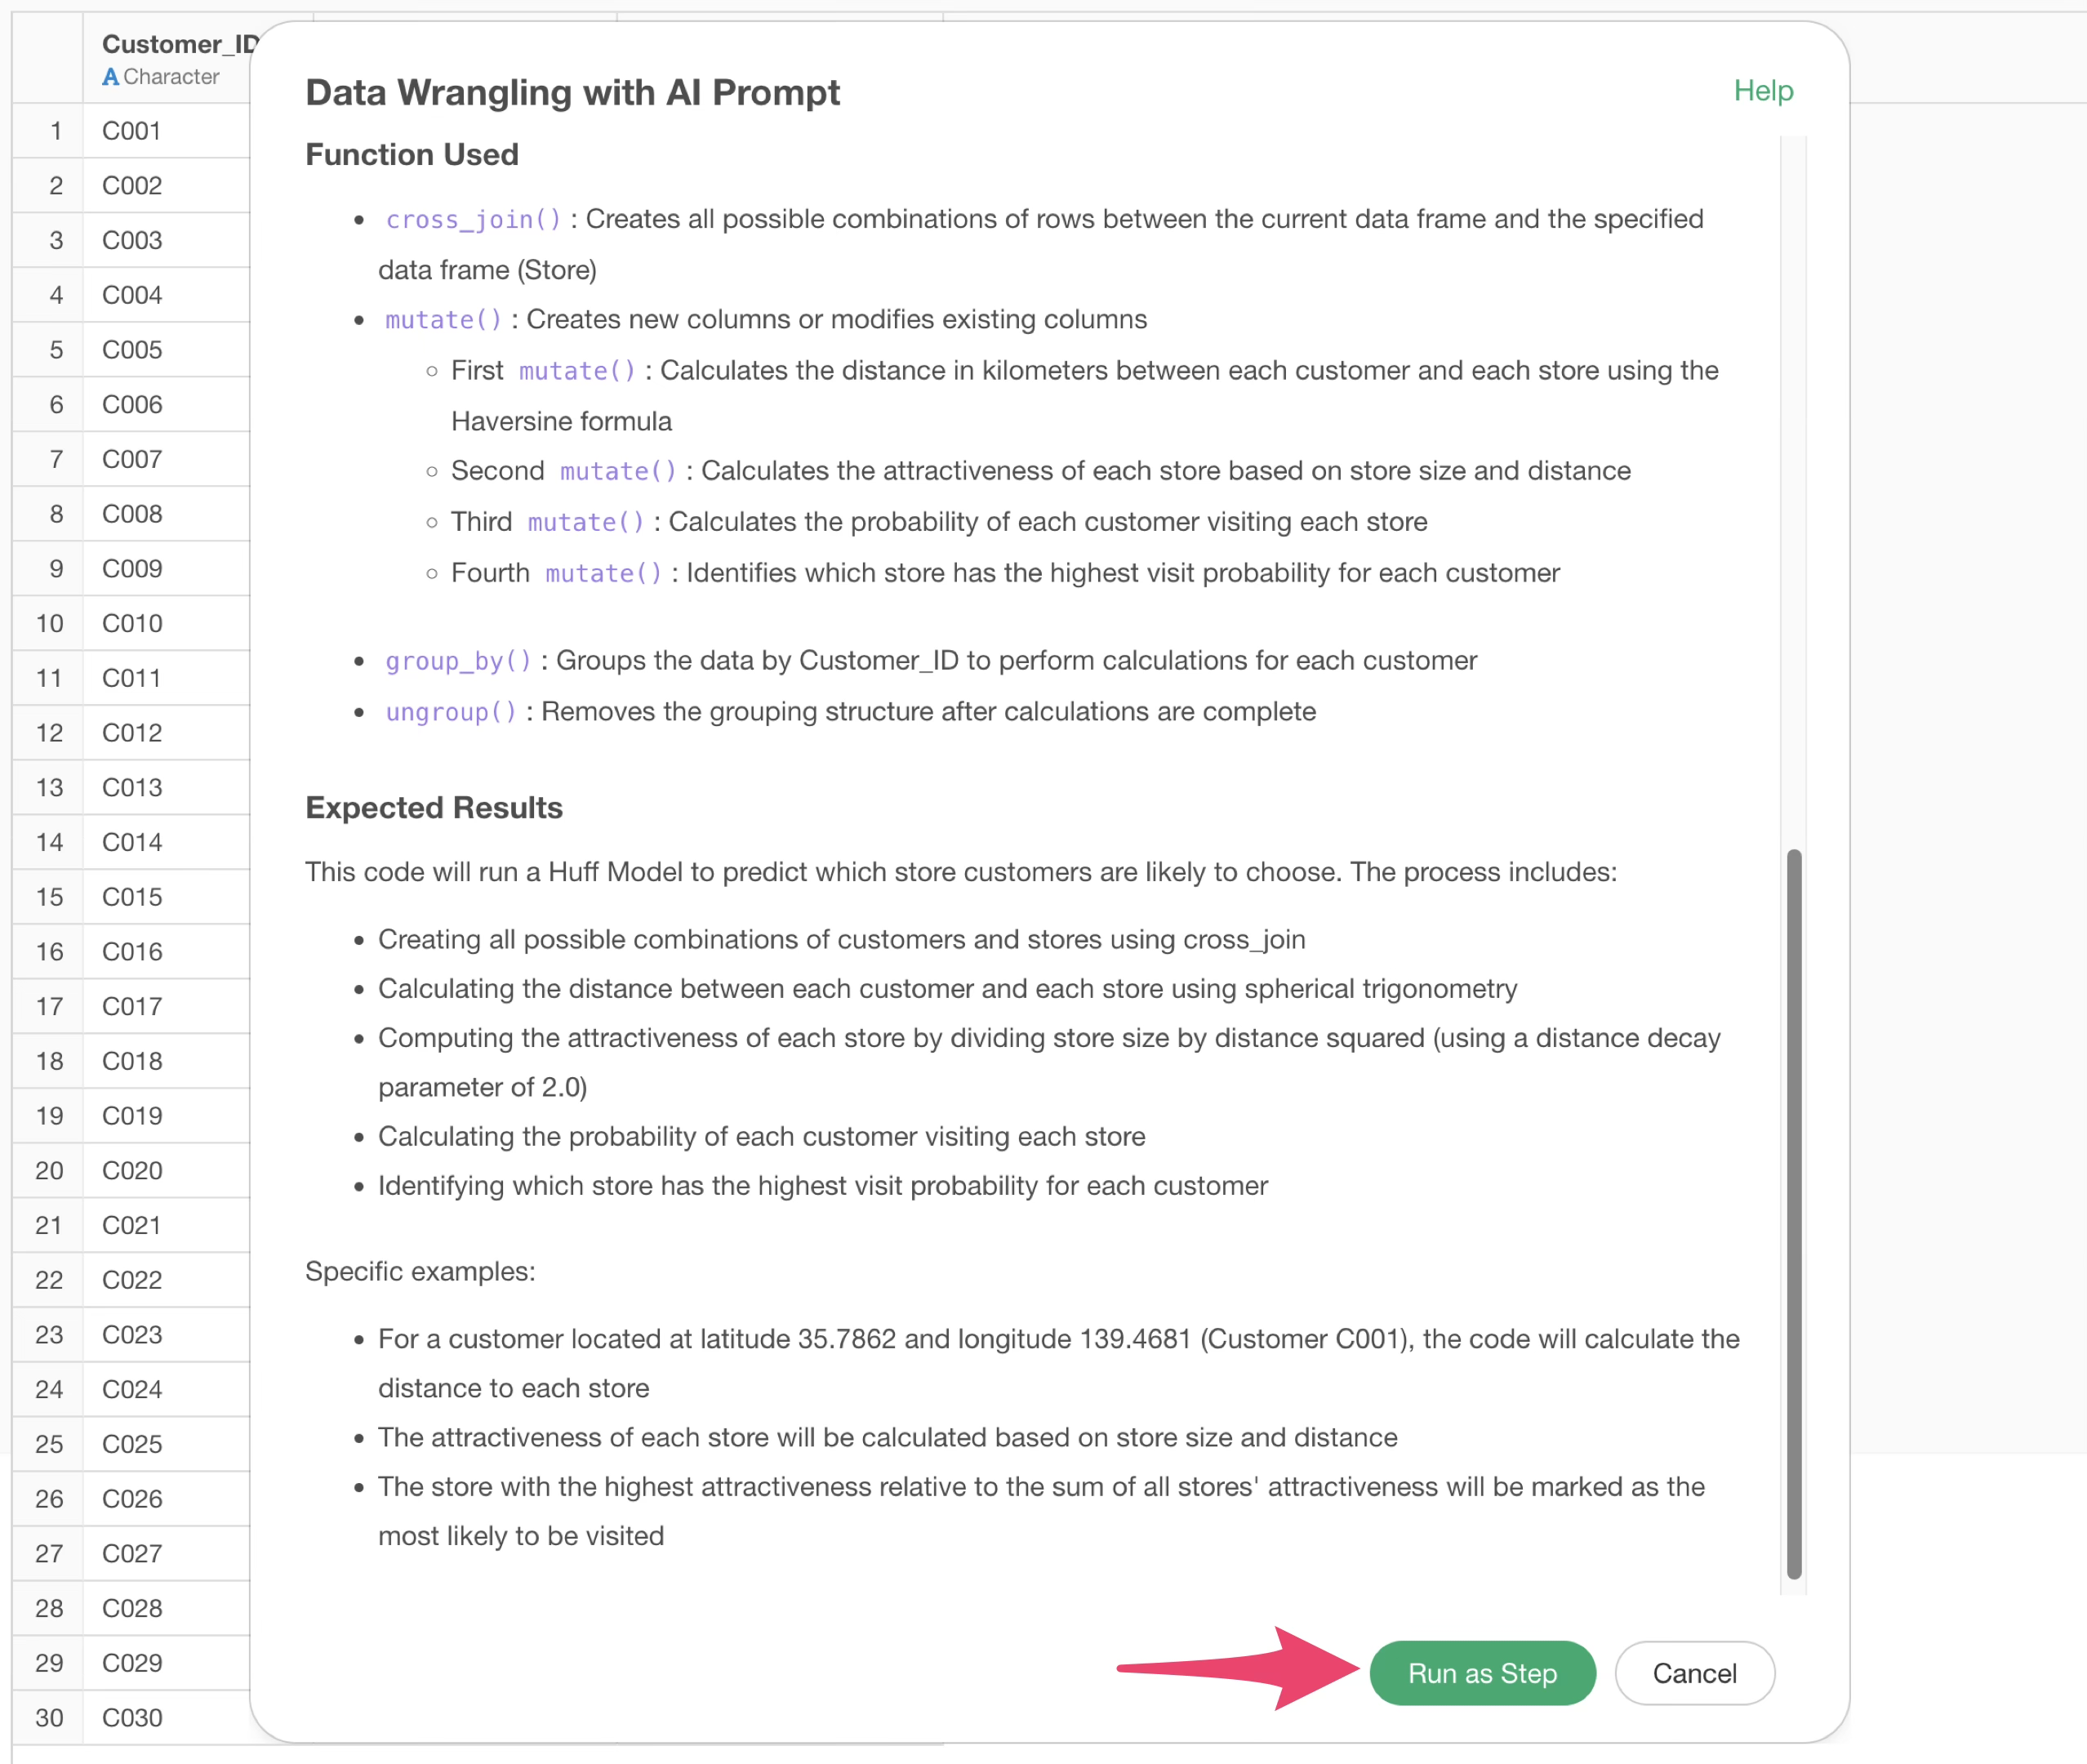
The generated code joins the customer and store data, calculates the distance between them, and computes the store attractiveness and the probability of each customer visiting.
Review the explanation of the functions used and the expected results, then click the “Run as Step” button.
The step is added, and the data for the Huff Model is created.
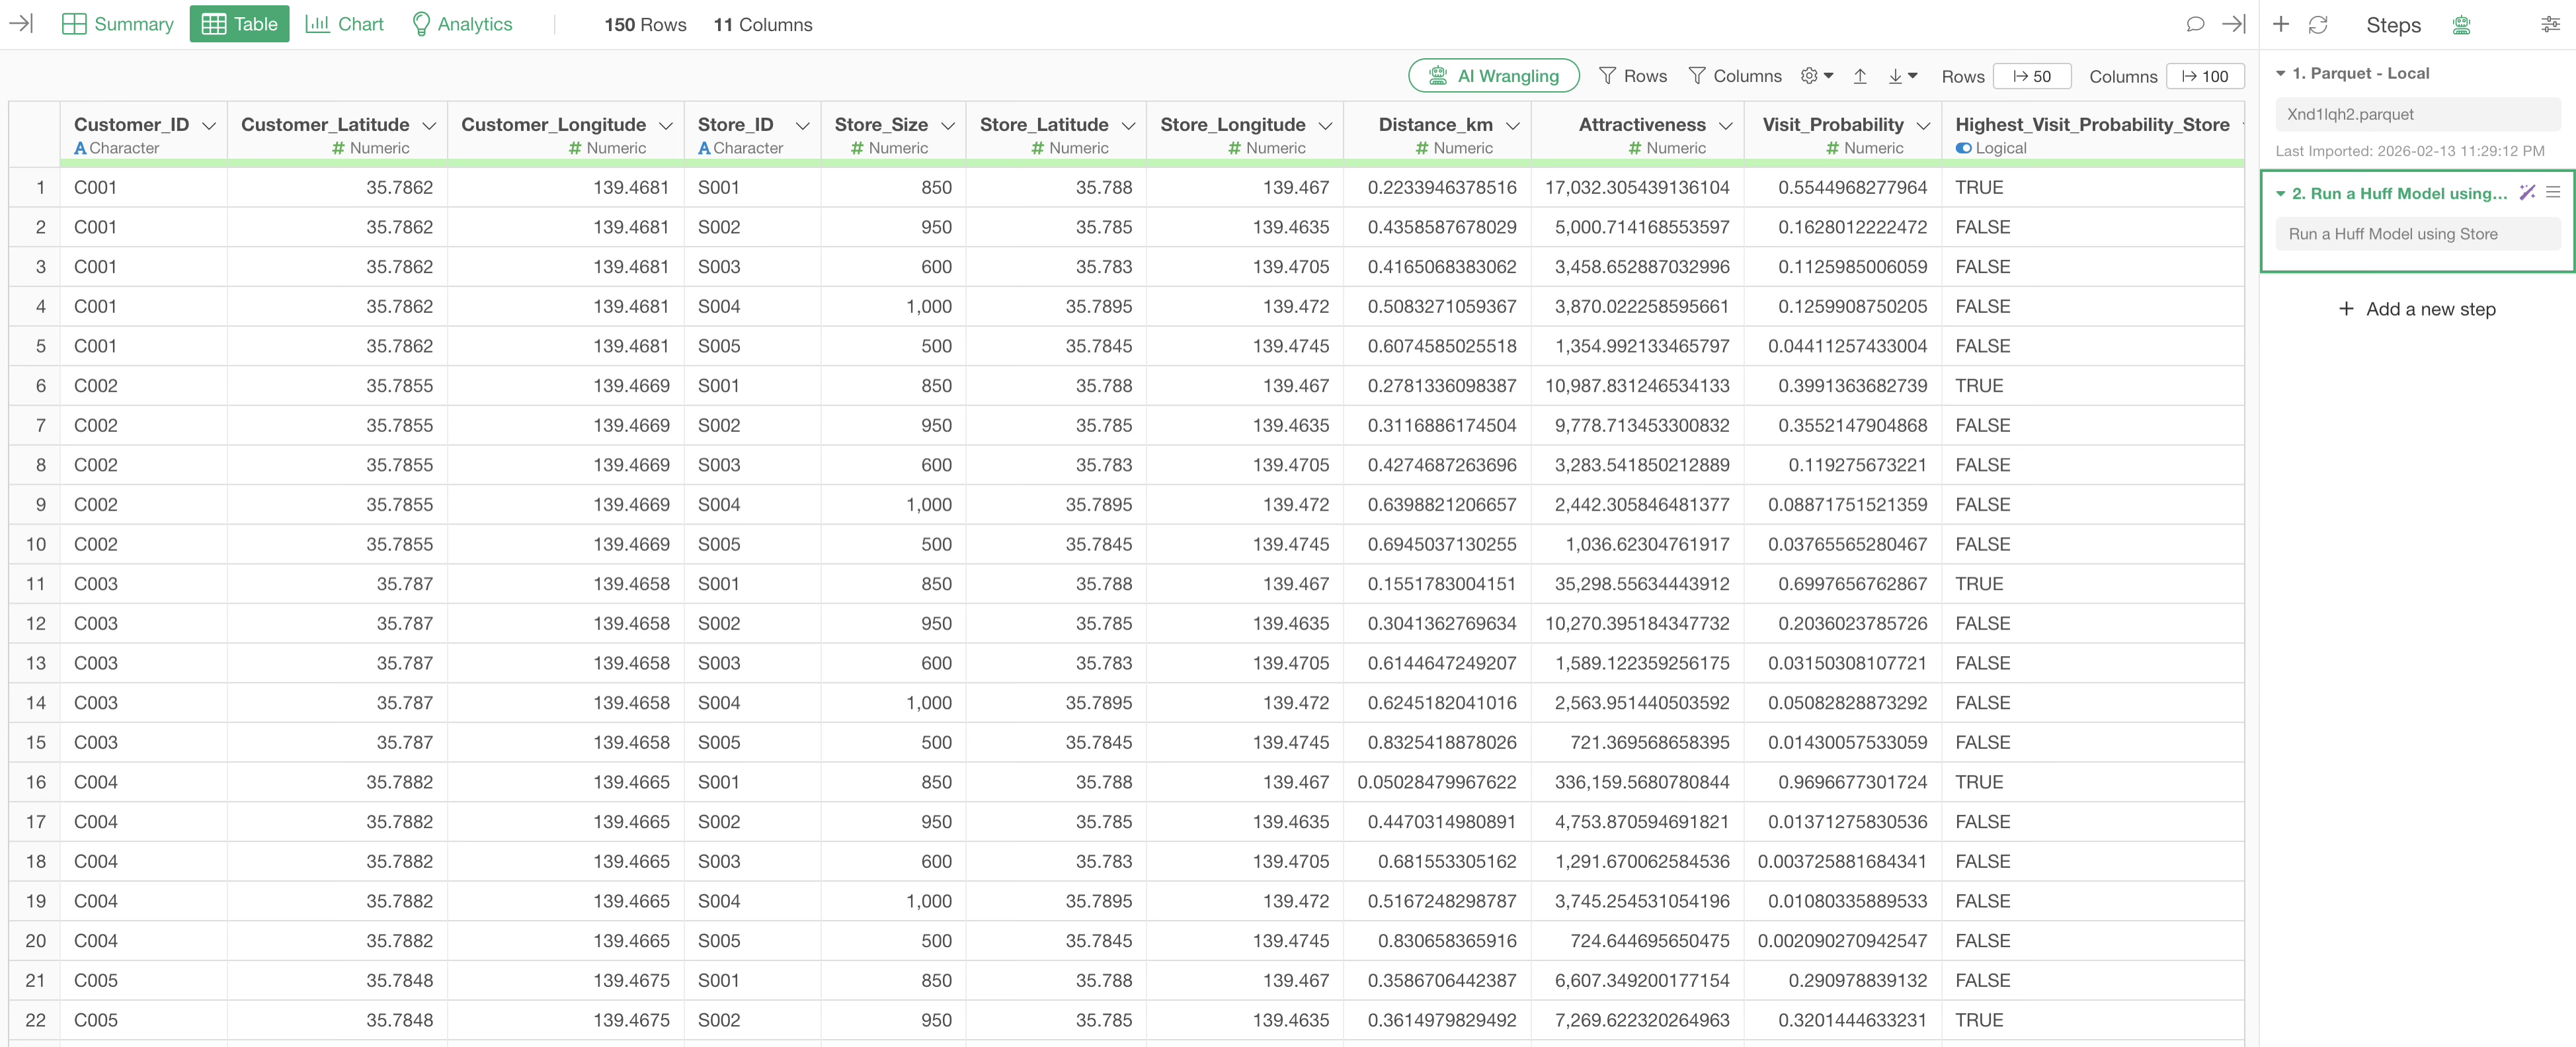
In the resulting data, distance, attractiveness, and visit probability are calculated for each combination of customer and store. Additionally, the store with the highest visit probability for each customer is identified.
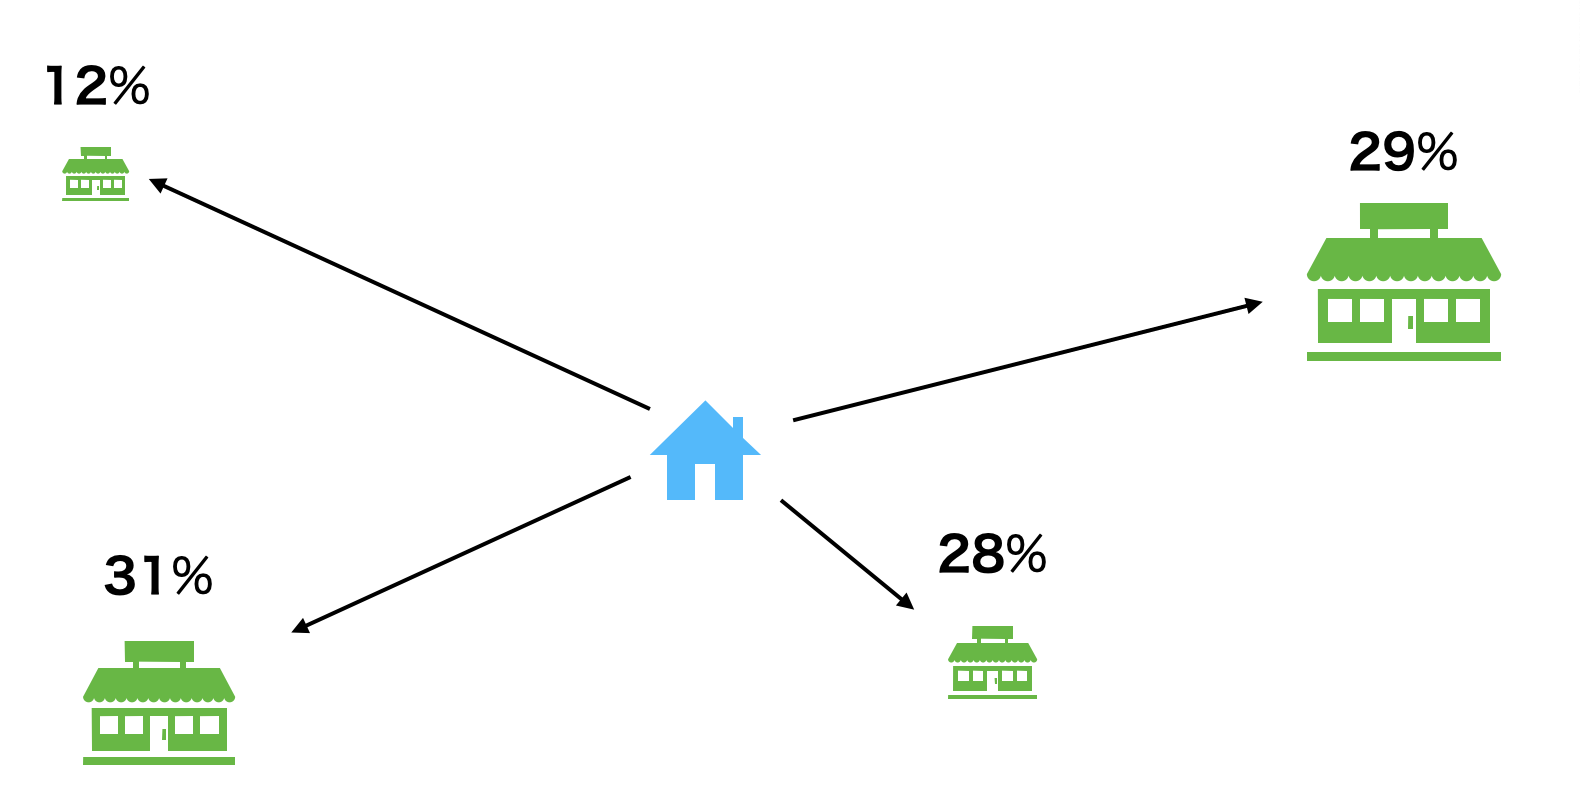
All that’s left is to visualize it with a chart. In this case, we will display the “store with the highest visit probability for each customer” on a map.
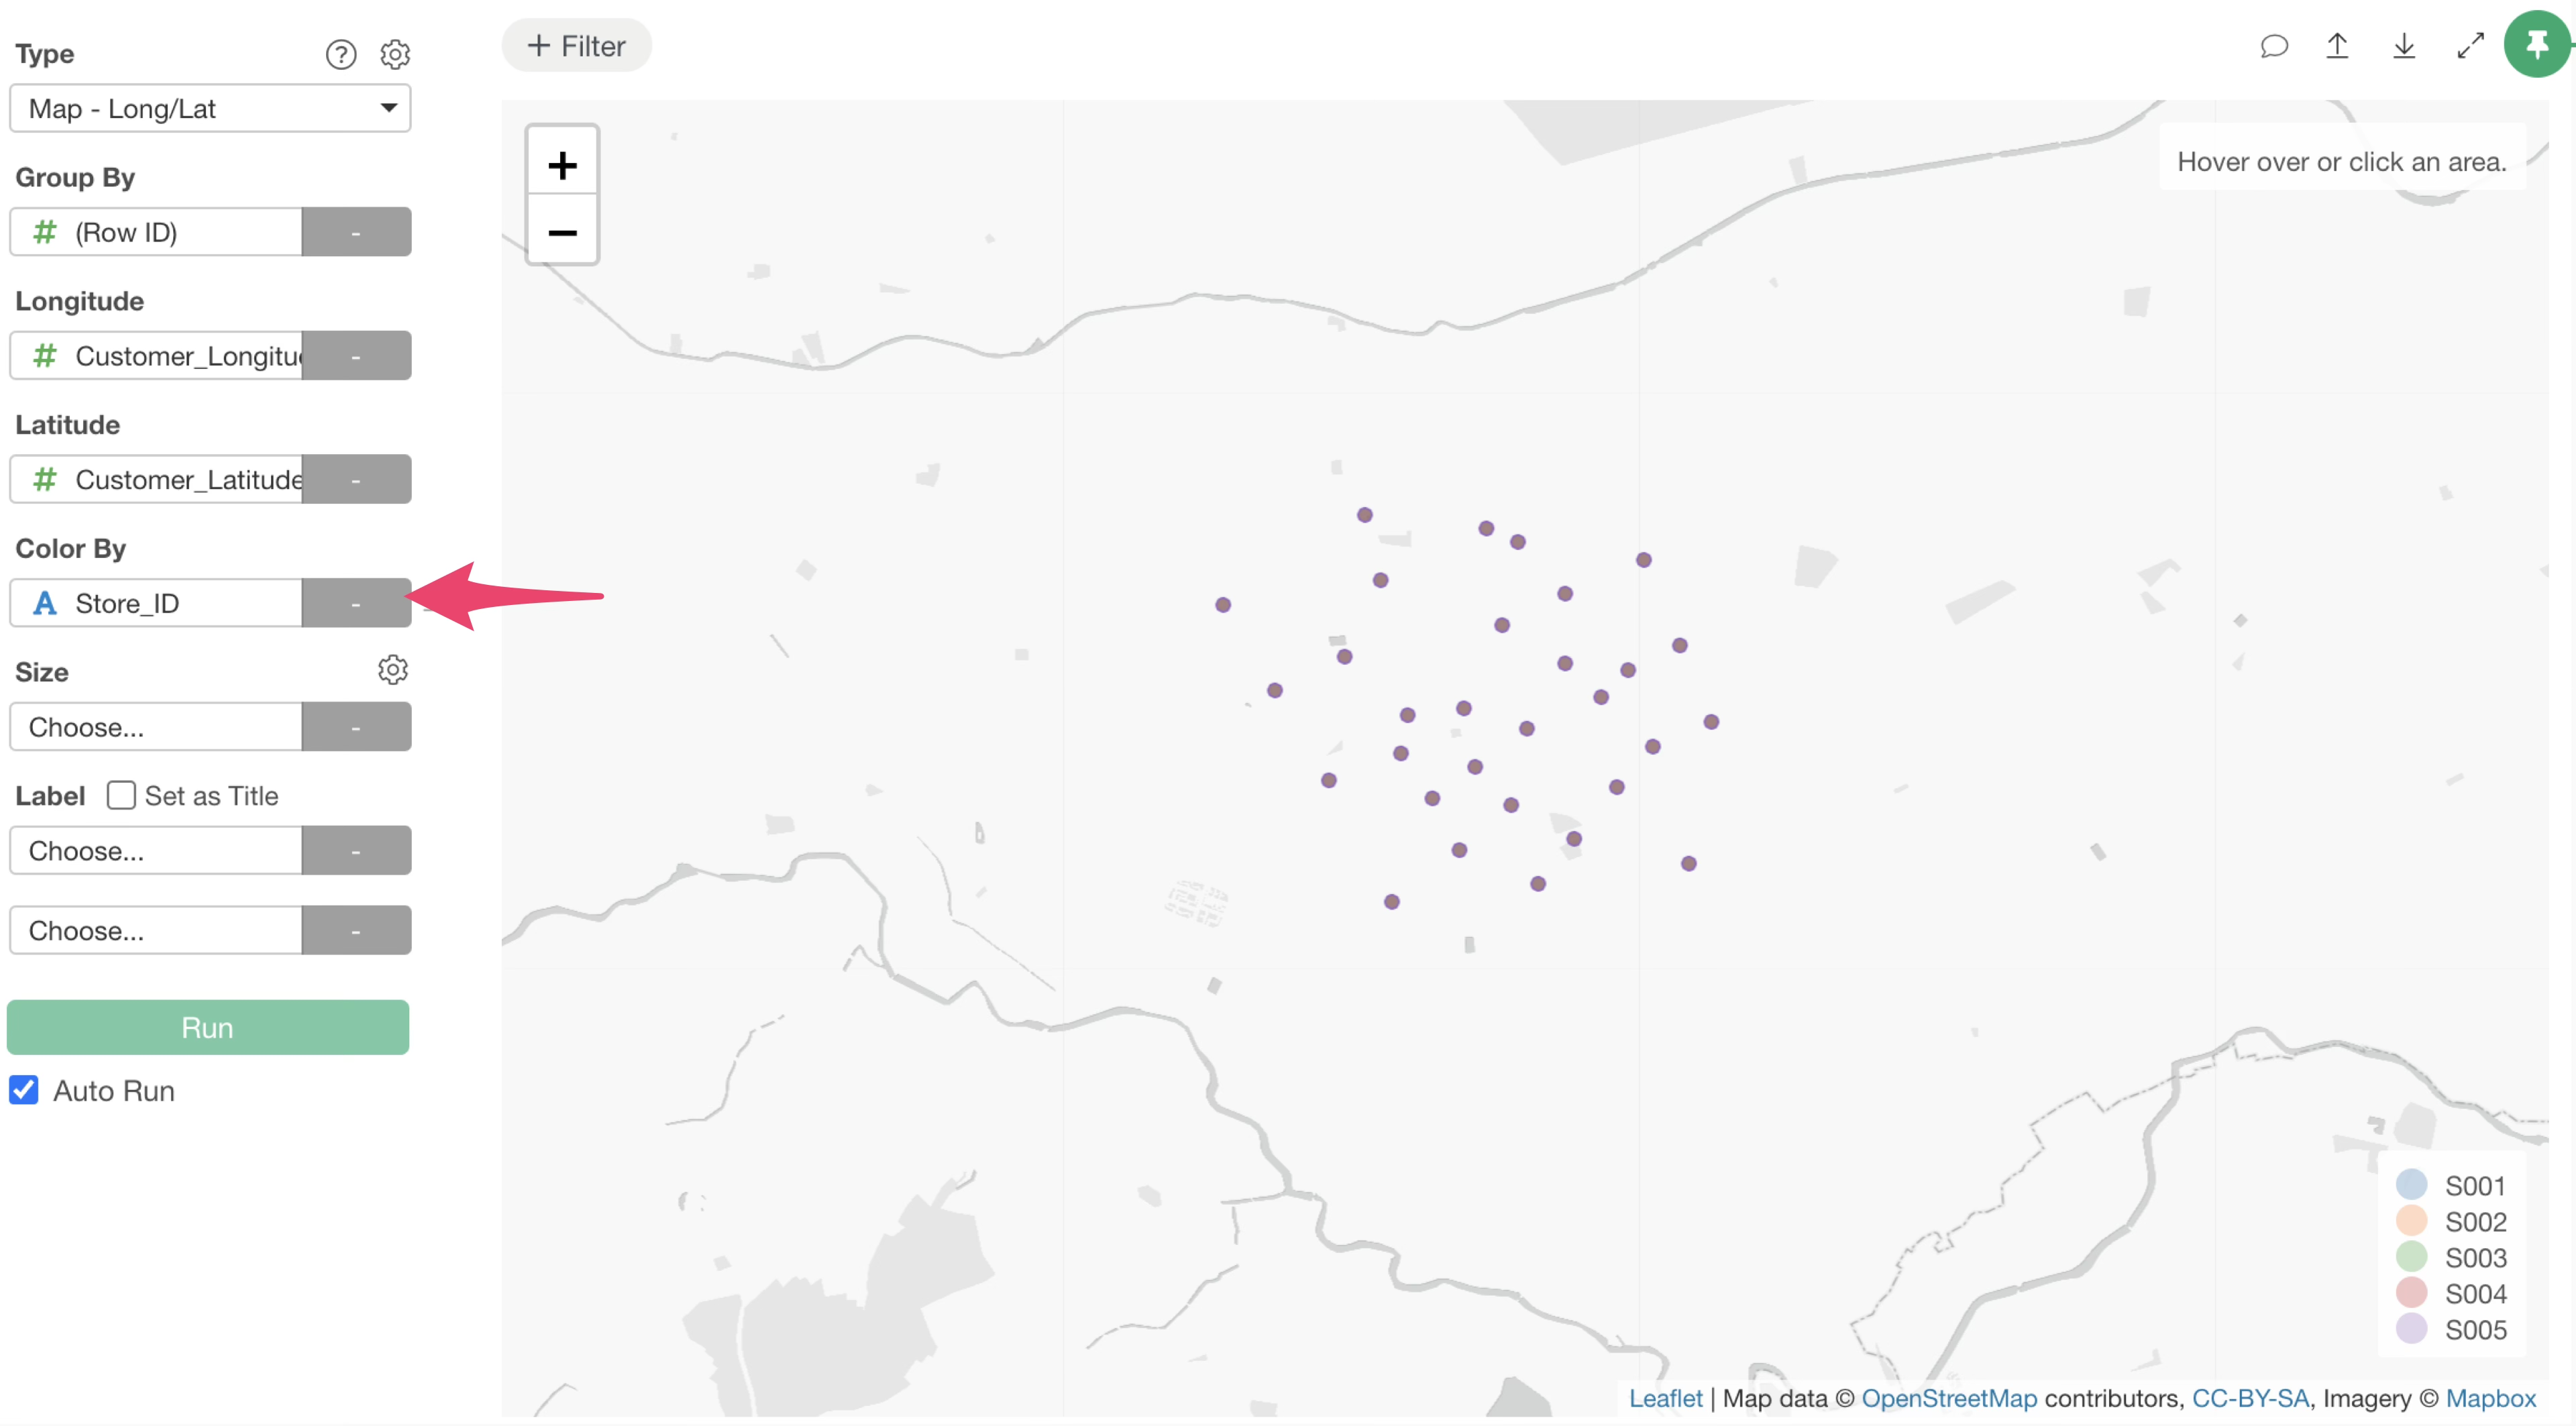
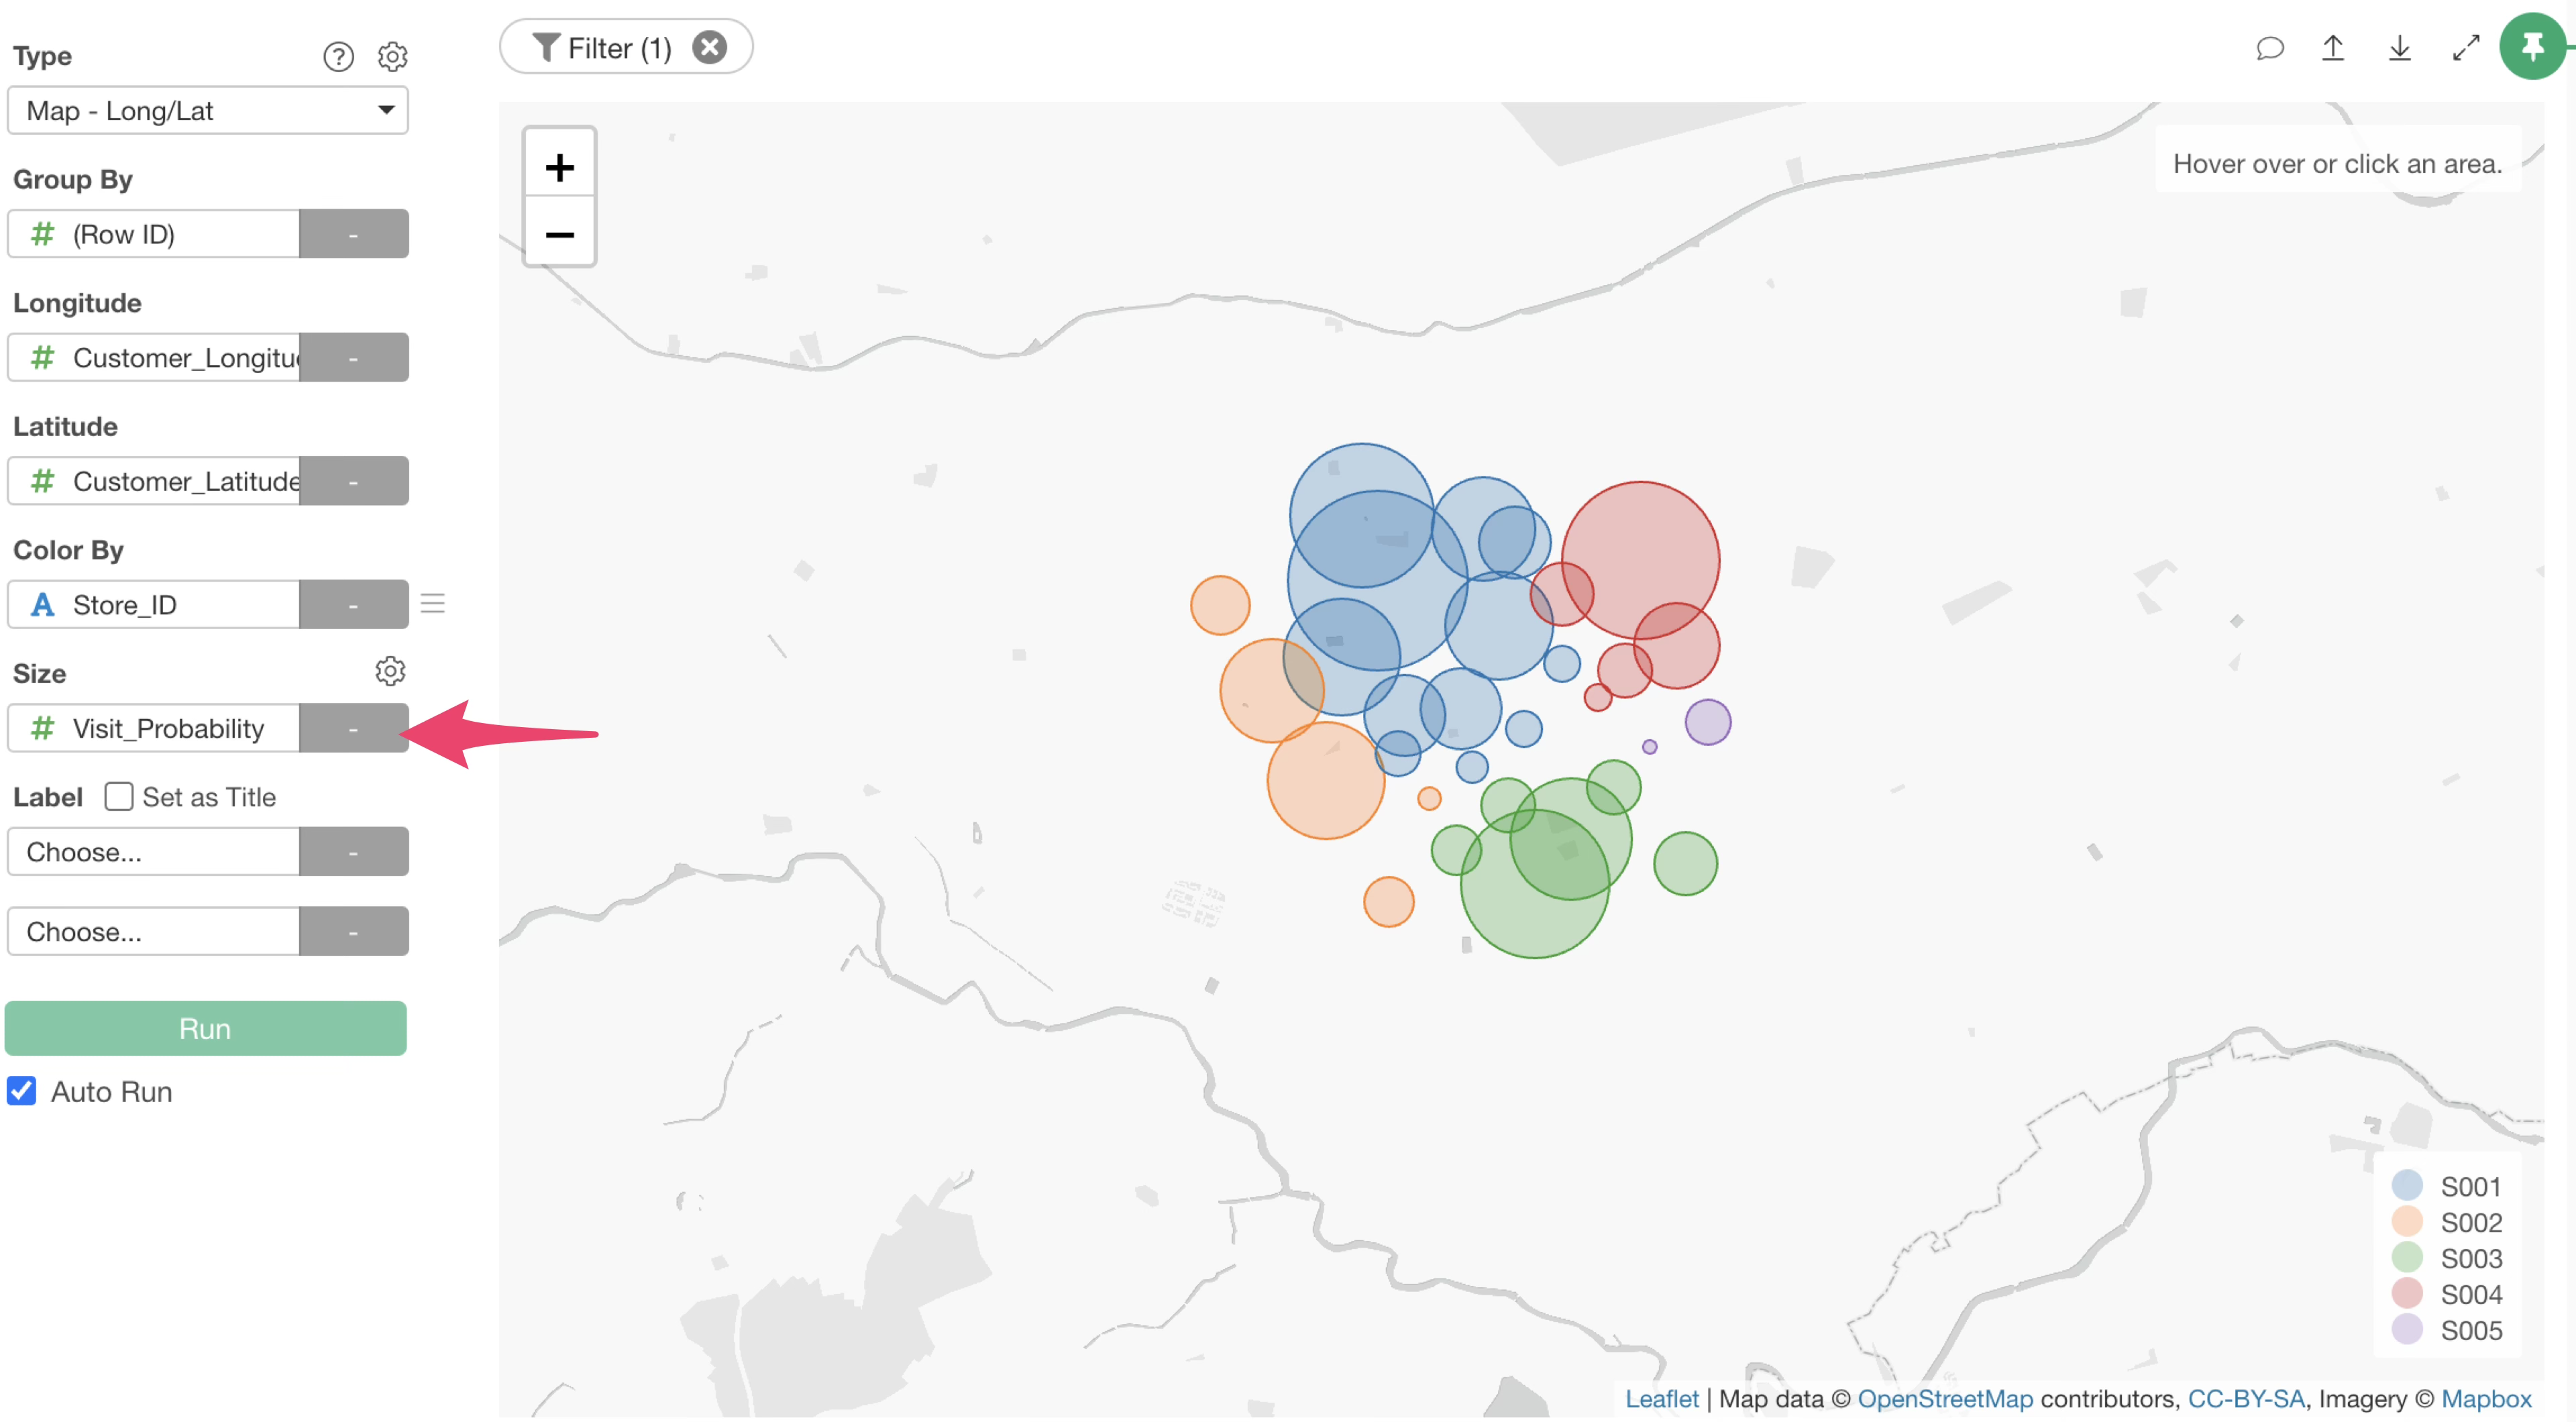
Go to the Chart view, select “Map - Latitude/Longitude” as the type, and select the customer’s longitude for Longitude and the customer’s latitude for Latitude.
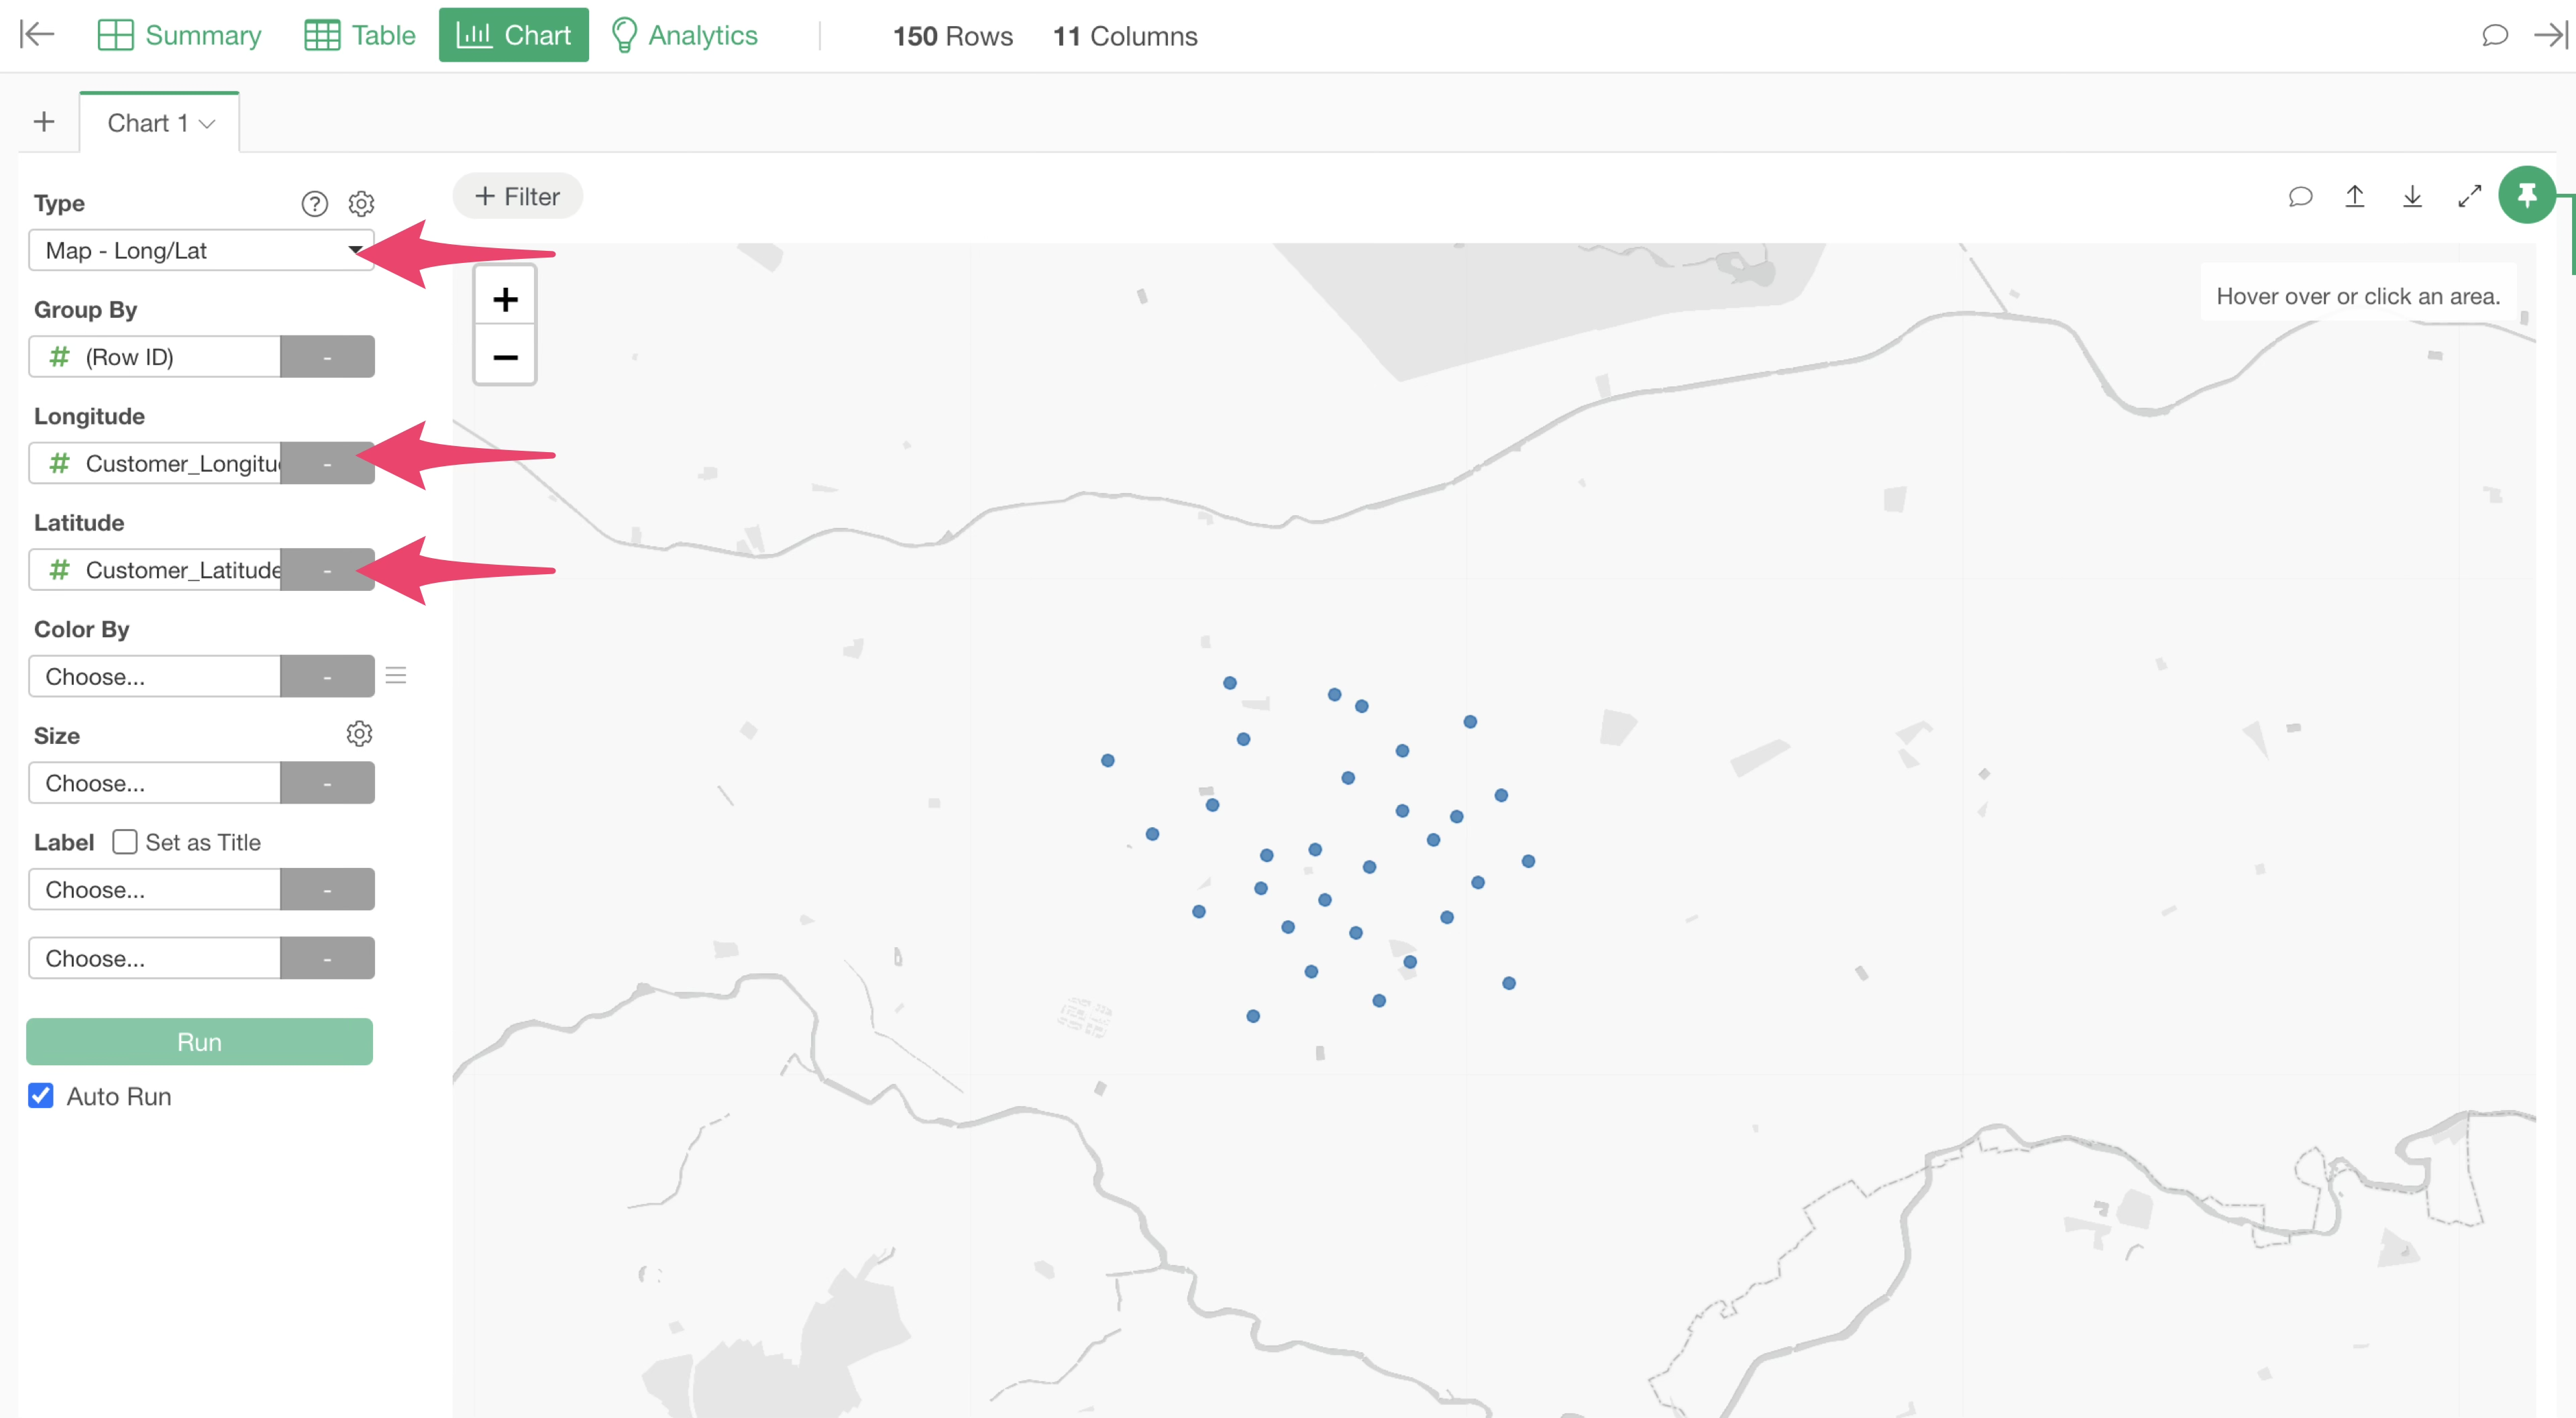
Next, for “Color By,” select the column that uniquely identifies the store.
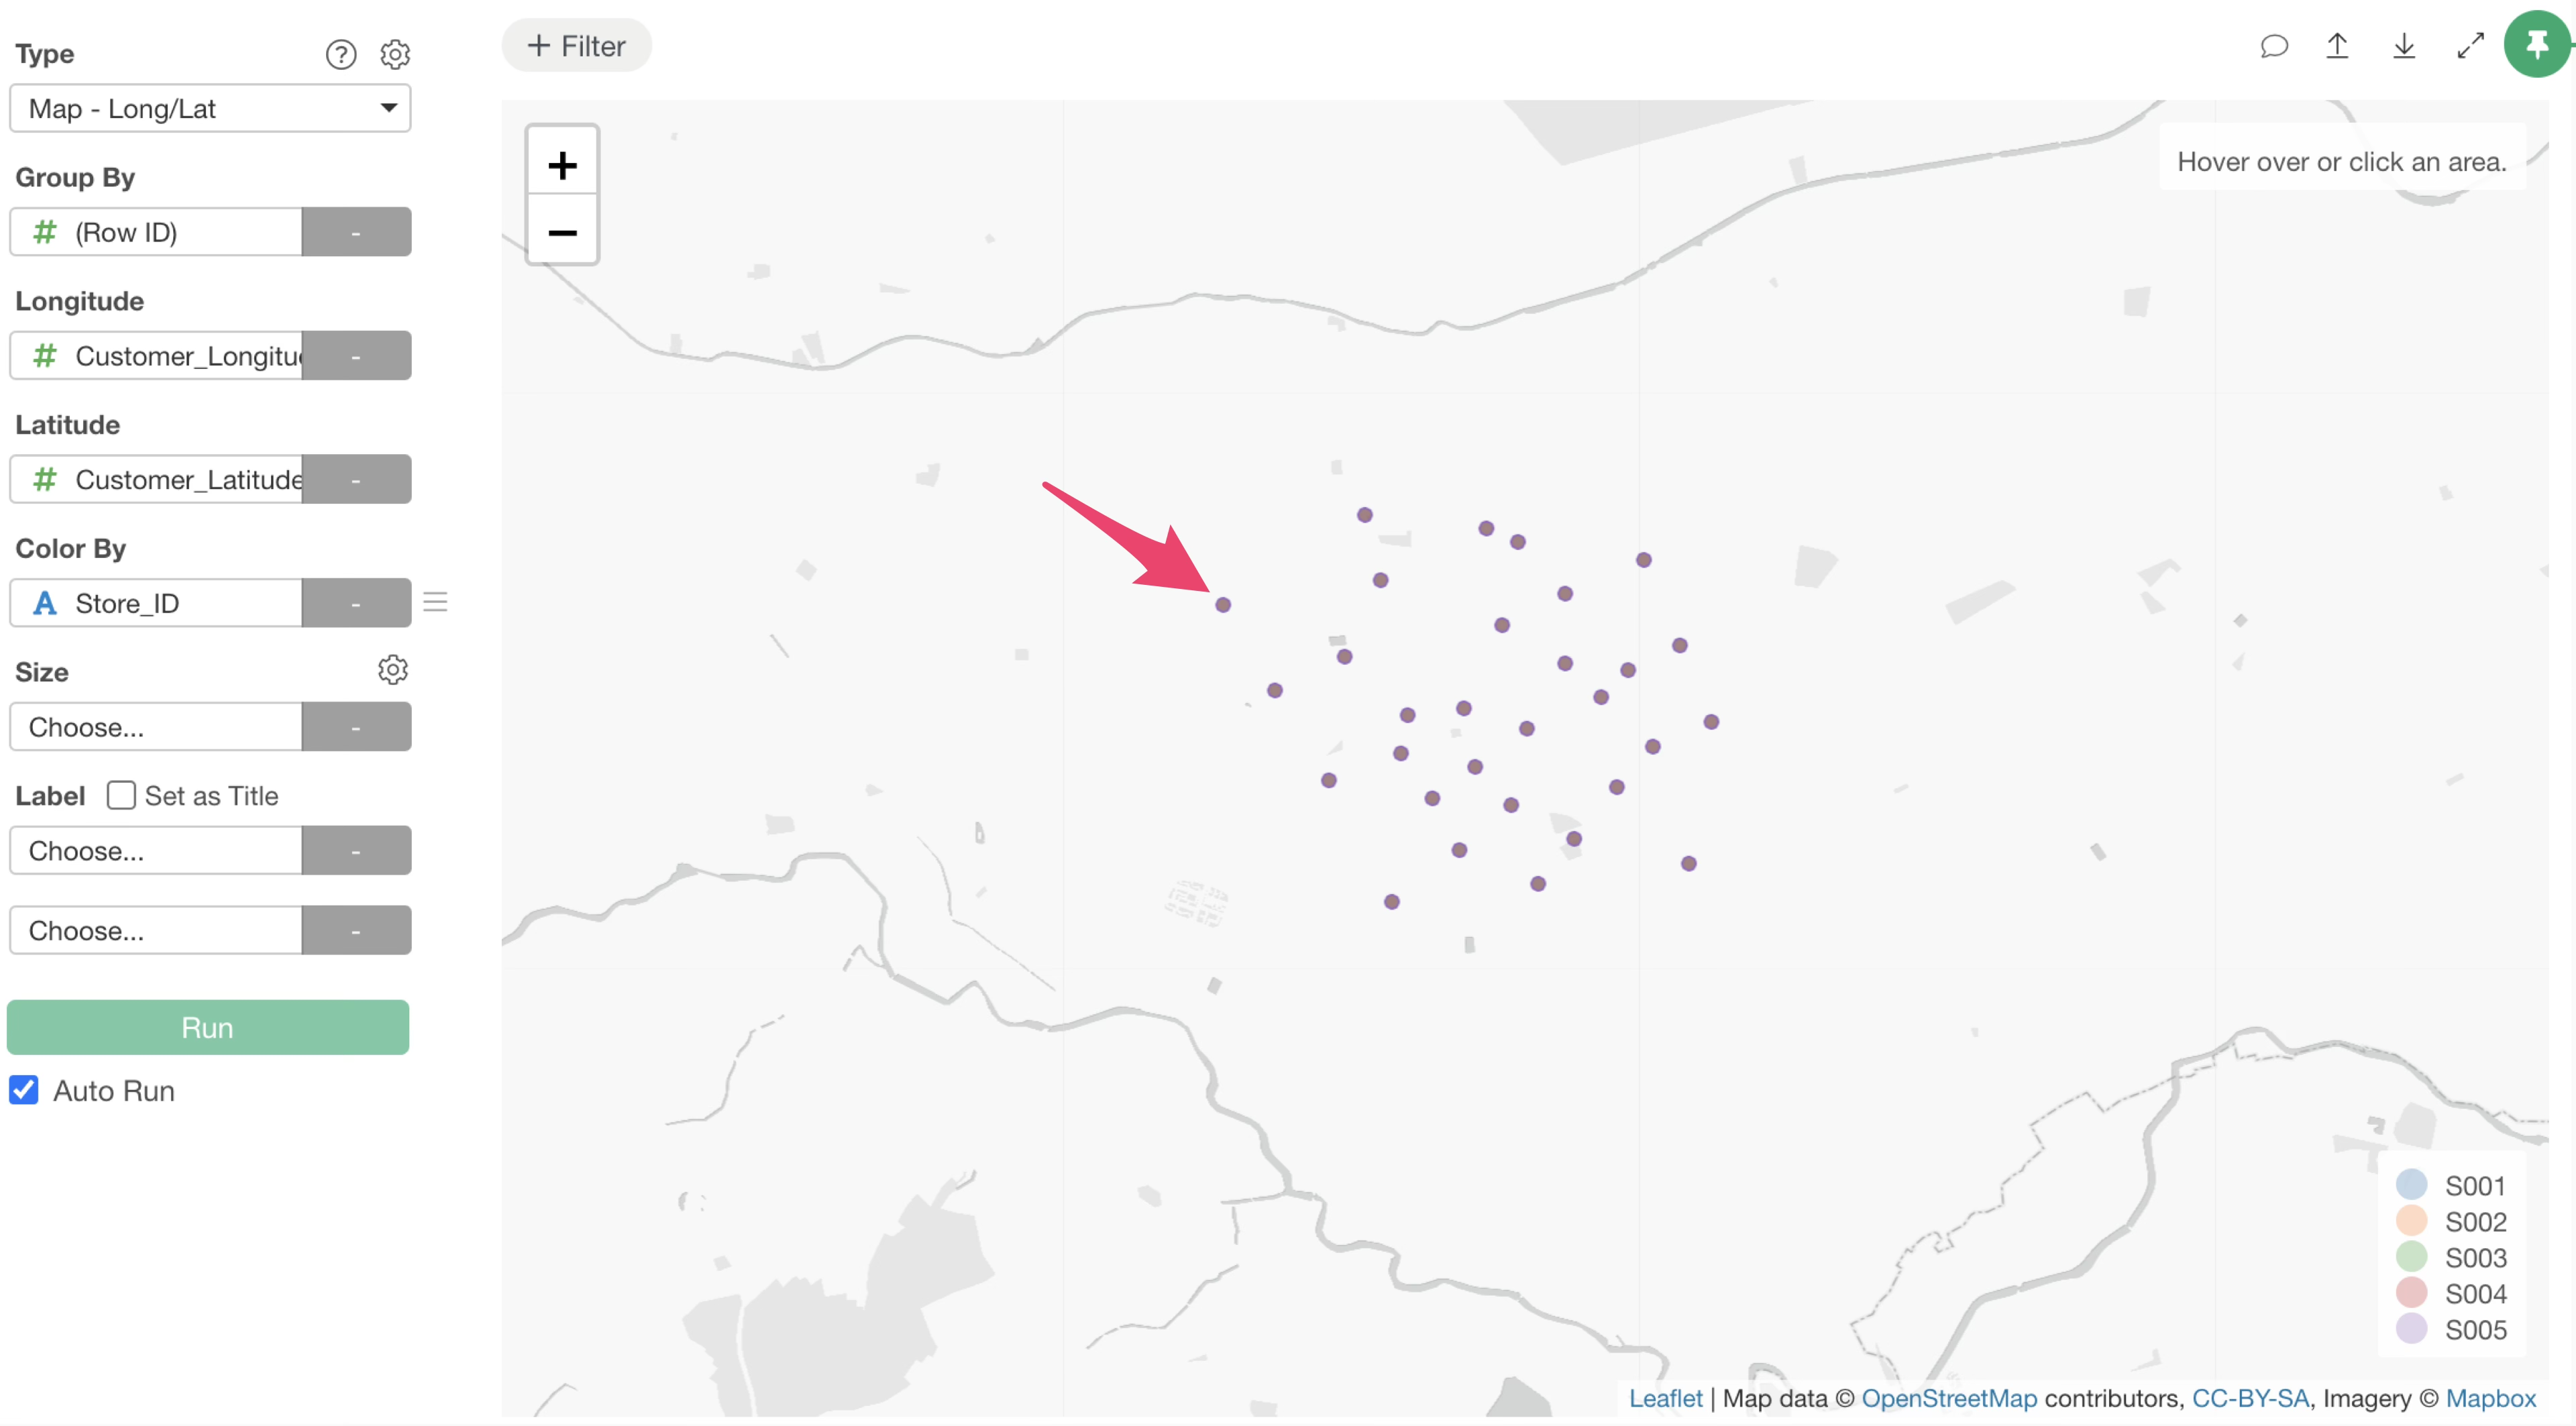
Since the original data contains all customer-store pairs, the “store with the highest visit probability for each customer” is not yet displayed at this stage, and all store information is overlapping.
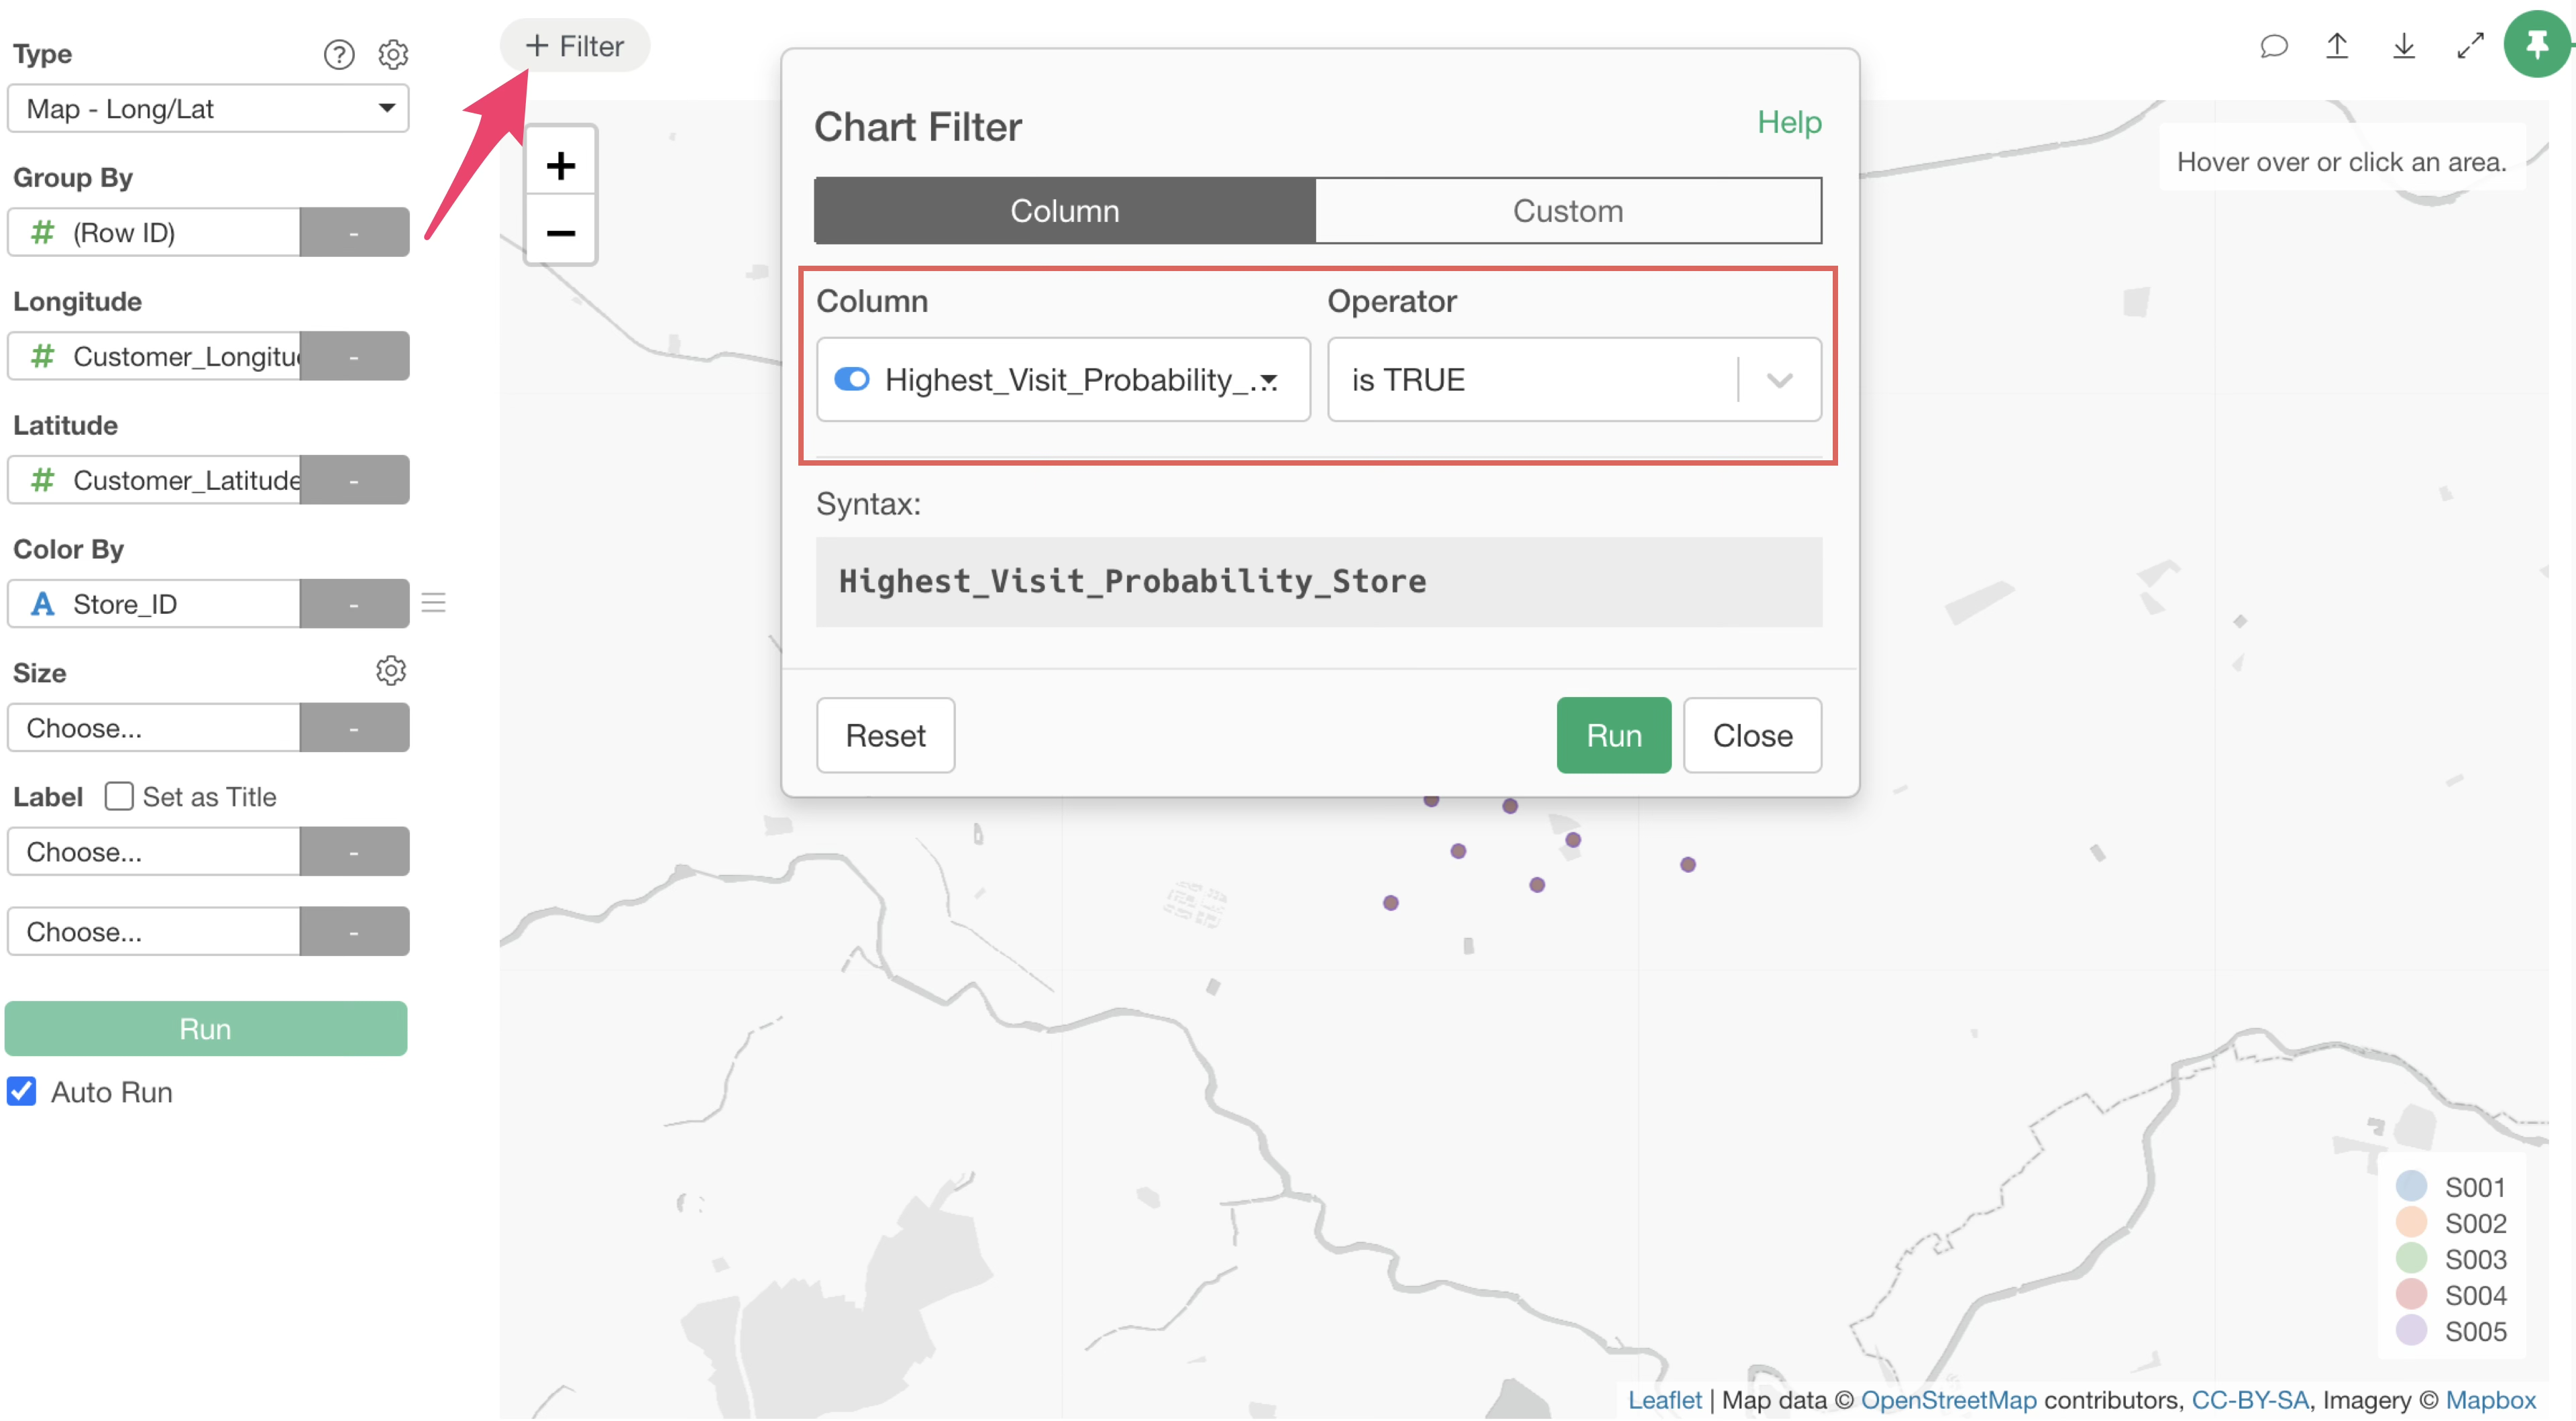
Therefore, click the “Add Filter” button at the top of the chart, select “Highest Visit Probability,” ensure the operator is TRUE, and execute.
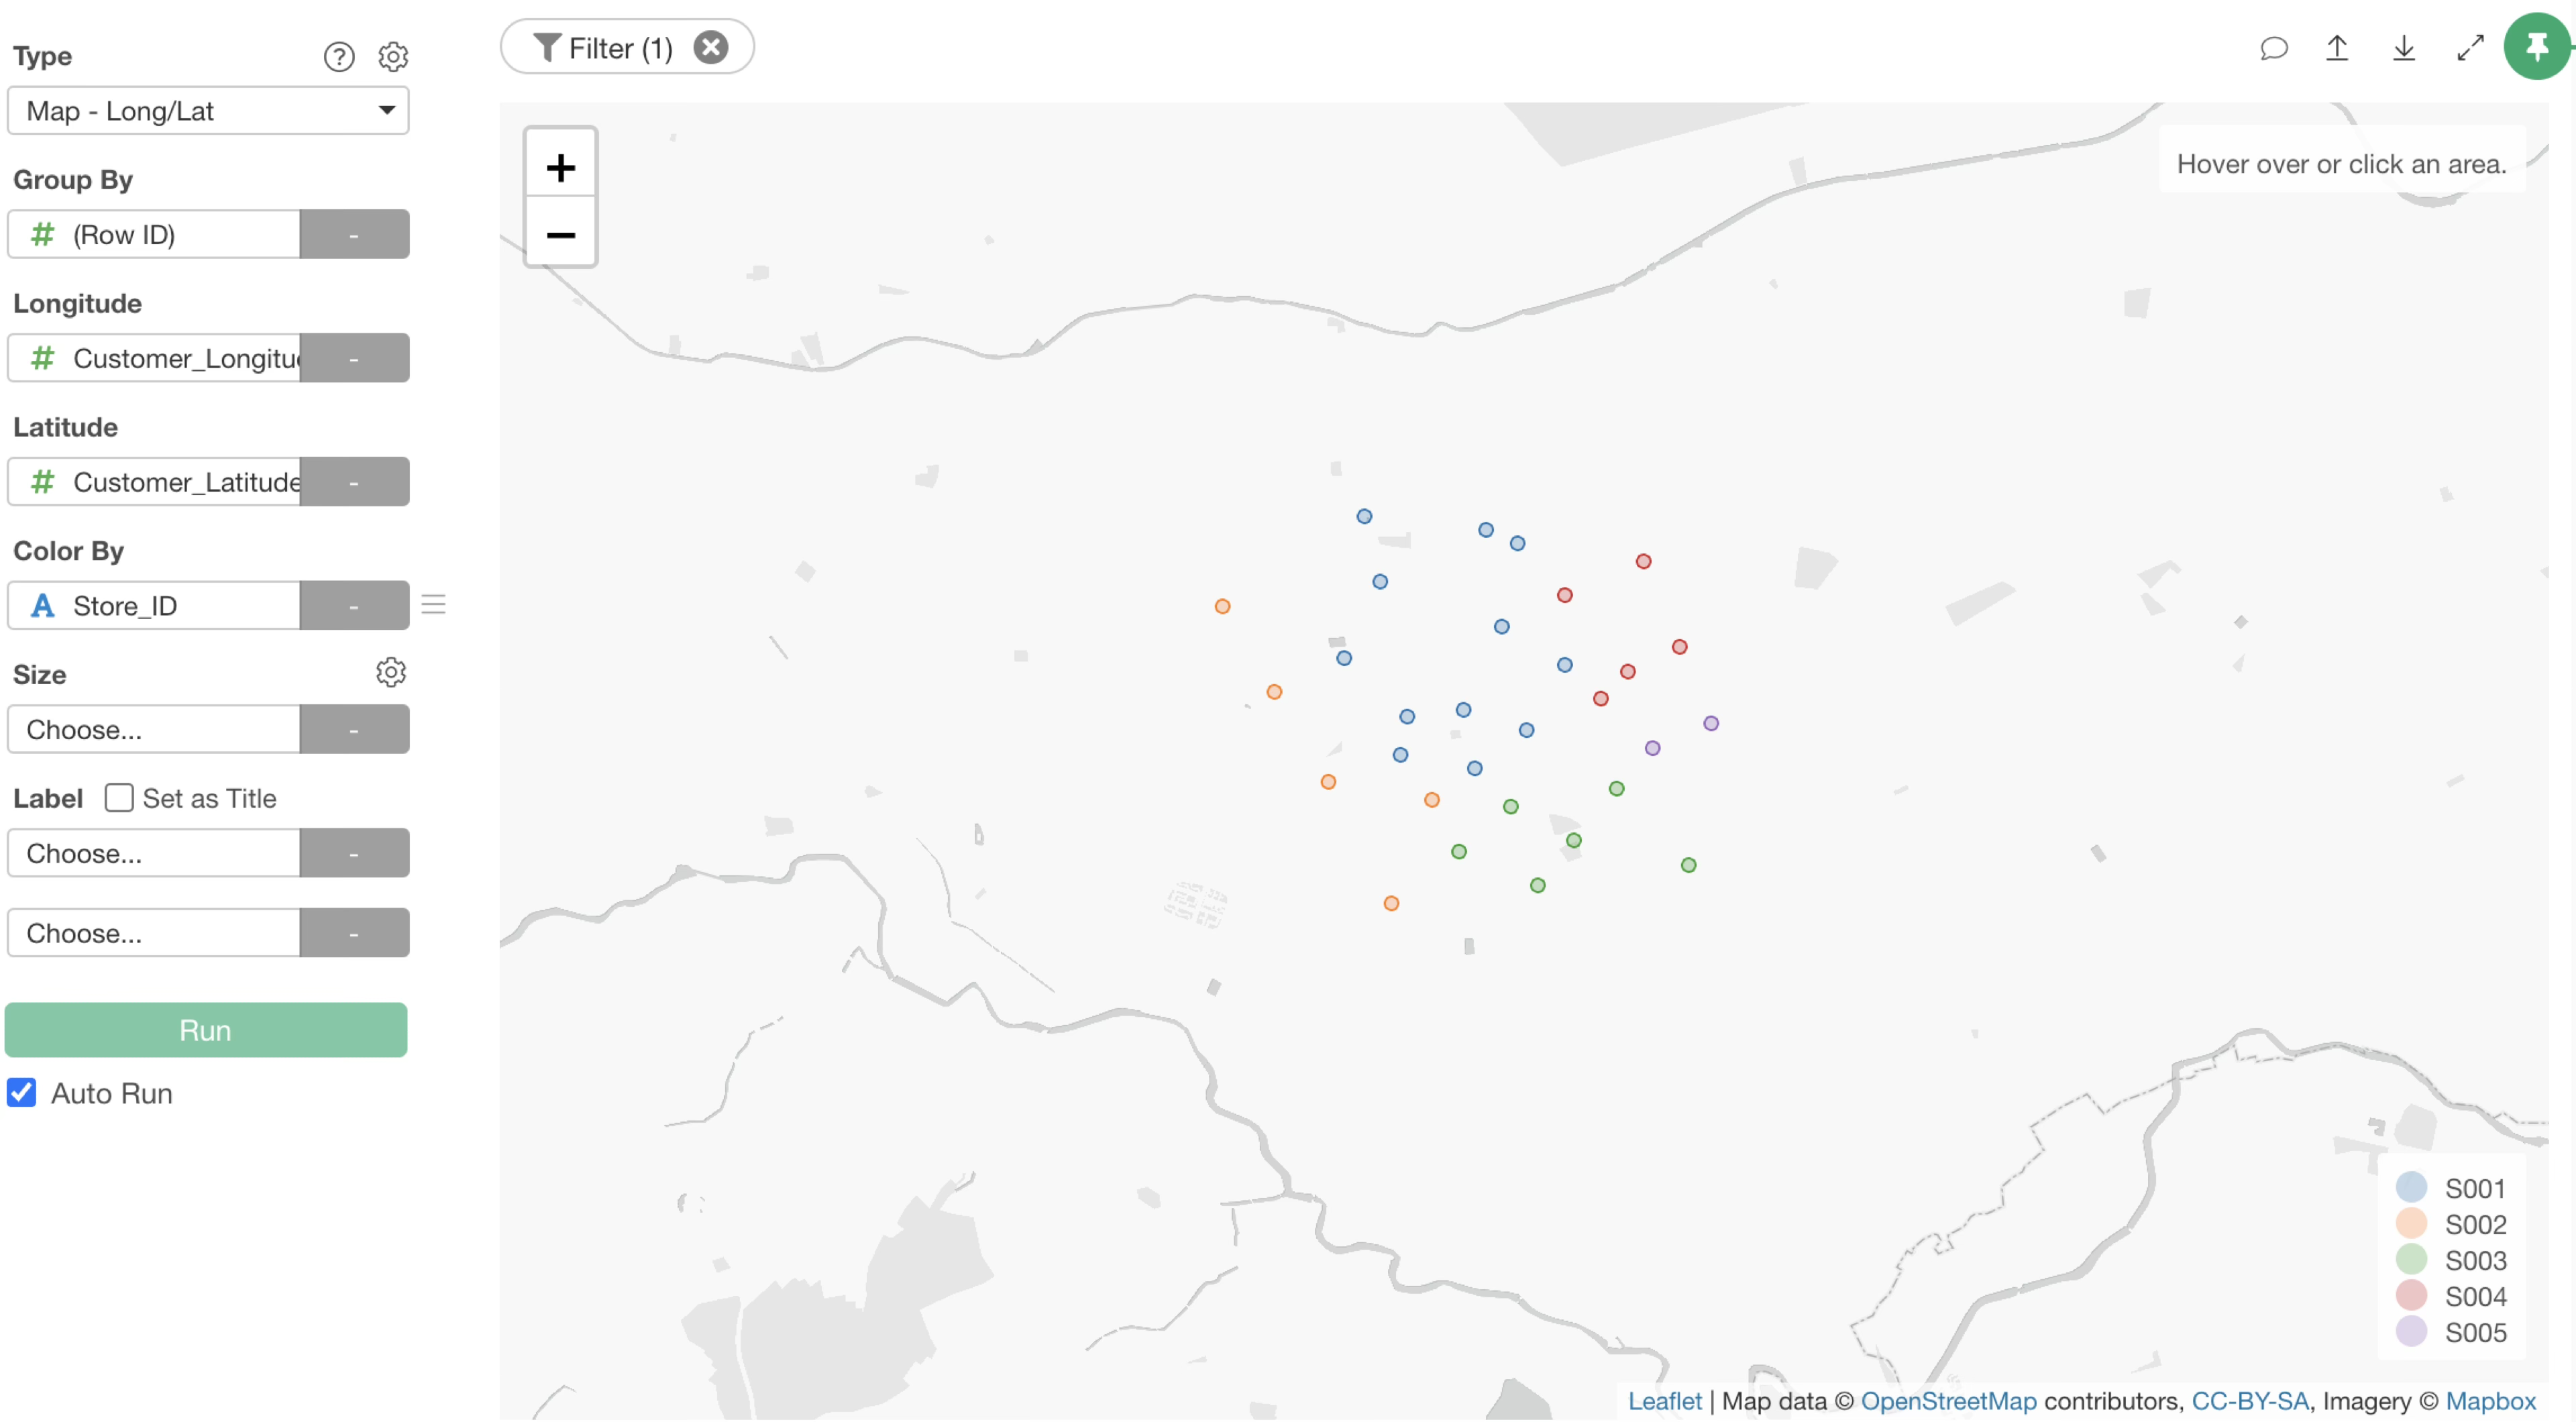
Now you can confirm that only the stores with the highest visit probability are displayed.
Finally, by selecting “Visit Probability” for Size, you can visualize the store with the highest visit probability for each customer along with the magnitude of that probability.
Specifying the Distance Decay Coefficient
The distance decay coefficient can be adjusted according to the industry or product characteristics.
For example, you can execute prompts that specify the product type or directly specify the distance decay coefficient as follows:
Run a Huff Model using @Store Information with a distance decay coefficient of 2.0Run a Huff Model for specialty goods using @Store Information