How to do PSM Analysis with AI Prompt
PSM Analysis (Price Sensitivity Measurement) is an analytical method used to measure the appropriateness of the price consumers feel for a product or service and to identify the optimal price range.
In PSM analysis, respondents are asked the following four questions to collect respective price points:
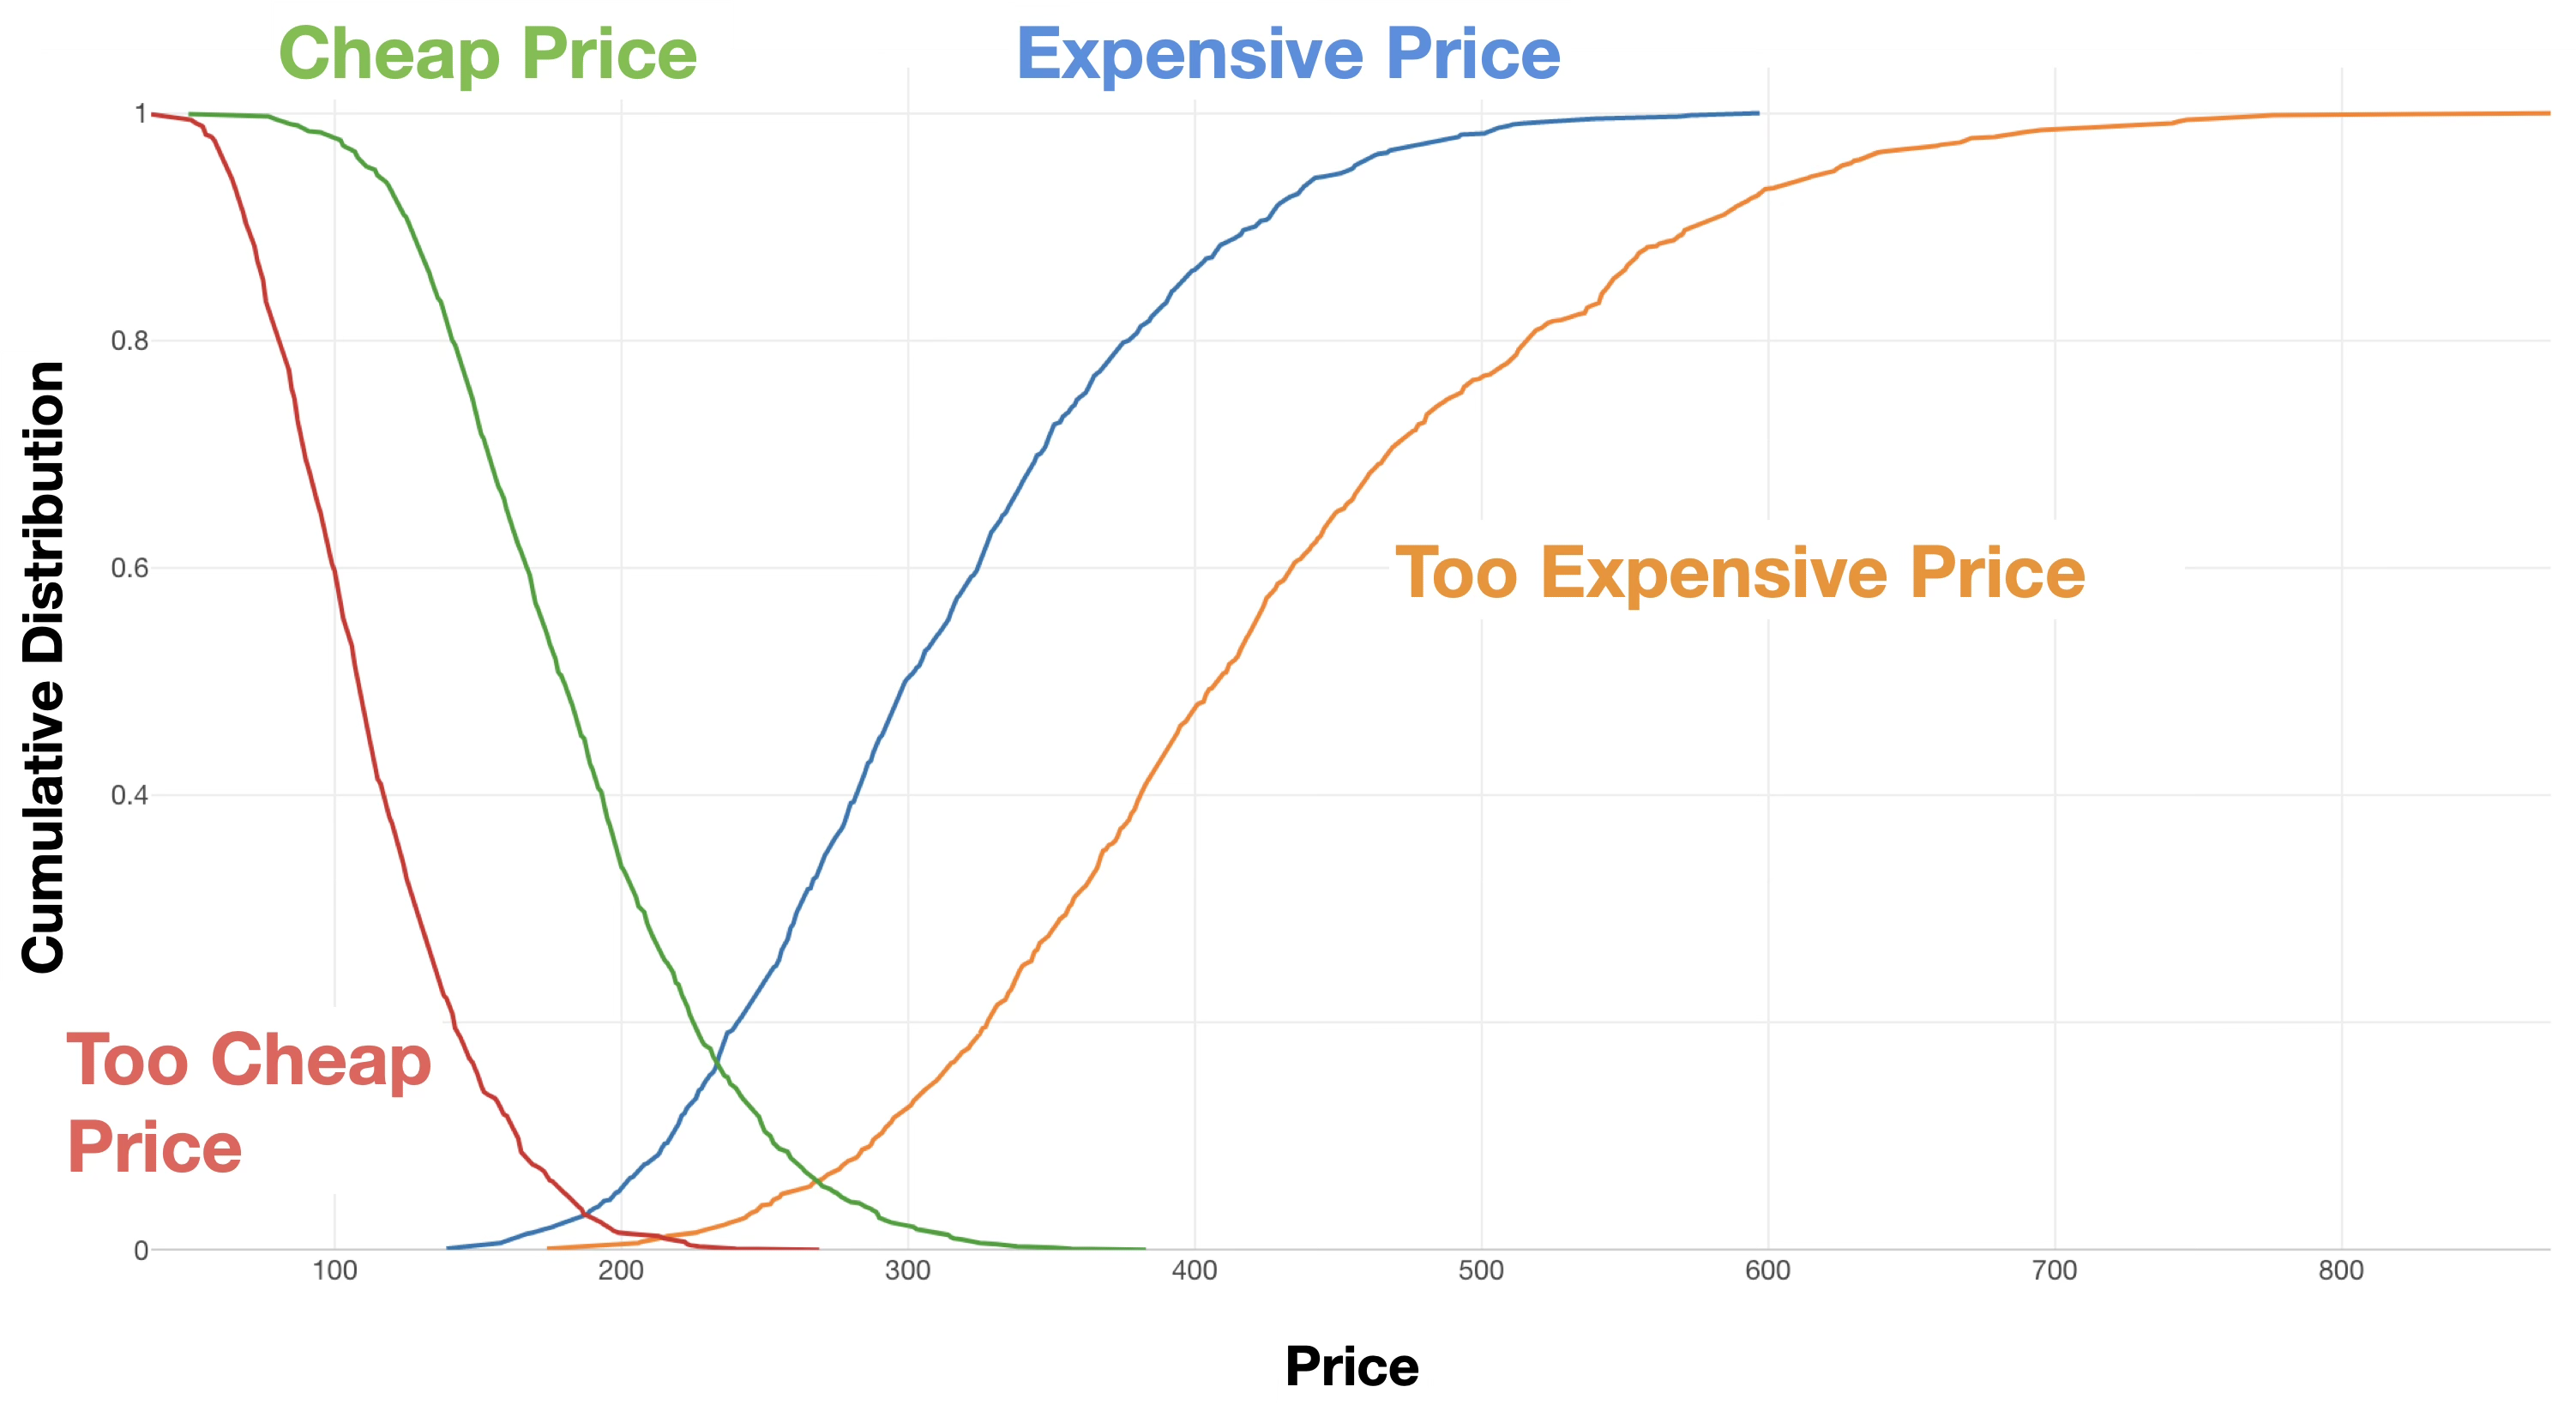
- Too Cheap Price: The price at which one feels uneasy about the quality (too cheap to want to buy).
- Cheap Price: The price that feels like a good deal.
- Expensive Price: The price that feels a bit high, but purchase can still be considered.
- Too Expensive Price: The price at which one would definitely not buy.
The consumer acceptance at each price range for these responses is represented by a cumulative distribution, and key price points are identified.
Cumulative distribution in PSM analysis is calculated by accumulating the percentage of people who answered “at or below” (or “at or above”) a certain price for each price point.
For example, in response to the “Too Expensive Price” question, if there are 100 respondents and 20 people say “$10 is too expensive,” 50 people say $15 is too expensive,” and 80 people say $20 yen is too expensive,” the cumulative percentage of “too expensive” at each price would be 20% at $10, 50% at $15, and 80% at $20.
Key price points are examined based on the intersections of the cumulative distributions of the four questions mentioned above.
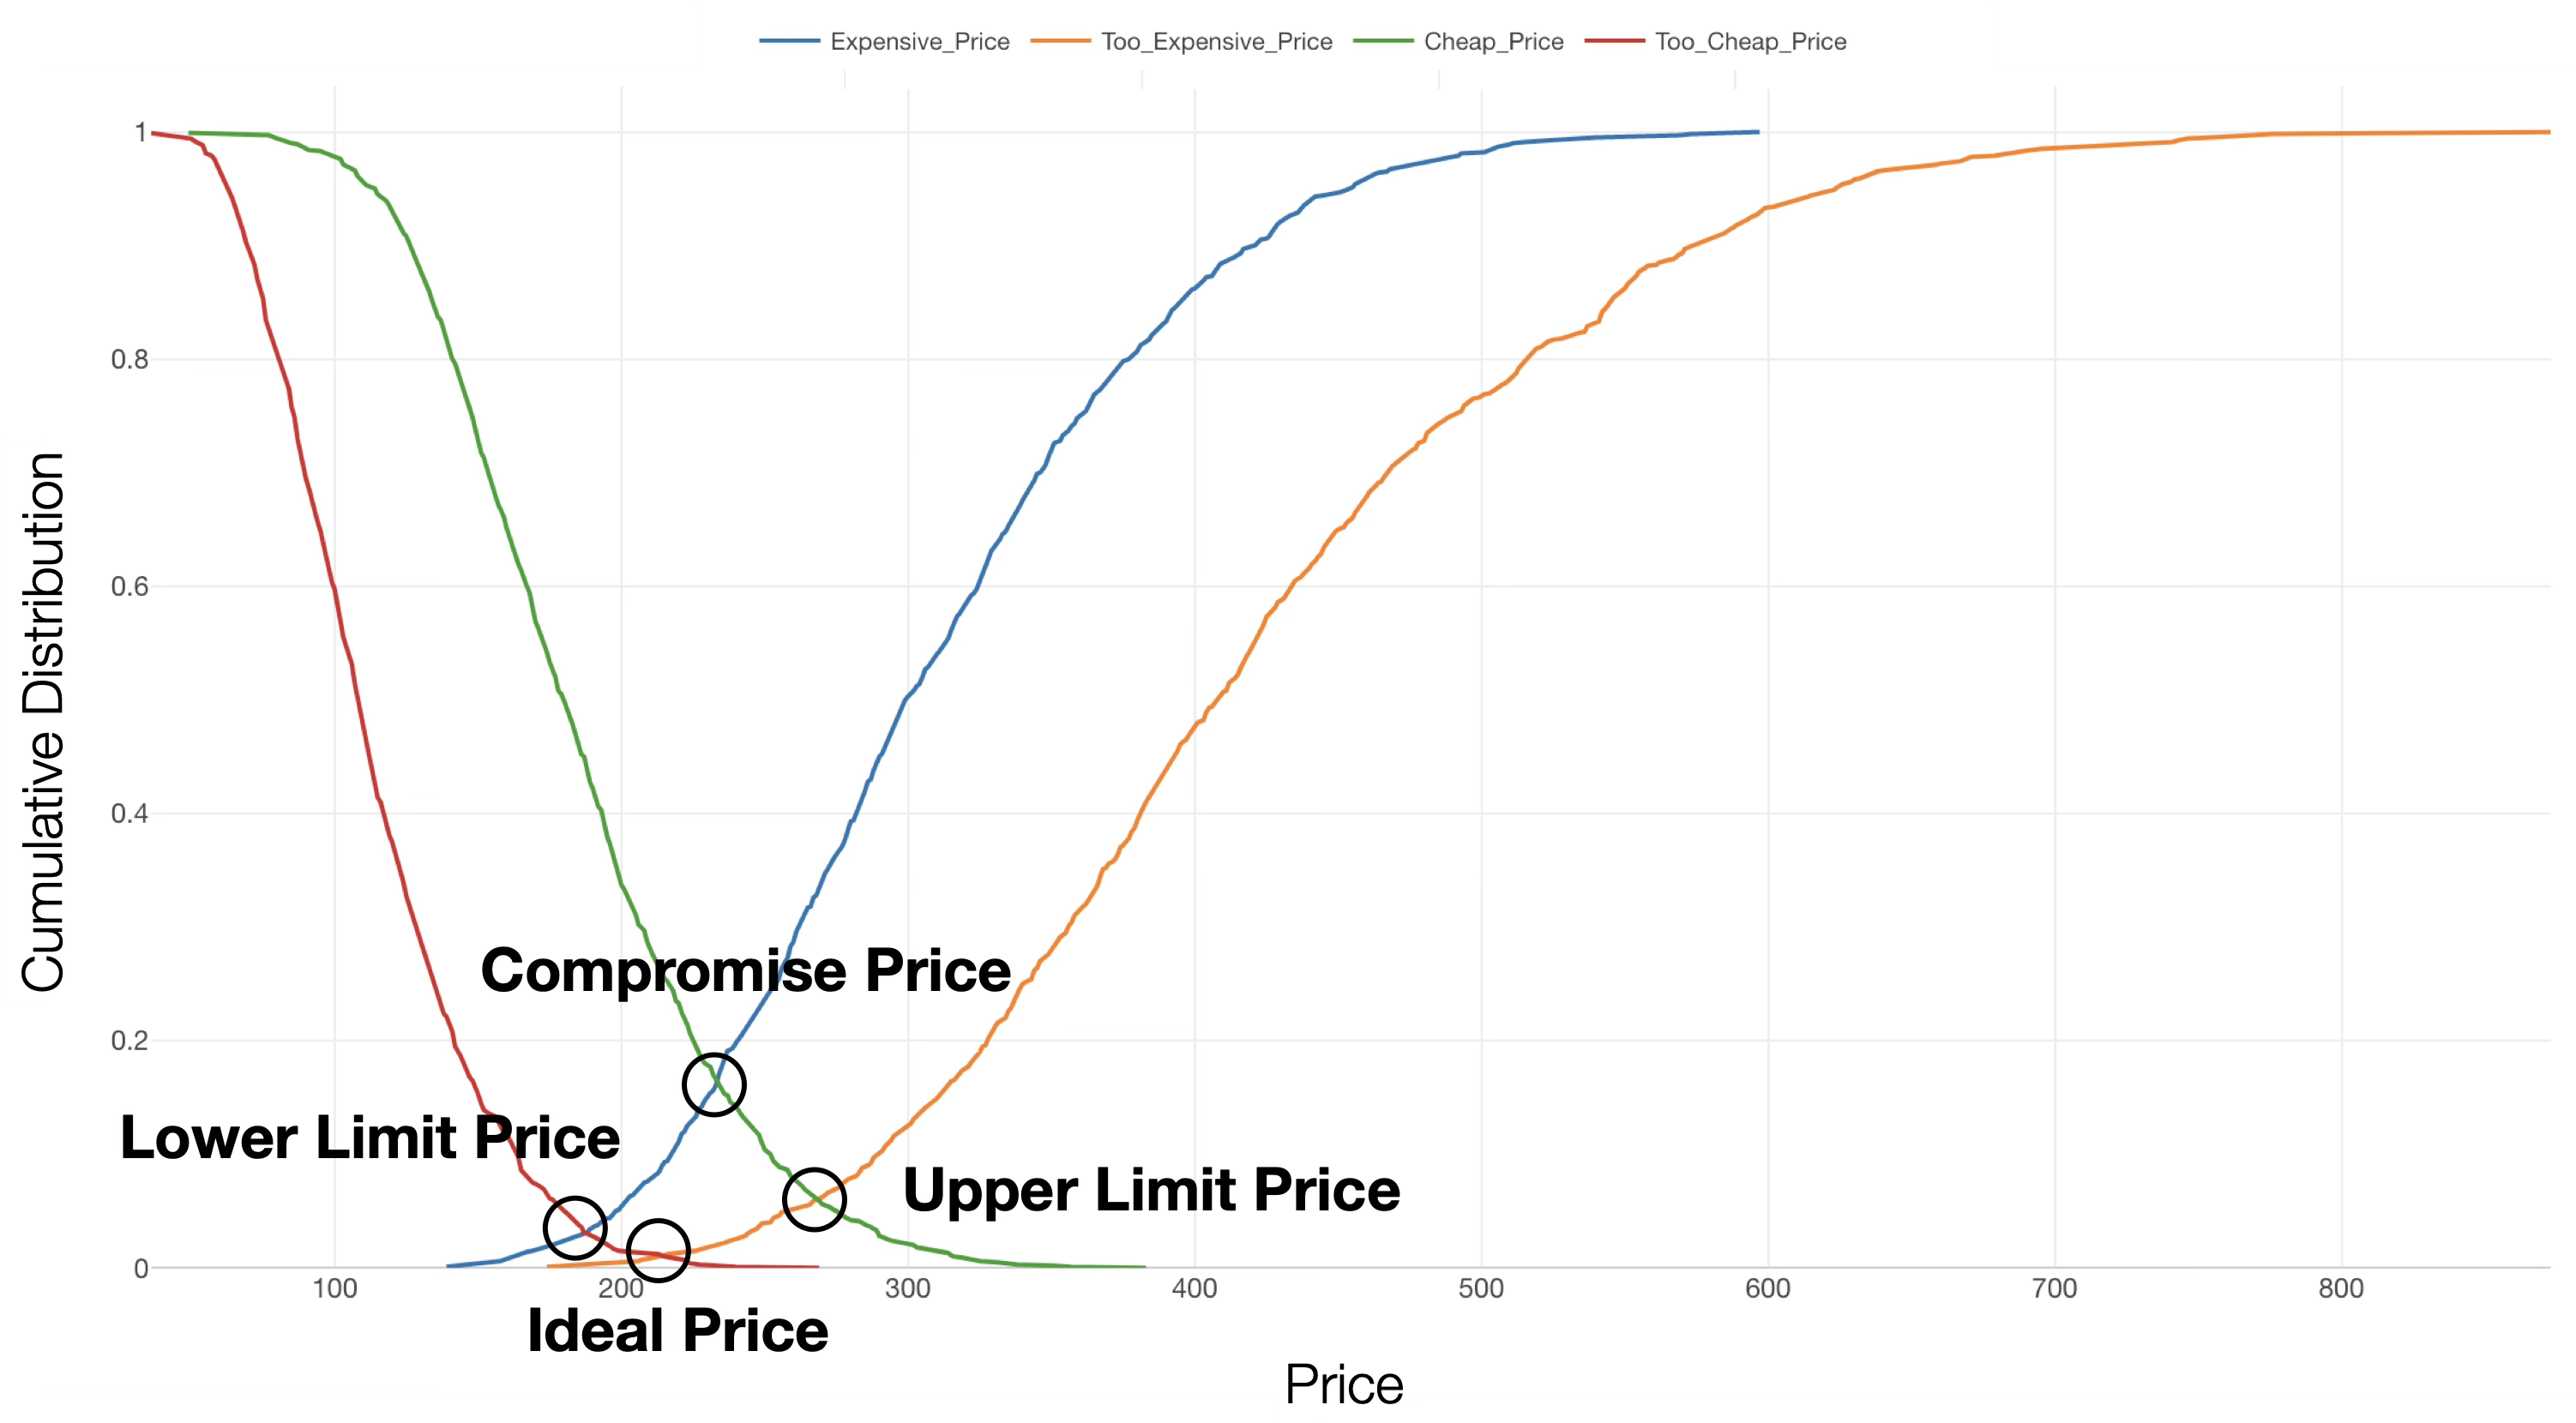
- Upper Limit Price: The intersection of the cumulative distributions of “Cheap Price” and “Too Expensive Price.” No matter how much quality is improved, prices higher than this make it difficult for the product to be purchased.
- Compromise Price: The intersection of “Cheap Price” and “Expensive Price.” The price at which consumers compromise, thinking “this much is unavoidable.”
- Ideal (Optimal) Price: The intersection of “Too Cheap Price” and “Too Expensive Price.” The ideal price point.
- Lower Limit Price: The intersection of “Too Cheap Price” and “Expensive Price.” Lowering the price beyond this point causes anxiety about quality, making it difficult for the product to be purchased.
How to Determine the Optimal Price Range
Utilizing the four intersections obtained through PSM analysis, the price is determined in the following steps according to business objectives.
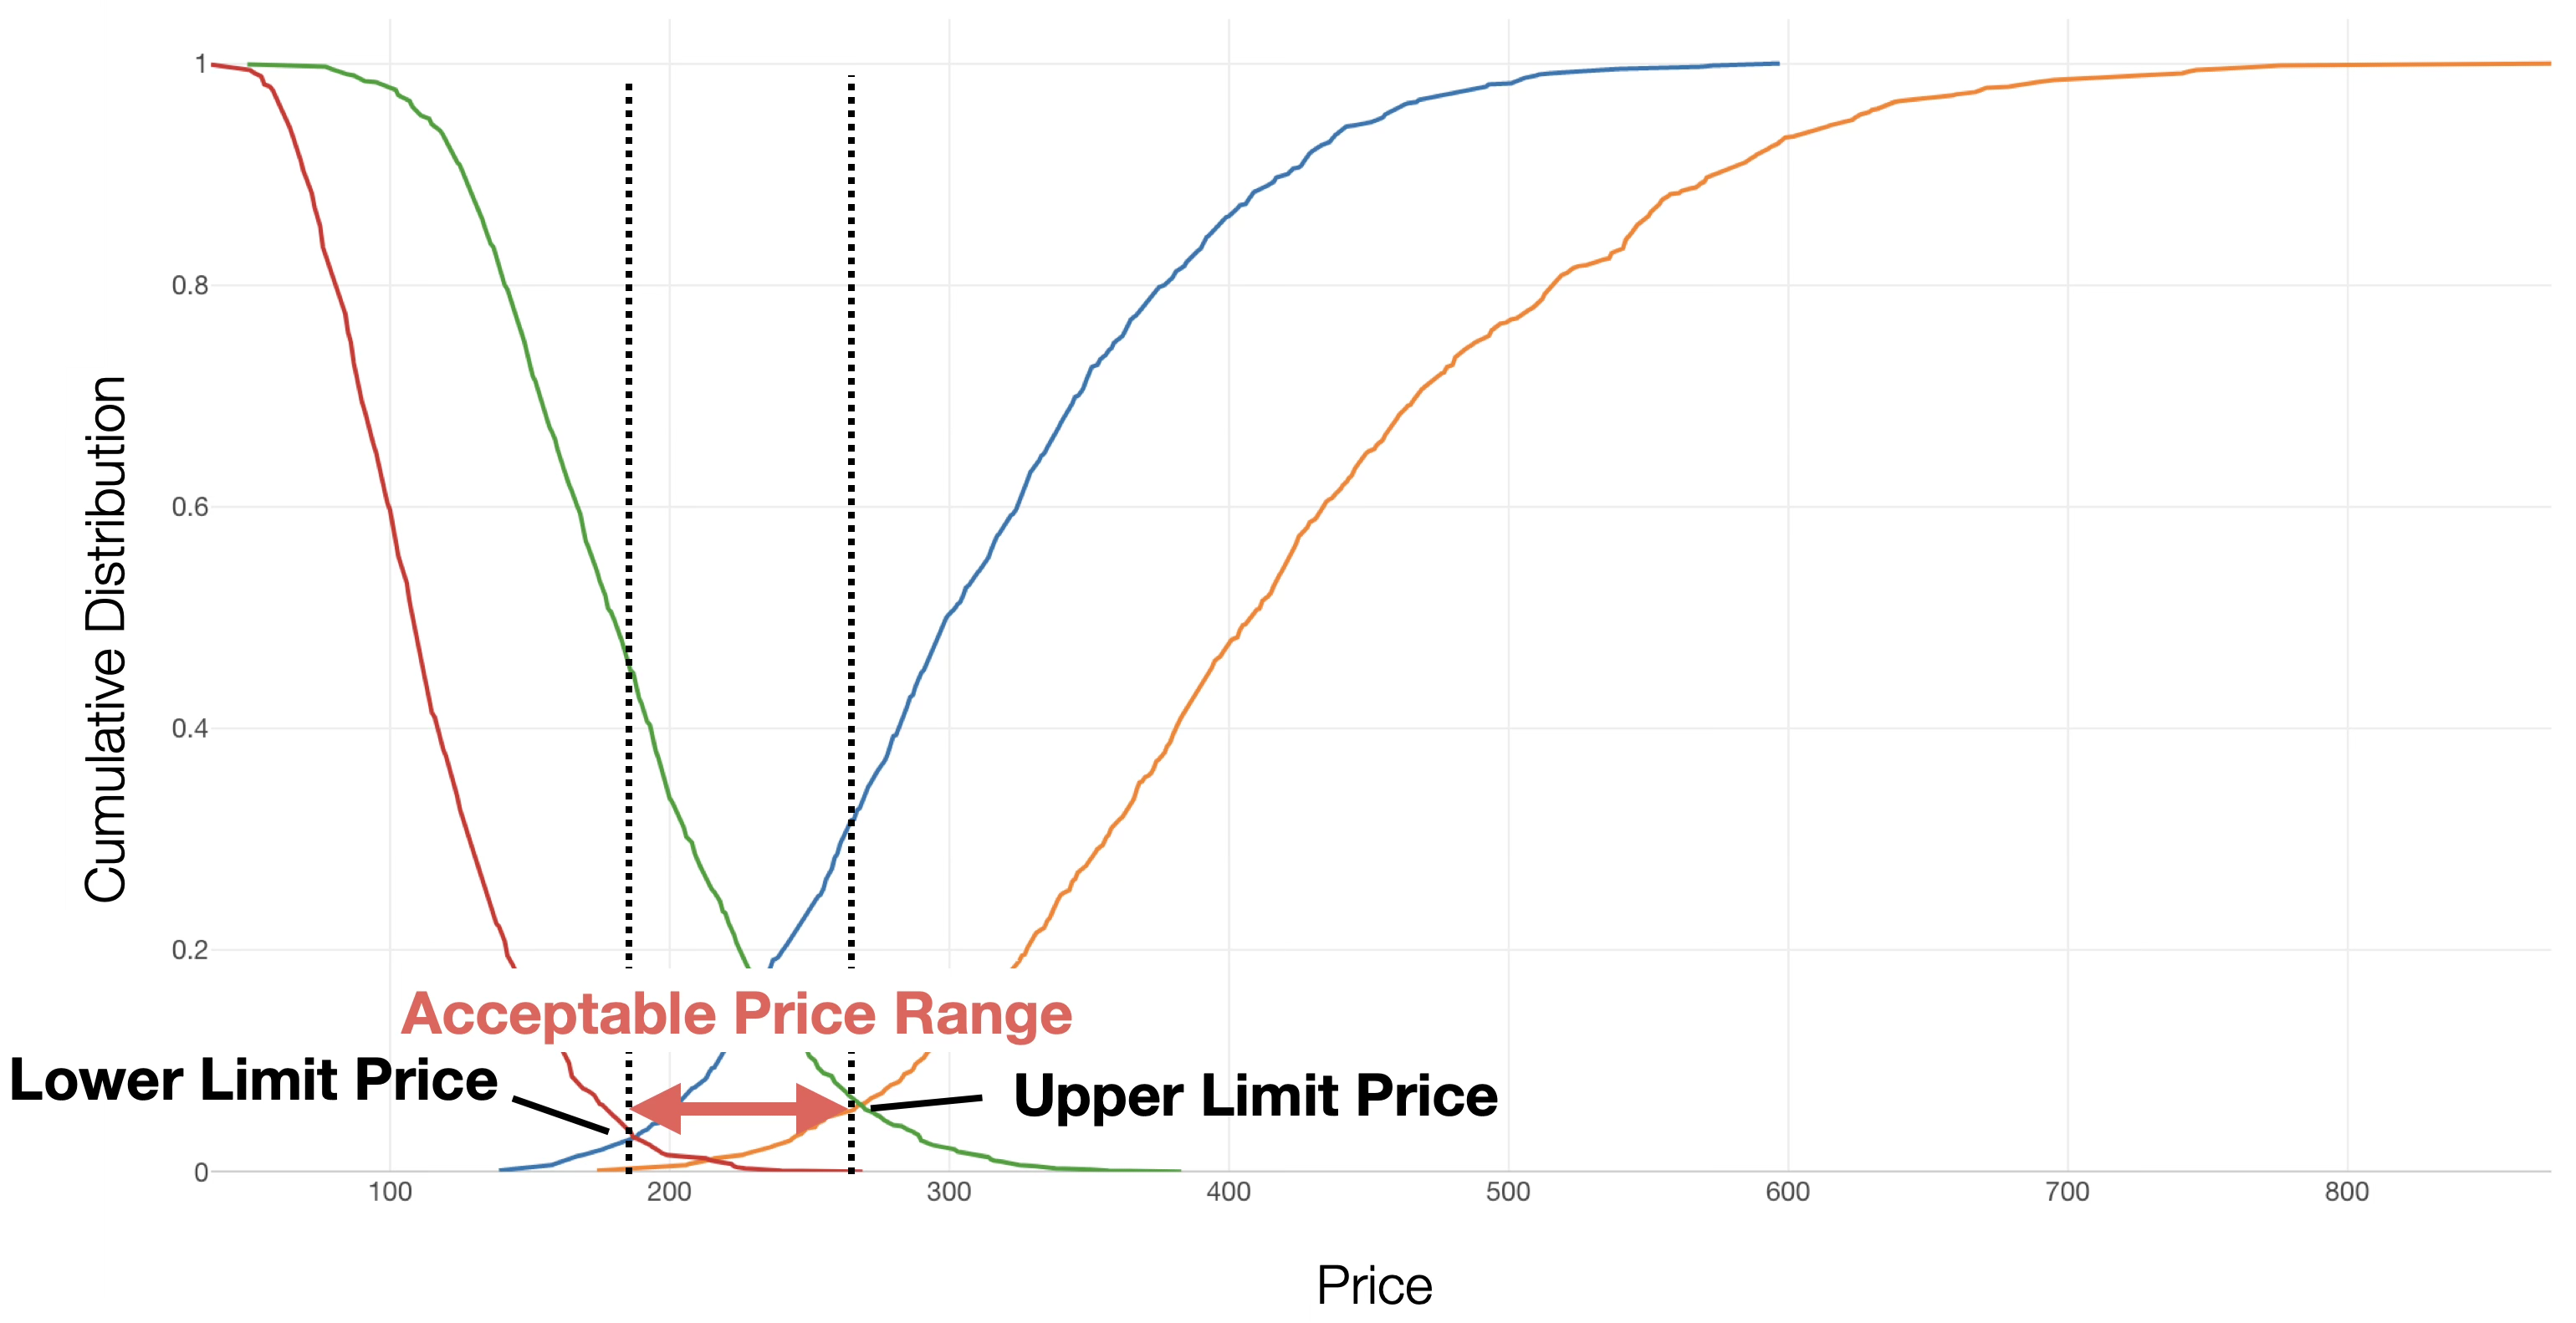
1. Understanding the Acceptable Price Range
First, the range between the “Lower Limit Price” and the “Upper Limit Price” is defined as the Acceptable Price Range that the market will accept.

If the price is set outside this range, it will either be perceived as “too cheap and worrisome” or “too expensive to be an option,” and the difficulty of selling will increase sharply.
2. Selecting Points Based on Strategy
Within the acceptable price range, consider which intersection to set the price near based on your company’s business strategy.
- When prioritizing market share expansion (Penetration Pricing Strategy): Set a price close to the “Ideal Price” or “Lower Limit Price.” Aim to have many users use the product first by appealing to the sense of value provided by the low price.
- When emphasizing brand image or profit margins (Skimming Pricing Strategy): Set the price between the “Compromise Price” and the “Upper Limit Price.” Target the segment that judges the product as “expensive, but worth the value,” maximizing profit per unit.
3. Gap Analysis between “Ideal Price” and “Compromise Price”
If there is a gap between the “Ideal Price” and the “Compromise Price,” set the price considering the size of that gap.
- If the Ideal Price is significantly lower than the Compromise Price: This is a sign that consumers feel the current market price is “high.” You need to either keep the price down or provide overwhelming added value to bridge that price difference.
- If the Ideal Price and Compromise Price are close: The market’s sense of price and consumer expectations are aligned. By setting the price between the Ideal Price and the Compromise Price, the risk of major failure is low.
Application of PSM Analysis
By utilizing PSM analysis, companies can quantitatively understand consumers’ psychological reactions to prices and establish a pricing strategy that balances profitability and market competitiveness.
Particularly in the launch of new products or price revisions of existing products, understanding consumer price sensitivity in advance can significantly reduce the risk of pricing failure. Furthermore, it enables objective price determination based on actual consumer data, rather than relying solely on intuition or competitor pricing.
Data Required for PSM Analysis
To perform PSM analysis, you need data where each row represents one respondent and contains columns for the four price points mentioned above. (Data can be downloaded from here.)

Executing PSM Analysis
This time, we will execute PSM analysis using AI prompts on survey data where each row represents one respondent.
The data includes respondent IDs and information on the four price points (Too Cheap, Cheap, Expensive, Too Expensive).
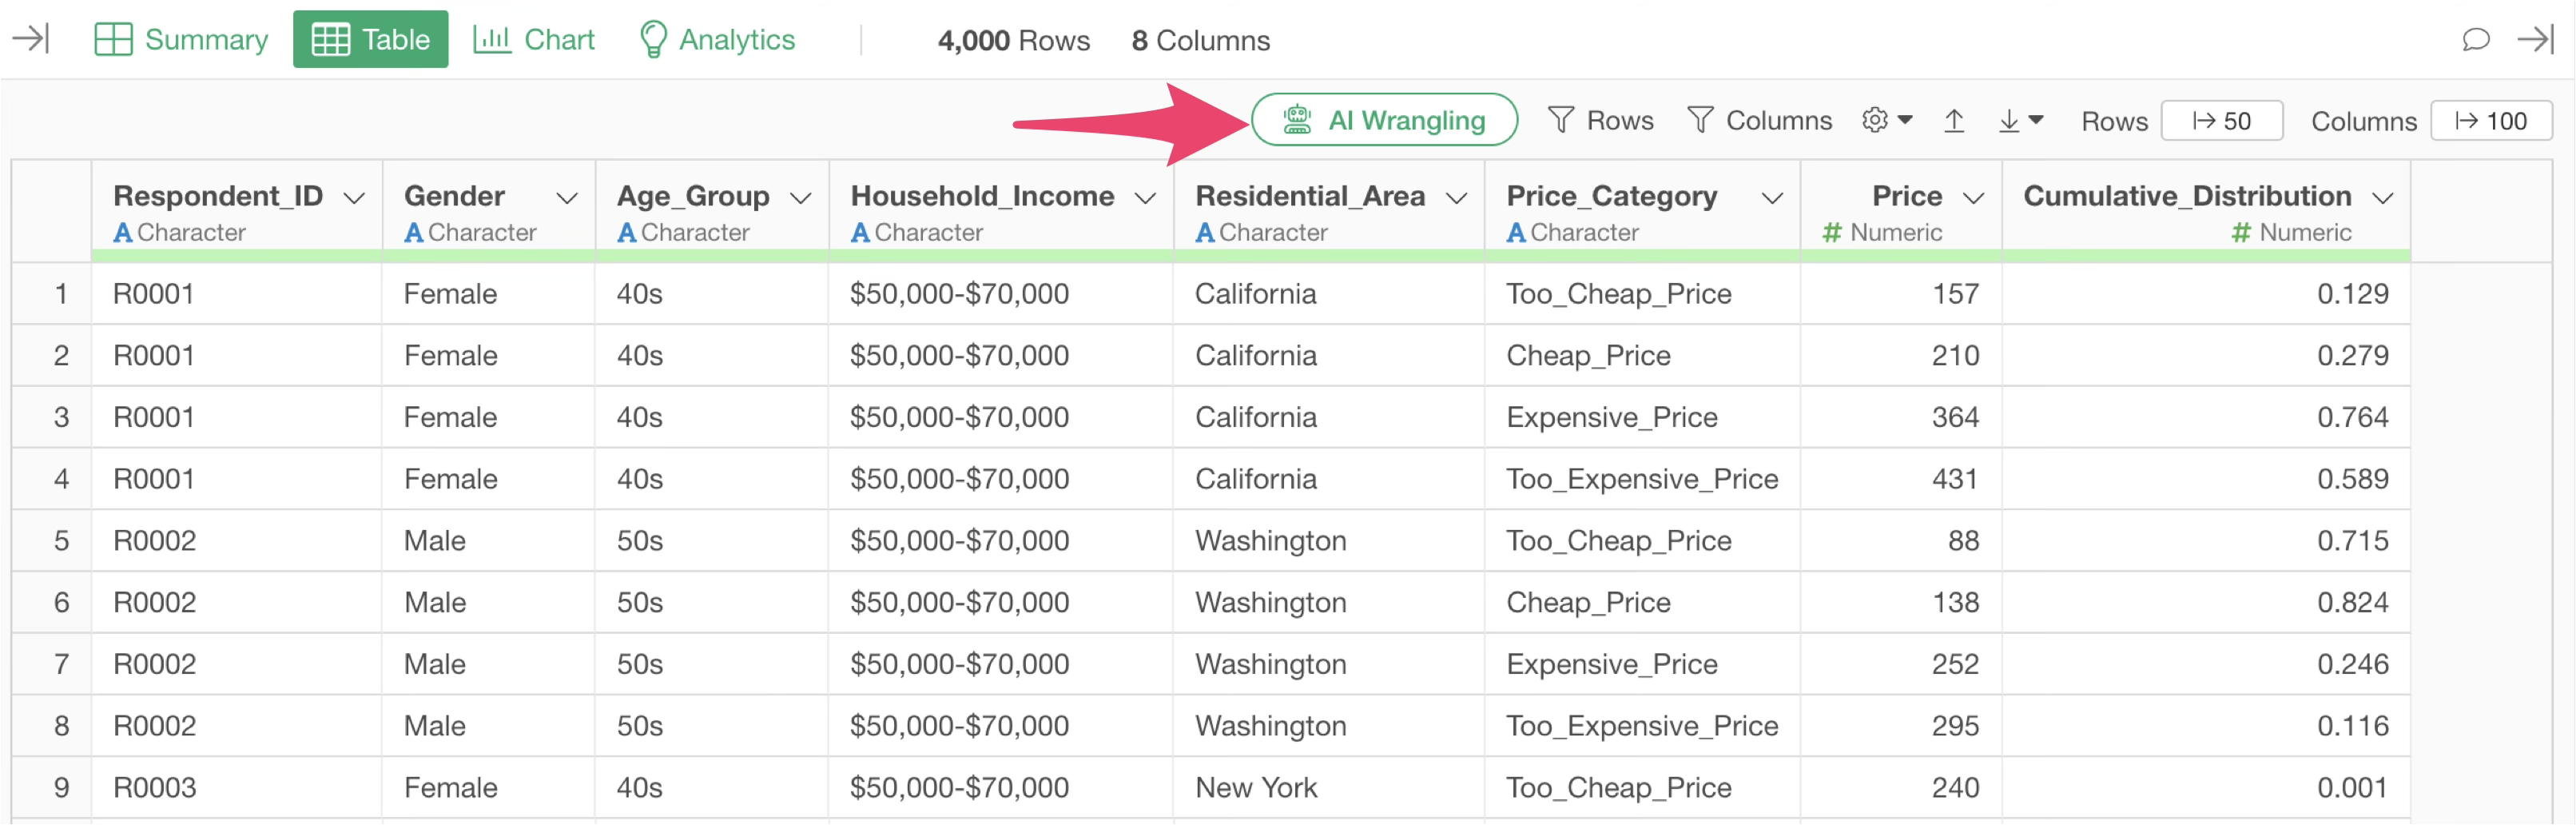
First, click the “AI Wrangling” button.
When the AI Prompt dialog opens, enter text like the following and execute it.
Run PSM analysis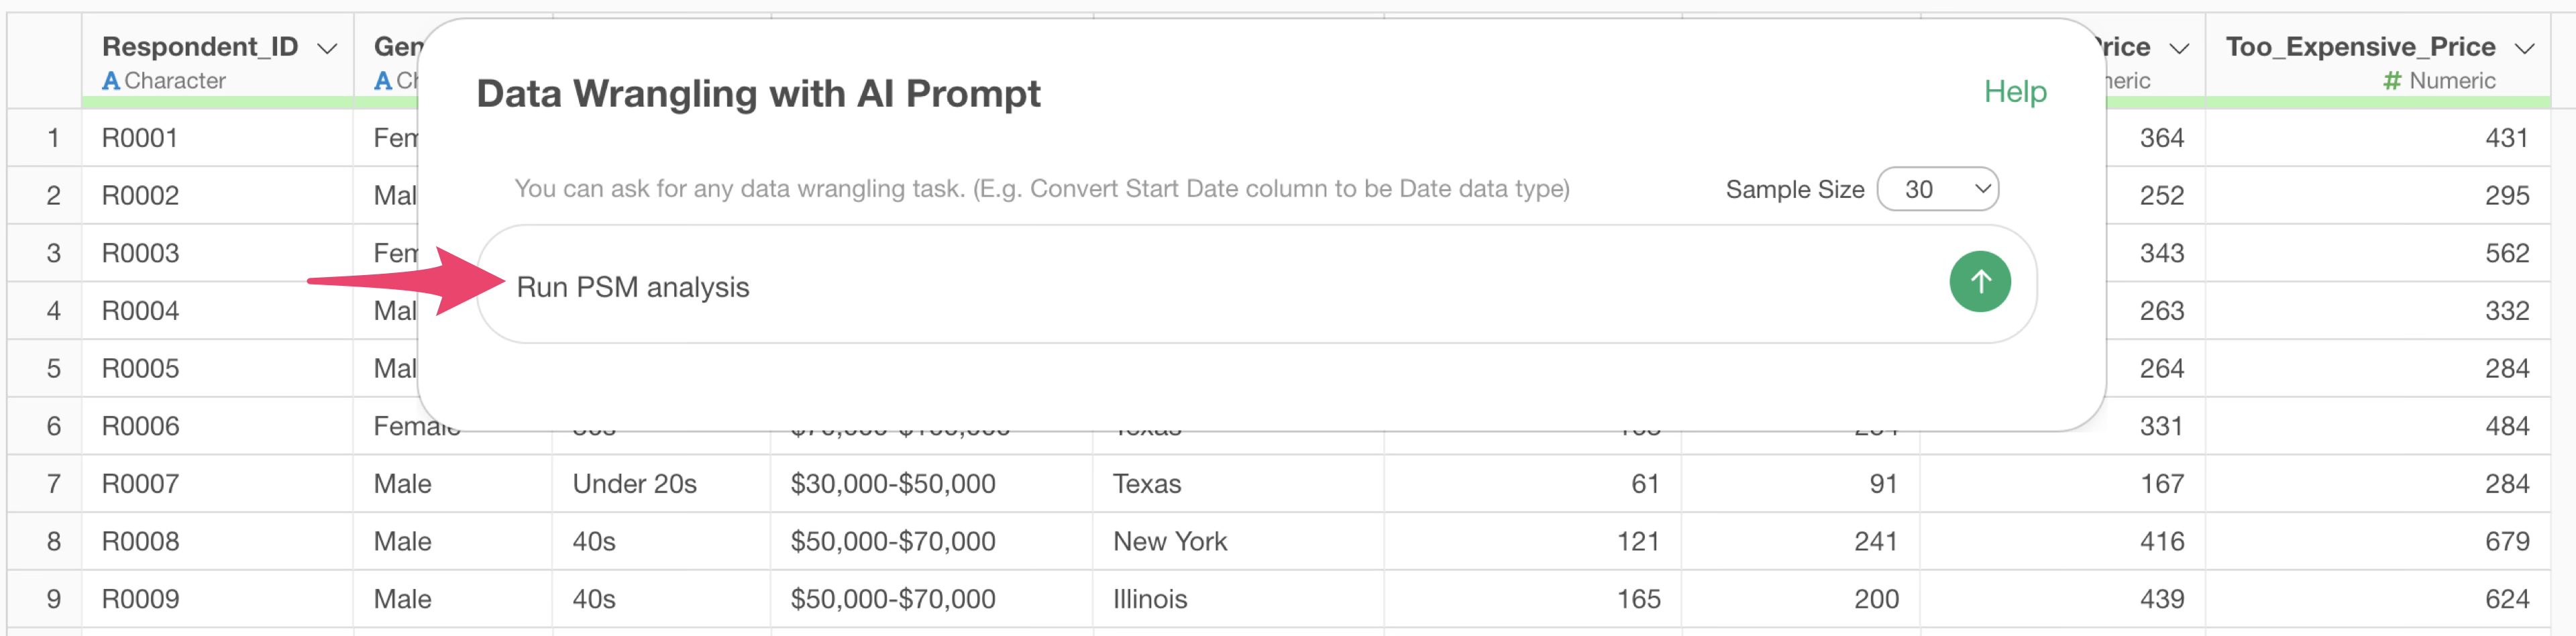
Then, the code to execute the PSM analysis will be generated.
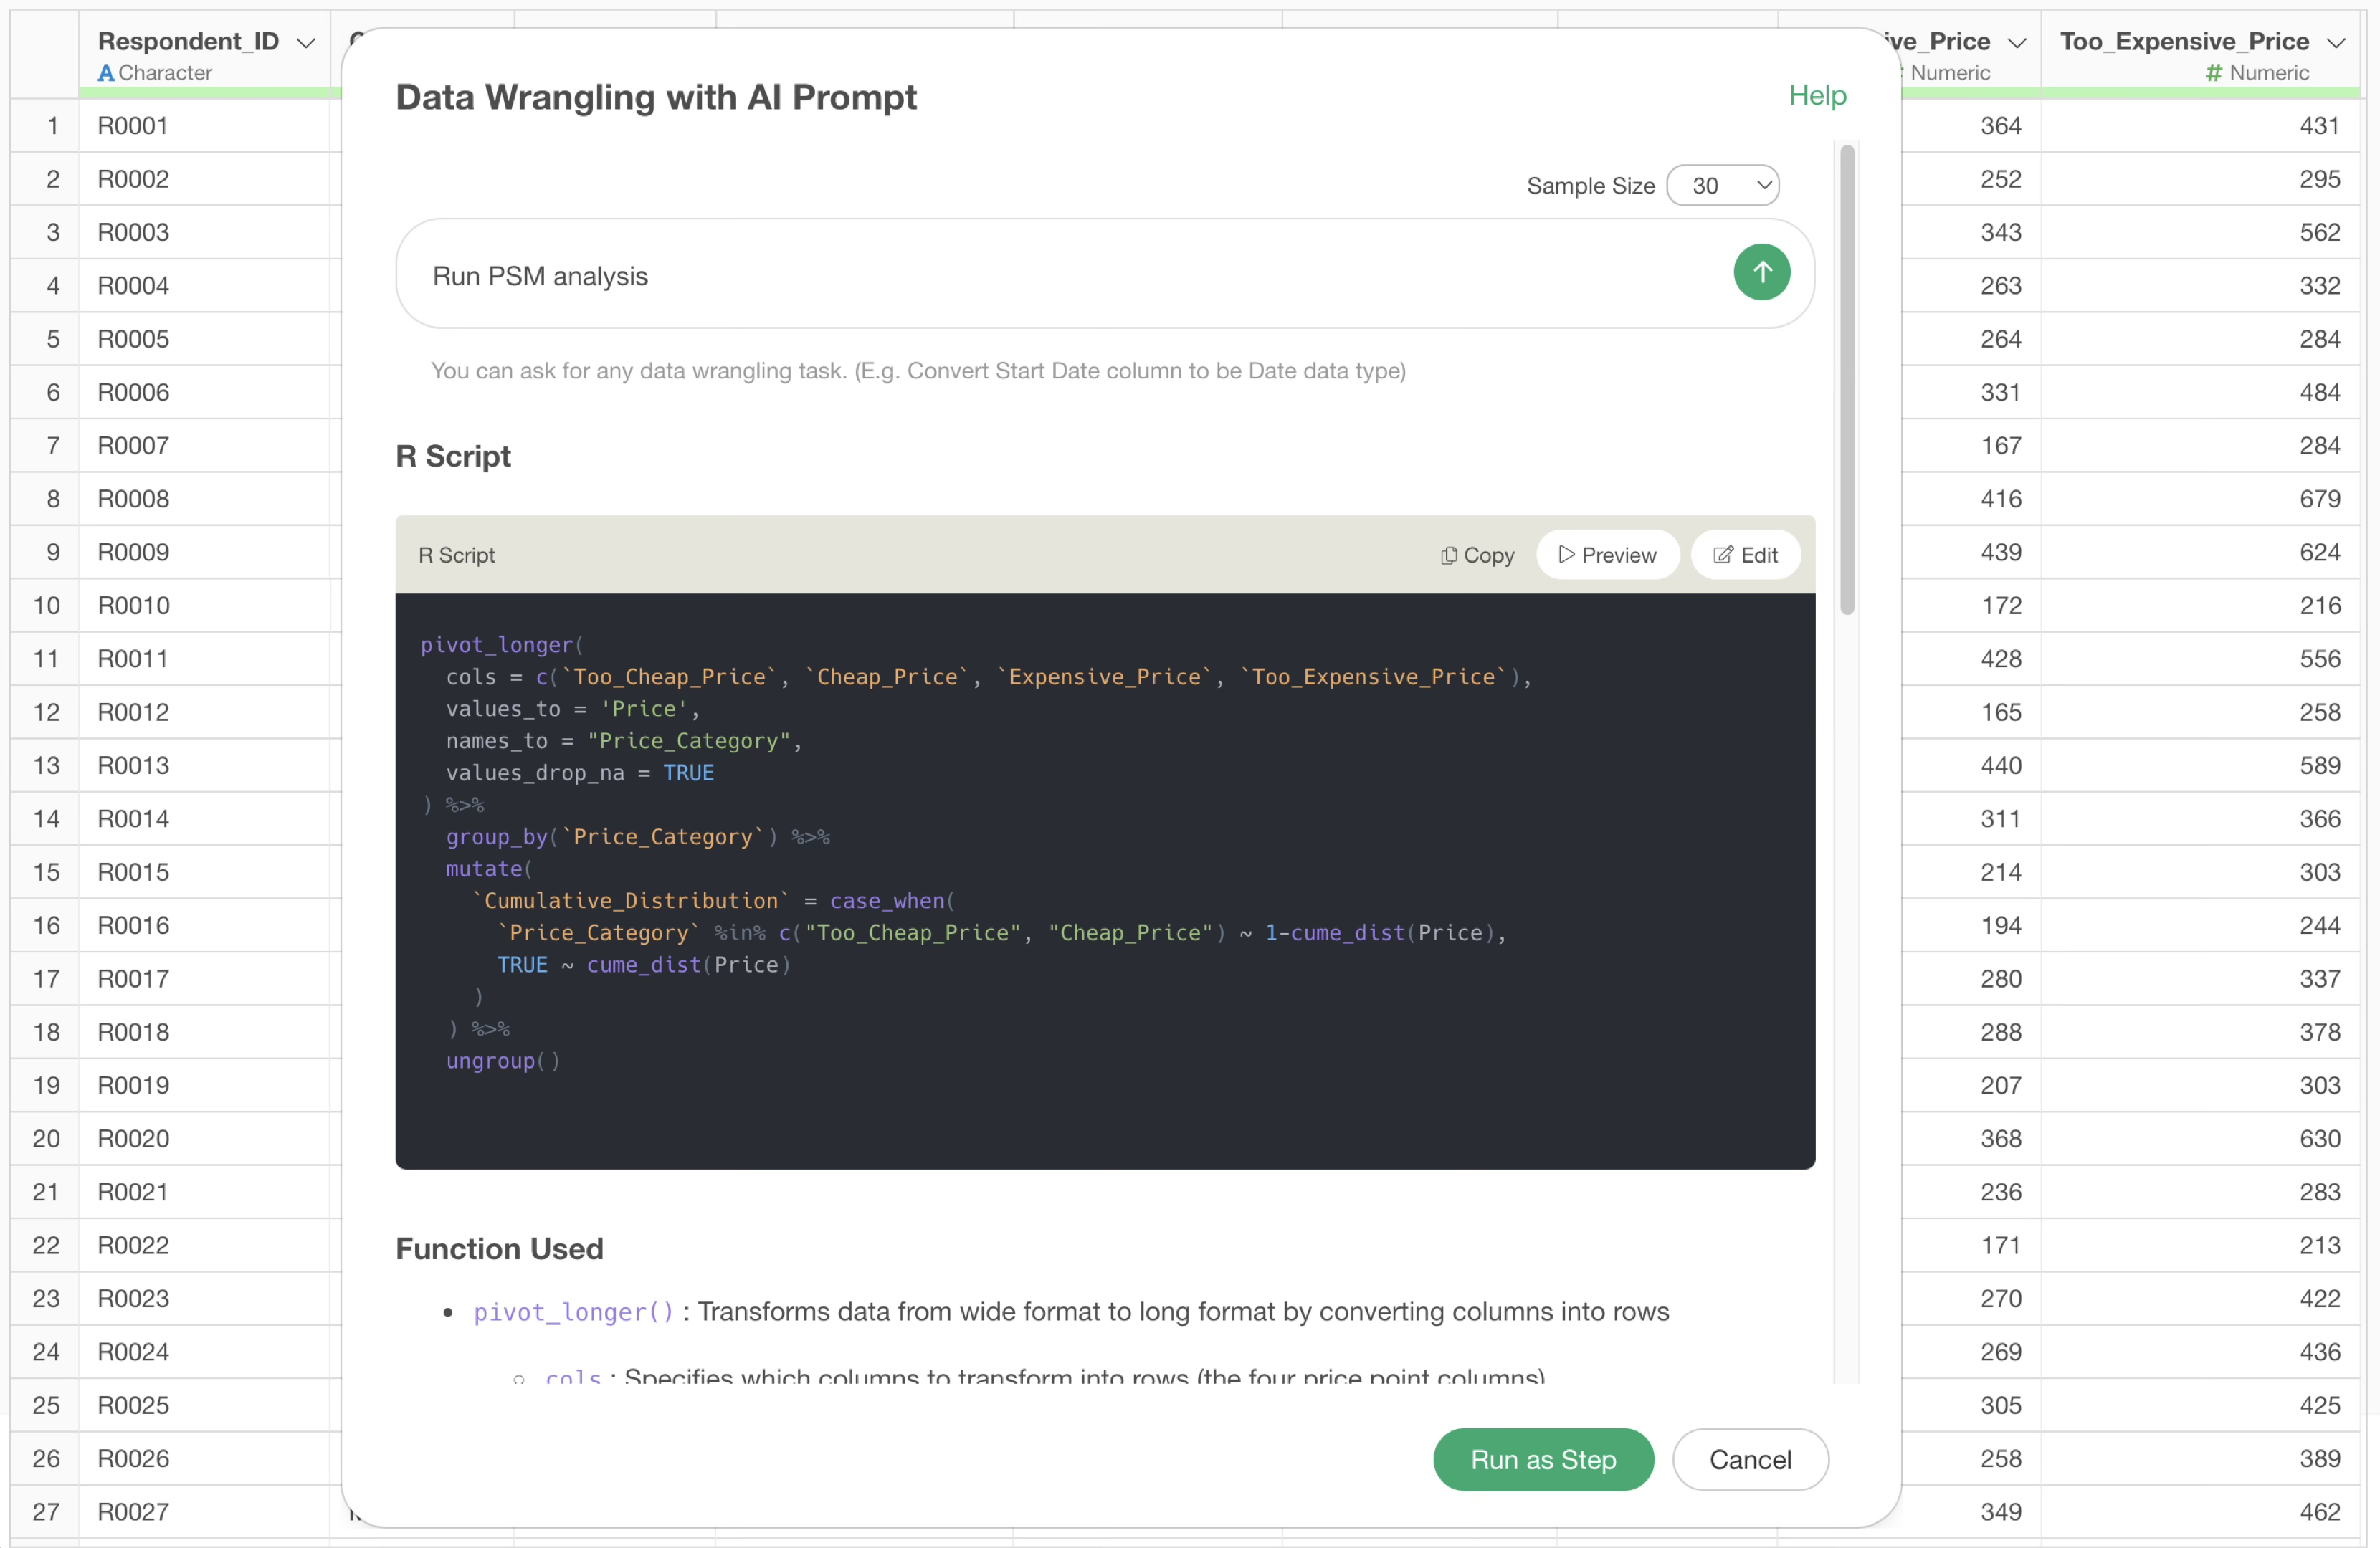
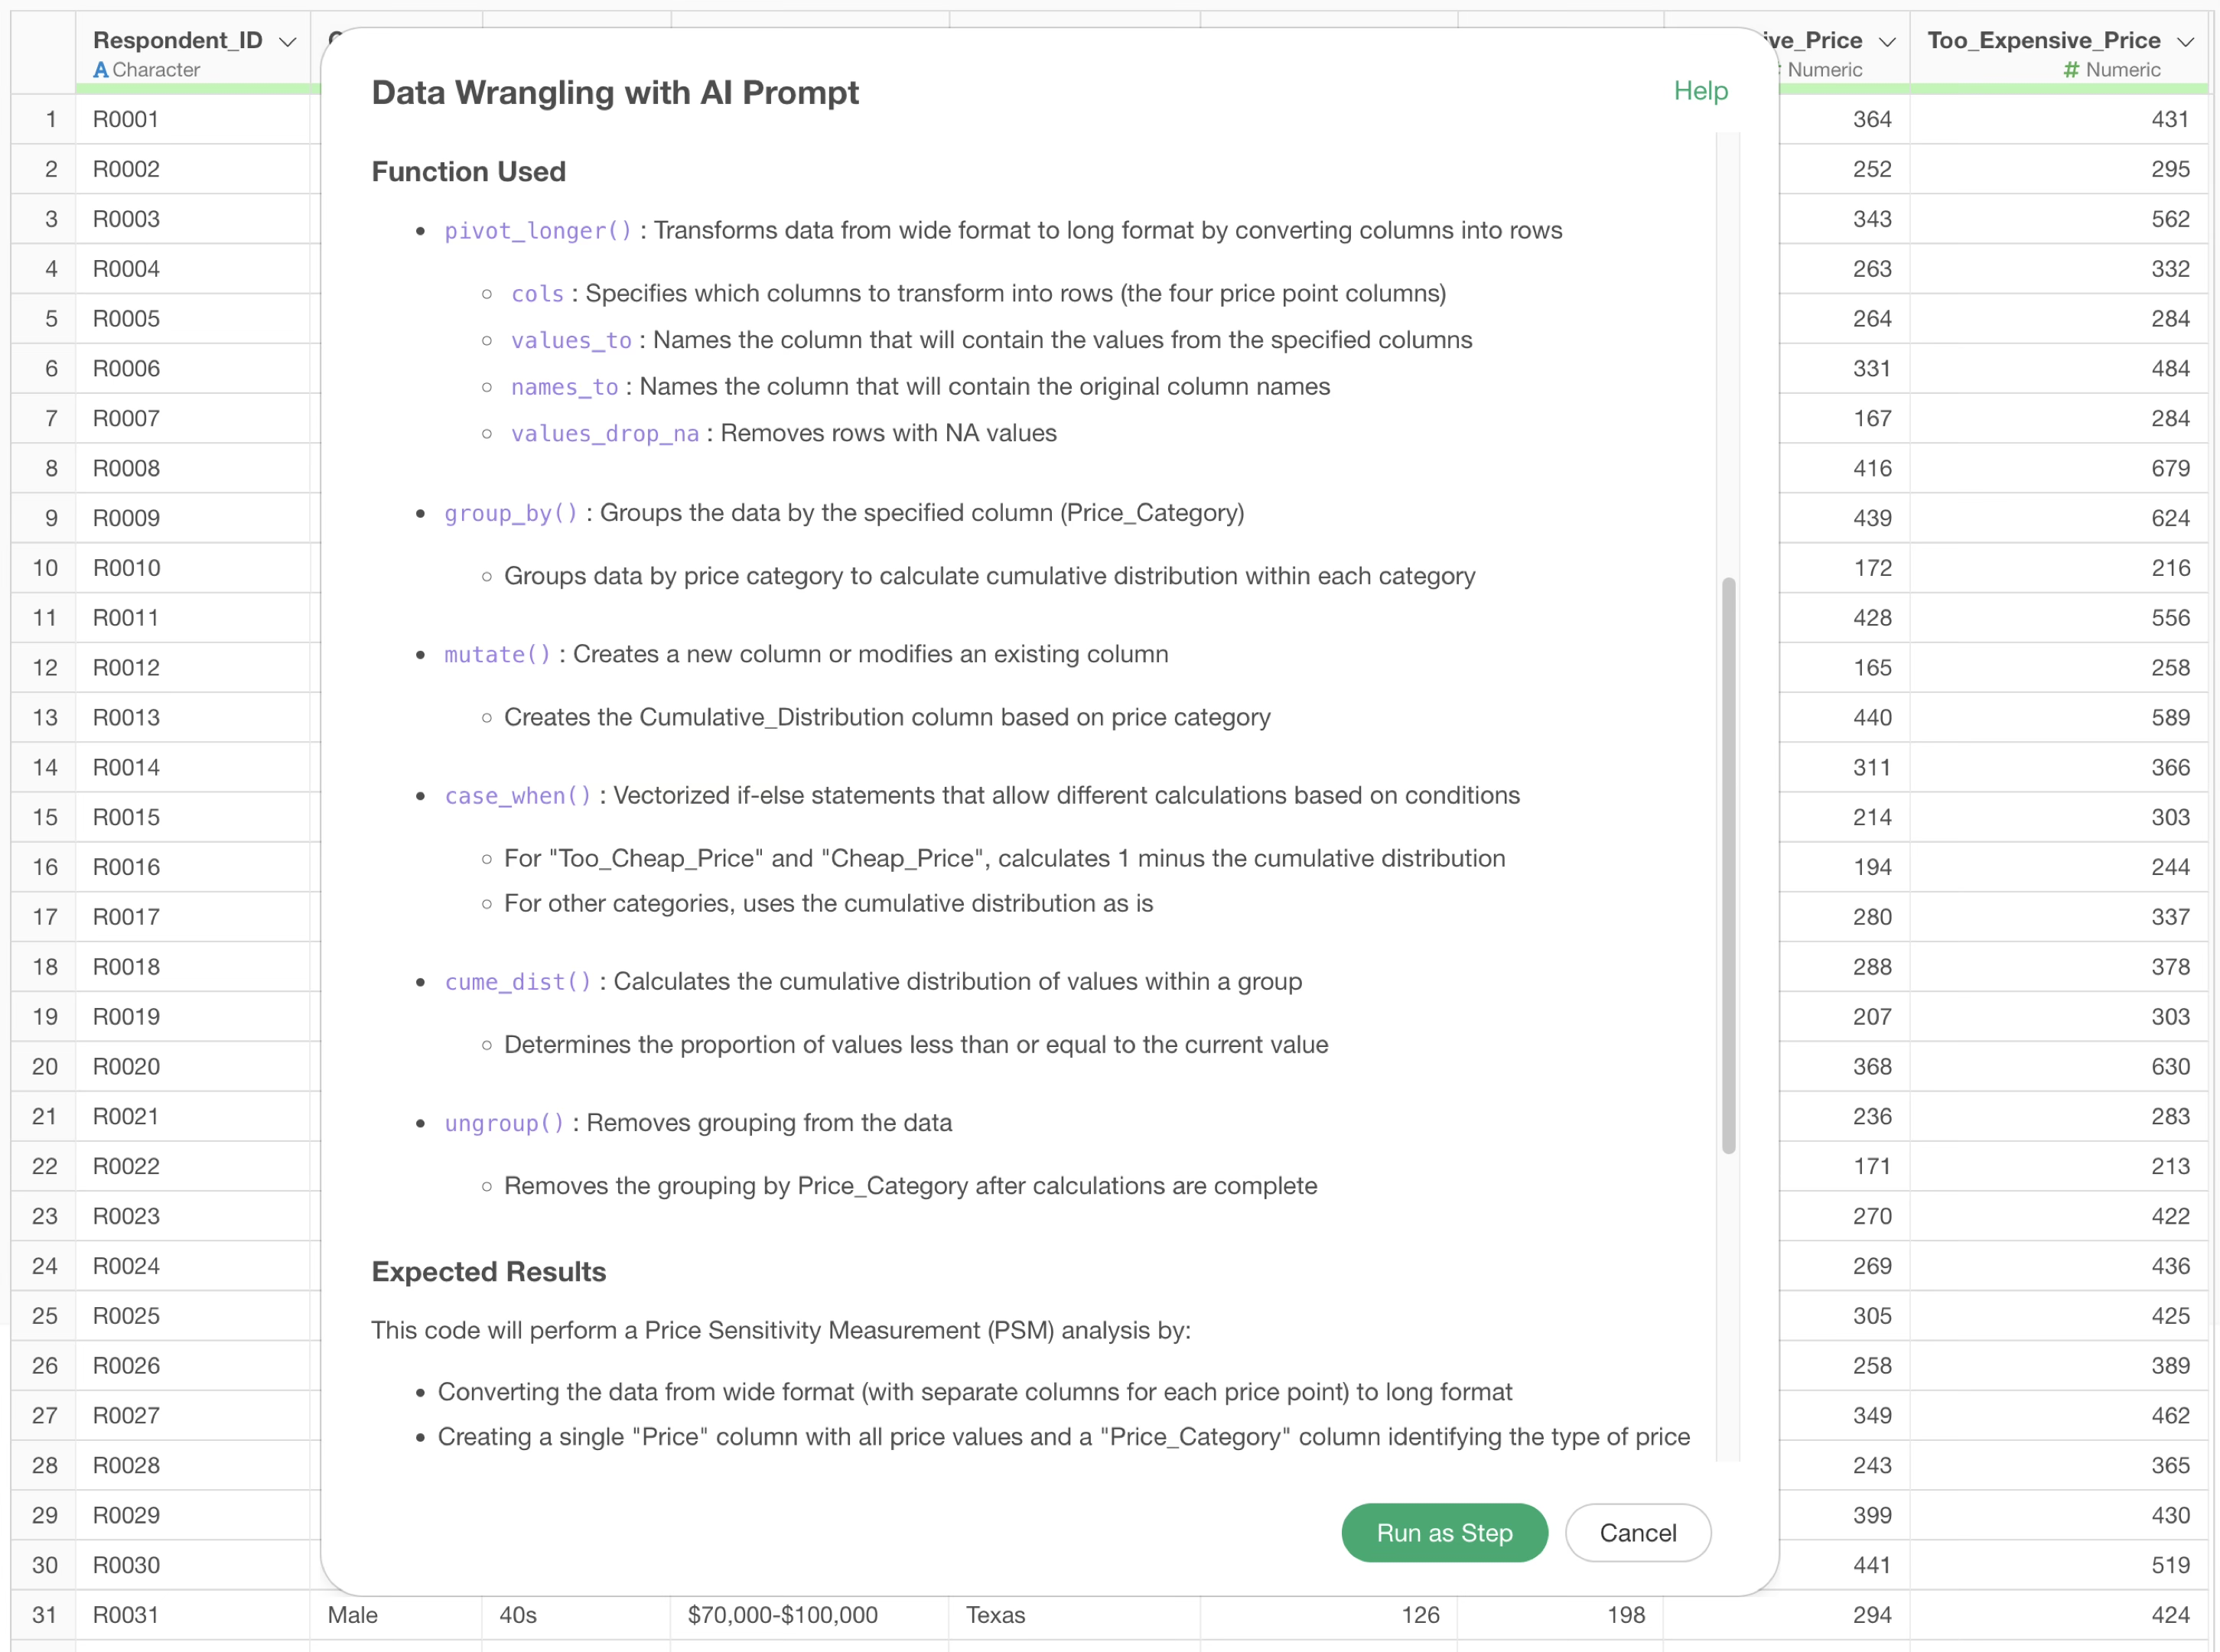
Check the explanation of the functions used and the expected results, confirm that the data for PSM analysis will be appropriately generated, and click the “Run as Step” button.
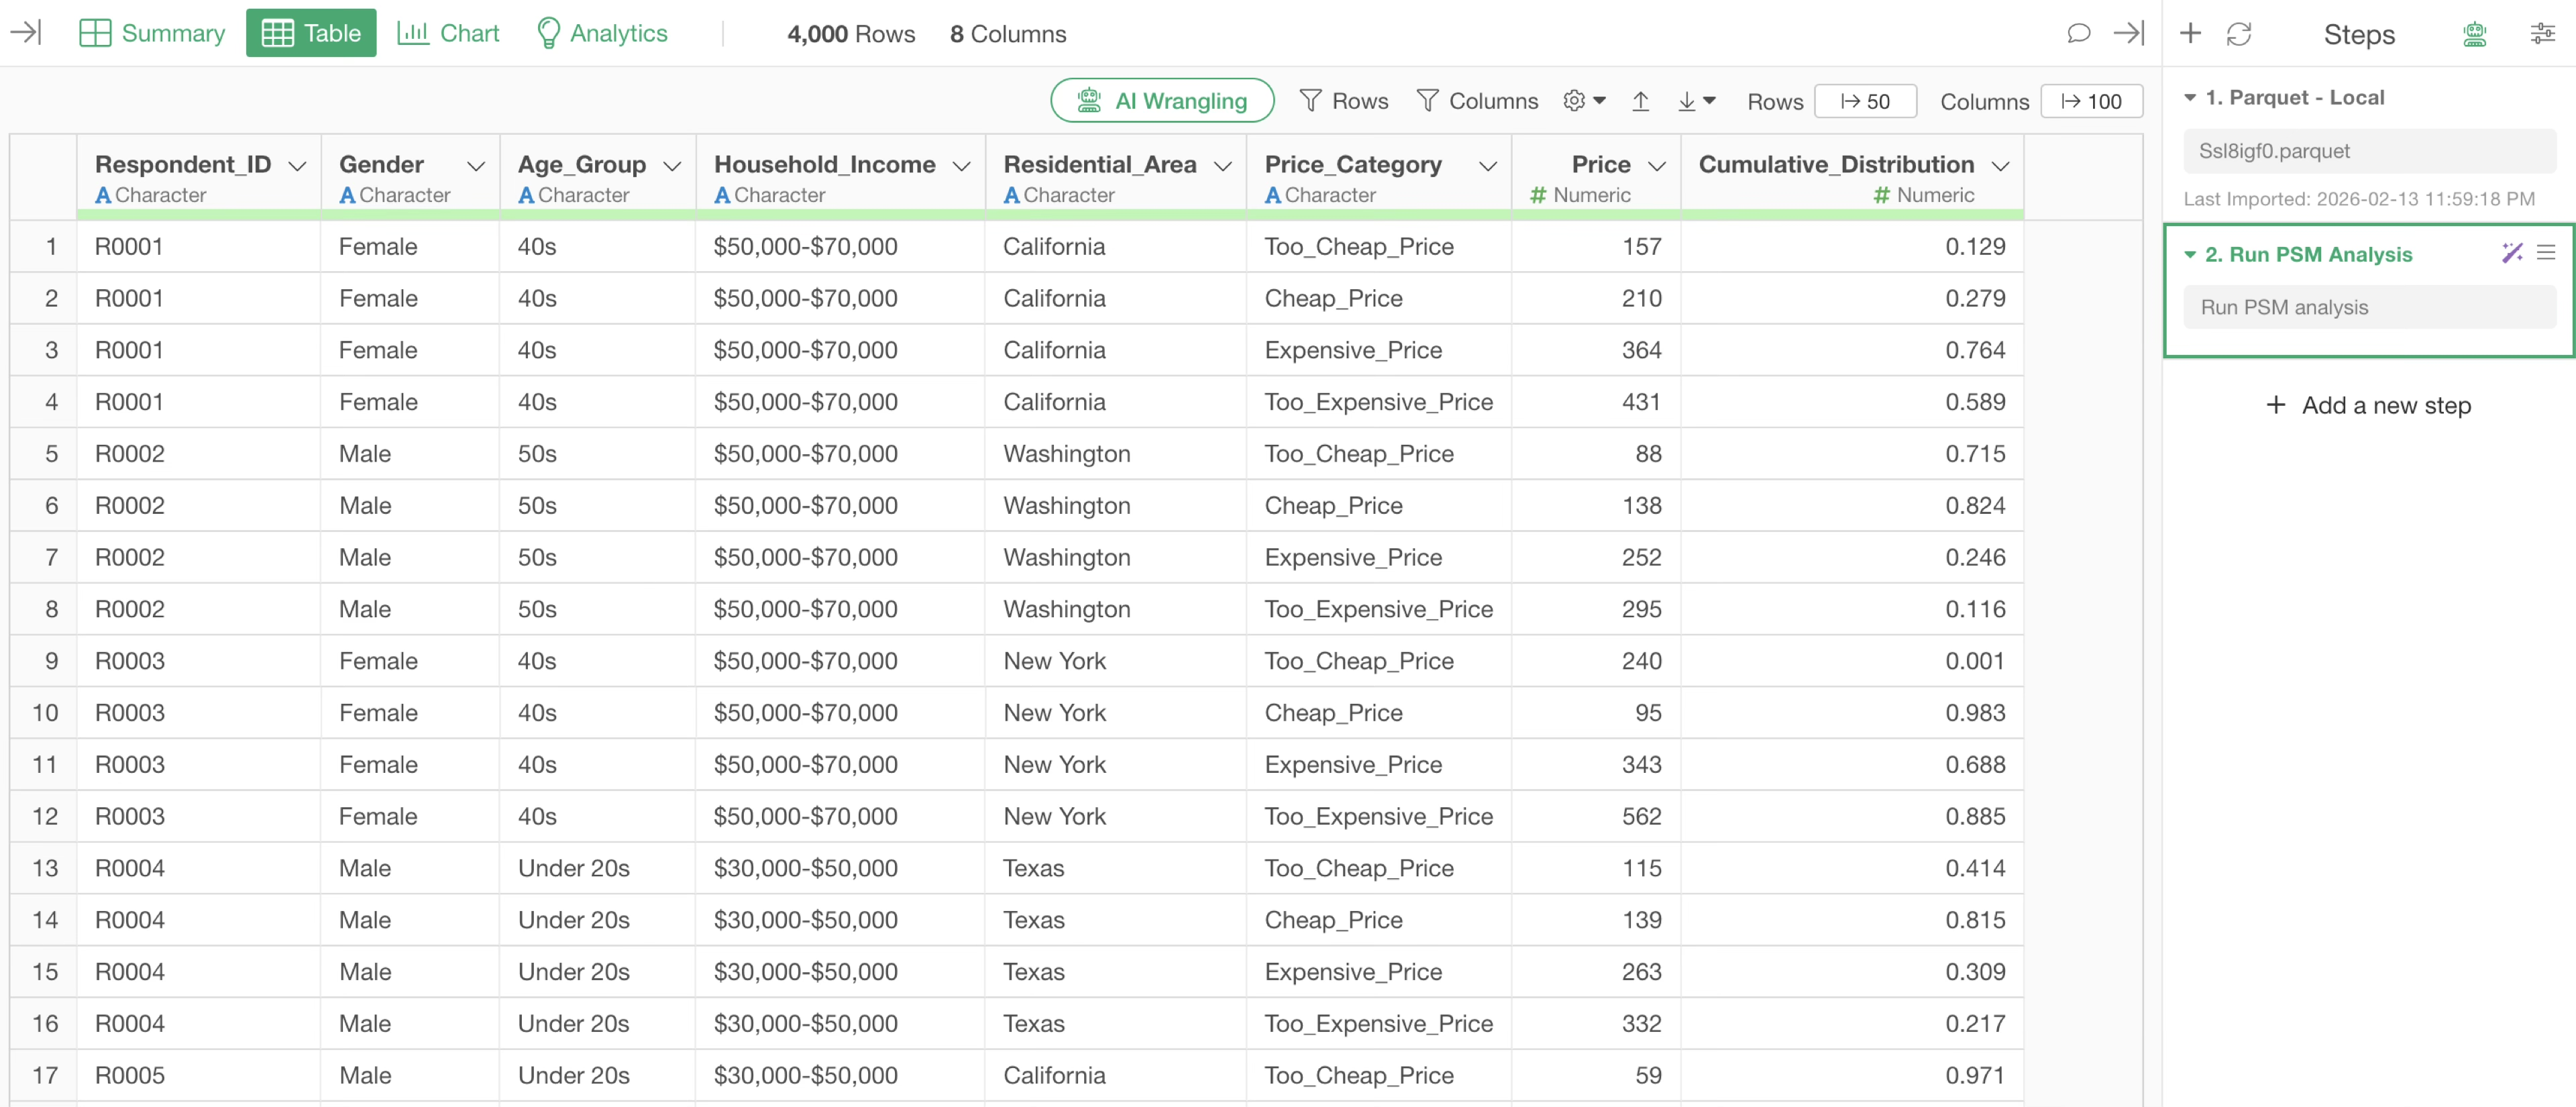
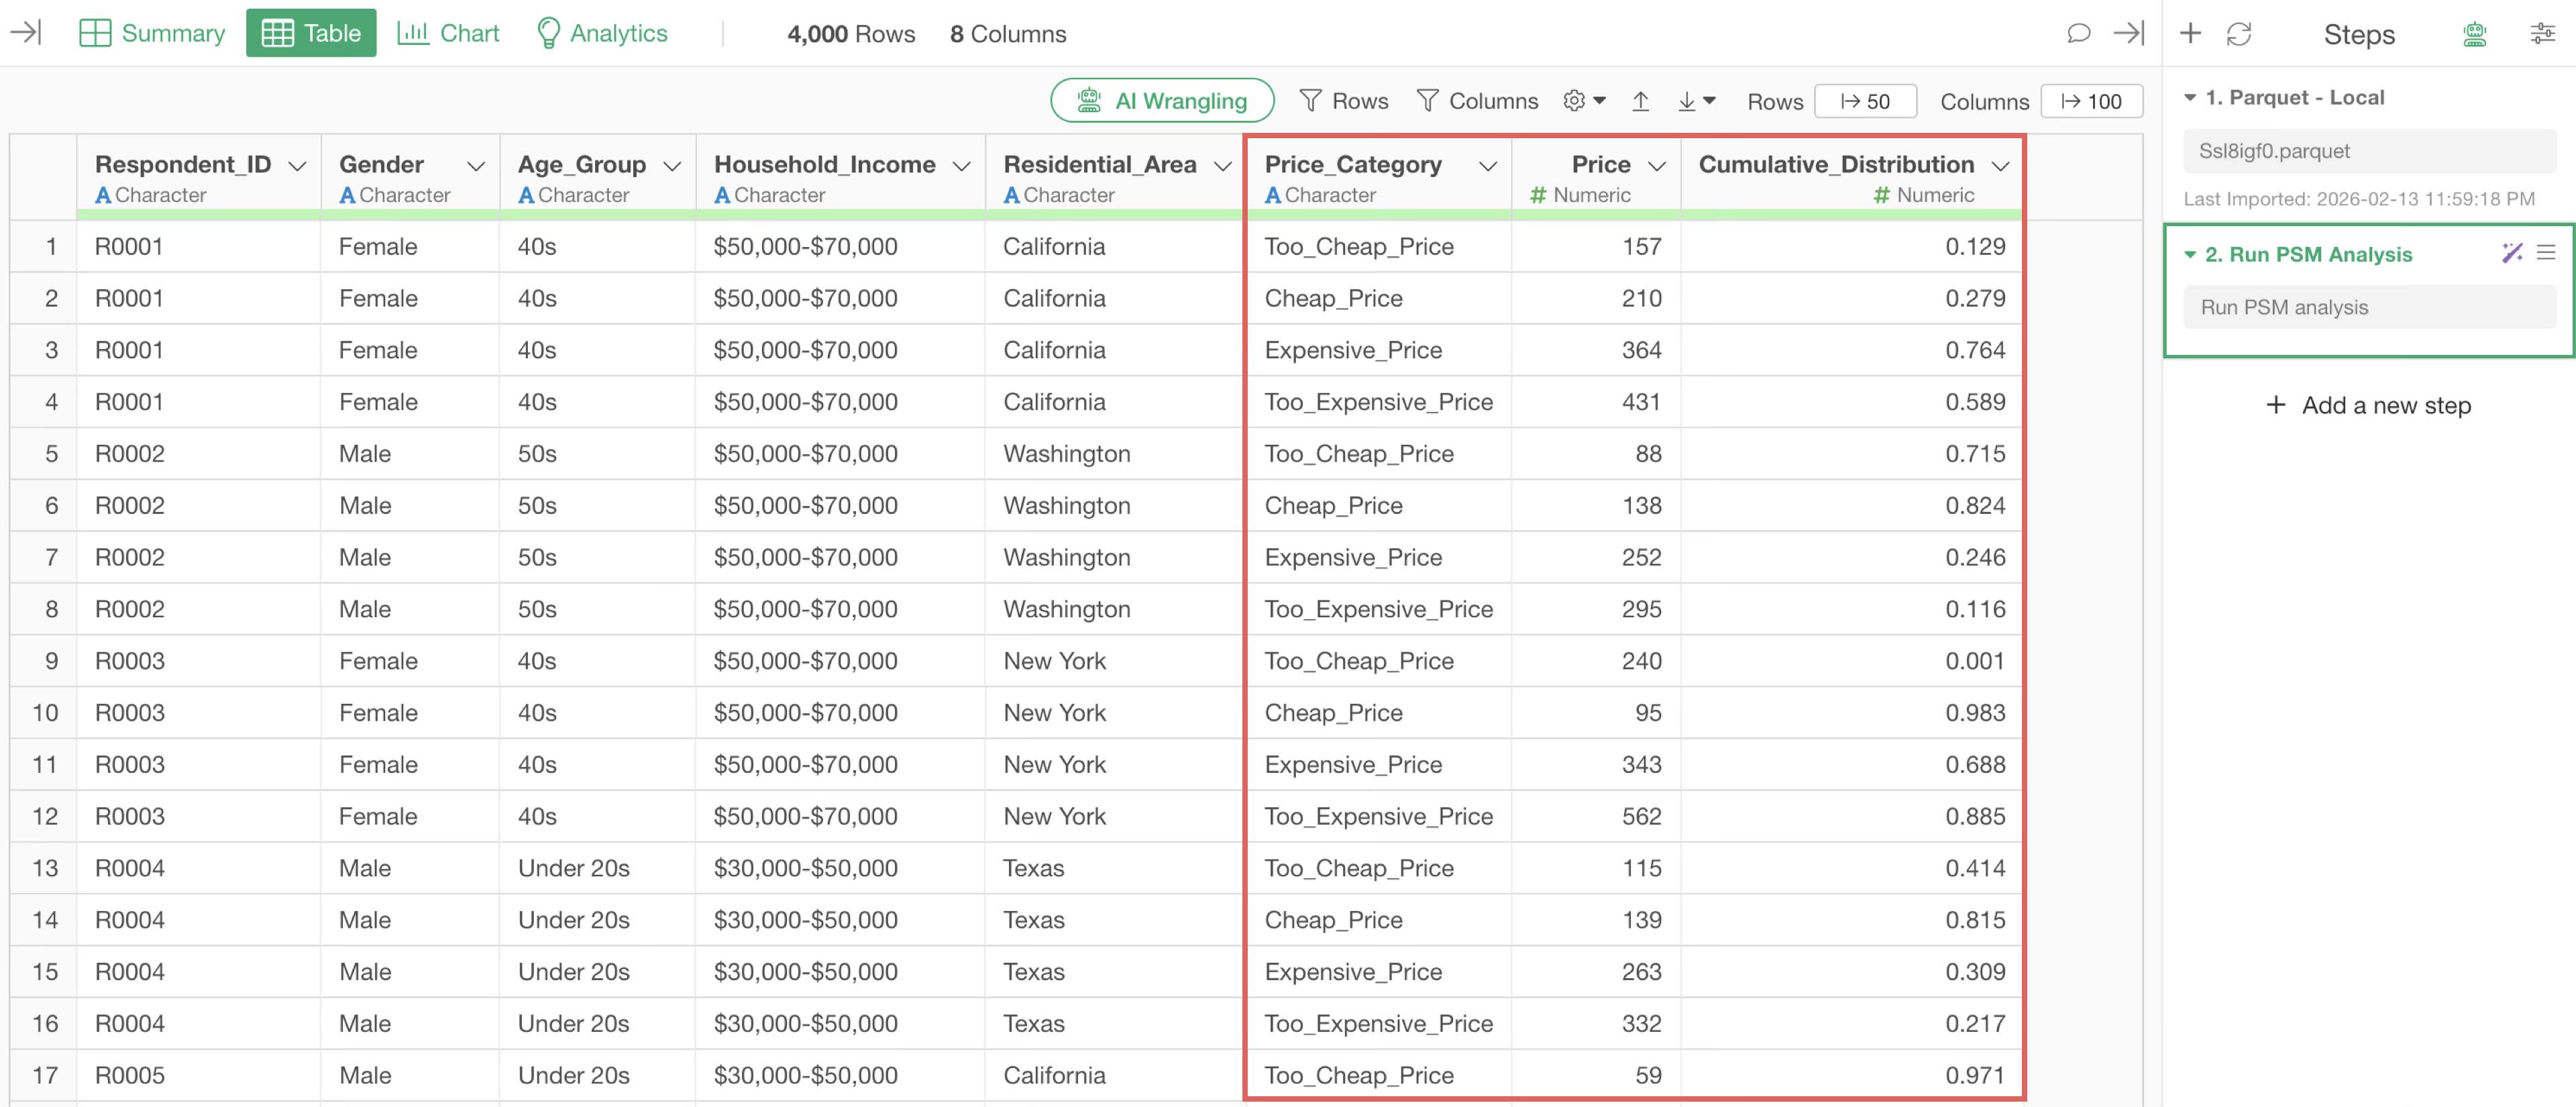
The step is added, and the cumulative distribution data for PSM analysis has been calculated.

Checking the data, the cumulative percentage at each price point has been calculated.

Using this cumulative percentage data, you can visualize the four characteristic curves of PSM analysis.
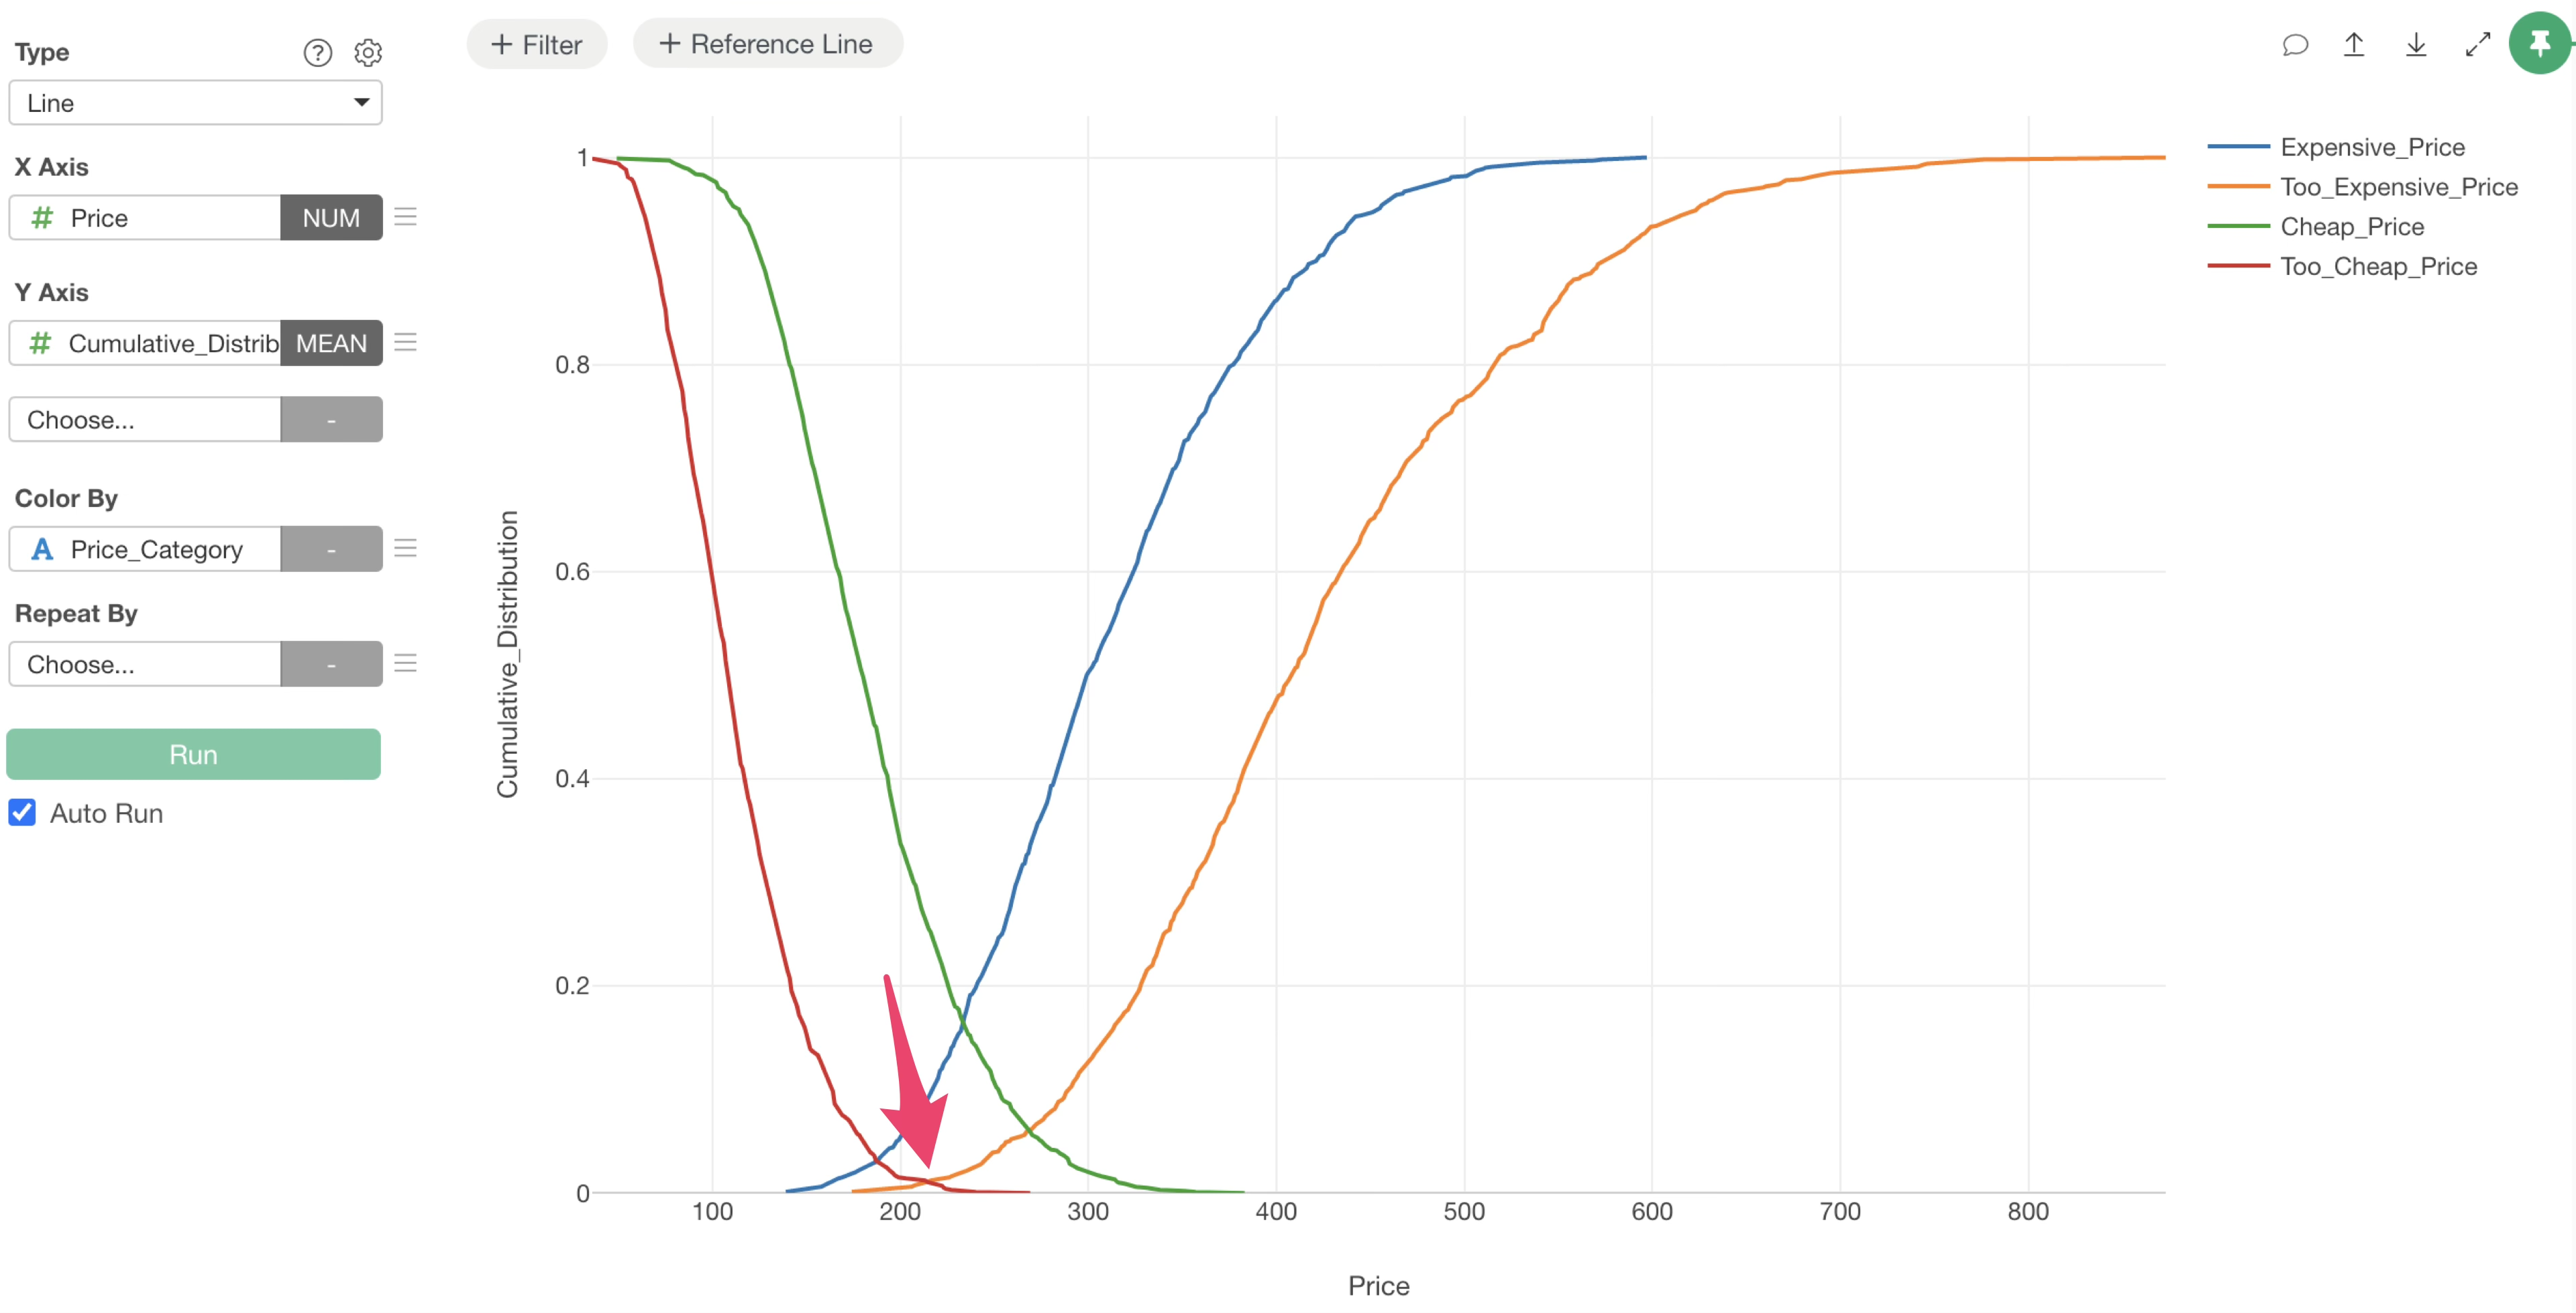
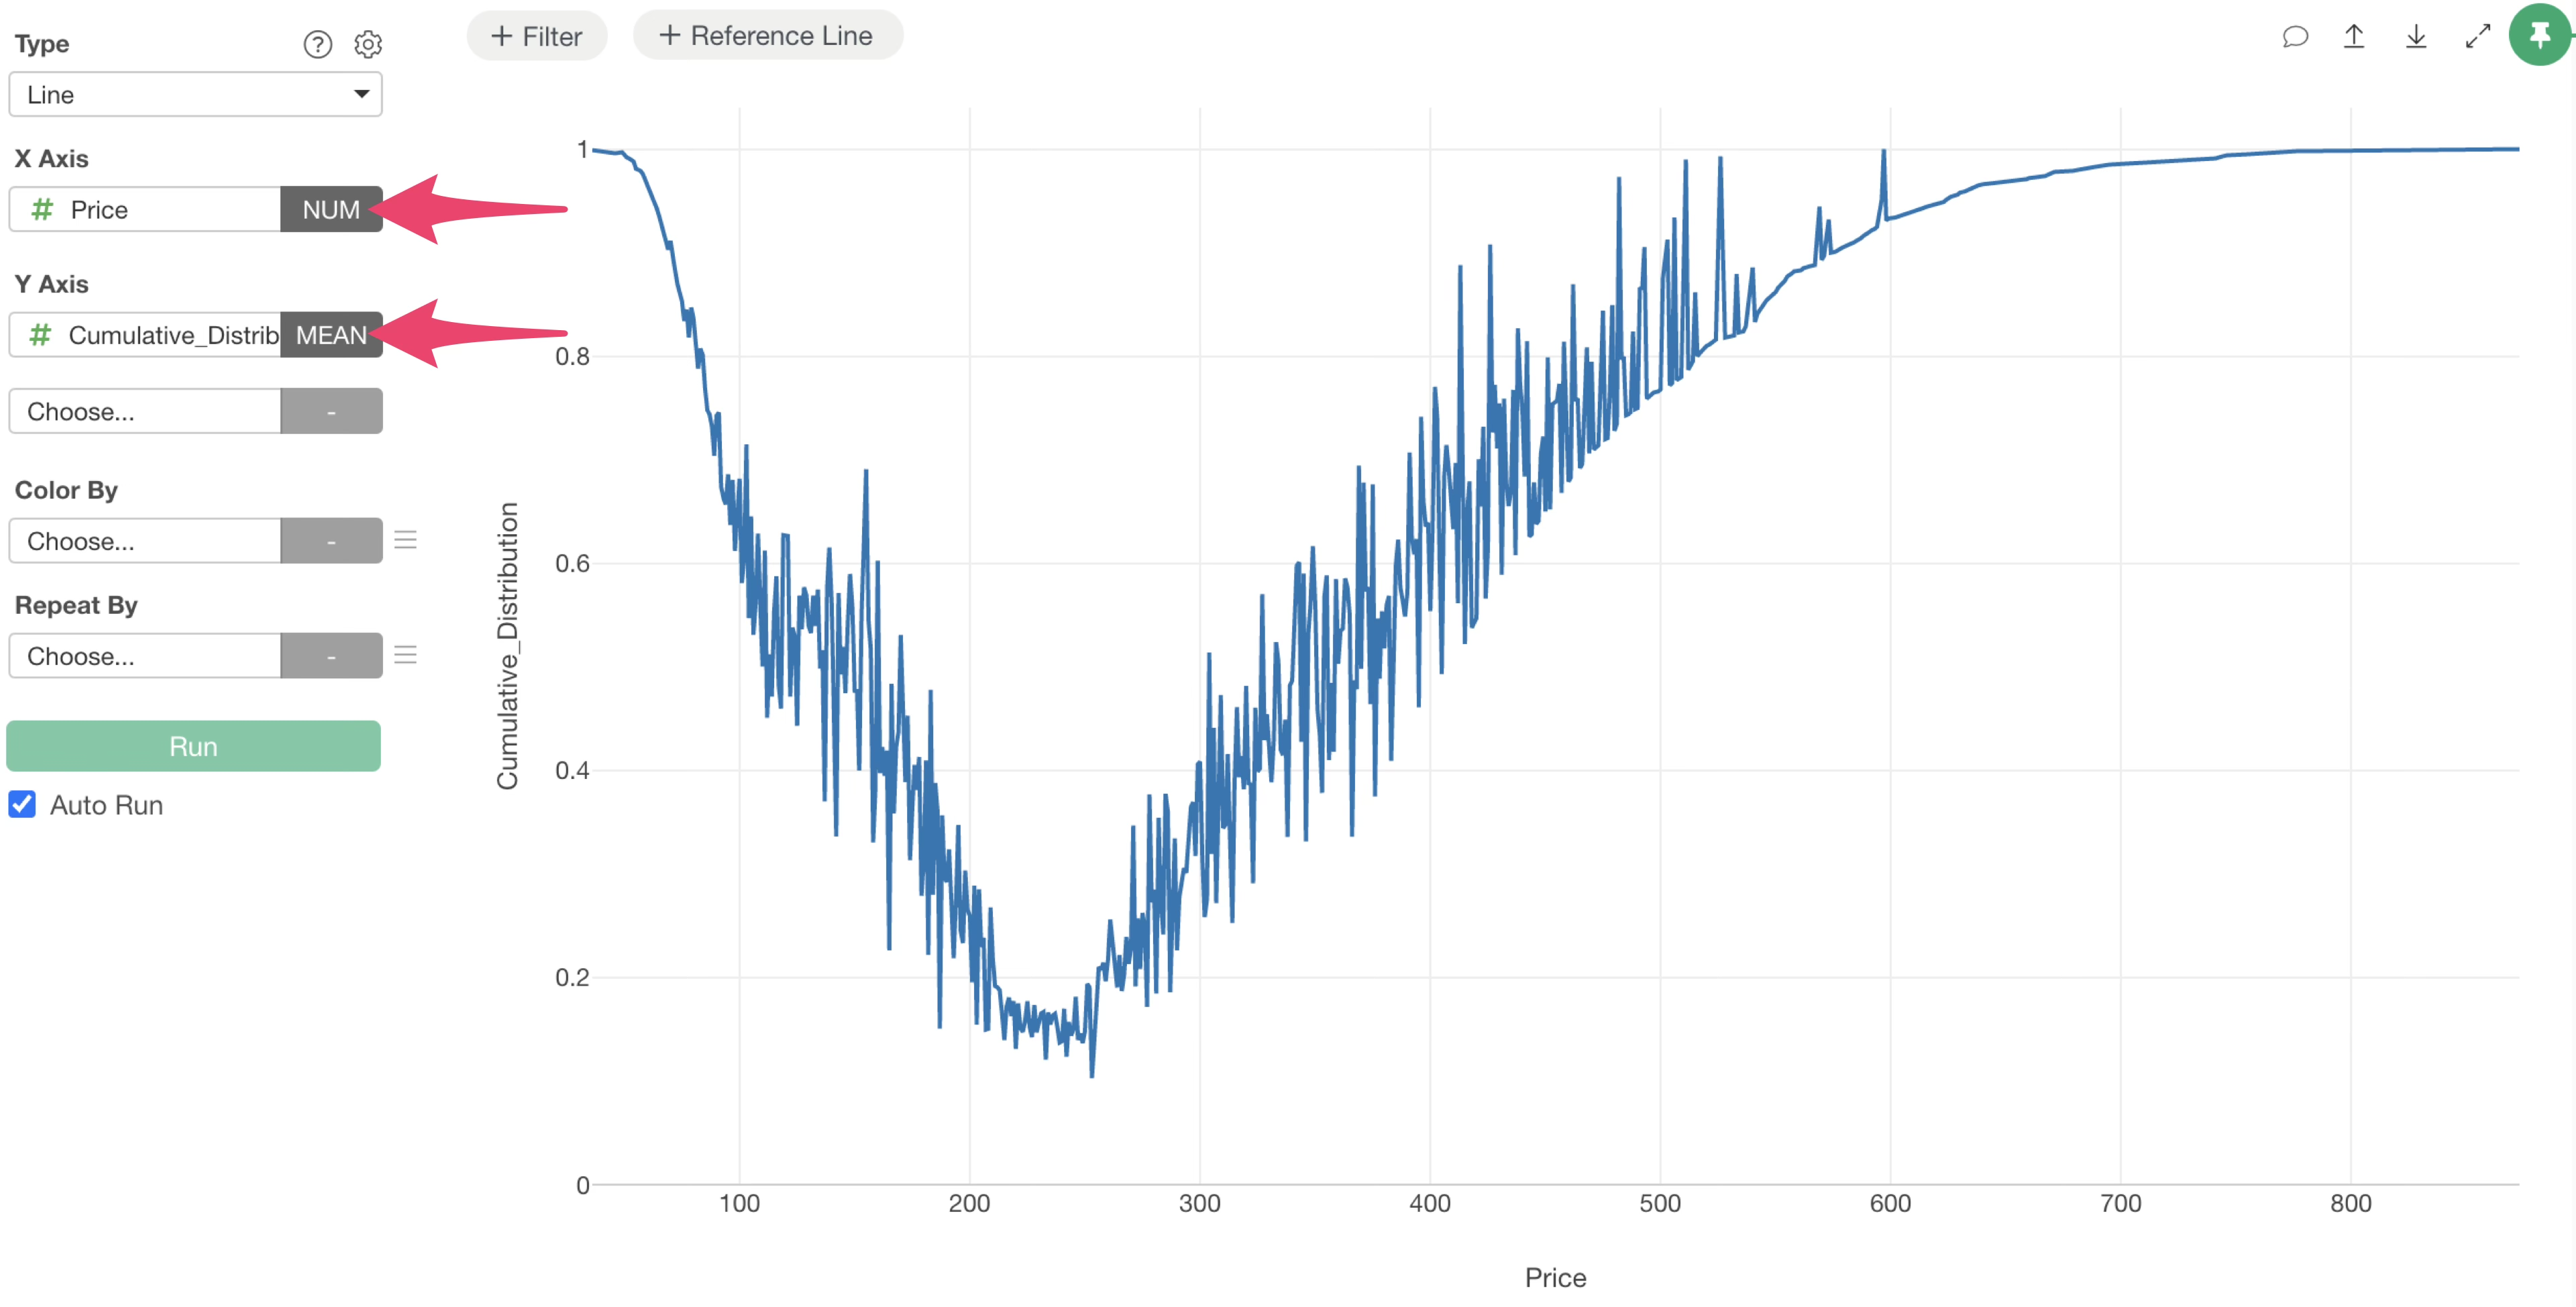
Go to the Chart view, select “Price” for the X-axis and “Cumulative Distribution” for the Y-axis in a line chart, and select Mean for the aggregate function.
Next, simply select “Price Category” for Color, and you can visualize the results of the PSM analysis.
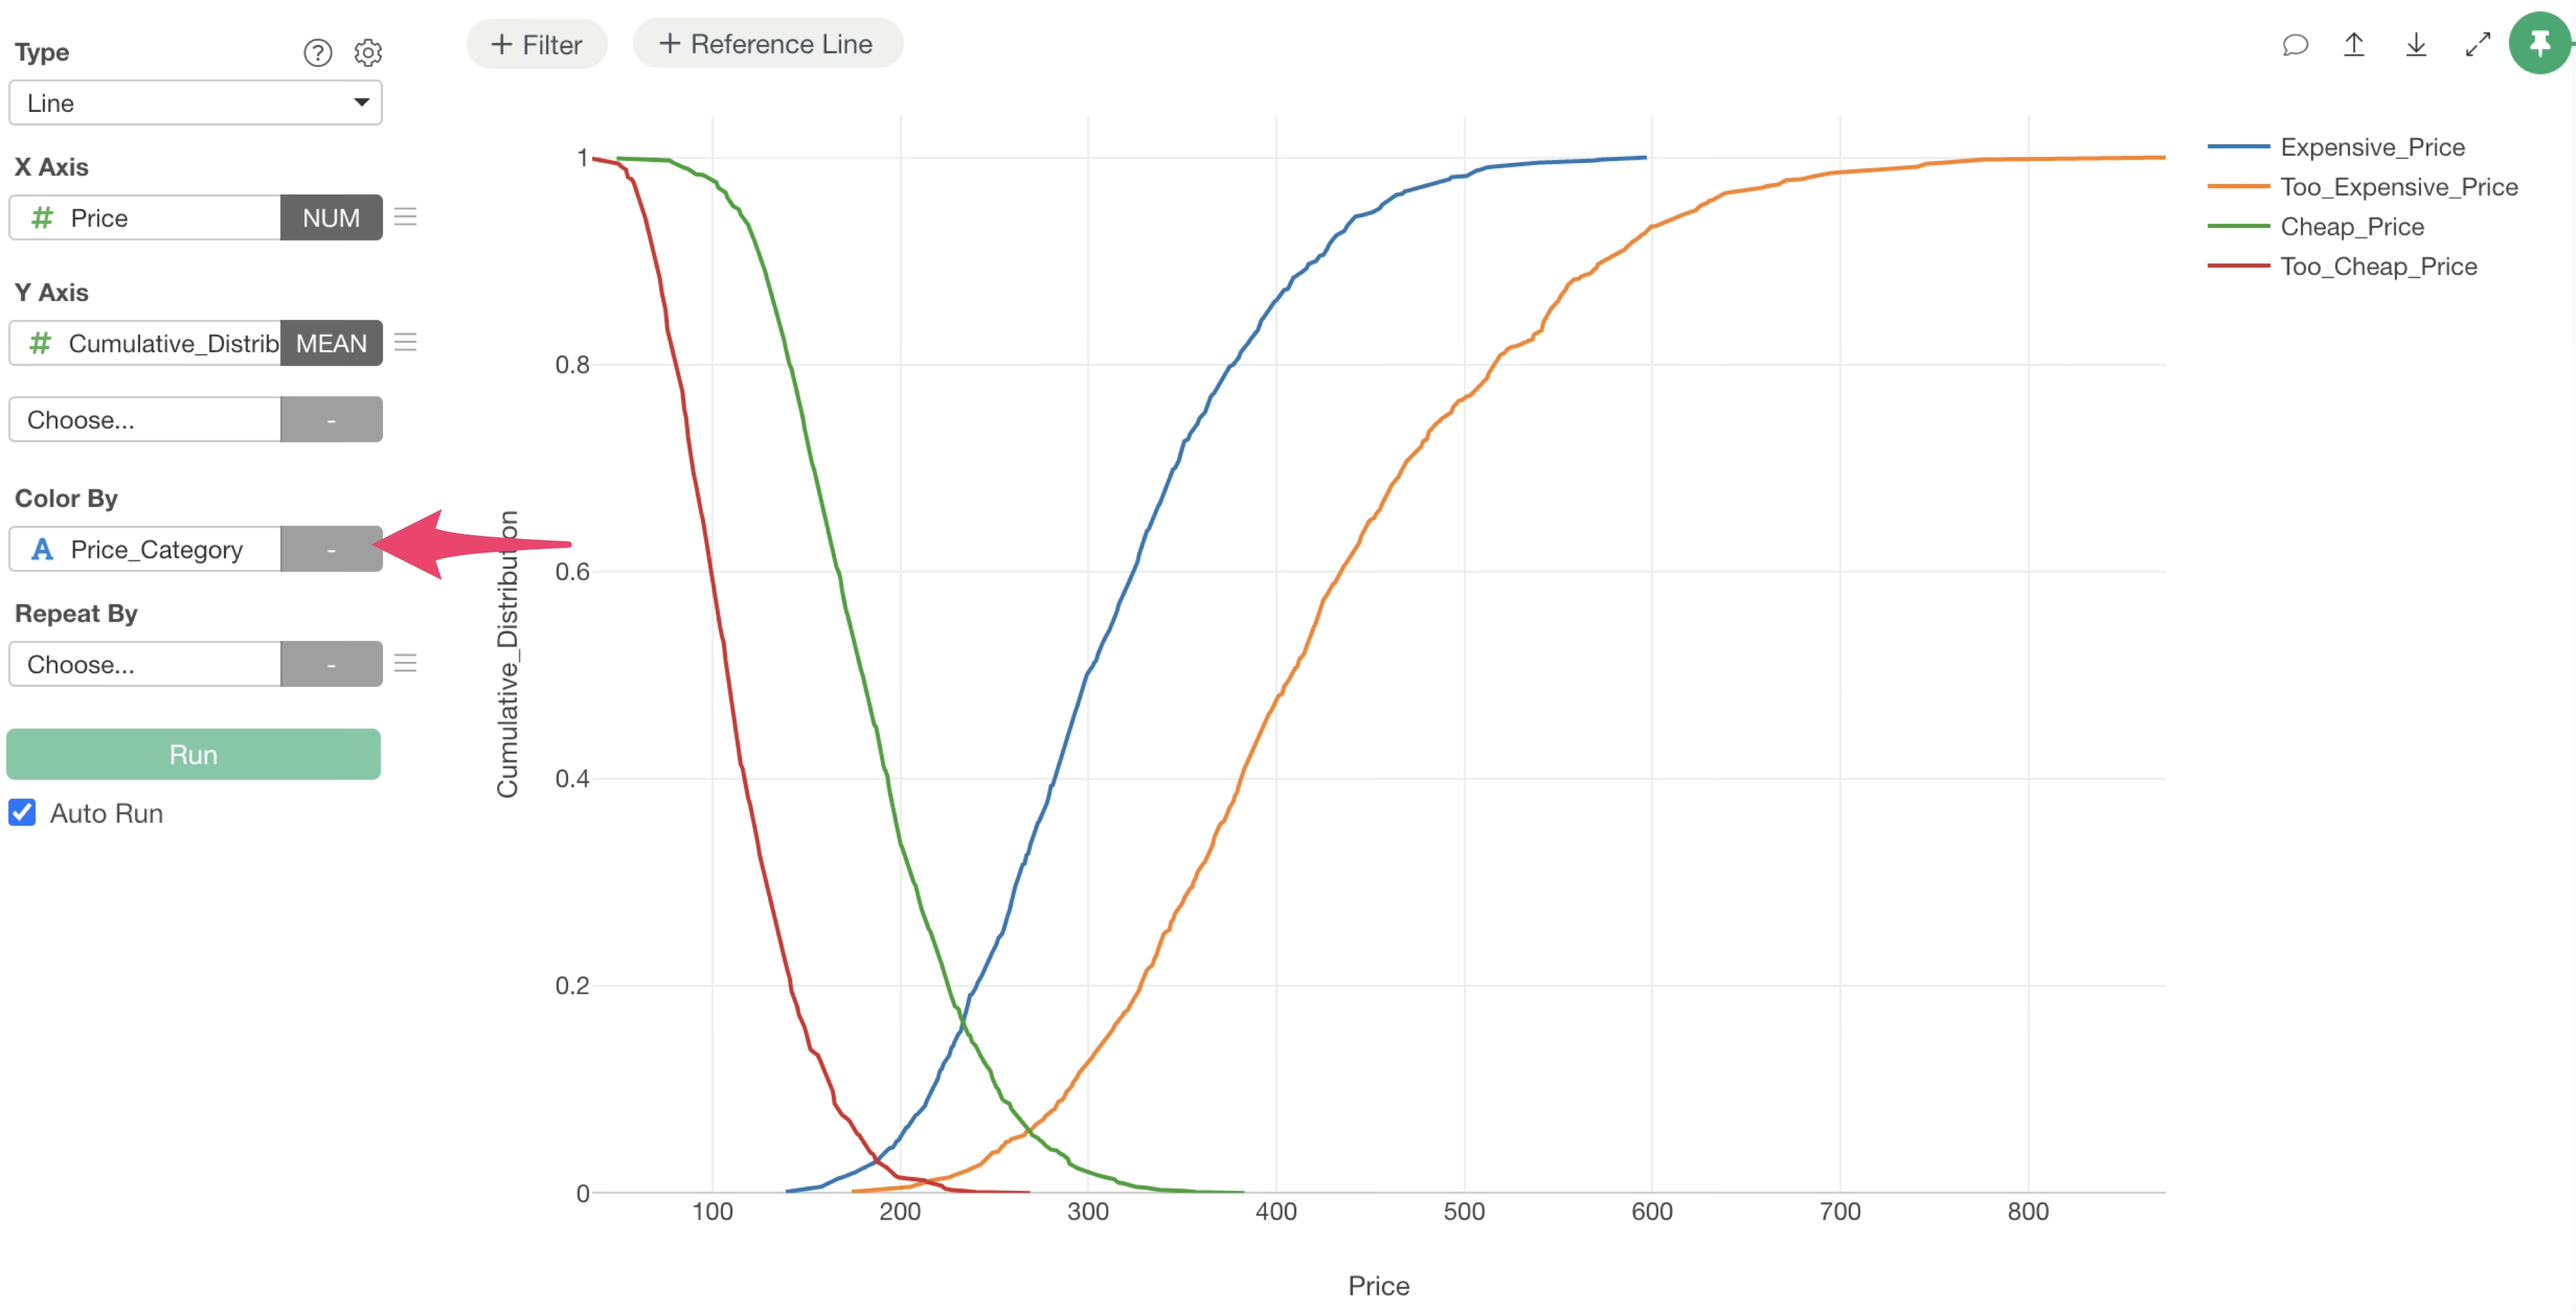
From this result, the range from $187 to $270 is the acceptable price range,

and it is clear that around $214 is the optimal price.