How to use Factor Analysis
Factor analysis is an analytics method that discovers a smaller number of “latent common factors” behind many variables (survey items). For example, even if a customer satisfaction survey has 10 evaluation items, it can often be explained by 3 to 4 essential factors.
Factor analysis specifically provides insights such as:
- Discovery of essential evaluation axes: Identifying factors that customers truly value from numerous evaluation items.
- Understanding relationships between variables: Grasping which evaluation items belong to the same factor.
- Data dimensionality reduction: Summarizing 10 variables into 3 to 4 factors for easier understanding.
- Factor scores for each respondent: Quantifying which factors individual customers prioritize.
Therefore, this note introduces how to use and interpret “Factor Analysis” in Exploratory.
Required Data Format
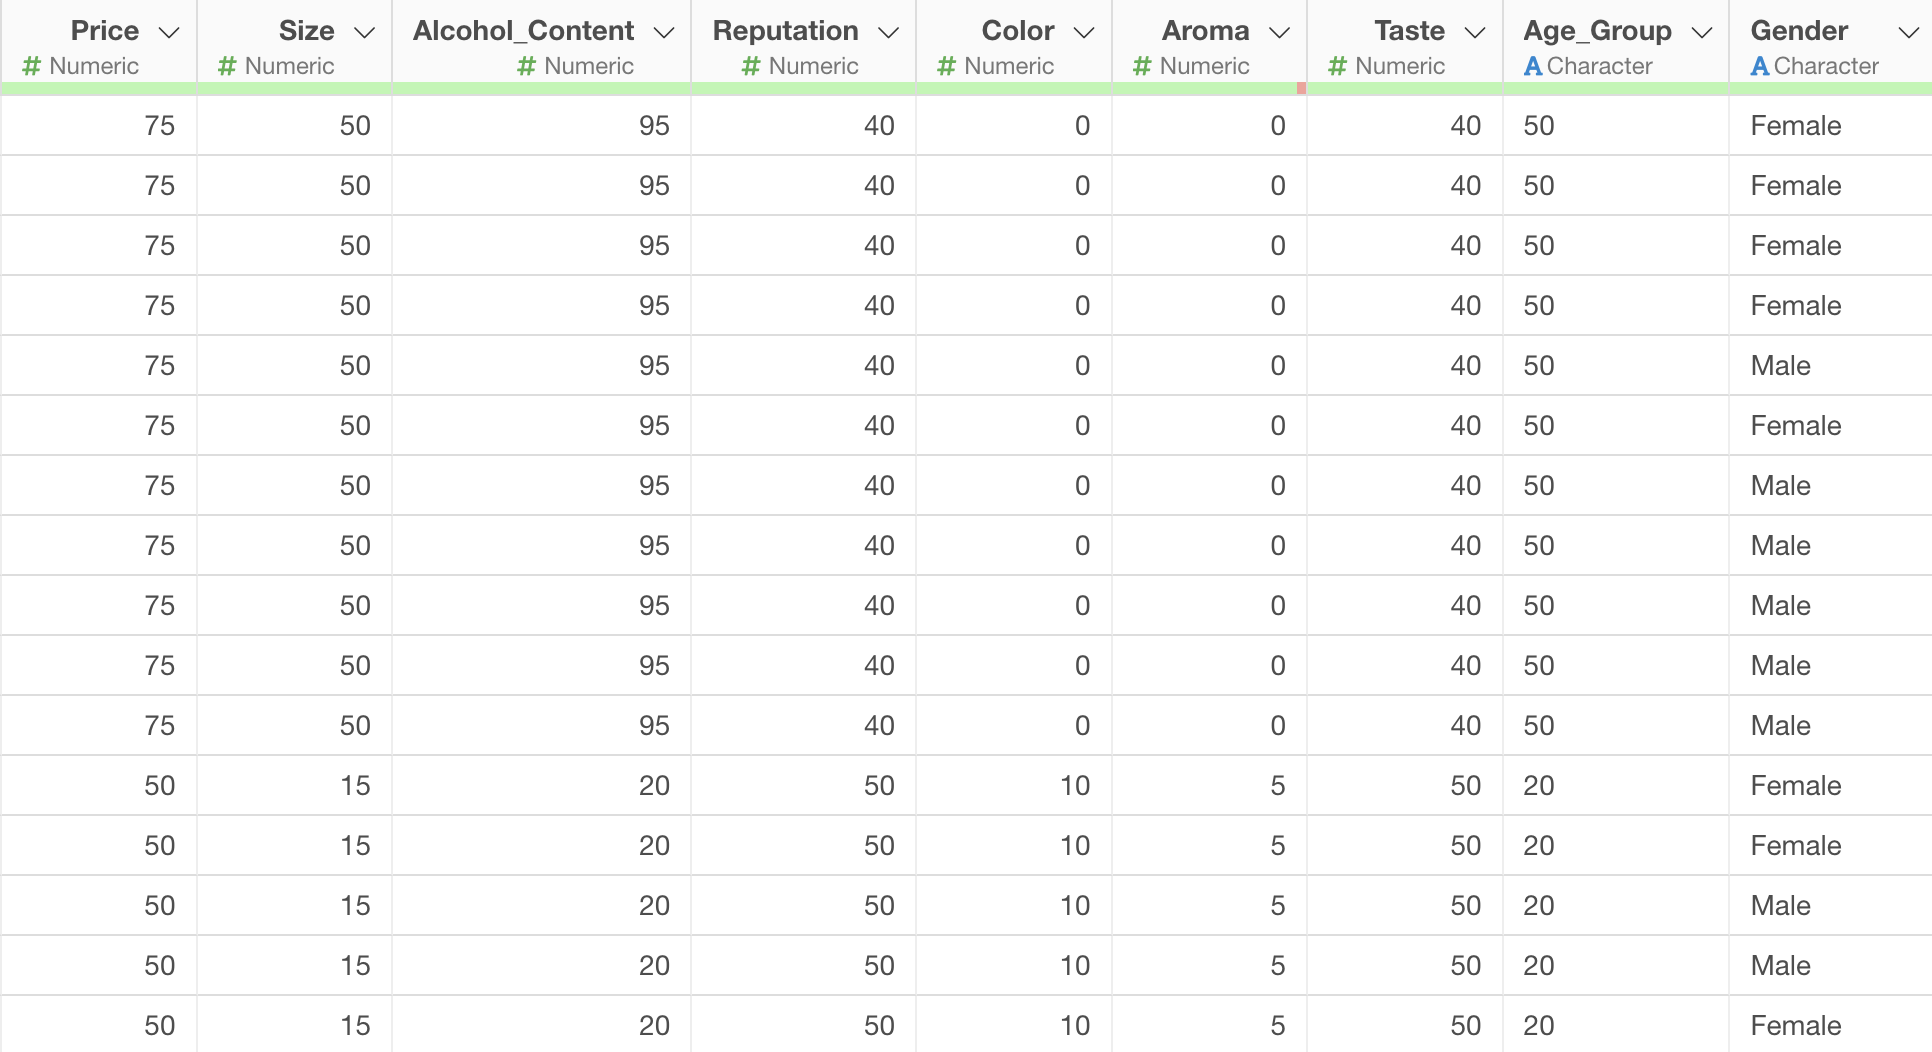
Factor analysis requires data where each row represents one observation. Also, only numeric columns can be selected as variables.
For this purpose, we will use survey data on “What people look for in beer” as sample data. In this data, each row represents one respondent, and the columns contain response scores to questions about price and size, as well as respondent attributes (age group, gender).
The question response scores are on a 100-point scale, with higher numbers indicating higher importance.
Running Factor Analysis
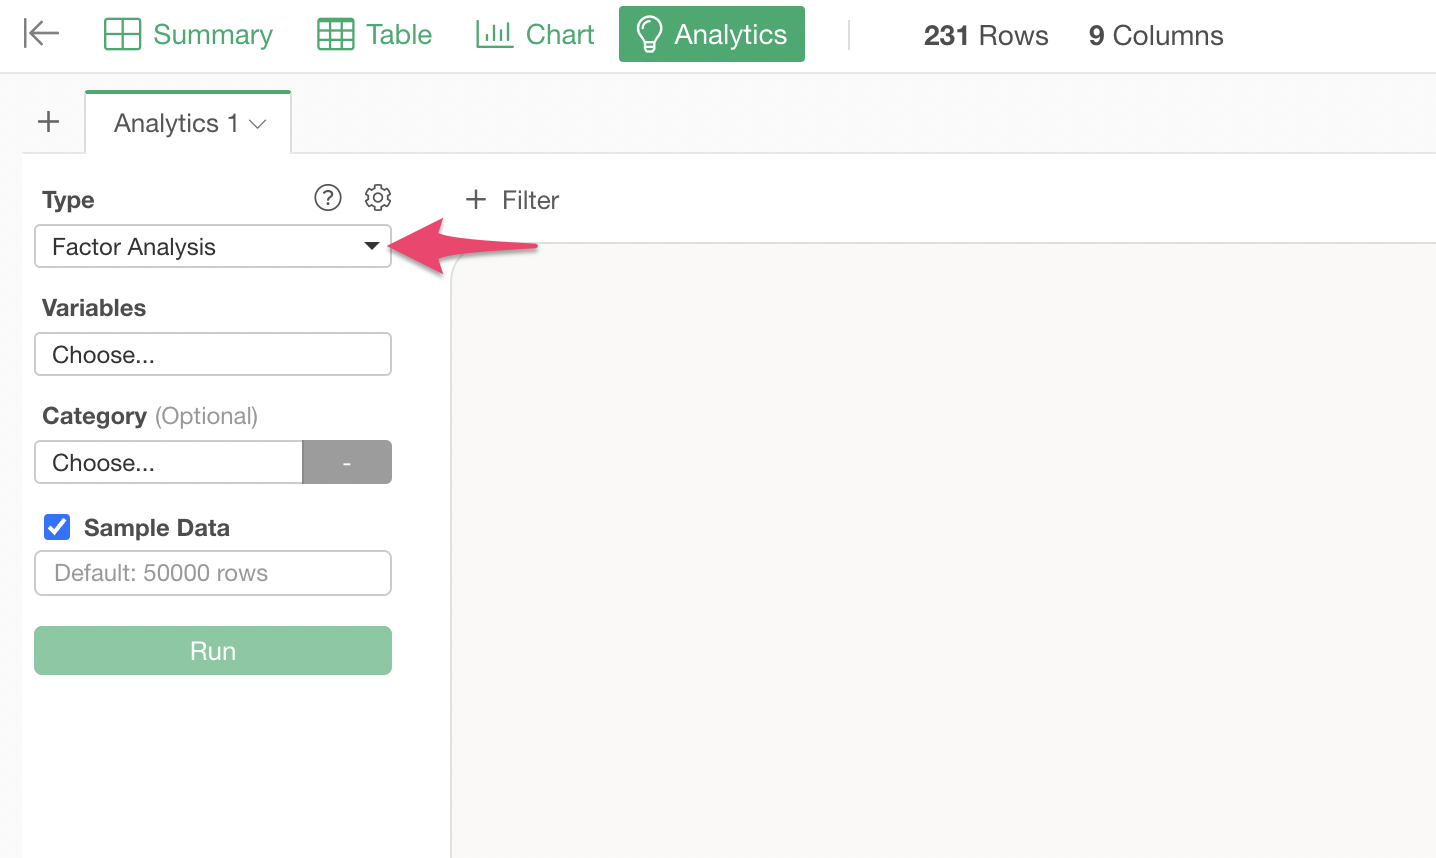
Open the Analytics view and select “Factor Analysis” as the type.
Click on “Variables” to select the columns to be used for factor analysis. You can select multiple columns at once by holding down the Shift key.
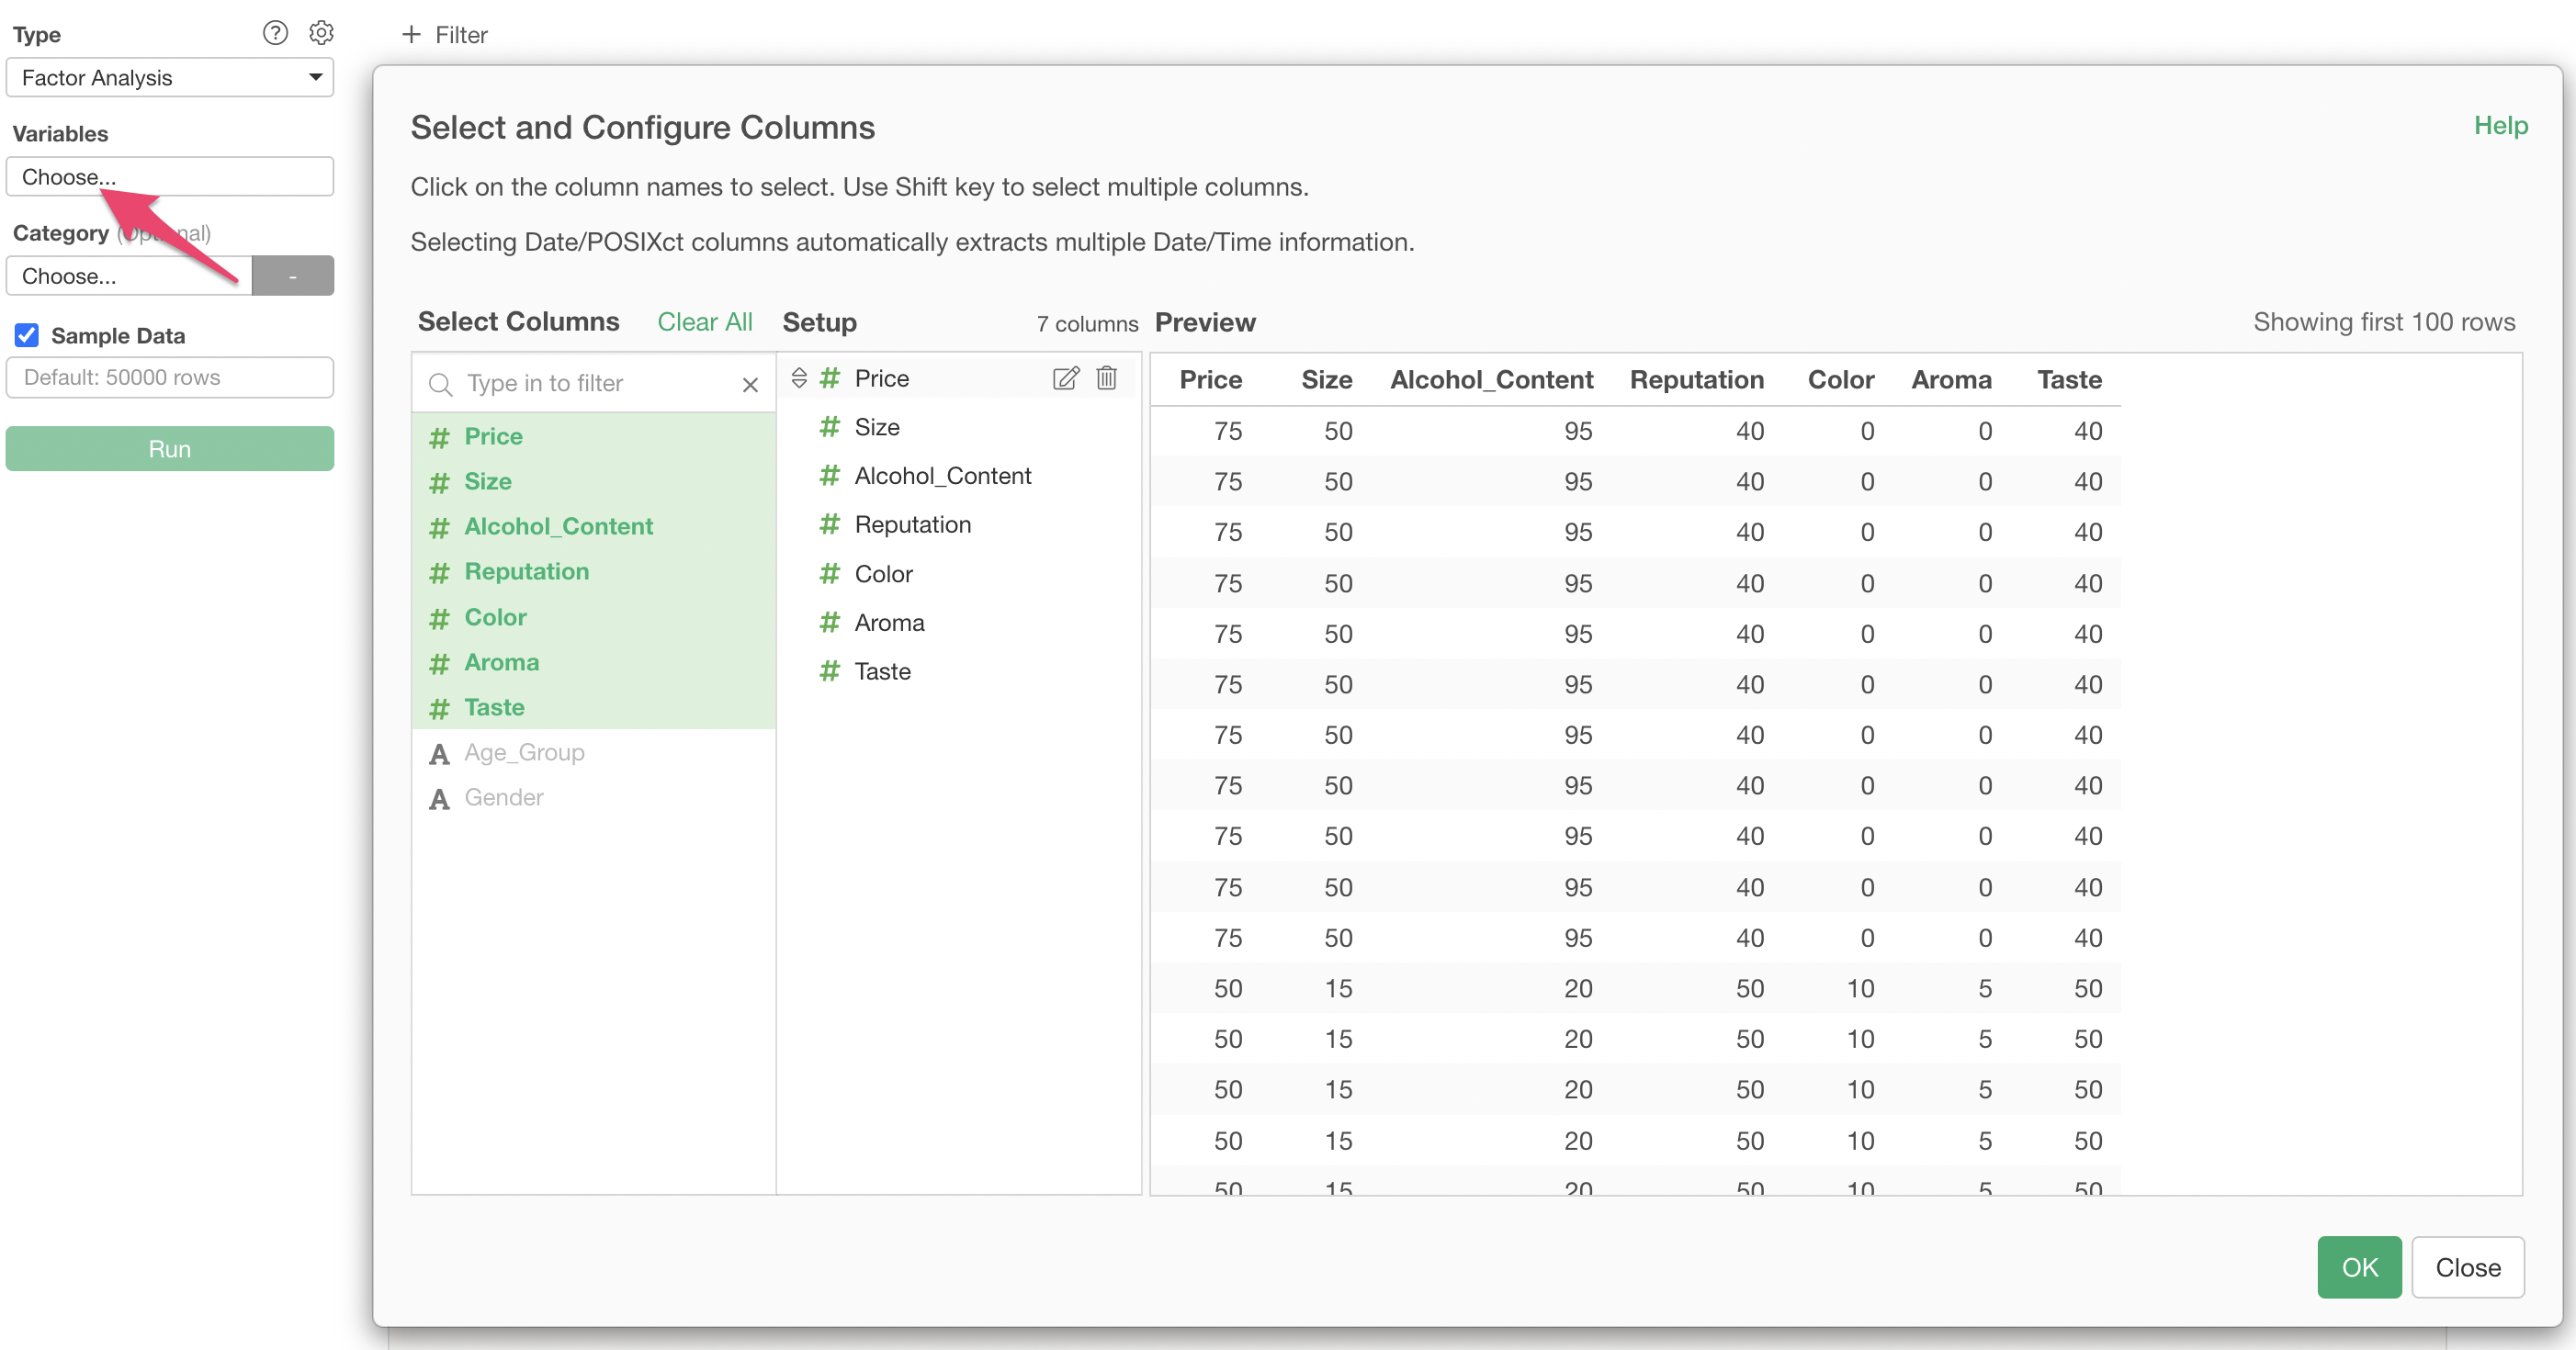
Once the columns are specified, click “Run” to display the factor analysis results.
Interpreting the Results
Relationship between Factors and Variables
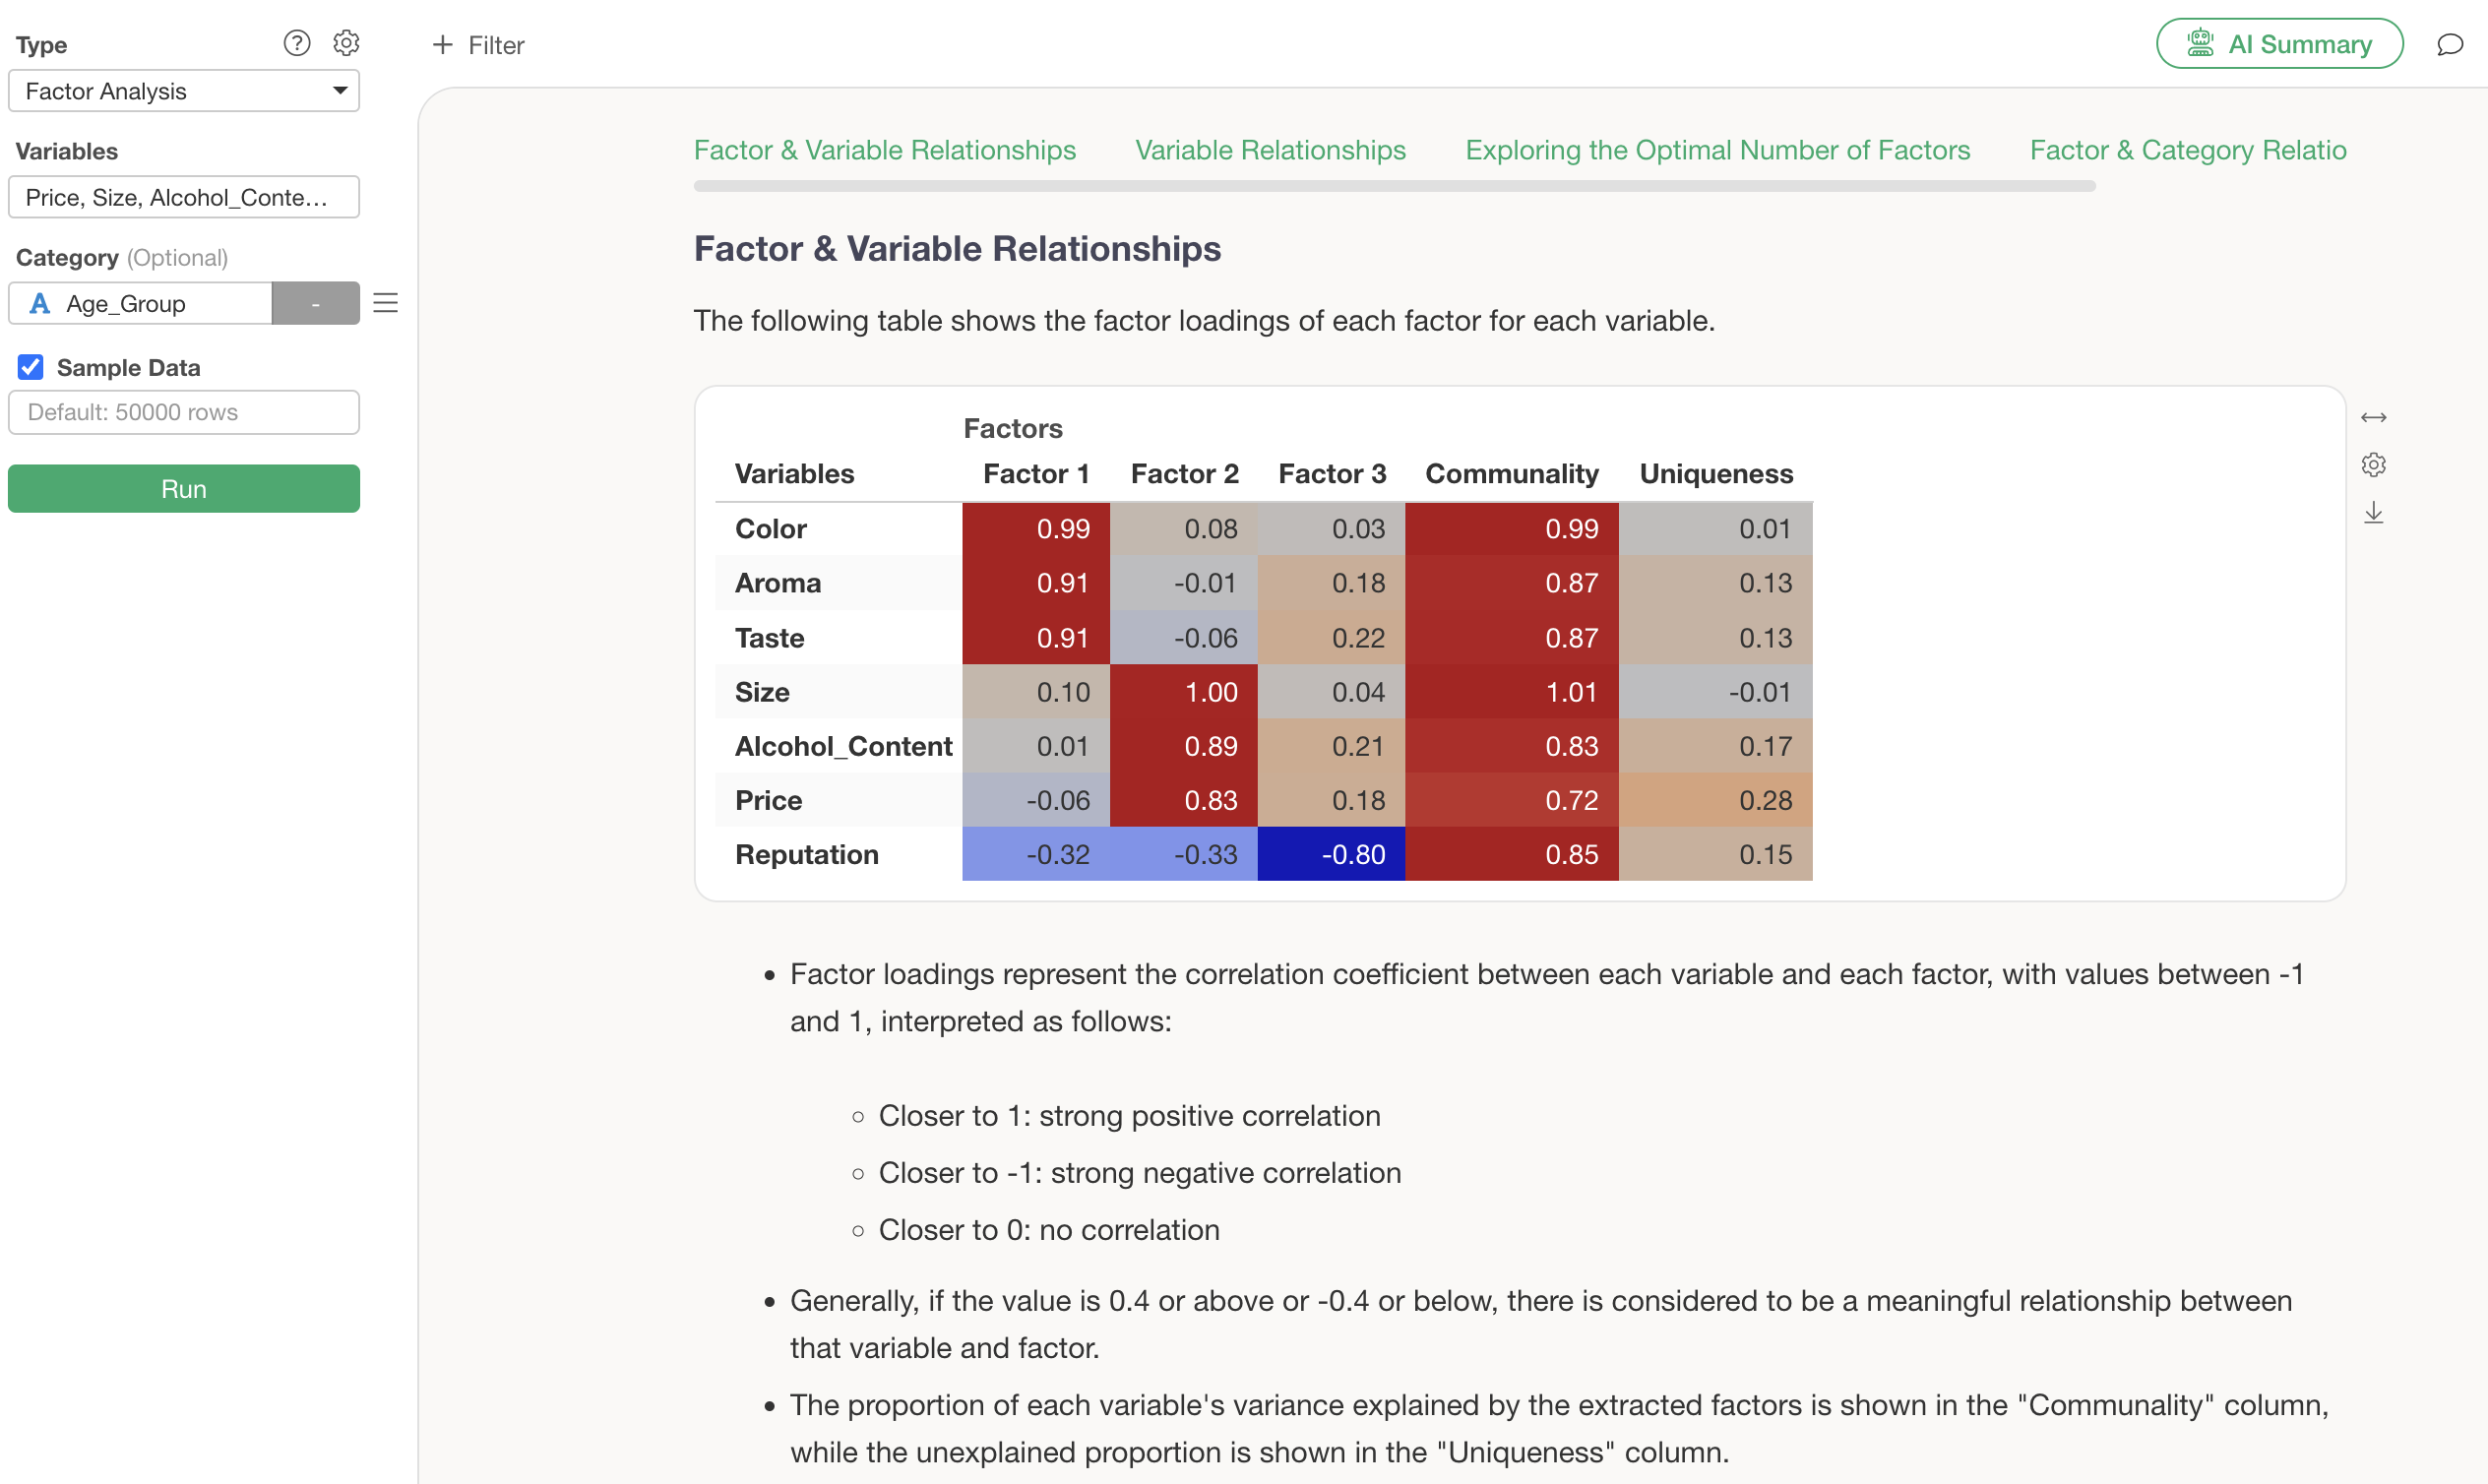
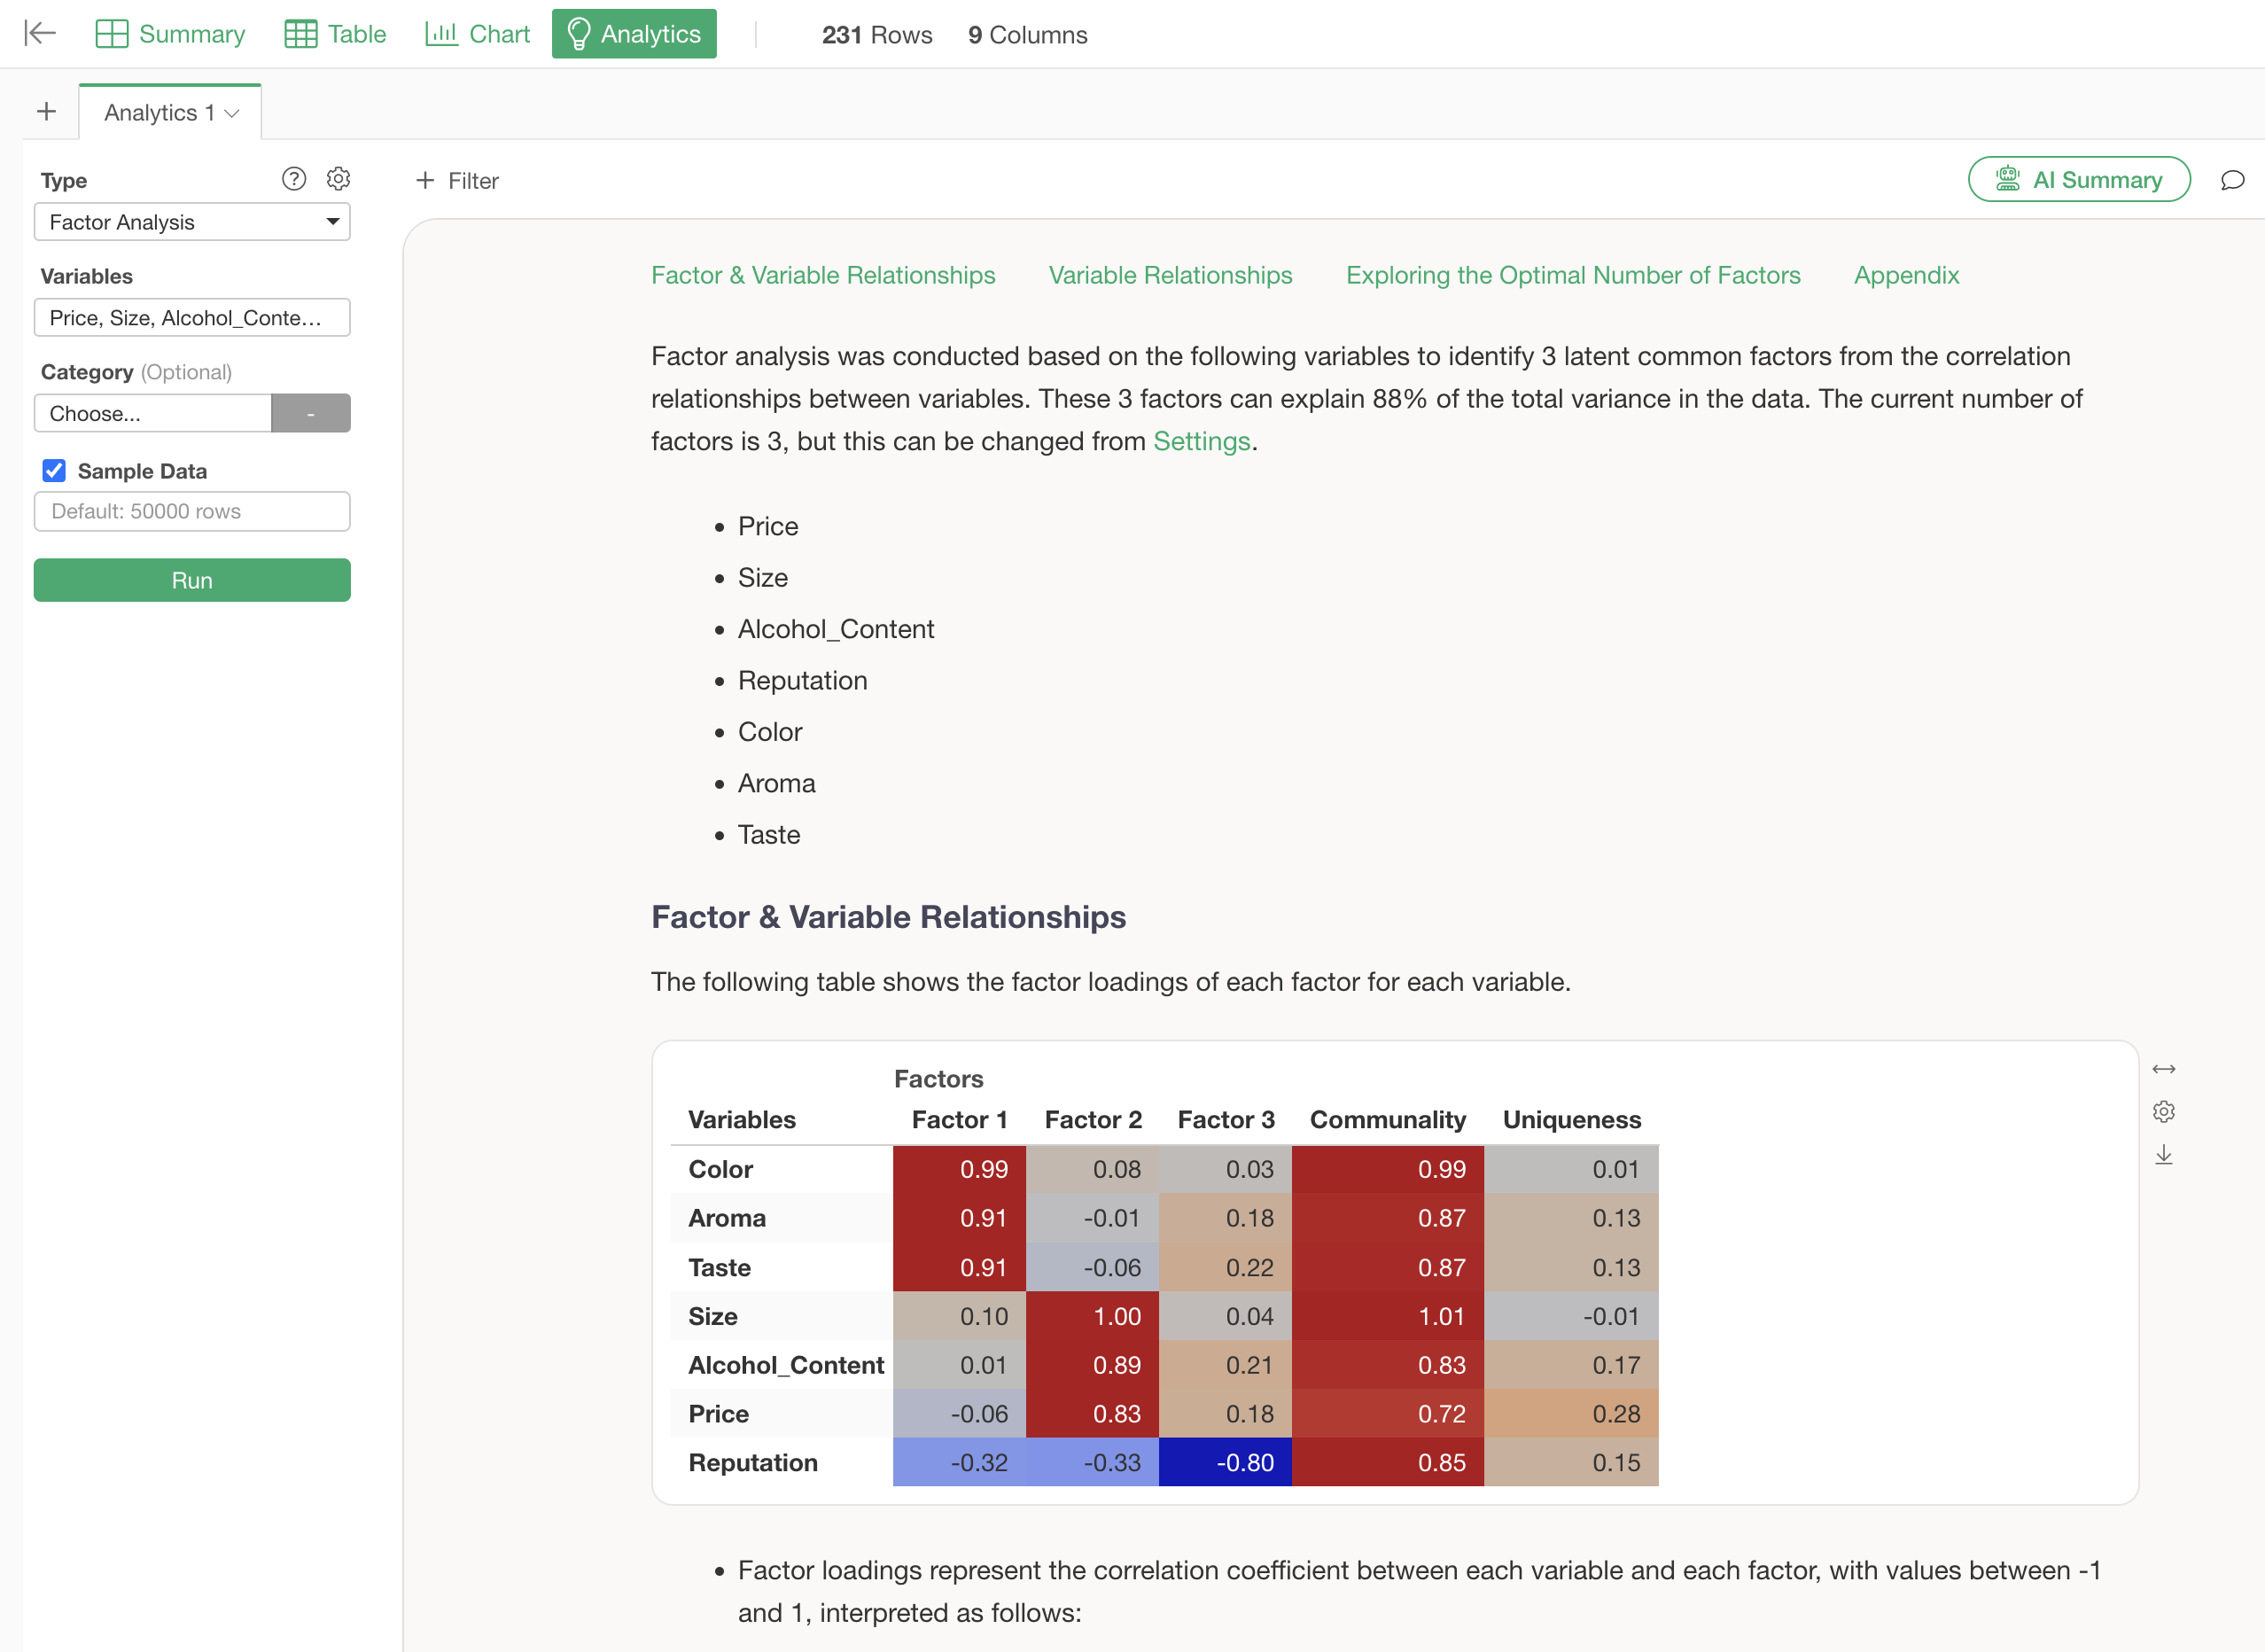
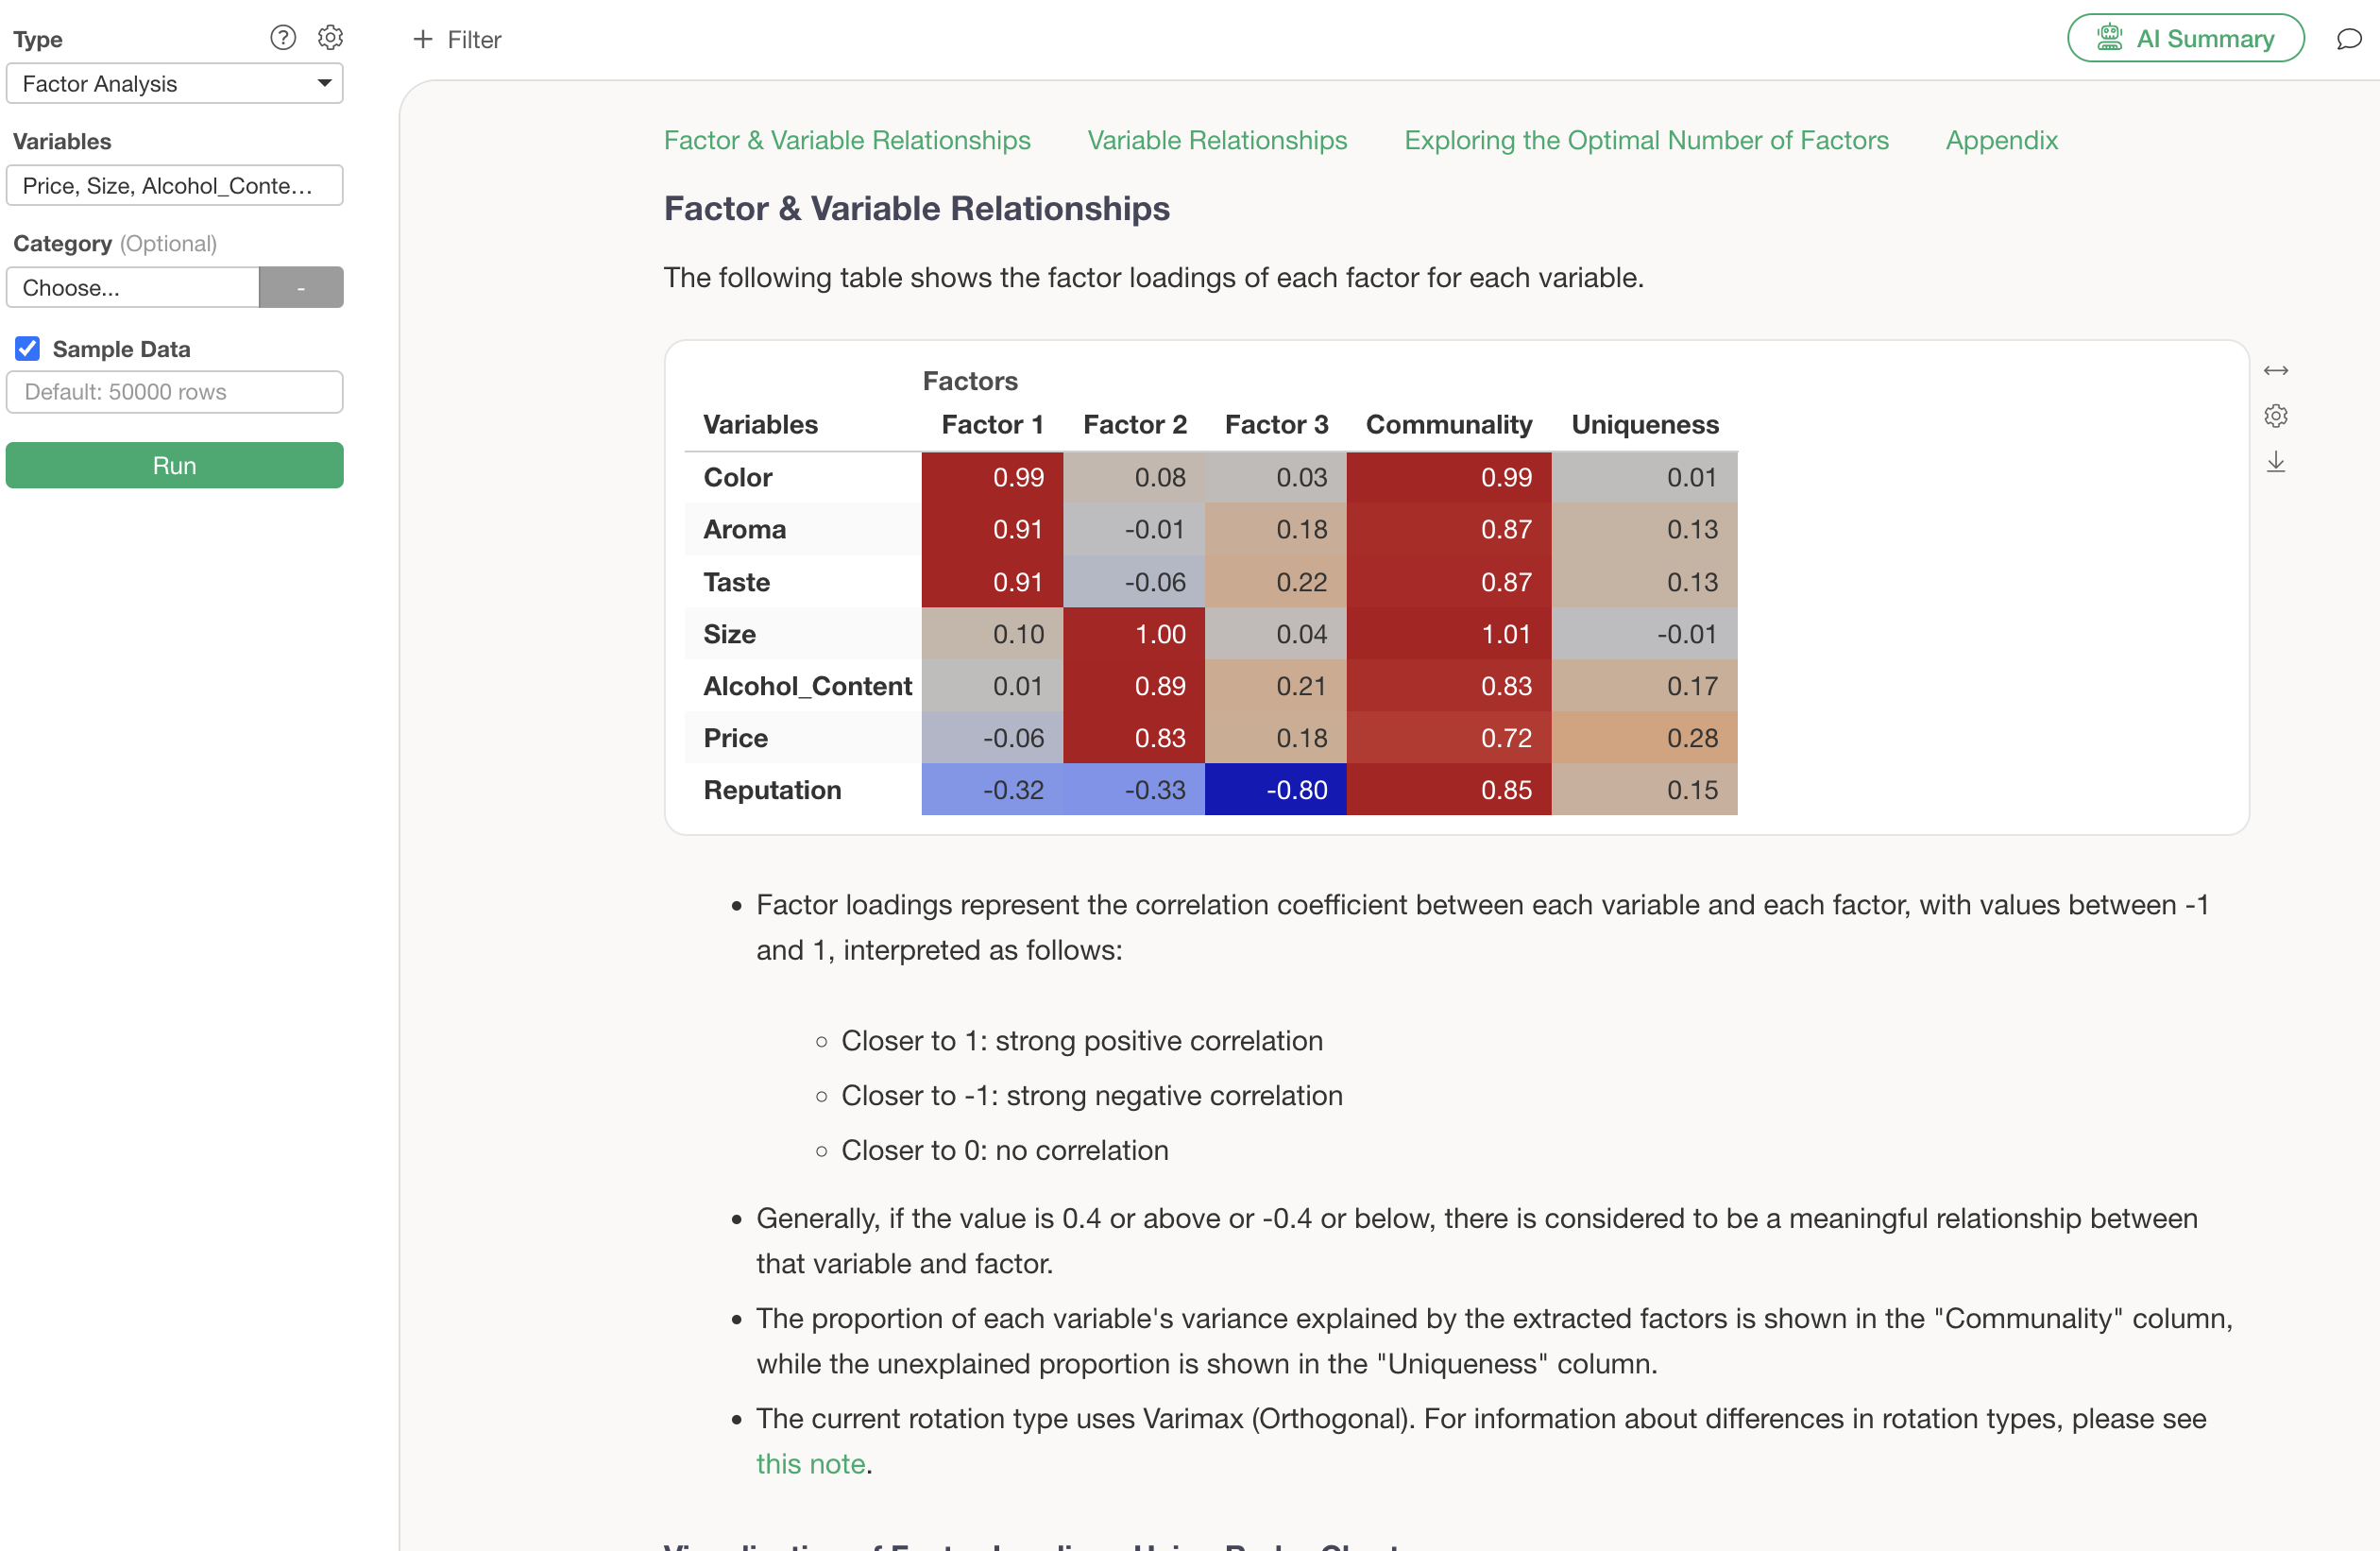
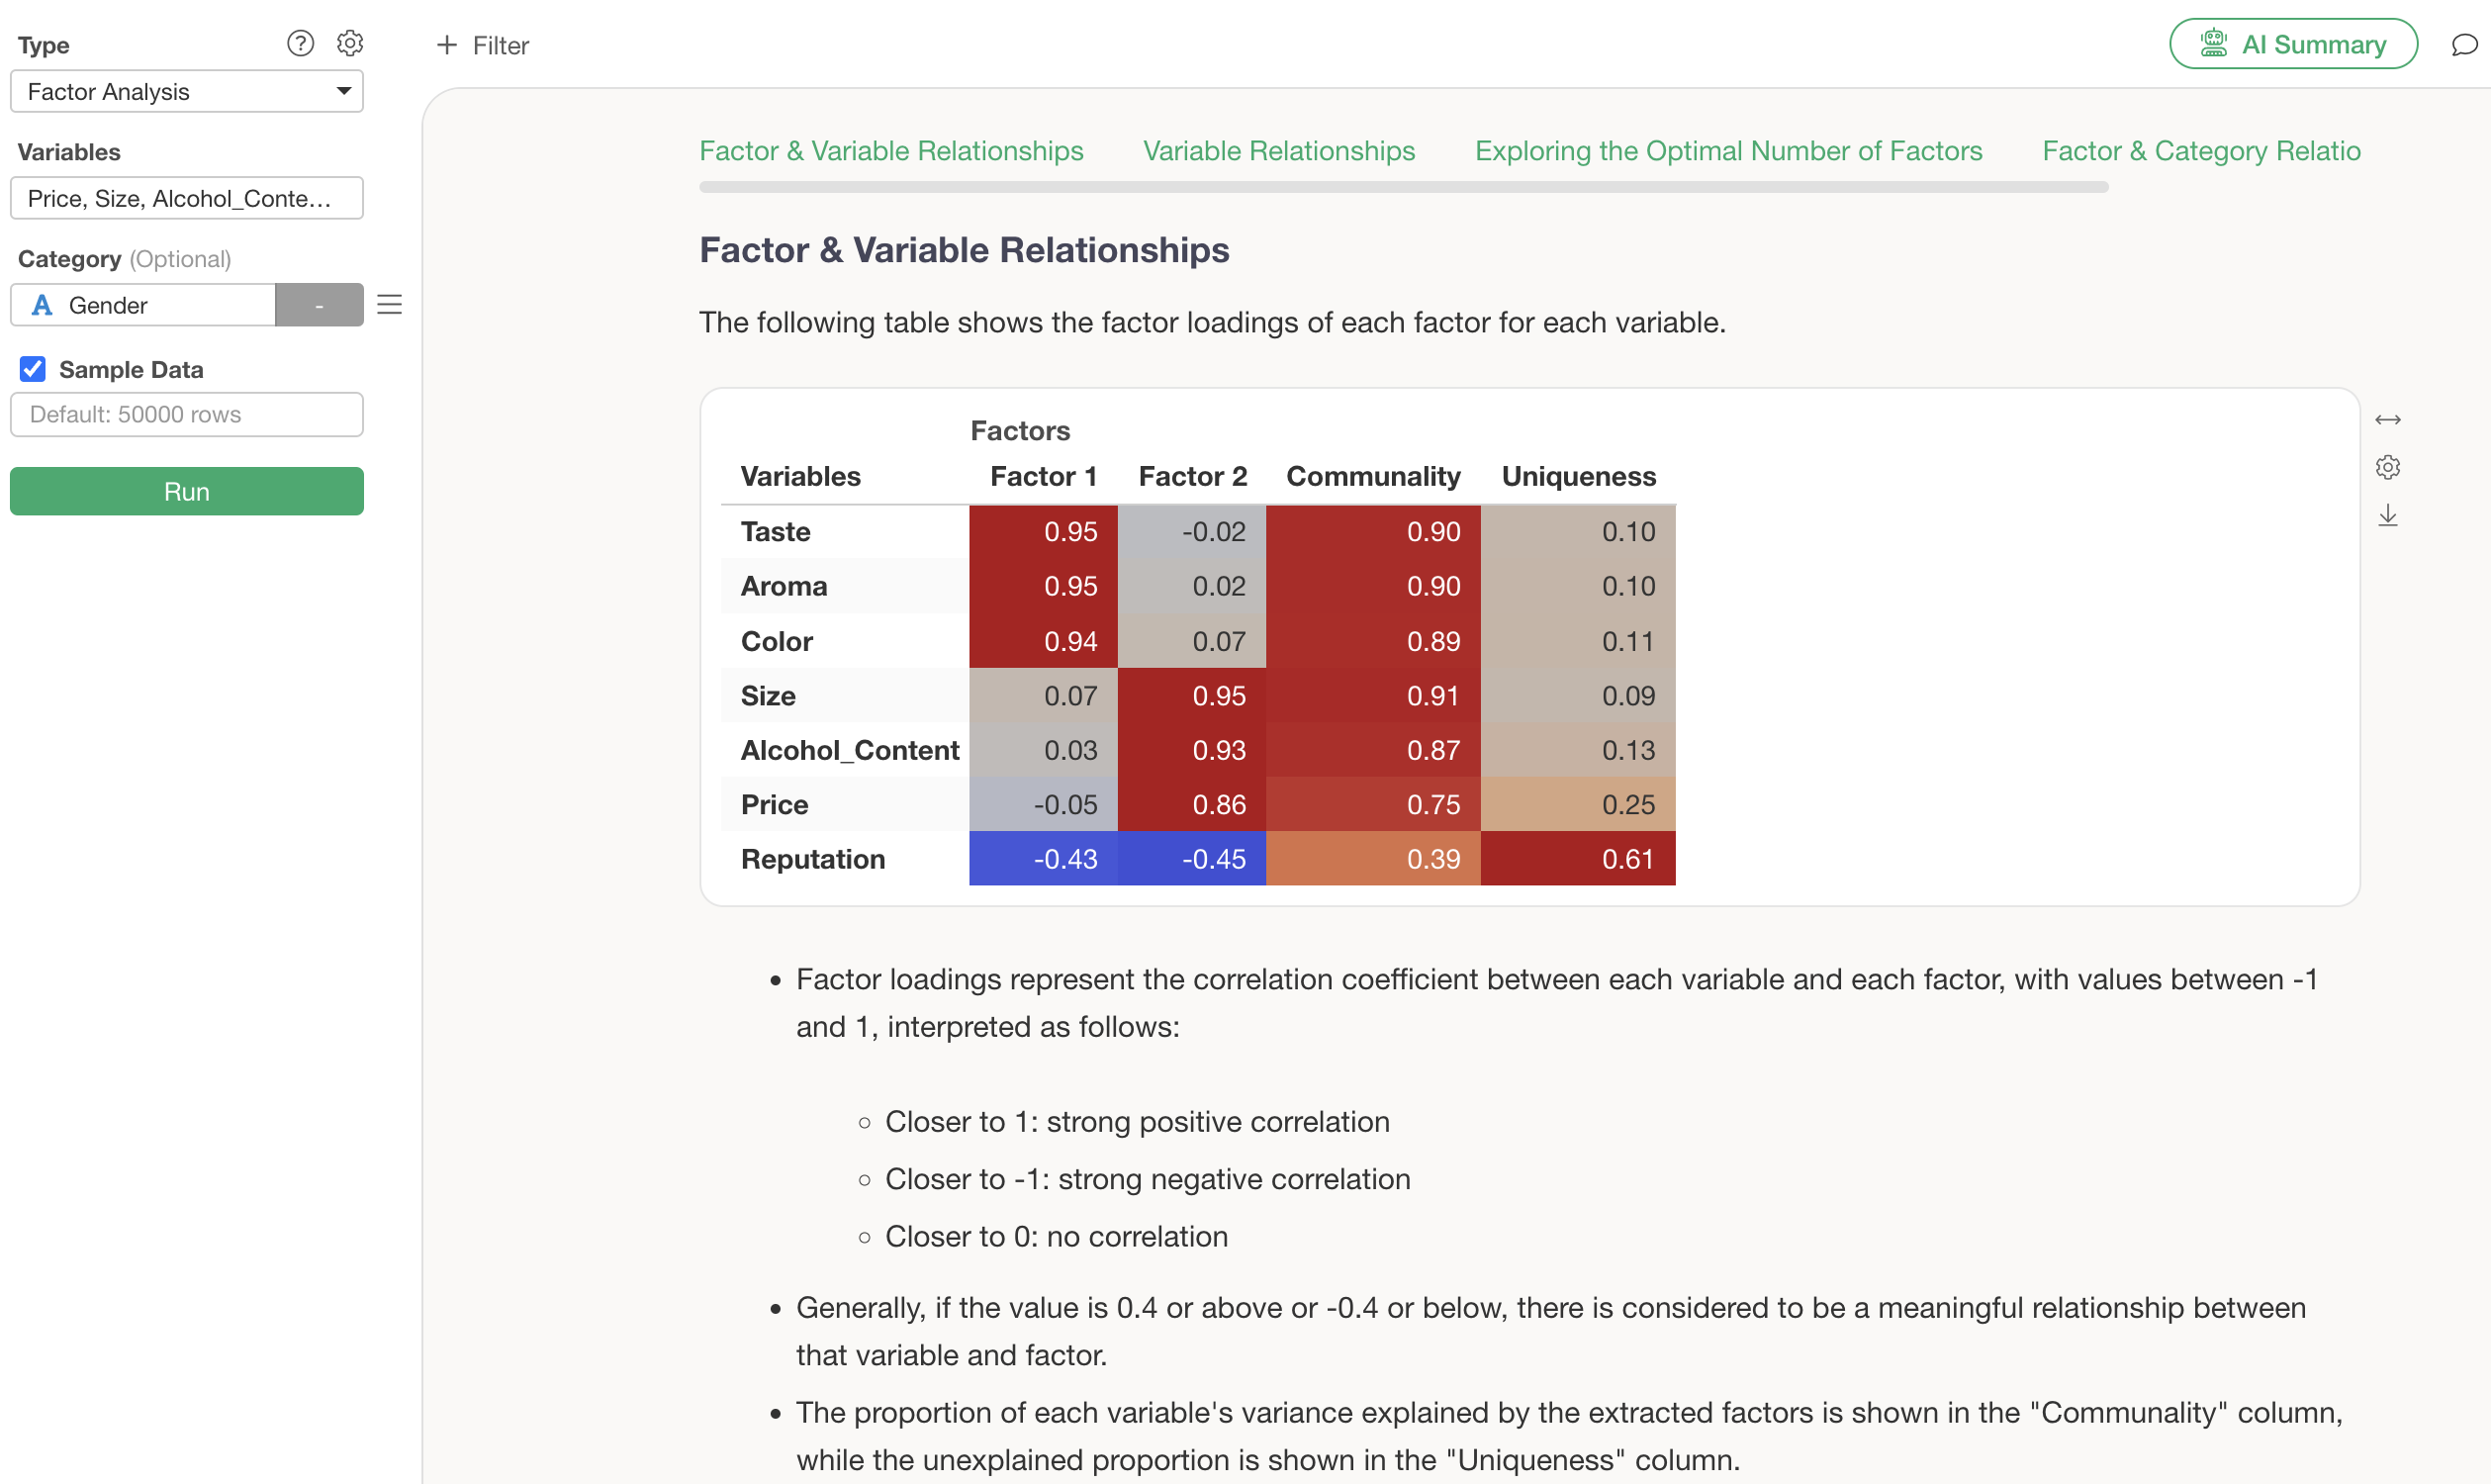
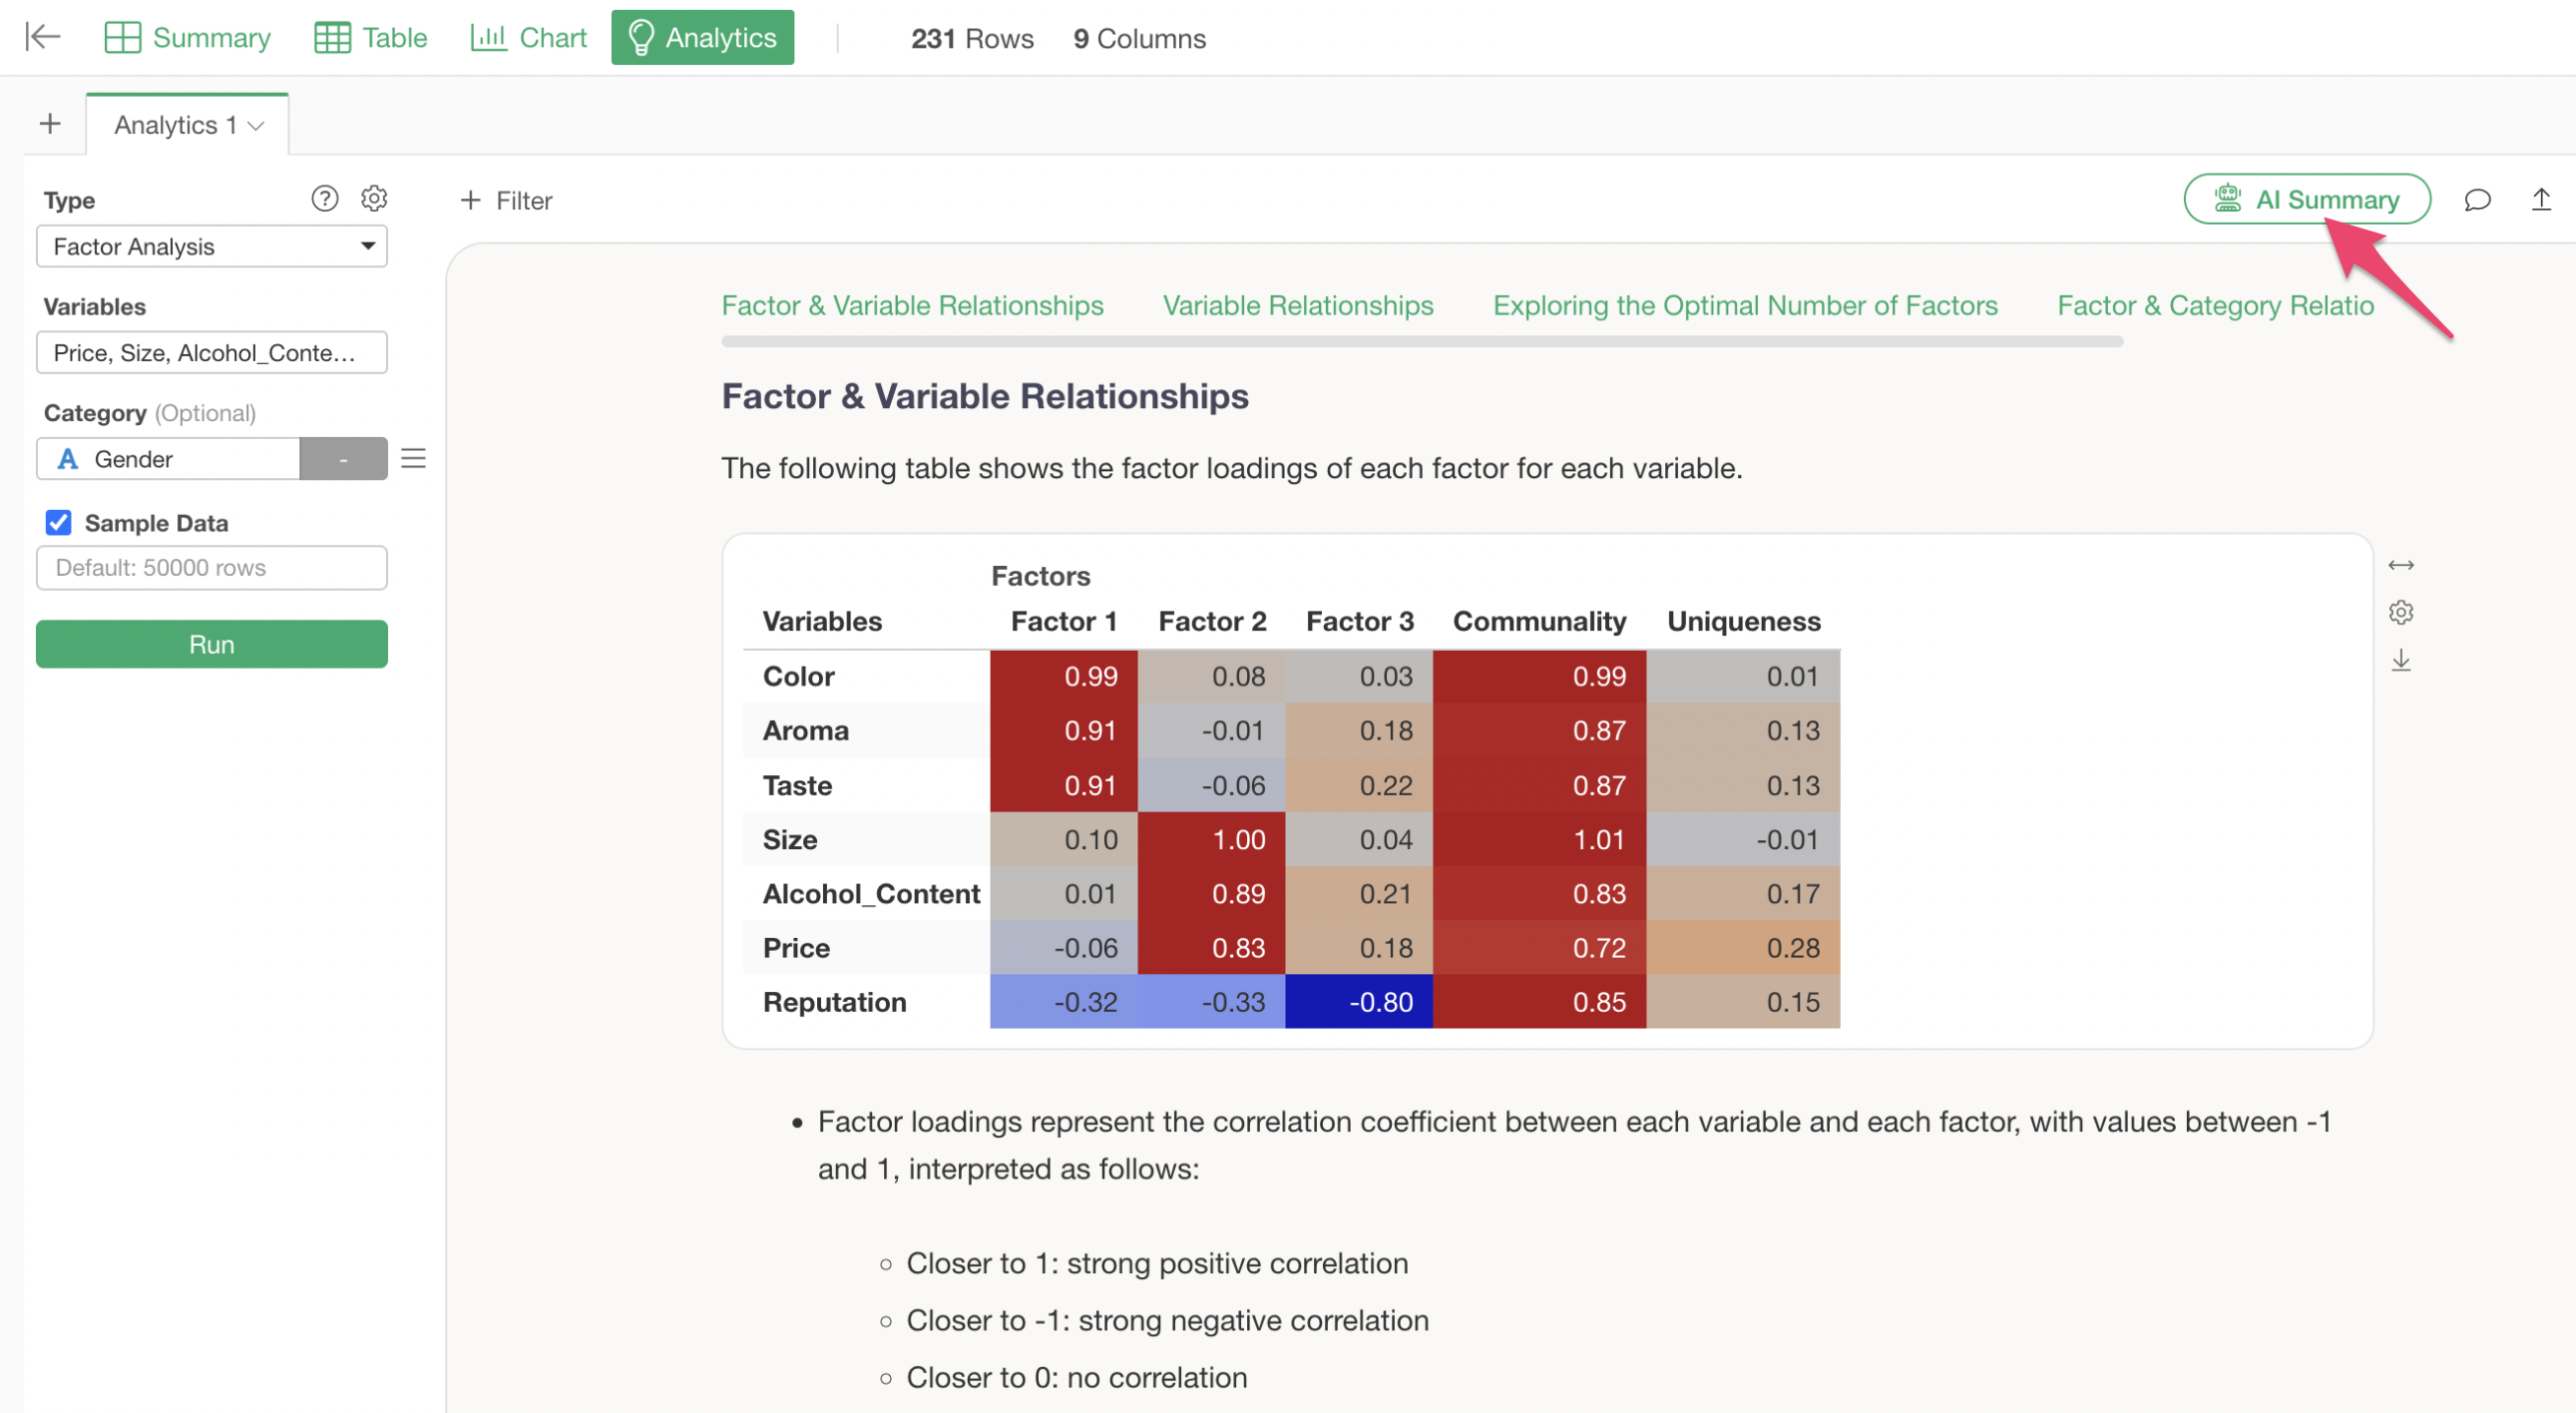
Under the “Relationship between Factors and Variables” section, a table showing the factor loadings (the strength of the factor’s influence on each variable) for each variable per factor is displayed. Factor loadings range from -1 to 1, and values closer to -1 or 1 indicate a stronger influence of each factor on its respective variable.
For example, since the factor loading values for “Color,” “Aroma,” and “Taste” are high, Factor 1 can be identified as “Quality.” For Factor 2, since the factor loadings for “Size,” “Alcohol Content,” and “Price” are high, Factor 2 can be identified as “Cost Performance.”
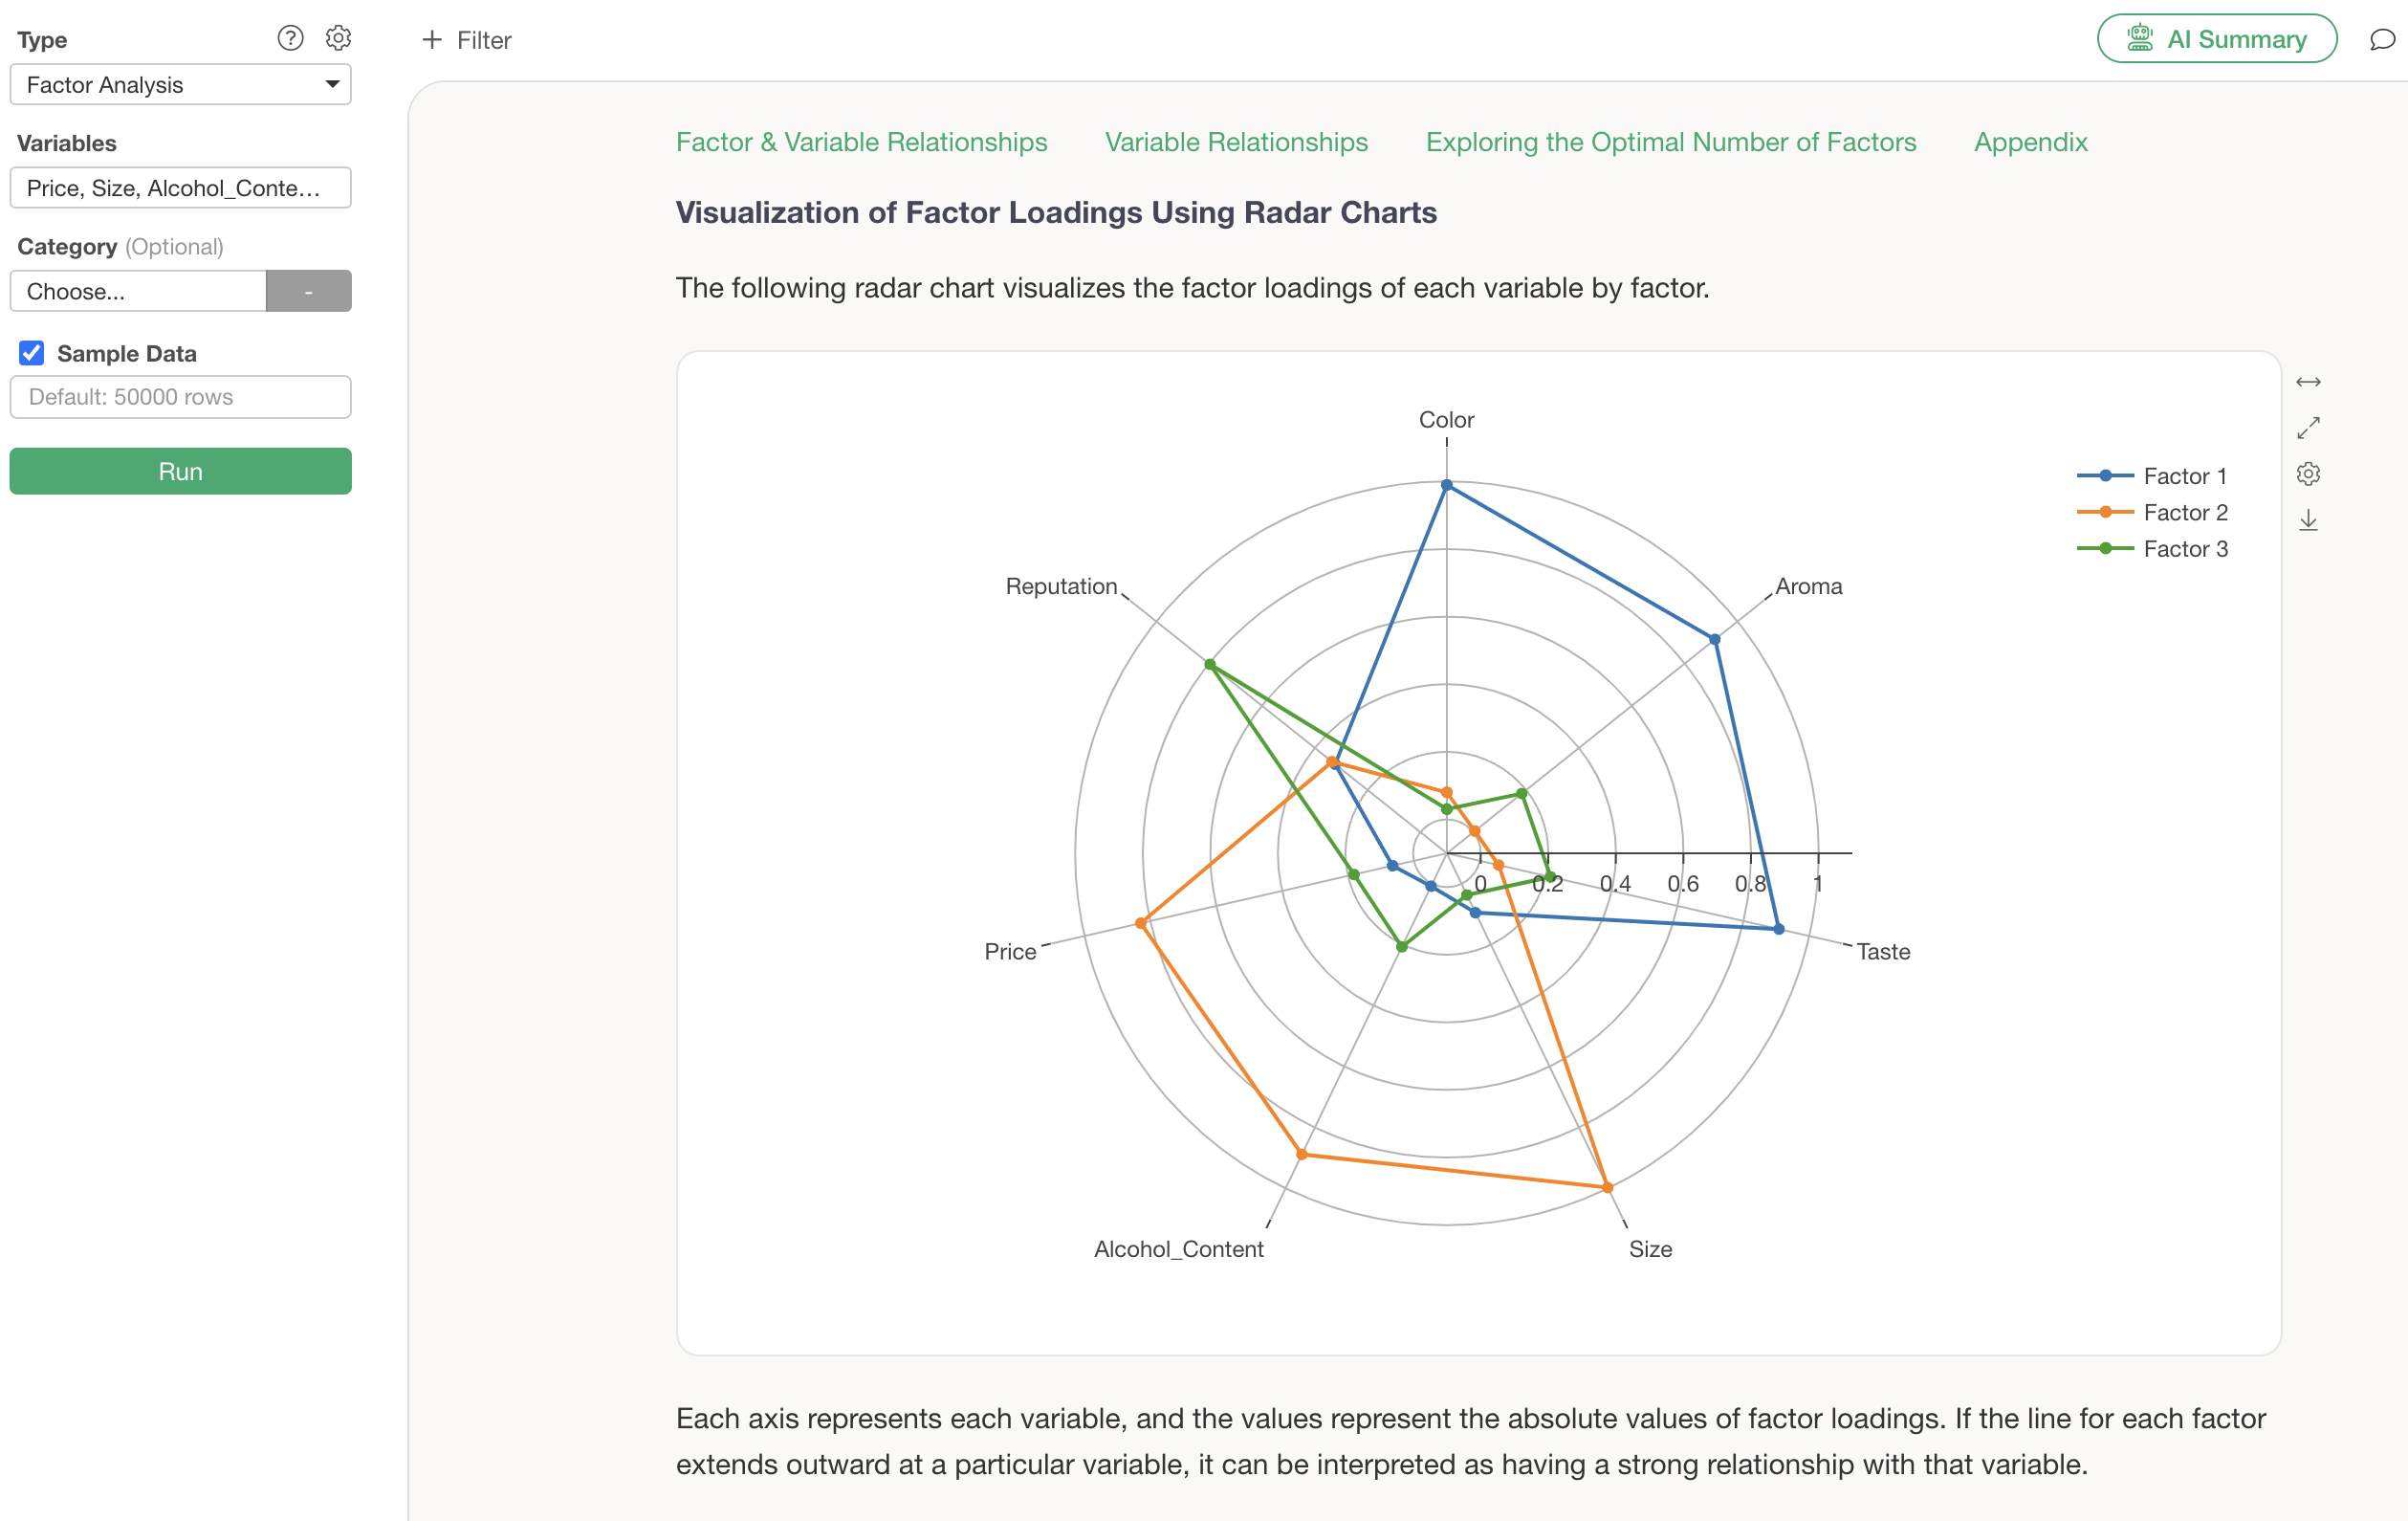
Similar results can be confirmed by visualizing factor loadings using a radar chart. Note that the factor loadings displayed in the radar chart are absolute values of the factor loadings.
Relationship between Variables
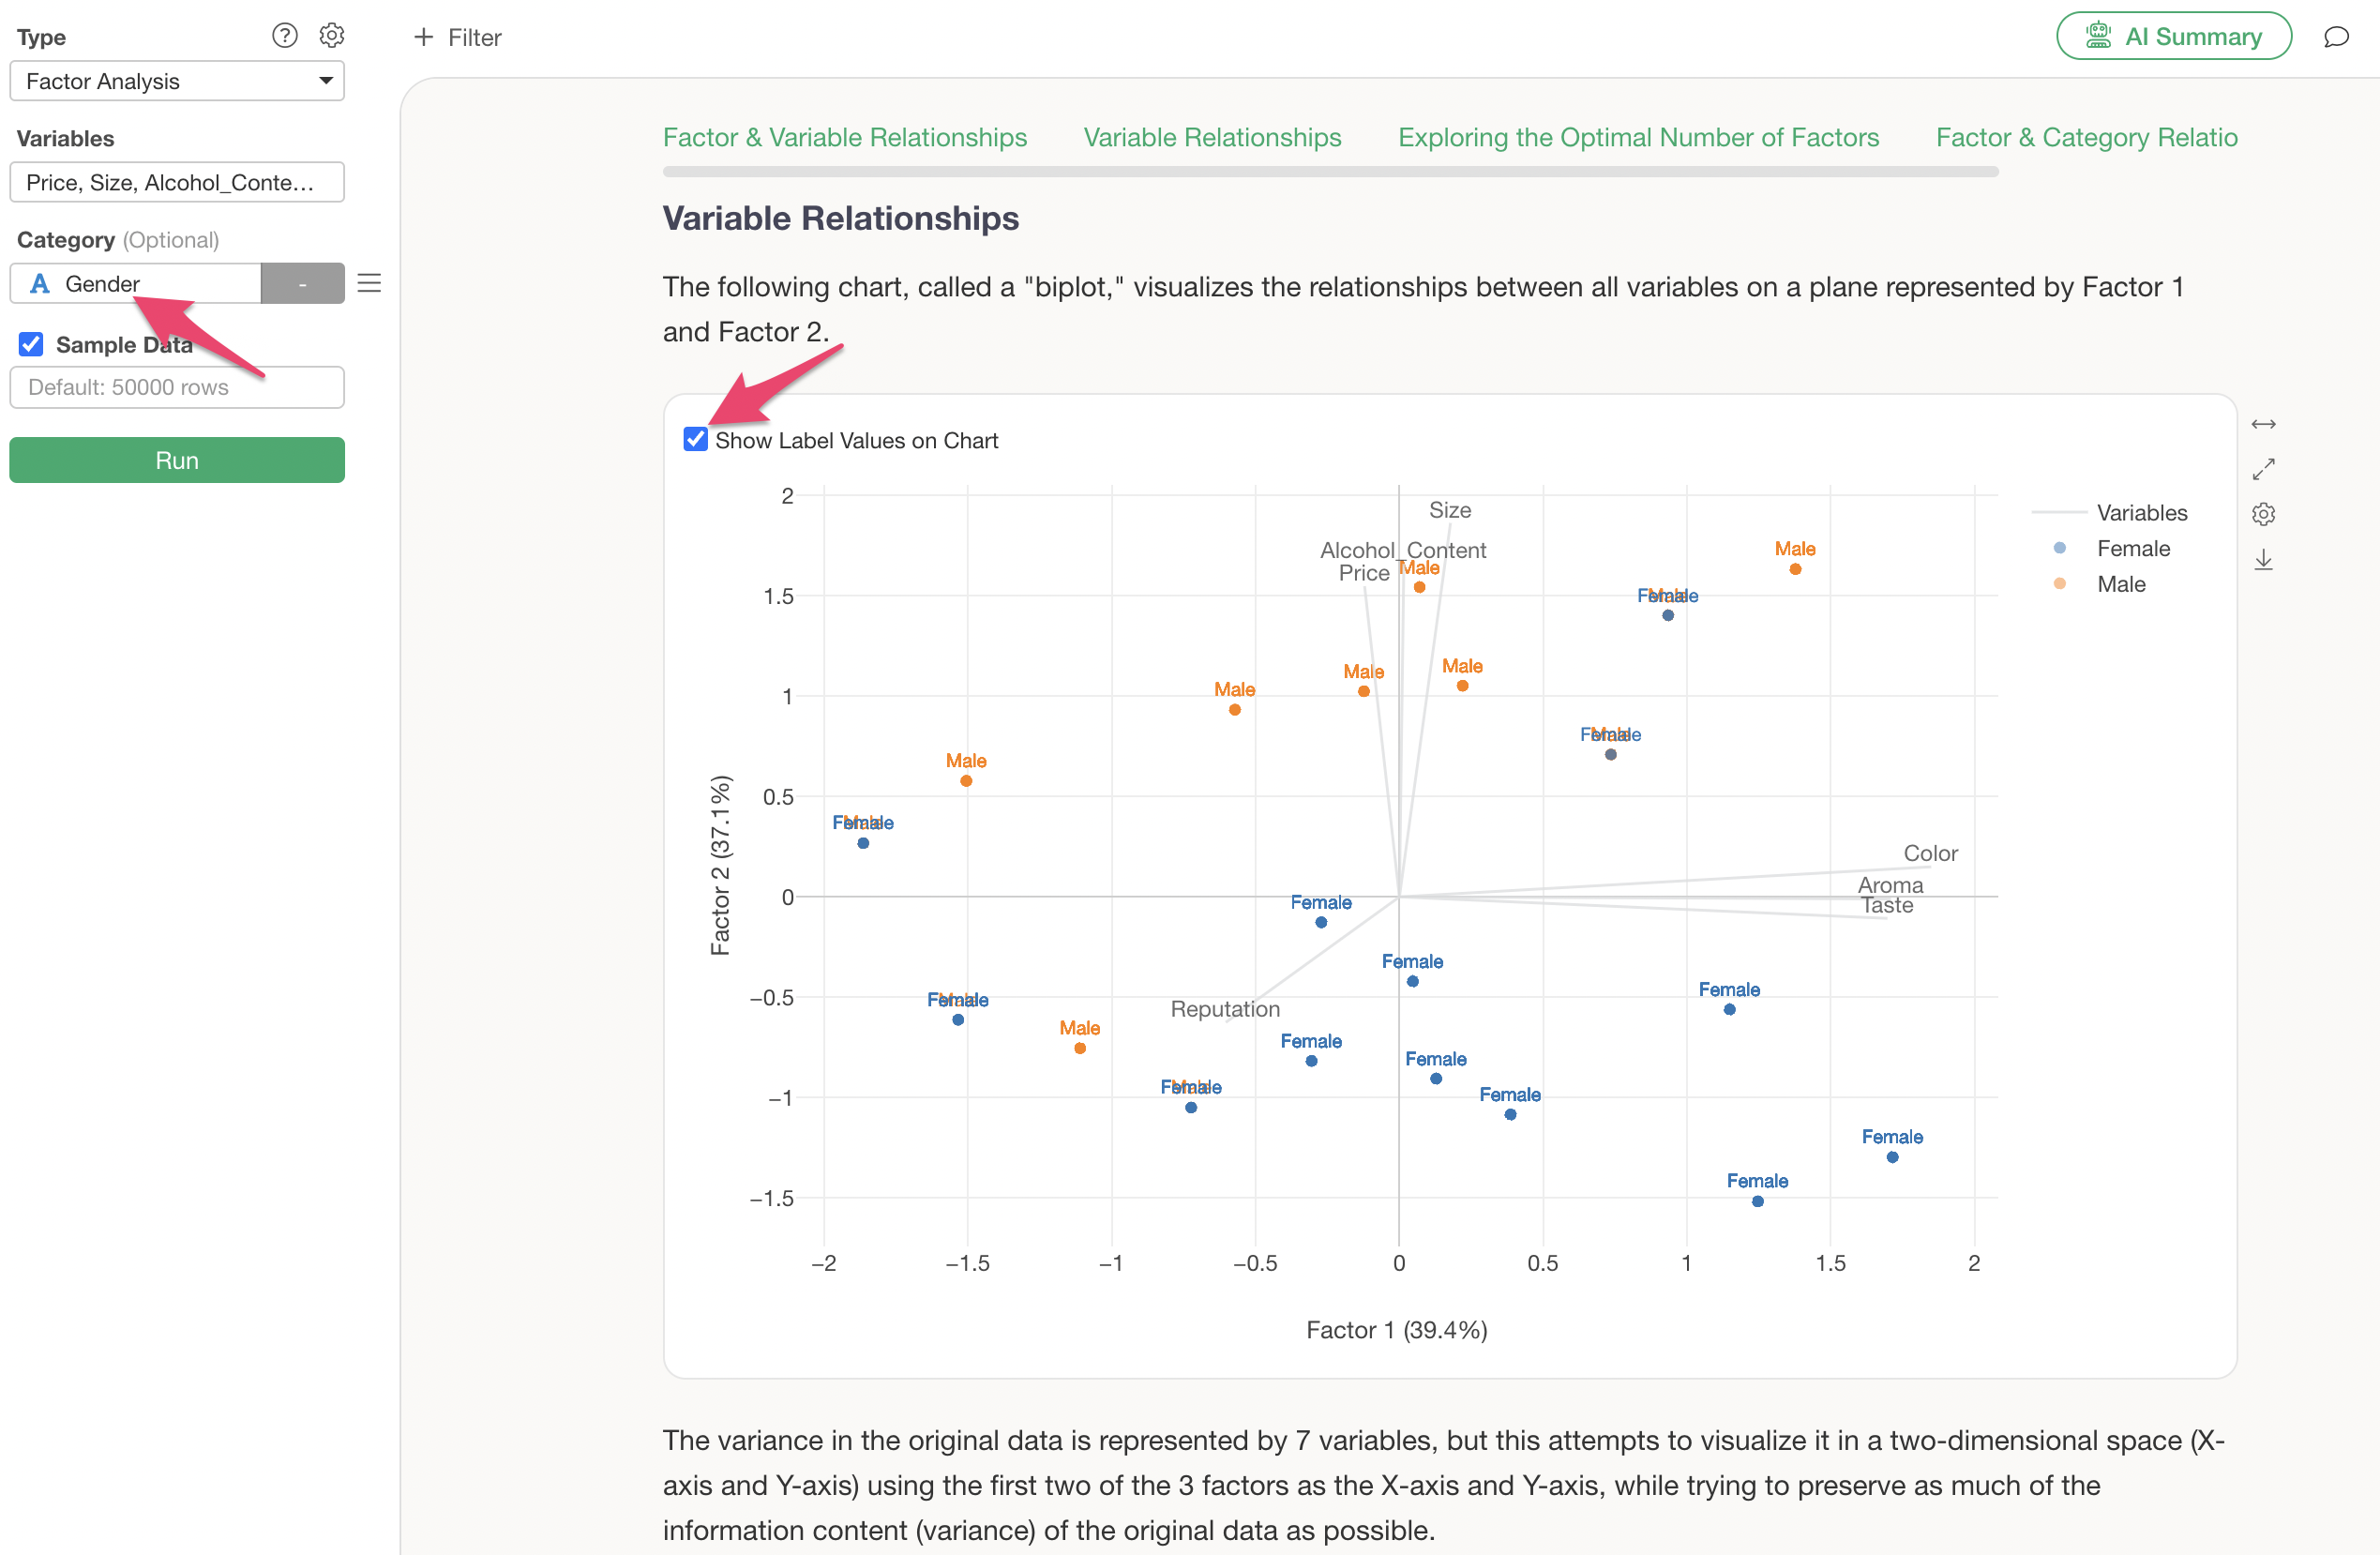
In the “Relationship between Variables” section, a biplot chart visualizes the relationships between the original variables based on the first two factors (Factor 1 and Factor 2).
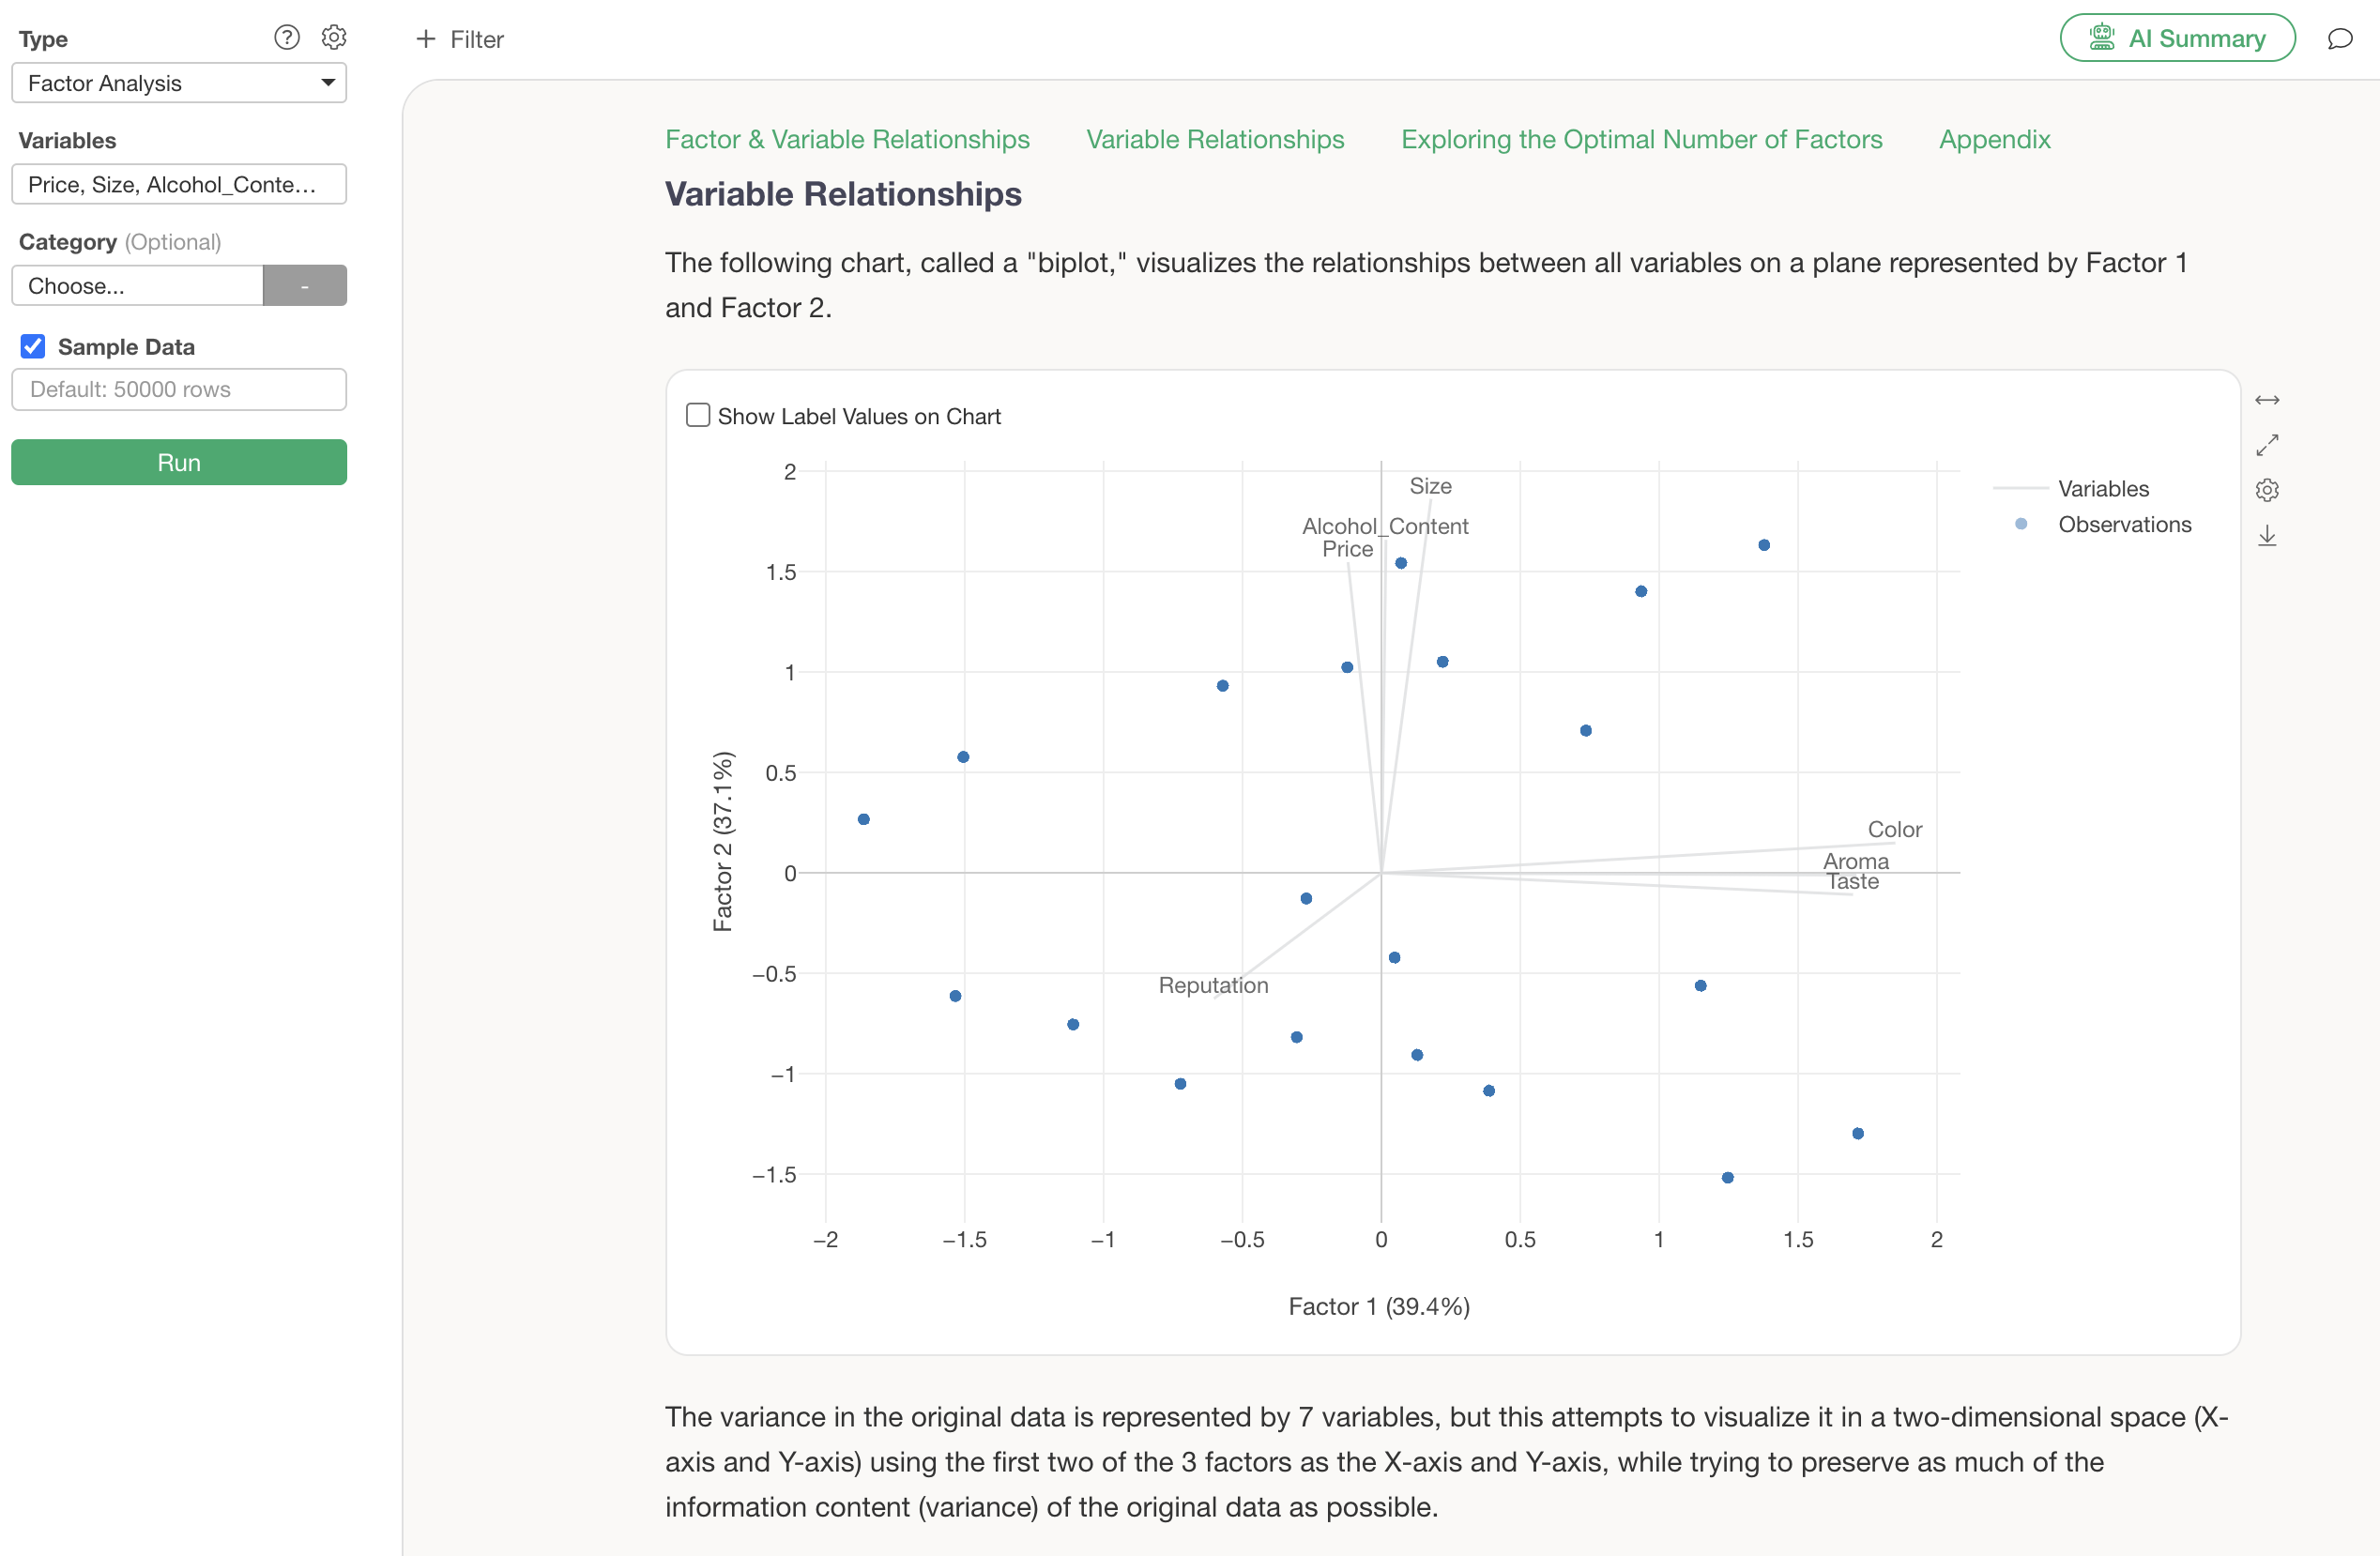
Lines represent individual variables, and points represent one row of data (e.g., one respondent). If the lines of variables point in the same direction, they can be considered strongly correlated variables.
Furthermore, if you assign a column to “Category” and check “Show Label Values on Chart” before running factor analysis, label information will be displayed on the biplot.
Exploring the Optimal Number of Factors
The “Exploring the Optimal Number of Factors” section visualizes the variance of errors (eigenvalues) as the number of factors increases, typically using a scree plot.
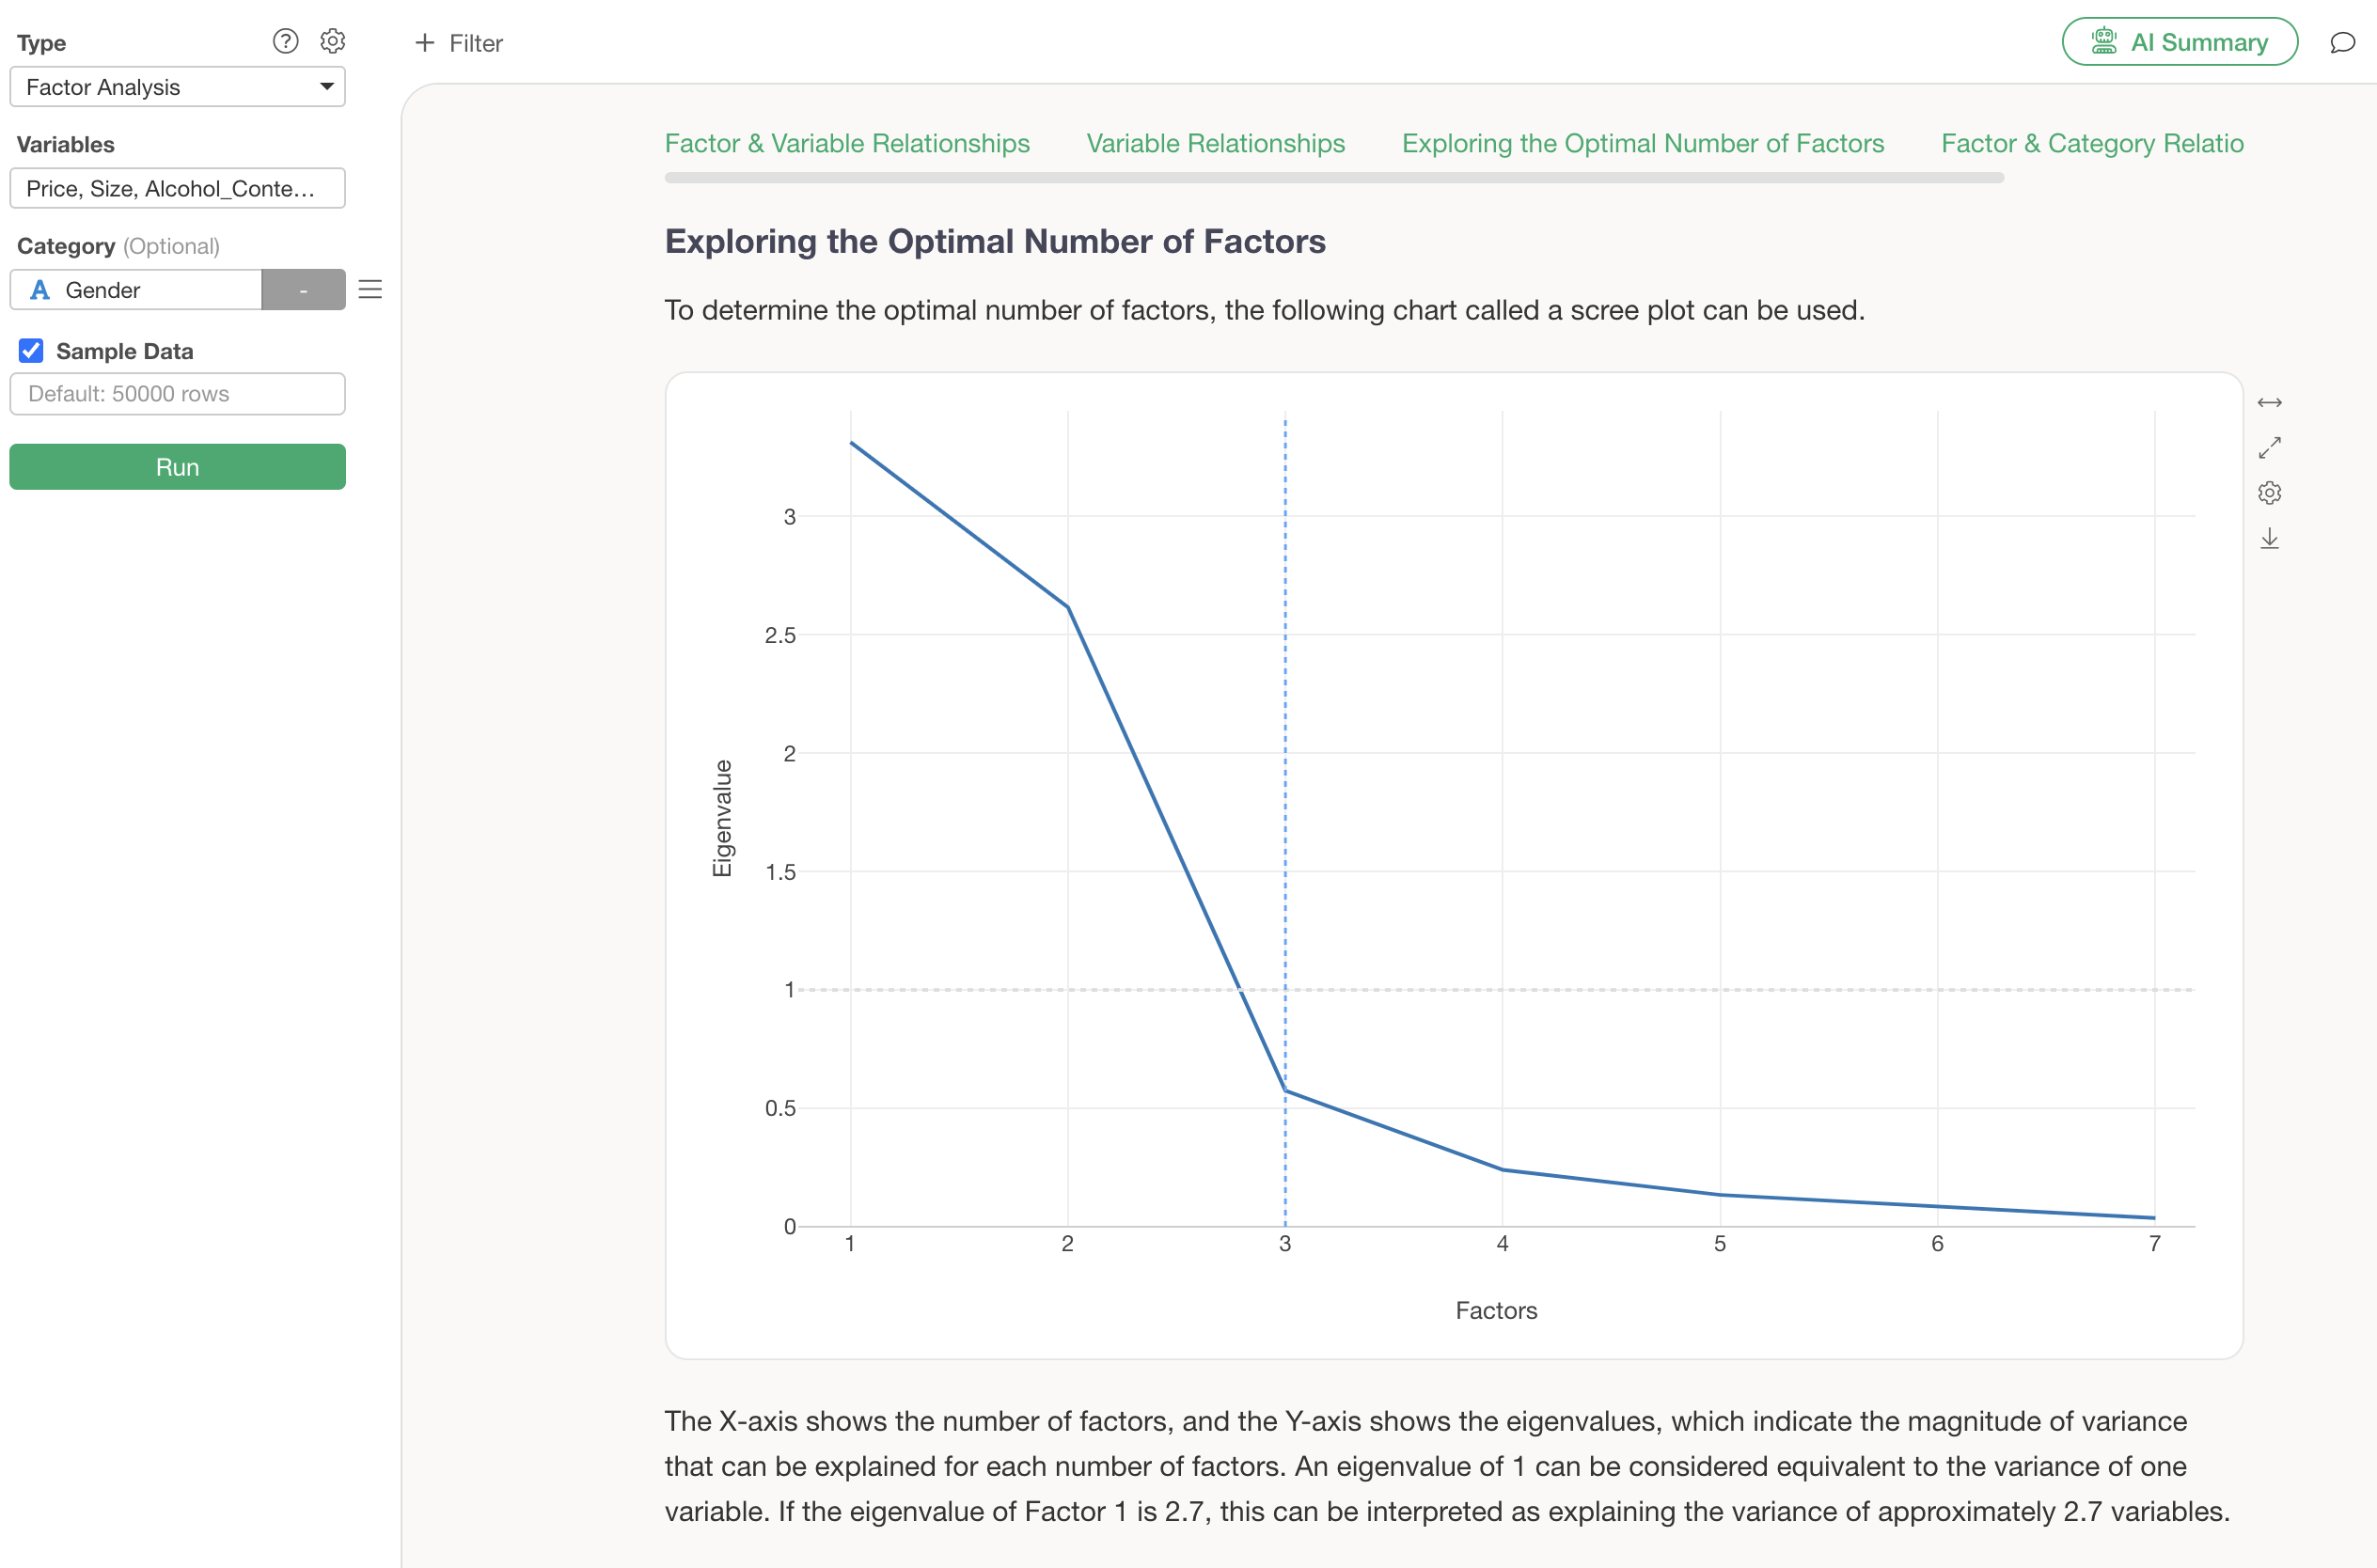
A detailed guide for identifying this optimal number of factors is also provided within the guide.
You can change the number of factors using the optimal number of factors explored in the scree plot.
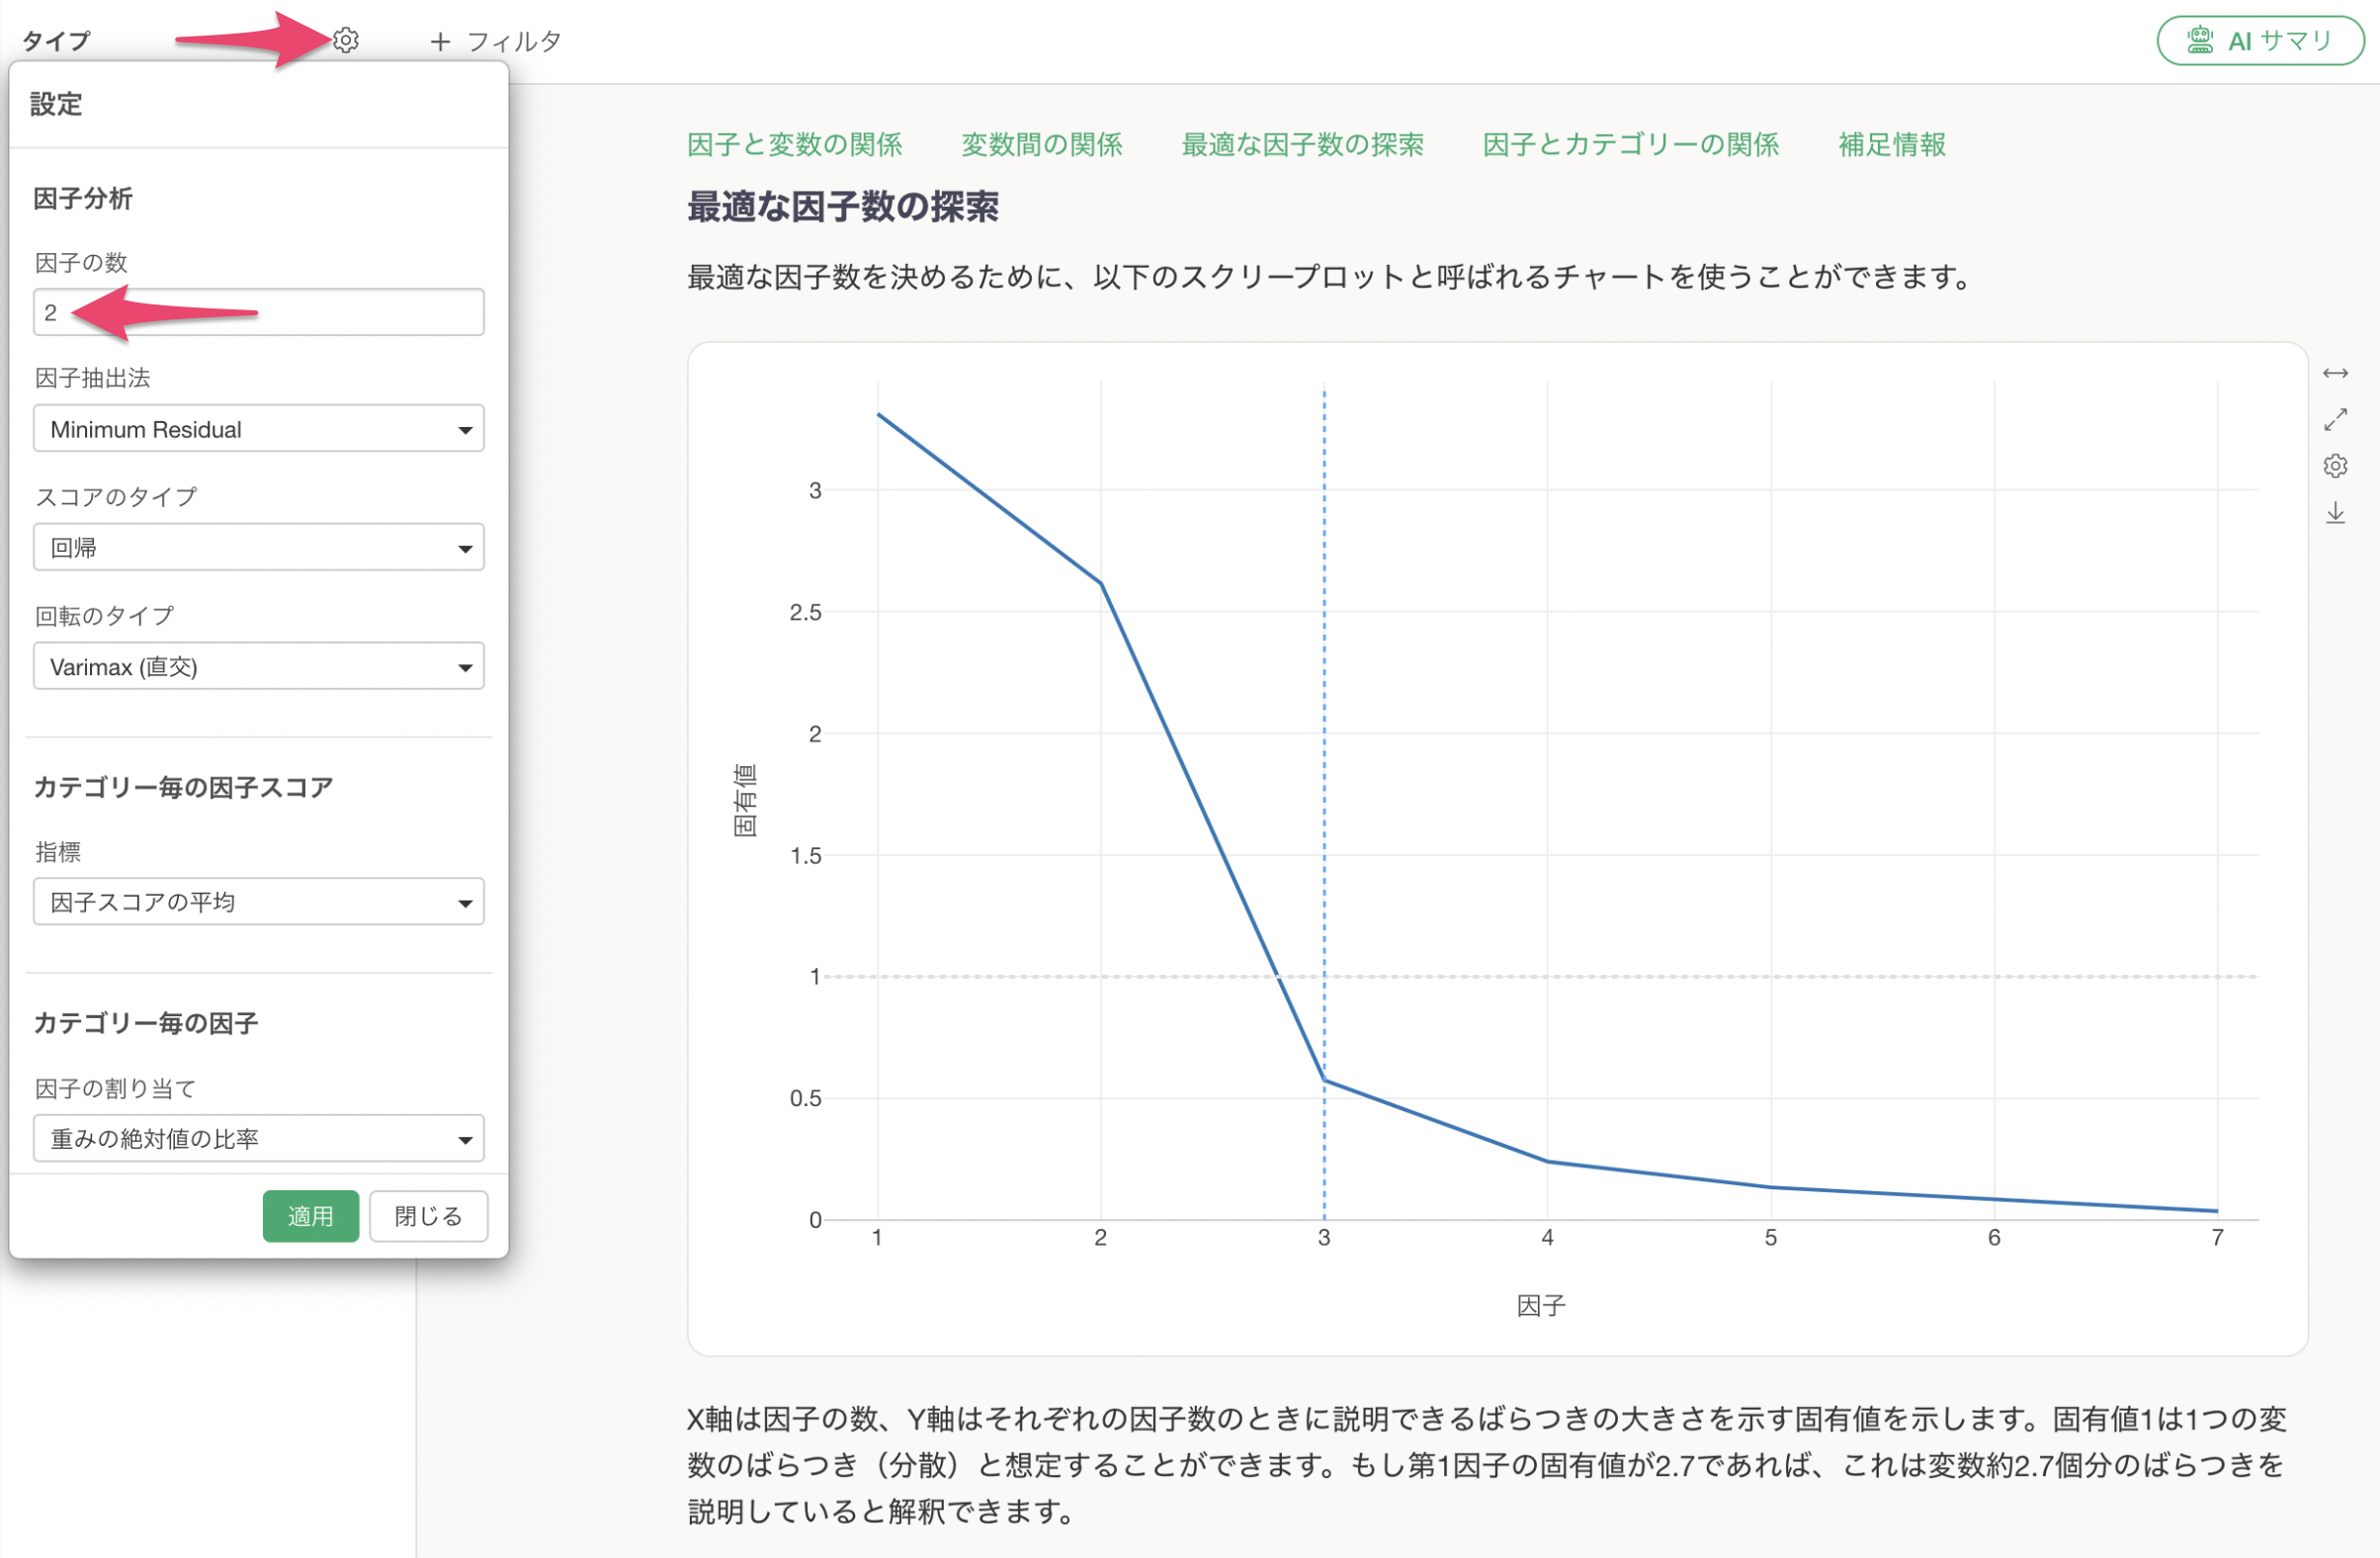
After specifying the number of factors, the results for the specified number of factors will be displayed.
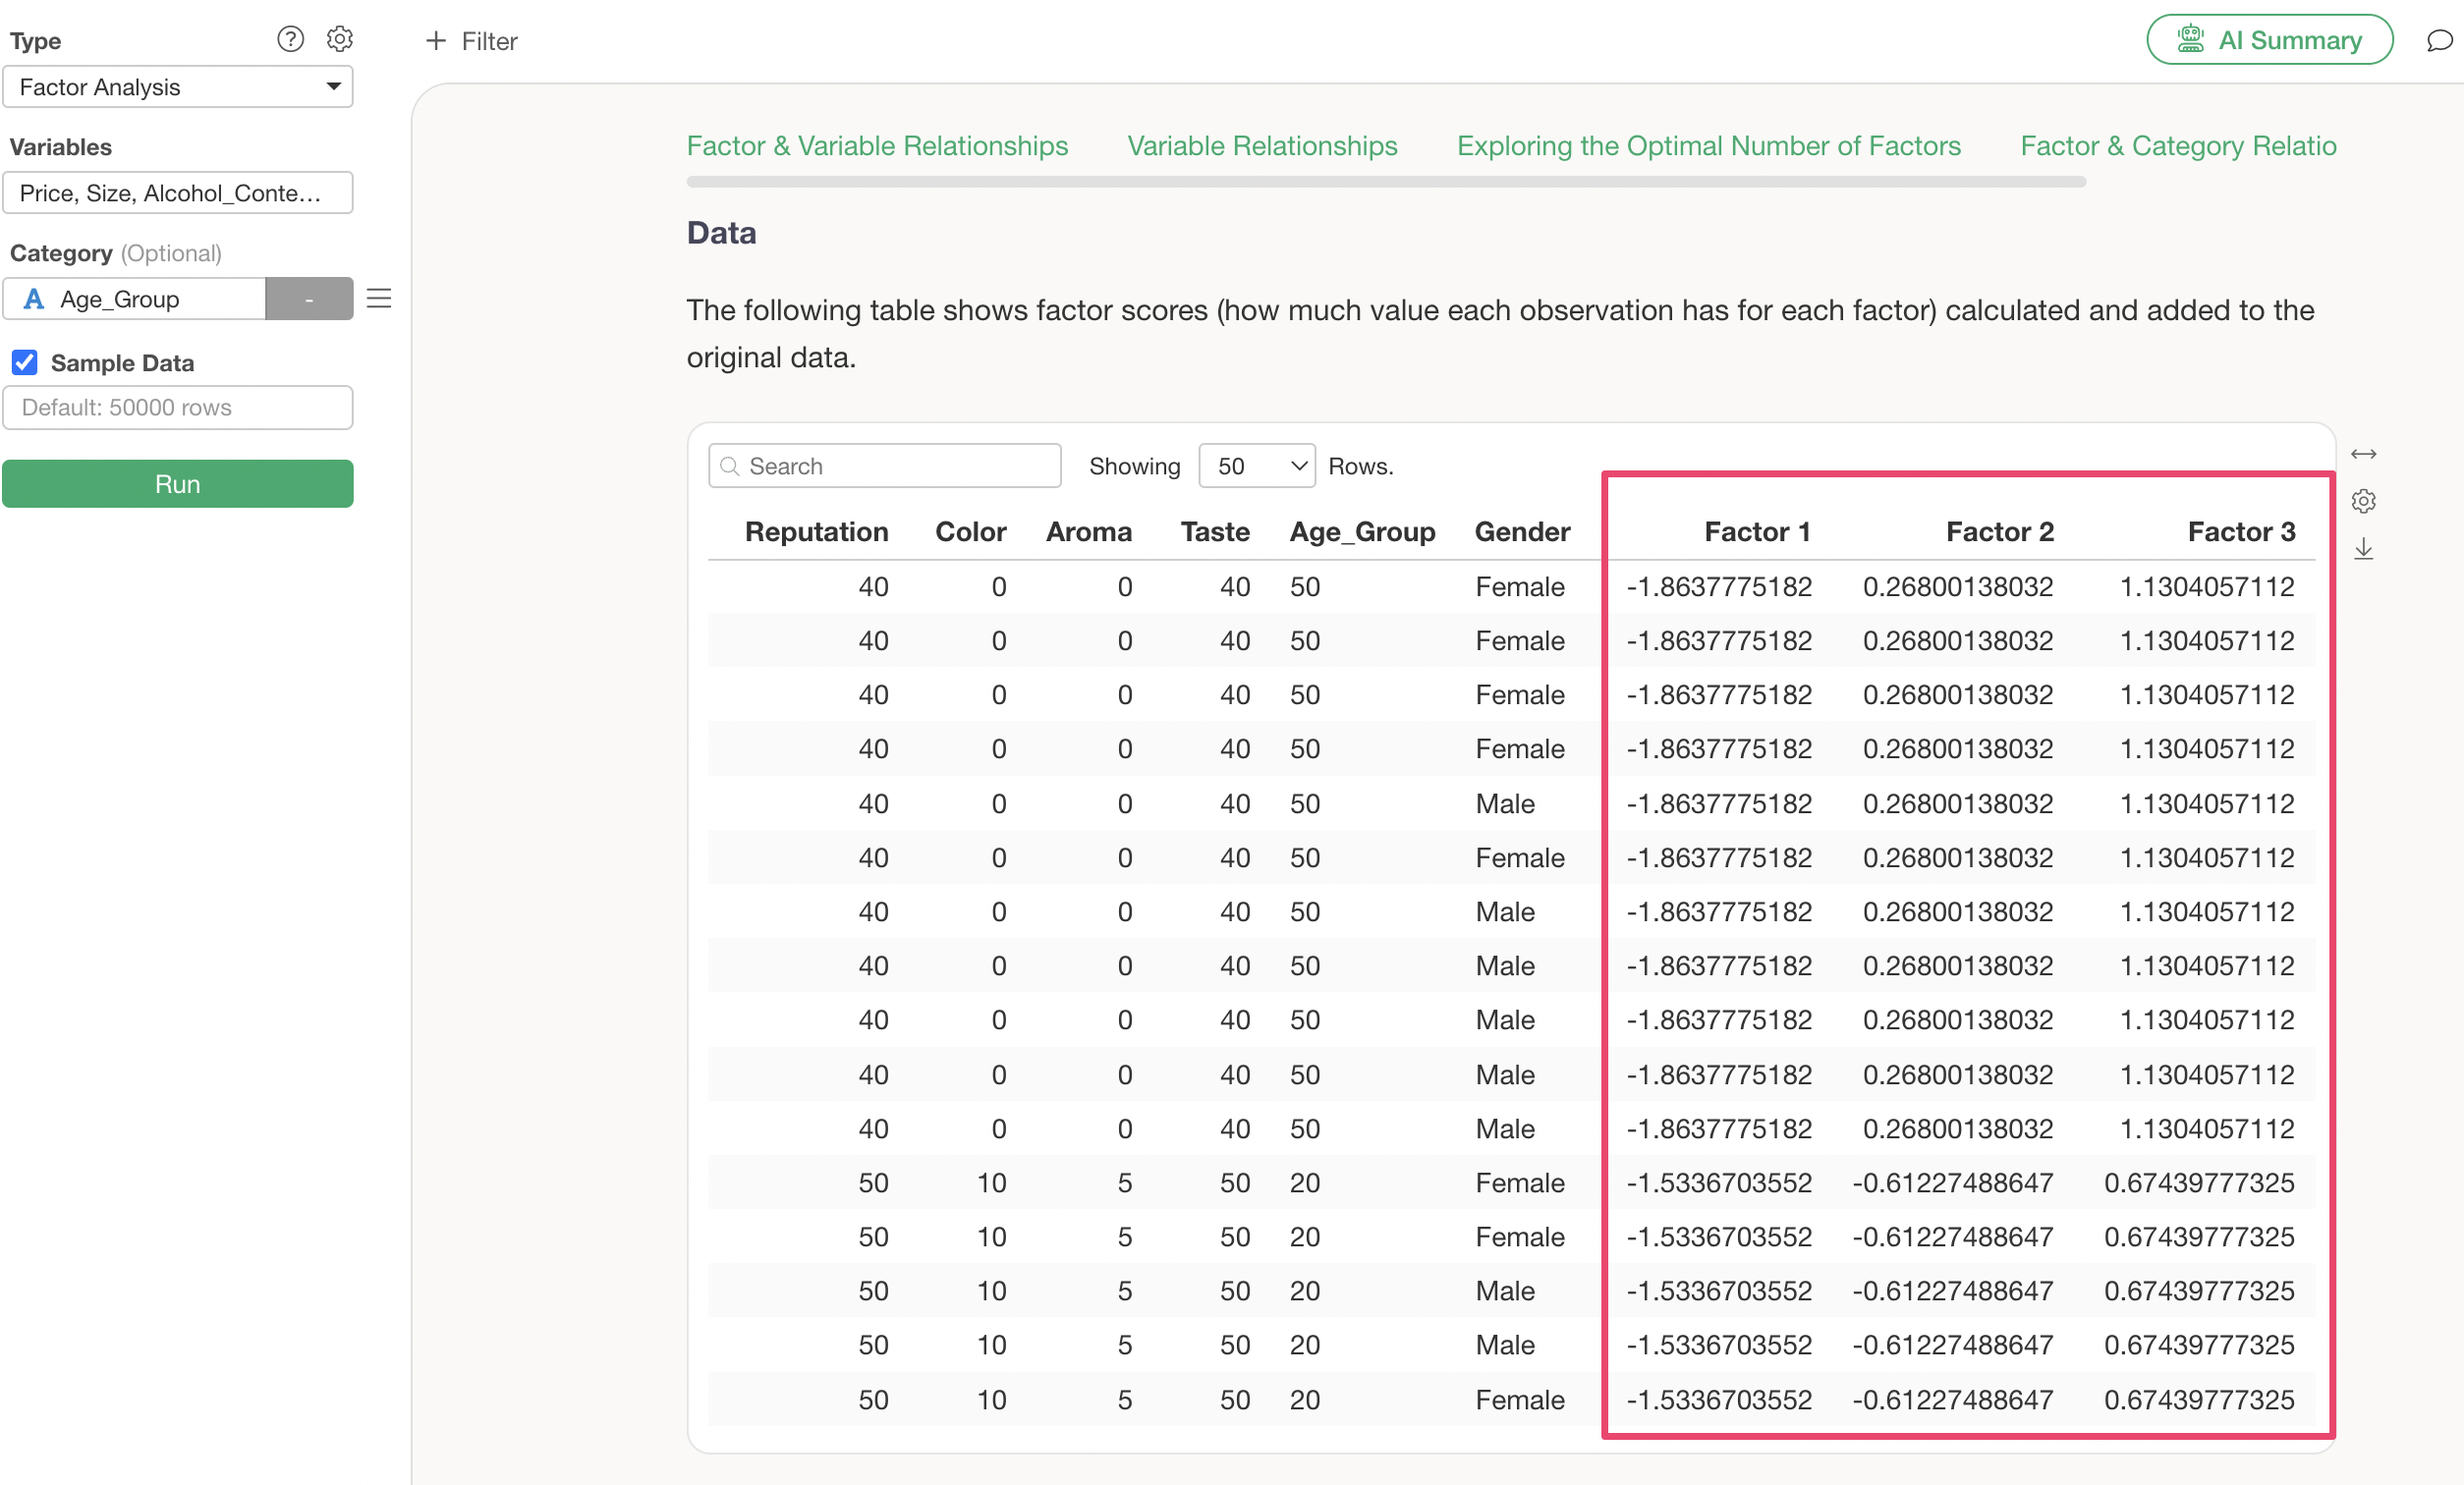
Data
In the “Data” section, you can view the original data along with the factor scores (Factor 1 ~ Factor 3) for each row (observation). If a particular factor score is high, it indicates a strong influence of that factor.

Up to this point, we have understood the characteristics of each factor based on the relationship between factors and variables using factor loading tables and radar charts. However, there are challenges such as:
- It takes time to interpret the characteristics of factors manually.
- Although detailed explanations are provided in the analytics guide, it can be difficult for beginners to interpret.
The “AI Summary” feature, introduced next, can solve these problems!
🤖 Summarize Analysis Results with AI Summary
The AI Summary feature, newly added in v13, automatically summarizes complex factor analysis results.
Its usage is incredibly simple: just click the “AI Summary” button after running factor analysis.
This will output a summary of the characteristics of each factor.
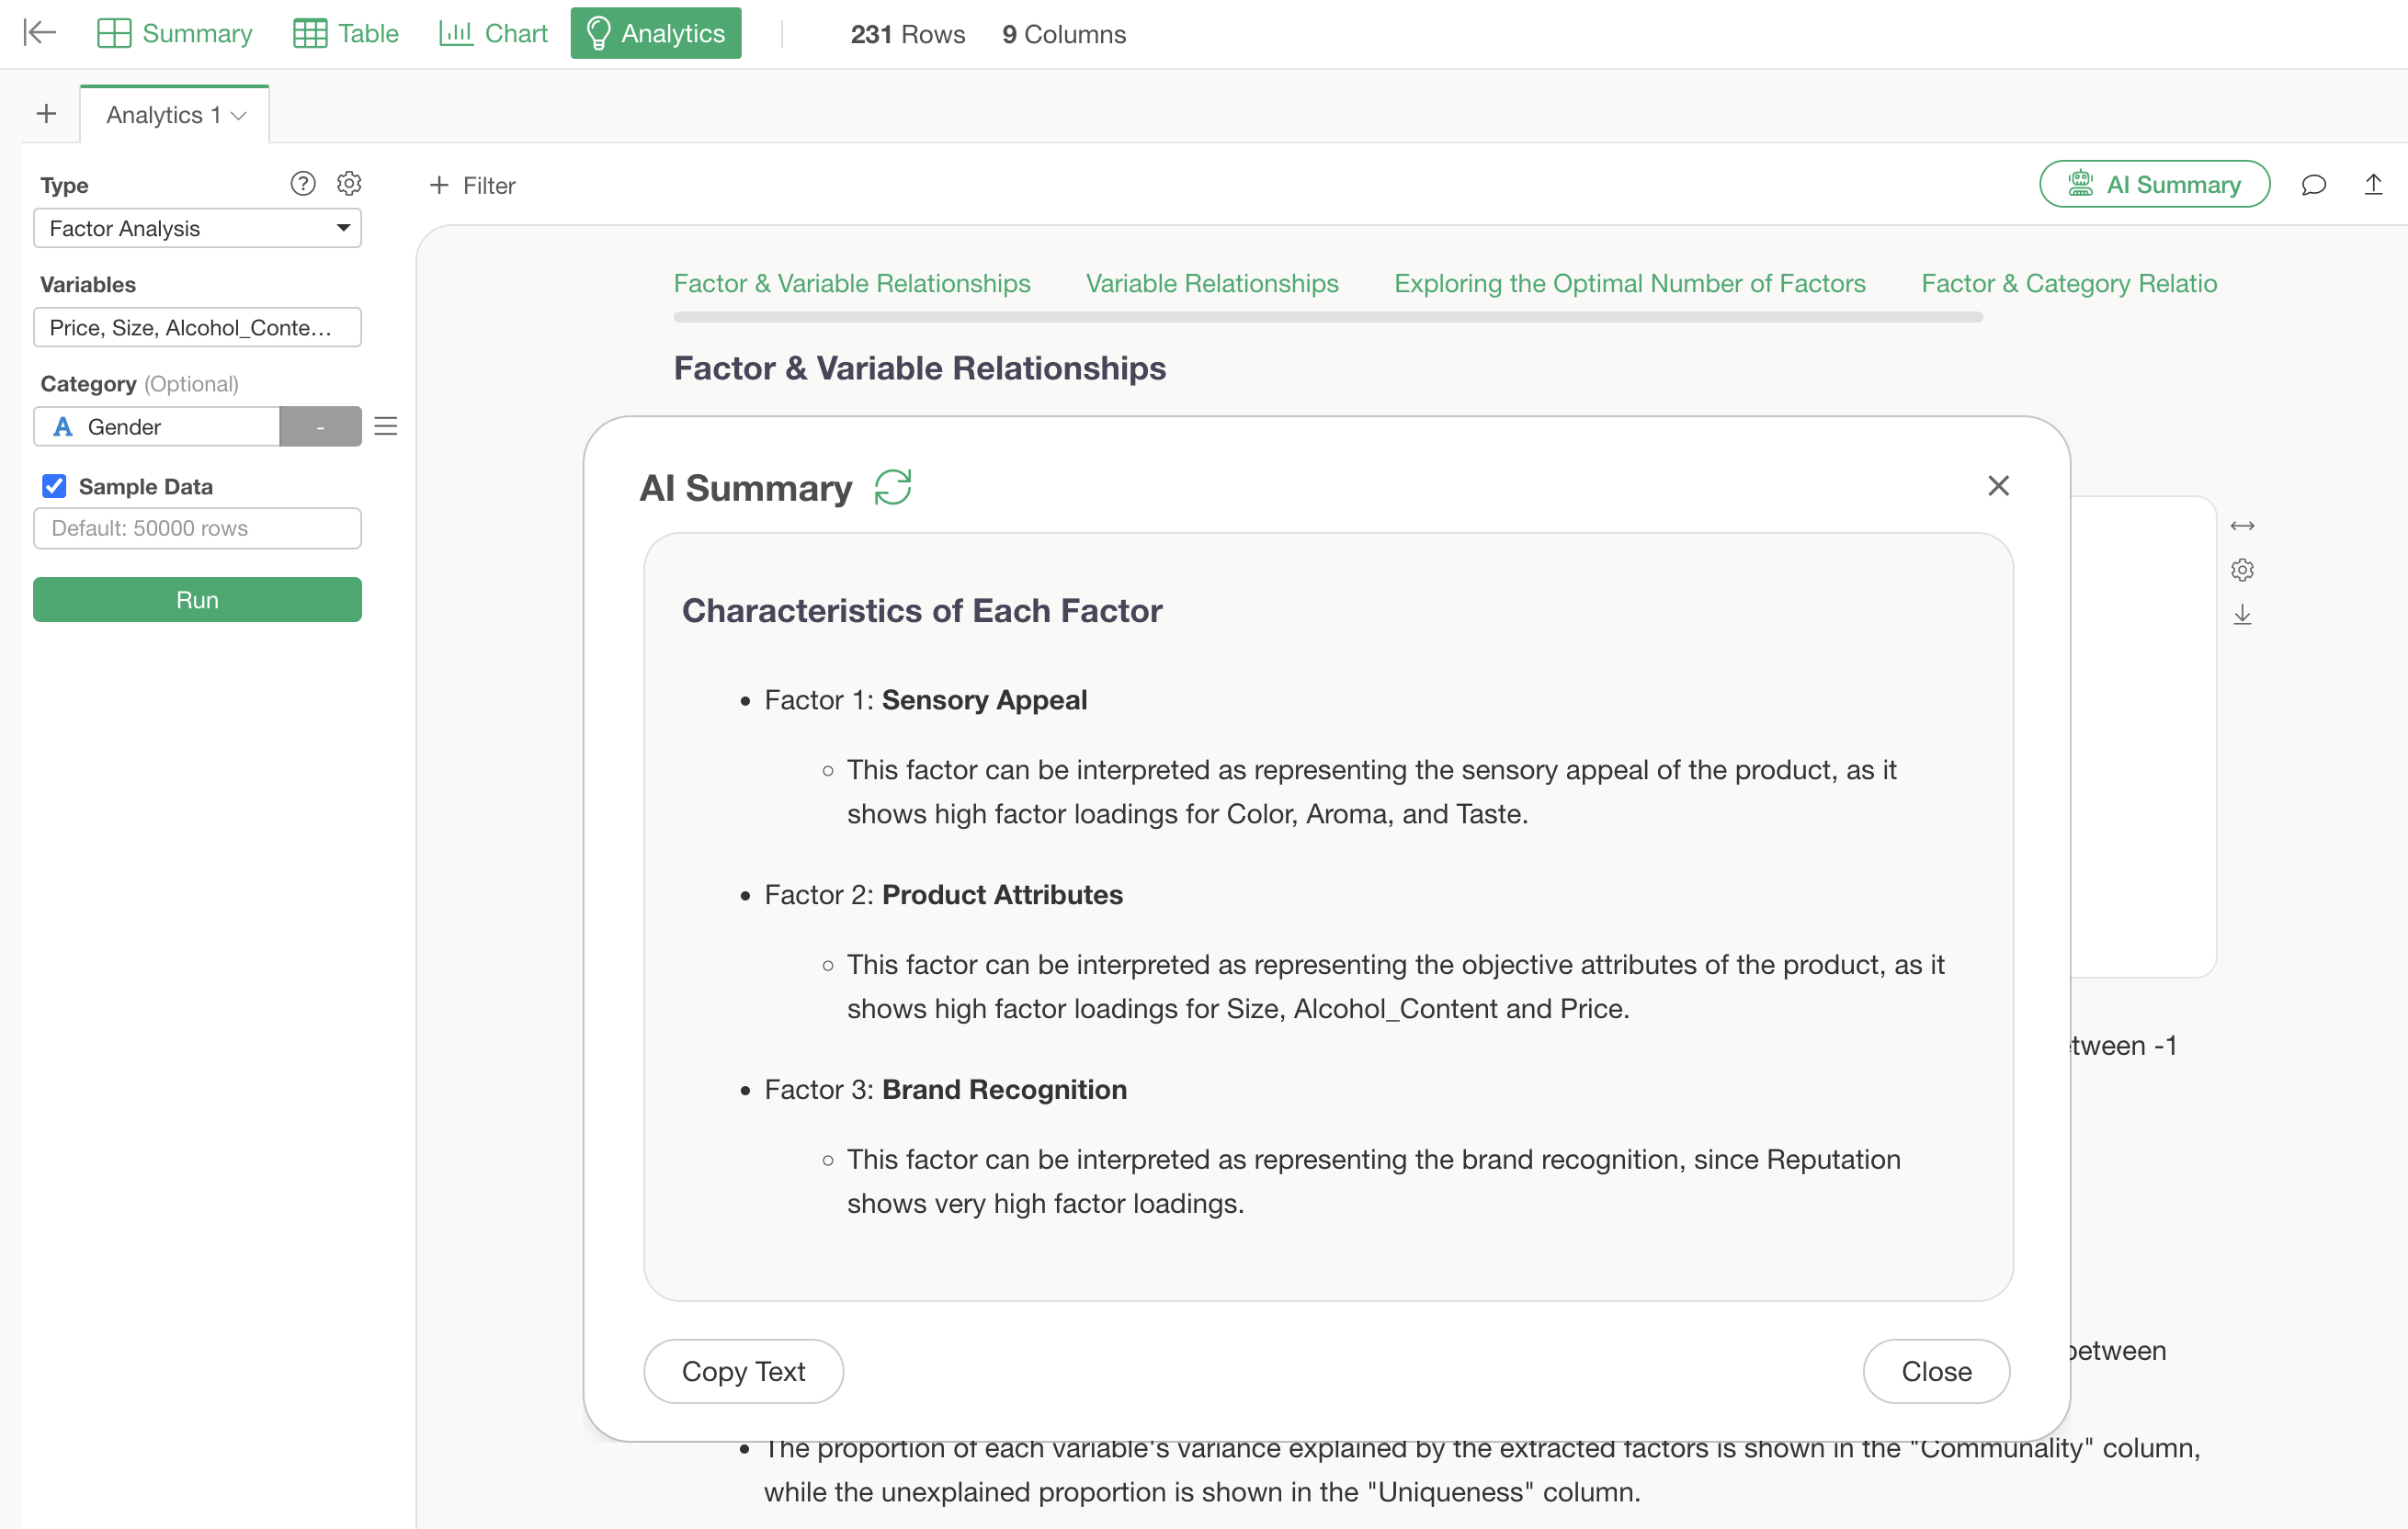
By simply looking at this AI Summary, you no longer have to interpret the characteristics of each factor “yourself” from factor loading tables, as the AI will determine and tell you what characteristics they have, making factor analysis easy for anyone to use.
References
Please refer to the following resources for more information on factor analysis.
Frequently Asked Questions about Factor Analysis
Here are common questions and answers regarding factor analysis.
Q: Is the data standardized internally when running factor analysis?
Factor analysis always performs standardization internally, and the factor analysis package used in Exploratory also executes standardization.
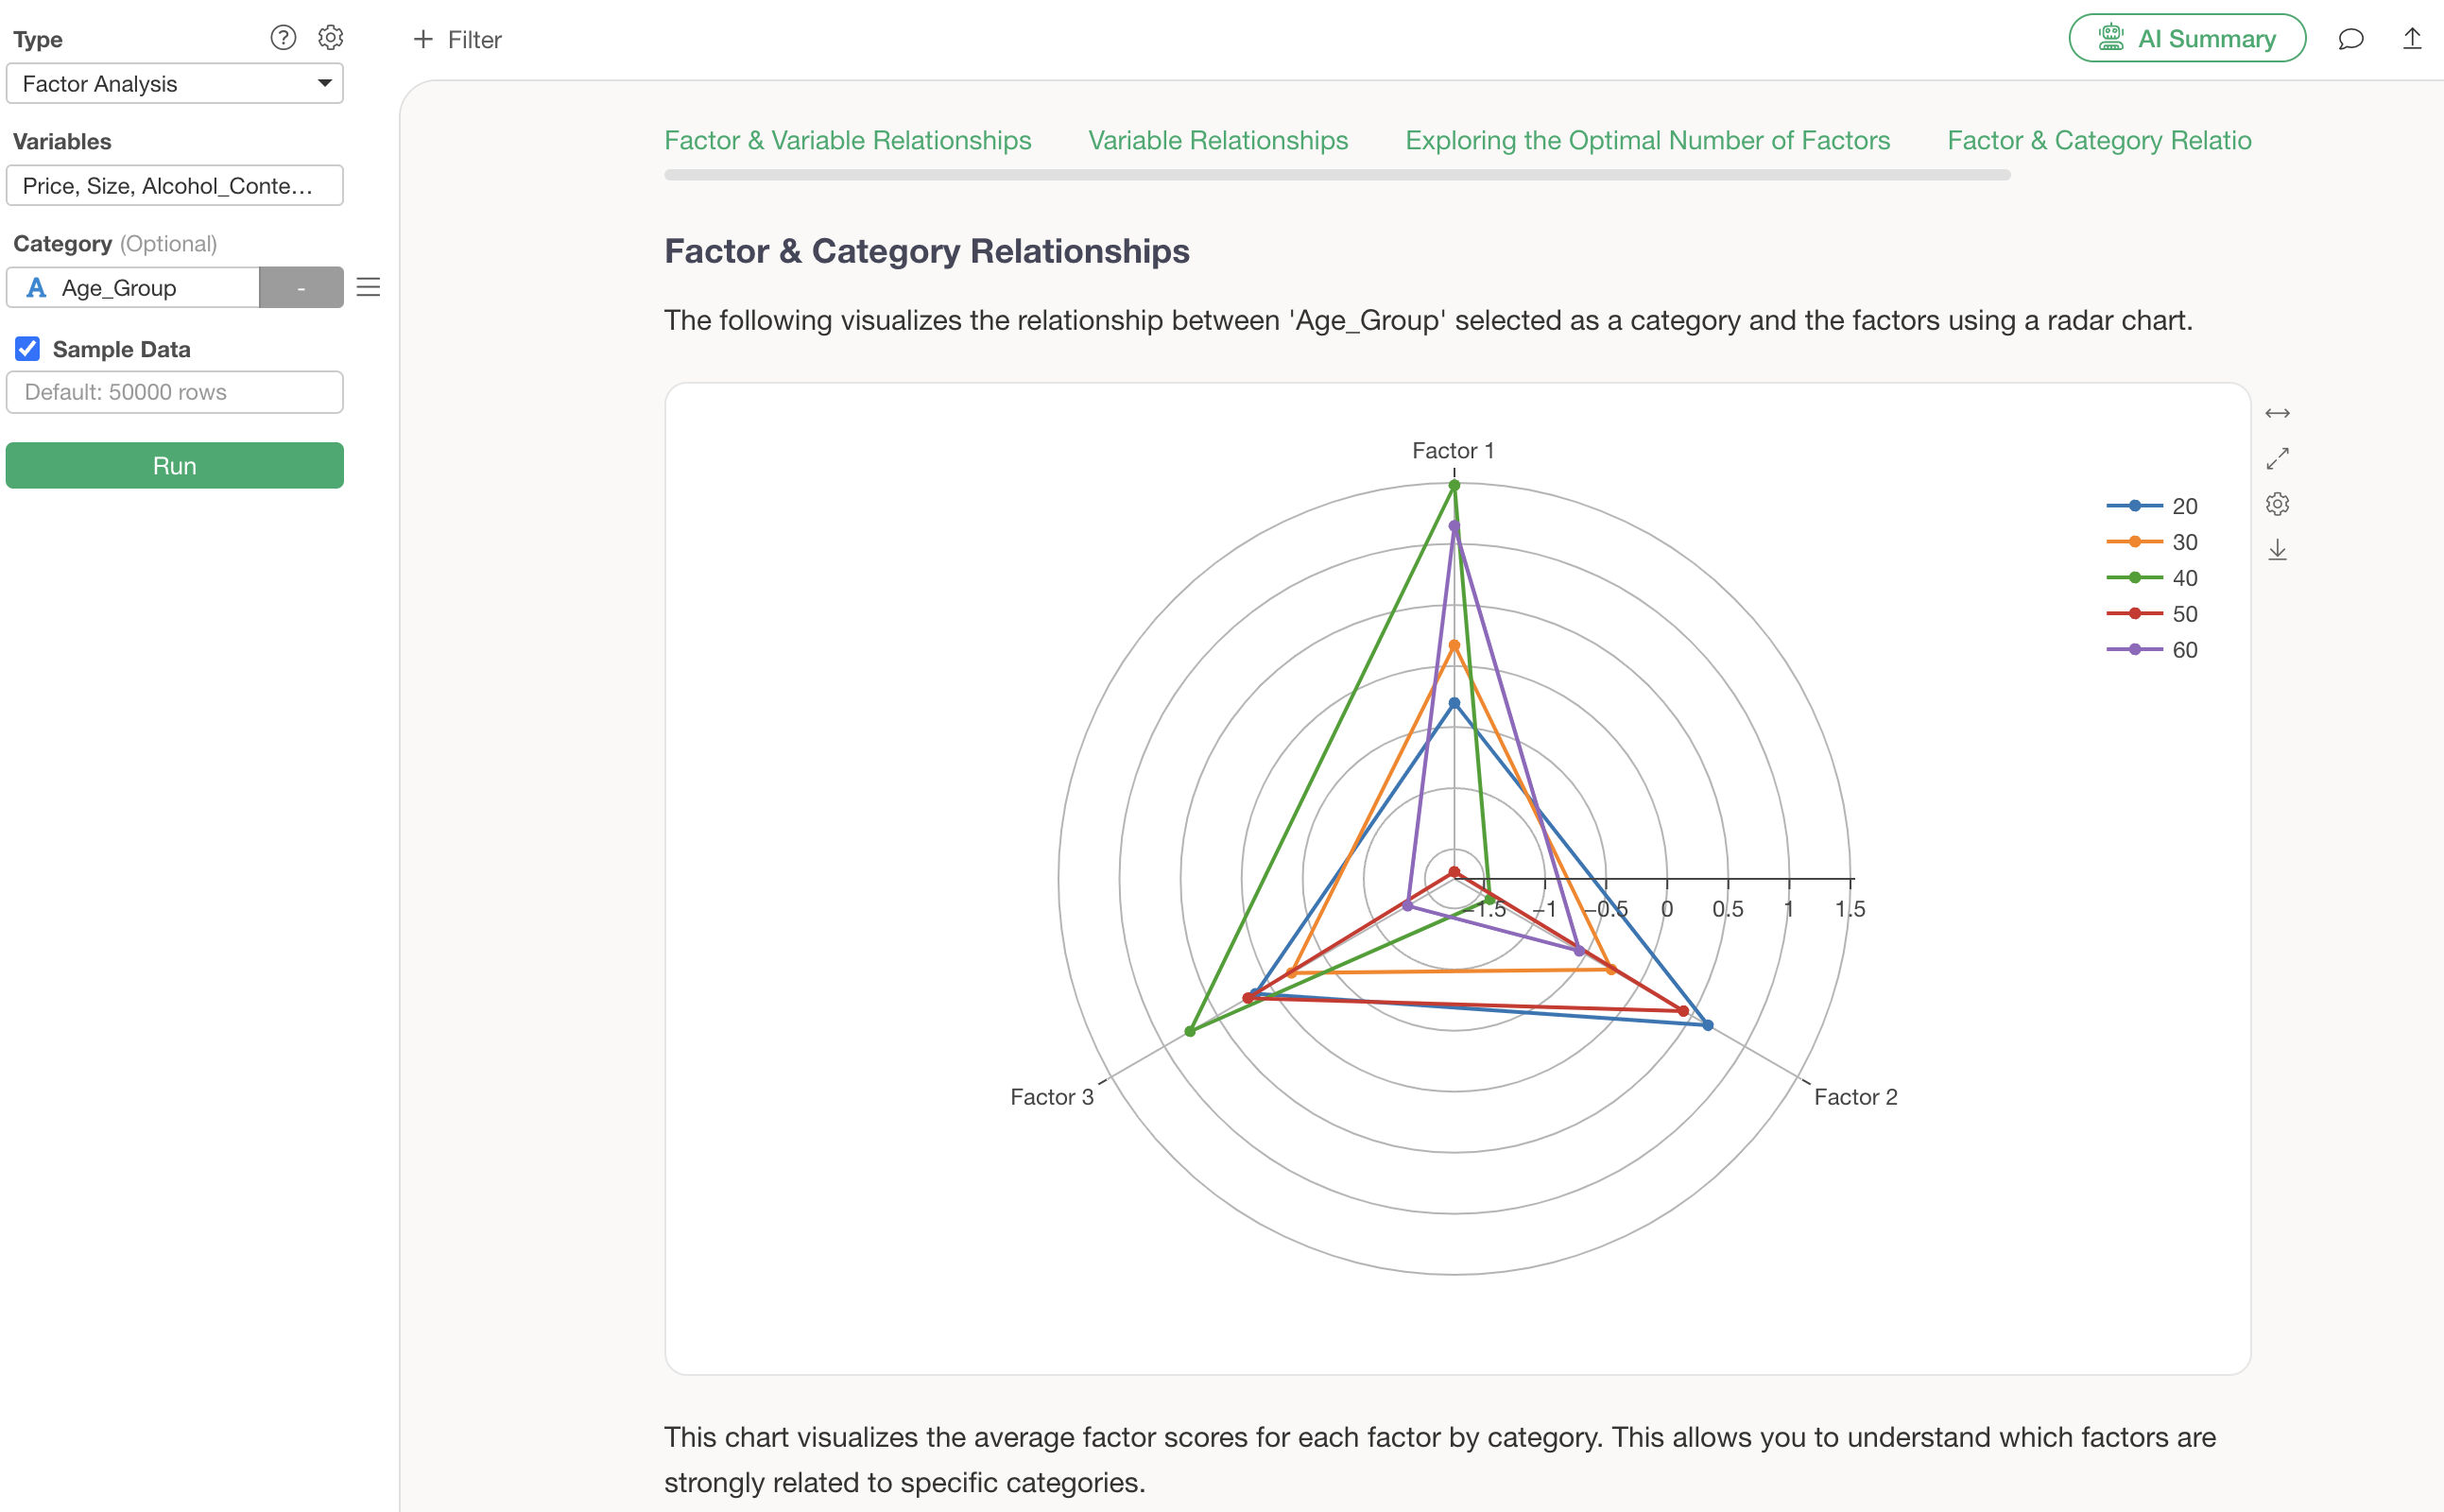
Q: What values are visualized in the “Relationship between Factors and Categories” section?
Assigning a column to “Category” will display the “Relationship between Factors and Categories” section.
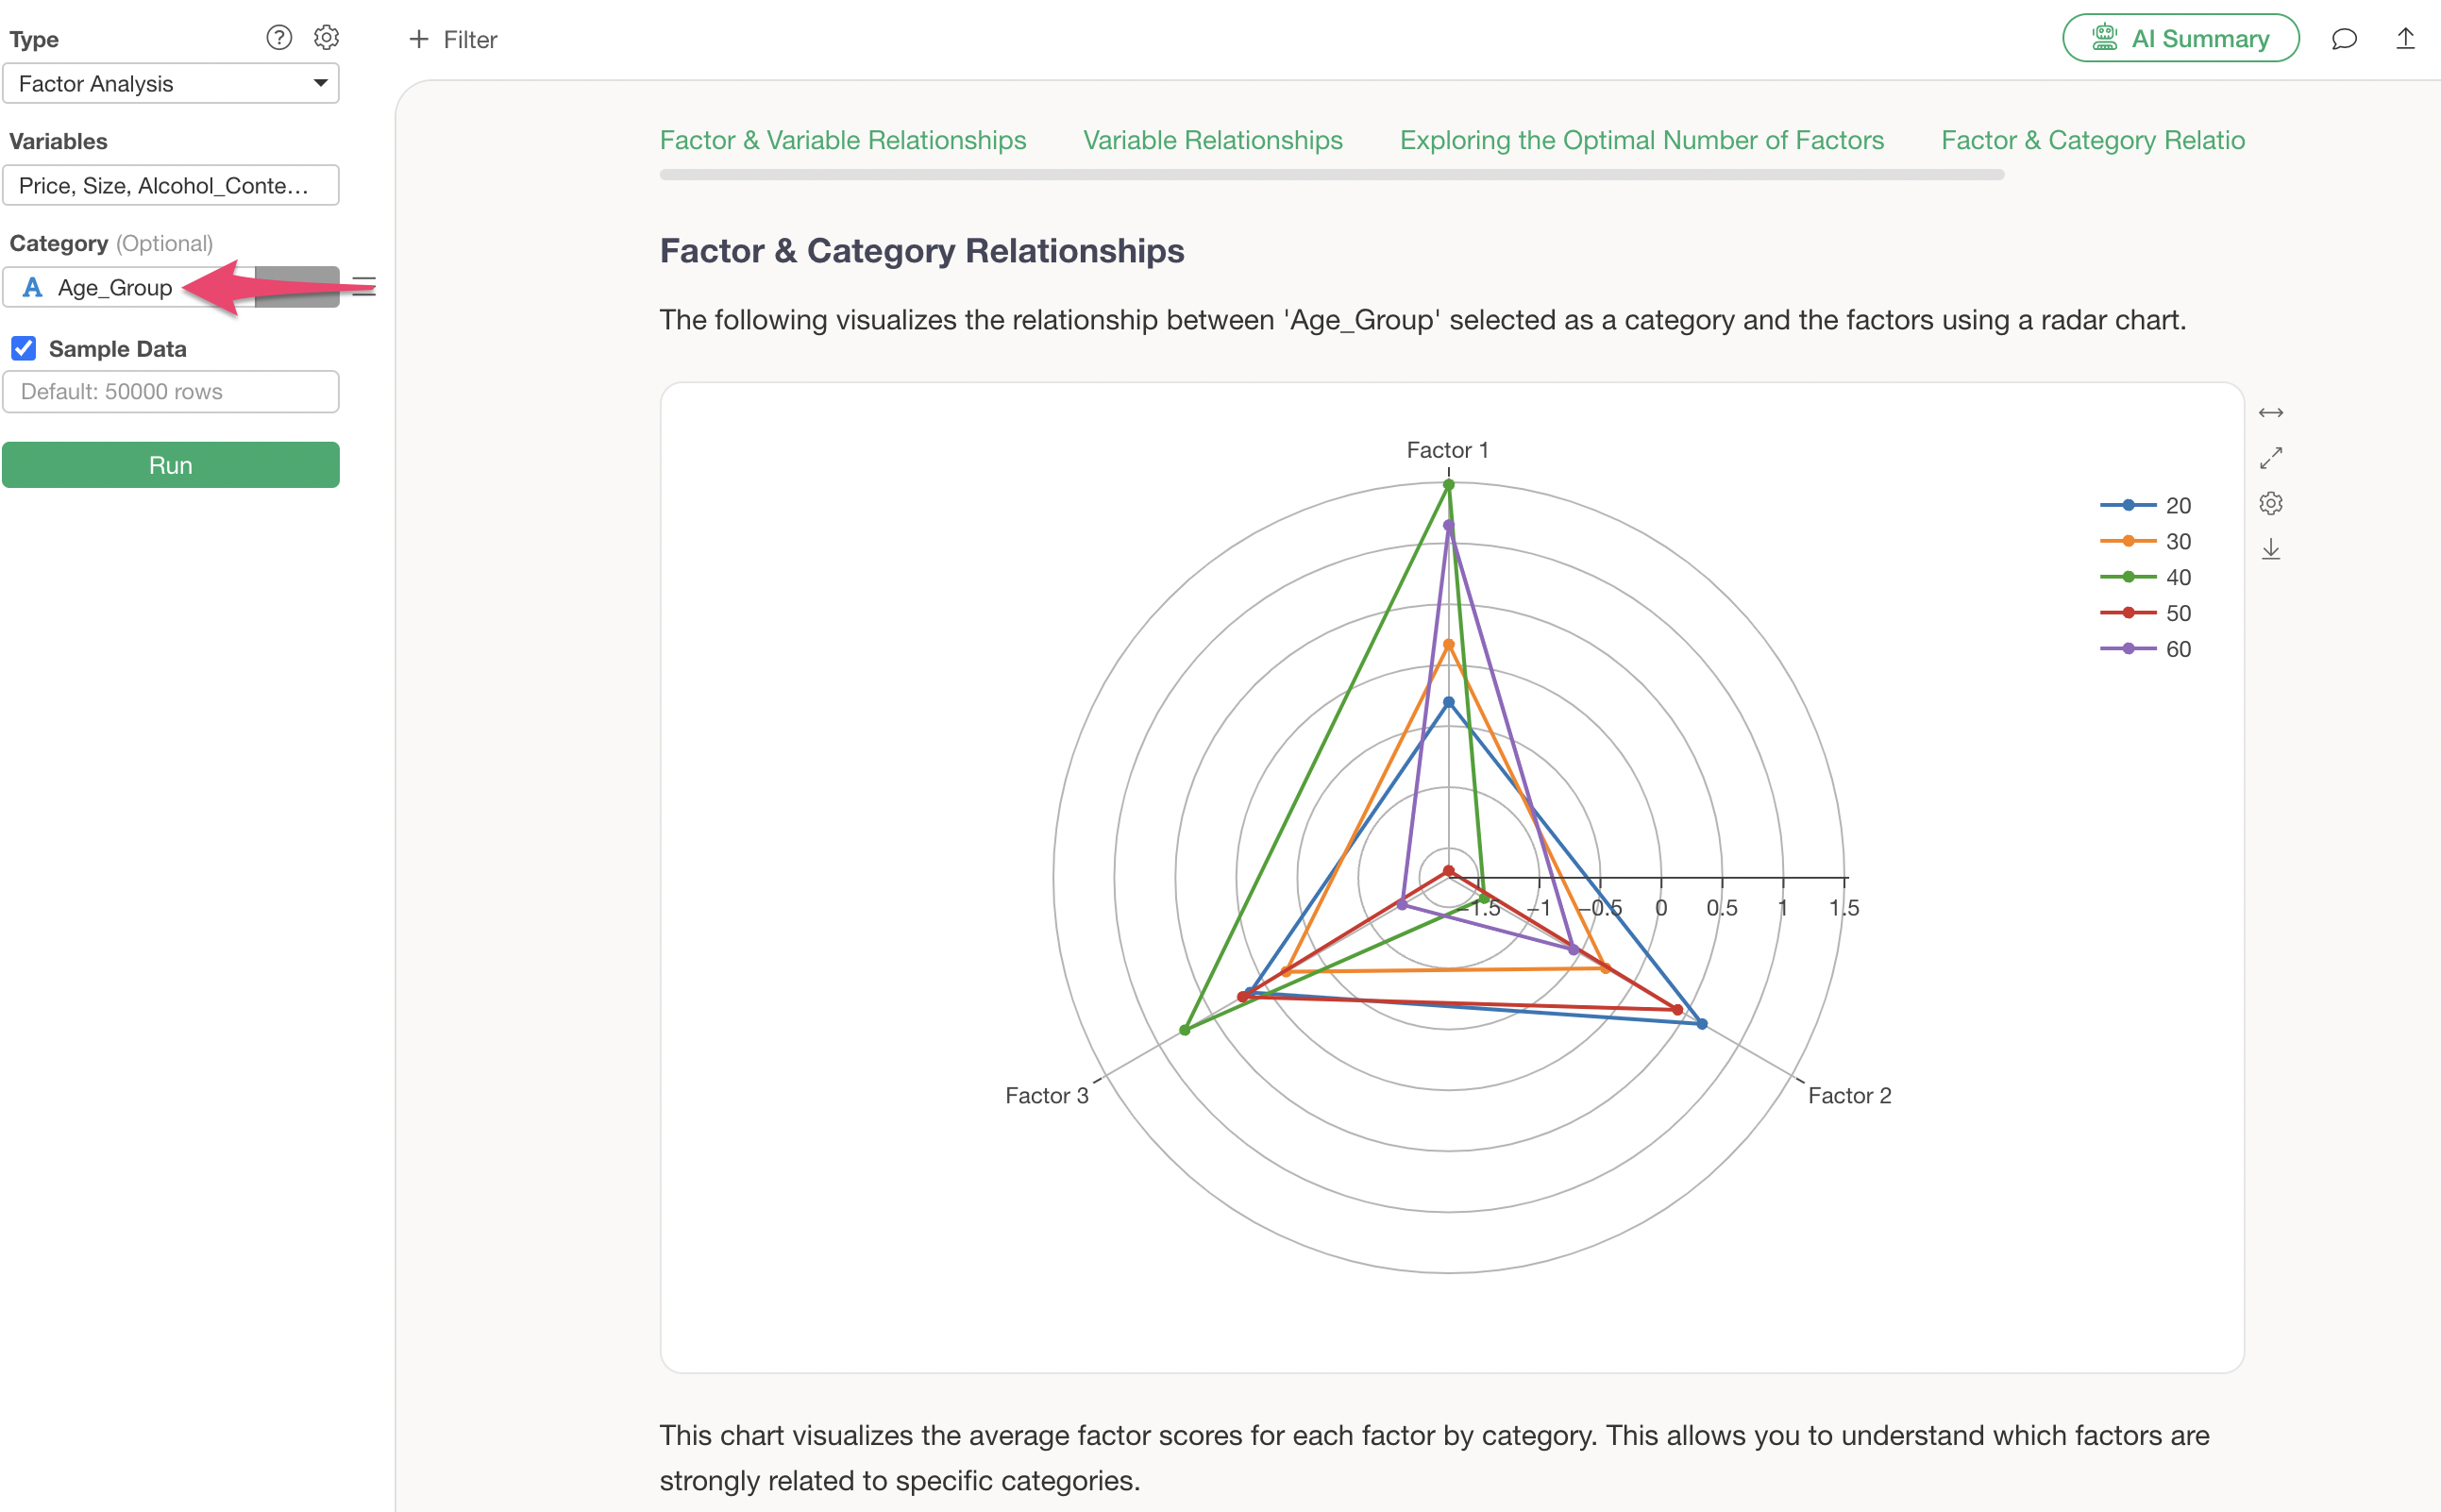
This tab displays the average factor score (factor loading) for each category.
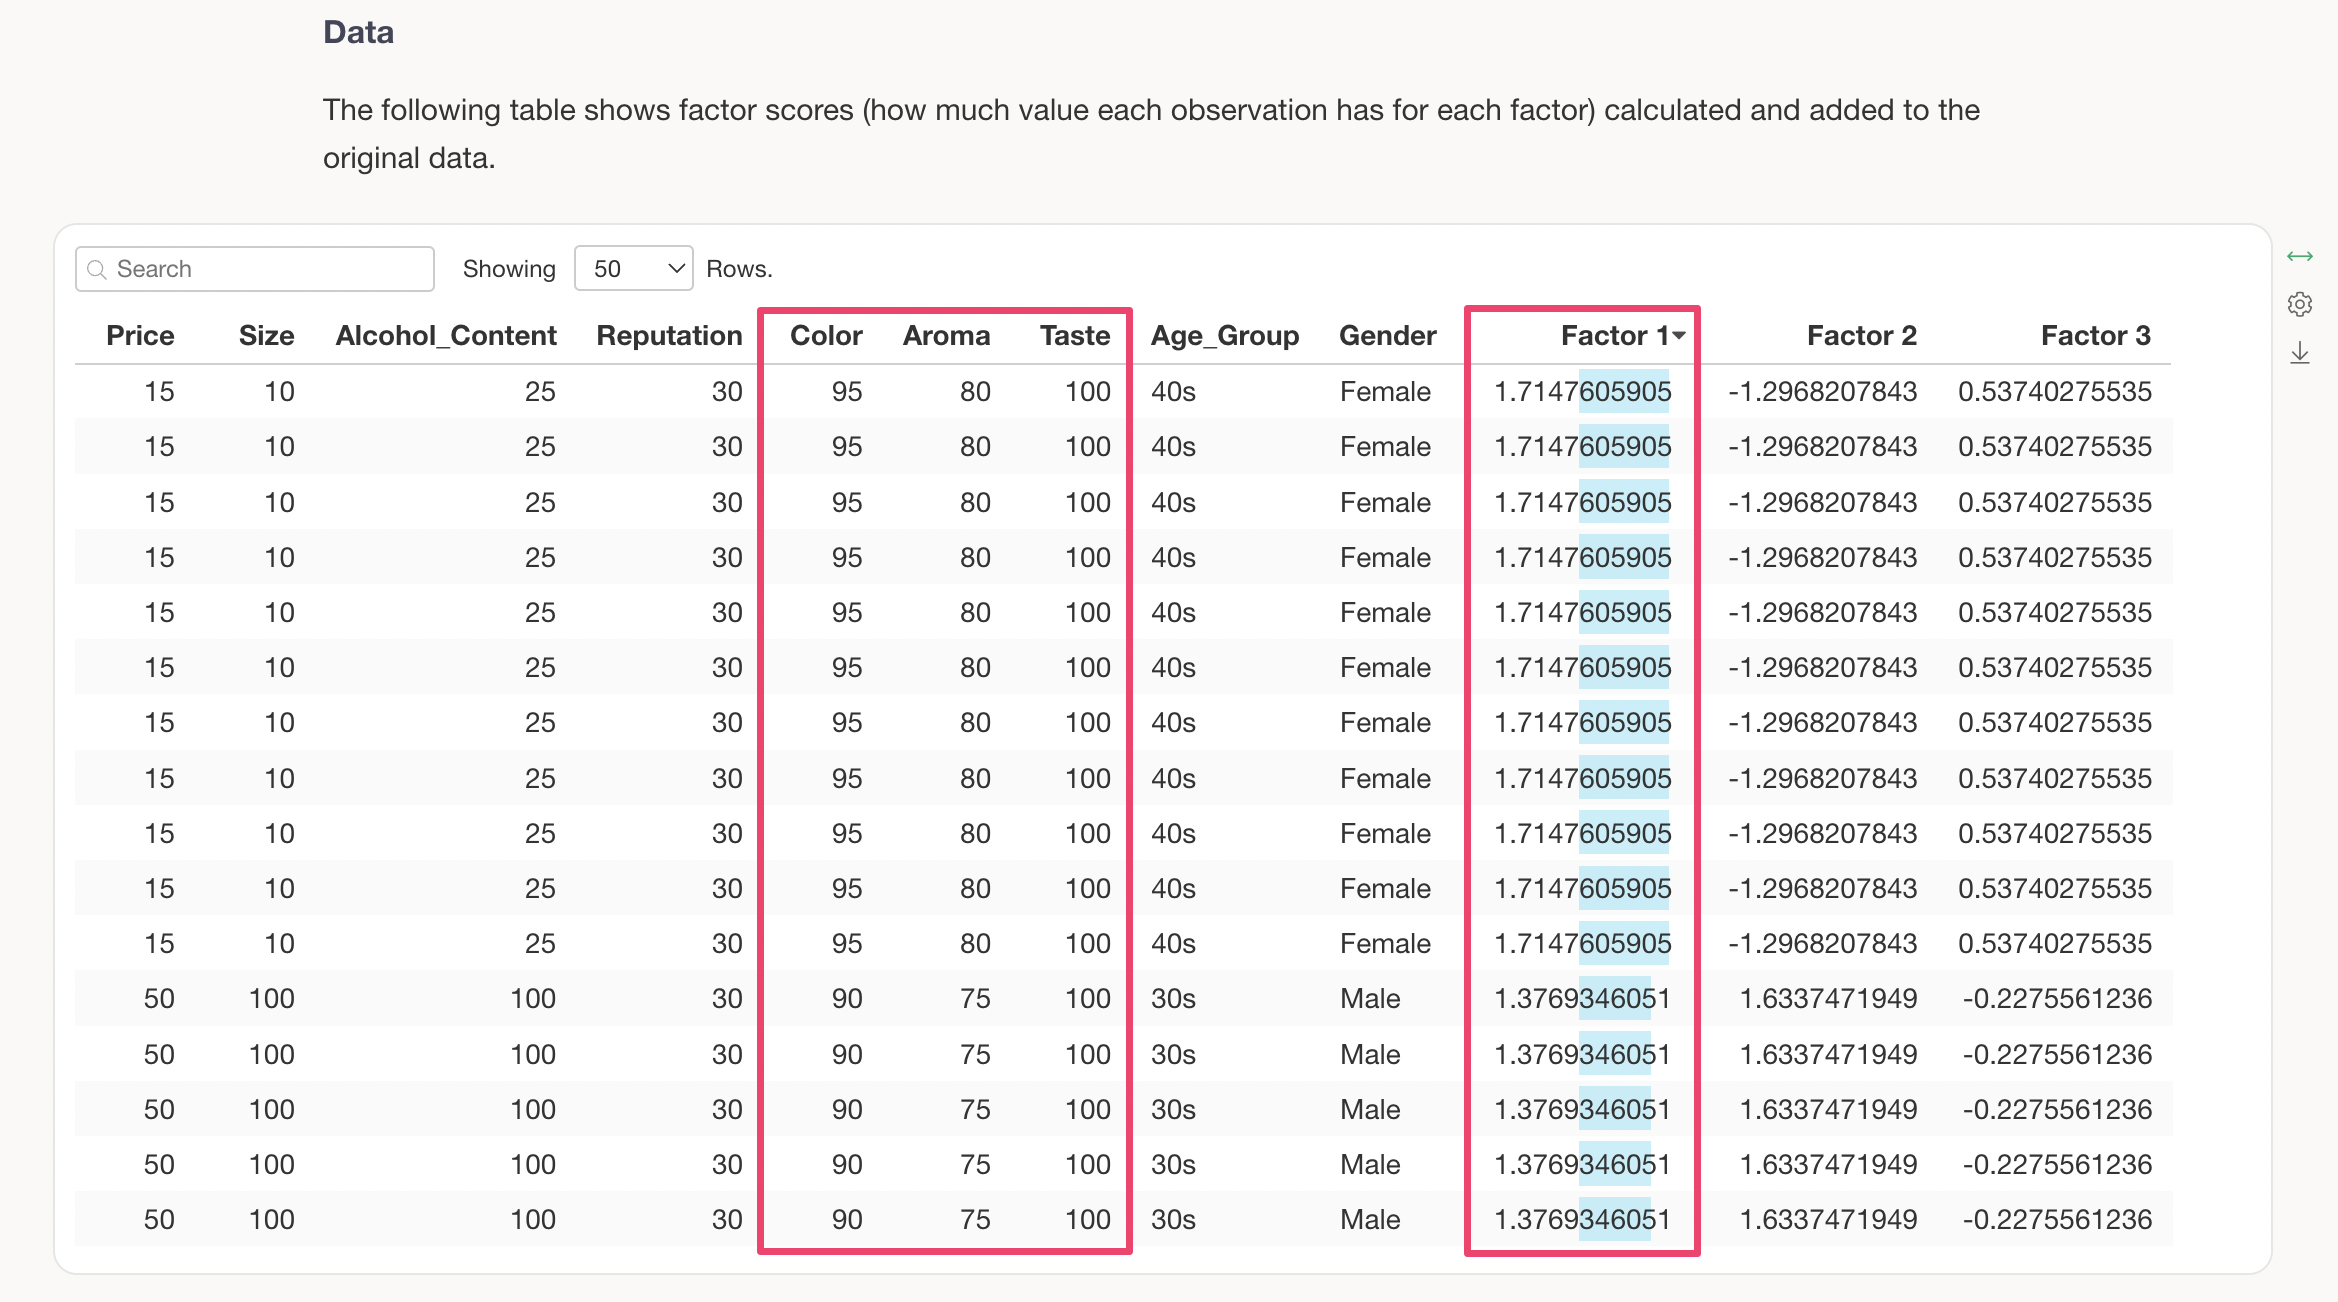
Q: How should I interpret the “Factor 1 ~ Factor 3” columns in the Data section?
In the Data section of the Factor Analysis, “Factor 1 ~ Factor 3” represent the factor score values for each observation.
Factor scores are standardized with a mean of 0 and a standard deviation of 1. A value close to 0 indicates an average tendency, while values further away from 0 (in either a positive or negative direction) indicate a stronger tendency for that specific factor. As a general guideline, values exceeding ±1 are considered to show a strong tendency that deviates significantly from the average.
Furthermore, the interpretation of the positive or negative sign of a factor score depends on the sign of the factor loadings.
For variables with positive factor loadings, a higher factor score indicates a higher value for that variable, while a lower factor score indicates a lower value for that variable.
Conversely, for variables with negative factor loadings, a higher factor score indicates a lower value for that variable, while a lower factor score indicates a higher value for that variable.
For example, the factor loadings for the first factor show positive scores.
In this case, when the factor score for Factor 1 is high, the scores for “Color,” “Aroma,” and “Taste” in the first factor are also high.
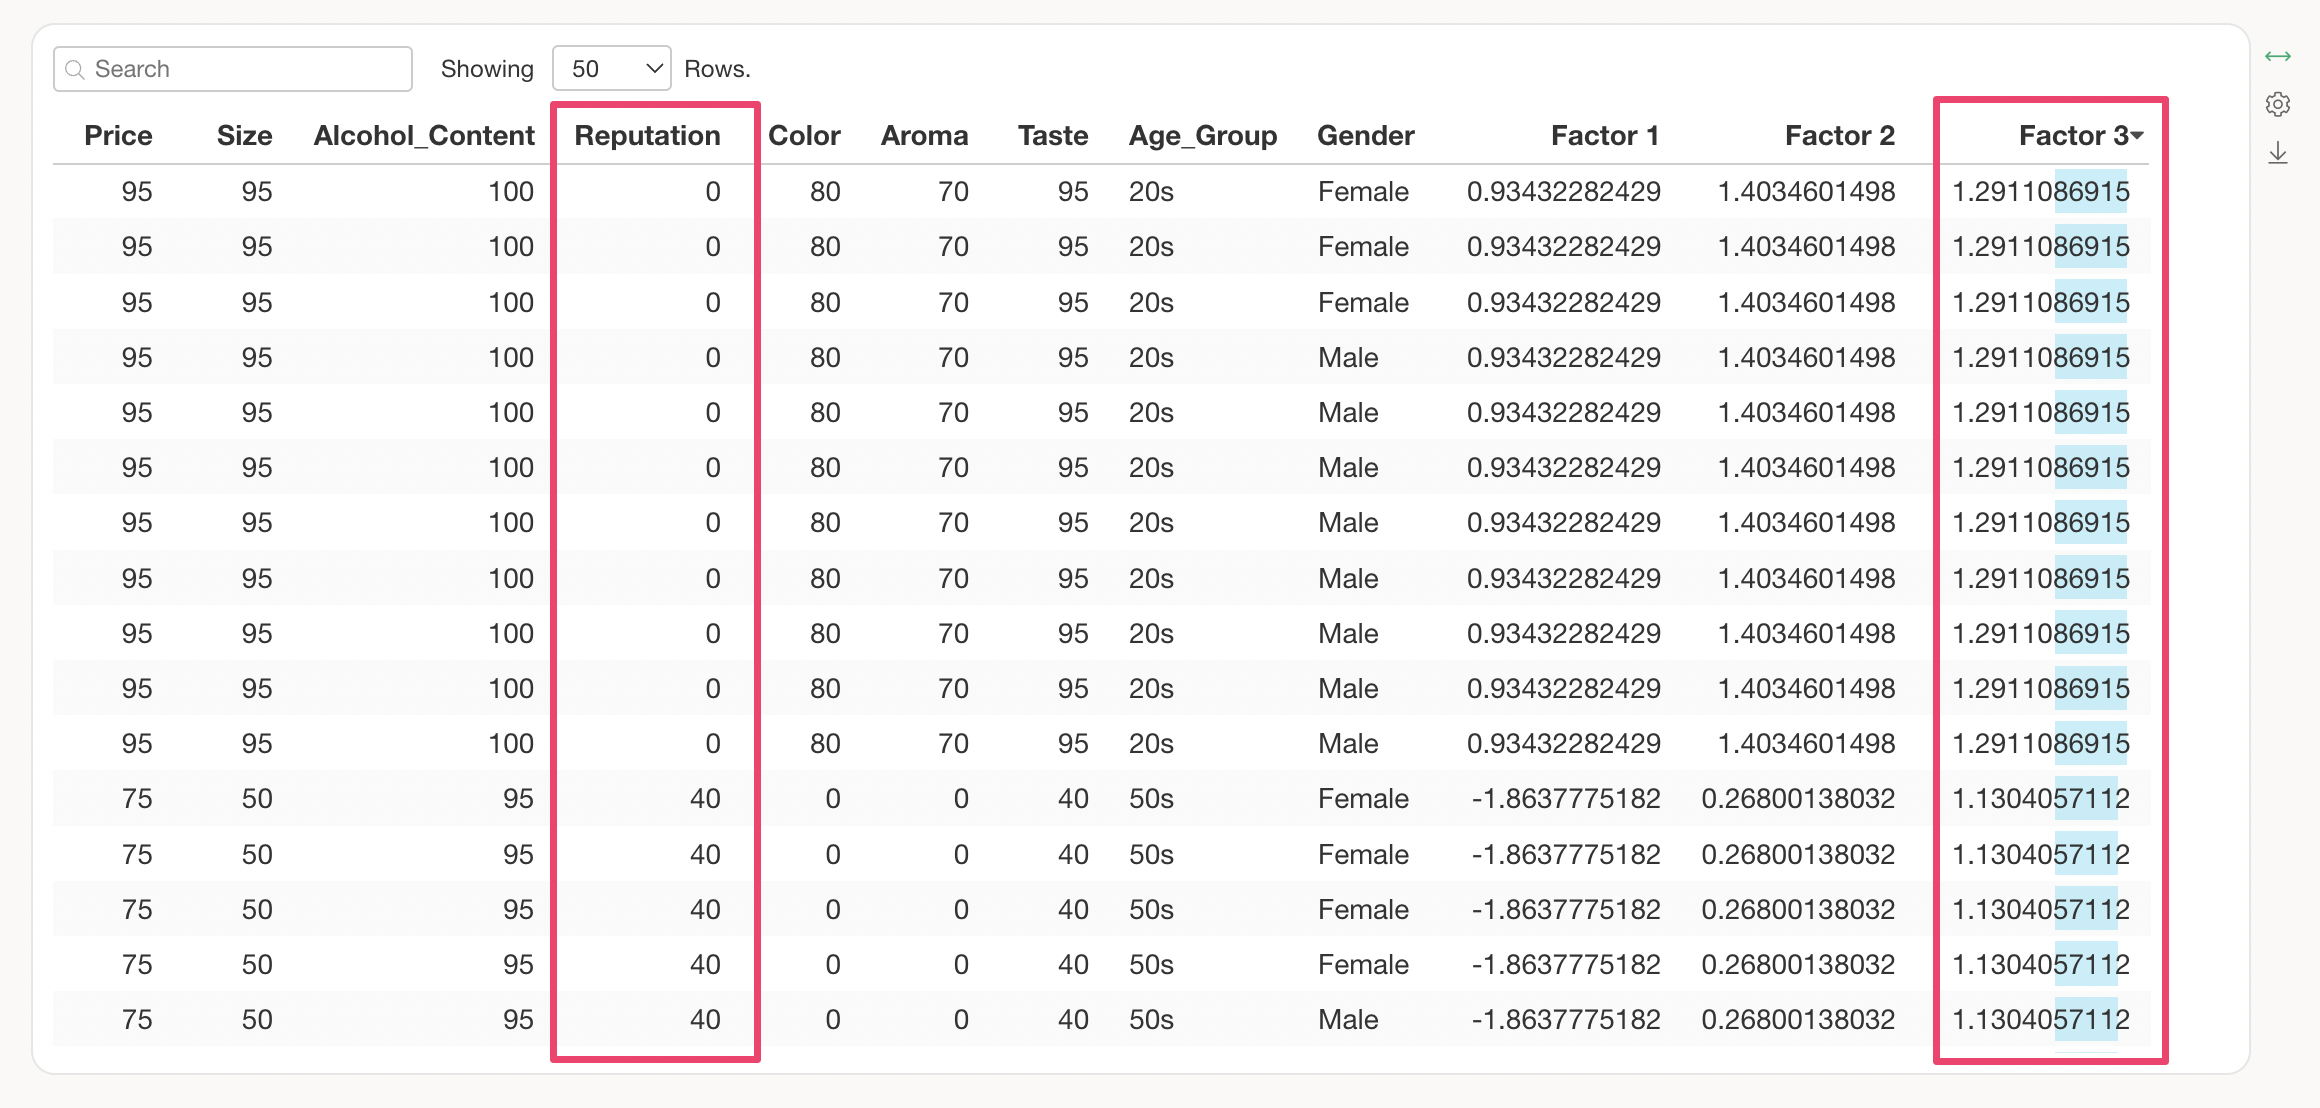
On the other hand, “Reputation,” which has the largest absolute factor loading in the third factor, has a negative score.
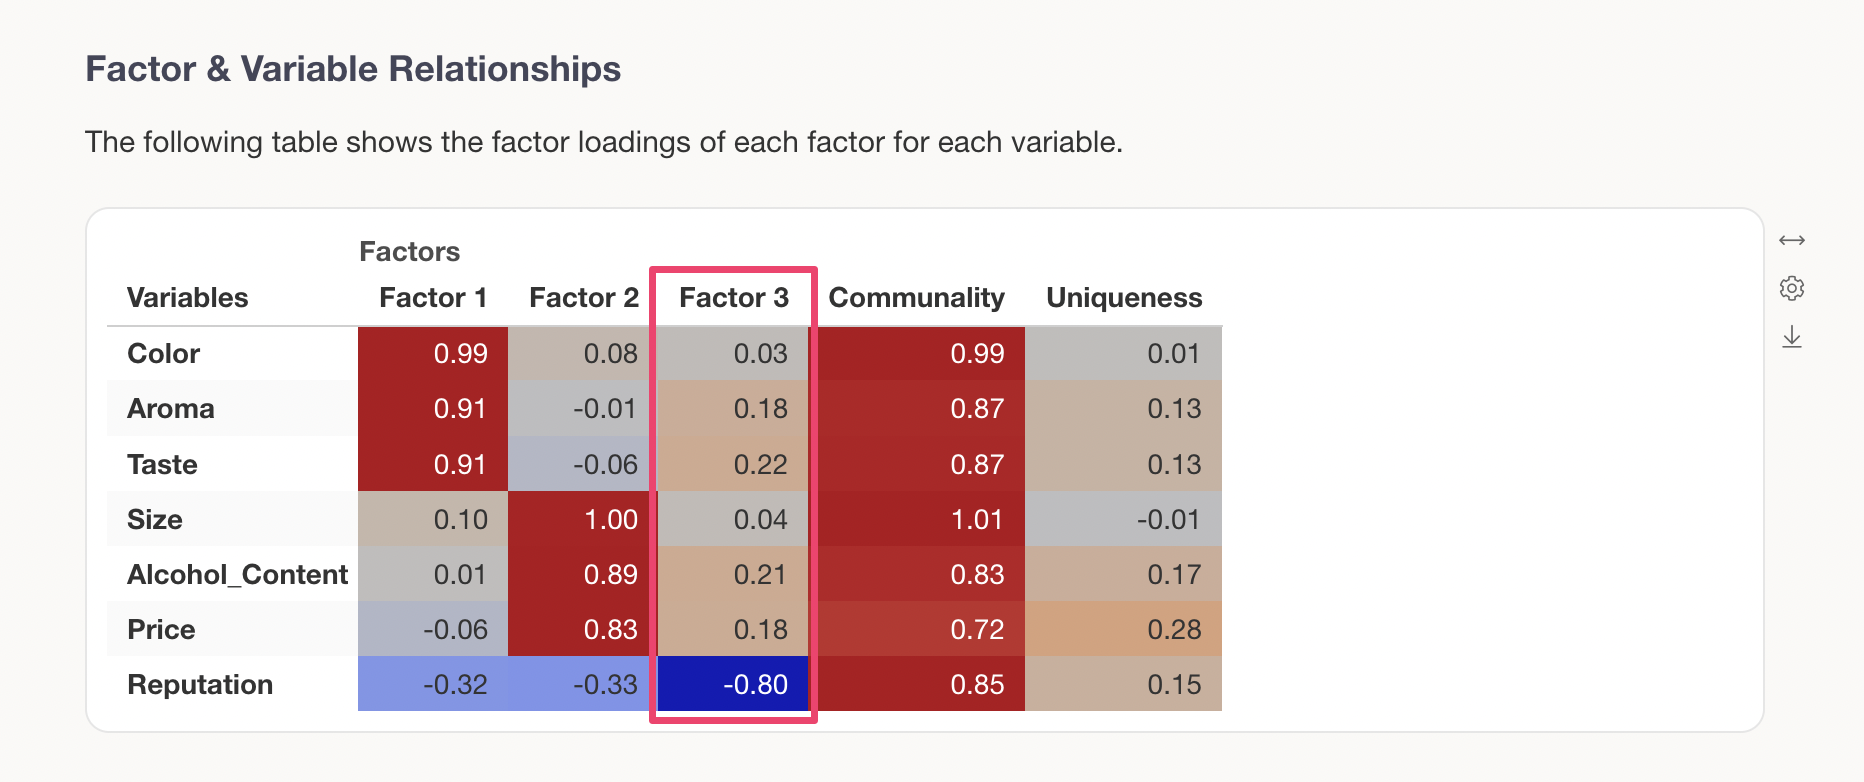
In this case, it can be seen that when the factor score for Factor 3 is low, the value for “Reputation” is high.
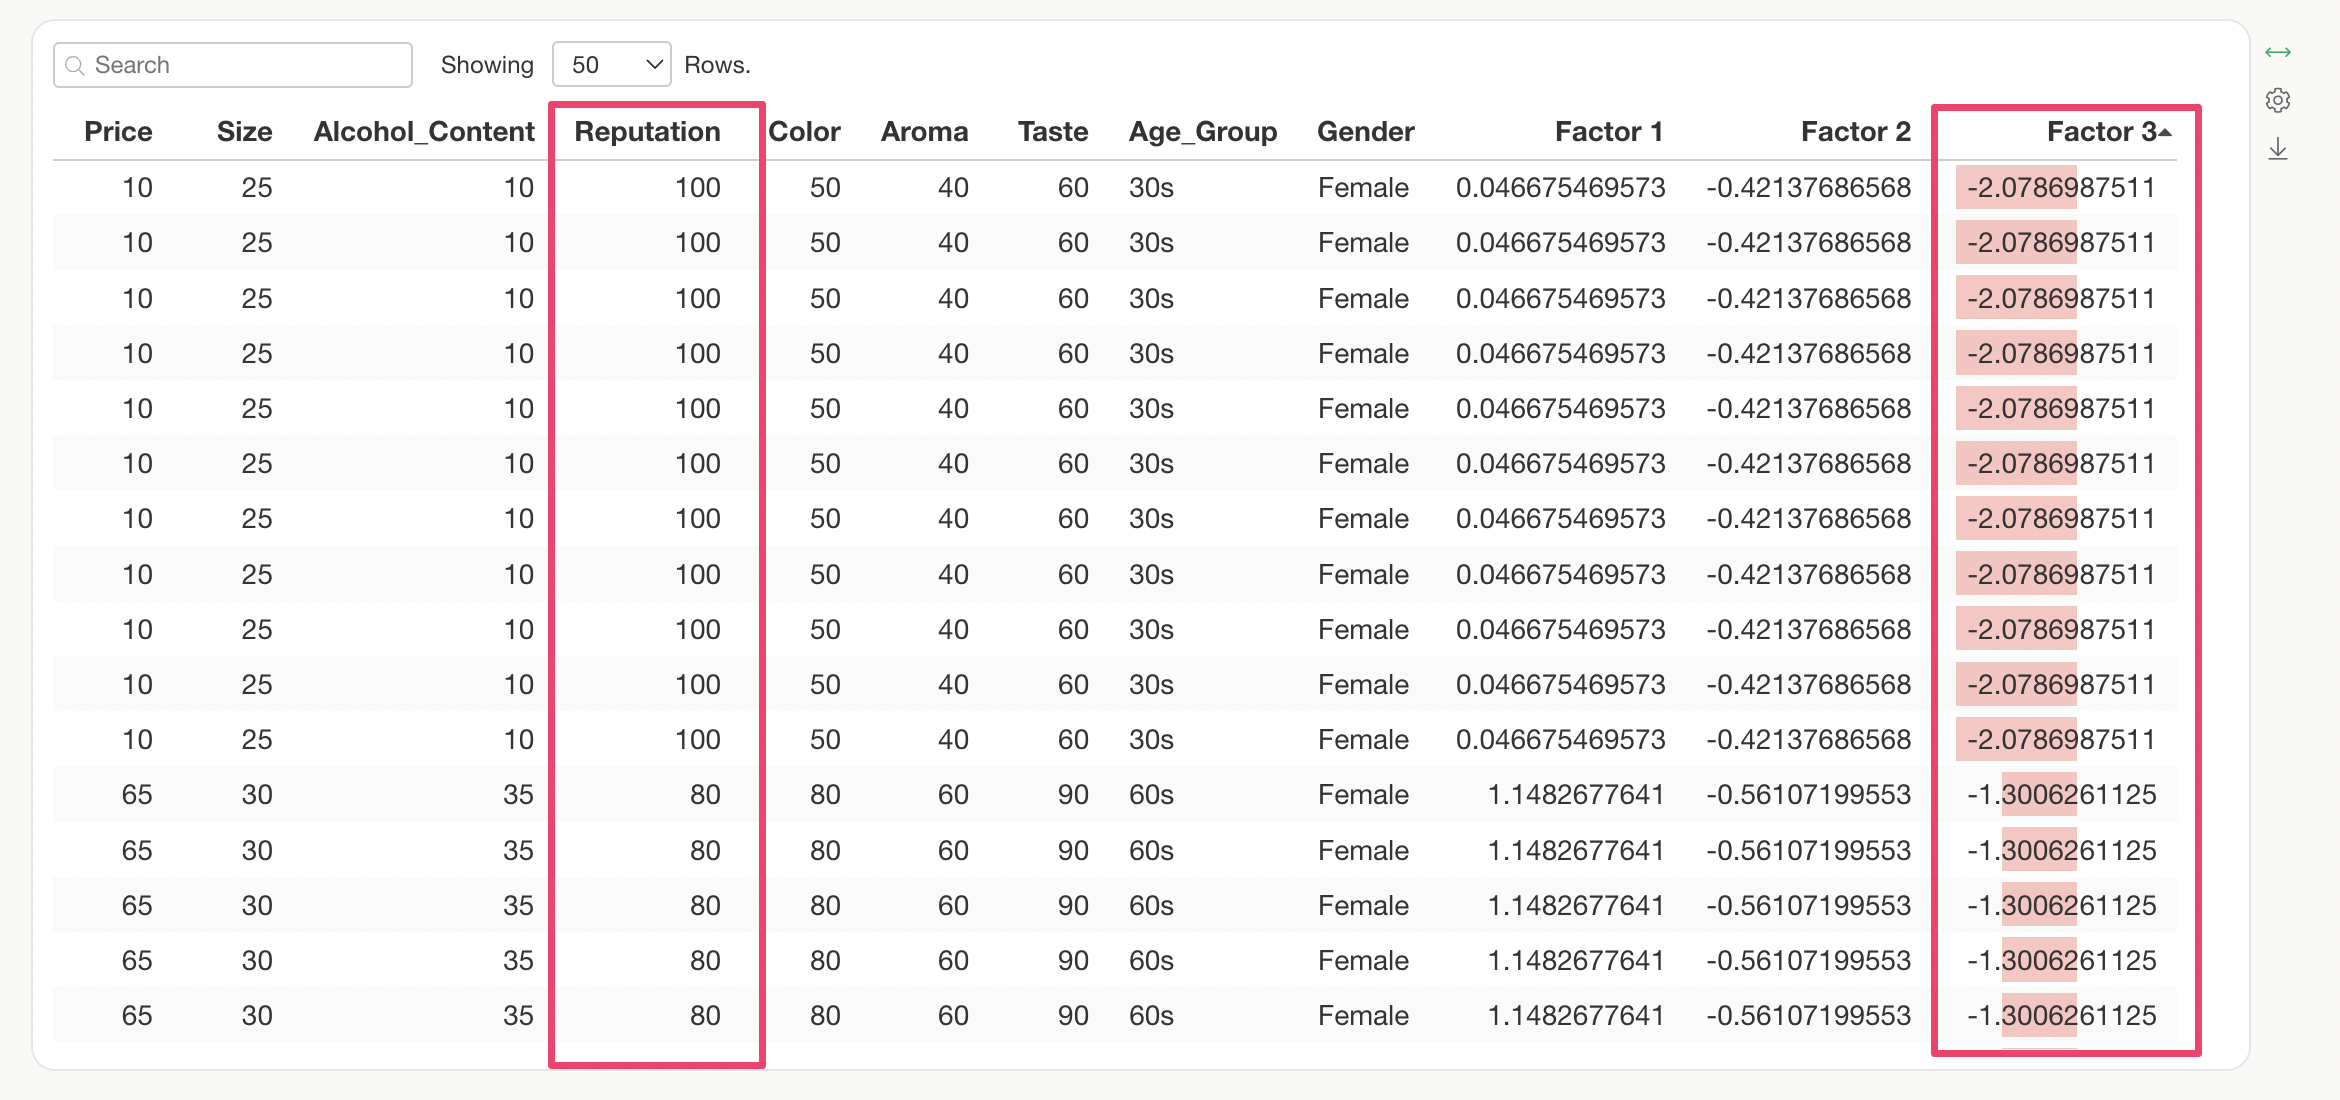
Conversely, when the factor score for Factor 3 is high, the value for “Reputation” is low.
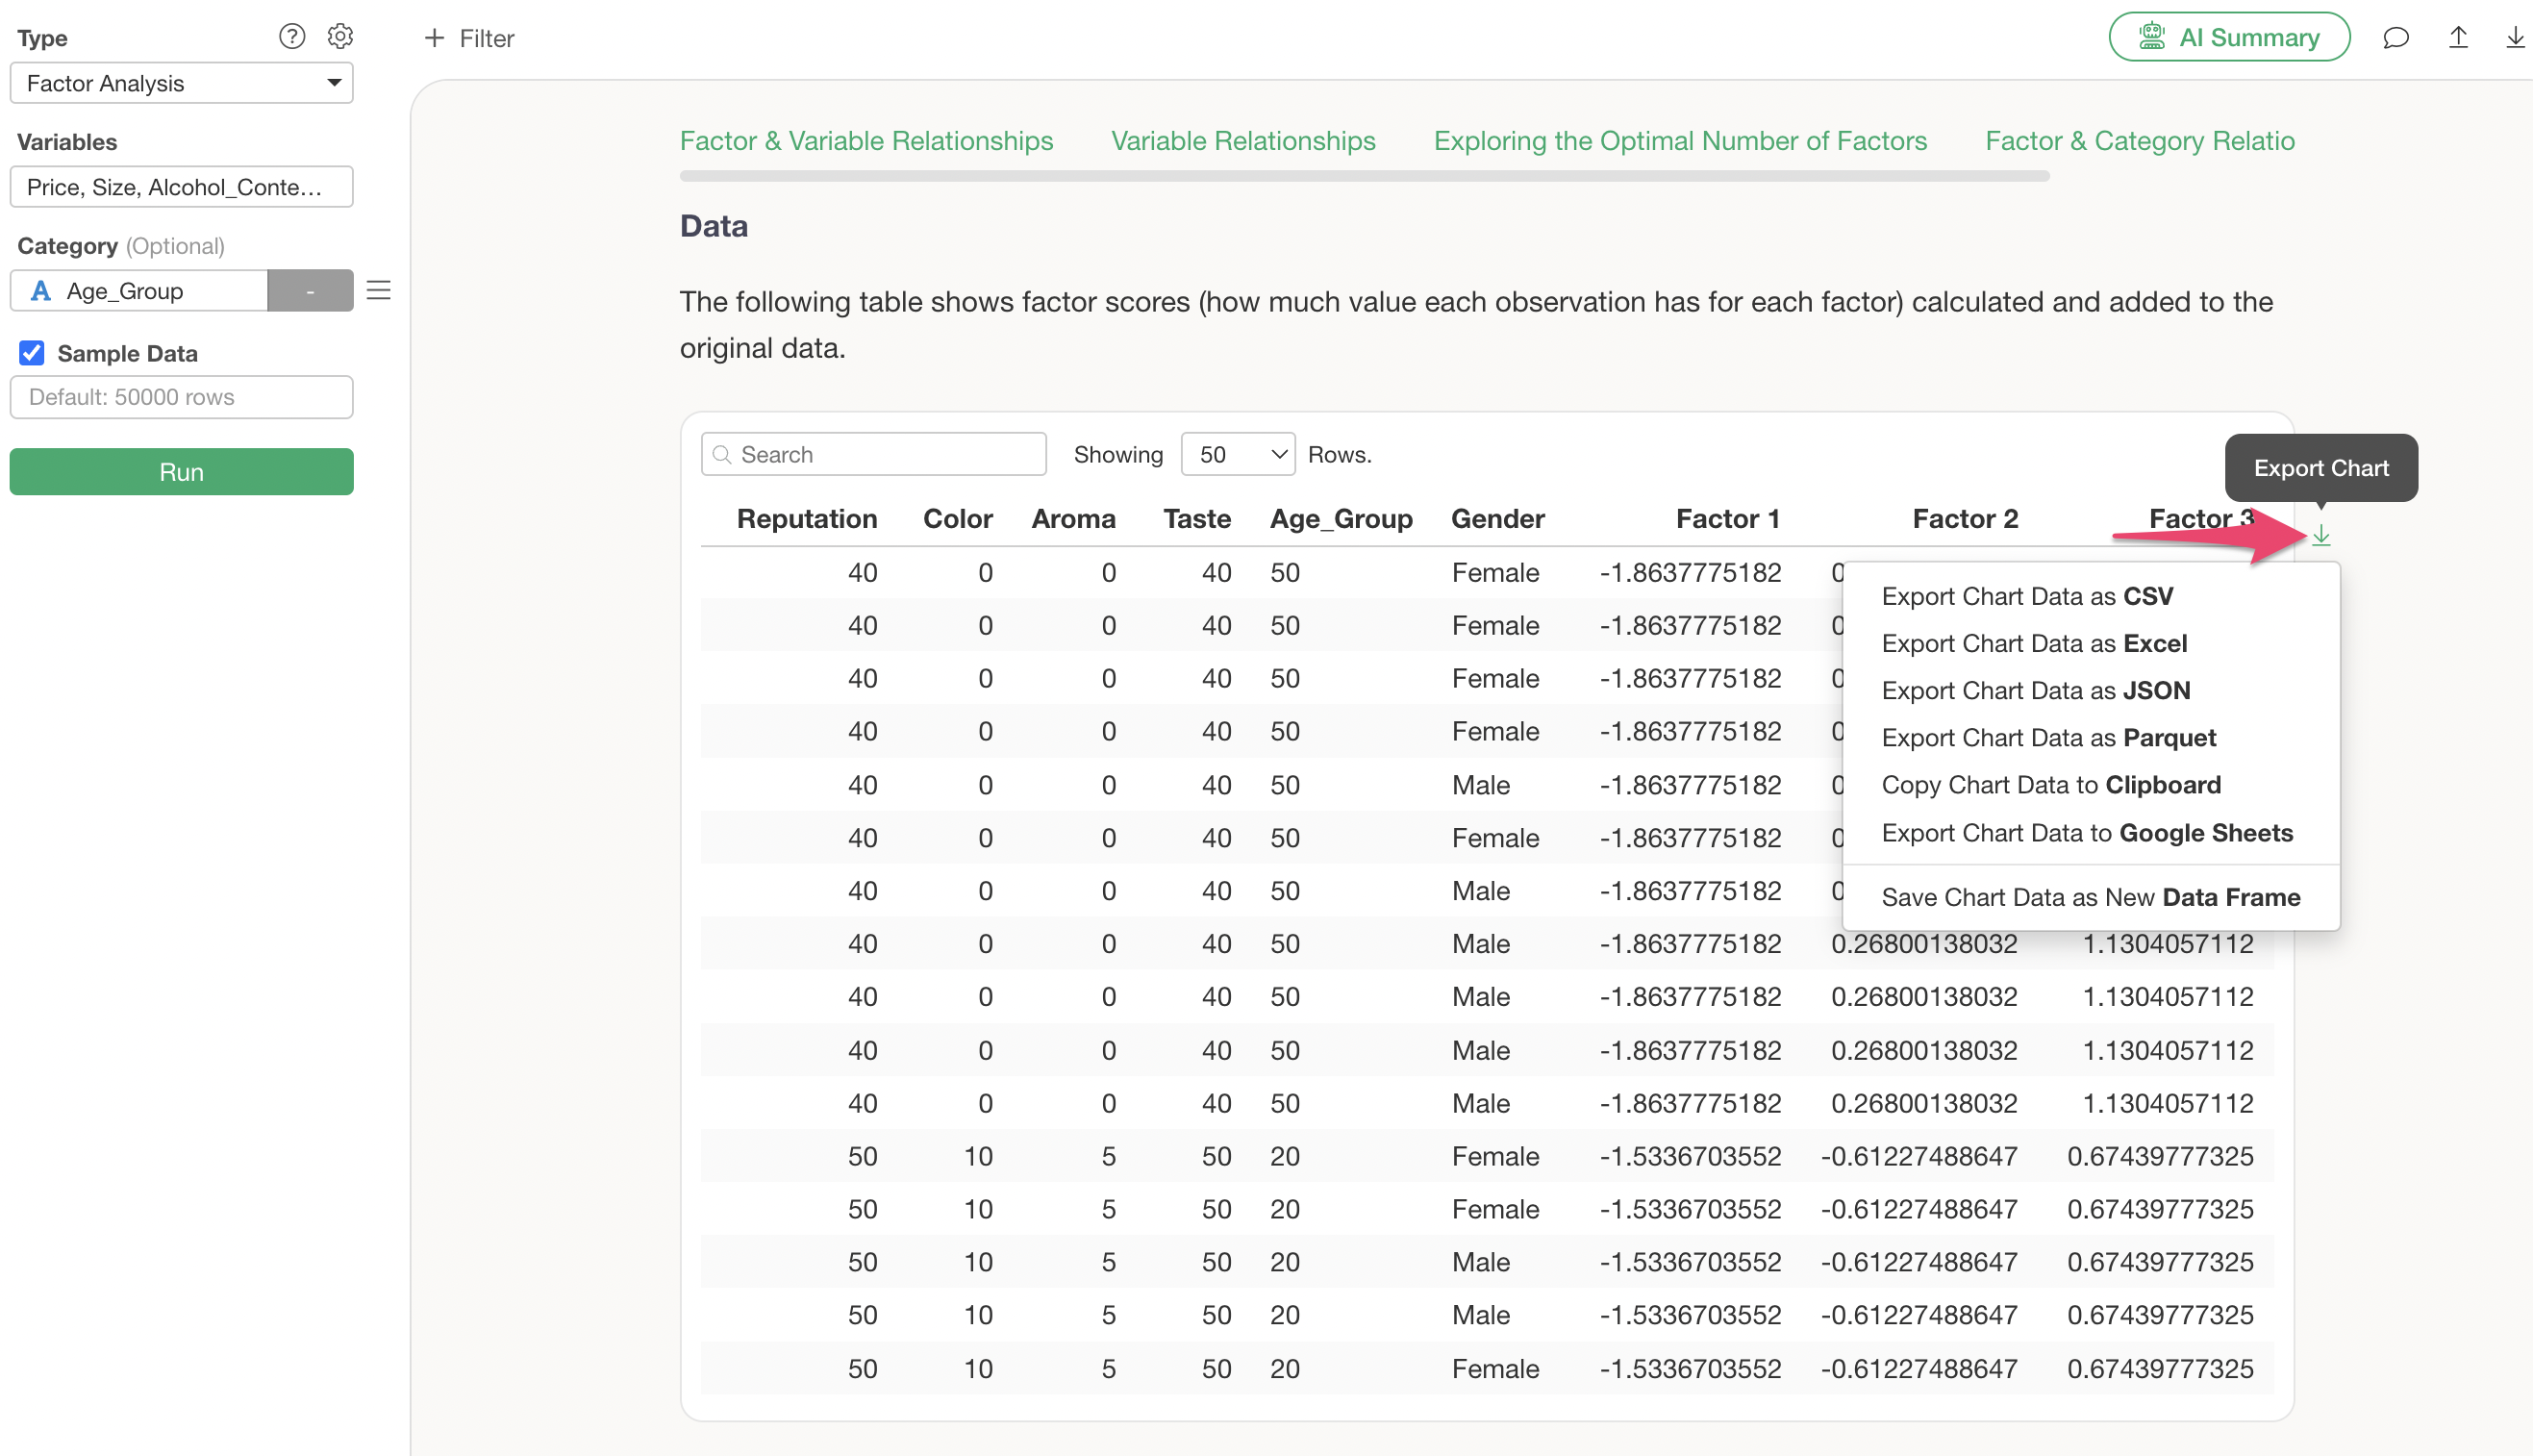
Q: I want to download the factor score data for each observation (row) from factor analysis.
Regarding the factor scores for each observation (row), you can download the data, including factor scores, by exporting the data from the table in the Data section as shown below.

Q: When I run factor analysis, only some rows of the data are used, not all of them.
It is possible that the variables used in factor analysis contained a large number of missing values. Rows with missing values are excluded from factor analysis calculations, which is why not all rows were used in the execution.
Therefore, you need to review the variables used in factor analysis or impute the missing values.